Article

Numerical Investigation of AdBlue Droplet Evaporation and Thermal Decomposition in the Context of NOx-SCR Using a Multi-Component Evaporation Model

Institute of Energy and Power Plant Technology, Technische Universität Darmstadt, 64287 Darmstadt, Germany
*
Author to whom correspondence should be addressed.
Energies 2018, 11(1), 222; https://doi.org/10.3390/en11010222
Submission received: 28 November 2017 / Revised: 24 December 2017 / Accepted: 12 January 2018 / Published: 17 January 2018
(This article belongs to the Section I: Energy Fundamentals and Conversion)

Abstract

:
To cope with the progressive tightening of the emission regulations, gasoline and diesel engines will continuously require highly improved exhaust after-treatment systems. In the case of diesel engines, the selective catalytic reduction (SCR) appears as one of the widely adopted technologies to reduce NOx (nitrogen oxides) emissions. Thereby, with the help of available heat from exhaust gas, the injected urea–water solution (UWS) turns inside the exhaust port immediately into gaseous ammonia (NH3) by evaporation of mixture and thermal decomposition of urea. The reaction and conversion efficiency mostly depend upon the evaporation and subsequent mixing of the NH3 into the exhaust gas, which in turn depends upon the engine loading conditions. Up to now, the aggregation of urea after evaporation of water and during the thermal decomposition of urea is not clearly understood. Hence, various scenarios for the urea depletion in the gaseous phase that can be envisaged have to be appraised under SCR operating conditions relying on an appropriate evaporation description. The objective of the present paper is therefore fourfold. First, a reliable multi-component evaporation model that includes a proper binary diffusion coefficient is developed for the first time in the Euler–Lagrangian CFD (computational fluid dynamics) framework to account properly for the distinct evaporation regimes of adBlue droplets under various operating conditions. Second, this model is extended for thermal decomposition of urea in the gaseous phase, where, depending on how the heat of thermal decomposition of urea is provided, different scenarios are considered. Third, since the evaporation model at and around the droplet surface is based on a gas film approach, how the material properties are evaluated in the film influences the process results is reported, also for the first time. Finally, the impact of various ambient temperatures on the adBlue droplet depletion characteristics as well as the effect of gravity is pointed out. The prediction capability of the model variants is assessed by comparing the achieved results to each other and with experimental data. It turns out that satisfactory agreement between experiment and numerical predictions is achieved for a wide range of operating temperatures by using correlations by “Wilke and Lee” for urea and by “Fuller et al.” for water. The results are essentially sensitive to gravity. From subsequent comparisons of different ways to account for the thermal decomposition in the gaseous urea, a significant difference is observed. Finally, the 1/3 film rule widely used for evaluating the material properties in the film shows accurate prediction of both evaporation and thermal decomposition regimes of urea.

Graphical Abstract

1. Introduction

Apart from improving the in-cylinder design technology and favorable internal engine combustion, the exhaust gas flow increasingly gains importance in the context of exhaust after-treatment as the emission regulations are becoming more and more stringent. The injection of urea–water solution (UWS) commercially known as adBlue® inside the exhaust port of automotive engines is one of the promising methods. Once UWS is sprayed inside the hot exhaust, the heat and mass transfer process occurs between the UWS droplets and the hot gas leaving urea that experiences thermal decomposition to form ammonia (NH3). The gaseous NH3 then reacts with NOx (nitrogen oxides) and converts into harmless compound that can be finally released into the environment. The reaction and conversion efficiency mostly depends upon the evaporation and subsequent mixing into the exhaust gas. The evaporation dynamic is largely dependent on the nozzle flow properties. In most cases, complete evaporation and thermal decomposition of urea cannot be accomplished in the gas phase and UWS droplets are then deposited on the system walls leading to a reduction of the NOx conversion efficiency of the selective catalytic reduction (SCR) system. Therefore, the SCR process requires precise control of the ammonia injection rate. An insufficient injection may result in an unacceptably low NOx conversion. An injection rate that is too high results in the release of undesirable ammonia into the atmosphere known as ammonia-slip. This increases at higher NH3/NOx ratios. Due to this reason, designing an efficient reactor for such a catalytic process is a challenging task that requires a careful consideration of various physical phenomena involved during the catalytic process, such as exhaust gas flow, UWS spray dynamics, evaporation, thermal decomposition, and chemical reaction (e.g., [1,2]).
In this respect, extensive research and development activities are going on in both experimental and numerical areas to improve the performance of SCR systems. A recent review of the state-of-the-art technologies of selective catalytic reduction of NOx from diesel engine exhaust can be found in [3]. In particular, computational fluid dynamics (CFD) modeling and simulations have become established techniques to carry out detailed analysis of individual ongoing processes in SCR systems and subsequently to perform design optimization and modification in catalytic chamber. It turns out that a comprehensive CFD analysis requires a complete mathematical description of all the relevant processes involved right from the engine exhaust to the final release into the ambient as mentioned above [4,5,6,7,8,9,10,11,12,13].
Regarding the evaporation dynamics of UWS, two different scenarios may happen for the urea depending on the rapidity of the water evaporation [8]. When the droplet size is small and/or the vaporization of water is slow, the concentration of urea throughout the droplet increases uniformly, which finally leads to the formation of a solid particle. However, when a rapid water vaporization occurs on the droplet surface, the urea concentration increases at the droplet surface, which builds up a urea shell around the droplet. This may lead to the boiling of water inside the urea shell and even to the explosion and fragmentation of the droplet as it has been observed experimentally. In fact, the droplet sizes are relatively large (2.4–3.0 mm) in the experiments carried out by Musa et al. [14] who reported about extreme behavior of urea solid-crust formation, subsequent evaporation and entrapment of gaseous phase, which ultimately explode the droplets. Such a behavior can be interpreted as a combined effect of droplet heating, evaporation rate, segregation of urea composition at the droplet surface, which ultimately results in solidification of urea and formation of solid crust at the droplet surface and micro-explosion of droplets. In [14], the authors concluded that this behavior is predominant for larger droplets due to longer evaporation time-scale.
Focusing on the numerical modeling, the adBlue droplet depletion can be modeled by three different scenarios [2,5,6,7,9,10,15]: an overall evaporation process, an Arrhenius expression, or a conversion efficiency factor. In particular, a two-stage model is suggested in [5,6], in which it is assumed that urea decays after water is evaporated completely, while, in [2,12], the urea decomposition is modeled as a heat transfer limited process at a constant temperature of 152 °C. In [7,
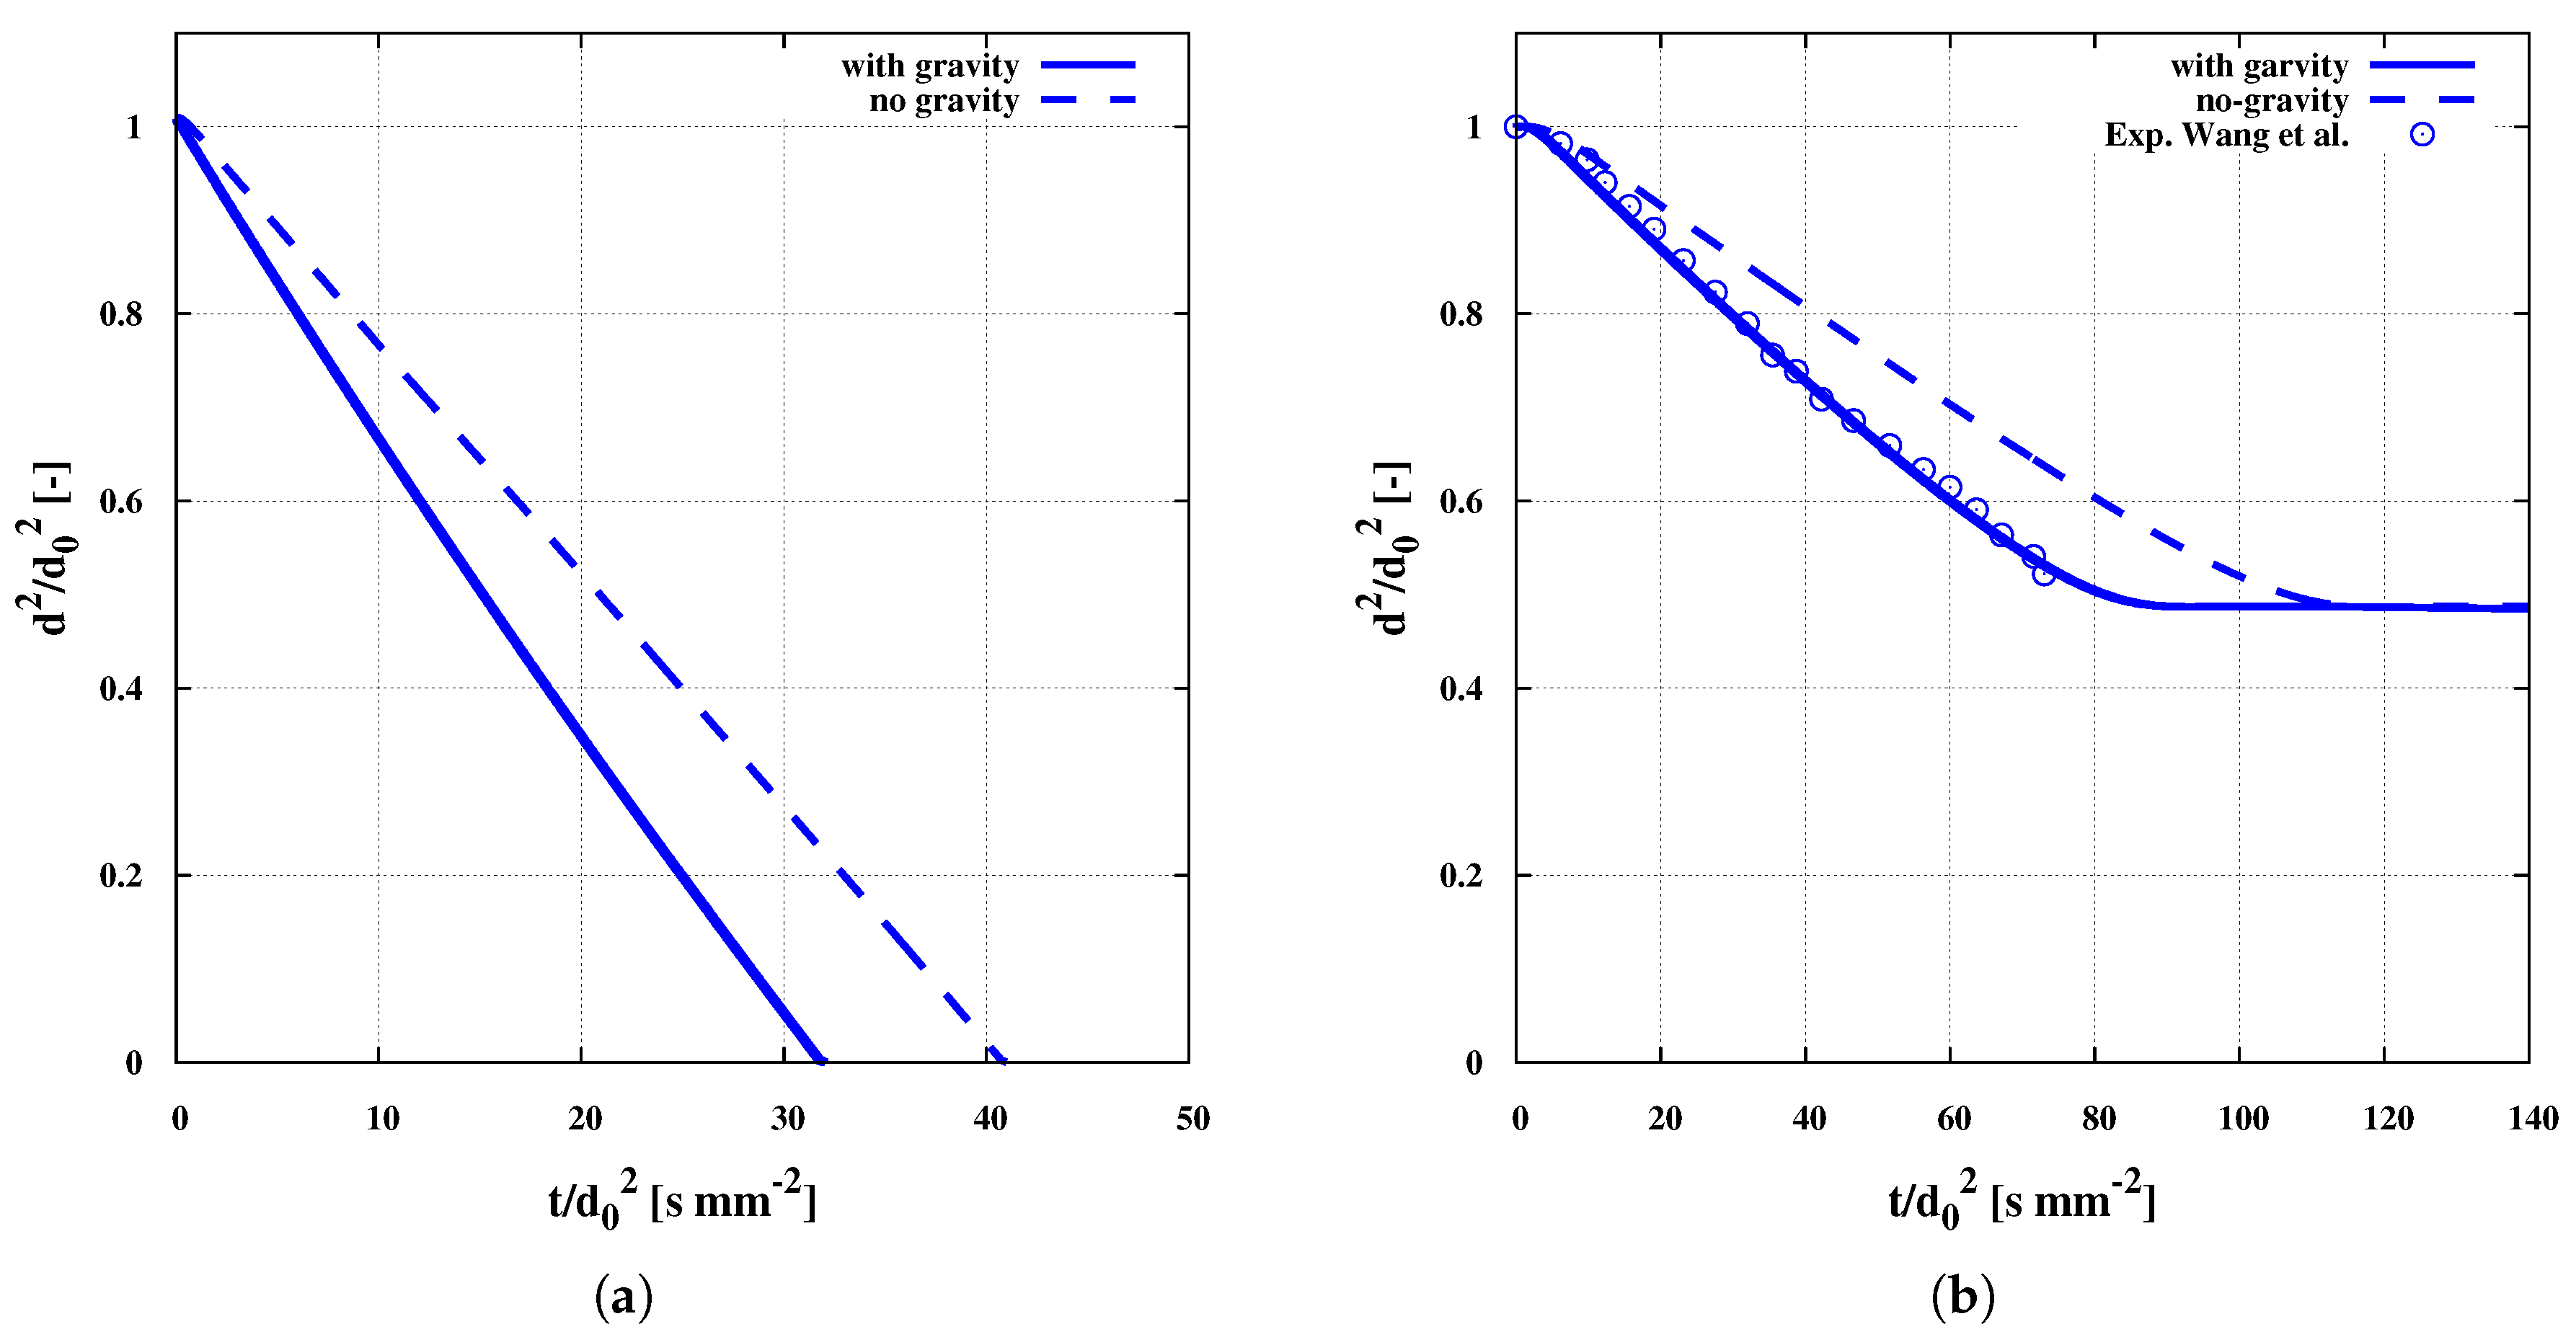
9], the UWS depletion is not separated in two distinct and consecutive processes, rather it is described by a multicomponent evaporation model. Thereby, the influence of various body forces on the overall droplet dynamics has been investigated, especially in [2]. The reported CFD analysis showed that the drag and gravity forces only are important to be taken into account.
To describe the urea decomposition, the ways of heat reaction are provided [16] play a great role in the overall mass transfer dynamics. The first way (W1) consists of an evaporation of molten/solid urea to the gaseous urea, which decomposes in the gas phase in ammonia and isocyanic acid (HNCO). The second (W2) models the urea depletion as an overall evaporation model that includes both the enthalpy of evaporation and that of the reaction in the gaseous urea. The third (W3) considers a direct decomposition from molten/solid urea to gaseous ammonia and isocyanic acid. In most contributions dealing with a single UWS droplet, e.g., [5,6,12], a detailed analysis was performed. The evaporation model used usually consisted of a random mixing (RM) or a diffusion limit (DL) model for the liquid phase description and in a film based model for the gas phase. It was found out that the RM model could provide a good compromise between accuracy and simulation time. However, it should be noted that the heat/mass diffusion resistance within the droplet is zero for the RM approach, making the model capable of providing reasonable results only for slow evaporation processes in situations where the heat conduction and diffusion within the droplet do not affect significantly the internal concentration and temperature distribution [17].
With respect to multi-component evaporation approaches, Sazhin et al. [18,19] recently reviewed the state-of-the-art evaporation model for hydrocarbon fuel droplets. For adBlue applications, ref. [4,8,9] extend either the Sirignano’s model or the Renksizbulut et al. [20] evaporation formulation, and mostly assume the droplet surface to be equal to the mean droplet temperature. For the liquid phase analysis, the RM model is favored. In [
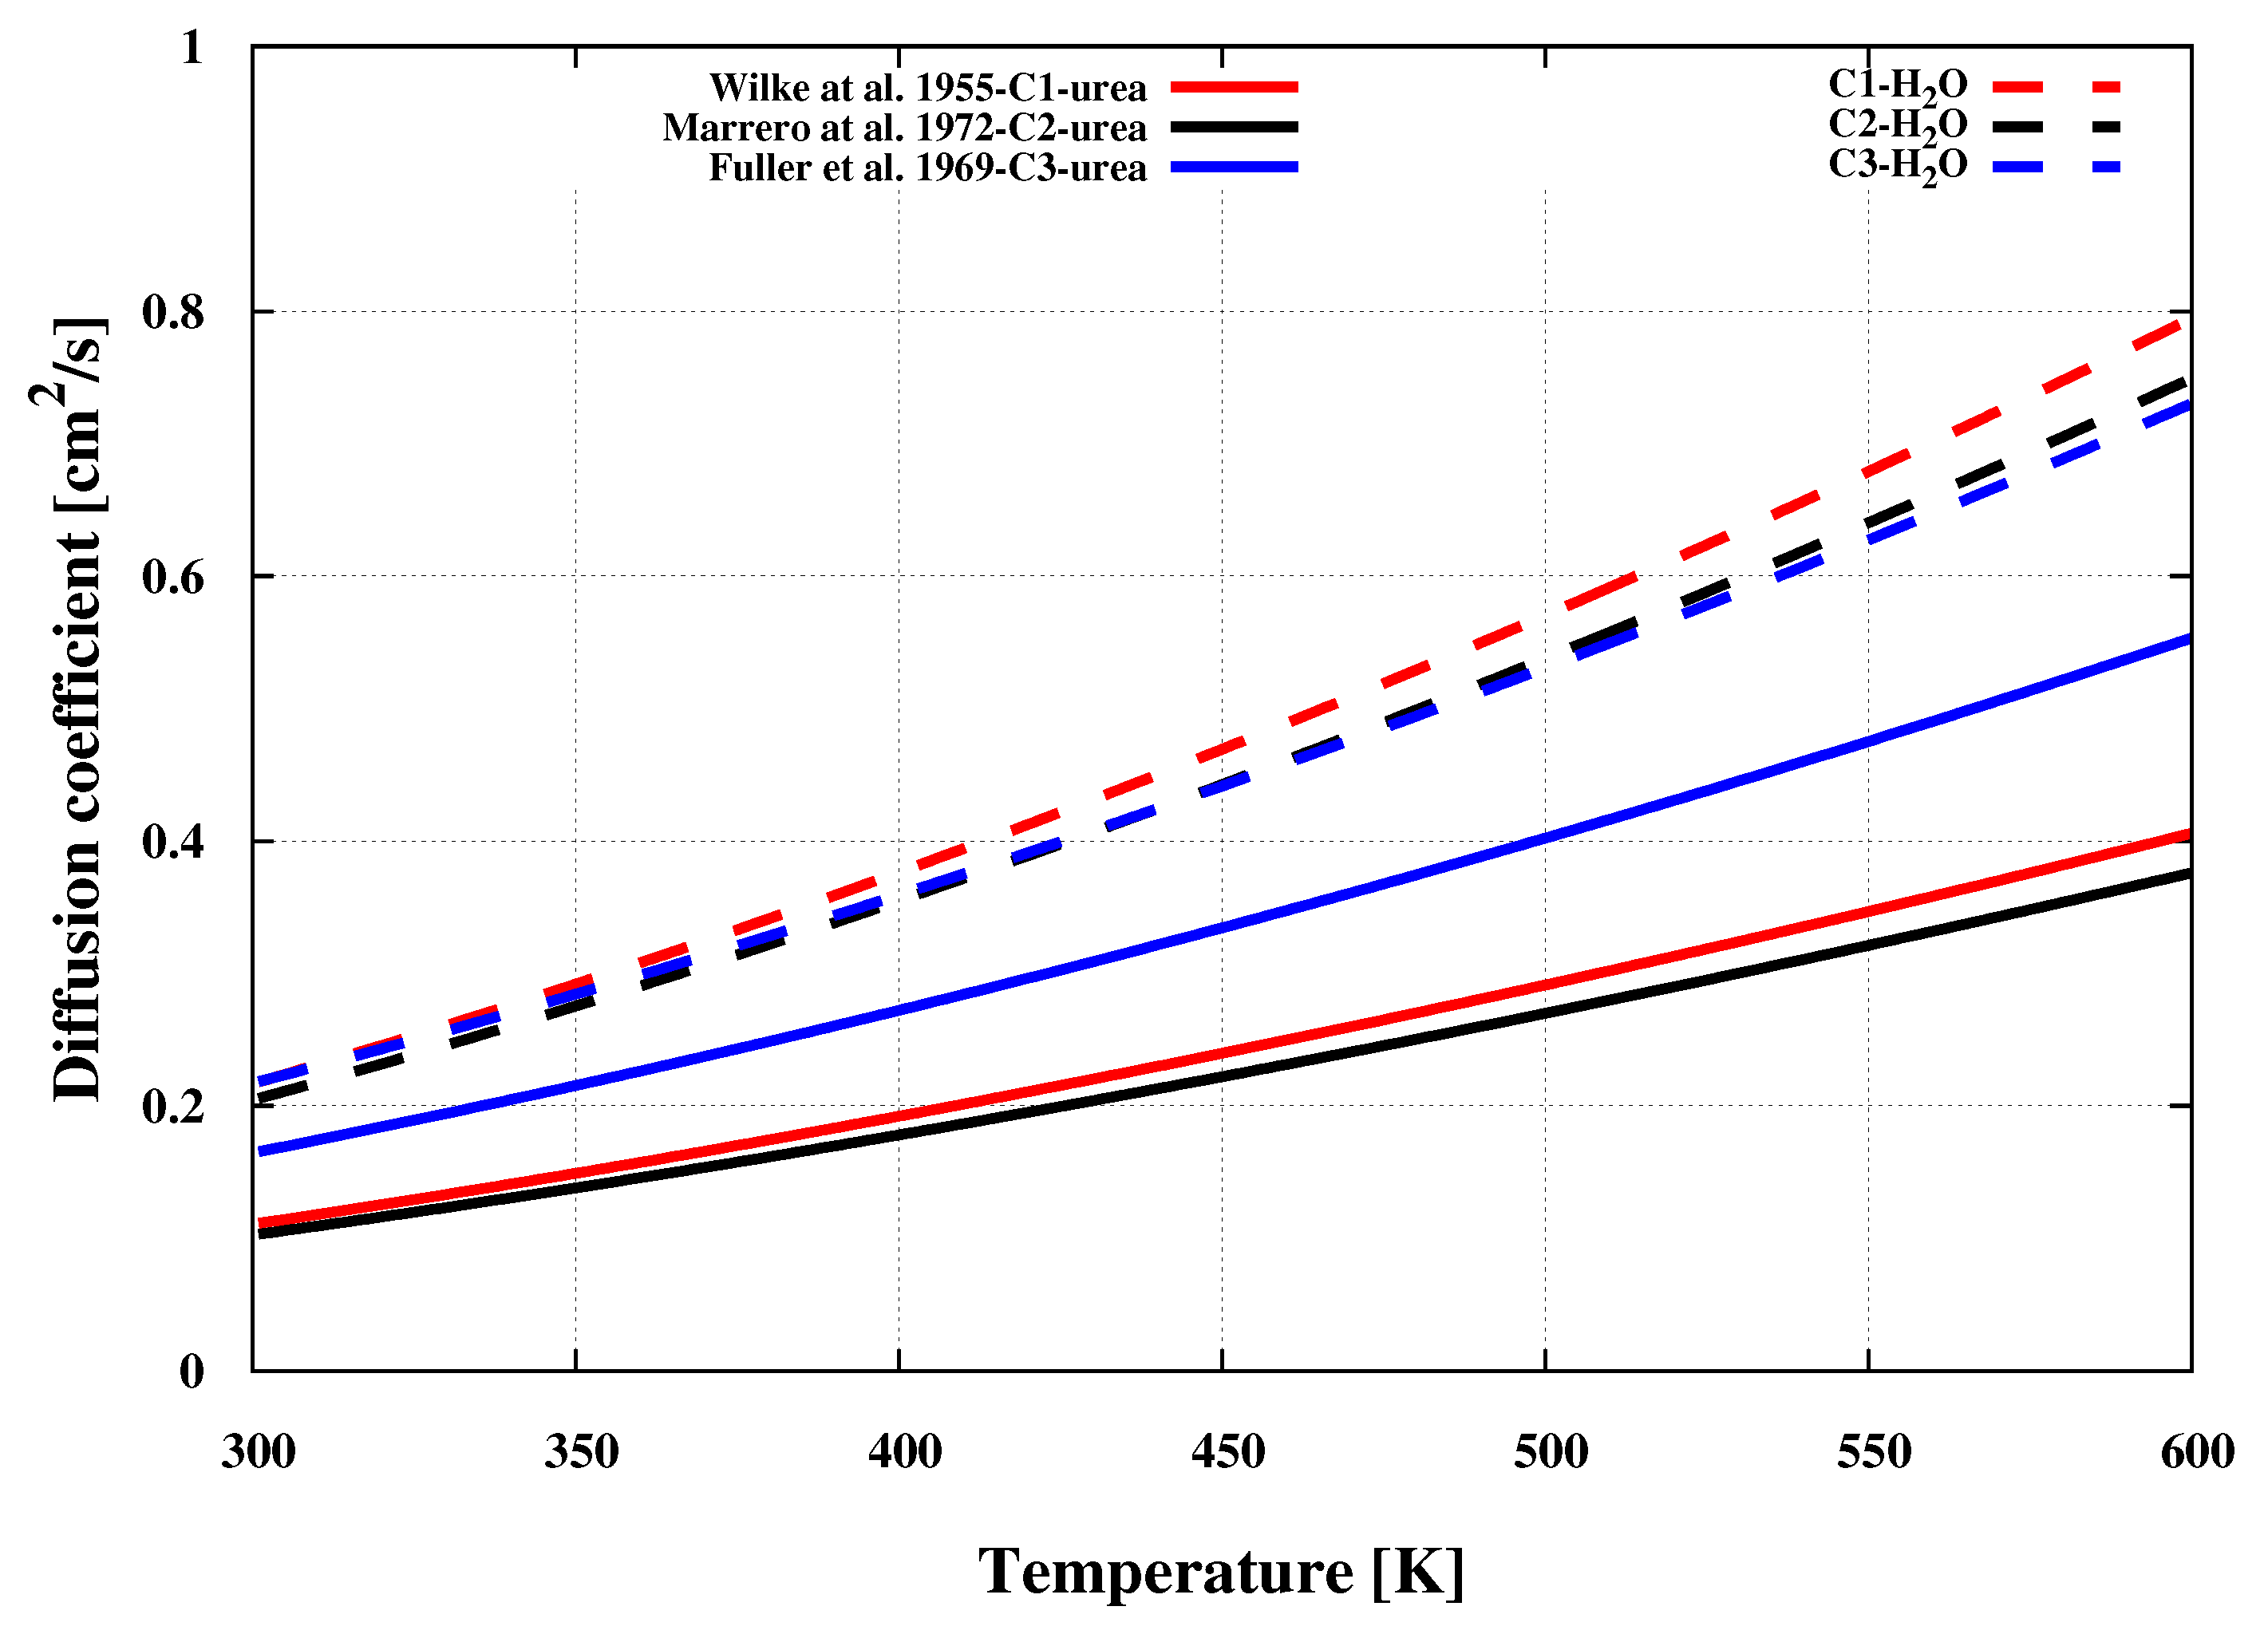
4], two possible approaches (multi-component droplet and a wet-solid particle) for the representation of UWS in a CFD simulation have been evaluated. It was concluded that the wet-solid approach provides greater accuracy. In all these studies, the diffusion of species that plays a determinant role in evaporation dynamics was widely described relying on a prescribed correlation, among them the Wilke et al. formulation [21]. While [
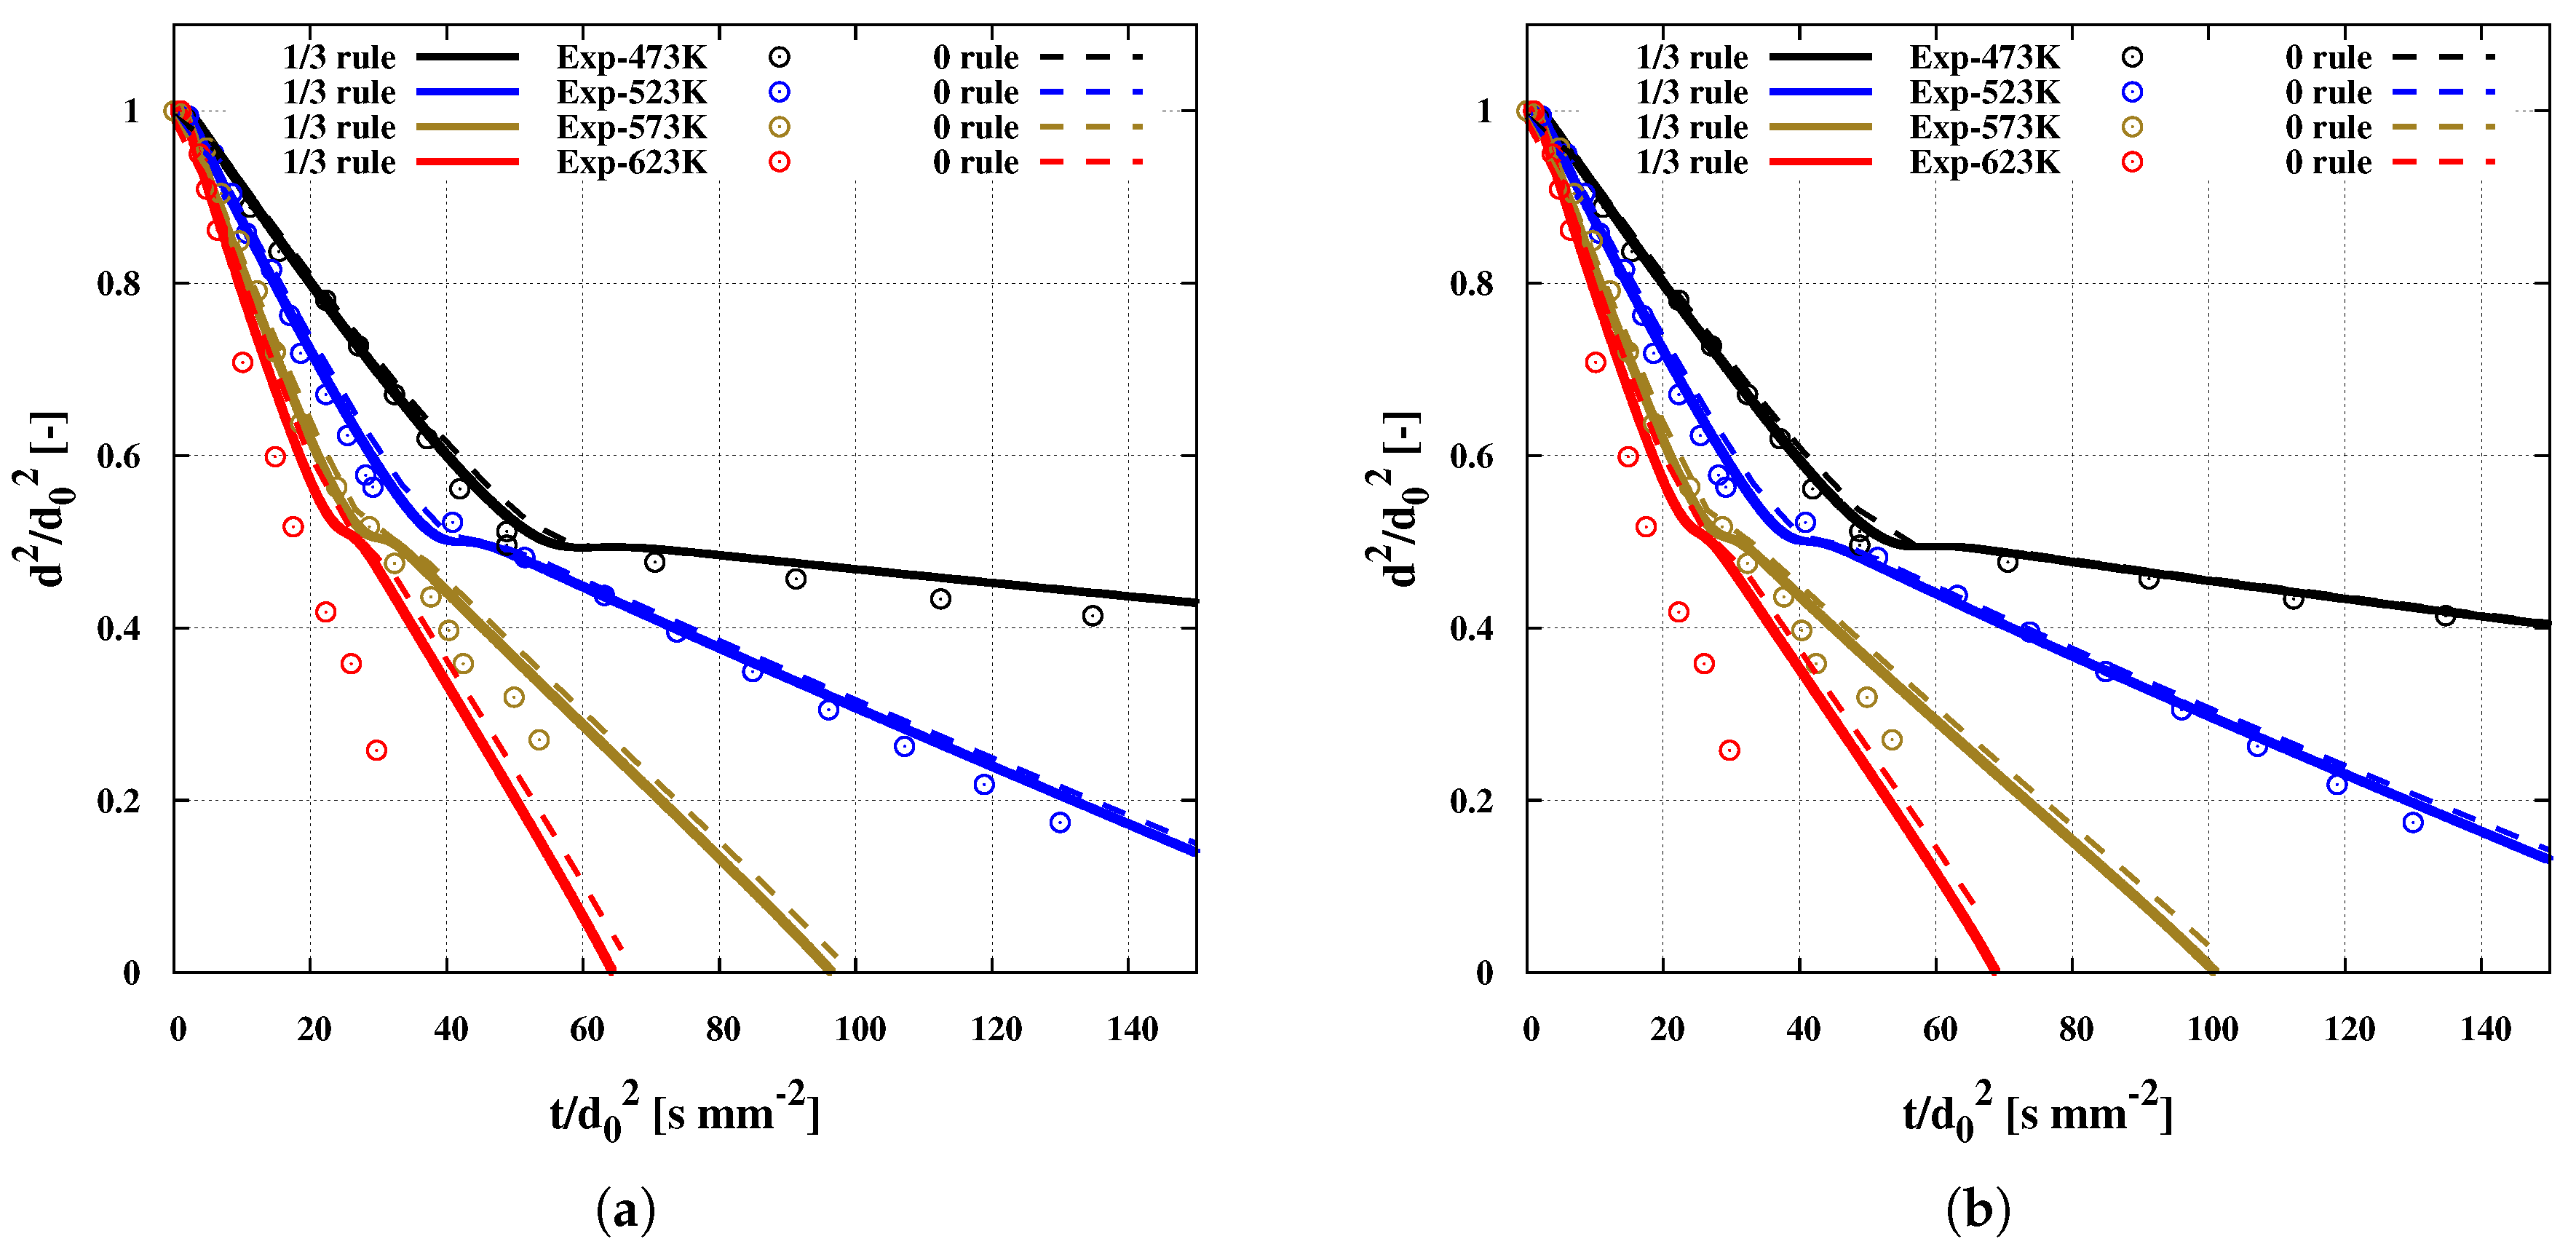
8] employed the Hirschfelder law instead of the Fick’s ansatz, the impact of these diffusion coefficient correlations on adBlue depletion has not yet been numerically addressed. Furthermore, in most studies, material properties in the film are evaluated usually using the 1/3 film rule and the Herning and Zipperer model as the mixing rule [2,7]. The effect of other film rules has not yet been evaluated on evaporation process predictions in SCR systems.
The objective of the present paper is therefore fourfold. First, a reliable multi-component evaporation model that includes a reliable binary diffusion coefficient will be developed for the first time in the Eulerian–Lagrangian CFD framework to account properly for the distinct evaporation regimes of adBlue droplets under various operating conditions. It is based on a 1D heat and mass transport equation along the droplet radius to describe the droplet heating and species diffusion inside the droplet, and on a film modelling approach according to [22,
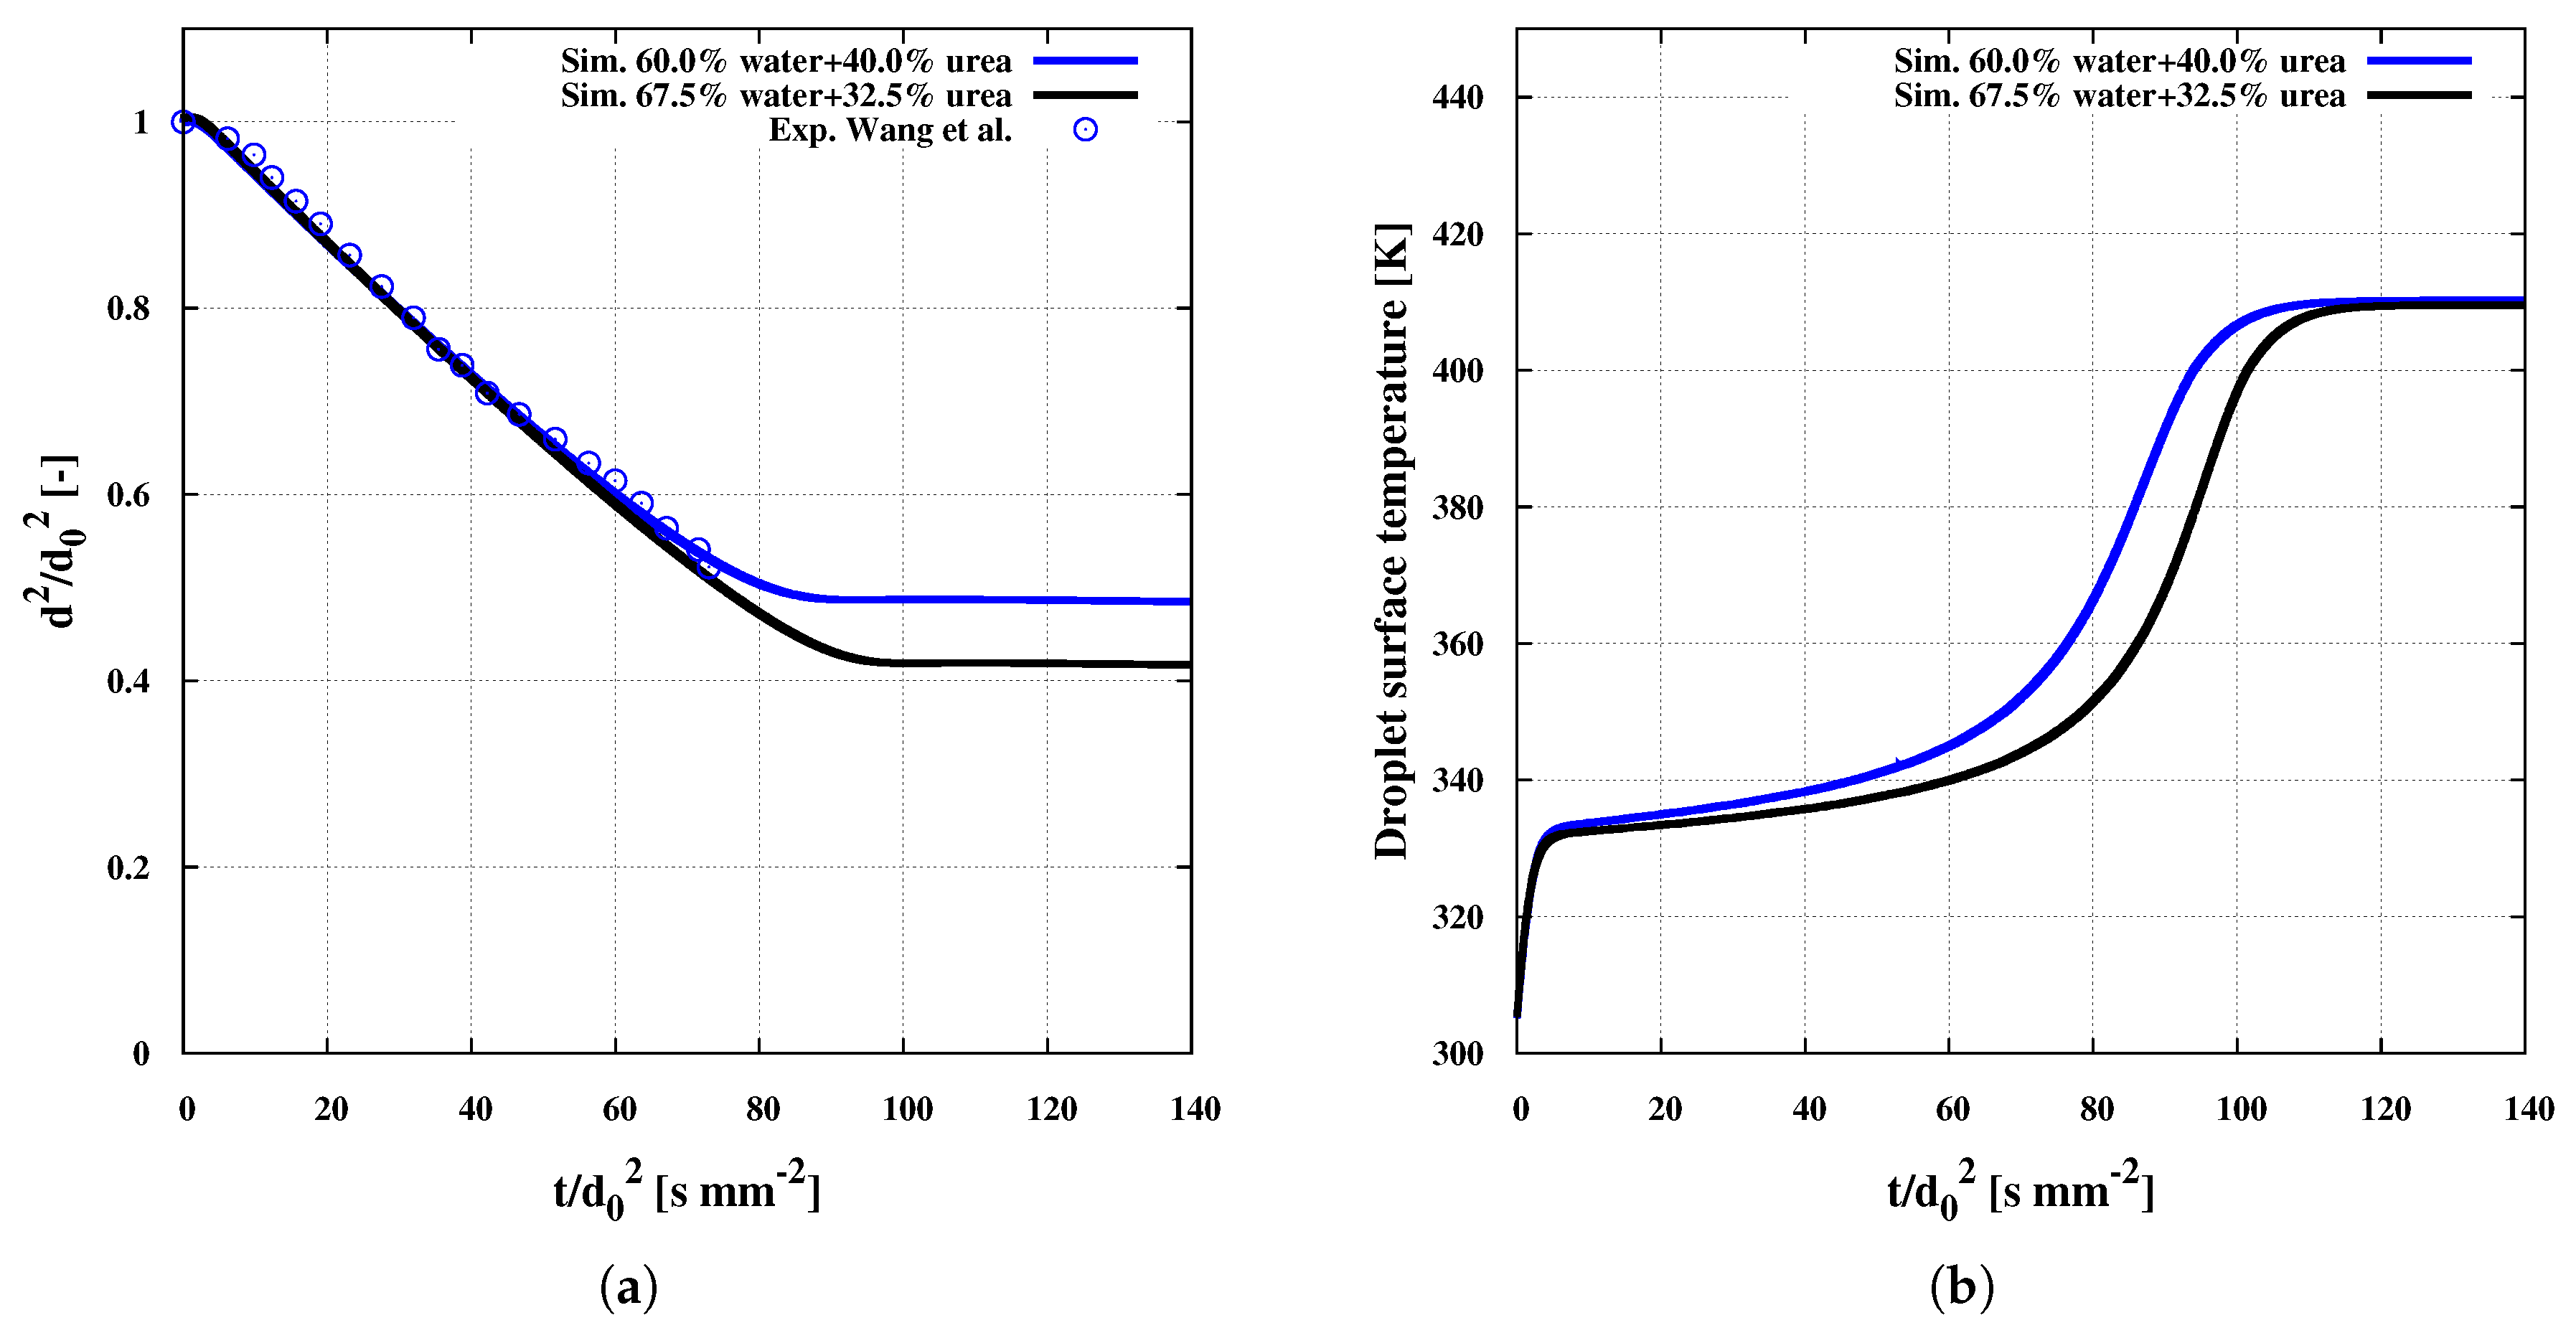
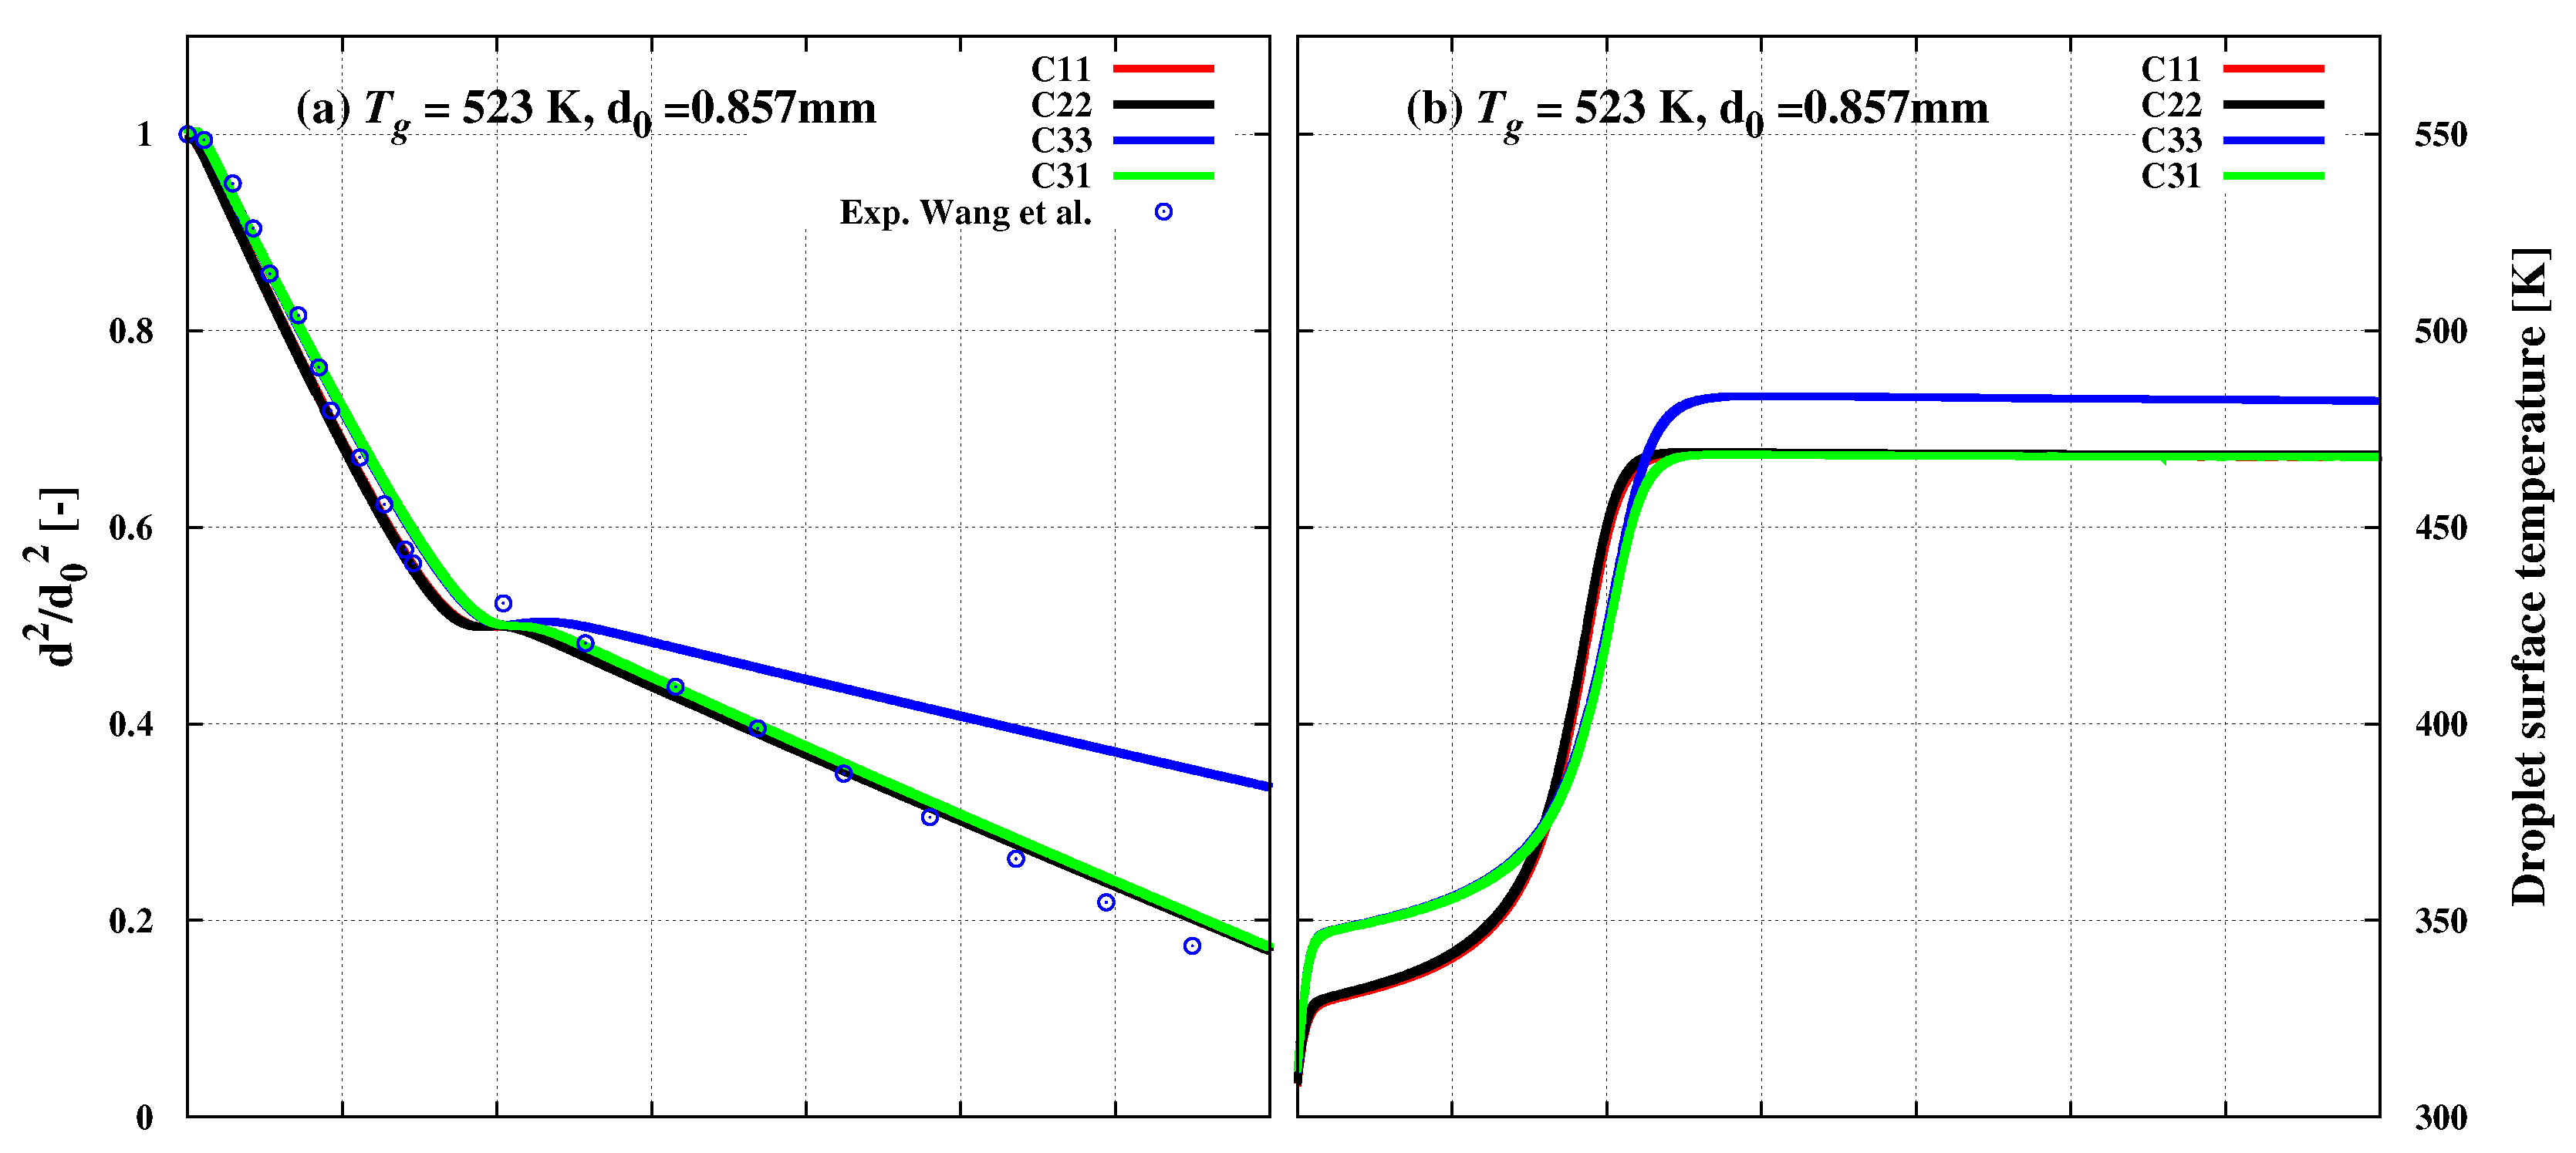
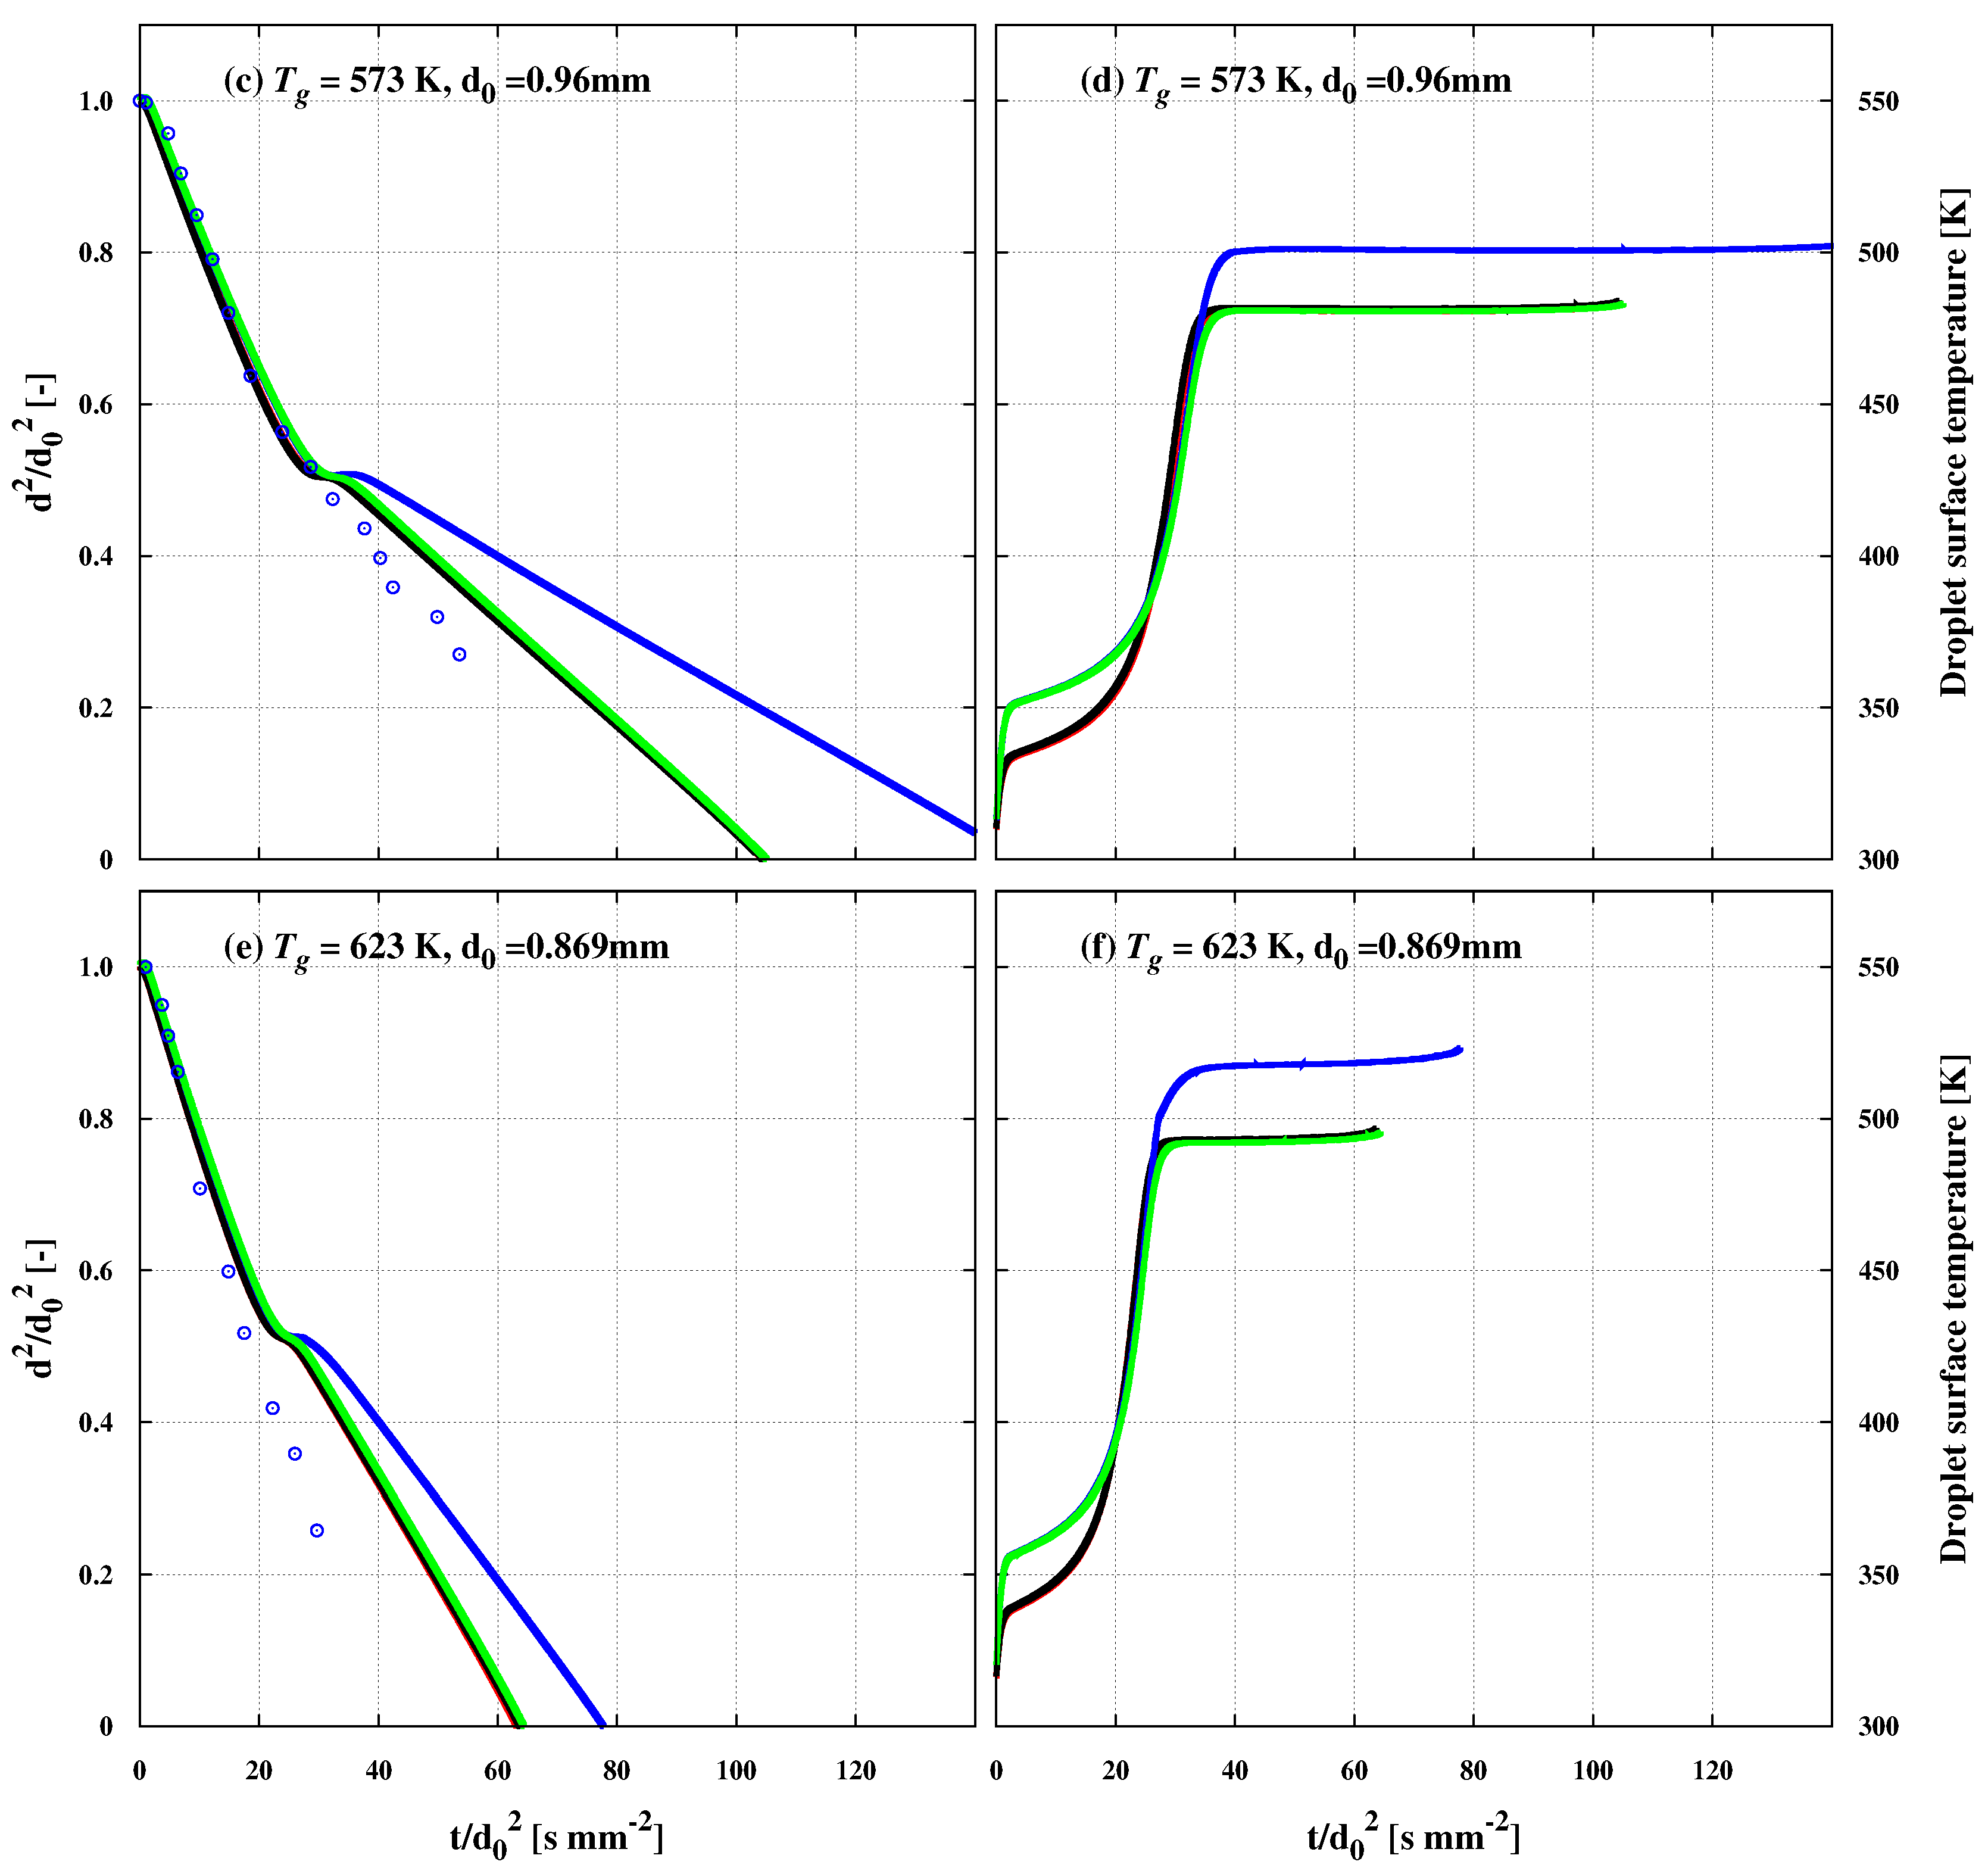
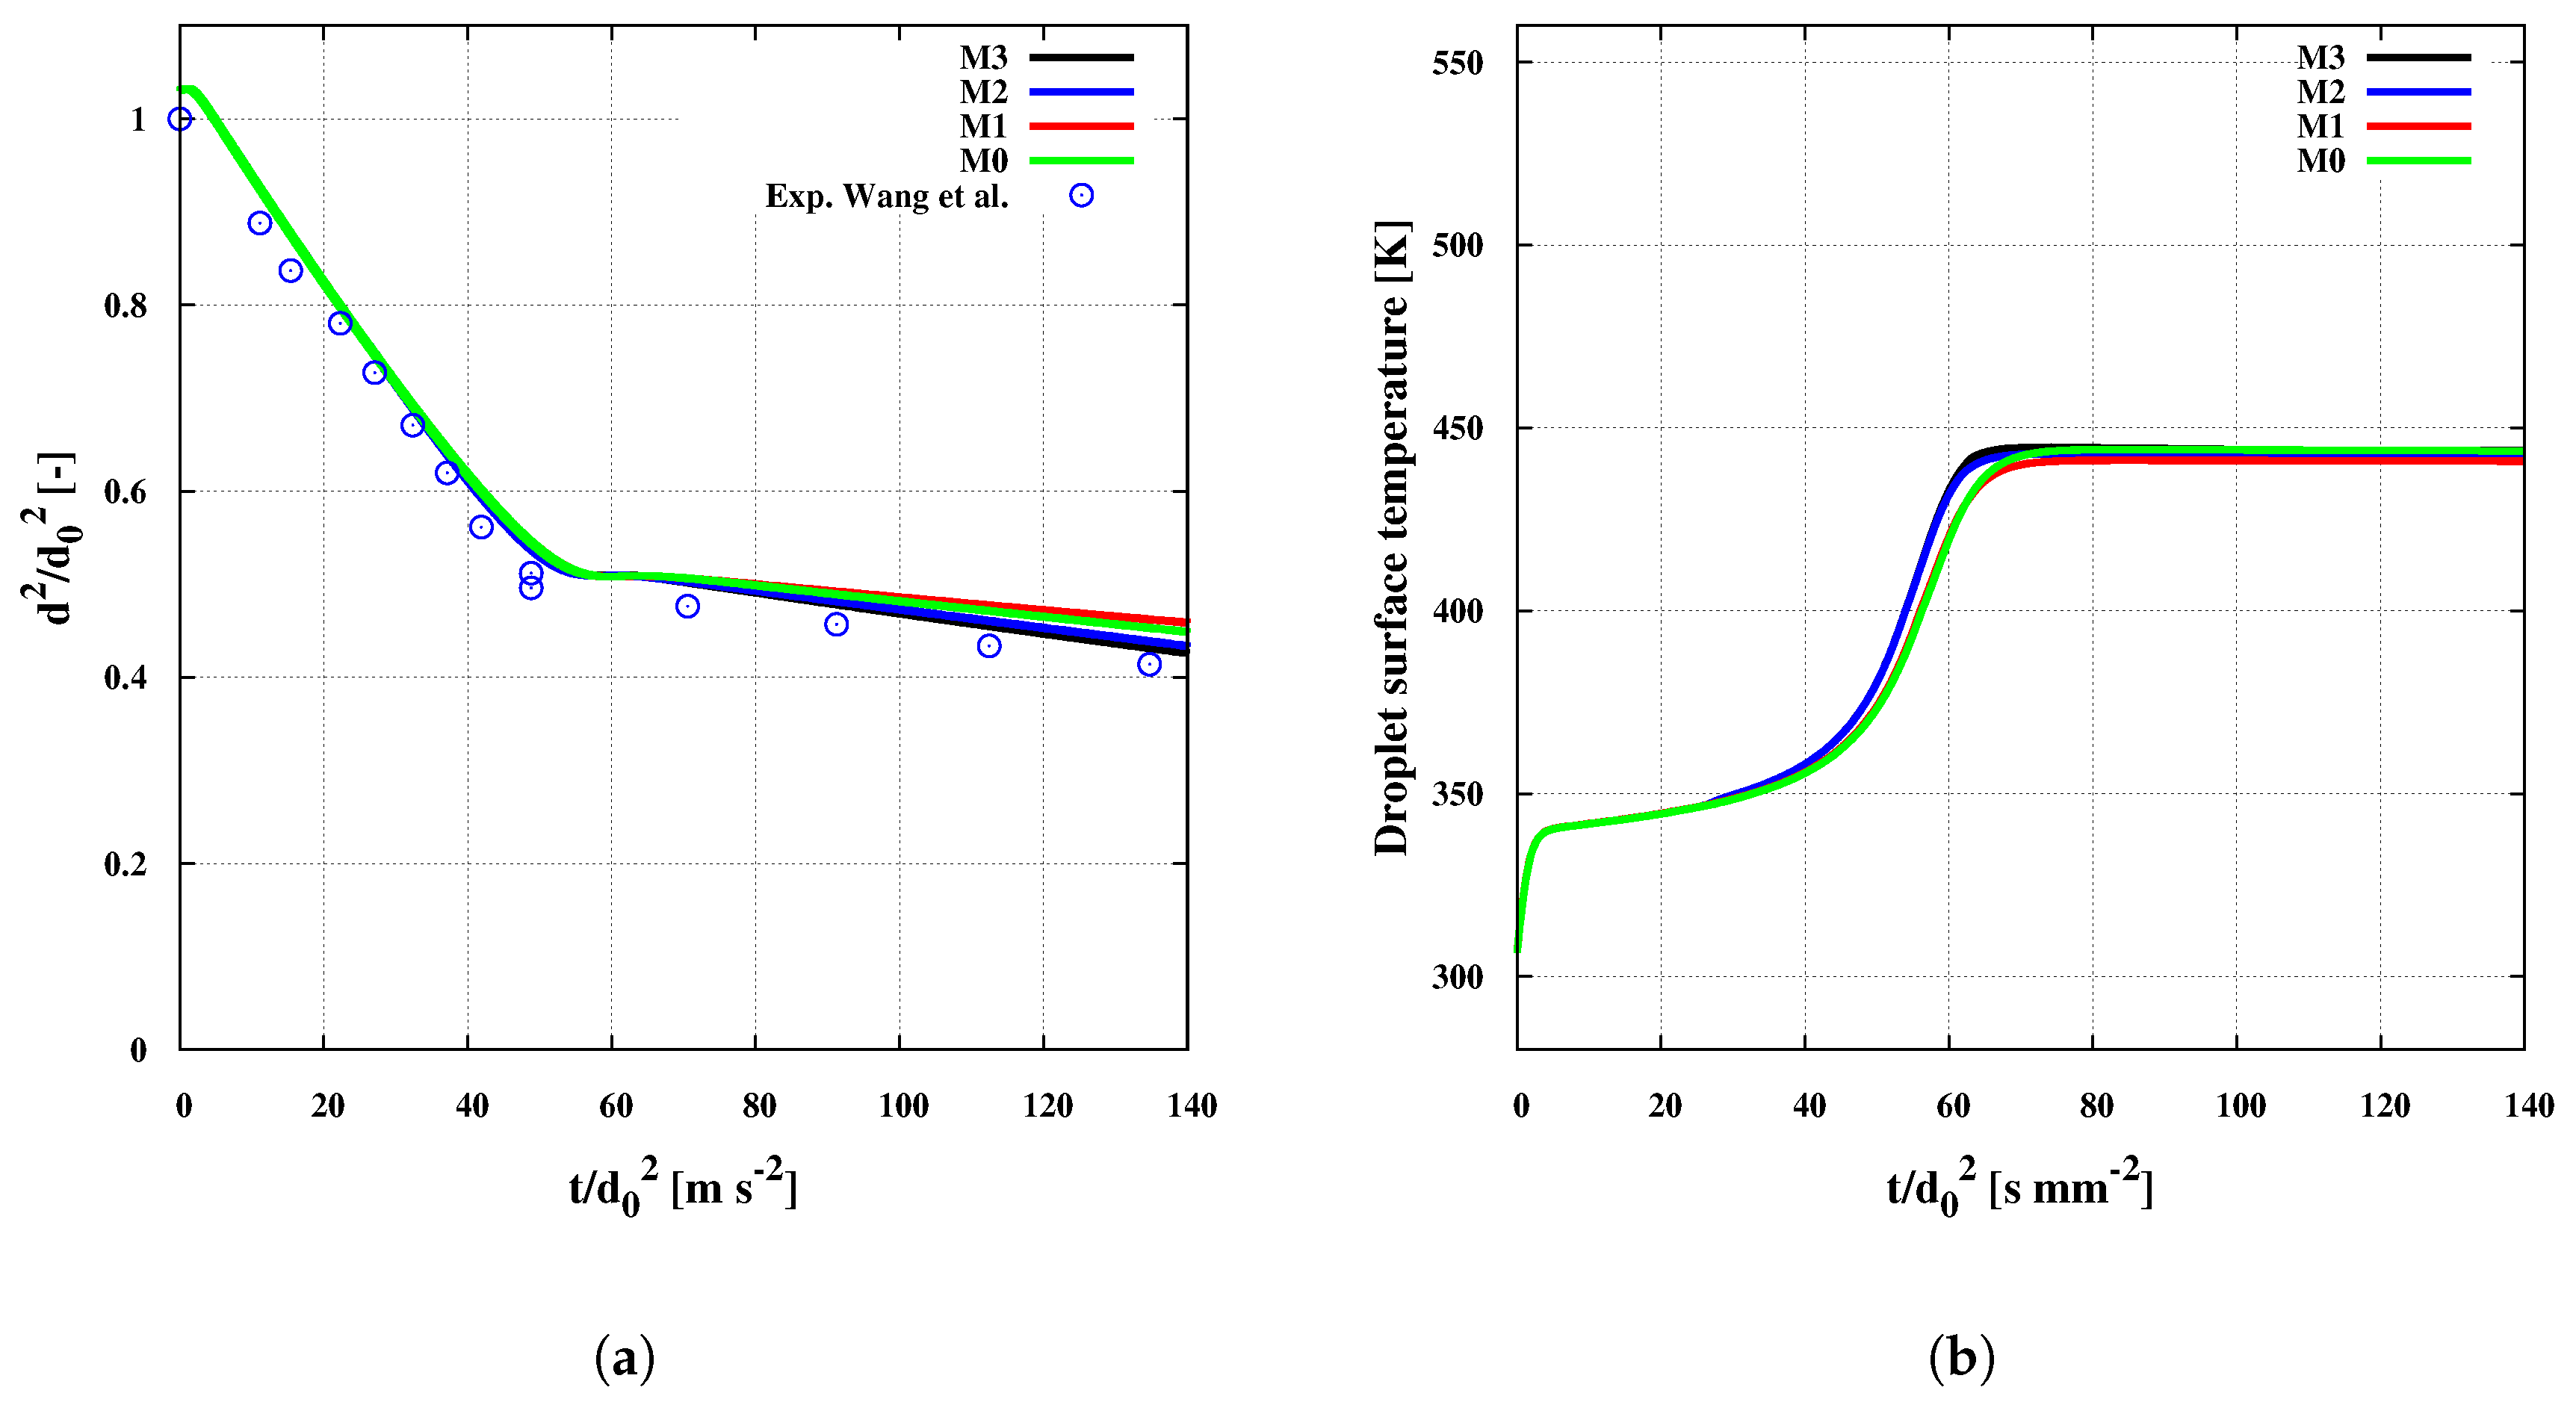
23] to capture the droplet evaporation and species mass fraction at and around the droplet surface. Second, this model will be extended for thermal decomposition of urea in the gaseous phase, where, depending on how the heat of thermal decomposition of urea is provided, different scenarios are considered. Third, since the evaporation model at and around the droplet surface is based on a film approach, how the material properties in the gas film along with the minimum and maximum temperatures expected at the drop surface are evaluated and influences the process results will be investigated. Fourth, the effect of ambient temperature as well as the impact of gravity on the UWS droplet depletion will be pointed out. The prediction capability of the model variants will be assessed by comparing the achieved results to each other and with experimental data. Since the droplet sizes in actual SCR scenarios are much smaller (droplet size 20–200 μm), the available experimental data by Wang et al. [24], who considered relatively smaller droplet size among other experiments [14,25,26], will be considered for model validation.
In the next section, the multicomponent evaporation modeling is provided. Thereby, a description of various binary diffusion coefficients to be used within the formulated evaporation model is outlined. To complete this section, various scenarios for thermal decompositions are introduced. In Section 3, the numerical configurations for the respective experiments are presented. The achieved results are reported and discussed in Section 4 in terms of model validation and various sensitivity analysis with respect to diffusion coefficient correlations, scenarios for thermal decomposition and gas film rule. The last section is devoted to conclusions.

2. Numerical Modeling

A single evaporating adBlue droplet is numerically investigated by applying the KIVA-4mpi CFD software (Los Alamos National Laboratory (LANL), Los Alamos, NM, USA). A Lagrangian particle description is employed to track the adBlue droplet whilst a two-way coupling between the gas phase and the liquid phase for energy, momentum and mass exchange [27,28] is accounted for within an Eulerian–Lagrangian framework.
In particular, the multi-component evaporation model suggested in the present paper consists in the liquid phase heating and species diffusion inside the multi-component droplet and in the droplet evaporation in the gas phase.

2.1. Droplet Heating and Species Diffusion inside the Droplet

Assuming that the processes inside the droplet are spherically symmetric (no flow recirculation within the droplet), the thermal evolution and species fraction distribution within the droplet are achieved by solving a 1D heat and mass transport equation along the droplet radius r as [23]:
ρ l t + 1 r 2 r r 2 ρ l v = 0 ,
ρ l Y i t + 1 r 2 r r 2 ρ l v l Y i = 1 r 2 r r 2 ρ l D l Y i r ,
ρ l T t + 1 r 2 r r 2 T ρ l v l = 1 C p , l r 2 r r 2 λ l T r + ρ l D l c p r 2 i r r 2 h l , i Y i r h l , i r r 2 Y i r .
Thereby, ρ l , C p , l and v l are the species mass averaged liquid density, specific heat and velocity, respectively. D l stands for the species diffusion coefficient of liquid, while λ i , h l , i and Y i express the thermal conductivity, enthalpy and mass fraction of species i, respectively. The interface conditions including the determination of the surface droplet temperature are provided in details in [23].

2.2. Droplet Evaporation and Species Mass Fraction at and around the Droplet Surface

The designed multi-component evaporation model relies on the film modeling approach according to [22,23]. In this respect, the evaporation rate or mass transfer of a multi-component droplet is given by:
m ˙ = d m d d t = i n m ˙ i = i n π d p ρ ¯ D ¯ i , g S h i l n 1 + B M , i ,
and the heat balance can be formulated based on averaged droplet properties as:
d T d d t = m ˙ C p , g T T d / B T h e v a p m d C p , d ,
where m ˙ represents the total evaporation rate of droplet, m ˙ i the evaporation rate of individual species i, d p the droplet diameter, D i , g the binary diffusion coefficient of component i in the gas. This will be later denoted as D A B in Equations (10)–(12). In Equation (5), T d represents the averaged droplet temperature, C p , g , and C p , d stand for the specific heat capacity of vapor phase and droplet liquid, respectively, while h e v a p expresses the latent heat and B T , the Spalding heat transfer number. The dimensionless Sherwood number S h i :
S h i = 2 r d Y i r | r = r s Y i , s Y i , ,
defined as the ratio of the mass fraction gradient at the droplet surface and the average mass fraction gradient in the gas film surrounding the droplet is introduced based on the correlation [22]:
S h 0 i = 2.0 + 0.6 R e 1 / 2 S c i 1 / 3 ,
to account for the convection of the species due to gas flow. The quantities R e , and S c i represent the Reynolds and Schmidt number defined, respectively, as:
R e = ρ g , u r e l d p μ g and S c i = μ g ρ g , D g , i .
To account further for the Stefan effect, the modified Sherwood number, S h i , is considered. It is defined as a function of the Spalding mass transfer number of component i, B M , i following [22] as:
S h i = 2 + S h 0 i 2 F B M , i with B M , i = Y i , s Y i , 1 Y i , s and F B M , i = 1 + B M , i 0.7 l n ( 1 + B M , i ) B M , i ,
where Y i , s and Y i , are the mass fraction at the droplet surface and far from the droplet surface, respectively.
Focusing on UWS as a bi-component mixture, it is vital to have reliable thermo-physical properties for the individual liquid components. These properties are summarized in Table 1, Table 2, Table 3, Table 4 and Table 5. Apart from these thermo-physical properties, the binary diffusion coefficient plays a critical role on evaporation rate, especially in the case of static droplet. It helps in renewal of droplet interface by diffusing away the liquid vapor. The theory describing diffusion of binary gaseous mixtures especially at atmospheric pressure has been well developed based on solution of Boltzmann equation. Initial works from Chapman and Enskog (see in [29]) provide basic framework in calculation of diffusion coefficient. In this aspect, Marrero and Mason [30] proposed for a binary diffusion coefficient between species A and B the following relation:
D A B = 0.00266 T 1.5 p M A B 0.5 σ A B 2 Ω D ,
where T is the temperature (in K), p the pressure (in bar), σ A B the characteristic length of molecule (in A°), Ω D the diffusion collision integral (dimensionless) and M A B = 2 M A 1 + M B 1 the averaged molecular weight of binary components.
There are several proposed methods to estimate D A B in low pressure binary gas systems retaining the general form by Chapman and Enskog with empirical constants based on experimental data. One of the widely used binary diffusion correlations is the modification by Wilke and Lee [21] given as:
D A B = 3.03 0.98 / M A B 0.5 10 3 T 1.5 p M A B 0.5 σ A B 2 Ω D ,
where σ A B = σ A + σ B / 2 with σ = 1.18 V b 1 / 3 . Thereby, V b expresses the liquid molar volume at normal boiling point temperature. In the present study, the diffusion collision integral Ω D is calculated by a more accurate relation proposed by Neufeld et al. [33]. Another famous estimation of D A B is based on atomic diffusion volume as proposed by Fuller et al. [34]:
D A B = 0.00143 T 1.5 p M A B 0.5 v A 1 / 3 + v B 1 / 3 ,
where v is found for each component by summing atomic diffusion volumes tabulated in [34] and obtained by regression analysis of many experimental data.
Since the diffusion coefficient plays a significant role in evaporation dynamics of static droplet with zero or micro-gravity, numerical studies are performed in this work to analyze the influence of the three correlations in Equations (10)–(12). Figure 1 shows the diffusion coefficient of water and urea in N2 environment as function of temperature. Since both water and urea vapor can exhibit entirely different mechanism for mass diffusion (see Figure 1), various combinations of these correlations are applied for adBlue system. These will be named throughout the paper as case studies C11, C22, C33 and C31, respectively, as clearly listed in Table 6.
The evaporation rate can further be defined by introducing the heat transfer correlation as [22];
m ˙ = 2 π r d λ g C p , g N u ln ( 1 + B T ) ,
where r d is the droplet radius, λ g and C p , g are the thermal conductivity and specific heat capacity of gaseous media, respectively. N u the modified Nusselt number as a function of Spalding heat transfer number B T is provided in Equation (16). Note that the classical dimensionless Nusselt number N u is defined as [22]:
N u = 2 r d T r | r = r s T d T .
To account for the convective heat transfer between the droplet and the gas phase, the Nusselt Number N u 0 is introduced based on correlations as:
N u 0 = 2.0 + 0.6 R e 1 / 2 P r 1 / 3 with P r = C p , g μ g λ g .
Further accounting for the Stefan effect, the modified Nusselt number is also introduced as:
N u = 2 + N u 0 2 F B T with B T = C p , g T T d h e v a p and F B T , i = 1 + B T 0.7 ln ( 1 + B T ) B T ,
where P r is the Prandtl number, μ g the viscosity of carrier gas, respectively. L e represents the Lewis number taken as 1 in the present study. It should also be noted here that in the case of static and zero-gravity evaporation with no droplet relative velocity, the value of correlations for both S h and N u becomes 2.
In order to take into account the influence of natural convection on the droplet evaporation, the Sherwood number correlation in Equation (9) and Nusselt number in Equation (16) are modified following [35] as:
S h 0 i = 2.0 + 0.6 R e e q 1 / 2 S c i 1 / 3 and N u 0 = 2 + 0.6 R e e q 1 / 2 P r 1 / 3 ,
with R e e q a new equivalent Reynolds number introduced to account for the competitive contribution from the forced and natural convection. It is given as:
R e e q = m a x R e , m a x G r , 0.0   with   G r = ρ g , T g , T s d p 3 g 0 μ g T g , .
In this equation, the quantity g 0 is the gravitational constant.

2.3. Evaluation of Material Properties in the Film

The material properties for urea and water used in this work are taken from [31] and listed in Table 1, Table 2, Table 3, Table 4 and Table 5. The mass fraction of urea in a UWS droplet increases with water evaporation. According to the film modelling approach, it is assumed that a gaseous film surrounds the droplet where both liquid and gaseous phases are in a thermodynamic equilibrium. The mass fractions Y g s , i and Y l s , i at the droplet surface can be determined according to the Raoult’s law as:
p g s , i = X l s , i p v a p , i 0 ,
where p g s , i and X l s , i are the partial pressure in the gas phase and mole fraction at the droplet surface for species i, respectively. p v a p 0 is the equilibrium vapor pressure for a pure species i at the droplet surface with temperature, T s . The variable X l s , i and Y g s , i can be expressed by following relations between mole and mass fractions,
X l s , i = Y l s , i / M i j Y l s , j / M j , and Y g s , i = X g s , i M i j X g s , j M j = p g s , i M i j p g s , j M j ,
where M i is the molecular weight of species i.
Within the film, gas film properties are evaluated at a mean/reference temperature T g , r and composition Y g , r according to:
T g , r = T s + A r ( T g , T s ) and Y g , r = Y g , s + A r ( Y g , Y g , s ) with A r = 1 / 3 ; 2 / 3 ; 0 ,
where the averaging factor A r = 1 / 3 , 2 / 3 , 0 represents the so-called 1/3, 2/3 and 0 film rule, respectively. In this work, two expressions (the 1/3-rule and the zero-rule) are applied in order to assess how the qualitative temperature and species mass fraction in the film impacts the adBlue depletion process. The physical properties, like viscosity and thermal conductivity of the film mixture, are calculated using the Wilke mixing rules [36]. Throughout the paper, all the reported results are obtained by using “1/3” film rule, unless otherwise explicitly specified in figures.

2.4. Determination of UWS Vapor Pressure

Even though the adBlue is vastly being used in diesel engine SCR, the complete thermo-physical properties of binary-mixture, especially the vapor pressure of urea when it is dissolved with water is still unavailable. It has been largely reported that urea undergoes thermolysis (converting directly into gas from solid). Moreover, the urea has a melting point temperature of 407 K, and the corresponding vapor pressure is very low (see in [5]). Nevertheless, different vapor pressures are used in various studies [2,5,8,12].
In contrast to [1], in the present study, simulations are performed with the urea vapor pressure according to experimental data from [32], which is listed in Table 2. The vapor pressure of both water and urea is depicted in Figure 2. The difference among the vapor pressure is thereby clearly visible.

2.5. Scenarios for Urea Thermal Decomposition

With the help of available heat from exhaust gas, a solution of 32.5% urea in water (adBlue) is sprayed into the exhaust duct ahead of the SCR catalyst. Thereby, water is evaporated as
CO ( NH 2 ) 2 ( aq ) CO ( NH 2 ) 2 ( s , l ) + H 2 O ( g ) ,
and the resulting urea, if in solid state first melts (melting point of 407 K) and starts to decompose thermally. According to Koebel et al. [37], the decomposition produces ammonia accompanied by the formation of biuret, triuret and ammonium isocyanate. Above 453 K, cyanuric acid and other compounds of higher molecular weight are produced. In particular, if the urea heating is very fast, the above reactions under loss of ammonia are suppressed and the following thermal decomposition is the preferred reaction (thermolysis):
CO ( NH 2 ) 2 ( s , l ) NH 3 ( g ) + HNCO ( g ) ,
in which urea decomposes into ammonia (NH3) and isocyanic acid (HNCO). Due to the high reactivity of HNCO, it was observed that its primary formation may subsequently lead to the formation of the compounds of higher molecular weight mentioned above [37]. In particular, the reaction with urea will lead to biuret, the reaction with itself (trimerization) will lead to cynuric acid, etc. (see [37]). To avoid these compounds, fast heating process is recommended to get only ammonia and isocyanic acid. As pointed out in [37] and elsewhere, this reaction is endothermic by +185.5 kJ/mol at standard conditions (298 K, 1 bar). The released gaseous ammonia can take part in the SCR reactions while the resulting isocyanic acid (HNCO) will produce ammonia (NH3), through hydrolyzation on the SCR catalyst (or in the gas phase at high temperatures) following
HNCO ( g ) + H 2 O NH 3 ( g ) + CO 2 ( g ) .
While water evaporation and thermolysis processes are endothermic, the hydrolysis reaction is exothermic by 95.9 kJ/mol at standard conditions. As pointed out above, a key issue faced by SCR systems is inefficient performance resulting from incomplete thermolysis of urea ahead the SCR catalyst, among others. This incomplete thermolysis can be due to incomplete water evaporation or/and due to thermolysis process itself, which may lead to undesirable urea deposition on the walls and substrates inlets. In order to appraise the capability of the methodology to accurately describe the two involved endothermic reactions, we restrict ourselves to processes Equations (22) and (23). The hydrolysis (Equation (24)) is therefore not considered in the present work assuming that the HNCO formed during the process is stable enough in the humid gas phase as pointed out in [37].
As the aggregation of urea after the evaporation of water and during the thermal decomposition is not clearly known, various scenarios for the thermal decomposition of urea in the gaseous phase are envisaged from the literature. As already mentioned in introduction, two ways to treat urea decomposition can be depicted depending on whether the urea is directly decomposed at the droplet surface or first evaporates into the gaseous phase and then decomposes according to a chemical reaction [5,16]. Relying on the film evaporation model, the second alternative is first adopted in the present paper. Thereby, two single step scenario mechanisms and two two-step scenario mechanisms are considered. The reference one, referred to as M0, consists in an evaporation process in which the heat of evaporation corresponds to the latent heat of urea (+87.4 kJ/mol). The second (M1) considers the evaporation of urea in which the heat of evaporation corresponds to the total heat of evaporation and of a fictive heat of decomposition of urea (87.4 + 98.1 = 185.5 kJ/mol). The mechanisms M0 and M1 are not followed by a subsequent chemical reaction. The next two mechanisms proceed in two steps in which the scenarios M0 and M1 are extended by consideration of subsequent reaction kinetics (Equation (23)), respectively. Hence, the third mechanism (M2) considers subsequently to M1, a decomposition reaction according to an Arrhenius law that does not contribute to any thermal evolution ( h d e c = 0.0 kJ/mol). The fourth (M3) separates the heat contributions in both evaporation ( h e v a p = 87.4 kJ/mol) and decomposition ( h d e c = 98.1 kJ/mol) by considering them individually. It extends “M0” by considering the thermal decomposition, which is described by an Arrhenius law, which, in turn, is accompanied by a gas phase reaction. All these scenarios are summarized in Table 7.

3. Numerical Configurations and Experiments

In the present work, the evaluation of the adopted multi-component evaporation model is performed in various stages. First, the model is assessed to ensure its predictability on simple single component water droplet since water is one component of adBlue droplet. In particular, the influence of gravity or natural convection is taken into account following the experiment in [24]. Second, the model is applied to predict the evaporation process of adBlue droplet, first at lower temperature of 423 K. This case is devoted to ensuring the correctness of initial droplet condition as experiment reports about a delay time associated with generating droplet and bringing the furnace chamber environment to static droplets. Finally, configurations under various operating temperature conditions as experimentally studied in [24] are investigated where the prediction capability of the mechanisms M0–M3 is evaluated. In [24], the adBlue droplets were suspended in thin optic-fiber wire and the preheated furnace at desired temperature was then brought up to heat-up the droplets. More details about the measurement technique can be found in [24]. However, it is essential to note that the measurements were also performed for relatively lower temperature, where the urea residue could be easily observed as well.
In order to retrieve the thermal and species evolution inside the droplet, 1D transport Equations (1)–(3) are discretized spatially along the droplet radius and solved for. A high mesh resolution close to the droplet surface is needed in case of intense heat and mass transfer. For the present case, a discretization with 10 equidistant control volumes along the droplet radius was found to be sufficient to capture the evaporation dynamics properly.

4. Results and Discussion

In this section, the results of the various investigations as already stated in the previous section are reported. They are correspondingly discussed.

4.1. Model Validation on Single Component Water Droplet under Gravity

As already mentioned before, the pure urea is in a solid state at room temperature, and adBlue, which is a mixture of water and urea, forms a binary liquid mixture. Such a system is complex in terms of evaporating behaviour. The vapor pressure of both pure water and pure liquid urea is shown in Figure 2 according to [32]. The large difference in the vapor pressure inevitably makes water a preferred candidate for evaporation in a binary system: once water is fully evaporated, urea can then evaporate depending on the gas-phase temperature (while undergoing thermolysis).This is addressed in detail in subsequent sections.
First, the influence of natural convection is evaluated on an evaporating a single component water droplet at 573 K with an initial diameter size of 0.92 mm. This size corresponds to one of the adBlue droplet diameters to be investigated later. A significant effect is observed on the droplet evaporation rate in Figure 3a. This influence is twofold. First, the heat and mass transfer is enhanced due to natural convection around the droplet (see Equations (17) and (18)). Second, the droplet interface is continuously renewed by convecting away the evaporated mass, thus maintaining the higher mass fraction gradient at droplet interface, which, in turn, enhances the mass transfer rate. Therefore, in order to carry out a consistent study of single standing droplets under gravitational influence, evaporation models should include the heat and mass transfer correlations that especially account for natural convection (see e.g., Equation (17)). The present numerical study uses the available experimental data by Wang et al. [24], which were gathered under normal gravitational influence. Figure 3b underlines this effect on the evaporation rate of adBlue droplet (60% water + 40% urea) at lower temperature 423 K at which urea mass transfer is not observed.

4.2. Adaptation of Initial Droplet Condition Related to adBlue Experiment

The model including natural convection effect with “C31” diffusion coefficient correlation is now applied to track the evaporation of adBlue droplets. Figure 4 shows the evaporation behavior and temperature evolution of adBlue at 423 K. It is worth noting here that the melting point of pure urea is 407 K. Therefore, only water evaporates as depicted in Figure 4a in accordance with experimental observations. Since the decomposition gets fully evident slightly above 407 K, there is no visible thermolysis of the remaining urea (also in experiments) at this temperature. The droplet diameter remains constant once water is completely evaporated. However, it is reported in experiments that there is a finite time associated with generating droplets and bringing the furnace chamber environment to static droplet. Therefore, part of water gets evaporated before the actual measurement is performed and droplet becomes enriched with urea. Thus, in the present study, urea–water mass is corrected to 40% urea + 60% water (instead of 32.5% urea + 67.5% water). Figure 4a shows the results for both corrected and uncorrected mass fraction plotted against experimental data. Since there is less water to be evaporated in the corrected mass case, the evaporation of water is completed earlier and the respective final drop size is higher and close to experimental results (see also Figure 3b, (with gravity)).
The droplet surface temperature profile shows four distinct stages (see Figure 4b). At the start of evaporation, a droplet extracts heat from the gaseous environment and its temperature rises until the equilibrium corresponding to the wet-bulb temperature of water is reached. In the second stage, the droplet starts to shrink as water evaporates (due to its higher vapor pressure compared to that of urea) causing the urea mass fraction to increase at the droplet surface. This phenomena can easily be also observed in Figure 5a. This leads to a slight increase in the droplet temperature. The increase in urea mass fraction at the surface slows down further evaporation as the vapour pressure of water at the surface drops while that of urea increases. Once the water inside the droplet is fully evaporated, the temperature further rises to reach the thermal equilibrium corresponding to that of urea (third stage). The slope of the droplet surface area vs. time changes after a short transitional period. Since in this particular case the gas temperature is lower than the equilibrium temperature of urea, the final droplet temperature nearly reaches the gas phase temperature (fourth stage) while the urea mass fraction becomes maximal. This is also clearly depicted in Figure 5b. In fact, to gain more insight into the urea distribution inside the droplet, the time evolution of urea mass fraction and temperature inside the droplet is plotted along the droplet radius in Figure 5 exemplary at 573 K. Because the heating up period of the droplet is much shorter than the evaporation time, there is no significant thermal gradient along the droplet radius. From Figure 5b, it is also apparent that the urea concentration rather displays a three-stage behavior away from the droplet surface as no visible effect on the urea concentration is observed during the initial heating process of water.
Further validation results at various temperatures are provided in the next section together with the effect of binary diffusion coefficients on the evaporation rate.

4.3. Influence of Binary Diffusion Coefficient Correlations

Once ensuring the correctness of the initial droplet condition, the influence of the diffusion correlations (see Table 6) on the droplet evaporation dynamics is now investigated. For that purpose, simulations are performed for further chamber temperatures, namely 473 K, 523 K, 573 K and 623 K. Figure 6a shows a comparison of the evaporation rates with experiments for gas phase temperature of 473 K. Four sets of diffusion coefficients are considered. The case “C11” applies the diffusion correlation proposed by Wilke et al. [21] to both water and urea. “C22” uses that suggested by Marrero et al. [30] while “C33” employs the diffusion coefficient by Fuller et al. [34] also to both water and urea. The case “C31” combines the best diffusion correlation for water (Fuller et al. [34]) and that for urea (Wilke et al. [21]). A realistic evaporation rate can be clearly seen in all these cases. There are two distinct regimes of evaporation as clearly exhibited by two different slopes. The first sharp slope represents the evaporation of water (due to lower boiling point temperature) and the second one stands for the urea mass transfer. The difference in evaporation rate is visible for case C33, while cases C11 and C22 display almost the same profile. The correlation C33 exhibits lower evaporation rate as compared to cases C11 and C22. The corresponding droplet temperature evolution is depicted in Figure 6b, showing clearly the influence of binary diffusion coefficient correlations. The droplet temperature is higher for C33 case due to lower evaporation rate. However, four stages of droplet thermal dynamics are also clearly evident. Similar evaporation rate and droplet temperature trend are also observed under other temperature conditions 523 K, 573 K and 623 K as shown in Figure 7. Moreover, the distinction between the two regimes of evaporation becomes lesser with higher gas temperature. It turns out that the combined D A B correlation “C31” enables an evaporation rate prediction relatively closer to experimental data, while at higher temperature slight deviation occurs. This finding is summarized in Figure 8a. The slight deviation at high temperature can be partly attributed to radiation effect or to the reliability of thermo-physical properties at higher temperature and partly due to chemical kinetics in the gas phase at higher temperature. Focusing on Figure 8b, it is evident from the temperature evolution that the droplet reaches its maximum temperature earlier with increasing gas phase temperature.
The influence of gas phase temperature on both water and urea mass transfer rate is displayed in Figure 9. Thereby, the evaporation rate is plotted at 473 K and 573 K as gathered by using both the 1/3 and zero film rules, respectively. At the end of a short initial heating, the mass transfer rate reaches its maximum for both gas phase temperatures, followed by a gradual reduction in rate with decreasing drop size (or drop surface area). Note that the maximum transfer rate is 1.8 times higher for water evaporation and four times for urea evaporation for case 573 K once compared to case 473 K. This is reflected in the total time taken to evaporate water completely. However, the urea mass transfer rate is considerably lower in the case of 473 K where it takes relatively longer time to evaporate urea completely. A discussion of results obtained with the different film rules is provided in Section 5.2.

5. Thermal Decomposition of Urea

5.1. Effect of Scenarios for Urea Thermal Decomposition

As it has been pointed out earlier, once the water evaporates completely from a droplet, the remaining urea mass transfer is thought to proceed in conjunction with various thermo-chemical processes [5,16]. In addition to the two one-step scenario mechanisms defined as M0 and M1, two two-step scenario mechanisms (M3 and M2) are applied in which gas phase reaction kinetics for decomposition of urea into ammonia (NH3) and isocyanic acid (HNCO) is considered. They extend the scenarios M0 and M1 by accounting for subsequent reaction kinetics as summarized in Table 7. In the first mechanism “M2”, urea is evaporated in the gaseous phase with a total heat of evaporation that includes both latent heat and decomposition enthalpy of urea; the decomposition reaction does not contribute to any thermal evolution. In the second mechanism “M3”, the heat contribution in both evaporation and decomposition is considered individually. In order to assess the influence of these approaches on the droplet depletion dynamics under gravitational effect, simulations are performed by using the reliable diffusion correlation case “C31” together with a 1/3 film rule for determining thermo-physical material properties in the film. The results from mechanisms M2 and M3 are compared to those obtained by applying the evaporation mechanisms M0 and M1 (without any reaction) and to experimental data [24], respectively.
Figure 10 shows the comparison of the evaporation dynamics for mechanisms M0–M3 against the experimental data for gas phase temperature 473 K. While there is no influence of these mechanisms on water evaporation rate, the aforesaid decomposition mechanism is expected to influence the evaporation dynamics in three folds. First, the droplet interface will be renewed due to the consumption of urea resulting in a higher mass transfer and subsequent concentration gradient. Secondly, due to lower latent heat especially in M3 case, the mass transfer rate is further higher. Finally, since the decomposition process is endothermic, it absorbs heat from the gas phase resulting in the reduced mass transfer of urea. Since at lower temperatures, especially 473 K, the evaporation rate of urea is very small due to lower vapor pressure, the corresponding contribution from both decomposition mechanisms is not so visible in overall evaporation dynamics. This influence is more dominant at higher ambient temperatures as seen in Figure 11 for 523 K, 573 K and 623 K cases, respectively. It is worth noting that at higher temperature the simulated results with thermal decomposition scenario model “M3” compared well against experiments, while “M0” emerges as a reliable evaporation scenario.
In order to get further insight about these mechanisms and their influence under various ambient gas temperatures, Figure 12 shows water and urea mass transfer rate in conjunction with conversion dynamics of NH3 and HNCO. As observed above, the water mass transfer rate is only influenced by the gas phase temperature, and not by the reaction mechanisms, while urea mass transfer is significantly influenced by both ambient temperatures and reaction mechanisms (Figure 12a). The total converted mass of NH3 and HNCO is the same in both mechanisms while noticeable delay in case “M2” (Figure 12b) owing to lower urea evaporation rate is initially observed. This suggests the importance of considering the right mechanism to simulate such SCR system. The conversions are considerably small for low gas phase temperature of 473 K.

5.2. Effect of Material Properties in the Film

In order to assess the influence of the gas film rule on the prediction of the evaporation outcome, simulation results achieved by applying the zero-rule are compared in Figure 9 to those obtained with the 1/3 film rule for determining thermo-physical material properties in the film using mechanism M0. In Figure 13, their effects on the evaporation with and without thermal decomposition are compared to experimental data [24] when the two best mechanisms M0 and M3 are employed, respectively. In both cases (see Figure 9 and Figure 13), the influence of the film rule is very small. However, the 1/3 rule provides results that are slightly close to experiment.

6. Conclusions

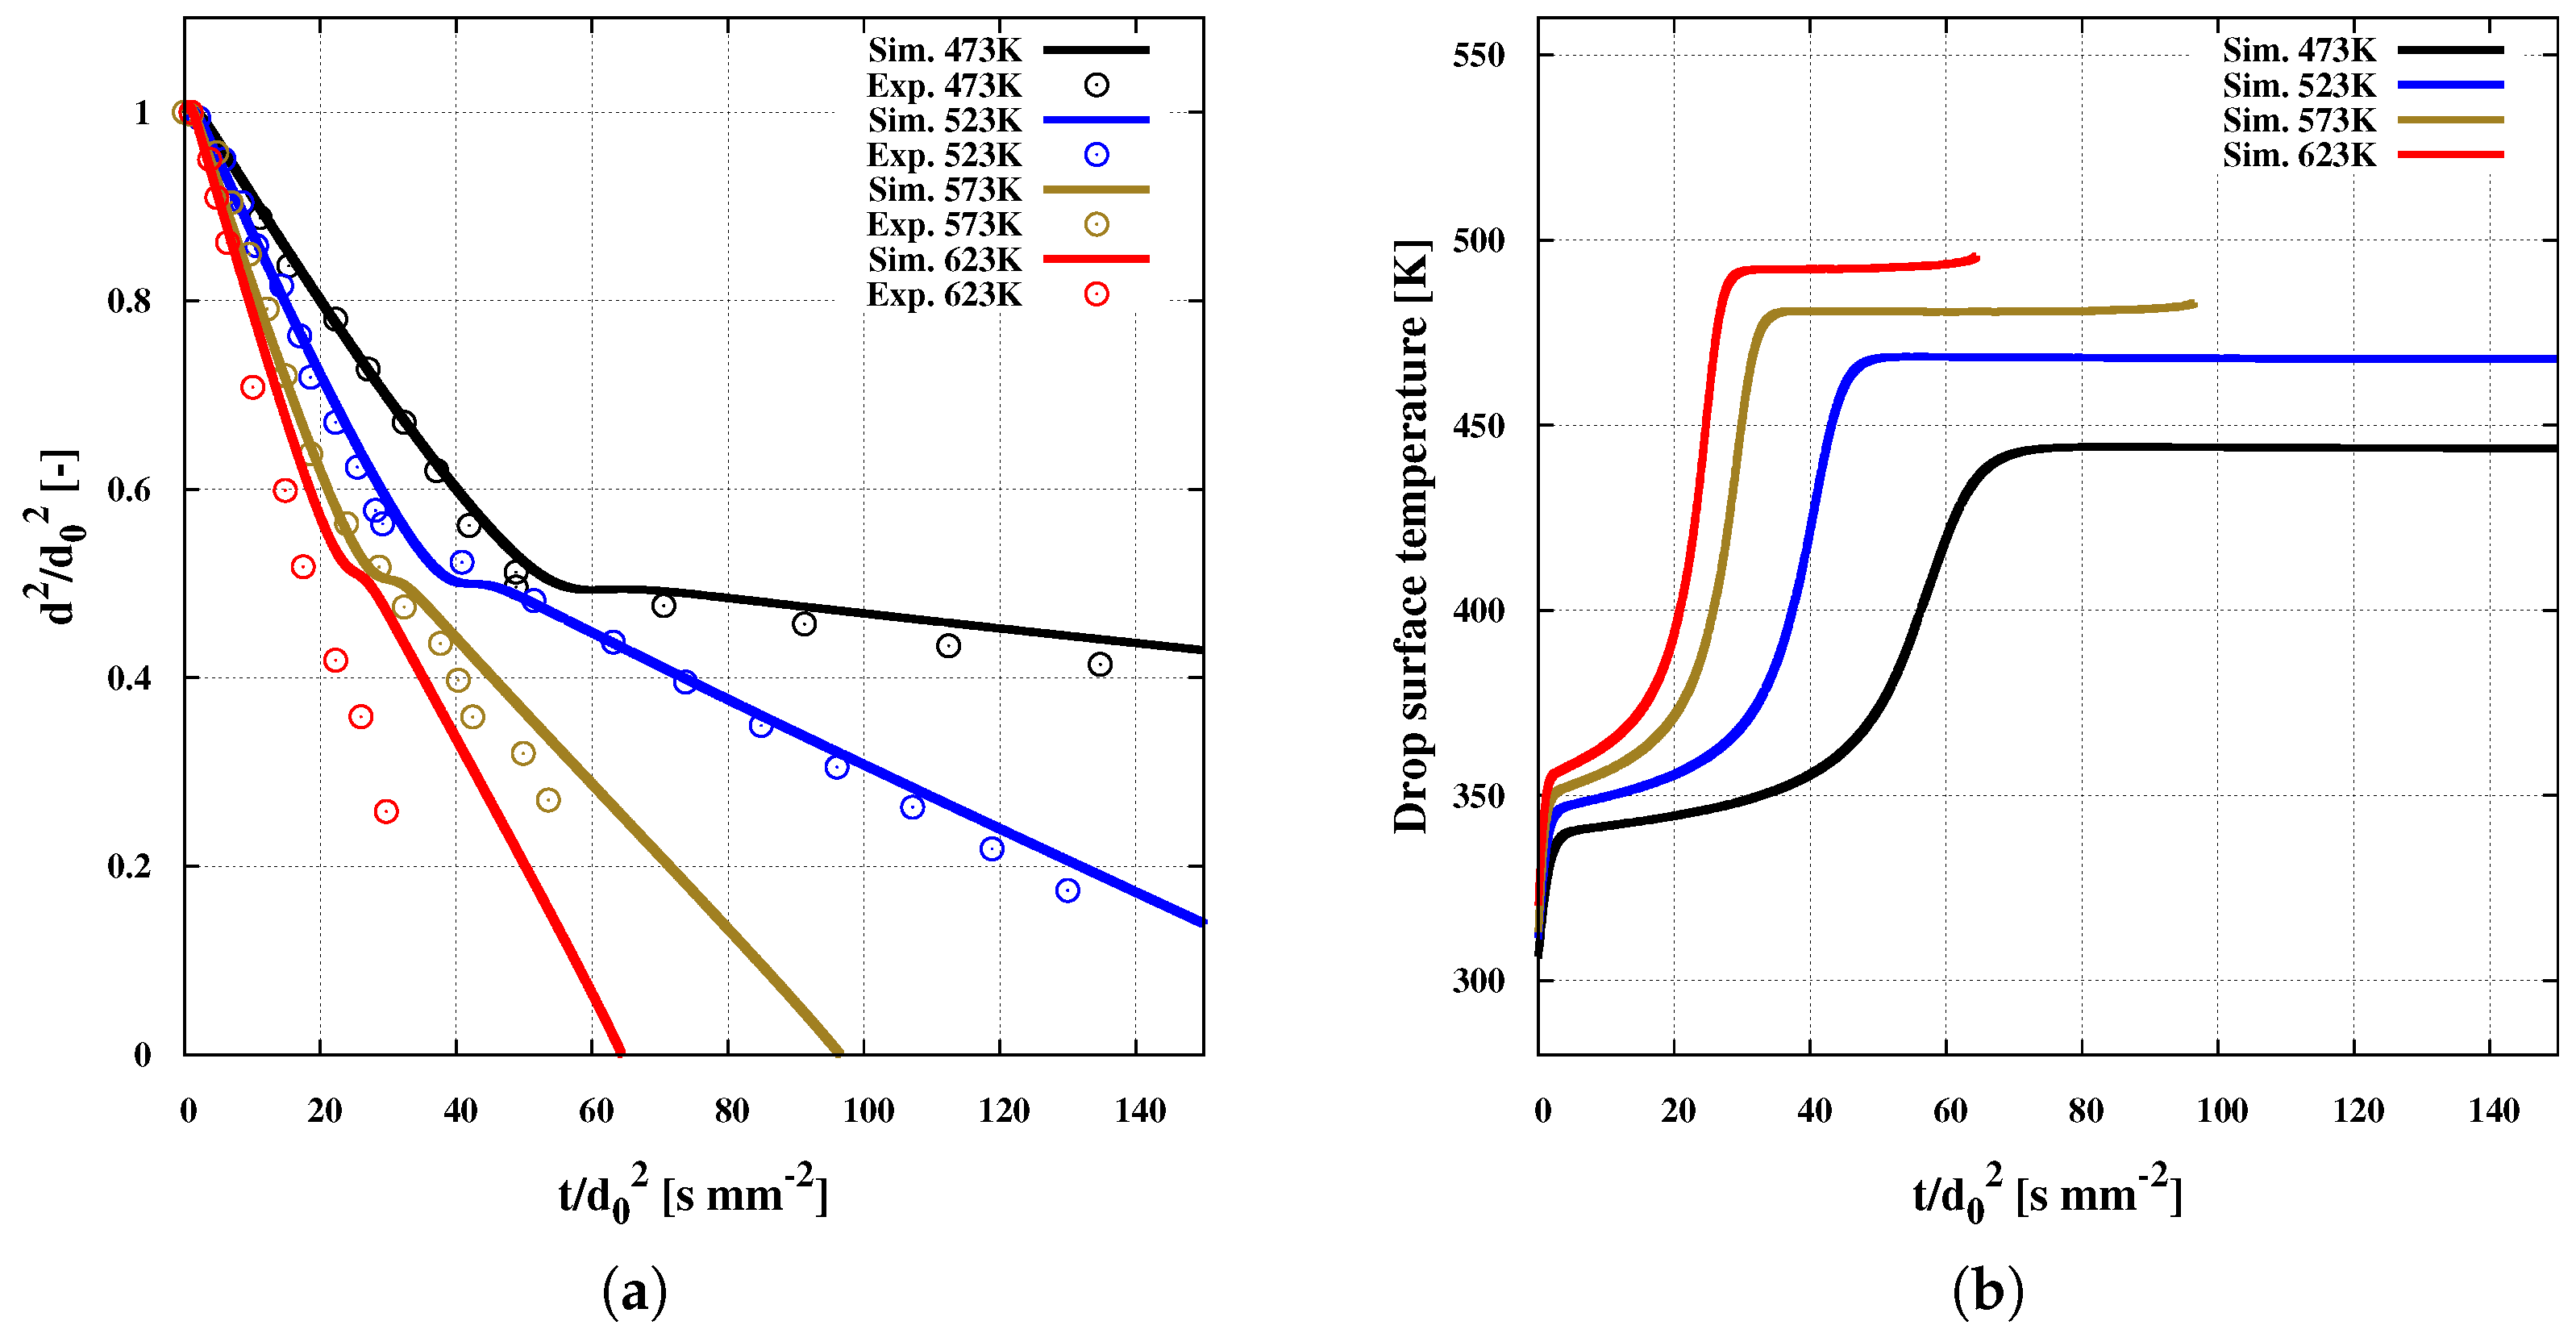
In this work, various scenarios for thermal decomposition have been investigated and assessed under SCR operating conditions relying on an appropriate multi-component evaporation model that includes a reliable binary diffusion coefficient. Such a model has been designed for the first time in the Eulerian–Lagrangian CFD framework to account properly for the distinct evaporation regimes of adBlue droplets under various operating conditions. First, the effect of diffusion coefficient correlations on the droplet thermal dynamics has been especially pointed out. It turned out that satisfactory agreement between experiment and numerical predictions was achieved for a wide range of operating temperatures by using the correlations by “Wilke and Lee” for urea and by Fuller et al. for water. The results are especially sensitive to gravity effect.
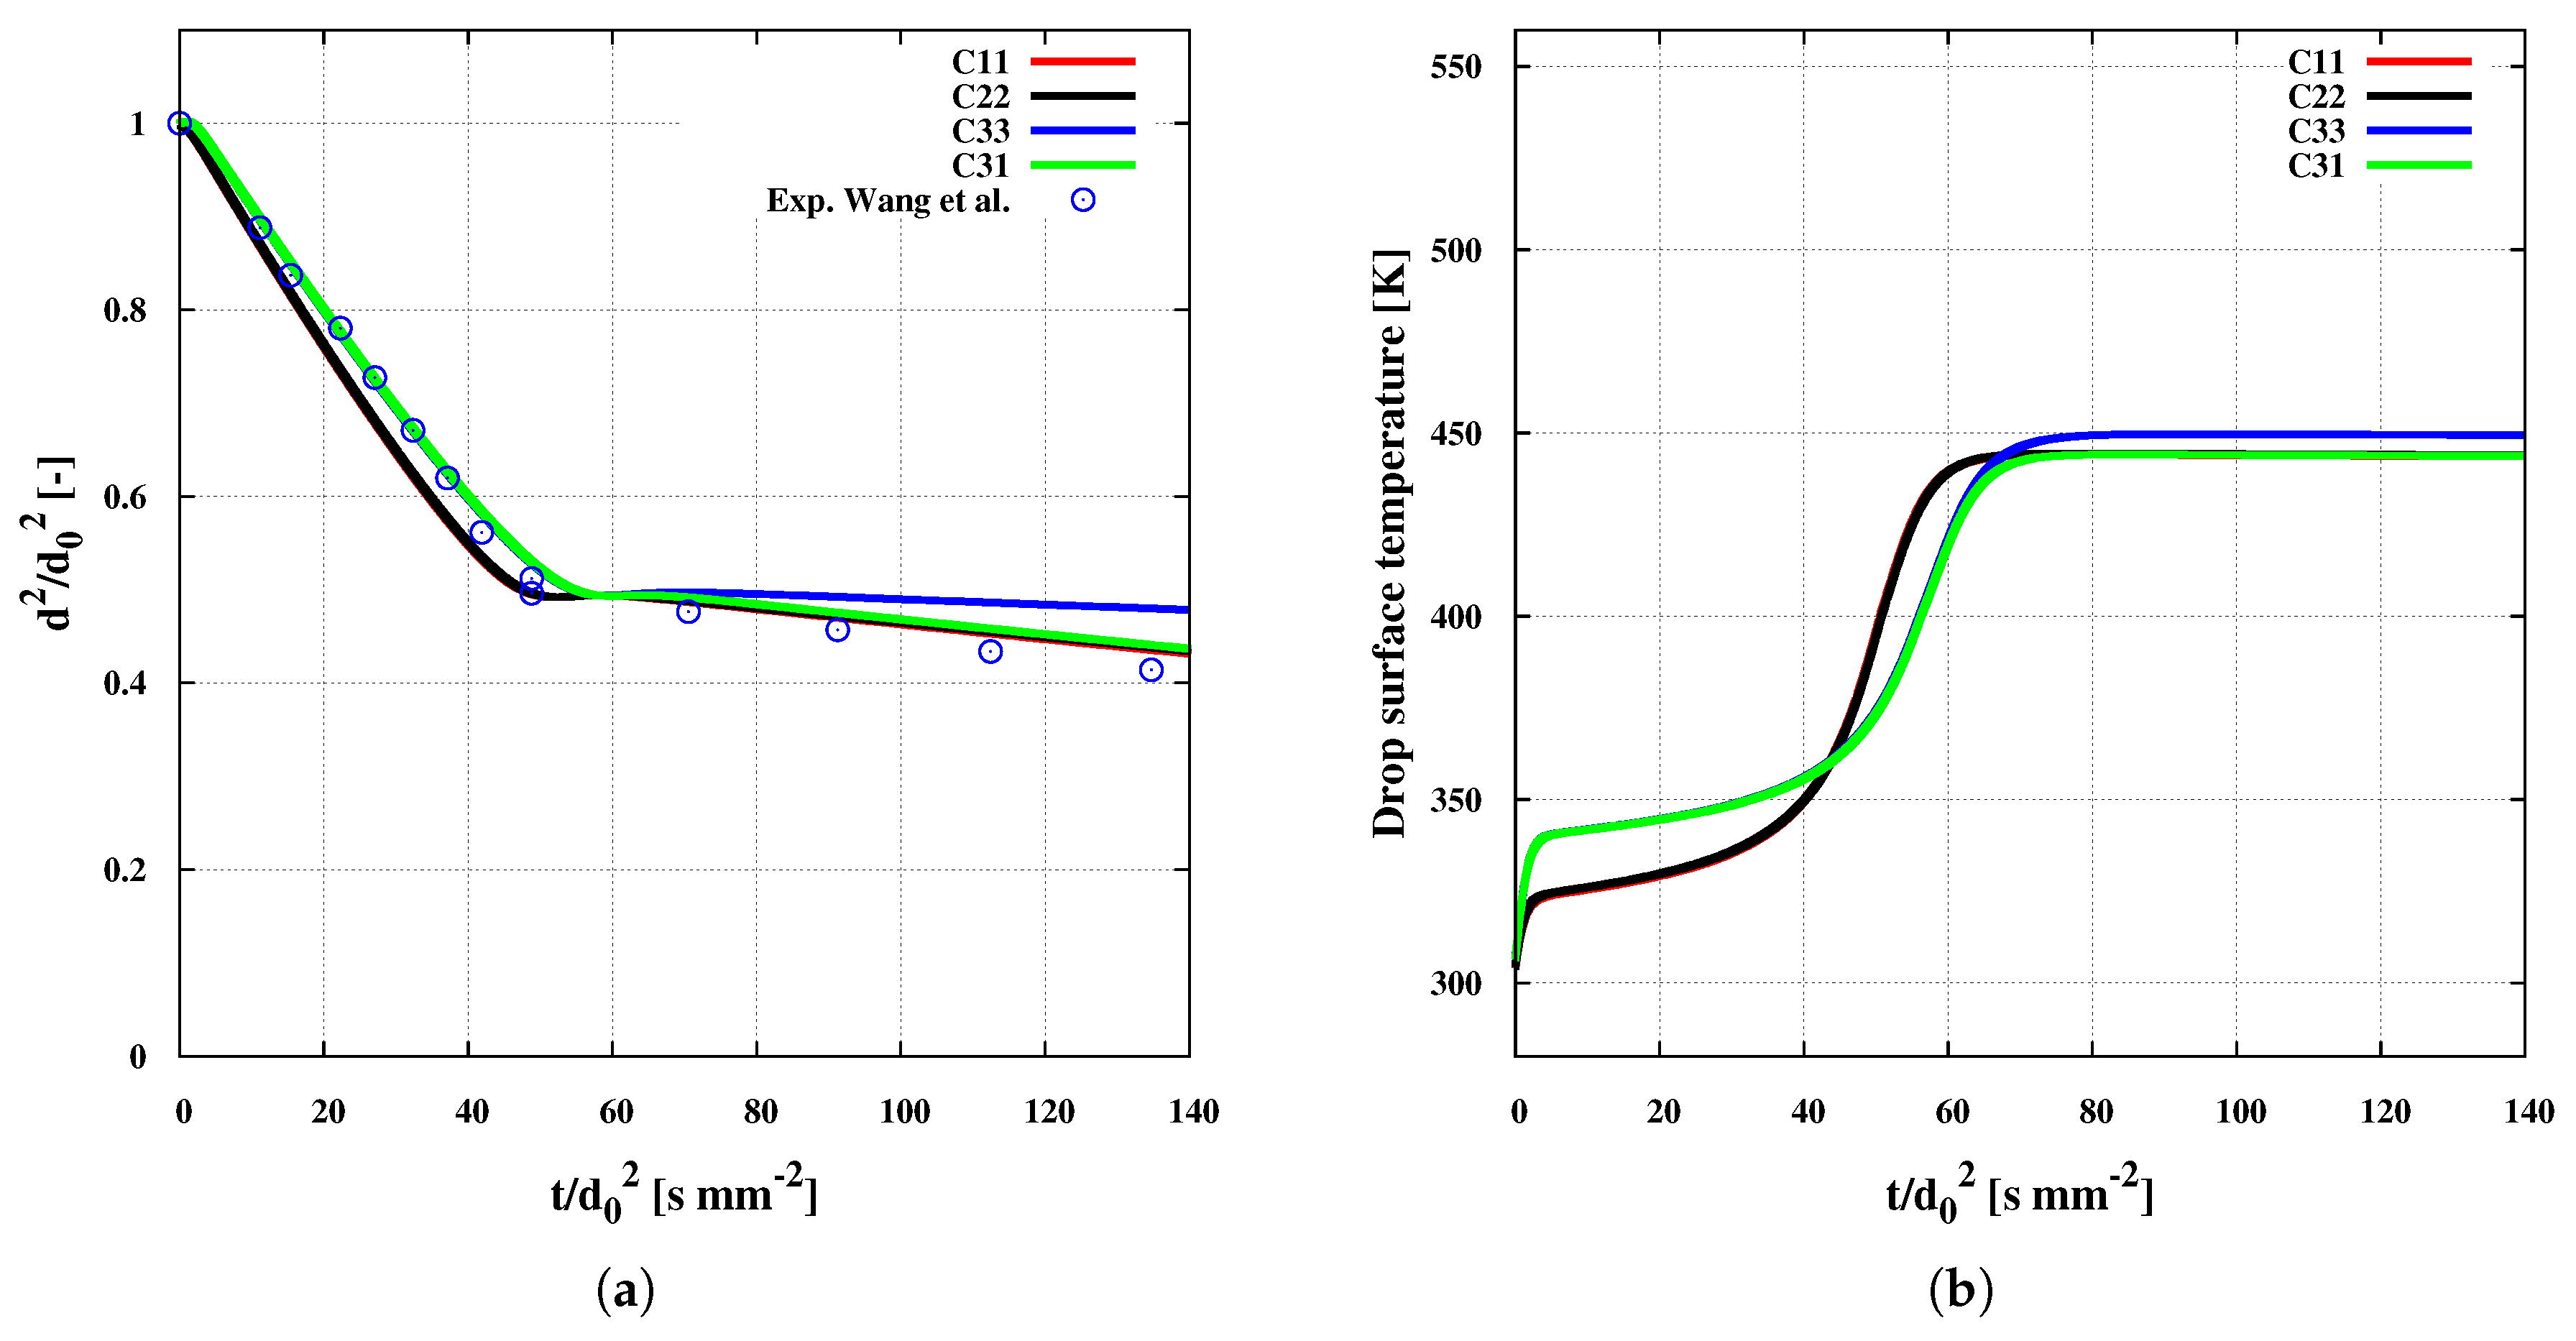
This model has been extended for thermal decomposition of urea in the gaseous phase. Depending on how the heat of thermal decomposition of urea is provided, four scenarios have been considered. The predictions of the resulting model variants have been assessed in terms of droplet evaporation rate, water and urea mass fraction inside and outside the droplet, conversion rate of isocyanic acid and ammonia as well as of droplet temperature evolution, whereby available experimental data by Wang et al. [24] have been used for validation.
For the case of single adBlue droplet investigated in the present work, the following conclusions can be drawn:
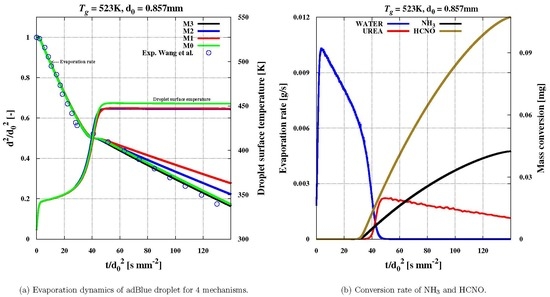
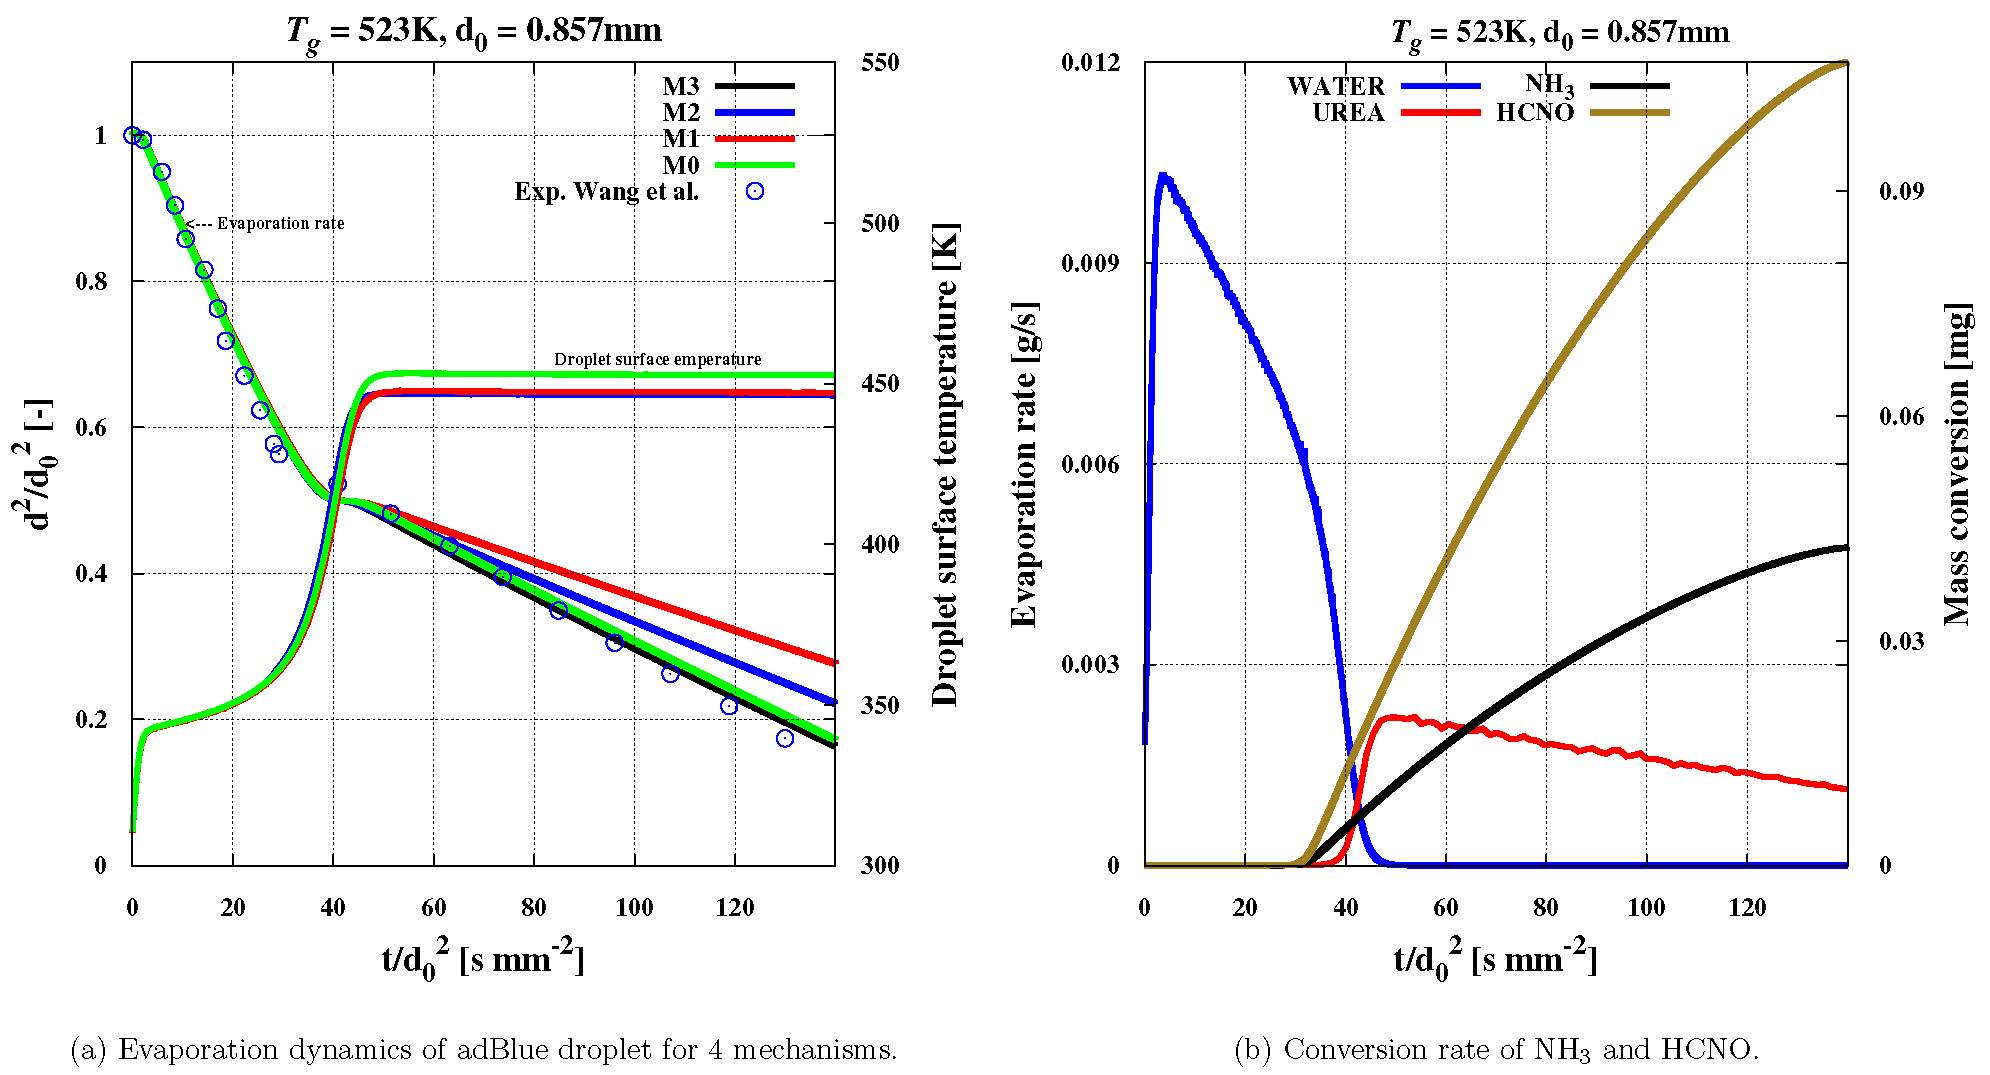
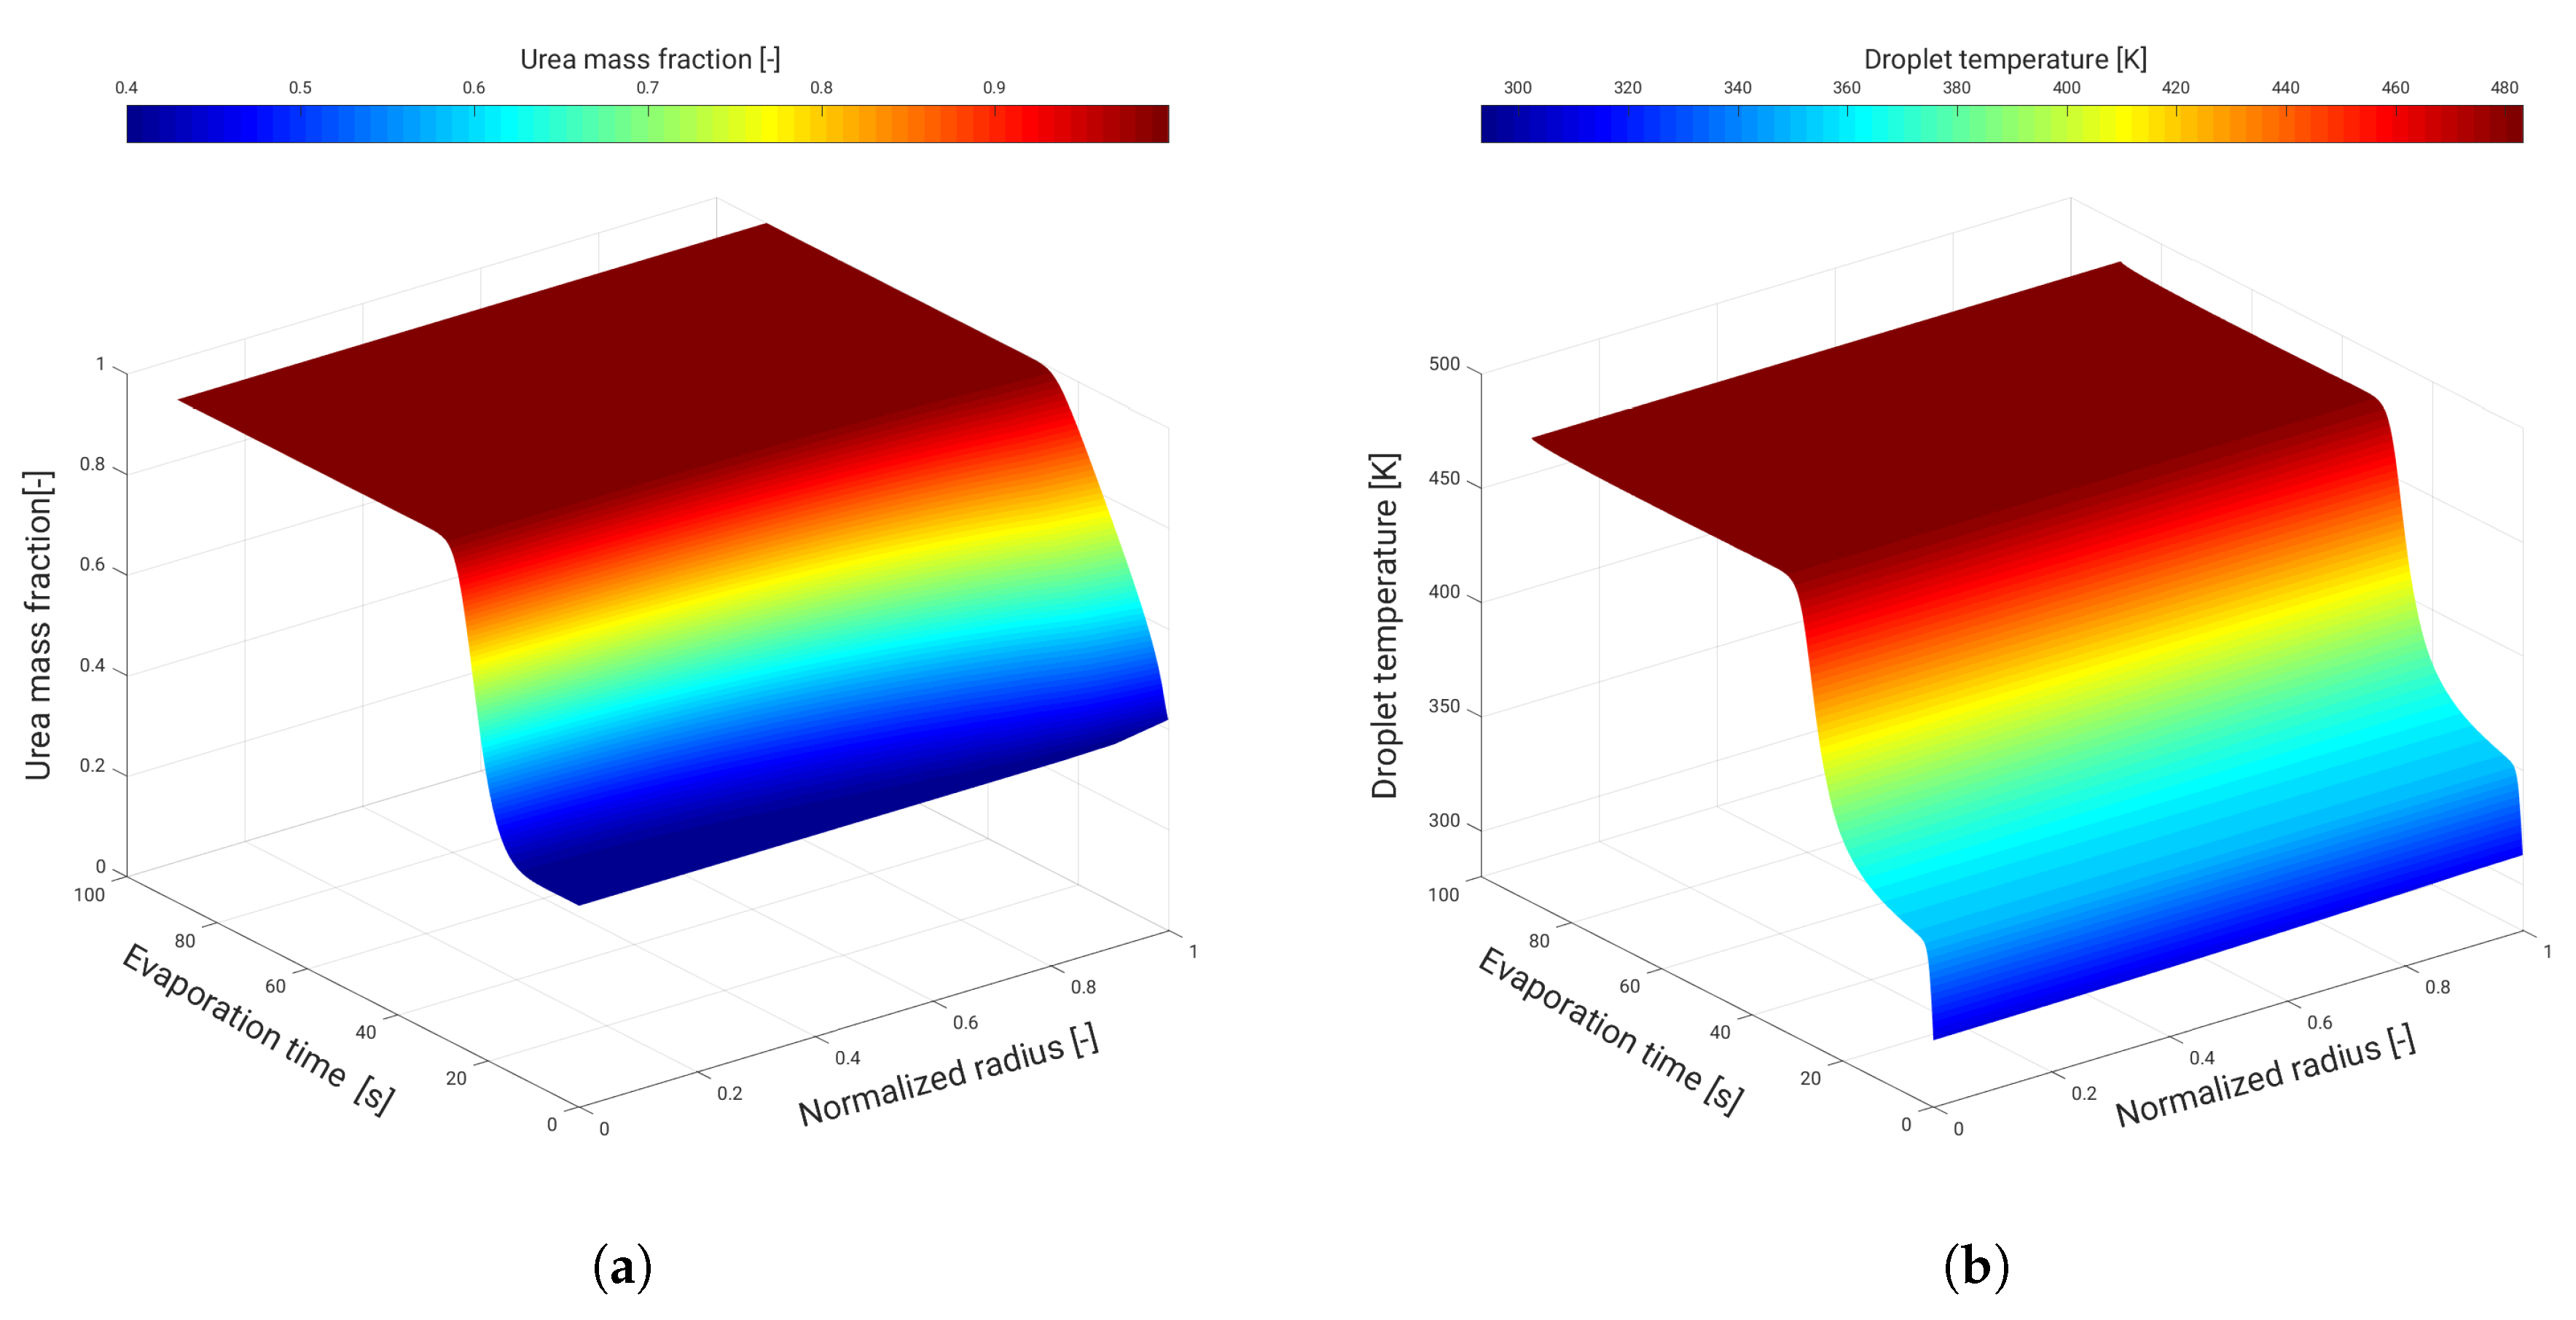
  • Two evaporation regimes of urea have been observed as usual, while four stages for the thermal droplet evolution and three for the urea mass fraction inside the droplet have been pointed out.
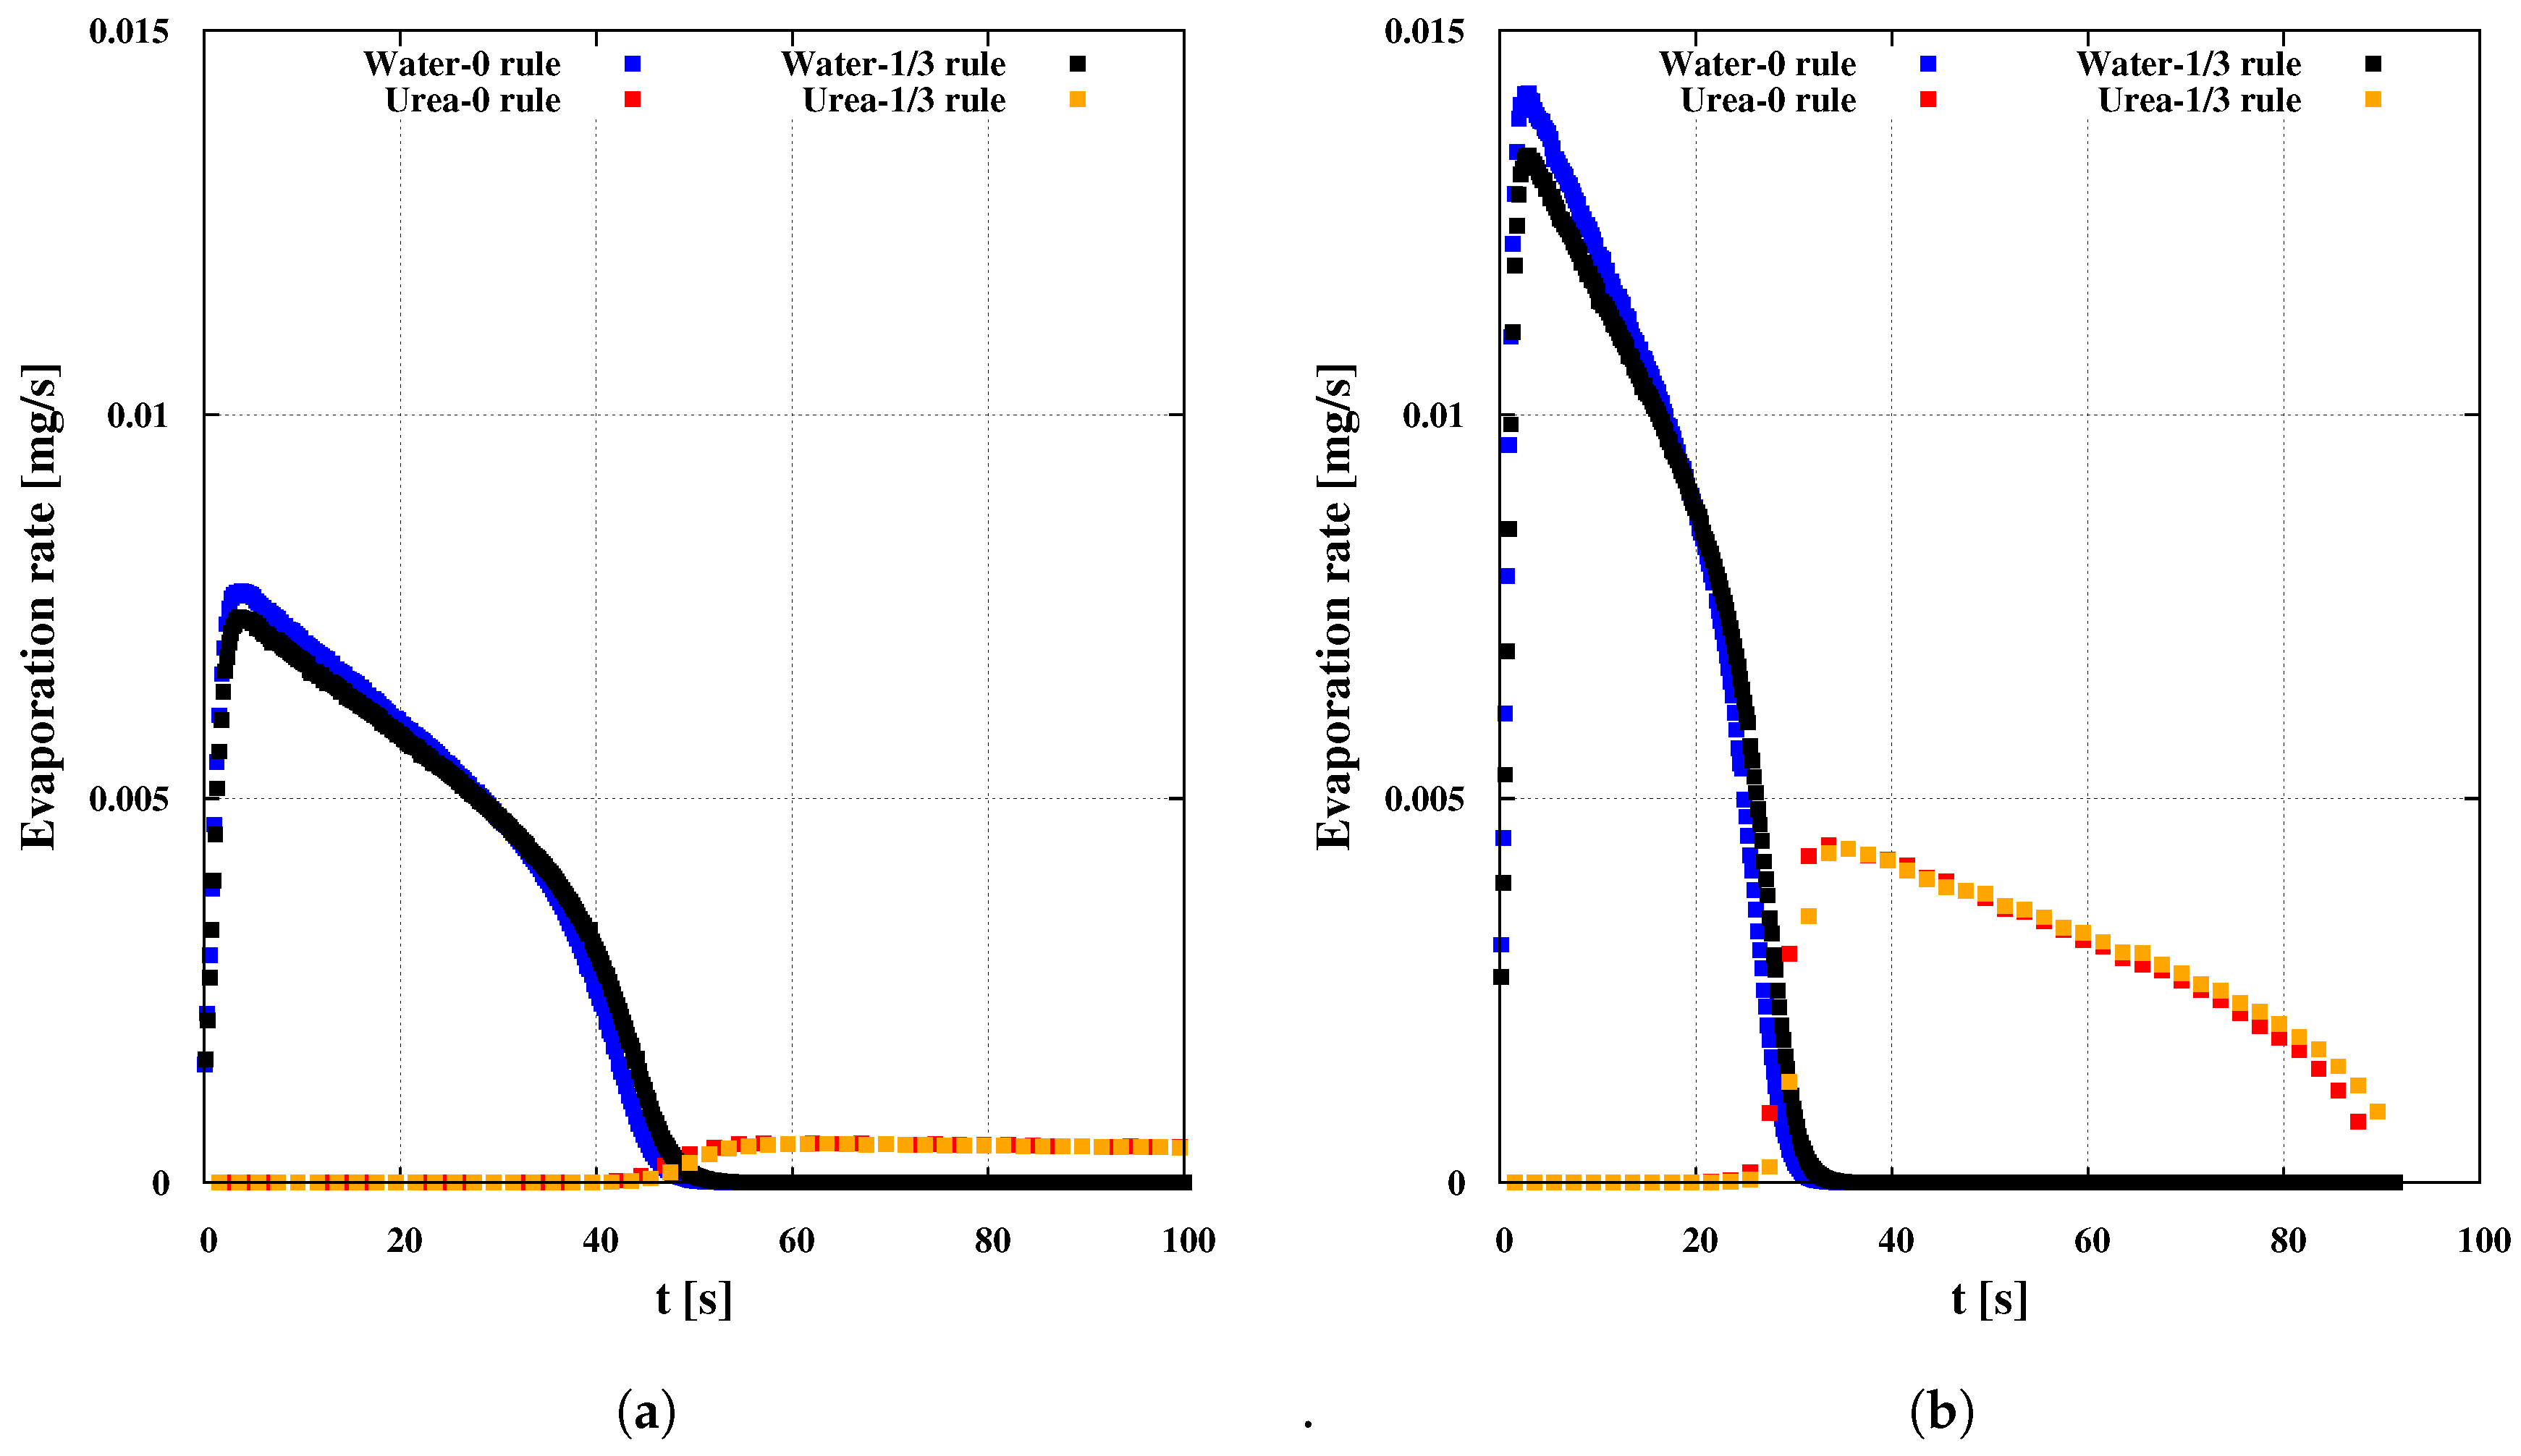
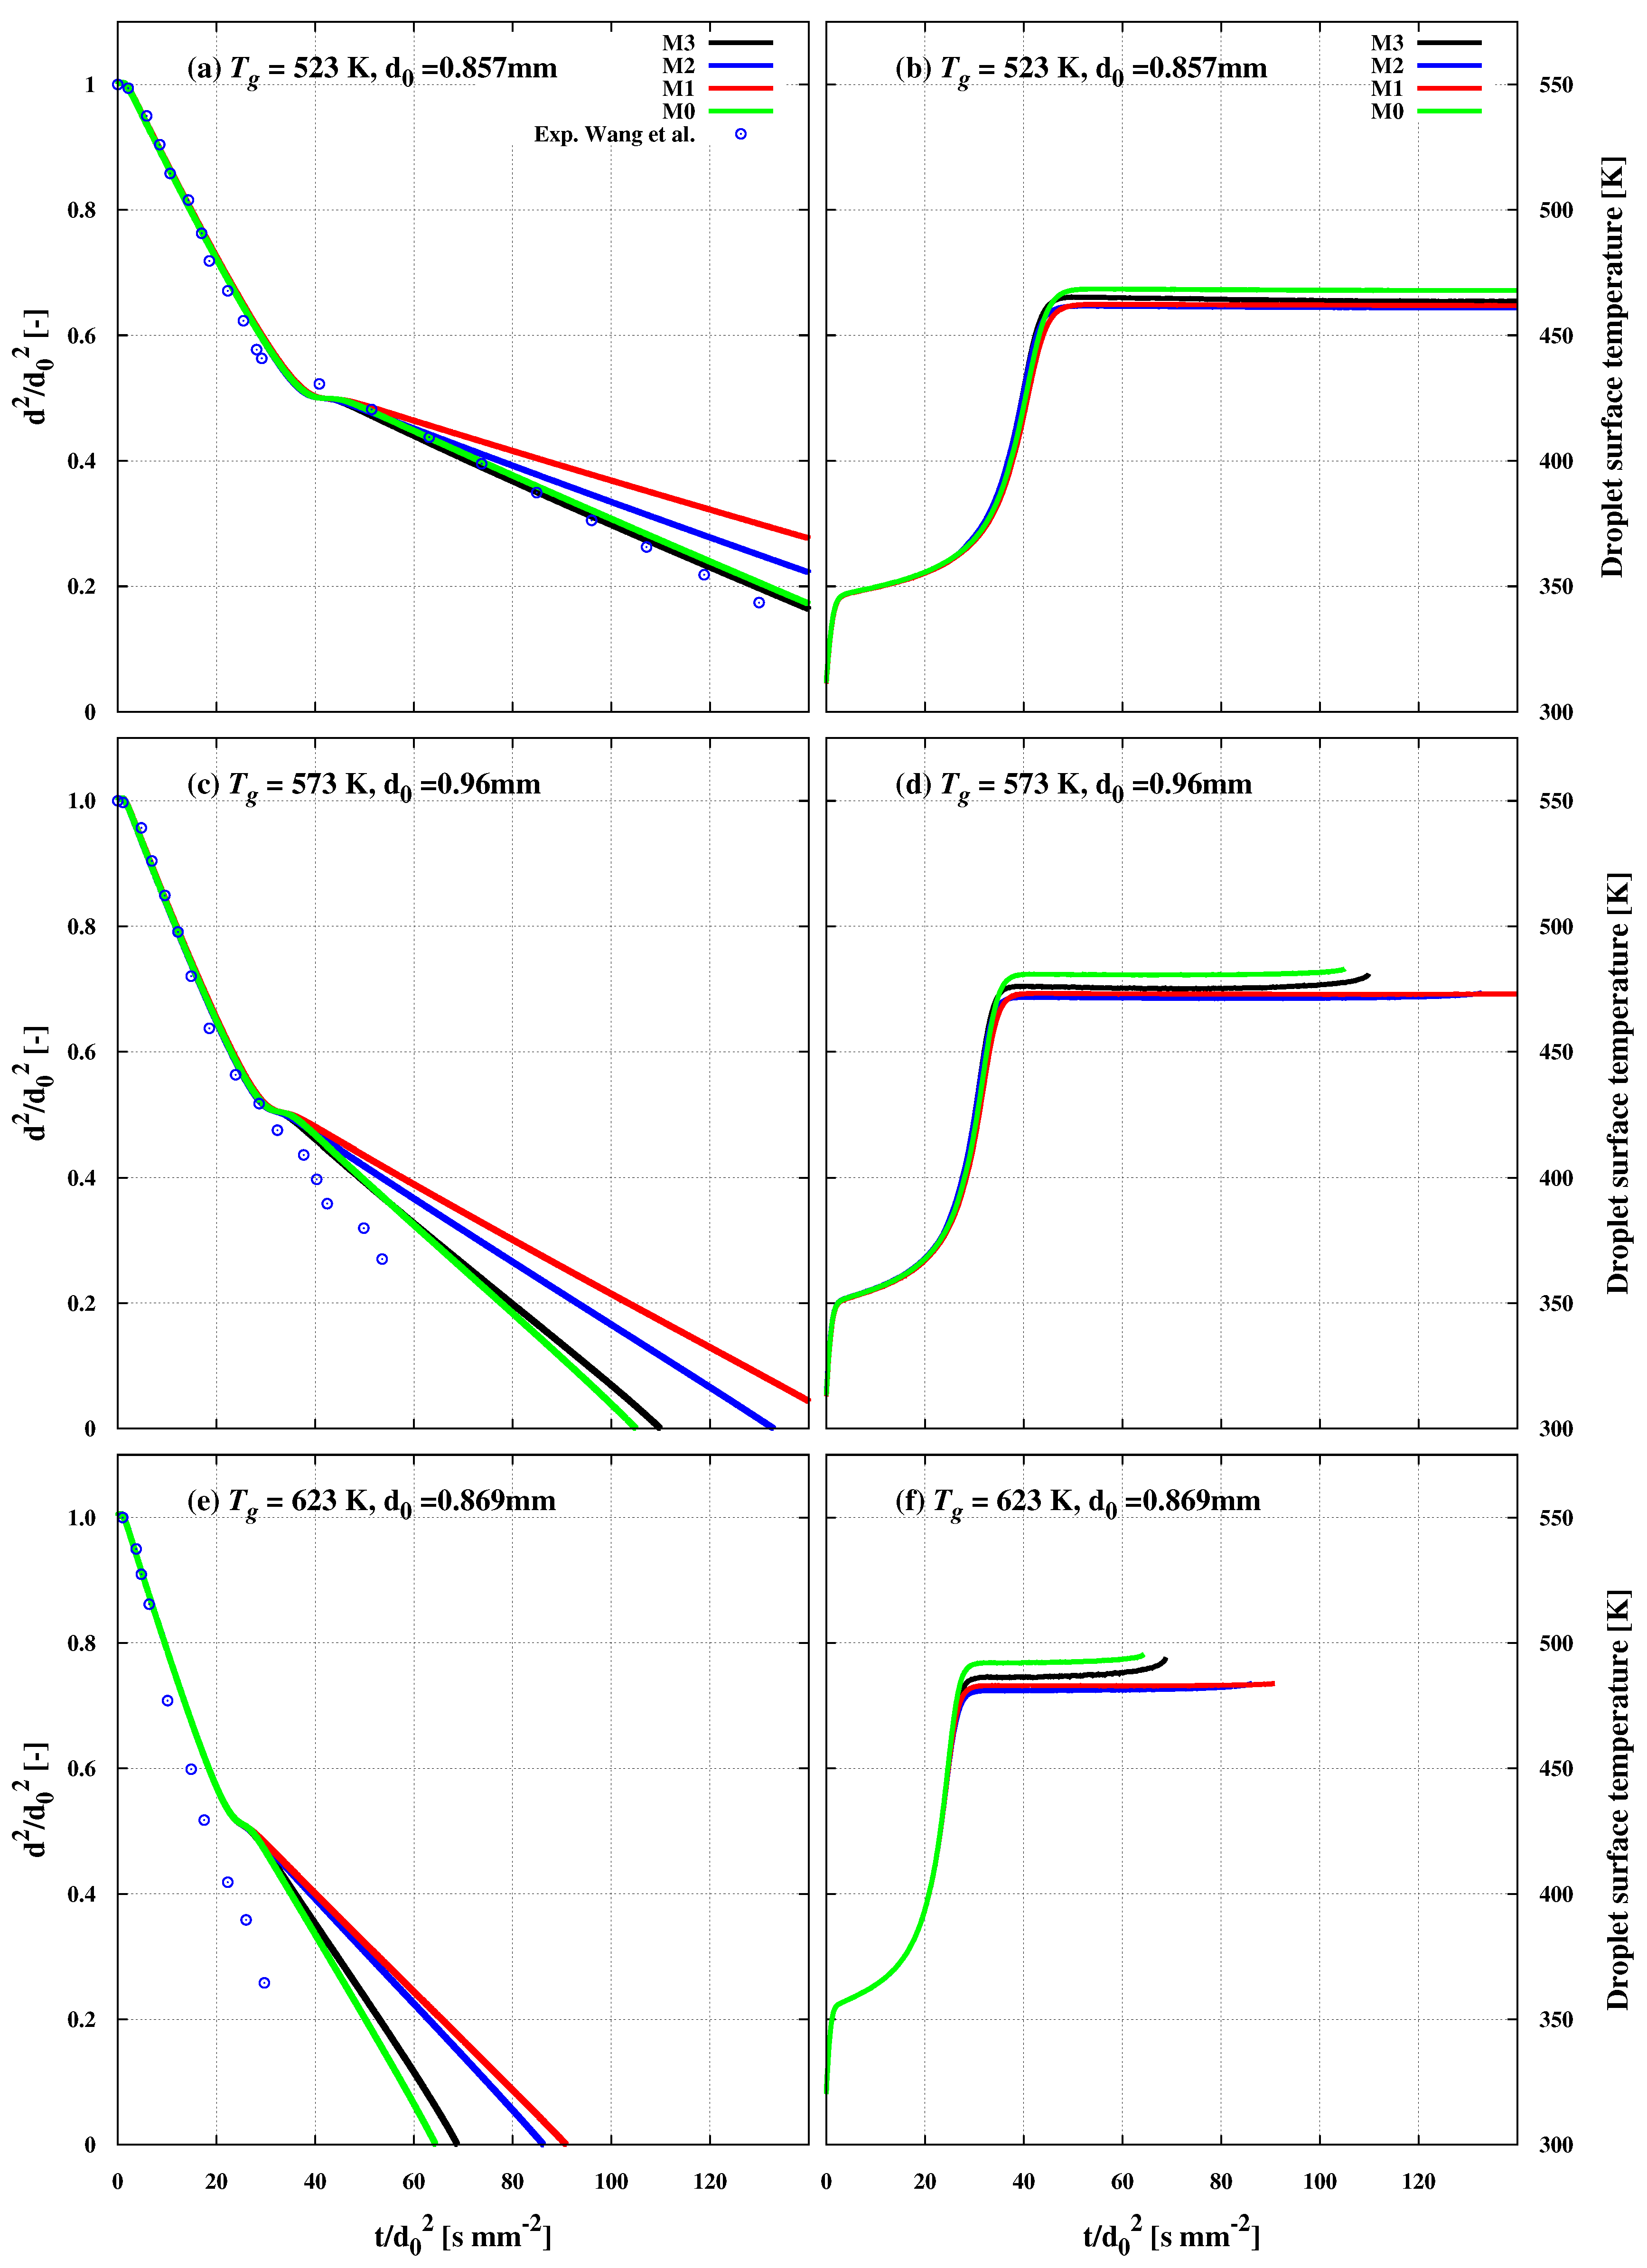
  • The mass transfer rate for water is only influenced by the gas phase temperature, but not by the scenario mechanisms of thermal decomposition of urea. The urea mass transfer is significantly influenced by both ambient temperatures and reaction mechanisms. The total converted mass of NH3 and HNCO is comparable in the mechanisms implying gas reaction, “M2” and “M3”, while a noticeable delay in the case “M2” owing to lower urea evaporation rate is initially observed. The conversions are considerably small for low gas phase temperature. In particular, at higher temperature, the simulated results with “M3”, which includes the scenario “M0” for evaporation (see Table 7) compared well against experiments.
  • The impact of material properties evaluation has been highlighted: the “1/3” film rule provides acceptable results compared to the zero-film rule, even though the difference in overall prediction is very small.
  • Under natural convection operating conditions, the suitable model should include the effect of gravity that has been found to be significant.
  • The model set “M3” together with the “1/3” film rule and the gravity effect emerges as the best scenario for thermal decomposition below 600 K.
    Above this value, some deviations to experiments have been observed due probably to the radiation which can be significant. This effect has not been considered in the heat transfer description in this work.
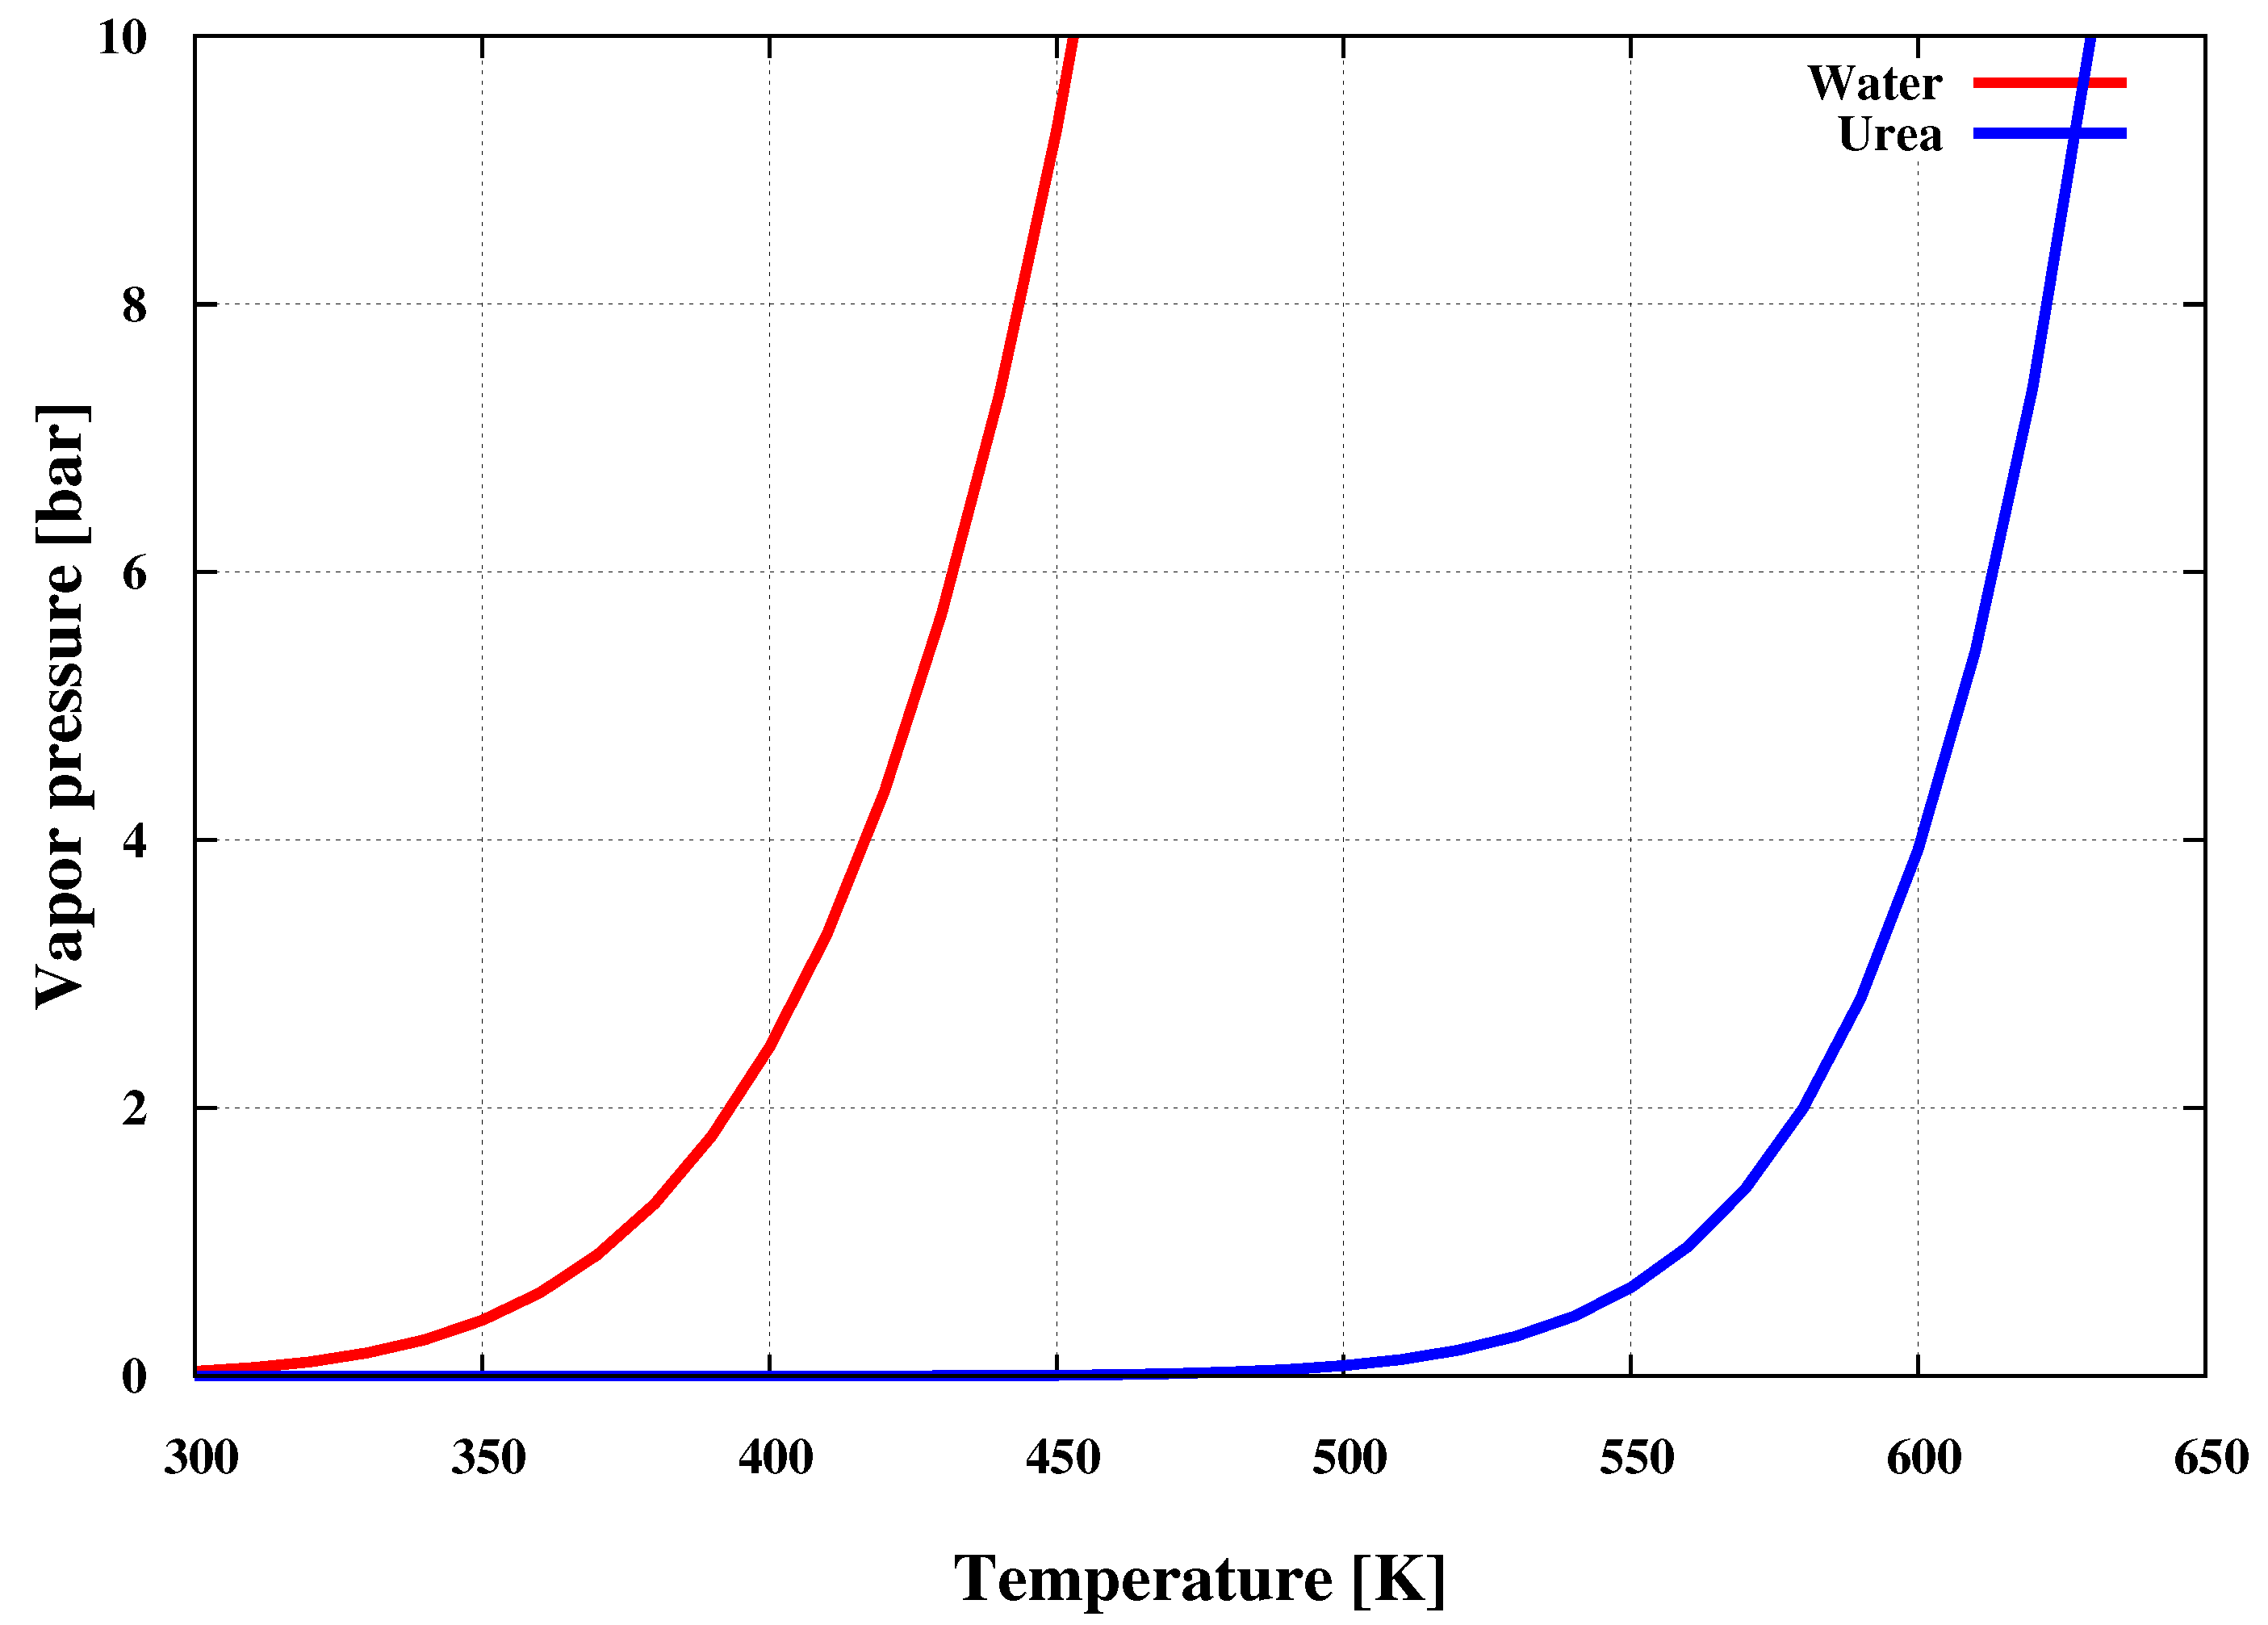
At low gas temperature, crystallization or solidification of urea can be observed due to its higher sublimation temperature. However, in SCR context, urea particle solidification should be avoided as it blocks the SCR circuit. In the context of numerical simulation, it is therefore of great interest to include the formation of solid particles together with deposition processes in a complete modeling. This requires extra effort that is not addressed here. This is left for future work.

Acknowledgments

The authors gratefully acknowledge the research funding from the German Research Council (DFG) in the framework of Collaborative Research Project (SFB) TRR-150 “Turbulent, chemically reactive, multi-phase flows near walls” and support by the German Research Foundation and the Open Access Publishing Fund of Technische Universität Darmstadt.

Author Contributions

For this research, Kaushal Nishad and Amsini Sadiki conceived and designed the numerical setup. Kaushal Nishad performed the numerical simulations, processed and exploited the data. Together with Amsini Sadiki, they analyzed, discussed and interpreted the numerical results. Kaushal Nishad wrote the paper, while Amsini Sadiki further improved the manuscript. Amsini Sadiki and Johannes Janicka contributed by providing materials and computing resources. All authors have read and approved the final manuscript.

Conflicts of Interest

The authors declare no conflict of interest.

Nomenclature

m ˙ evaporation rate, kg/s
A r film rule
B M Spalding mass transfer number
B T Spalding heat transfer number
C p heat capacity, J/kg K
ddroplet diameter, m
D l liquid diffusion coefficient, m 2 /s
D i , g binary diffusion coefficient, m 2 /s
ggravitational acceleration, m/s 2
G r Grashof number
henthalpy, J/kg
h e v a p Enthalpy of evaporation, J/mol
Mmolecular weight, kg/mol
N u Nusselt number
ppressure, Pa
P r Prandtl number
rdroplet radial coordinate, m
R e droplets Reynolds number
S c Schmidt number
S h Sherwood number
tphysical time, s
T c critical temperature, K
T d droplet temperature, K
T r reduced temperature
u r e l relative velocity of droplet, m/s
v l liquid velocity inside droplet, m/s
Xmole fraction
Yspecies mass fraction

Greek Symbols

λ thermal conductivity J/mK
μ dynamics viscosity kg/ms
Ω dimensionless diffusion collision integral
ρ density, kg/m 3
σ characteristics length of molecule, A
v atomic diffusion volume, m 3

Subscripts

carrier phase far field
ddroplet
ggas phase
ispecies
lliquid phase
sdroplet surface

References

  1. Nishad, K.; Sadiki, A.; Janicka, J. Numerical modeling of adBlue droplet evaporation in the context of SCR-DeNOx. In Proceedings of the 18th Annual Conference on Liquid Atomization and Spray Systems (ILASS) Asia, Chennai, India, 6–9 November 2016. [Google Scholar]
  2. Ström, H.; Lundström, A.; Andersson, B. Choice of urea-spray models in CFD simulations of urea-SCR systems. Chem. Eng. J. 2009, 150, 69–82. [Google Scholar] [CrossRef]
  3. Guan, B.; Zhab, R.; Lin, H.; Huang, Z. Review of state-of-the-art technologies of selective catalytic reduction of NOx from diesel engine exhaust. Appl. Therm. Eng. 2014, 66, 395–414. [Google Scholar] [CrossRef]
  4. Faltsi, R.; Mutyal, J. Confidence in modeling SCR aftertreatment systems. In Automotive Simulation World Congress; Ansys: Canonsburg, PA, USA, 2012. [Google Scholar]
  5. Birkhold, F.; Meingast, U.; Wassermann, P.; Deutschmann, O. Modeling and simulation of the injection of urea–water-solution for automotive SCR DeNOx-systems. Appl. Catal. B-Environ. 2007, 70, 119–127. [Google Scholar] [CrossRef]
  6. Birkhold, F.; Meingast, U.; Wassermann, P.; Deutschmann, O. Analysis of the Injection of Urea-Water-Solution for automotive SCR DeNOx-systems: Modeling of two-phase flow and spray/wall-interaction. SAE Int. 2006. [Google Scholar] [CrossRef]
  7. Ebrahimian, V.; Nicolle, A.; Chawki, H. Detailed modeling of the evaporation and thermal decomposition of urea–water solution in SCR systems. AIChE J. 2012, 58, 1998–2009. [Google Scholar] [CrossRef]
  8. Ebrahimian, V. Development of Multi-Component Evaporation Models and 3D Modeling of NOx-SCR Reduction System. Ph.D. Thesis, Institut National Polytechnique de Toulouse (INP Toulouse), Toulouse, France, 2011. [Google Scholar]
  9. Abu-Ramadan, E.; Saha, K.; Li, X. Modeling the depleting mechanism of urea–water-solution droplet for automotive selective catalytic reduction systems. AIChE J. 2011, 57, 3210–3225. [Google Scholar] [CrossRef]
  10. Zanoelo, E.F. A lumped model for thermal decomposition of urea. Uncertainties analysis and selective non-catalytic reduction of NO. Chem. Eng. Sci. 2009, 64, 1075–1084. [Google Scholar] [CrossRef]
  11. Löfgren, N. Air Assisted Urea Spray Modeling. Master’s Thesis, Department of Chemical and Biological Engineering, Chalmers University of Technology, Göteborg, Sweden, 2013. [Google Scholar]
  12. Ström, H.; Sasic, S.; Andersson, B. Effects of the turbulent-to-laminar transition in monolithic reactors for automotive pollution control. Ind. Eng. Chem. Res. 2011, 50, 3194–3205. [Google Scholar] [CrossRef]
  13. Hua, L.; Zhao, Y.; Hu, J.; Tao, T.; Shuai, S. Comparison between air-assisted and airless urea spray for diesel SCR system by PDA and CFD. SAE Int. 2012. [Google Scholar] [CrossRef]
  14. Musa, S.N.A.; Saito, M.; Furuhata, T.; Arai, M. Evaporation characteristics of a single aqueous urea solution droplet. In Proceedings of the 10th International Conference on Liquid Atomization and Spray Systems, Kyoto, Japan, 27 August–1 Septemer 2006; Available online: http://www.ilasseurope.org/ICLASS/ICLASS2006/DATA/PDF/C1-03-195.pdf (accessed on 16 January 2018).
  15. Gan, X.; Yao, D.; Wu, F.; Dai, J.; Wei, L.; Li, X. Modeling and simulation of urea–water-solution droplet evaporation and thermolysis processes for SCR systems. Chin. J. Chem. Eng. 2016, 24, 1065–1073. [Google Scholar] [CrossRef]
  16. Stein, M.; Bykov, V.; Maas, U. The Effect of evaporation models on urea decomposition from Urea-Water-Solution droplets in SCR conditions. J. Emiss. Control Sci. Technol. 2017, 3, 263–274. [Google Scholar] [CrossRef]
  17. Samimi Abianeh, O.; Chen, C.P. A discrete multicomponent fuel evaporation model with liquid turbulence effects. Int. J. Heat Mass Transf. 2012, 55, 6897–6907. [Google Scholar] [CrossRef]
  18. Sazhin, S.S. Advanced models of fuel droplet heating and evaporation. Prog. Energy Combust. Sci. 2006, 32, 162–214. [Google Scholar] [CrossRef]
  19. Sazhin, S.S.; Elwardany, E.A.; Heikal, M.R. New approaches to the modelling of multi-component fuel droplet heating and evaporation. J. Phys. Conf. Ser. 2015. [Google Scholar] [CrossRef]
  20. Renksizbulut, M.; Bussmann, M. Multicomponent droplet evaporation at intermediate Reynolds numbers. Int. J. Heat Mass Trans. 1993, 36, 2827–2835. [Google Scholar] [CrossRef]
  21. Wilke, C.R.; Lee, C.Y. Estimation of diffusion coefficients for gases and vapors. Ind. Eng. Chem. 1955, 47, 1253–1257. [Google Scholar] [CrossRef]
  22. Abramzon, B.; Sirignano, W.A. Droplet vaporization model for spray combustion calculations. Int. J. Heat Mass Trans. 1989, 32, 1605–1618. [Google Scholar] [CrossRef]
  23. Torres, D.J.; O’Rourke, P.J.; Amsden, A.A. Efficient multi-component fuel algorithm. Combust. Theory Model. 2003, 7, 67–86. [Google Scholar] [CrossRef]
  24. Wang, T.J.; Baek, S.W.; Lee, S.Y.; Kang, D.H.; Yeo, G.K. Experimental investigation of Urea-Water-Solution droplet for SCR applications. AIChE J. 2009, 55, 3267–3276. [Google Scholar] [CrossRef]
  25. Wei, L.; Youtong, Z.; Asif, M. Investigation on UWS evaporation for vehicle SCR applications. AIChE J. 2016, 62, 1547–5905. [Google Scholar] [CrossRef]
  26. Mikhil, S.; Anand, T.N.C.; Bakshi, S. Experimental studies on single droplet evaporation of urea water solution (UWS) at elevated temperatures. In Proceedings of the 27th Annual Conference on Liquid Atomization and Spray Systems (ILASS) Europe, Brighton, UK, 4–7 September 2016; Available online: http://www.ilasseurope.org/ICLASS/ICLASS2006/top.html (accessed on 16 January 2018).
  27. Amsden, A.A.; O’Rourke, P.J.; Butler, T.D. KIVA-II: A Computer Program for Chemically Reactive Flows with Sprays; No. LA-11560-MS; Los Alamos National Lab.: Los Alamos, MX, USA, 1989.
  28. Chrigui, M.; Sadiki, A.; Ahmadi, G. Study of interaction in spray between evaporating droplets and turbulence using second order turbulence RANS modelling and a Lagrangian approach. Prog. Comput. Fluid Dyn. 2004, 4, 162–174. [Google Scholar] [CrossRef]
  29. Hirschfelder, J.O.; Curtiss, C.F.; Bird, R.B. Molecular Theory of Gases and Liquids; Wiley: New York, NY, USA; Chapman & Hall: London, UK, 1954; ISBN 978-0471400653. [Google Scholar]
  30. Marrero, T.R.; Mason, E.A. Correlation and prediction of gaseous diffusion coefficients. AIChE J. 1973, 19, 498–503. [Google Scholar] [CrossRef]
  31. Yaws, C.L. Chemical Properties Handbook: Physical, Thermodynamics, Environmental Transport, Safety & Health Related Properties for Organic & Inorganic Chemical; McGraw-Hill Education: New York, NY, USA, 1999; ISBN 978-1606235270. [Google Scholar]
  32. Bernhard, A.M.; Czekaj, I.; Elsener, M.; Wokaun, A.; Kröcher, O. Evaporation of urea at atmospheric pressure. J. Phys. Chem. A 2011, 115, 2581–2589. [Google Scholar] [CrossRef] [PubMed]
  33. Neufeld, P.D.; Janzen, A.R.; Aziz, R.A. Empirical equations to calculate 16 of the transport collision integrals Ω(l,s)* for the lennard-jones (12-6) potential. J. Chem. Phys. 1972, 57, 1100–1102. [Google Scholar] [CrossRef]
  34. Fuller, E.N.; Ensley, K.; Giddings, J.C. Diffusion of halogenated hydrocarbons in helium. The effect of structure on collision cross sections. J. Phys. Chem. 1969, 73, 3679–3685. [Google Scholar] [CrossRef]
  35. Habchi, C.; Ebrahimian, V. Gravitational Effects on Multi-component Droplet Evaporation. Microgravity Sci. Technol. 2012, 24, 229–235. [Google Scholar] [CrossRef]
  36. Wilke, C.R. A viscosity equation for gas mixtures. J. Chem. Phys. 1950, 18, 517–519. [Google Scholar] [CrossRef]
  37. Koebel, M.; Strutz, E.O. Thermal and hydrolytic decomposition of urea for automative decomposition selective catalytic reduction systems: Thermochemical and practical aspects. Ind. Eng. Chem. Res. 2003, 10, 2093–2100. [Google Scholar] [CrossRef]
Figure 1. Diffusion coefficients of water and urea vapor in N2 used in the present work marked as C1, C2, and C3 individually for both water and urea.
Energies 11 00222 g001
Figure 2. The vapor pressure of urea as reported in [32] and water.
Energies 11 00222 g002
Figure 3. Influence of gravity on evaporation dynamics of (a) pure water droplet at T g = 573 K, and (b) adBlue droplet (60% water + 40% urea) at T g = 423 K.
Energies 11 00222 g003
Figure 4. Evaporation behavior of adBlue droplet with corrected and un-corrected initial mass fraction at 423 K ambient temperature. (a) evaporation rate (experiment from [24]); (b) droplet surface temperature.
Energies 11 00222 g004
Figure 5. Evolution of (a) urea mass fraction, and (b) droplet temperature for T g = 573 K.
Energies 11 00222 g005
Figure 6. Evaporation dynamics of adBlue droplet (d0 = 0.87 mm) for the four diffusion coefficient correlations at ambient gas temperature of 473 K. (a) evaporation rate (experiment from [24]); (b) droplet surface temperature.
Energies 11 00222 g006
Figure 7. Evaporation rate (left, experiment from [24]) and droplet surface temperature (right) for the four diffusion coefficient correlations at ambient gas temperatures of 523 K, 573 K and 623 K, respectively.
Energies 11 00222 g007aEnergies 11 00222 g007b
Figure 8. Evaporation dynamics of adBlue droplet under various gas temperatures for only evaporation mechanism case “M0” with combined diffusion coefficient correlation “C31”. (a) evaporation rate (experiment from [24]); (b) droplet surface temperature.
Energies 11 00222 g008
Figure 9. Evaporation rate of water and urea with “0” and “1/3” rules. (a) T g = 473 K; (b) T g = 573 K.
Energies 11 00222 g009
Figure 10. Evaporation dynamics of adBlue droplet (d0 = 0.87 mm) for four mechanisms with combined diffusion coefficient correlations (C31) at ambient gas temperature of 473 K. (a) evaporation rate (experiment from [24]); (b) droplet surface temperature.
Energies 11 00222 g010
Figure 11. Evaporation rate (left, experiment from [24]) and droplet surface temperature (right) for four mechanisms with combined diffusion coefficient correlation (C31) at ambient gas temperatures of 523 K, 573 K, and 623 K, respectively.
Energies 11 00222 g011
Figure 12. (a) Evaporation rate, and (b) conversion rate of HNCO and NH3 at ambient temperature of 473 K and 573 K.
Energies 11 00222 g012
Figure 13. Influence of “1/3” and “0” film rules on evaporation dynamics for mechanism; (a) evaporation rate—M0, and (b) evaporation rate—M3.
Energies 11 00222 g013
Table 1. Liquid density-(g/mL) [31].
ρ = A B 1 T T c n AB T c n
Urea0.569820.337705.000.28571
Water0.347100.274647.130.28571
Table 2. Vapor pressure-(Pa).
Urea [32] ln ( p v a p ) = 32.472 − 11,755.0/T
Water p v a p = [ 7.76 + 1.46 ( 1 T r ) 0.5 2.78 ( 1 T r ) 2 1.23 ( 1 T r ) 5 ] ( 1 T r ) / T r
Table 3. Latent heat-(kJ/mol).
h e v a p = A + B T + C T 2 ABC
Urea [32]87.4 (M0,M3), 185.1 (M1,M2)00
Water50,600.0 9.298 × 10 1 6.519 × 10 2
Table 4. Thermal conductivity-(W/mK) [31].
λ = A + B T + C T 2 ABC
Urea0.2888 1.1326 × 10 5 4.5537 × 10 7
Water 0.2758 4.6120 × 10 3 5.5391 × 10 6
Table 5. Heat capacity-(J/mol K) [31].
C p = A + B T + C T 2 + D T 3 ABCD
Urea965.507−5.0993 1.0028 × 10 2 6.3799 × 10 6
Water92.053 3.9953 × 10 2 2.1103 × 10 4 5.3469 × 10 7
Table 6. Diffusion correlation D ig used for water and urea species.
Correlation/ D ig C11C22C33C31
WaterWilke et al. [21]Marrero et al. [30]Fuller et al. [34]Fuller et al. [34]
UreaWilke et al. [21]Marrero et al. [30]Fuller et al. [34]Wilke et al. [21]
Table 7. Scenario mechanisms during evaporation and decomposition.
Case/MechanismLatent HeatUrea DecompositionGas Reaction
M0✔( h e v a p = 87.4 kJ/mol)--
M1✔( h e v a p = 185.5 kJ/mol)--
M2✔( h e v a p = 185.5 kJ/mol)✔( h d e c = 0.0 kJ/mol)
M3✔( h e v a p = 87.4 kJ/mol)✔( h d e c = 98.1 kJ/mol)

