Analysis of Low Temperature Preheating Effect Based on Battery Temperature-Rise Model

1
College of Electrical and Electronics Engineering, Harbin University of Science and Technology, Harbin 150000, China
2
State Key Laboratory of Automotive Safety and Energy, Tsinghua University, Beijing 100084, China
*
Author to whom correspondence should be addressed.
Energies 2017, 10(8), 1121; https://doi.org/10.3390/en10081121
Submission received: 13 May 2017
/
Revised: 22 June 2017
/
Accepted: 27 July 2017
/
Published: 1 August 2017
(This article belongs to the Special Issue Advanced Energy Storage Technologies and Their Applications (AESA))
Abstract
:It is difficult to predict the heating time and power consumption associated with the self-heating process of lithium-ion batteries at low temperatures. A temperature-rise model considering the dynamic changes in battery temperature and state of charge is thus proposed. When this model is combined with the ampere-hour integral method, the quantitative relationship among the discharge rate, heating time, and power consumption, during the constant-current discharge process in an internally self-heating battery, is realized. Results show that the temperature-rise model can accurately reflect actual changes in battery temperature. The results indicate that the discharge rate and the heating time present an exponential decreasing trend that is similar to the discharge rate and the power consumption. When a 2 C discharge rate is selected, the battery temperature can rise from −10 °C to 5 °C in 280 s. In this scenario, power consumption of the heating process does not exceed 15% of the rated capacity. As the discharge rate gradually reduced, the heating time and power consumption of the heating process increase slowly. When the discharge rate is 1 C, the heating time is more than 1080 s and the power consumption approaches 30% of the rated capacity. The effect of discharge rate on the heating time and power consumption during the heating process is significantly enhanced when it is less than 1 C.

1. Introduction
Lithium batteries have become the main source of power for electric vehicles because of the advantages they offer, such as reduced pollution, a long life cycle, high energy density, and good power performance [1]. However, the performance of lithium batteries at low temperatures is poor. When the temperature decreases, the ohmic, polarization, and total internal resistance of batteries increase [2]. For example, the ohmic resistance of a charging LiFePO4 battery at −5 °C is five times that at room temperature [3]. When the temperature is below −10 °C, there is a significant drop in battery capacity, as well as a loss in power [4]. Battery charging is also more difficult than discharging in this environment. In this case, if the battery is forced to charge, lithium deposits and dendrites will appear on its negative electrode, which cause an internal short circuit [5]. So far, it has been difficult to solve the low-temperature performance problem of lithium batteries through the use of innovative materials [6]. Therefore, it is often necessary to heat the battery to a suitable operating temperature before using the battery in low temperature conditions.
At present, methods for heating batteries in low temperature environments are divided primarily into external heating and internal heating. Wang Facheng et al. [7] used a heating wire to heat air at the inlet of an air duct of a battery box, and subsequently heat batteries through air convection. Hyun-Sik Song et al. [8] also achieved battery heating by way of air convection. The above heating method can make the battery temperature rise rapidly to the appropriate temperature and the battery performance is improved significantly at low temperatures. However, this method causes unnecessary energy loss in the heating process, and the energy utilization of techniques that heat by way of air convection is low. Zhang Chengning et al. [9] heat batteries using a wide-line metal film. Comparing with that it is almost not able to discharge prior to heating, the battery can subsequently release 50% of the stored electric energy after heating.
Liu Cunshan et al. [10] established a low-temperature heating model for power batteries, and compared the effect of a positive temperature coefficient (PTC) heater and an electrothermal film heater. The electrothermal film heating mode does not affect the heat dissipation of the battery and has insulating performance at some degree. However, the power batteries used in electric vehicles are composed of a plurality of cells, which are arranged closely together, in series and in parallel [11]. In the external heating mode, battery cells are not uniformly heated, which causes a rapid rise in local temperature. As a result, battery consistency deteriorates and the life of the battery pack is greatly shortened. In more severe cases, the deterioration in battery consistency causes failure of isolated cells, resulting in serious accidents. Compared to the external heating methods, the main advantage of internal heating is the use of heat generated by internal resistance in the charging/discharging process. The internal heating methods are characterized by high energy efficiency and can achieve uniform battery heating. Yan Ji et al. [12] simulated a battery pack equivalent to two groups of cells, which, at a certain frequency, are alternately charged and discharged for battery heating after DC/DC boost, ultimately getting the ideal temperature rise effect. The mutual pulse heating consumes little battery power and is free of convective heat transfer system. However, it appears that the current used in this process is too large. In addition, the charging voltage of the battery in the heating process may reach 4.5 V, which is significantly higher than the charging cut-off voltage and increases the possibility of the formation of lithium dendrites. Zhang Jianbo et al. [5] established a frequency domain model for a lithium-ion battery, which had a rated capacity of 3.1 A∙h, and proposed the use of sinusoidally alternating currents for internal heating. The battery can be heated from −20 °C to 5 °C within 15 min and the temperature distribution remains essentially uniform. However, the heating process is accompanied by large transient voltages. The maximum battery voltage recorded experimentally is 4.5 V. If an appropriate AC amplitude and frequency cannot be selected in practical applications, the battery may continue to be in a state of over-voltage, causing some damage. Zhao Xiaowei et al. [13] proposed the use of a large current pulse for heating a 3.2 V, 12 A∙h lithium-iron phosphate battery. The charge and discharge cut-off voltages were 2.1 V and 3.6 V respectively. The heating process comprised a total of 18 charge and discharge cycles. In the final realization, the battery temperature rises from −10 °C to 3 °C. Ruan Haijun et al. [14] heated batteries with a high-frequency alternating current, using a constant polarization voltage as a boundary condition. Ultimately, the battery temperature can be raised from −15 °C to 5.6 °C in 338 s. The constant polarization voltage is managed for battery heating to achieve a good tradeoff between short heating time and less damage to battery lifetime based on an electro-thermal coupled model. However, as the study only proved that there was no significant capacity decay in the battery after 30 repeated internal heating tests, the overall health of the battery, if the test is repeated more than 30 times, cannot be ascertained. Although pulsed heating can effectively heat batteries, alleviating the impact of low temperatures, larger charge pulse amplitudes result in stronger polarization of the anode surface, leading to the formation of lithium dendrites [15].
The main reason for the failure of lithium batteries is the generation of lithium dendrites during the charging process in low-temperature environments [16]. The lithium metal precipitates on the graphite anode surface at low temperatures or during charging at a high rate, and further reacts with the electrolyte. As a result, both available electrolyte and lithium ions are lost, and the battery volume changes, leading to poor contact between active substances and the current collector [17]. The embedding of both electrolyte and lithium ions accelerates the peeling of graphite particles. The corrosion of both the collector and the adhesive reduces battery capacity [18], eventually causing permanent damage to the battery. Though the discharging capacity of lithium batteries decreases and the discharging platform voltage drops, discharging in low temperature conditions does not cause permanent damage to the battery.
On the basis of the foregoing, this study develops a method to internally preheat lithium-ion batteries at low temperatures by way of constant-current discharging. This indicates that the temperature generated by internal resistance during battery discharging is used to heat the battery in a low temperature environment. Besides, it is difficult to predict the heating time and power consumption associated with the self-heating process of lithium-ion batteries at low temperatures. A temperature-rise model considering the dynamic changes in both battery temperature and state of charge (SOC) is thus proposed. When this model is combined with the ampere-hour integral method, the quantitative relationship among the discharge rate, heating time, and power consumption, during the progress of constant-current discharging for internally self-heating battery, is realized. Further, the problem of predicting the heating time and power consumption of the self-heating at low temperature is solved in this paper.
2. The Temperature-Rise Model
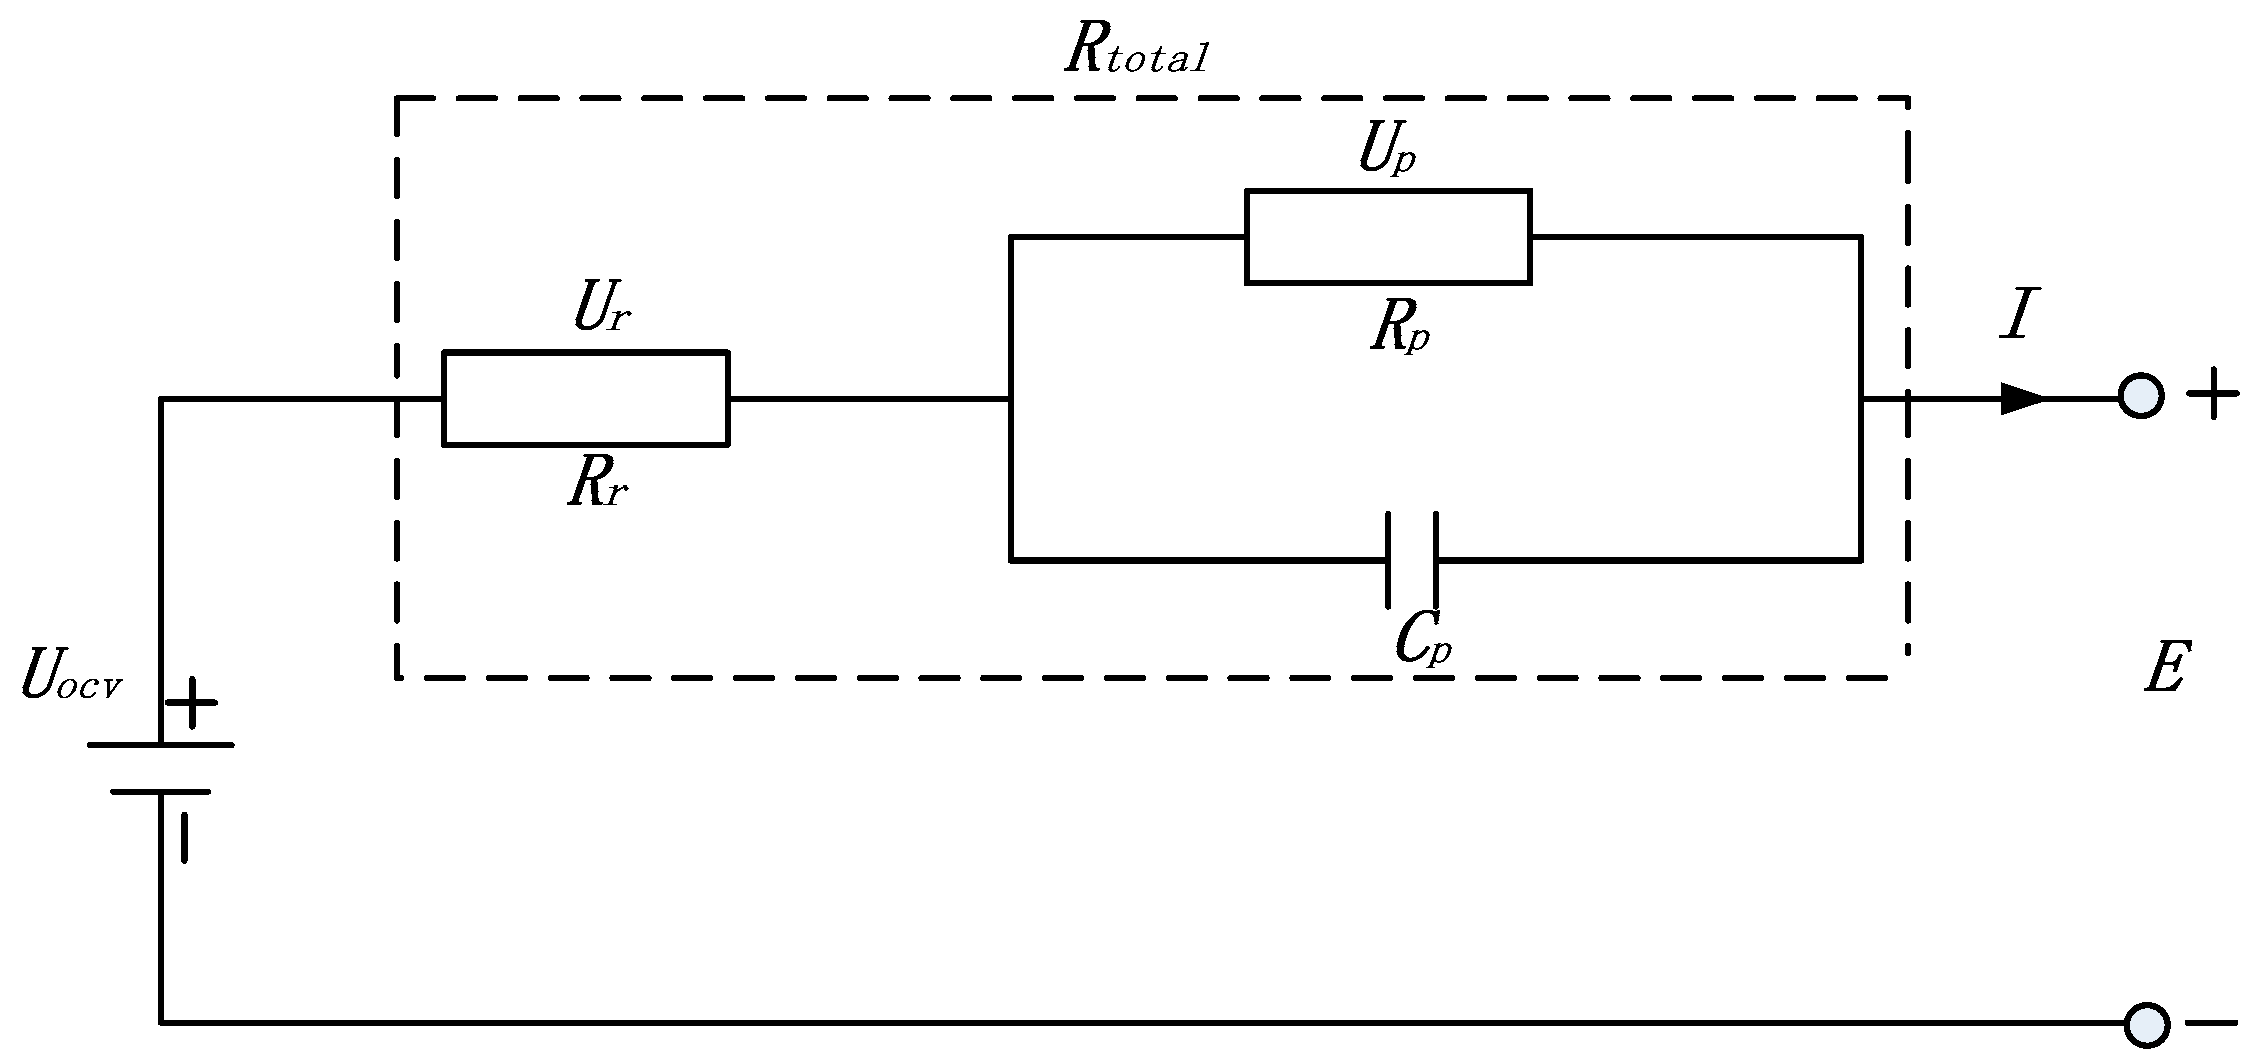
The Thevenin model is used to analyze the discharging process. As shown in Figure 1, represents the ohmic resistance, is the voltage on , and represents the polarization capacitance and polarization resistance respectively, is the voltage on and , is the open circuit voltage, E is the terminal voltage, is the discharging current. In this paper, is equivalent to the combination of , and , which is annotated as in the temperature-rise model.
Heat generated by a battery can be divided into irreversible heat and reversible heat. The irreversible heat includes Joule heat and concentration polarization heat. The reversible heat, also known as reaction heat, refers to energy that is released or absorbed in the electrochemical reaction to maintain the energy balance of the reaction. Referring to [19], the simplified heat generation equation used in this paper can be expressed as (1):
where, is the operating current of the battery (positive for charge, negative for discharge), is the battery voltage, is the open circuit voltage, is the total heat generation power. is the irreversible heat generation power, which represents the sum of both the heat generated by ohmic resistance when current flows and the heat generated by concentration difference through material transfer in the battery. is the reversible entropic heat or reaction heat, which depends on the direction of current and the sign of the entropy coefficient. The entropy potential is greatly influenced by the state of charge (SOC) and varies with different chemical compositions [20]. The difference between the battery terminal voltage and the open circuit voltage results from the voltage generated by internal resistance when current flows [21]. Therefore, the irreversible heat can be expressed as Equation (2), where is the equivalent internal resistance of the battery.
Battery temperature is influenced by heat generation, heat conduction, and thermal diffusion [22]. In addition to internal heat production, the battery also distributes heat to the exterior when it works at a low temperatures. There are two main approaches for heat loss: convection and heat radiation. Thermal radiation is very small compared to thermal convection and is therefore ignored [23]. The heat dissipation can be expressed by (3):
where is the equivalent heat transfer coefficient, is the surface area of the battery, is the battery temperature, and is the ambient temperature. Therefore, the heat balance equation can be obtained as the following equation:
where is the mass of battery and is the specific heat capacity. From Equation (4) we can see that the total heat generated by the battery is influenced by current, resistance, entropy potential, the equivalent heat transfer coefficient and battery temperature. One can yield that a greater current and resistance lead to greater heat generation. Conversely, a greater equivalent transfer coefficient and battery temperature results in more heat dissipation. As a result, the total heat generated is reduced. The battery temperature-rise model developed in this paper will take into account changes in the resistance and entropy coefficient during the process of battery heating so as to guarantee accuracy.
According to Equation (4), we can get the linear differential equation relating to battery temperature in Equation (5).
Equation (5) can be rewritten in discrete-time. The relevant expression, shown in Equation (6), is deduced, using the Laplace transform as,
where, is the initial time and is the current time. Under periodic sampling conditions, , , and , Equation (6) can be rewritten as:
Upon further rearrangement, we can get Equation (8) as,
Equation (9) is obtained from Equation (8) by the inverse Laplace transform
3. Model Validation
3.1. Model Parameter Acquisition
The battery tested in this study was a commercial 18650 lithium-ion battery, which has a rated capacity of 2.6 A∙h. The cathode of the battery is LixNiCoAlO2, and the anode is graphite. The specifications are shown in Table 1.
The experimental set-up is shown in Figure 2. The temperature sensor is attached to the battery, and the side surface of the battery tested in this experiment is covered by an insulating film. The battery temperature data measured by the temperature sensor is sent to the computer via the battery temperature measuring device. And the computer controls the battery to charge and discharge via the Arbin battery tester. Detailed parameters of the battery tester and temperature chamber are shown in Table 2.
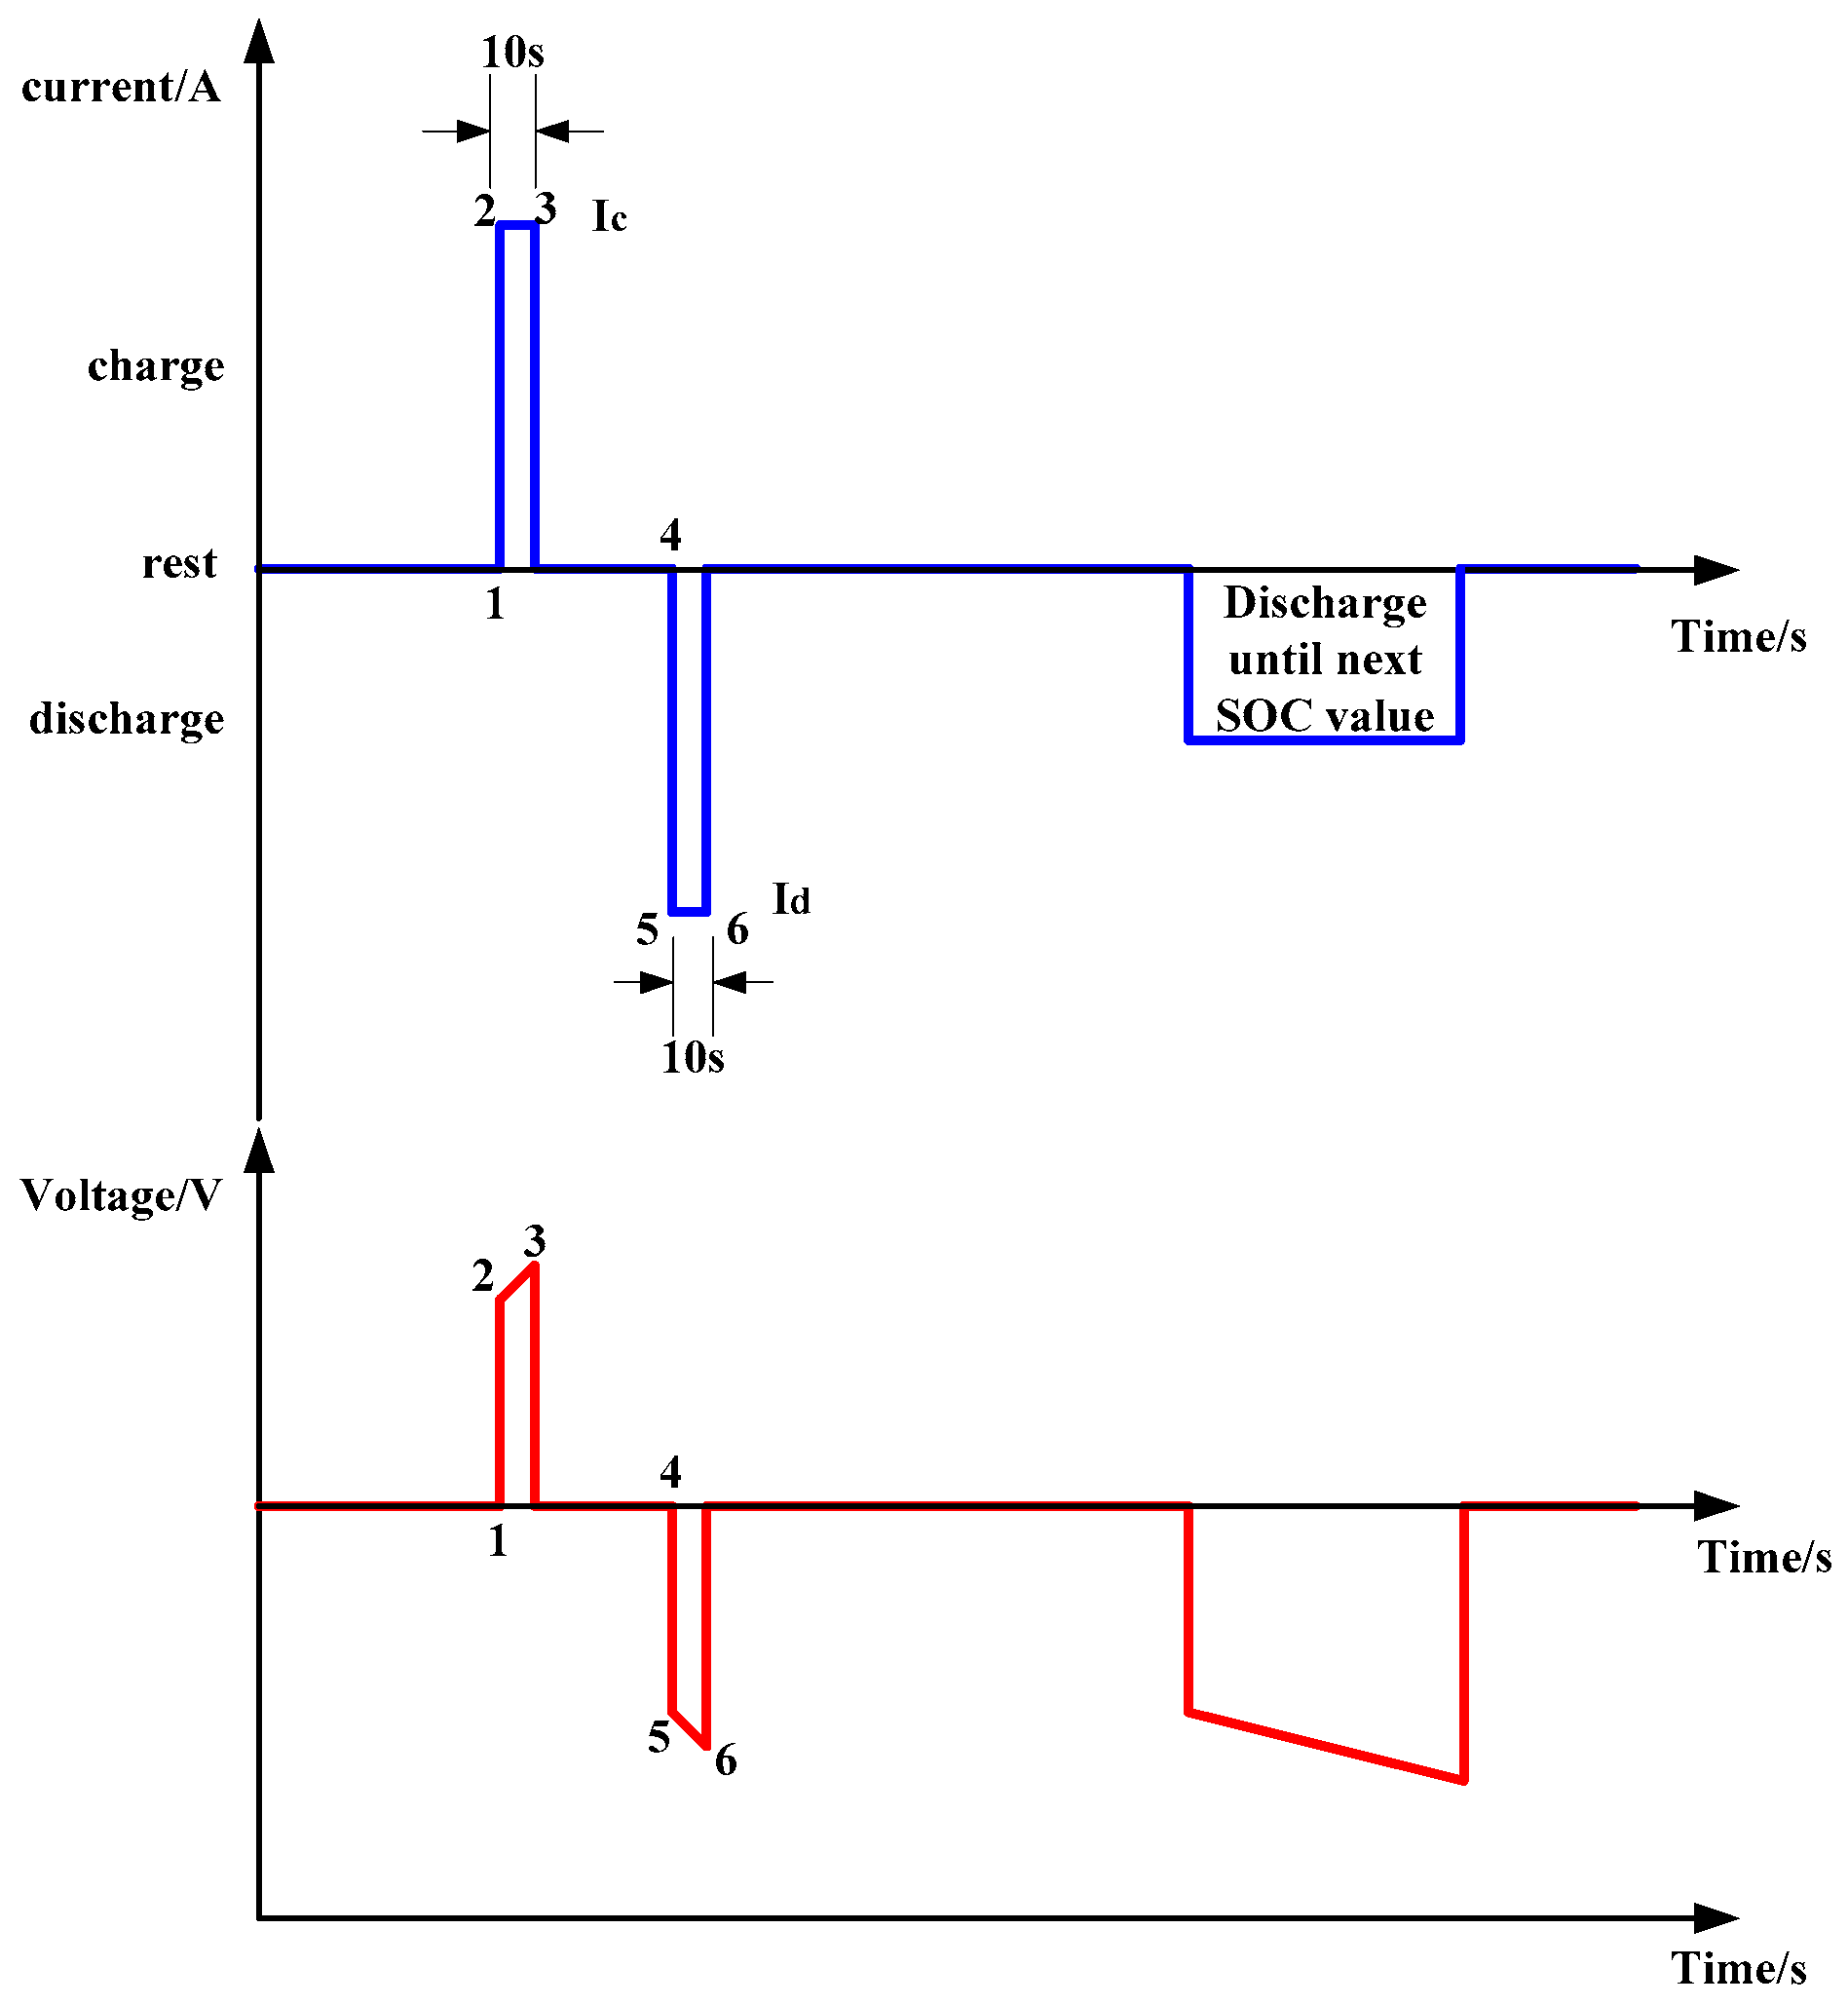
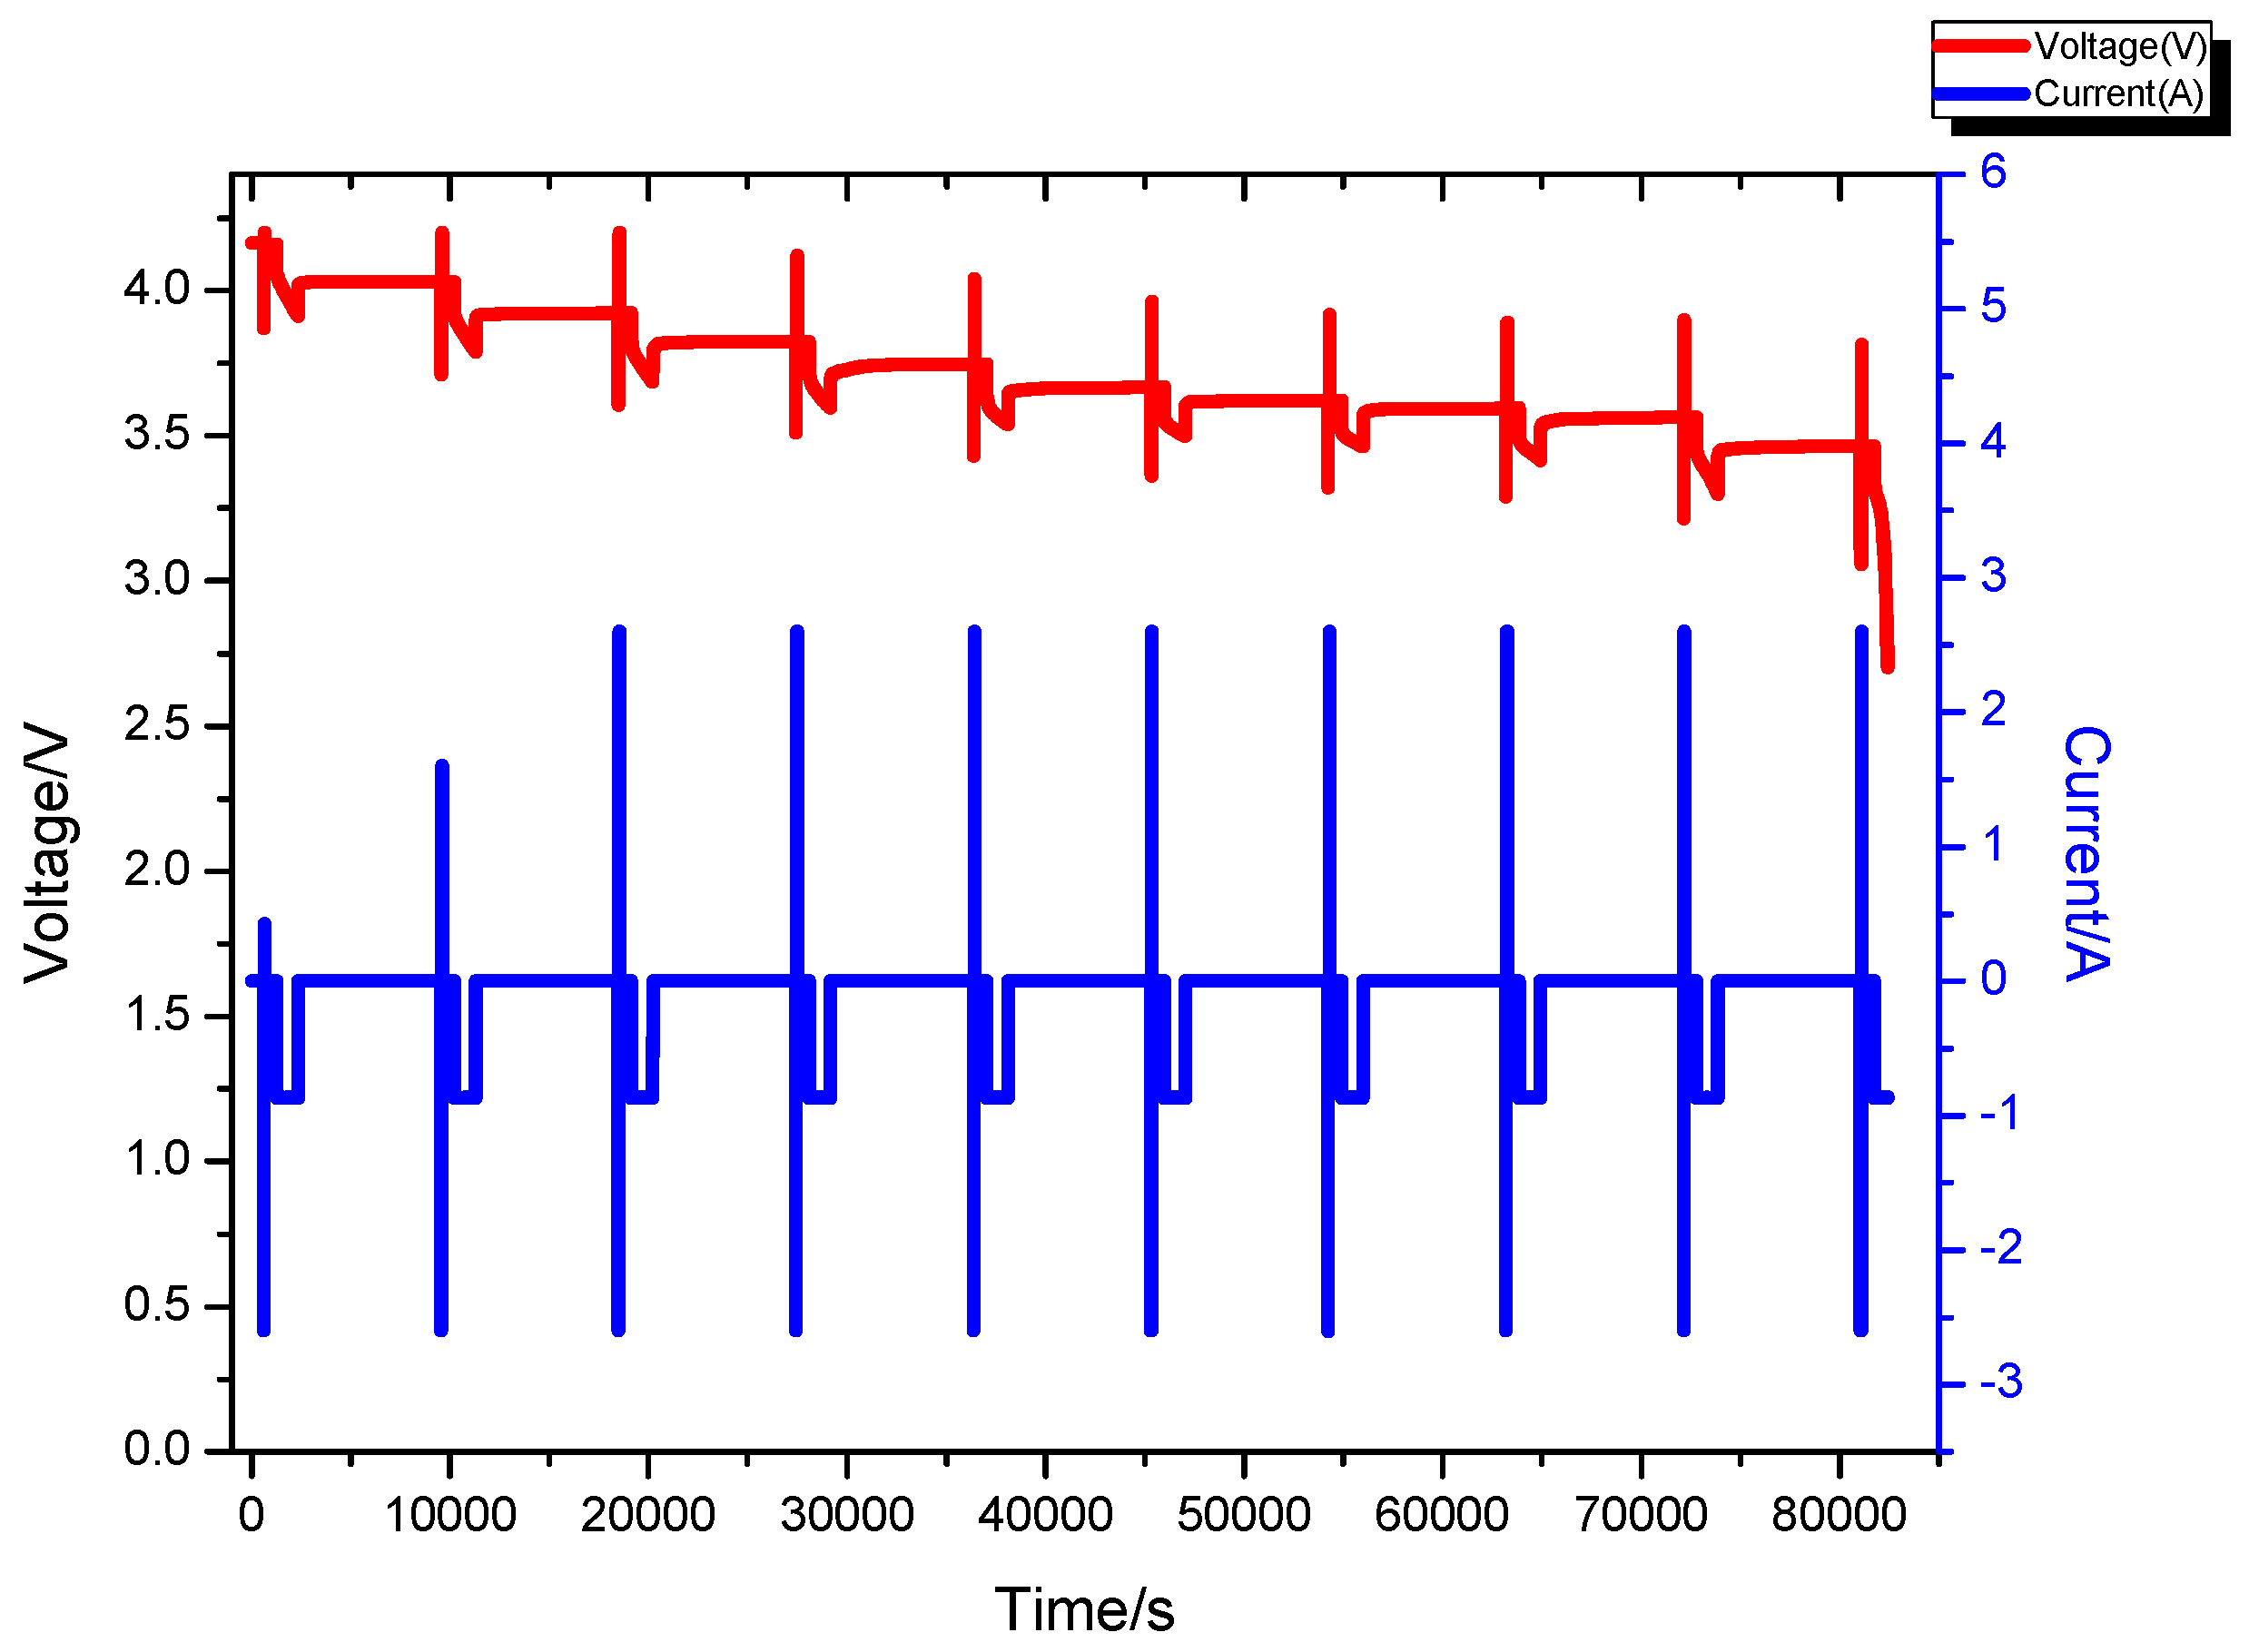
The batteries are tested by the hybrid pulse power characteristic (HPPC) rule [24] to obtain the relation between internal resistance and SOC at different temperatures. The schematic of the HPPC test is shown in Figure 3, the battery is excited by a charging pulse and a discharging pulse at a certain SOC, and the pulse width is set to 10 s. After that, the battery is discharged to the next SOC point. The result of HPPC test with 10% SOC intervals at 25 °C is shown in Figure 4. The equations of charging ohmic resistance , charging total resistance , discharging ohmic resistance and discharging total resistance are as follows:
Above all, , , , , , , are the terminal voltage at point 1, 2, 3, 4, 5, 6. In addition, , are charging current and discharging current respectively.
The results of HPPC tests at different temperatures are shown in Figure 5. The battery is excited by a pulse of 2.6 A under different conditions, and the voltage of the battery will exceed the range of cut-off voltage at both low SOC and low temperature. As a result, the data of resistance at both low SOC and low temperature are missing. Besides, the battery is excited by the mode of constant current—constant voltage at high SOC, preventing the voltage of battery from exceeding the upper cut-off voltage. In this paper, the SOC of the battery is defined as the ratio of residual capacity to the rated capacity. According to Figure 5, the internal resistance gradually increased with decreasing temperature. The battery resistance is effectively stable when the SOC is between 50% and 90%. The resistance increases when the SOC is less than 50% or more than 90%.
The relationship between the open circuit voltage (OCV) and SOC is significant for describing the basic performance of a battery. SOC-OCV curves vary with different types of batteries [25]. The SOC-OCV curves obtained by the battery test system are shown in Figure 6.
The open circuit voltage of the battery is mainly affected by the SOC and the temperature. The open circuit voltage increases gradually with increasing SOC, and decreases gradually with decreasing temperature. The effect of SOC on the open circuit voltage is significantly greater than that of temperature. The fluctuation of open circuit voltage caused by the variation of 5 °C in temperature does not exceed 5 mV.
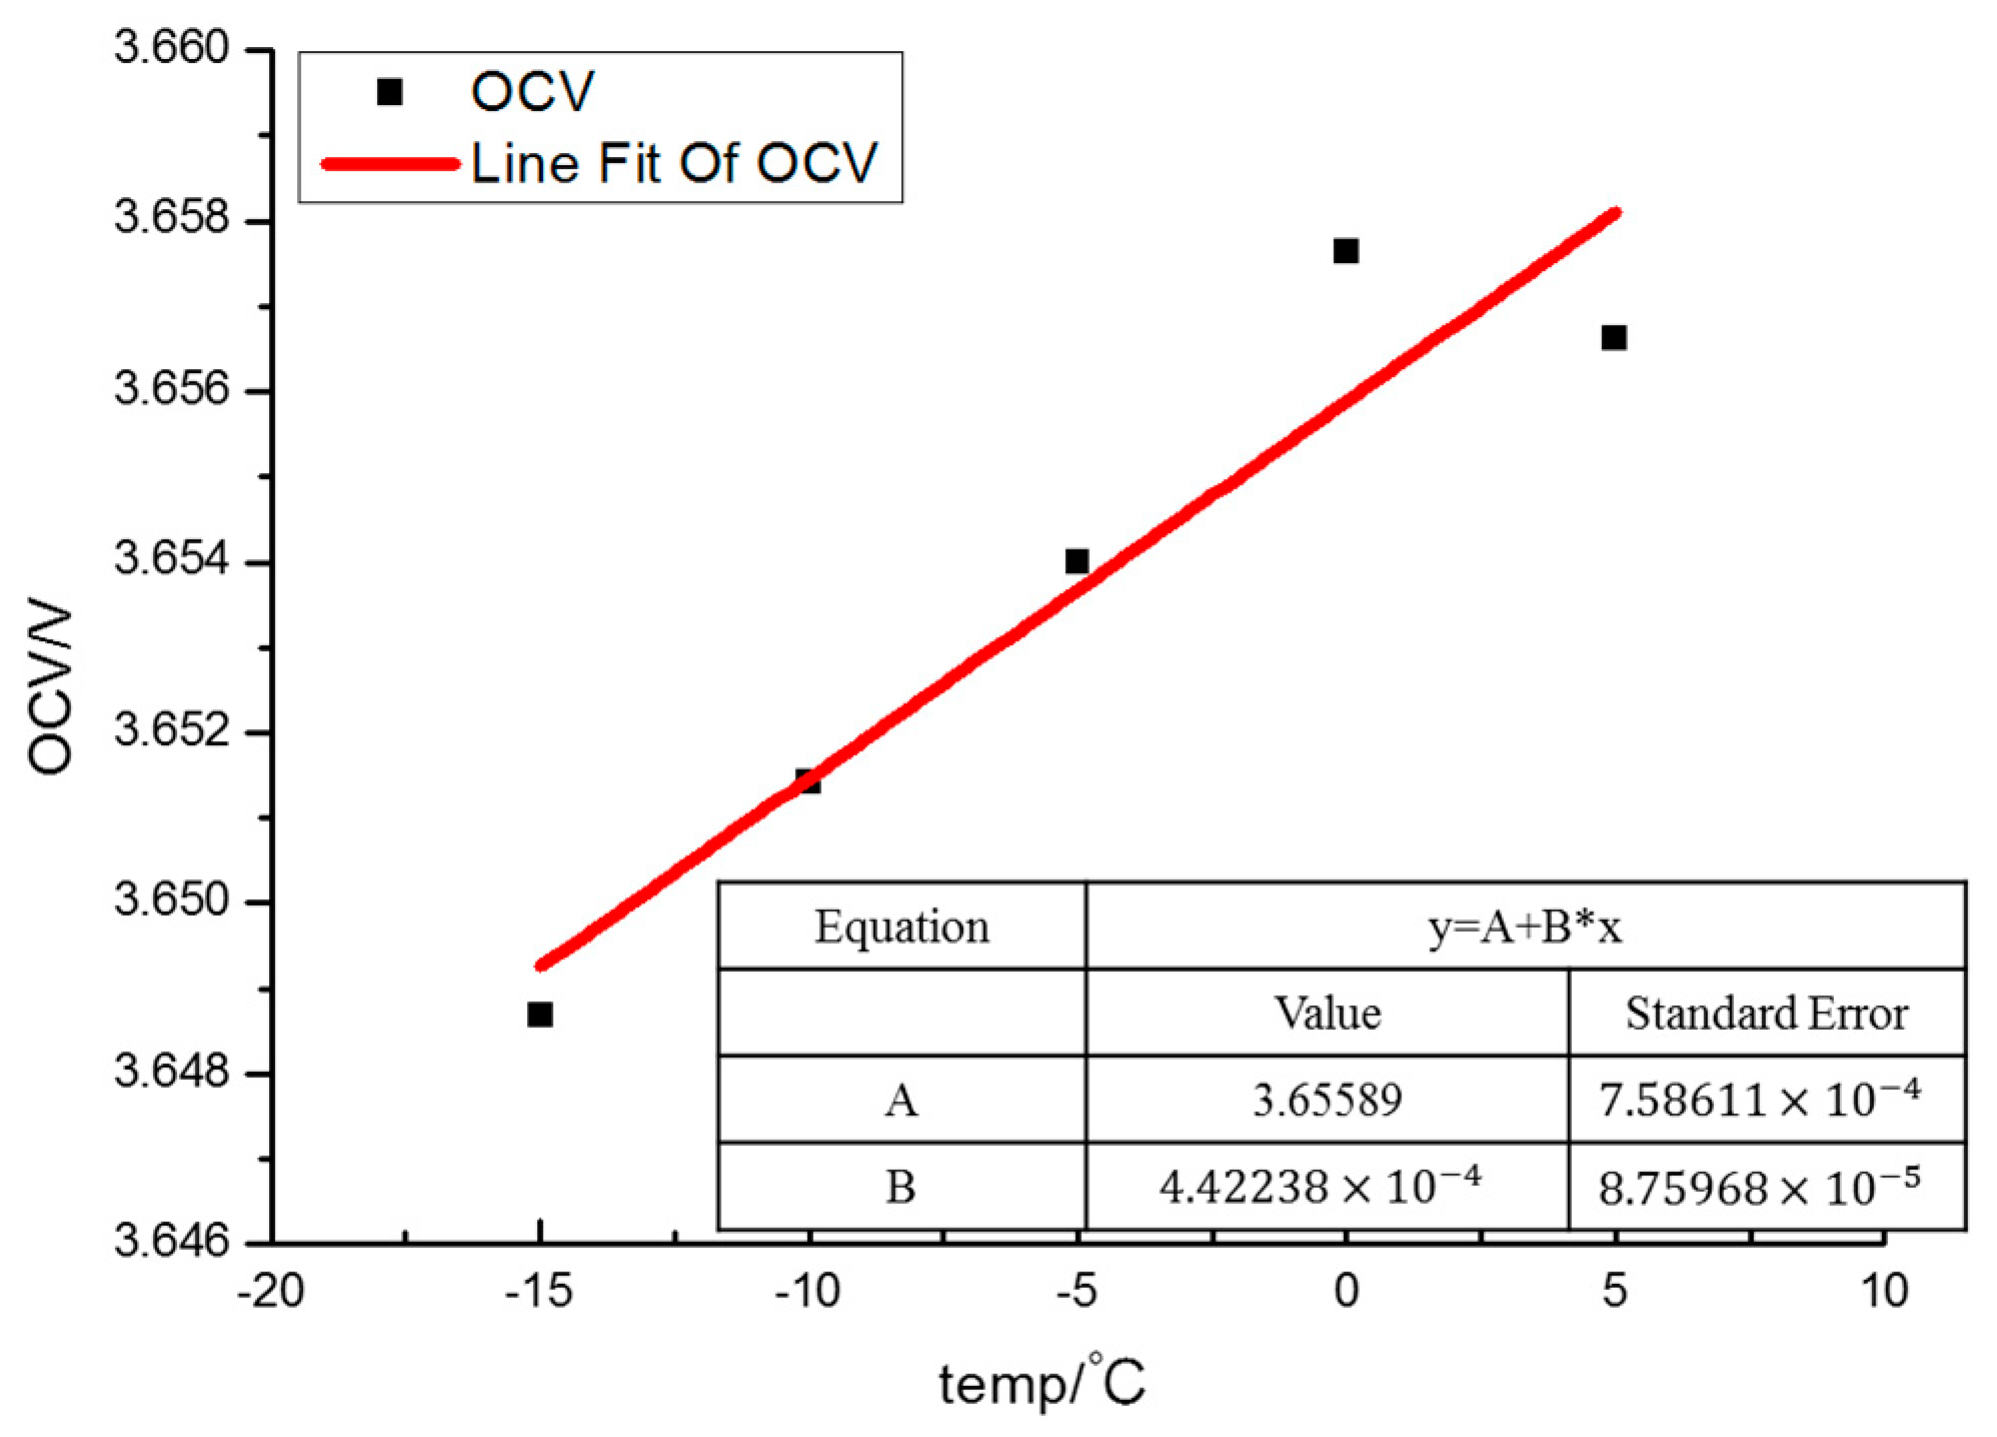
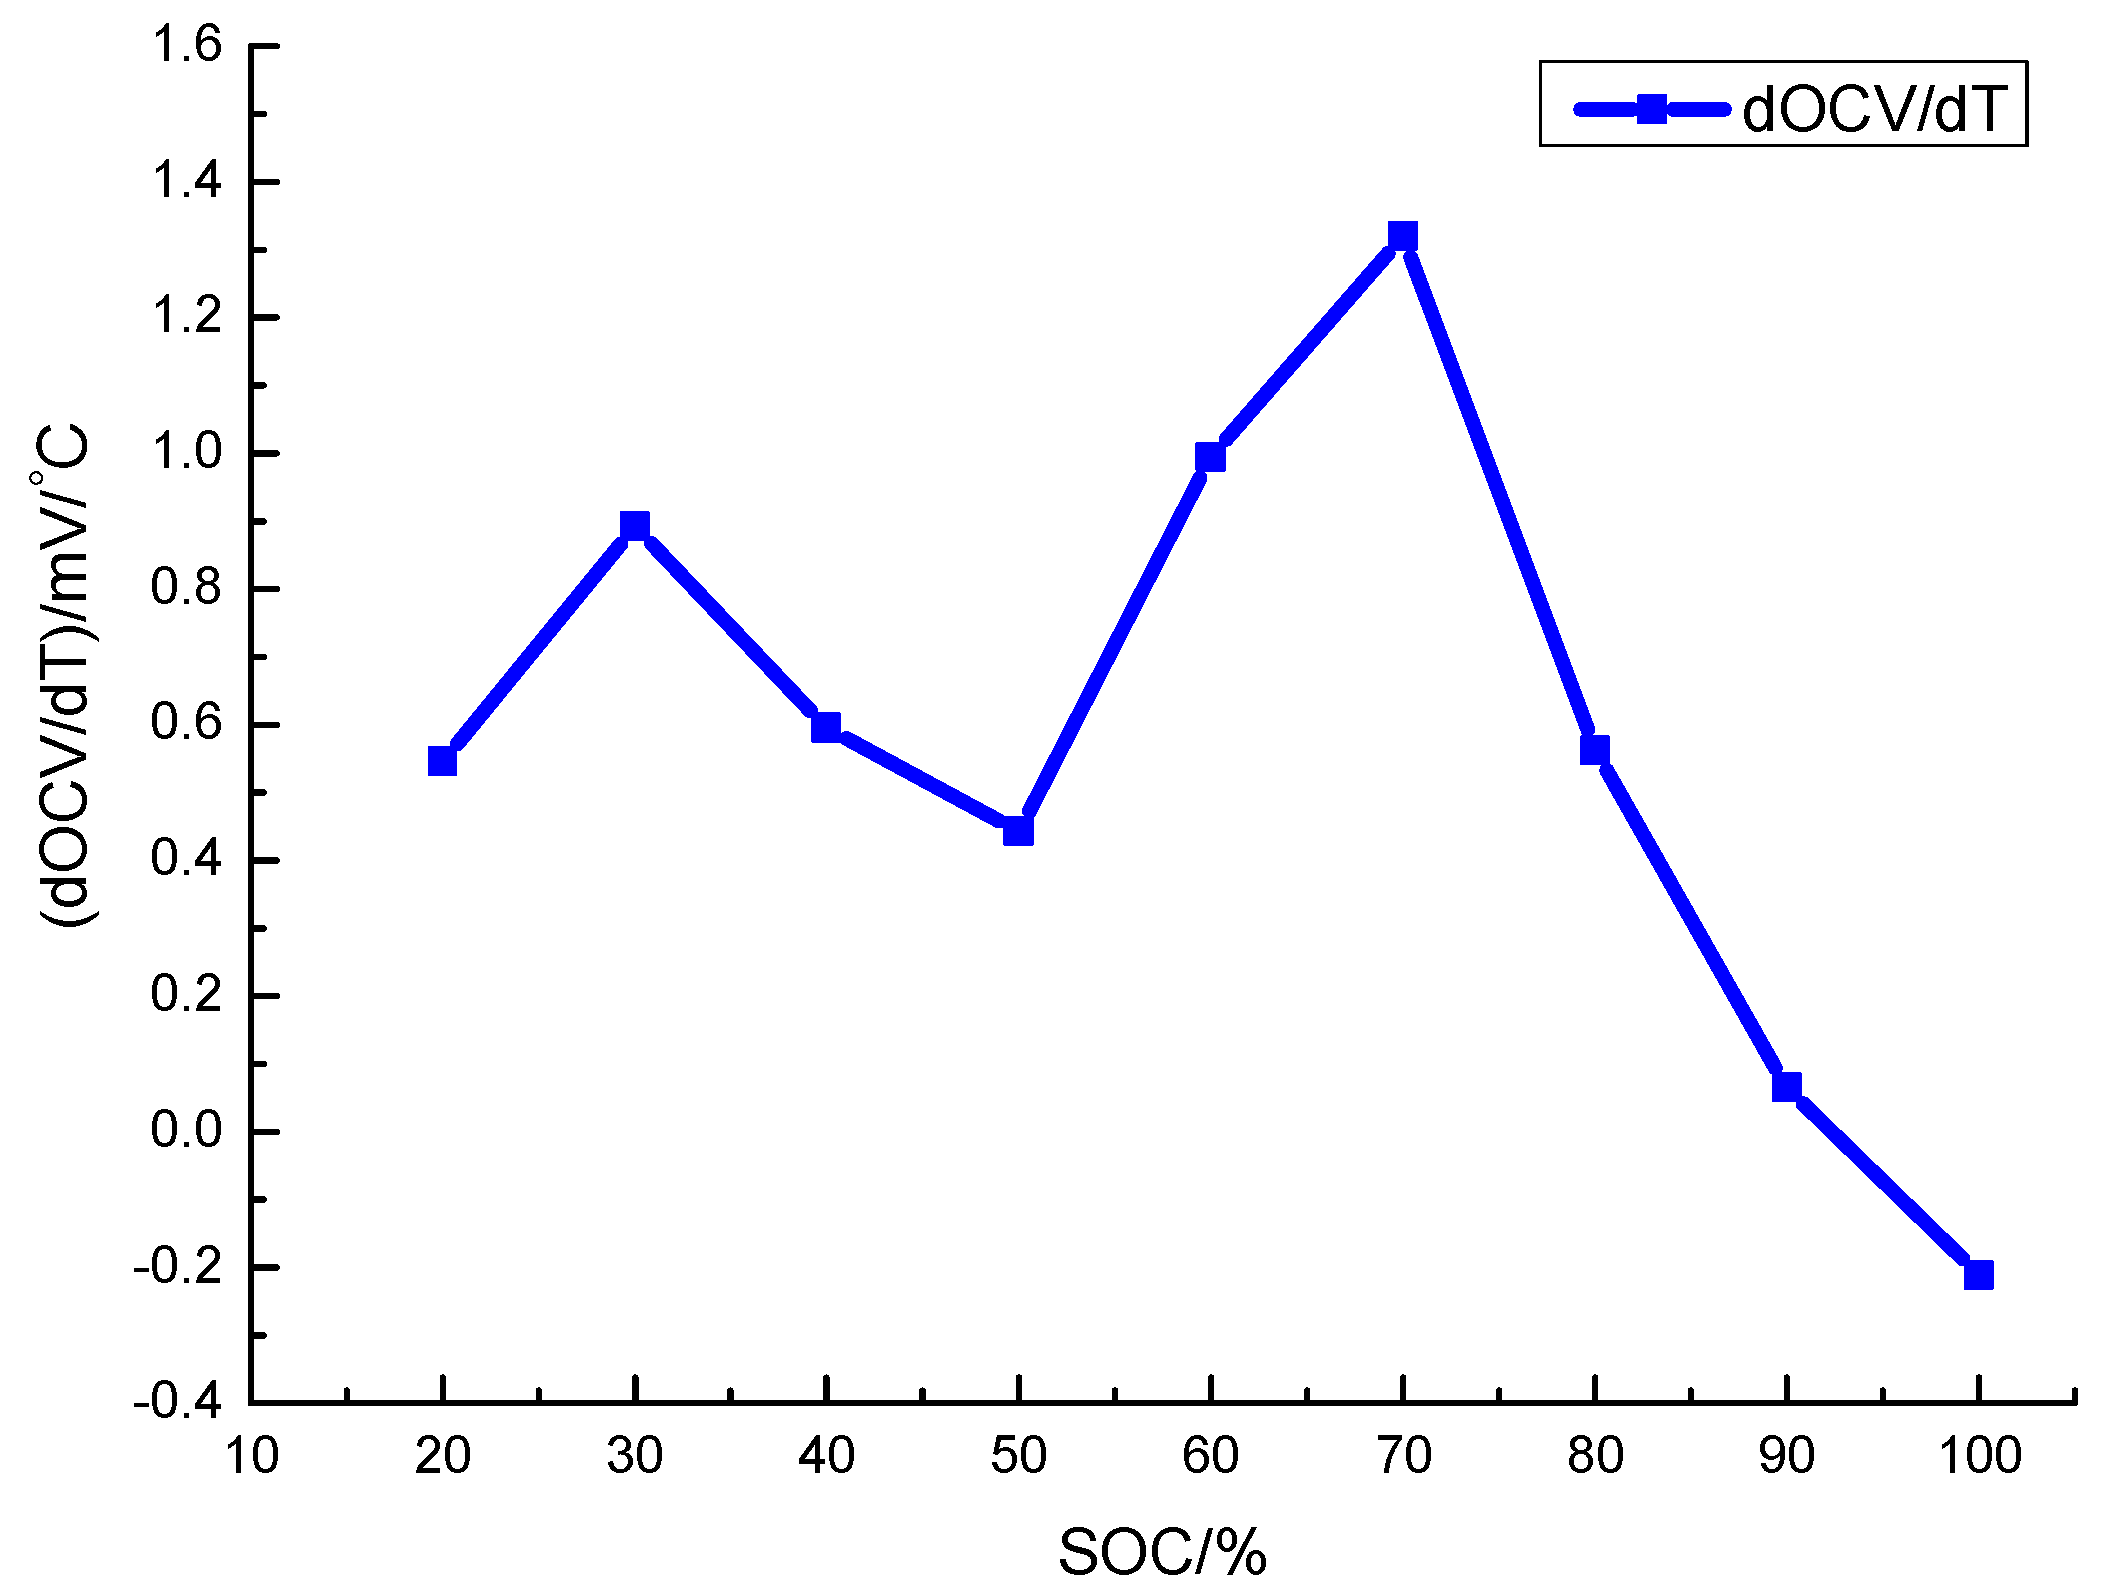
The entropy coefficient is an important parameter for estimating the reaction heat. Firstly, the open circuit voltages of the battery should be measured at different temperatures and SOC points. Through the analysis of the data measured, different open circuit voltage corresponding to different temperatures is obtained at a certain SOC. Referring to [26], a linear function of the temperature and the OCV at a specified SOC is fitted by the least square method. The slope of the derived function is used as the entropy coefficient at the defined SOC. The entropy coefficient at 50% SOC is shown in Figure 7. The above fitting methods were implemented at different SOC points. An entropy coefficient curve with 10% SOC intervals was obtained, as shown in Figure 8. The entropy coefficient is more than zero when the SOC is within a 20–90% range but less than zero when the SOC exceeds 90%. The value of the entropy coefficient is small, which is always in the range of −0.4 to 1.6 mV/°C. According to the reaction heat equation, which is , the small value of the entropy coefficient implies that the contribution of reaction heat is limited. This also shows that most of the heat is generated by Joule heat, and reaction heat contributes less to the temperature rise of the battery.
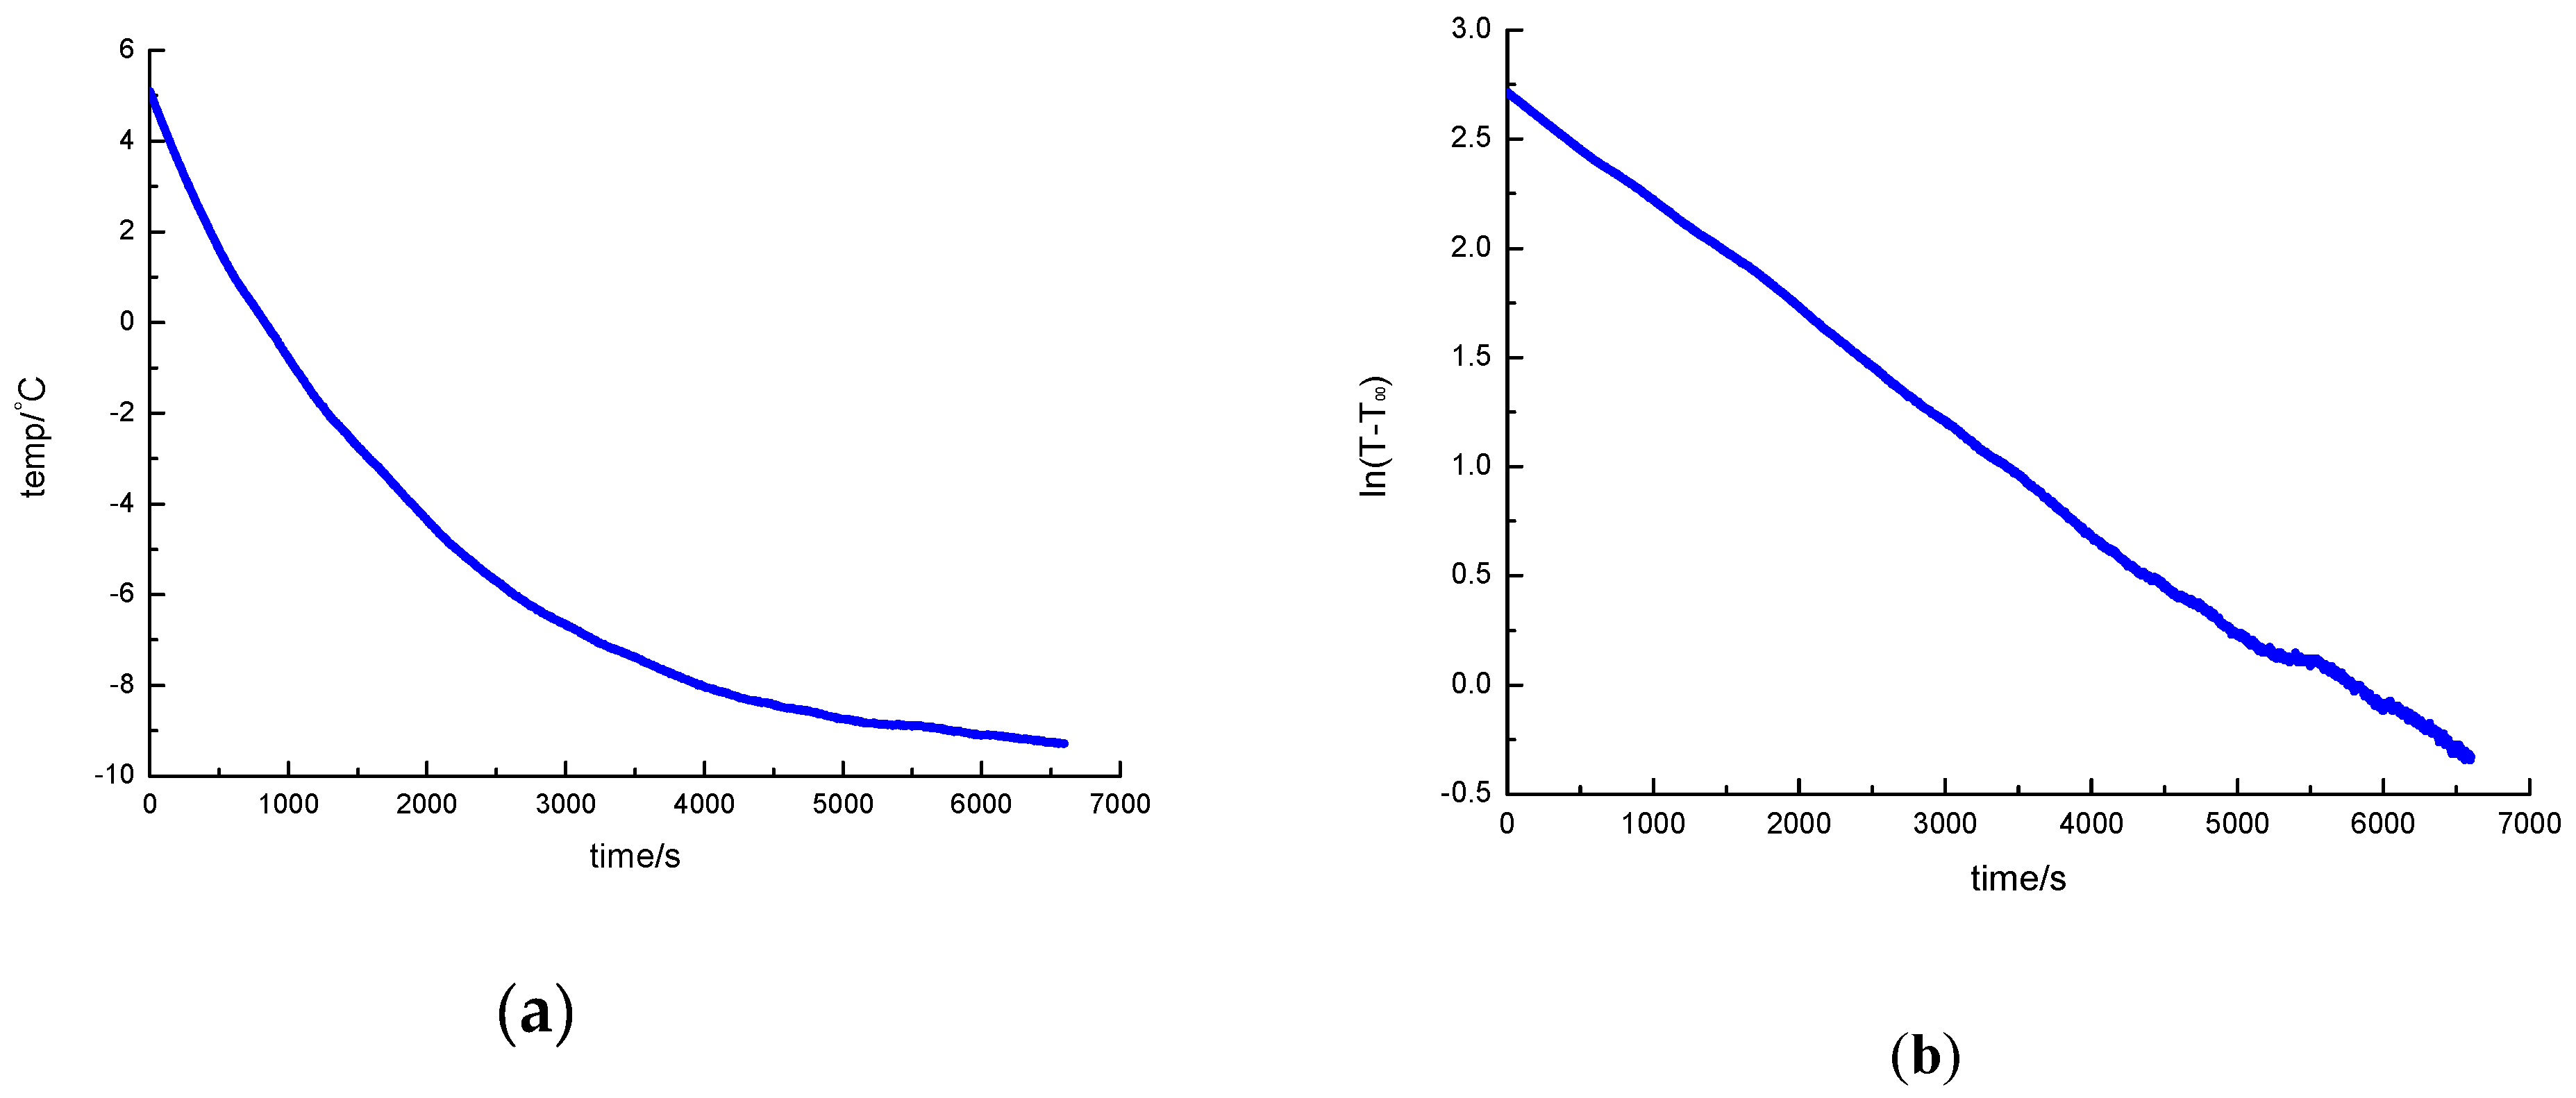
The heat dissipation in the heating process can be expressed by the equivalent heat transfer coefficient. The equivalent heat transfer coefficient is an important parameter in the energy conservation model, which can affect the accuracy of the battery temperature raise model. In practical application, hundreds of individual batteries are connected in series to compose a battery pack, which are put in the battery box of an electric vehicle. The battery box has an insulating effect on the batteries. In order to simulate the actual environment of the battery box in an electric vehicle and reduce the heat dissipation of the battery at low temperatures, the side surface of the battery tested in this experiment is covered by an insulating film which is a thin sponge with stickiness [27]. As a result, the equivalent heat transfer coefficient will be smaller due to the insulating film. The equivalent heat transfer coefficient of the battery is obtained by the temperature gradient calculated during the battery cooling process. The energy conservation equation is shown in Equation (14).
where = 45 g, = 1.72 J/g∙K [5], and = −10 °C. If is a constant value, a solution to Equation (14) is:
Equation (15) shows that there is a linear function between and time, and the equivalent heat transfer coefficient can be determined from the slope of the curve of with [28]. The battery temperature and when the battery cools down are shown in Figure 9. Figure 9b shows the linear relationship with time, resulting in an equivalent heat transfer coefficient of 5.035 W/m2∙K.
3.2. Temperature-Rise Model Validation
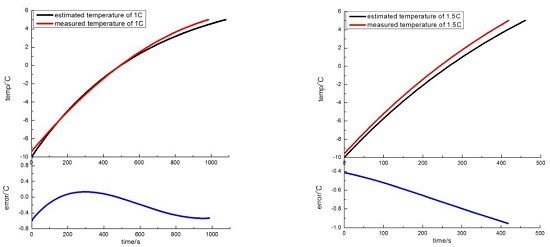
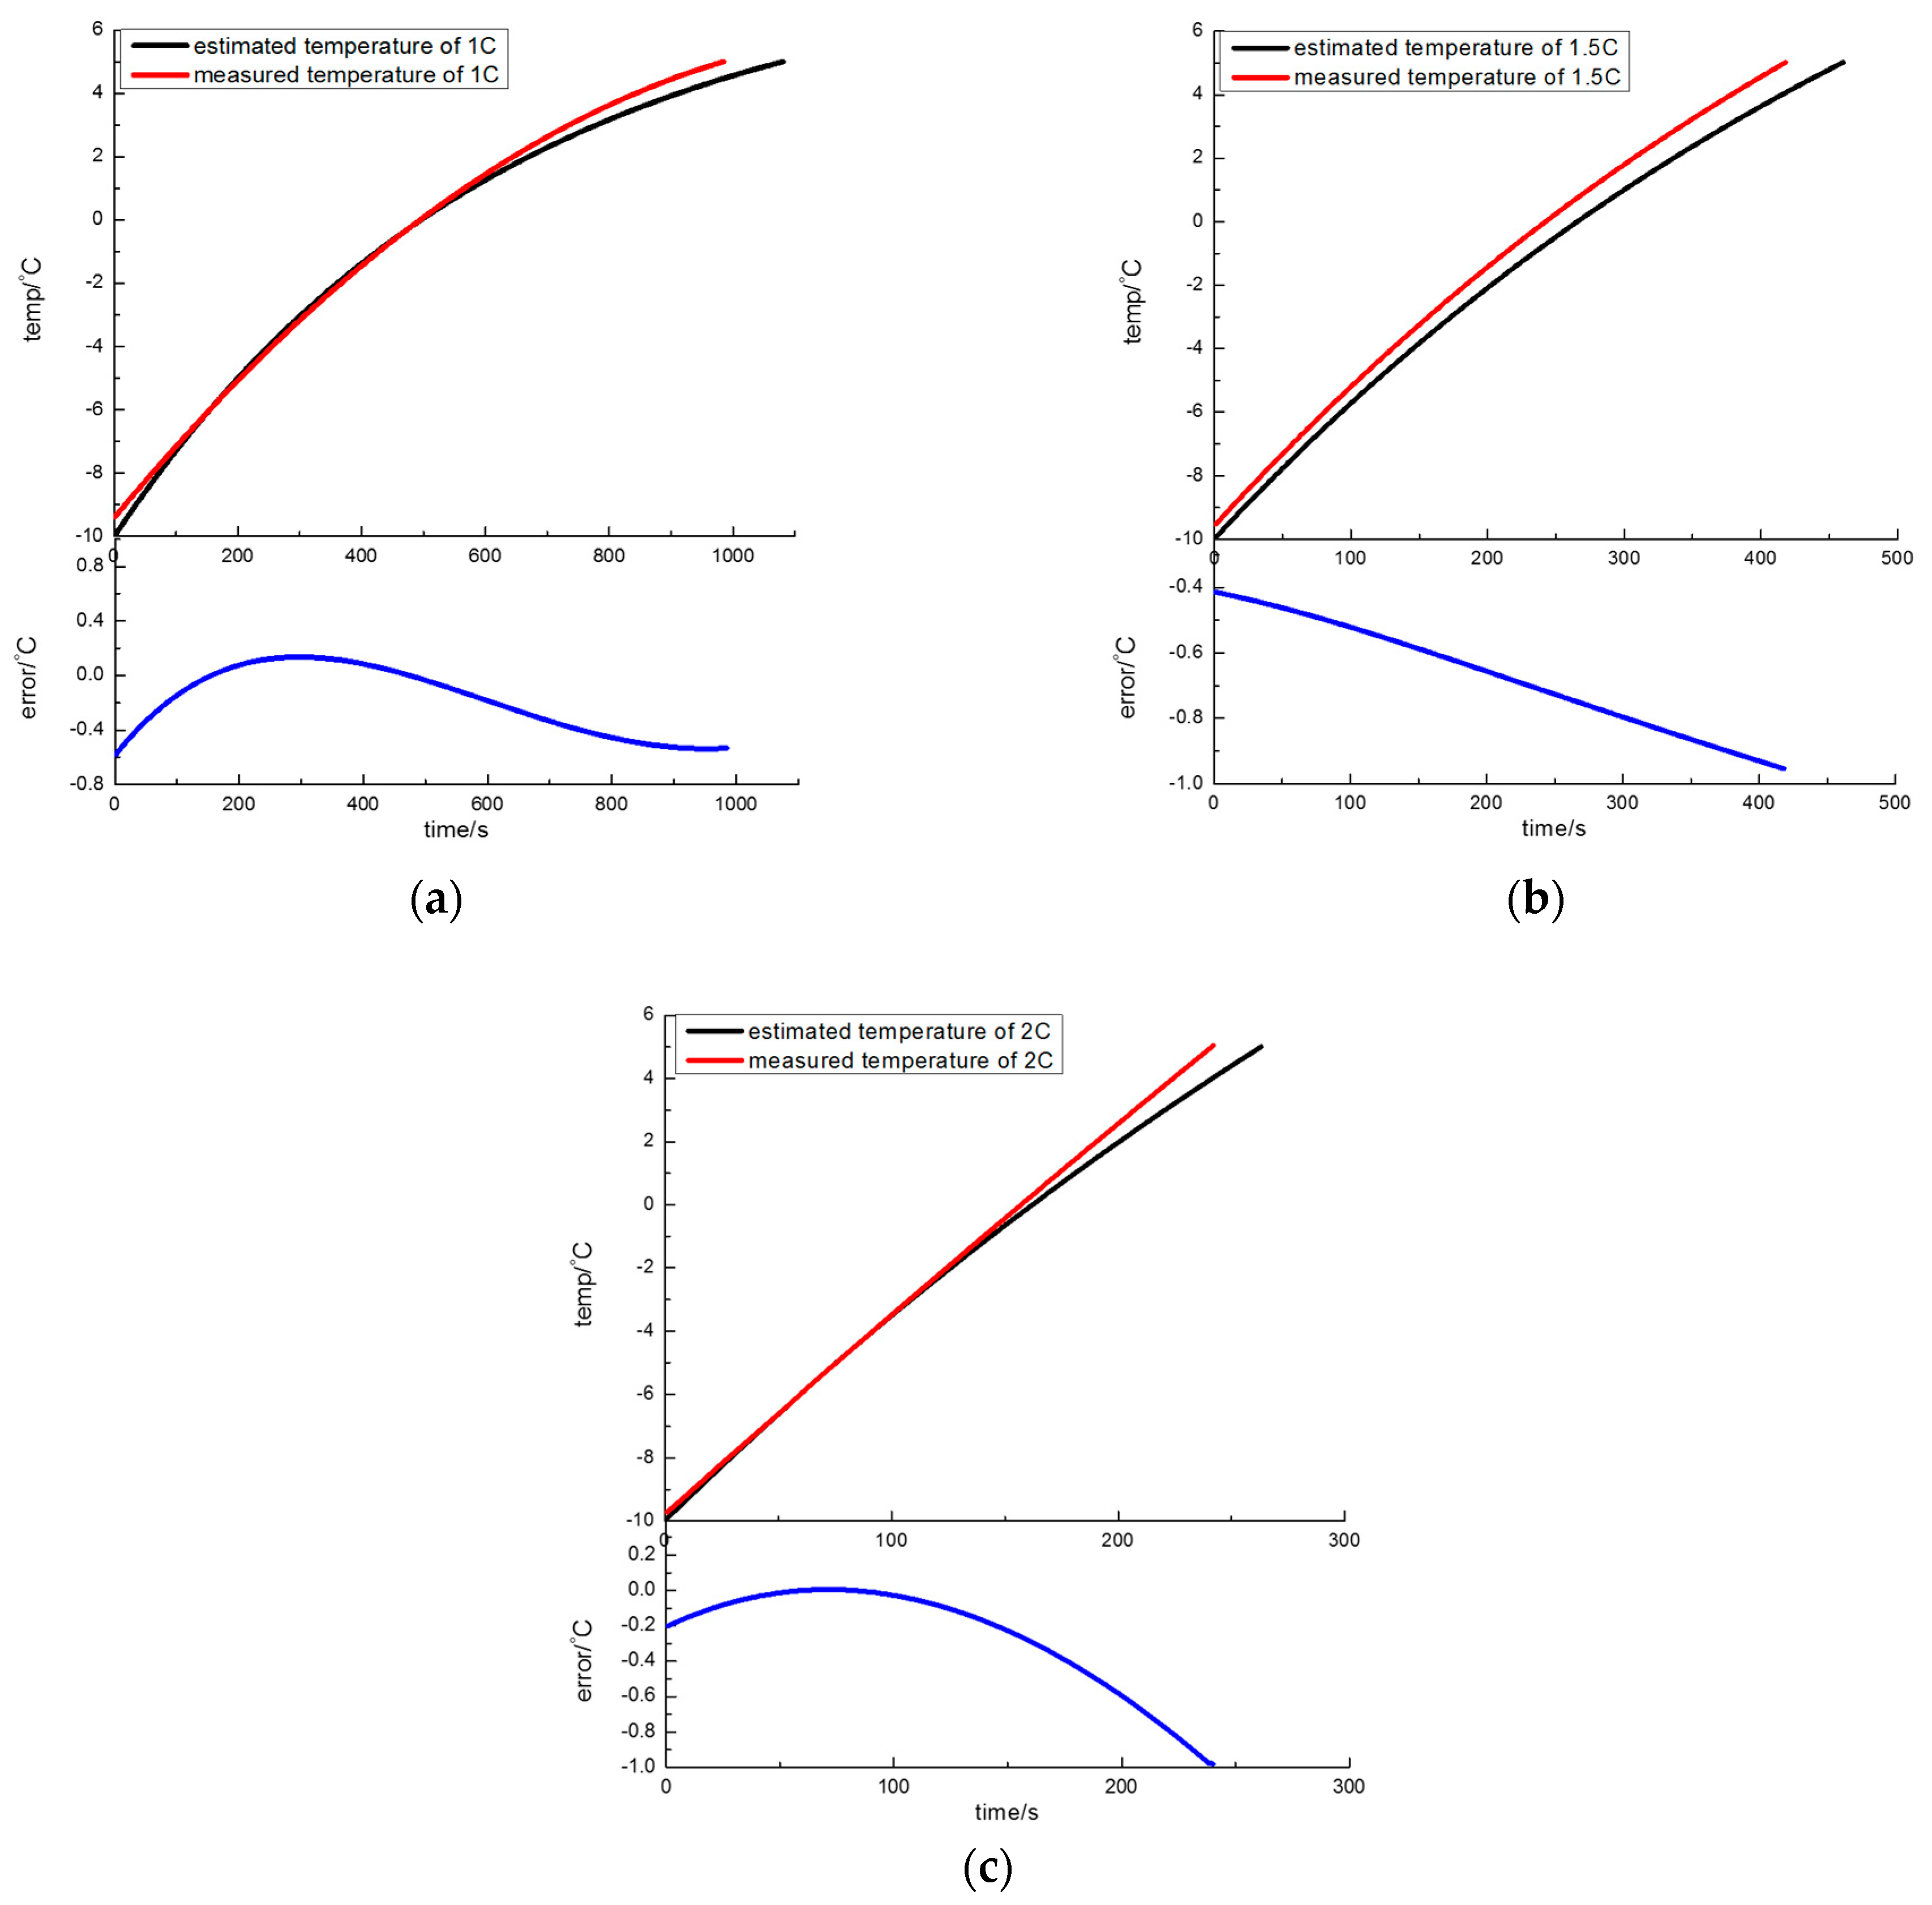
The fluctuation of both battery temperature and SOC is relatively large in the process of battery discharge for self-heating. This paper establishes a temperature-rise model which takes into account the dynamic characteristic of the battery temperature and SOC. Tests analyzing the discharge process for self-heating at low temperature were carried out. The discharge rates selected are 1 C, 1.5 C, and 2 C. The ambient temperature is −10 °C, the target temperature is 5 °C [5], and the initial SOC of the tested battery is 80%. The experimental results are compared with the simulation results, and the accuracy of the temperature rise model is verified by the error between the actual temperature and the simulation.
Plots of the predicted temperature, actual temperature and the error between these values are shown in Figure 10. The predicted temperature obtained from the temperature-rise model is essentially identical to the actual temperature of the battery. The maximum error between the predicted temperature and the actual temperature does not exceed 1 °C during the process of self-heating, which is the same as [26]. Hence, it can be demonstrated that the temperature-rise model established for ICR18650 batteries in this paper is highly accurate.
4. Calculation Results and Analysis
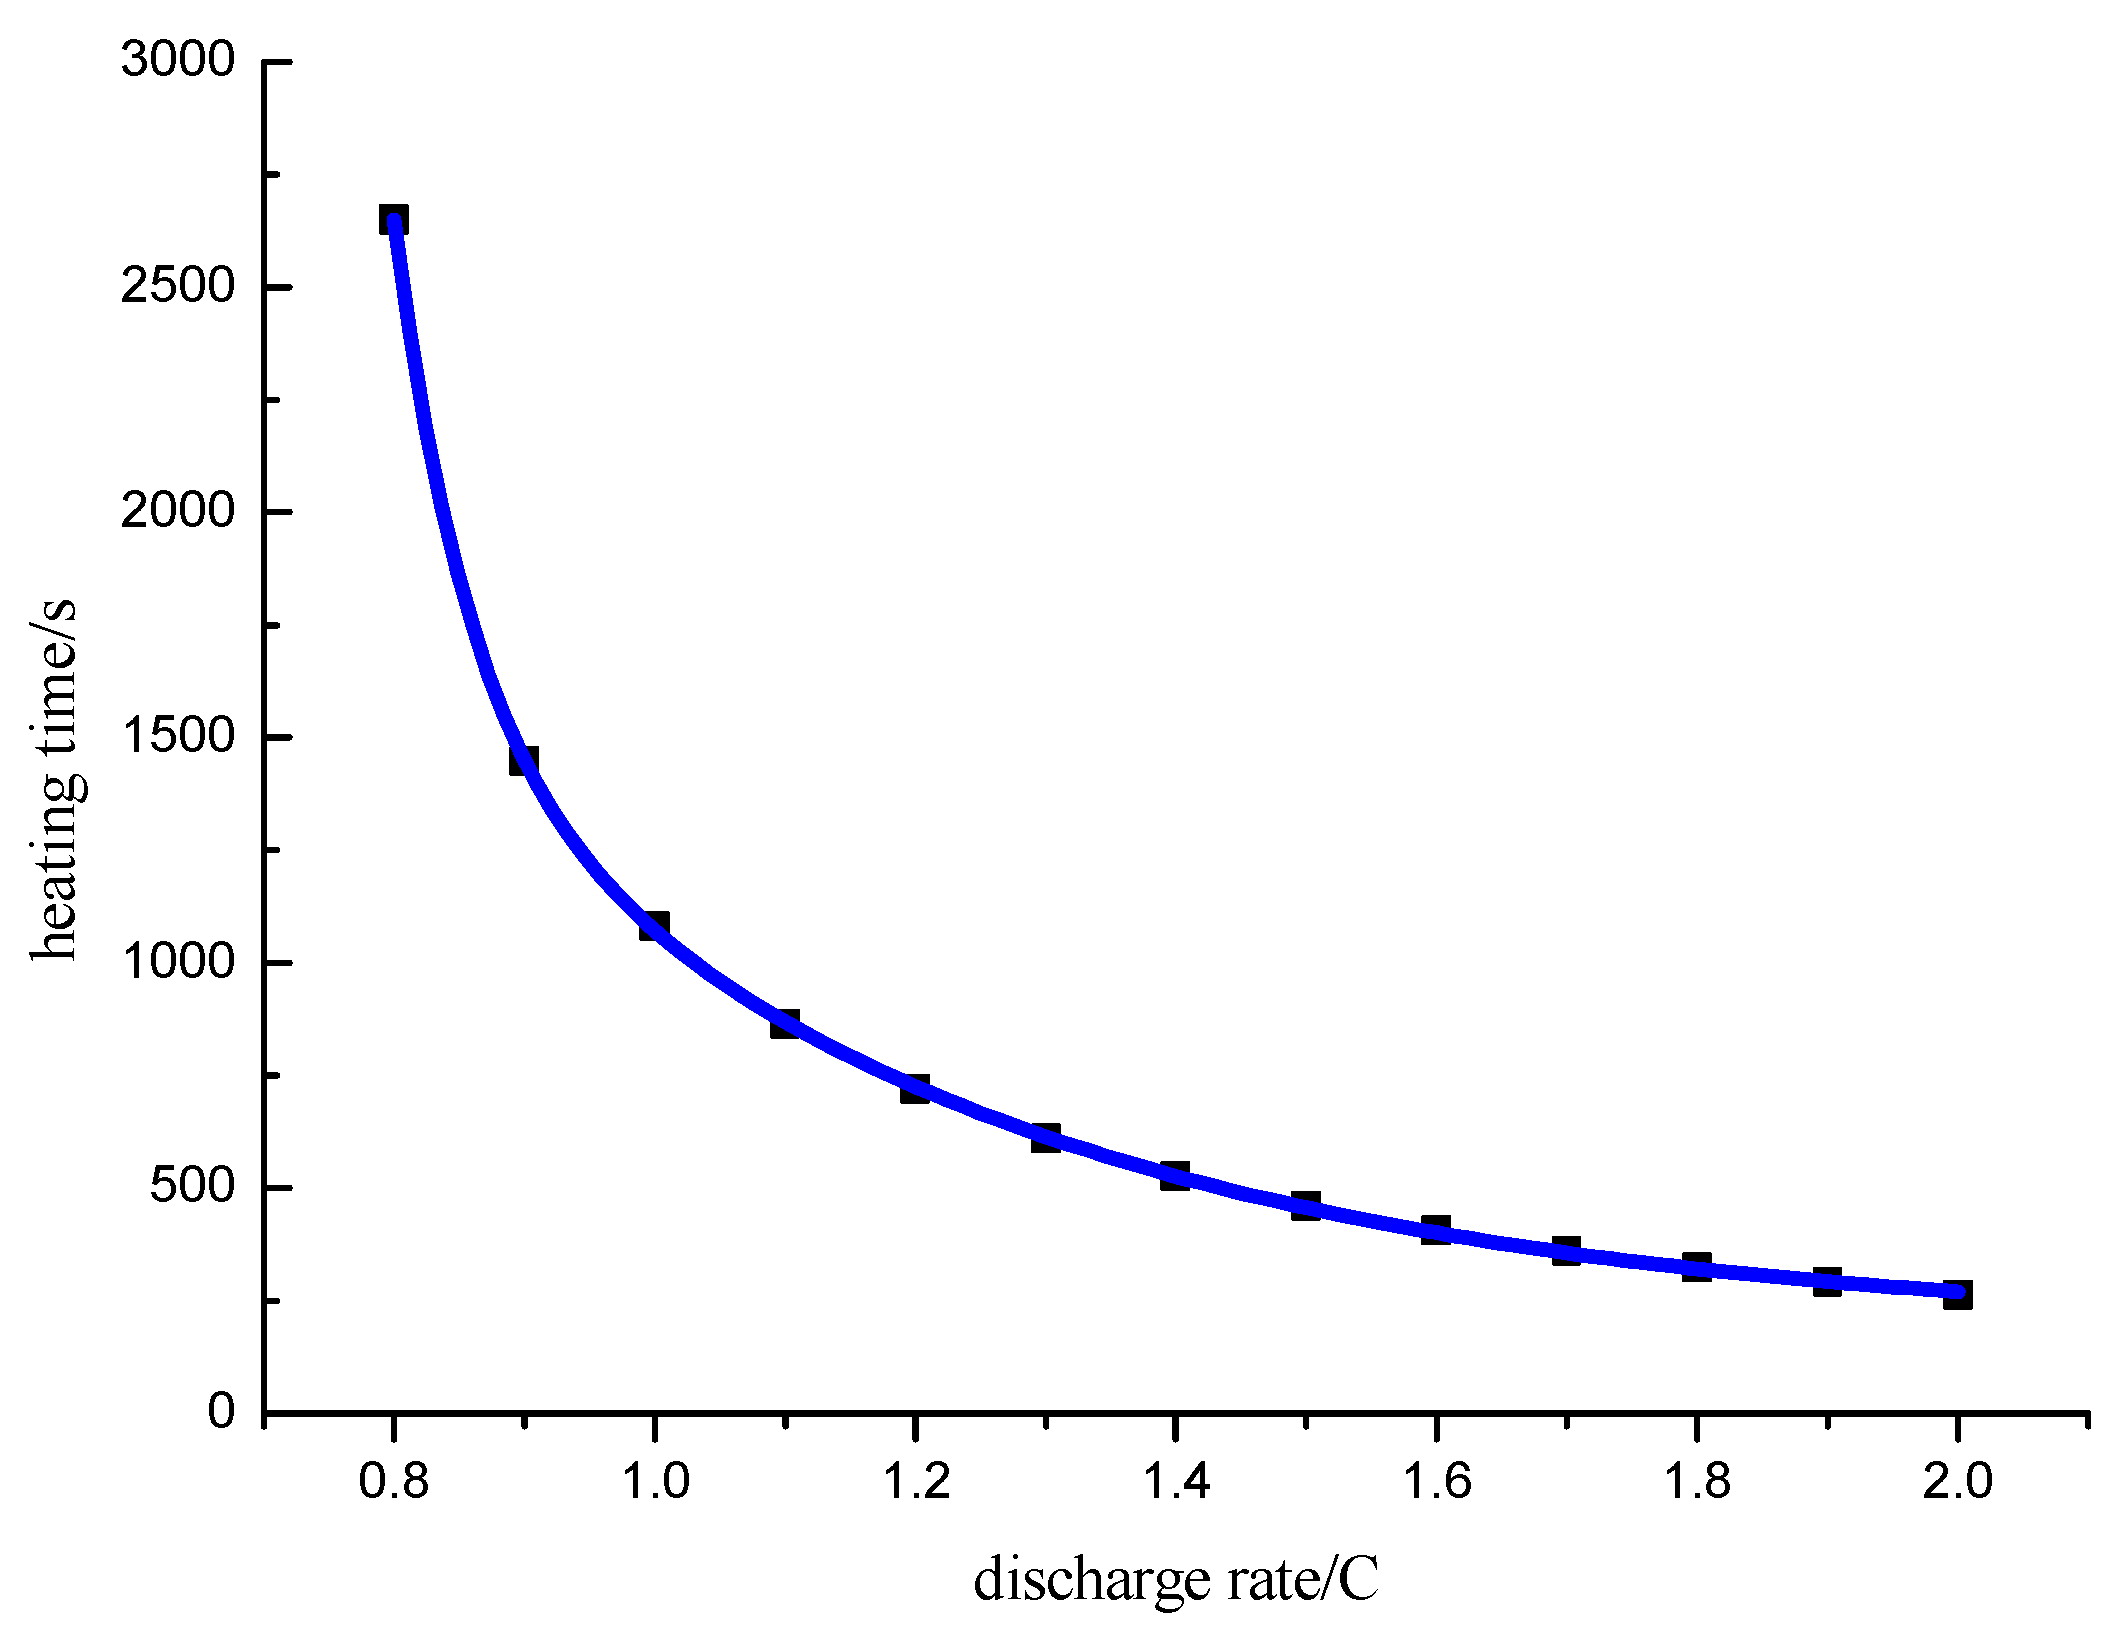
According to the temperature-rise model developed in this paper, the time required for heating the battery from the ambient temperature to the target temperature at different discharge rates is obtained, as shown in Figure 11. The curve is fitted by the least squares method to obtain the function of the battery discharge rate and the heating time, which is shown in Equation (12), where is the discharge rate and is the heating time in seconds.
As can be seen from Figure 11, the battery temperature can be raised from −10 °C to 5 °C in 280 s when the discharge rate is 2 C. When the discharge rate decreases, the heating time gradually increases in response. The heating time is 1080 s when the discharge rate is 1 C. The effect of current discharge on the heating time is significantly enhanced when the discharge rate is less than 1 C. As the discharge rate continues to decrease, the heating time rapidly increases. The heating time is more than 2640 s when the discharge rate is 0.8 C, which is far longer than the reasonable heating time in actual applications.
Further, the power consumption of the self-heating process can be calculated by combining the battery temperature-rise model with the ampere-hour integral method [29]. The ampere-hour integral equation is shown as Equation (17).
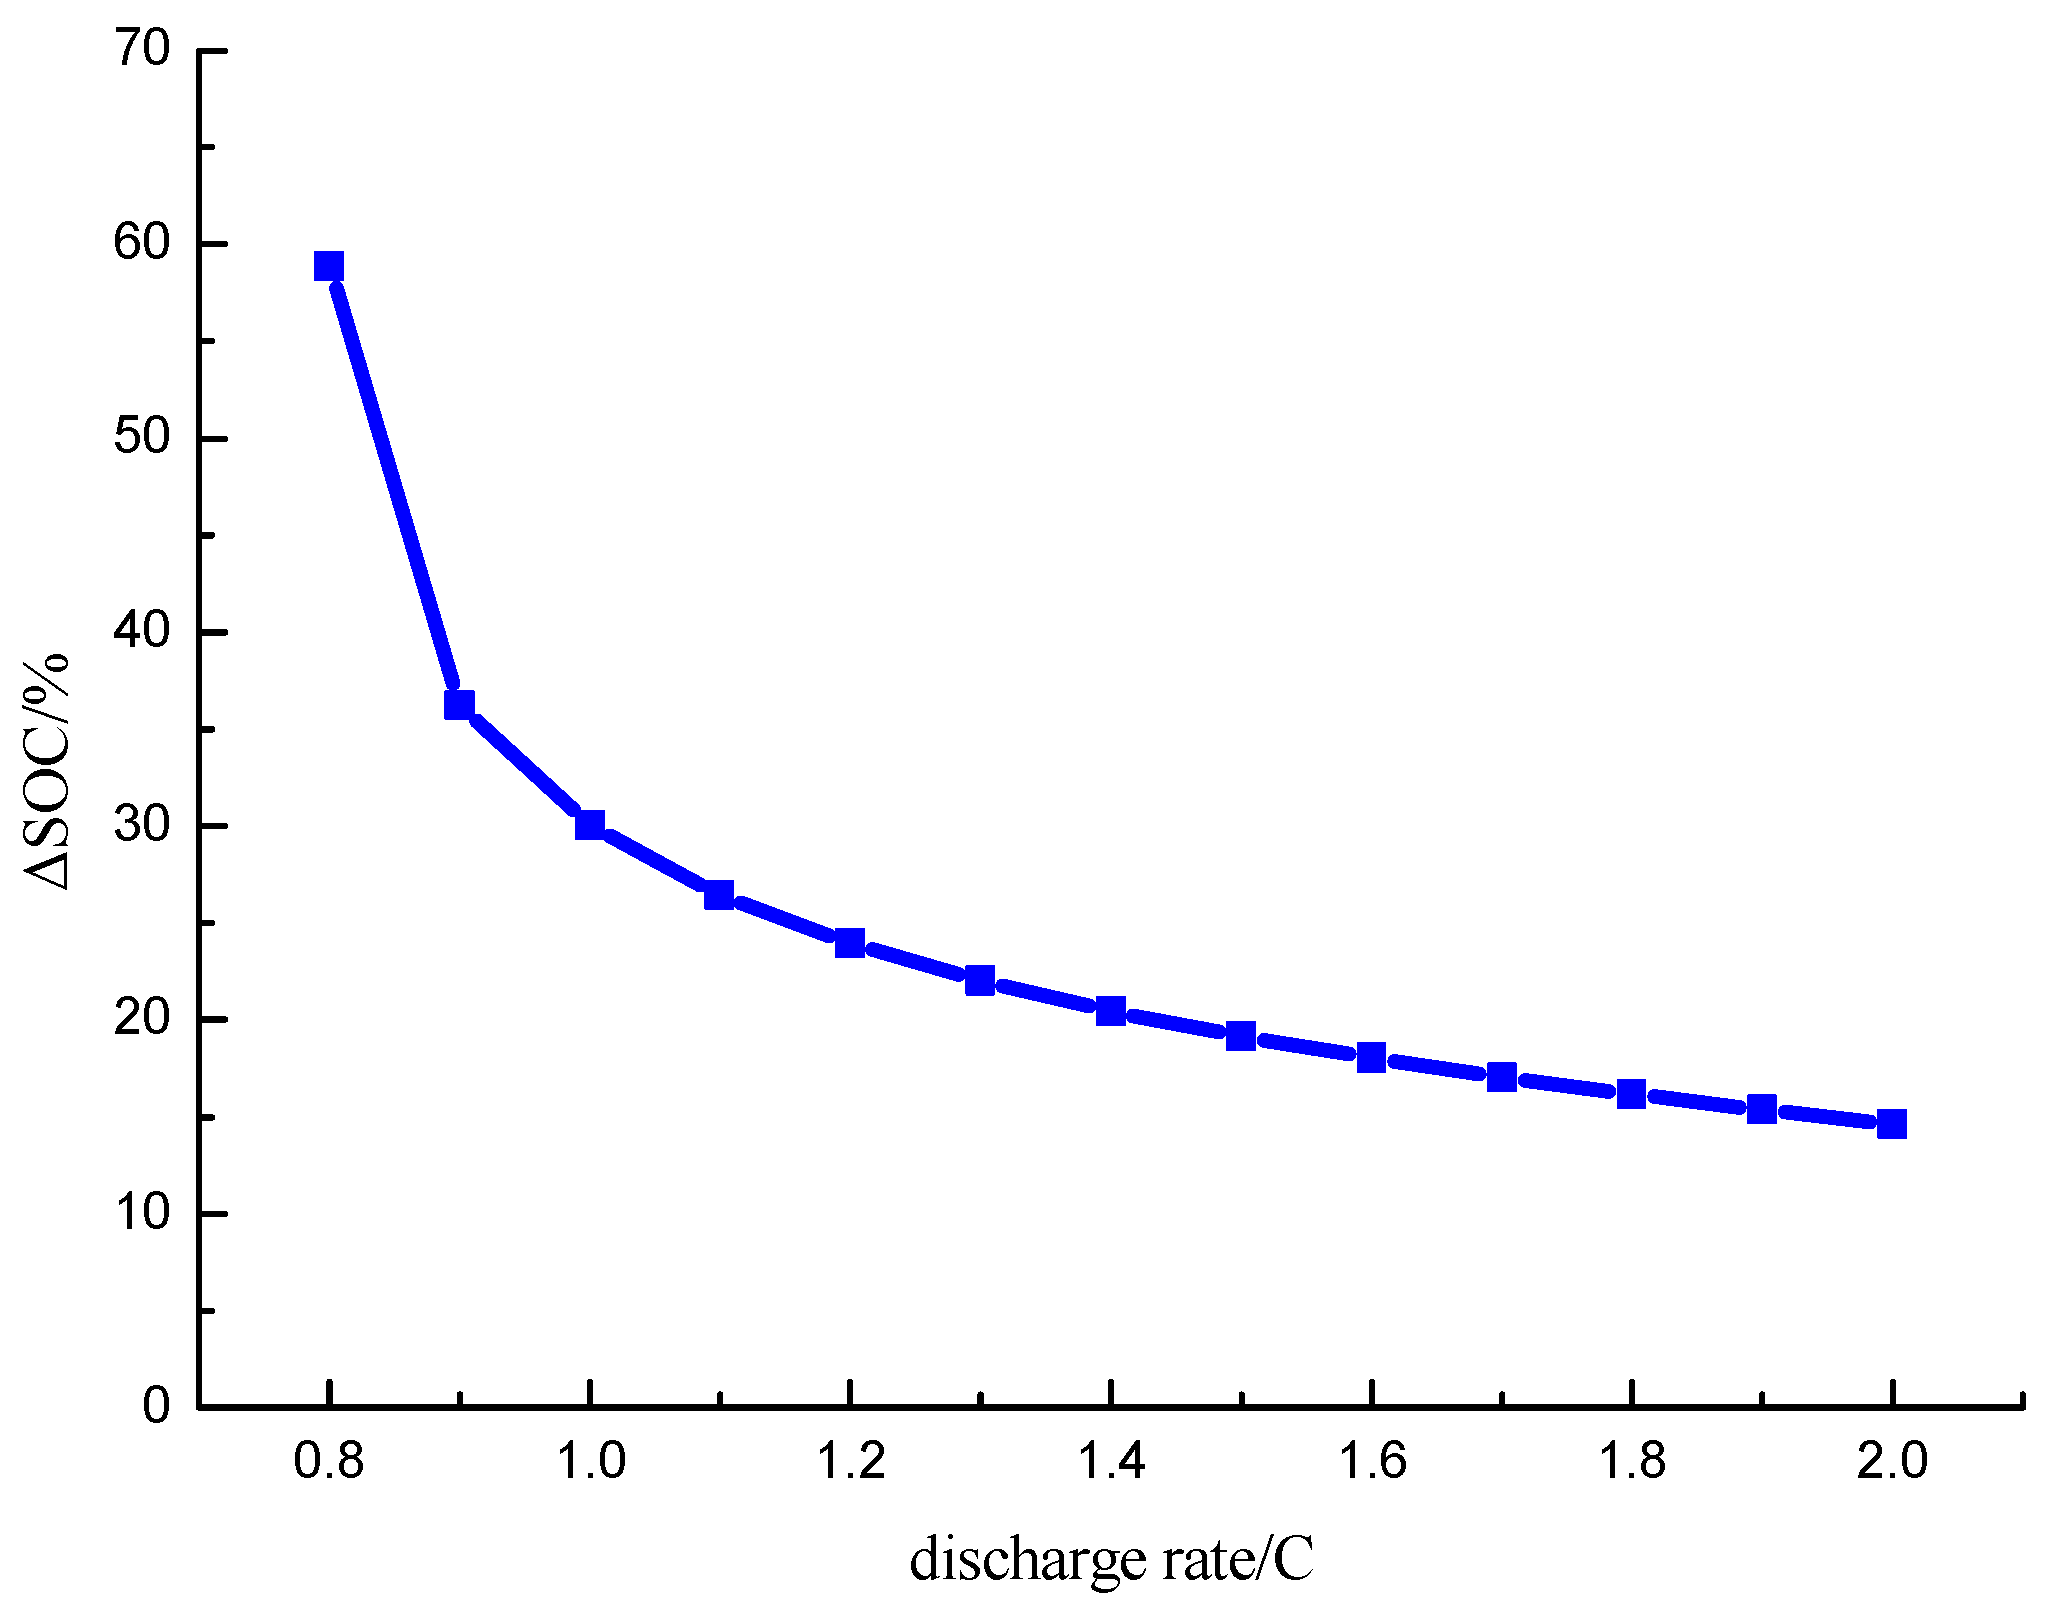
where is the initial SOC of the battery, is the SOC at time , is the discharge current of the battery, and is the rated capacity of the battery. Additionally, is defined as the power consumption in this paper. The power consumption of the battery during heating at different discharge current rates is shown in Figure 12. The curve is fitted utilizing the least squares method to further obtain the function of the battery discharge rate and power consumption shown in Equation (18), where is the discharge rate and is the total variation of SOC during the heating process, i.e., the power consumption.
According to Figure 12, the power consumption of the battery at a 2 C discharge rate is less than 15% of the rated capacity. As the discharge rate gradually reduced, the power consumption increases slowly. The power consumption of the heating process is 30% of the rated capacity when the discharge rate is 1 C. The effect of discharge rate on power consumption is significantly enhanced when it is less than 1 C. When the discharge rate is 0.8 C, the power consumption of the heating process is 60% of the rated capacity, which is twice the value at 1 C. Therefore, the discharge rate should be selected in the range of 1 C–2 C in applying the constant-current discharge method to heating a battery at low temperature.
5. Conclusions
A temperature-rise model considering the dynamic fluctuation in battery temperature and SOC is proposed, and it is possible to predict the battery temperature during the progress of battery self-heating at low temperature. Tests in which the battery was heated from −10 °C to 5 °C were conducted at different discharge rates. The results show that the temperature-rise model can accurately reflect actual variation in battery temperature. The maximum error between the predicted temperature and actual temperature is less than 1 °C during the process of battery self-heating.
When the temperature-rise model developed in this paper is combined with the ampere-hour integral method, the quantitative relationship among the discharge rate, the heating time, and the power consumption during the self-heating process is realized. The difficulty in predicting the heating time and power consumption during the self-heating process is thus addressed. The results indicate that the discharge rate and the heating time present an exponential decreasing trend and it is similar with the discharge rate and the power consumption. When a 2 C discharge rate is selected for constant-current discharging to the internal heating battery, the battery temperature can rise from −10 °C to 5 °C in 280 s. In this case, the power consumption of the self-heating process does not exceed 15% of the rated capacity. As the discharge rate gradually reduced, the heating time and power consumption of the heating process increased slowly. When the discharge rate was 1 C, the heating time exceeded 1080 s, and the power consumption reached 30% of the rated capacity. The effect of discharge rate on the heating time and power consumption during the self-heating process is significantly enhanced when the discharge rate is less than 1 C. When the discharge rate is 0.8 C, the power consumption of self-heating process is 2.45 times that at 1 C, and the heating time is twice that at 1 C. Therefore, the discharge current rate should be selected in the range of 1 C–2 C in applying the constant-current discharge method to battery self-heating. The method of self-heating is suitable for heating the lithium-ion battery which is fully charged at low temperature before the normal operation.
Acknowledgments
This work was supported by the State Key Laboratory of Automotive Safety and Energy under Project No. KF16062 and Science Funds for the Young Innovative Talents of HUST, No. 201503.
Author Contributions
Xiaogang Wu, Zhe Chen and Zhiyang Wang designed the simulations and experiments; Xiaogang Wu analyzed the data; Zhe Chen wrote the paper; Zhiyang Wang polished the paper.
Conflicts of Interest
The authors declare no conflict of interest.
References
- Sun, F.; Xiong, R.; He, H. A systematic state-of-charge estimation framework for multi-cell battery pack in electric vehicles using bias correction technique. Appl. Energy 2016, 162, 1399–1409. [Google Scholar] [CrossRef]
- Li, Z.; Han, X.; Lu, L.; Ouyang, M. Temperature Characteristics of Power LiFePO4 Batteries. Chin. J. Mech. Eng. 2011, 115–120. [Google Scholar] [CrossRef]
- Lin, C.; Li, B.; Chang, G.; Xu, S. Experimental study on internal resistance of LiFePO4 batteries under different ambient temperatures. Chin. J. Power Sources 2015, 39, 22–25. [Google Scholar]
- Cho, H.; Choi, W.; Go, J.; Bae, S.; Shin, H. A study on time-dependent low temperature power performance of a lithium-ion battery. J Power Sources 2012, 198, 273–280. [Google Scholar] [CrossRef]
- Zhang, J.; Ge, H.; Li, Z.; Ding, Z. Internal heating of lithium-ion batteries using alternating current based on the heat generation model in frequency domain. J. Power Sources 2015, 273, 1030–1037. [Google Scholar] [CrossRef]
- Lei, Z.; Zhang, C.; Li, J.; Fan, G.; Lin, Z. Preheating method of lithium-ion batteries in an electric vehicle. J. Mod. Power Syst. Clean Energy 2015, 3, 289–296. [Google Scholar] [CrossRef]
- Wang, F.C.; Zhang, J.Z.; Wang, L.F. Design of electric air-heated box for batteries in electric vehicles. Chin. J. Power Sources 2013, 37, 1184–1187. [Google Scholar]
- Song, H.; Jeong, J.; Lee, B.; Shin, D.H.; Kim, B.; Kim, T.; Heo, H. Experimental Study on the Effects of Pre-Heating a Battery in a Low-Temperature Environment. In Proceedings of the 2012 IEEE Vehicle Power and Propulsion Conference (VPPC), Seoul, Korea, 9–12 October 2012; pp. 1198–1201. [Google Scholar]
- Zhang, C.N.; Lei, Z.G.; Dong, Y.G. Method for Heating Low-Temperature Lithium Battery in Electric Vehicle. Trans. Beijing Inst. Technol. 2012, 32, 921–925. [Google Scholar]
- Liu, C.; Zhang, H. Research on heating method at low temperature of electric vehicle battery. Chin. J. Power Sources 2015, 39, 1645–1647, 1701. [Google Scholar]
- Xiong, R.; Sun, F.; Chen, Z.; He, H. A data-driven multi-scale extended Kalman filtering based parameter and state estimation approach of lithium-ion olymer battery in electric vehicles. Appl. Energy 2014, 113, 463–476. [Google Scholar] [CrossRef]
- Ji, Y.; Wang, C.Y. Heating strategies for Li-ion batteries operated from subzero temperatures. Electrochim. Acta 2013, 107, 664–674. [Google Scholar] [CrossRef]
- Zhao, X.W.; Zhang, G.Y.; Yang, L.; Qiang, J.X.; Chen, Z.Q. A new charging mode of Li-ion batteries with LiFePO4/C composites under low temperature. J. Therm. Anal. Calorim. 2011, 104, 561–567. [Google Scholar] [CrossRef]
- Ruan, H.; Jiang, J.; Sun, B.; Zhang, W.; Gao, W.; Wang, L.Y.; Ma, Z. A rapid low-temperature internal heating strategy with optimal frequency based on constant polarization voltage for lithium-ion batteries. Appl. Energy 2016, 177, 771–782. [Google Scholar] [CrossRef]
- Fan, J.; Tan, S. Studies on Charging Lithium-Ion Cells at Low Temperatures. J. Electrochem. Soc. 2006, 153, A1081–A1092. [Google Scholar] [CrossRef]
- Ouyang, M.; Chu, Z.; Lu, L.; Li, J.; Han, X.; Feng, X.; Liu, G. Low temperature aging mechanism identification and lithium deposition in a large format lithium iron phosphate battery for different charge profiles. J. Power Sources 2015, 286, 309–320. [Google Scholar] [CrossRef]
- Verma, P.; Maire, P.; Novák, P. A review of the features and analyses of the solid electrolyte interphase in Li-ion batteries. Electrochim. Acta 2010, 55, 6332–6341. [Google Scholar] [CrossRef]
- Vetter, J.; Novák, P.; Wagner, M.R.; Veit, C.; Möller, K.C.; Besenhard, J.O.; Winter, M.; Wohlfahrt-Mehrens, M.; Vogler, C.; Hammouche, A. Ageing mechanisms in lithium-ion batteries. J. Power Sources 2005, 147, 269–281. [Google Scholar] [CrossRef]
- Liu, G.; Ouyang, M.; Lu, L.; Li, J.; Han, X. Analysis of the heat generation of lithium-ion battery during charging and discharging considering different influencing factors. J. Therm. Anal. Calorim. 2014, 116, 1001–1010. [Google Scholar] [CrossRef]
- Viswanathan, V.V.; Choi, D.; Wang, D.; Xu, W.; Towne, S.; Williford, R.E.; Zhang, J.; Liu, J.; Yang, Z. Effect of entropy change of lithium intercalation in cathodes and anodes on Li-ion battery thermal management. J. Power Sources 2010, 195, 3720–3729. [Google Scholar] [CrossRef]
- Zhang, Y.; Xiong, R.; He, H.; Shen, W. Lithium-Ion Battery Pack State of Charge and State of Energy Estimation Algorithms Using a Hardware-in-the-Loop Validation. IEEE Trans. Power Electr. 2017, 32, 4421–4431. [Google Scholar] [CrossRef]
- Li, X.; Zhang, J.; Wei, Y.; Liu, Y.; Ding, S. Analysis of Specific Heat of Lithium-ion Power Battery. J. Mater. Sci. Eng. 2014, 32, 908–912. [Google Scholar]
- Ruan, H.; Jiang, J.; Sun, B.; Wu, N.; Shi, W.; Zhang, Y. Stepwise Segmented Charging Technique for Lithium-ion Battery to Induce Thermal Management by Low-Temperature Internal Heating. In Proceedings of the 2014 IEEE Conference and Expo Transportation Electrification Asia-Pacific (ITEC Asia-Pacific), Beijing, China, 31 August–3 September 2014. [Google Scholar]
- Hunt, G. Freedom CAR Battery Test Manual for Power-Assist Hybrid Electric Vehicles. In DOE/ID-11069; Idaho National Engineering & Environmental Laboratory: Idaho Falls, ID, USA, 2003. [Google Scholar]
- Wu, X.G.; Mei, Z.Y.; Hu, C.; Zhu, C.B.; Sun, J.L. Temperature Percormance Comparative Analysis of Different Power Batteries. In Proceedings of the 2016 IEEE Vehicle Power and Propulsion Conference (VPPC), Hangzhou, China, 17–20 October 2016. [Google Scholar]
- Sun, J.; Wei, G.; Pei, L.; Lu, R.; Song, K.; Wu, C.; Zhu, C. Online Internal Temperature Estimation for Lithium-Ion Batteries Based on Kalman Filter. Energies 2015, 8, 4400–4415. [Google Scholar] [CrossRef]
- Zhang, J.; Wu, B.; Li, Z.; Huang, J. Simultaneous estimation of thermal parameters for large-format laminated lithium-ion batteries. J. Power Sources 2014, 259, 106–116. [Google Scholar] [CrossRef]
- Ge, H.; Huang, J.; Zhang, J.; Li, Z. Temperature-Adaptive Alternating Current Preheating of Lithium-Ion Batteries with Lithium Deposition Prevention. J. Electrochem. Soc. 2016, 163, 290–299. [Google Scholar] [CrossRef]
- Chen, C.; Xiong, R.; Shen, W. A lithium-ion battery-in-the-loop approach to test and validate multi-scale dual H infinity filters for state of charge and capacity estimation. IEEE Trans. Power Electr. 2017, 99, 1. [Google Scholar] [CrossRef]
Figure 1.
Thevenin model

Figure 2.
Experimental set-up.

Figure 3.
The schematic of the HPPC test.

Figure 4.
The result of HPPC test at 25 °C.

Figure 5.
Battery internal resistance curves at different temperatures.

Figure 6.
Curves of battery open circuit voltage at different temperatures.

Figure 7.
Entropy coefficient for SOC = 50%.

Figure 8.
Entropy coefficient curve for varying SOCs.

Figure 9.
Curves of (a) battery temperature; (b) , when the battery cools down.

Figure 10.
Comparing the estimated temperature with the measured temperature at (a) 1 C; (b) 1.5 C; (c) 2 C discharge rates.
Figure 10.
Comparing the estimated temperature with the measured temperature at (a) 1 C; (b) 1.5 C; (c) 2 C discharge rates.

Figure 11.
Time required for heating the battery from ambient temperature to the target temperature at different discharge current rates.
Figure 11.
Time required for heating the battery from ambient temperature to the target temperature at different discharge current rates.

Figure 12.
Power consumption of the battery heated from ambient temperature to the target temperature at different discharge current rates.
Figure 12.
Power consumption of the battery heated from ambient temperature to the target temperature at different discharge current rates.


Table 1.
Battery parameters.
| Parameters | Symbol | Value |
|---|---|---|
| Mass | m | 45 g |
| Surface area | A | 4.287 × 10⁻³ m2 |
| Capacity | Q | 2.6 A∙h |
| Voltage | Vrate | 3.63 V |
| Upper cut-off voltage | Vup | 4.2 V |
| Lower cut-off voltage | Vlow | 2.75 V |
Table 2.
Equipment parameters.
| Arbin Battery Tester | Voltage range: 0 V–5 V Current range: 0 A–50 A Voltage accuracy: full-range ± 0.05% FSR Current accuracy: full-range ± 0.01% FSR Number of channels: 4 |
| Temperature Chamber | Temperature range: −50 °C~150 °C Temperature error:<0.5 °C Chamber volume: 0.5 m × 0.5 m × 0.6 m |
© 2017 by the authors. Licensee MDPI, Basel, Switzerland. This article is an open access article distributed under the terms and conditions of the Creative Commons Attribution (CC BY) license (http://creativecommons.org/licenses/by/4.0/).
Share and Cite
MDPI and ACS Style
Wu, X.; Chen, Z.; Wang, Z. Analysis of Low Temperature Preheating Effect Based on Battery Temperature-Rise Model. Energies 2017, 10, 1121. https://doi.org/10.3390/en10081121
AMA Style
Wu X, Chen Z, Wang Z. Analysis of Low Temperature Preheating Effect Based on Battery Temperature-Rise Model. Energies. 2017; 10(8):1121. https://doi.org/10.3390/en10081121
Chicago/Turabian StyleWu, Xiaogang, Zhe Chen, and Zhiyang Wang. 2017. "Analysis of Low Temperature Preheating Effect Based on Battery Temperature-Rise Model" Energies 10, no. 8: 1121. https://doi.org/10.3390/en10081121
Note that from the first issue of 2016, this journal uses article numbers instead of page numbers. See further details here.