Patient Monitoring by Abnormal Human Activity Recognition Based on CNN Architecture
by
 , ,
, ,
Malik Ali Gul
1,2 ,
,
Muhammad Haroon Yousaf
1,2 ,
,
Shah Nawaz
3,
Zaka Ur Rehman
4 and 
HyungWon Kim
5,* 1
Department of Computer Engineering, University of Engineering and Technology Taxila, Taxila 47080, Pakistan
2
Swarm Robotics Lab, National Centre for Robotics and Automation, Taxila 47050, Pakistan
3
Istituto Italiano di Tecnologia, 16163 Genova, Italy
4
Department of Computer Science and IT, Gujrat Campus, The University of Lahore, Gujrat, Punjab 50700, Pakistan
5
College of Electrical & Computer Engineering School of Electronics Engineering, Chungbuk National University, Seowon-Gu, Cheongju, Chungbuk 28644, Korea
*
Author to whom correspondence should be addressed.
Electronics 2020, 9(12), 1993; https://doi.org/10.3390/electronics9121993
Submission received: 24 October 2020
/
Revised: 14 November 2020
/
Accepted: 18 November 2020
/
Published: 24 November 2020
(This article belongs to the Special Issue Deep Learning Based Object Detection)
Abstract
:Human action recognition has emerged as a challenging research domain for video understanding and analysis. Subsequently, extensive research has been conducted to achieve the improved performance for recognition of human actions. Human activity recognition has various real time applications, such as patient monitoring in which patients are being monitored among a group of normal people and then identified based on their abnormal activities. Our goal is to render a multi class abnormal action detection in individuals as well as in groups from video sequences to differentiate multiple abnormal human actions. In this paper, You Look only Once (YOLO) network is utilized as a backbone CNN model. For training the CNN model, we constructed a large dataset of patient videos by labeling each frame with a set of patient actions and the patient’s positions. We retrained the back-bone CNN model with 23,040 labeled images of patient’s actions for 32 epochs. Across each frame, the proposed model allocated a unique confidence score and action label for video sequences by finding the recurrent action label. The present study shows that the accuracy of abnormal action recognition is 96.8%. Our proposed approach differentiated abnormal actions with improved F1-Score of 89.2% which is higher than state-of-the-art techniques. The results indicate that the proposed framework can be beneficial to hospitals and elder care homes for patient monitoring.
1. Introduction
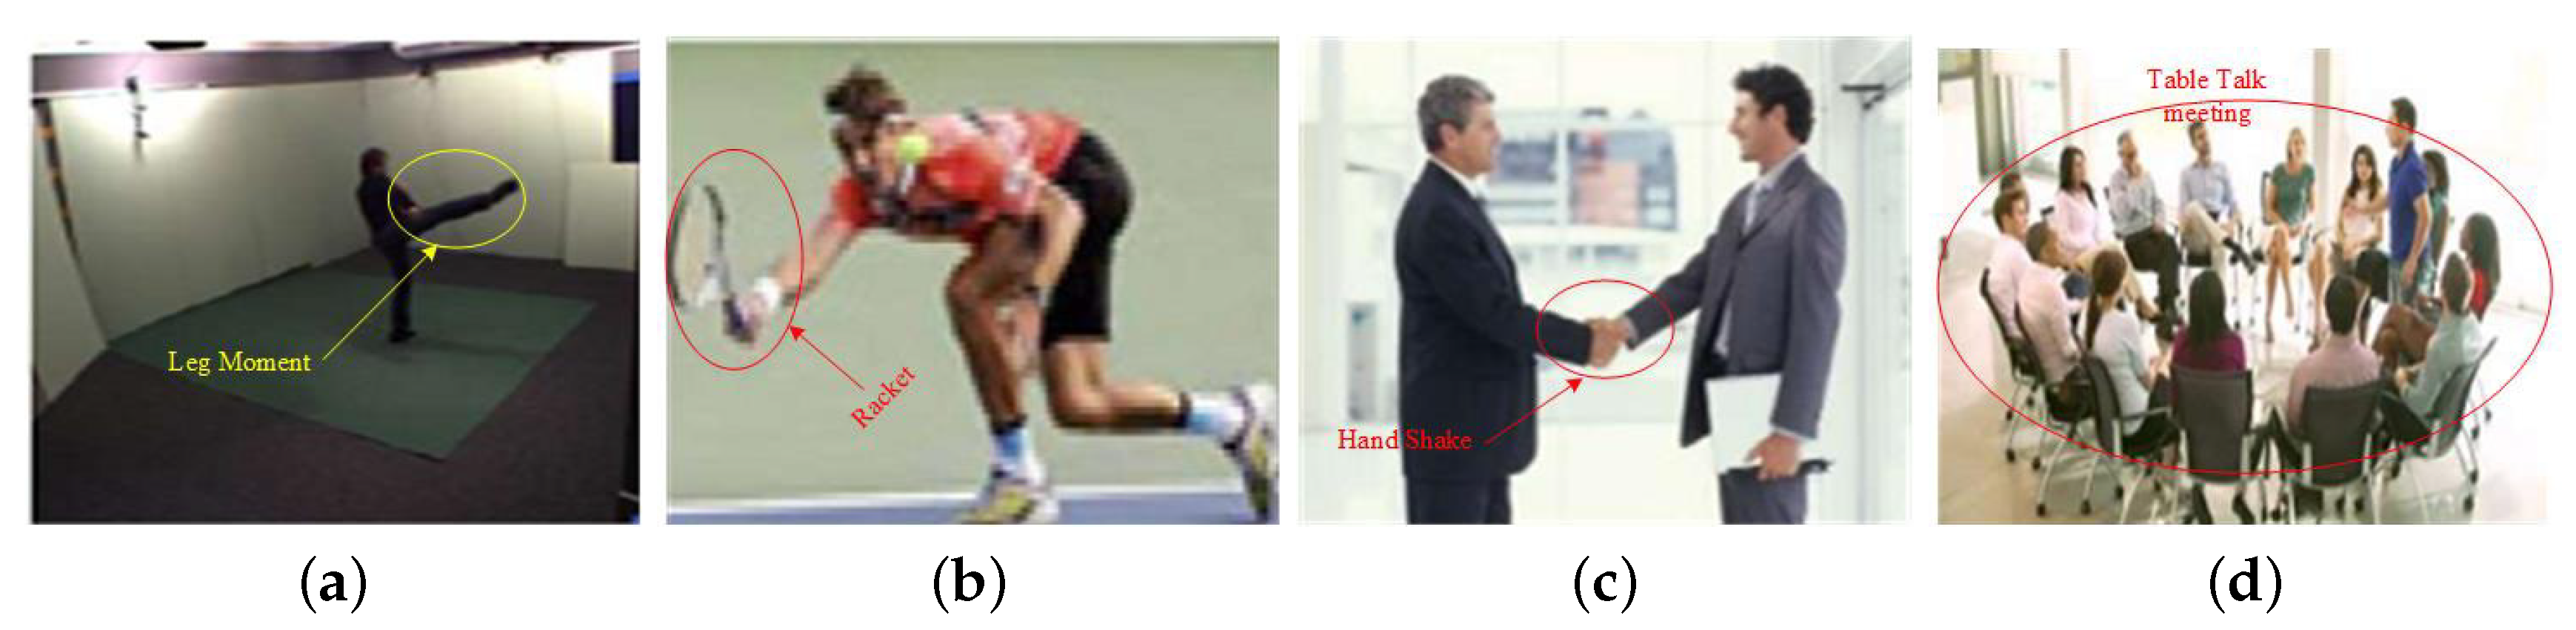
In recent years, action recognition has gained a lot of focus within the arena of video analysis technology [1]. Before digging into action recognition as a problem in computer vision, we first need to define what we mean when we talk about an action. There are several definitions of action offered in a recent survey by Herath et al. [2]. Examples of some actions could be playing with a racket, dialing the phone, eating, driving, sleeping, or writing a thesis, as shown in Figure 1.
Rapid advancement in smart gadgets and deep learning techniques have led recent growth in various applications for activity recognition. These techniques can be applied to numerous real-life, human-centric problems such as entertainment, surveillance and healthcare [3]. Many studies have been made in this domain, delivering efficient smart assistance support in the field of simple human action recognition activities. According to a recent survey [4], however, recognizing complex activities remains a great challenge, demanding further research. In contrast, with the ease of valuable information accessibility, the incentive to develop an activity recognition system for more challenging and application-oriented circumstances is increasing. Eliasz et al. [5] introduced a wearable based smart IoT device for recognition of sedentary behavior and cardiovascular risk measurement, but this technique is limited due to the necessity to acquire a wearable sensor and not being able to directly measure the heart attack issues. Recently, many computer vision and machine learning based approaches have emerged with the aim to develop improved human recognition models [3,4].
The classical activity recognition pipeline typically consists of the pre-processing, feature descriptor and extraction, and classification steps, while deep learning includes feature extraction and classification steps. With deep learning techniques, feature extraction and classification can also be performed in a single step [4]. In recent years, incredible progress has been achieved with deep learning. Furthermore, the core aspects of the attractiveness of deep learning are rapidly improving thanks to fast processing capabilities of modern computers and availability of larger datasets.
It has been proven that deep learning also provides effective solutions to a variety of problems such as natural language processing, robotics, computer vision, speech and audio processing, search engines, finance, video games and online advertising [6].
In recent years, Convolutional Neural Networks (CNN) [7] have been widely used by researchers in imaging classification problems. Due to the outstanding performance of CNN [8] in image classification and object detection, many researchers have started to deploy CNN for video classification with some modification [6]. Early approaches such as Region-based Convolutional Neural Network (R-CNN) use region proposal methods to first generate potential bounding boxes in an image and then run a classifier on these proposed boxes [9]. After classification, post-processing is used to refine the bounding boxes, eliminate duplicate detection, and re-score the boxes based on other objects in the scene [10]. These complex pipelines are slow and hard to optimize because each component must be trained separately. We re-frame object detection as a single regression problem, straight from image pixels to bounding box coordinates and class probabilities [11]. An abnormal activity in this work is elaborated as an activity that needs emergency medical assistance [6].
In our approach, an abnormal patient activity is classified as an activity that needs emergency medical assistance. There are eight abnormal activities in our dataset: backward fall, chest pain, coughing, faint, forward fall, headache, taking medicine, and vomiting. The main aim of this paper is to differentiate between multiple abnormal human activities. The main contributions of our work are as follows:
- We mplemented a CNN-based patient activity recognition algorithm.
- We applied a CNN object detector to patient activity recognition for the first time.
- We collected a large patient activity video dataset with ground truth labels.
- We found an efficient way of training the CNN with the collected patient video dataset for high accuracy.
- We obtained improved performance compared with previous work using extensive dataset.
YOLO is refreshingly simple, as shown in Figure 2. A single convolutional network simultaneously predicts multiple bounding boxes and class probabilities for those boxes. It trains on full images and directly optimizes detection performance [12]. This unified model has several benefits over traditional methods of object detection.
2. Literature Review
Action recognition is an extensively studied research area of computer vision with a large and rapidly growing amount of work on the topic available in the literature. A brief comparison is given in Table 1, which indicates that deep learning is preferable over the classical machine learning. A neural Network takes as input an image in the form of an array and then transforms it into feature maps by processing it through a sequence of convolutional layers that contain clusters of neurons whose output features are computed by a set of weights. The final layers of CNNs are usually fully connected layers, which compute prediction outputs such as class scores if the task is classification. A brief comparison of a few well-known CNNs for object detection is given in Table 2. While YOLO provides a lower mean average precision (mAP) of 63.4 (out of 100), it offers higher speed of 45 frames per second (FPS), which satisfies the real time requirement (30 frames per second) of our target patient monitoring system. In contrast, Faster R-CNN based on VGG 16 achieves a higher mAP of 73.2, but delivers a much lower speed of only 7 fps, which cannot satisfy the real time requirement of our target patient monitoring [13]. Therefore, we chose YOLO as the backbone model for our patient activity recognition system. In [14], the authors used a different approach to recognize the abnormal activities. R transform was used with the combination of principal component analysis and independent component analysis and then Hidden Markov Model was used further for activity recognition. In [15], the approach implemented R transform for feature extraction and then linear discriminant analysis to further recognize six elderly abnormal human activities: headache, vomit, faint, chest pain, backward fall and forward fall. Kernel discriminant technique was used for discrimination between lookalike activities.
In [16,17], a 3D extension of second convolutional neural networks (CNN) was introduced, where data are processed by 3D convolution consisting of area and time dimension. A 3D CNN was employed by Baccouche et al. [18], the results of which are then fed into a continual neural network for activity classification. In a more recent work, Tran et al. [19] also applied a 3D CNN, but with a deeper network to improve the performance of human activity recognition.
In [20], motion data were enclosed in a particular approach that provides a dense optical flow of the network at the input data. In addition, two streams of a network square measure are employed, one supporting classification for static video frames and the other supporting the optical flow. Alternative ways of fusing the spatial and temporal streams of networks are studied in [21].
The authors of [22] proposed an efficient human activity recognition system based on Recurrent Neural Network (RNN) that utilizes joint angles which are depicted in a spatiotemporal feature matrix. With these derived features, they trained RNN for human activity recognition model. For evaluation, they compared the performance of the RNN-based human activity recognition against Deep Belief Network (DBN)-based human activity recognition and the traditional HMM. For the test with 12 human activities, their model outperformed HMM- and DBN-based human activity recognition.
In [23], an LSTM model is used to characterize the action dynamics of individuals during a sequence and to aggregate person-level information for activity detection. The authors evaluated their model on two datasets: the Collective Activity Dataset and a replacement volleyball dataset.
In [24], a CNN with two streams is proposed, where spatial and temporal information is divided into different domains and then the CNN is trained using the UCF 101 dataset. It then combines the information in the end of the inference to check the results.
In [25], the YOLO model is used for training and testing on the LIRIS dataset consisting of 10 human activities. The model is trained selecting video frames that contain appropriate actions from the LIRIS dataset. For the recognition process, the authors selected thirty video frames that were used for the localization of action in testing procedure. After a certain number of frames, some frames are randomly chosen from the input video. Across each frame, the proposed model allocated a unique confidence score and action label (unique ID) for video sequences by finding a recurrent action label ID.
Although the latest video-based human activity recognition systems provide promising results, they suffer from deceptive performance problems that make it difficult for their real-world deployment. More specifically, we are faced with the following challenges:
- Activity recognition systems such as the video sequences are most often perceived from random camera viewpoints; therefore, the outputs of the system need to be invariant from heterogeneous camera viewpoints. However, modern procedures are based on constrained viewpoints, e.g., the person must be in a front-view (i.e., face the camera) or side-view. Multiple-camera-based methods have been proposed in the recent past to capture diverse view sequences that are ultimately combined to construct training data or to conduct self-adaptive calibration. However, these methods are regarded as impractical due to the high cost of multiple cameras.
- It remains as a great challenge to handle obstruction such as human-to-human, body part-to-body part, and human-to-object obstructions and occlusions.
- The most crucial challenge is differentiation between human activities. Discriminating between different abnormal activities is increasingly difficult as there are similarities in many target activities.
To address the above challenges, in this paper, we propose an approach that can distinguish patient’s activities from similar activities with invariance to camera viewpoint using a single camera. From evaluation of various recent CNN detector models, we chose YOLO due to its fast speed to satisfy the real time requirement of our target patient monitoring system.
As in [25], we retrained the YOLO model using our LIRIS dataset consisting of 10 human activities.
3. Proposed Approach
3.1. Overall Flow
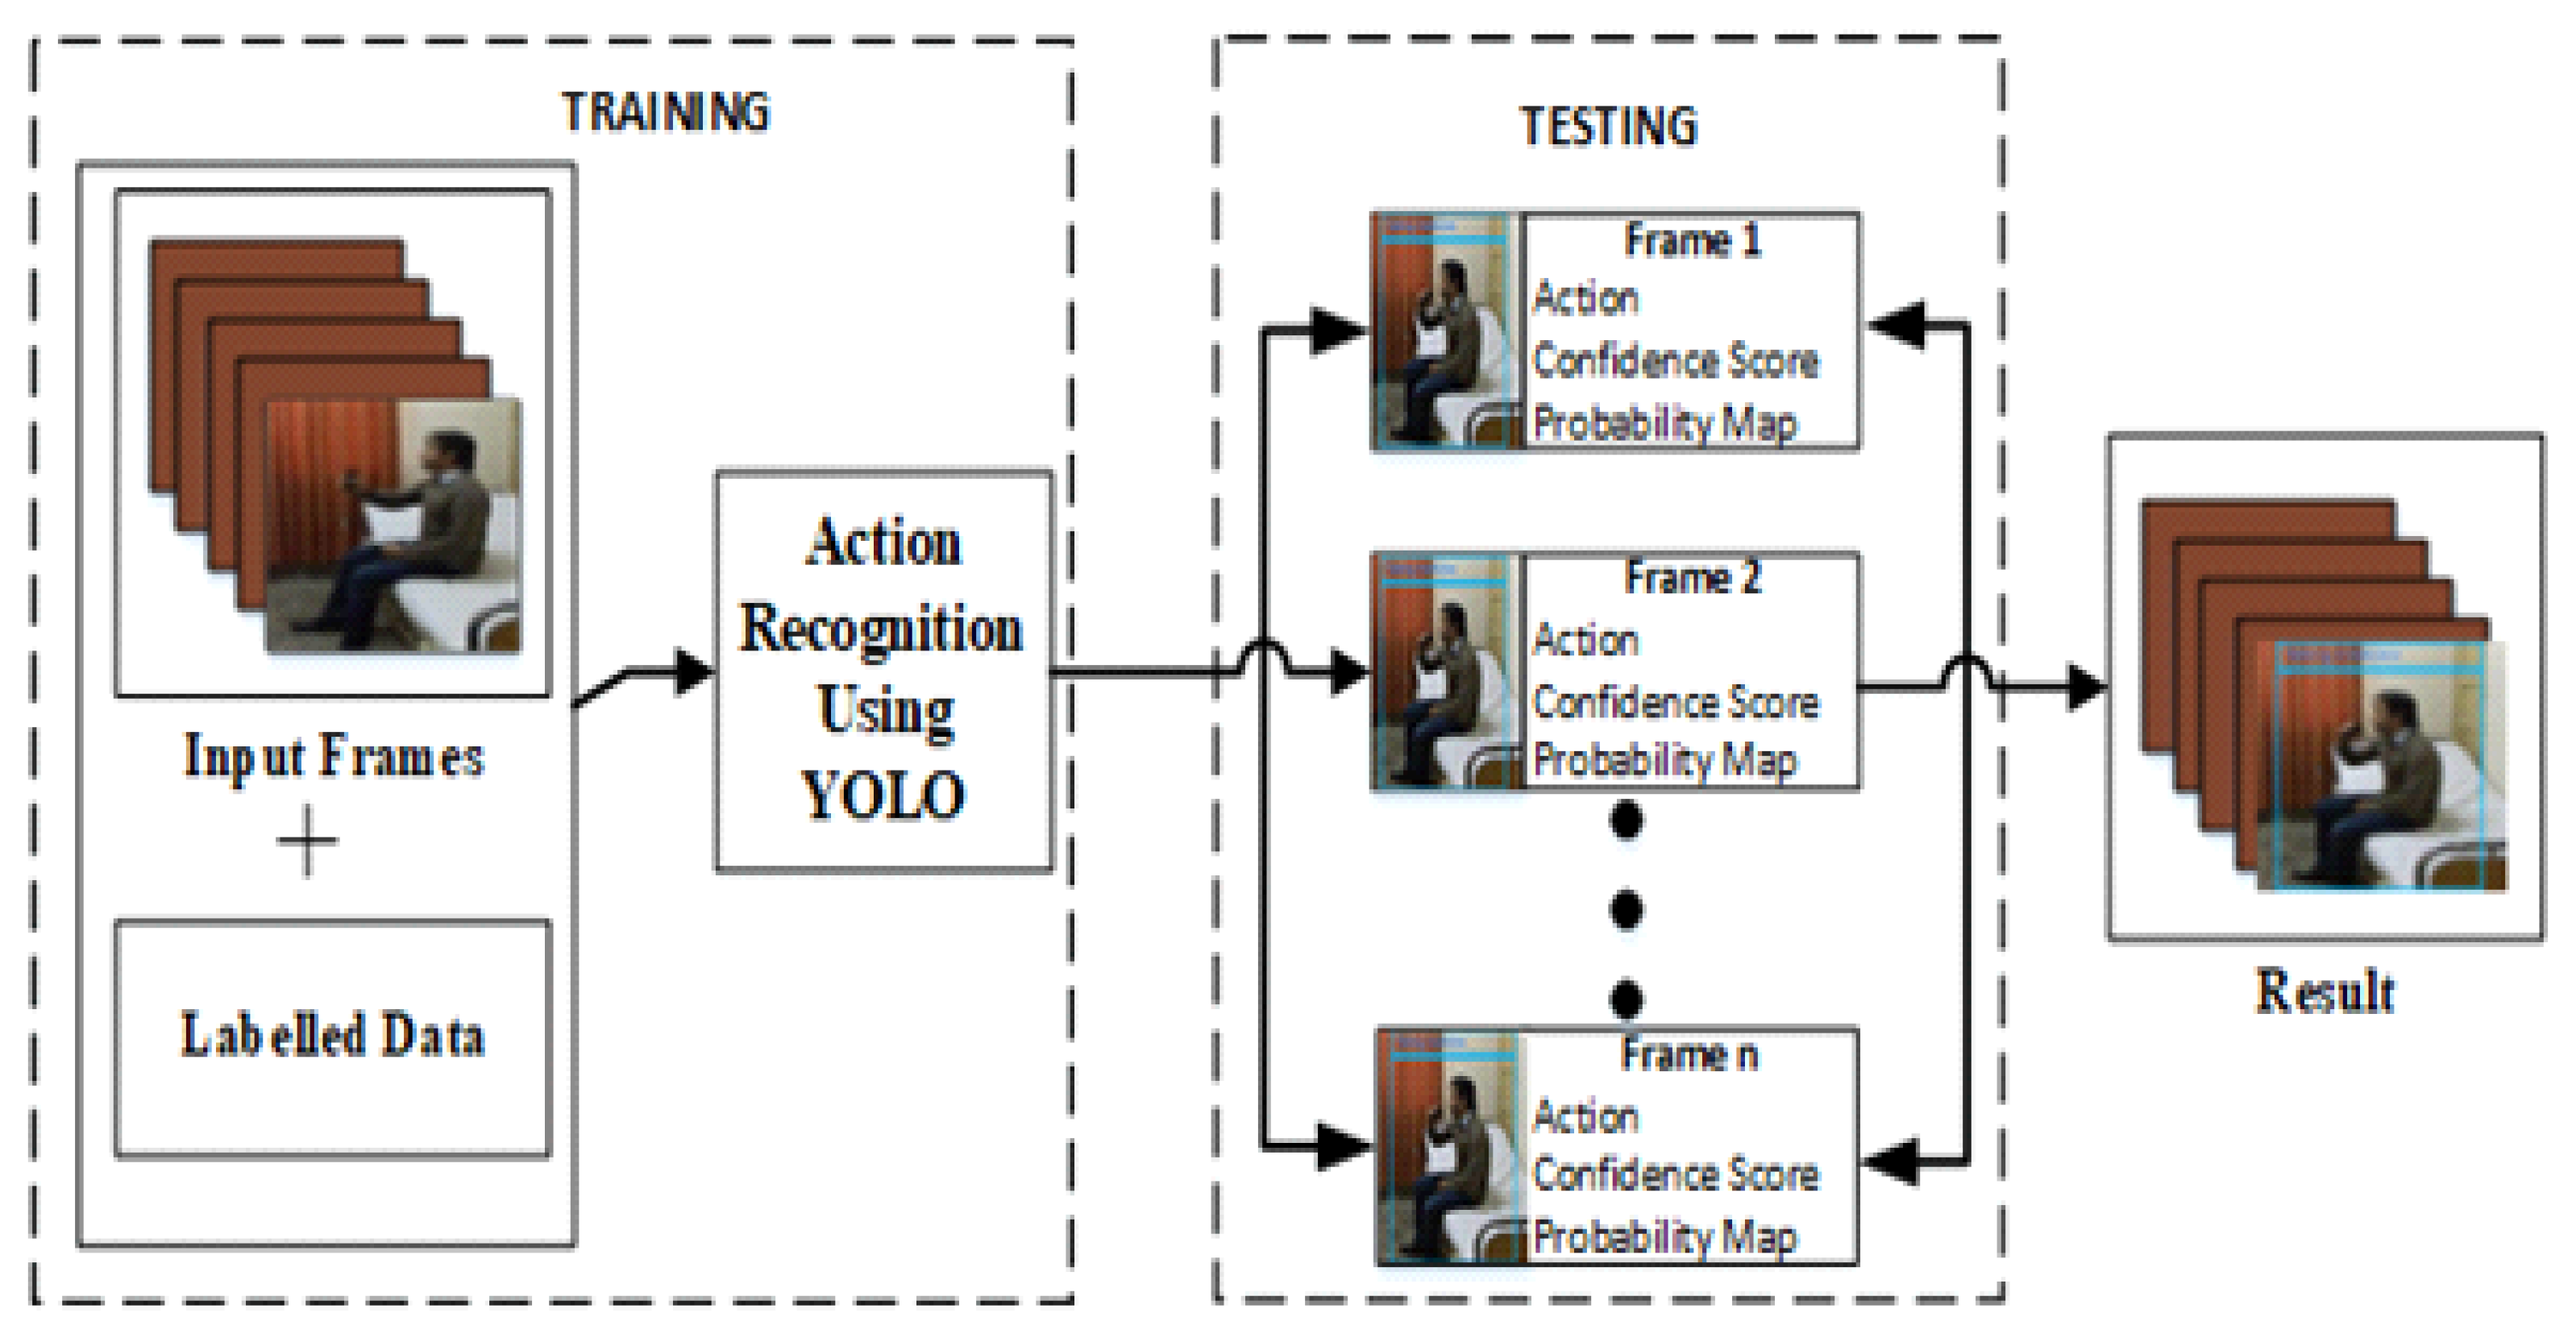
The proposed methodology workflow is given in Figure 3. YOLO [26] is employed. For the training step, we constructed a custom training dataset specifically consisting of a large set of abnormal activity images and various normal images. For the current work, we selected eight abnormal activity classes.
We divided each video into segments of 30 frames, which are manually labeled as one of the eight classes. We split the labeled dataset into training dataset and test dataset. The second step is conducting the classification prediction for each input video segment with the trained CNN model. Then, in the third step, confidence score and prediction scores along these frames are calculated based on IOU (Intersection over Union) for all the classes. In the final step, the evaluation parameters such as accuracy, precision, and recall are computed to judge the performance of the patient’s activity recognition system based on the sequence of input video segments.
3.2. Back-Bone CNN Model
In the second step of Figure 2, the CNN model in our current implementation is based on the YOLO model. The primary structure and operations of the YOLO model are described below.
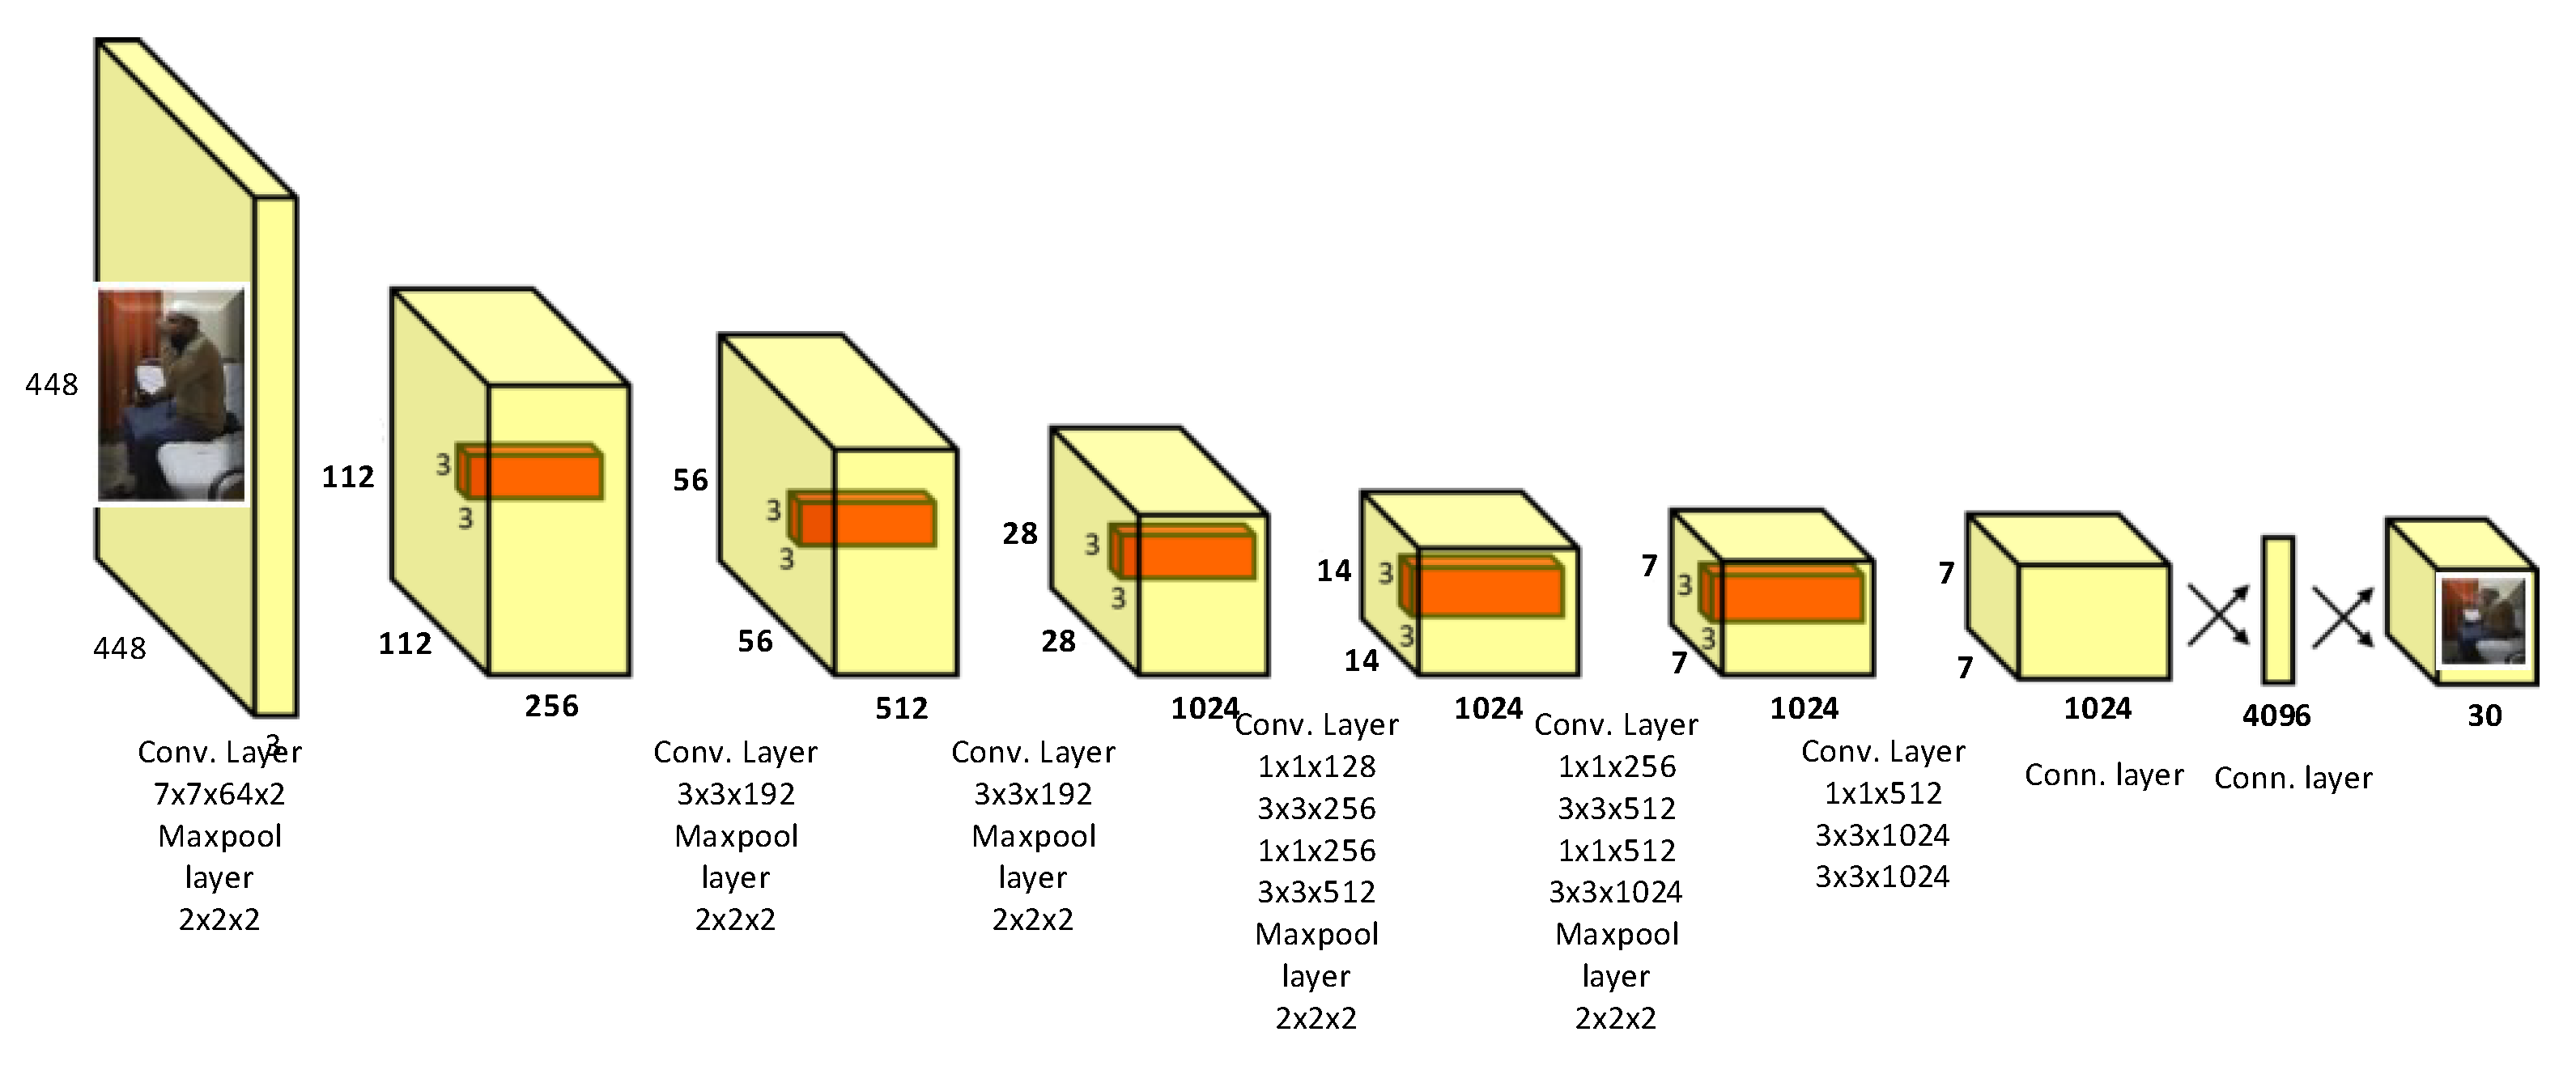
The YOLO model is motivated by the GoogleNet model for image classification and positional regression of objects. As with most CNN models, the convolutional layers of YOLO extract optimized features from the input image, while its fully connected layers predict the resultant coordinates and probabilities of the objects. YOLO network architecture consists of 24 convolutional layers and 2 fully connected layers. The CNN model conducts the object detection in the following steps.
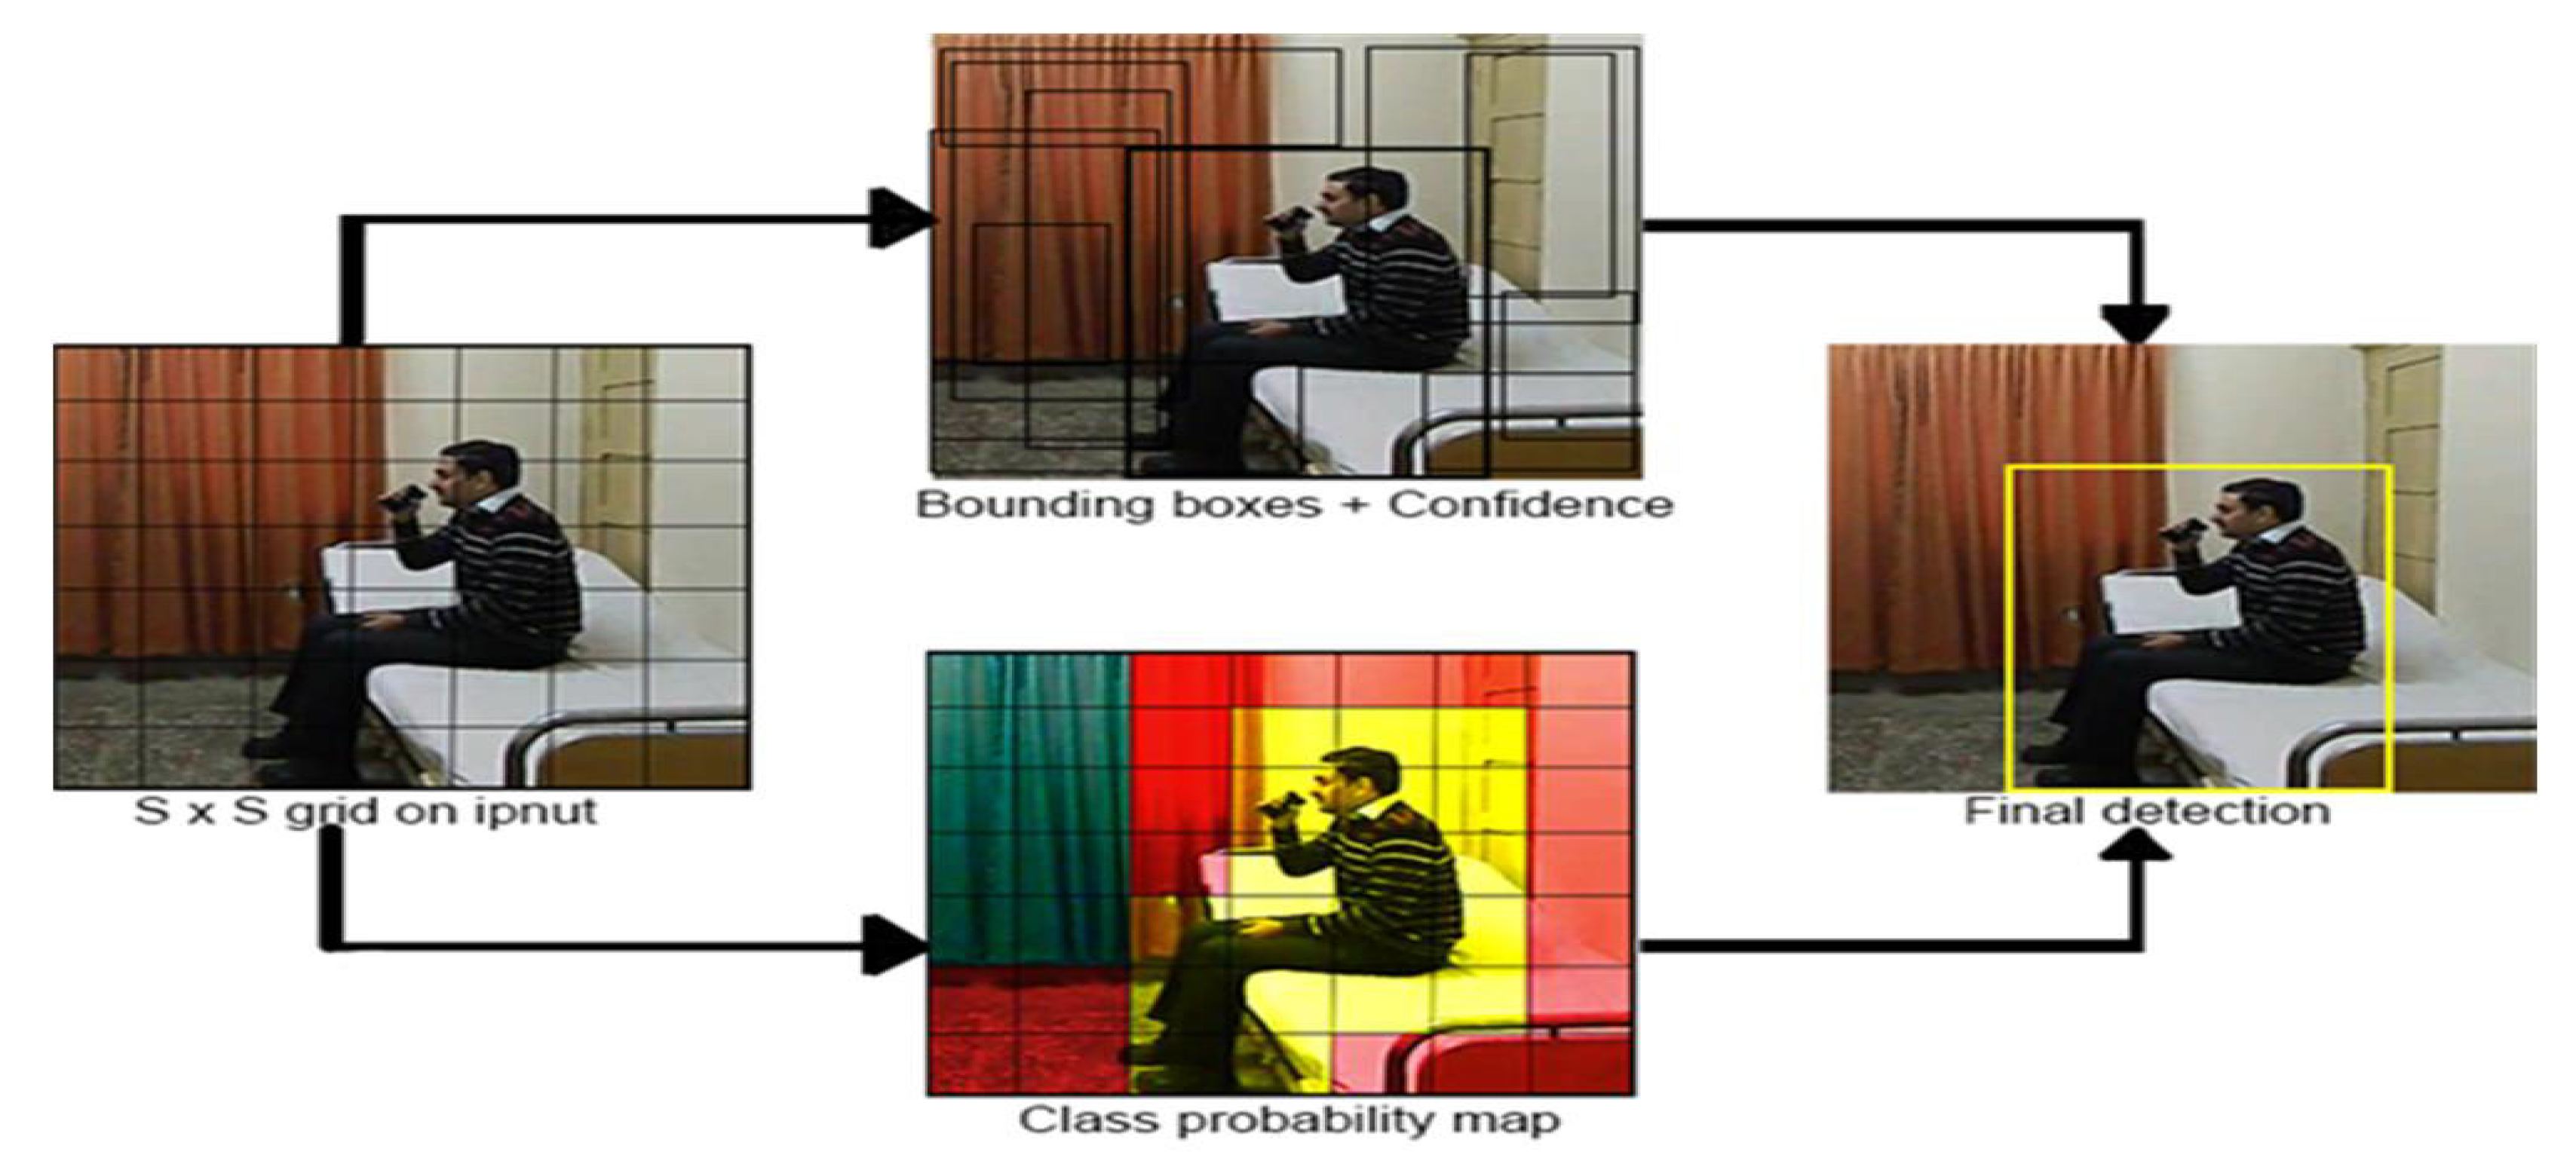
- CNN takes an image as an input and divides it into random grid cells. In the patch of input image that belongs to one of the grid cells, when the midpoint of an object falls into that grid cell, that object is detected.
- Each grid cell calculates B bounding boxes and C confidence score parameters against these boxes shown in Figure 4.
- CNN produces predicted outputs in tensor form for each grid cell.
- Each tensor provides information regarding Bounding box’s Coordinates (x, y).
- Probability distribution is calculated across all classes in the system during training. Moreover, a threshold is applied to these computed confidence scores (probability), which eradicates class labels with scores lower than the threshold.
- The confidence scores are used to judge the model accuracy. The confidence score is zero in the case of no object detection. When an object is detected, the confidence score is equivalent to the intersection over union (IOU) between the ground truth and predicted box.
In the case of YOLO model, there are five predictions involved in each bounding box: x, y, w, h, and confidence score. Here, the (x, y) coordinates indicate the center of the box, while w and h represent the width and height of the box. Each grid cell forecasts C conditional class probabilities given by . It calculates only one group of class probabilities per grid cell, regardless of the quantity of boxes B in the cell. As shown in Equation (1), the conditional class probabilities and the distinct box confidence predictions are multiplied as the confidence scores.
Hence, on each box, we can acquire class-specific confidence scores values. These scores are further investigated together with two factors i.e., the probability of the class prediction and how precisely the predicted box fits the object’s boundary. The confidence scores are used both in the back propagation of loss functions in the training process and in the accuracy evaluation in the test process.
3.3. Dataset
Publicly available online datasets relevant to human activities are as follows:
- KTH dataset [27] consists of periodic actions: running, jogging, etc.
- UCF101 and CASIA [27] datasets consist of humans interacting with objects and human-to-human interactions.
- The are specific actions in multimedia such as YouTube and Daily Motion videos in the UCF YouTube and Google Ava datasets [28].
- MSRC-12 [29] is a RGB-D video dataset covering depth information.
However, no existing datasets provide the patient activity classes that we can use for training and testing our patient monitoring system. Therefore, to accurately evaluate of our proposed approach, we created our own dataset of abnormal patient activities, as summarized in Table 3.
The dataset was acquired with the help of eight volunteers who performed eight different kinds of activities three times. Each video sequence is 4–5 s long. The dataset is organized into two different partition ratios. In Data Partition 1, 60% of the overall dataset is selected for training and 40% for testing. In Data Partition 2, 70% of the overall dataset is selected for training and 30% for testing.
Labeling
For labeling our dataset, an annotation tool called VoTT (Visual Object Tagging Tool) [30] was used. The labels were added to each image of the video dataset in the form of a bounding box around the patient and the class ID of the activity, which are shown in Figure 5.
The format of label consists of the following five parameters:
- Class ID for the patient activity
- Box x-axis ratio
- Box y-axis ratio
- Box width ratio
- Box height ratio
As the frame rate to construct the labeled dataset, we chose 30 frames per second, which is considered to meet the requirement of real time video. We retrained the pre-trained CNN model using our patient dataset of 23,040 frames (see Table 3).
3.4. Testing
For testing purpose, we first tested 40% and then 30% of the overall dataset for classification and localization of actions. Along with each grid cell in a frame, B bounding boxes and C confidence score were calculated. Finally, these confidence scores were used as the parameters to evaluate the detection results.
However, in the cell with no object detected, the confidence score is zero. Otherwise, the confidence score is calculated by the intersection over union (IOU) phenomenon between the predicted box and the ground truth value. The test procedure selects the frame if the confidence is non-zero, and discards the frame otherwise. Then, it calculates the performance by checking the classification results in the selected frames. Some of the visual results of assigned labels are given in Figure 6.
4. Implementation and Test Set Up
This section describes the implementation of the proposed patient monitoring system and test set up for performance evaluation of activity recognition.
4.1. Implementation Details
The following summarizes the specifications of the computer machine used for the training and testing of the proposed patient monitoring system.
- OS:
- Windows 10 (64 bit)
- CPU:
- Intel(R) 3rd Generation Core (TM) i5-3470 CPU @ 3.20 GHz @ 3.20 GHz
- CPU RAM:
- 16 GB
- CGPU:
- Titan XP
- Graphics card Ram size:
- 12 GB
We implemented the proposed patient monitoring system using C program with CUDA 8.0, cuDNN 7.0, OpenCV 3.0. We integrated the darknet of YOLO [30] as a back-bone model in the form of C and CUDA code.
4.2. Performance Metrics
For the performance evaluation of our proposed method, we computed the confusion matrix. Confusion matrix [31] is an efficient performance evaluation tool as well as useful for computing other performance metrics.
- Precision:
- Recall:
- F1 Score:
- It is the harmonic mean (mathematical expression) of recall and precision, and it can be calculated using Equation (4)
- Accuracy:
- The ratio of the number of components that are truly classified (TP or TN) with respect to the total number of components that are TP, TN, FP, or FN. The mathematical expression is shown in Equation (5).
5. Performance Evaluation
5.1. Training and Testing
For training and testing, we partitioned the dataset into 60:40 and 70:30 ratios, which are common partition ratios used by Luhach et al. [34]. Performance was evaluated on the confusion matrix and then recall, accuracy, precision, and accuracy. For the selection of data partition ratio, the Intersection over Union (IOU) was computed [35], then the recall against them, and finally the trained weights were selected.
We stopped training at 20,000 iterations when the loss was no longer decreasing. Videos were working at 45 FPS. For the first partition ratio, IOU was 95.7%, and for the second partition ratio it was 96.8%. Then, we determined whether to accept or reject the frames based on IOU. Frames with the IOU greater than a threshold of 0.5 were considered further for classification, while the frames below this threshold were discarded as failed detection.
Table 4 presents a confusion matrix for our custom dataset. We trained 60% of the data in the training and 40% for the testing. Our dataset was constructed from 192 patient videos consisting of 23,040 frames in total.
Thus, for the case of dataset partition with 60:40, we used 13,824 frames from 115 videos for training, while using 9216 frames from 77 videos for testing. Similarly, for the case of dataset partition with 70:30, we trained the CNN model using 70% of the dataset while testing the model using 30%, as summarized in Table 5.
5.2. Comparison with Previous Work
As analyzed from the results of Table 6, the performance of activities having similarities in their actions such as forward fall, headache, and chest pain is affected by each other and consequently results in lower performance. Similarly, backward fall and faint affected each other, resulting in relatively lower performance. Activities such as taking medicine, backward fall, and vomiting show remarkable performance as these activities differ in terms of action appearance from others.
To further improve the performance, we employed the dataset with the partition ratio of 70:30 (70% of data for training and 30% for testing) as the results in Table 5 exhibits higher performance than those in Table 4. Compared with the dataset partition of 60:40, the results in Table 4, on the dataset partition of 70:30, show higher recall by 3.15%, accuracy by 1.03%, precision by 3.68%, and F1-score by 3.61%. This indicates that a small increase in the training dataset (from 60% to 70%) provides a substantial improvement in all performance metrics.
Next, we compared our performance with the state-of-the-art [25], although Shinde et al. [25] employed the LIRIS dataset contains different activities from our patient dataset. The LIRIS dataset consists of handshaking, picking an item, giving an item to another person, typing, talking, leaving and entering the room. The results of both batches were compared with the results of Shinde et al. [25]. Whereas our performance with the dataset partition of 60:40 are close to the results of Shinde et al. [25], our performance with the dataset partition of 70:30 outperforms that of Shinde et al. [25]. In detail, for the latter case, the recall was improved by 0.338%, while the precision was improved by 0.253% and the F1-Score by 0.911% compared with the results in [25]. The above comparison with the state-of-the-art [25] is summarized in Table 8.
5.3. Limitations and Future Work
The YOLO model executes strong spatial constraints for the prediction of the bounding box as two boxes are predicted in a single grid cell with a single class [26]. Due to its spatial constraints, however, it imposes limitation on the number of objects that the model can predict. Therefore, the model struggles with objects overlapped in groups and small objects. In this paper, however, we are concerned with patient videos with large objects and single objects only. We plan to extend the proposed patient monitoring system to handle small objects and multiple objects in the future.
6. Conclusions
The foremost contribution of this research is the development of a high-speed recognizing algorithm and making a custom dataset of abnormal human activities for patient monitoring. For fast and easy computation, frames are processed independently at the desired rate by ignoring the temporal redundancy and we chose YOLO as the back-bone CNN model implementation of the YOLO framework for abnormal human activity recognition to meet the requirement of real-time computation. YOLO uses a single CNN simultaneously for classification as well as for localization of the object instead of using different neural networks methods to first classify and then localize it. The proposed system when implemented using the computer machines specified above can process the patient images at a speed of 40–90 frames per second, which is faster than the previous method [26]. As a result, the improved performance has been achieved with minimum latency. A comparison with the state-of-the-art method is given in Table 8.
This work was demonstrated on video datasets with individual subjects present in the field view of the camera. This assumption limits the scope of real-world application of the work, where multiple human subjects may appear in a single scene. An interesting area of future work is to incorporate extension of action recognition and activity modeling for multiple individuals. The incorporation of multiple human subjects would also lead to a new direction of research that would study the interaction between people and help to analyze group behavior.
Author Contributions
The authors contributed equally to this work. All authors have read and agreed to the published version of the manuscript.
Funding
This work was supported by IITP grant (No.2020-0-01304), Development of Self-learnable Mobile Recursive Neural Network Processor Technology Project, and also supported by Korea Institute for Advancement of Technology (KIAT) grant funded by the Korea Government (MOTIE) (N0001883, The Competency Development Program for Industry Specialist). It was also funded by the Basic Science Research Program through the National Research Foundation of Korea (NRF).
Acknowledgments
The authors are thankful to Directorate of Advance Studies, Research and Technological Development (ASRTD) of UET Taxila for their continuous support for this project.
Conflicts of Interest
The authors declare no conflict of interest
References
- Vähäsantanen, K.; Hökkä, P.; Paloniemi, S.; Herranen, S.; Eteläpelto, A. Professional learning and agency in an identity coaching programme. Prof. Dev. Educ. 2017, 43, 514–536. [Google Scholar] [CrossRef]
- Herath, S.; Harandi, M.; Porikli, F. Going deeper into action recognition: A survey. Image Vis. Comput. 2017, 60, 4–21. [Google Scholar] [CrossRef] [Green Version]
- Bengio, Y. Deep learning of representations: Looking forward. In International Conference on Statistical Language and Speech Processing; Springer: Berlin/Heidelberg, Germany, 2013; pp. 1–37. [Google Scholar]
- Szegedy, C.; Liu, W.; Jia, Y.; Sermanet, P.; Reed, S.; Anguelov, D.; Erhan, D.; Vanhoucke, V.; Rabinovich, A. Going deeper with convolutions. In Proceedings of the IEEE Conference on Computer Vision and Pattern Recognition, Boston, MA, USA, 7–12 June 2015; pp. 1–9. [Google Scholar]
- Kańtoch, E. Recognition of sedentary behavior by machine learning analysis of wearable sensors during activities of daily living for telemedical assessment of cardiovascular risk. Sensors 2018, 18, 3219. [Google Scholar] [CrossRef] [PubMed] [Green Version]
- Abu-El-Haija, S.; Kothari, N.; Lee, J.; Natsev, P.; Toderici, G.; Varadarajan, B.; Vijayanarasimhan, S. Youtube-8m: A large-scale video classification benchmark. arXiv 2016, arXiv:1609.08675. [Google Scholar]
- Li, Q.; Cai, W.; Wang, X.; Zhou, Y.; Feng, D.D.; Chen, M. Medical image classification with convolutional neural network. In Proceedings of the IEEE 2014 13th International Conference on Control Automation Robotics & Vision (ICARCV), Singapore, 10–12 December 2014; pp. 844–848. [Google Scholar]
- Gu, J.; Wang, Z.; Kuen, J.; Ma, L.; Shahroudy, A.; Shuai, B.; Liu, T.; Wang, X.; Wang, G.; Cai, J.; et al. Recent advances in convolutional neural networks. Pattern Recognit. 2018, 77, 354–377. [Google Scholar] [CrossRef] [Green Version]
- Zhong, Z.; Sun, L.; Huo, Q. Improved localization accuracy by LocNet for Faster R-CNN based text detection in natural scene images. Pattern Recognit. 2019, 96, 106986. [Google Scholar] [CrossRef]
- Girshick, R.; Donahue, J.; Darrell, T.; Malik, J. Rich feature hierarchies for accurate object detection and semantic segmentation. In Proceedings of the IEEE Conference on Computer Vision and Pattern Recognition, Columbus, OH, USA, 23–28 June 2014; pp. 580–587. [Google Scholar]
- Li, K.; Wan, G.; Cheng, G.; Meng, L.; Han, J. Object detection in optical remote sensing images: A survey and a new benchmark. ISPRS J. Photogramm. Remote Sens. 2020, 159, 296–307. [Google Scholar] [CrossRef]
- Rastogi, A.; Ryuh, B.S. Teat detection algorithm: YOLO vs. Haar-cascade. J. Mech. Sci. Technol. 2019, 33, 1869–1874. [Google Scholar] [CrossRef]
- Redmon, J.; Santosh Kumar Divvala, R.B.G.; Farhadi, A. You Only Look Once: Unified, Real-Time Object Detection. CoRR 2015. [Google Scholar] [CrossRef] [Green Version]
- Arifoglu, D.; Bouchachia, A. Activity recognition and abnormal behaviour detection with recurrent neural networks. Procedia Comput. Sci. 2017, 110, 86–93. [Google Scholar] [CrossRef]
- Khan, Z.A.; Sohn, W. Abnormal human activity recognition system based on R-transform and kernel discriminant technique for elderly home care. IEEE Trans. Consum. Electron. 2011, 57, 1843–1850. [Google Scholar] [CrossRef]
- Ji, S.; Xu, W.; Yang, M.; Yu, K. 3D convolutional neural networks for human action recognition. IEEE Trans. Pattern Anal. Mach. Intell. 2012, 35, 221–231. [Google Scholar] [CrossRef] [PubMed] [Green Version]
- Lapeyre, C.J.; Misdariis, A.; Cazard, N.; Veynante, D.; Poinsot, T. Training convolutional neural networks to estimate turbulent sub-grid scale reaction rates. Combust. Flame 2019, 203, 255–264. [Google Scholar] [CrossRef] [Green Version]
- Baccouche, M.; Mamalet, F.; Wolf, C.; Garcia, C.; Baskurt, A. Sequential deep learning for human action recognition. In International Workshop on Human Behavior Understanding; Springer: Berlin/Heidelberg, Germany, 2011; pp. 29–39. [Google Scholar]
- Tran, D.; Bourdev, L.; Fergus, R.; Torresani, L.; Paluri, M. Learning spatiotemporal features with 3d convolutional networks. In Proceedings of the IEEE International Conference on Computer Vision, Santiago, Chile, 7–13 December 2015; pp. 4489–4497. [Google Scholar]
- Chatfield, K.; Simonyan, K.; Vedaldi, A.; Zisserman, A. Return of the devil in the details: Delving deep into convolutional nets. arXiv 2014, arXiv:1405.3531. [Google Scholar]
- Feichtenhofer, C.; Pinz, A.; Zisserman, A. Convolutional two-stream network fusion for video action recognition. In Proceedings of the IEEE Conference on Computer Vision and Pattern Recognition, Las Vegas, NV, USA, 27–30 June 2016; pp. 1933–1941. [Google Scholar]
- Park, S.; Park, J.; Al-Masni, M.; Al-Antari, M.; Uddin, M.Z.; Kim, T. A depth camera-based human activity recognition via deep learning recurrent neural network for health and social care services. Procedia Comput. Sci. 2016, 100, 78–84. [Google Scholar] [CrossRef] [Green Version]
- Ibrahim, M.S.; Muralidharan, S.; Deng, Z.; Vahdat, A.; Mori, G. A hierarchical deep temporal model for group activity recognition. In Proceedings of the IEEE Conference on Computer Vision and Pattern Recognition, Las Vegas, NV, USA, 27–30 June 2016; pp. 1971–1980. [Google Scholar]
- Han, C.; Mei, E.; Wang, C. YOLO-based Adaptive Window Two-stream Convolutional Neural Network for Video Classification. 2017. Available online: http://cs231n.stanford.edu/reports/2017/pdfs/707.pdf (accessed on 18 November 2020).
- Shinde, S.; Kothari, A.; Gupta, V. YOLO based human action recognition and localization. Procedia Comput. Sci. 2018, 133, 831–838. [Google Scholar] [CrossRef]
- Redmon, J.; Divvala, S.; Girshick, R.; Farhadi, A. You only look once: Unified, real-time object detection. In Proceedings of the IEEE Conference on Computer Vision and Pattern Recognition, Las Vegas, NV, USA, 27–30 June 2016; pp. 779–788. [Google Scholar]
- Schuldt, C.; Laptev, I.; Caputo, B. Recognizing human actions: A local SVM approach. In Proceedings of the IEEE 17th International Conference on Pattern Recognition (ICPR), Cambridge, UK, 26 August 2004; Volume 3, pp. 32–36. [Google Scholar]
- Rodriguez, M.D.; Ahmed, J.; Shah, M. Action mach a spatio-temporal maximum average correlation height filter for action recognition. In Proceedings of the 2008 IEEE Conference on Computer Vision and Pattern Recognition, Anchorage, AK, USA, 23–28 June 2008; pp. 1–8. [Google Scholar]
- Yang, Q.; Wang, L.; Ahuja, N. Graph-Structured Referring Expression Reasoning in The Wild. In Proceedings of the 2020 IEEE Conference on Computer Vision and Pattern Recognition (CVPR), Seattle, WA, USA, 16–18 June 2020. [Google Scholar]
- Chen, R.C. Automatic License Plate Recognition via sliding-window darknet-YOLO deep learning. Image Vis. Comput. 2019, 87, 47–56. [Google Scholar]
- Jeyaraj, P.R.; Nadar, E.R.S. Computer-assisted medical image classification for early diagnosis of oral cancer employing deep learning algorithm. J. Cancer Res. Clin. Oncol. 2019, 145, 829–837. [Google Scholar] [CrossRef] [PubMed]
- Ho, D.S.W.; Schierding, W.; Wake, M.; Saffery, R.; O’Sullivan, J. Machine learning SNP based prediction for precision medicine. Front. Genet. 2019, 10, 267. [Google Scholar] [CrossRef] [PubMed] [Green Version]
- Davis, J.; Goadrich, M. The relationship between Precision-Recall and ROC curves. In Proceedings of the 23rd International Conference on Machine Learning, Pittsburgh, PA, USA, 25–29 June 2006; pp. 233–240. [Google Scholar]
- Luhach, A.K.; Jat, D.S.; Hawari, K.B.G.; Gao, X.Z.; Lingras, P. Advanced Informatics for Computing Research: Third International Conference, ICAICR 2019, Shimla, India, 15–16 June 2019; Revised Selected Papers; Springer Nature: Berlin/Heidelberg, Germany, 2019; Volume 1075. [Google Scholar]
- Chen, H.; Zhang, K.; Lyu, P.; Li, H.; Zhang, L.; Wu, J.; Lee, C.H. A deep learning approach to automatic teeth detection and numbering based on object detection in dental periapical films. Sci. Rep. 2019, 9, 1–11. [Google Scholar] [CrossRef] [PubMed] [Green Version]
- Dinov, I.D. Model Performance Assessment. In Data Science and Predictive Analytics; Springer: Berlin/Heidelberg, Germany, 2018; pp. 475–496. [Google Scholar]
Figure 1.
Different human activities based on labels: (a) gymnast actions; (b) a man playing with bat; (c) human-to-human interaction; and (d) a group of people writing a thesis.
Figure 1.
Different human activities based on labels: (a) gymnast actions; (b) a man playing with bat; (c) human-to-human interaction; and (d) a group of people writing a thesis.

Figure 2.
Overall flow of the proposed approach.

Figure 3.
The representation of the entire proposed pipeline of our approach. It is divided into two main phases: training and testing.
Figure 3.
The representation of the entire proposed pipeline of our approach. It is divided into two main phases: training and testing.

Figure 4.
The system model divides the image into an grid size and along with each grid cell B bounding boxes are predicted with confidence across those boxes, as well as C class probabilities. Thus, in this research, YOLO is used for activity recognition mainly on a customized dataset and is configured in a way that YOLO, which is typically used for detection, can be used for both detection and recognition of actions.

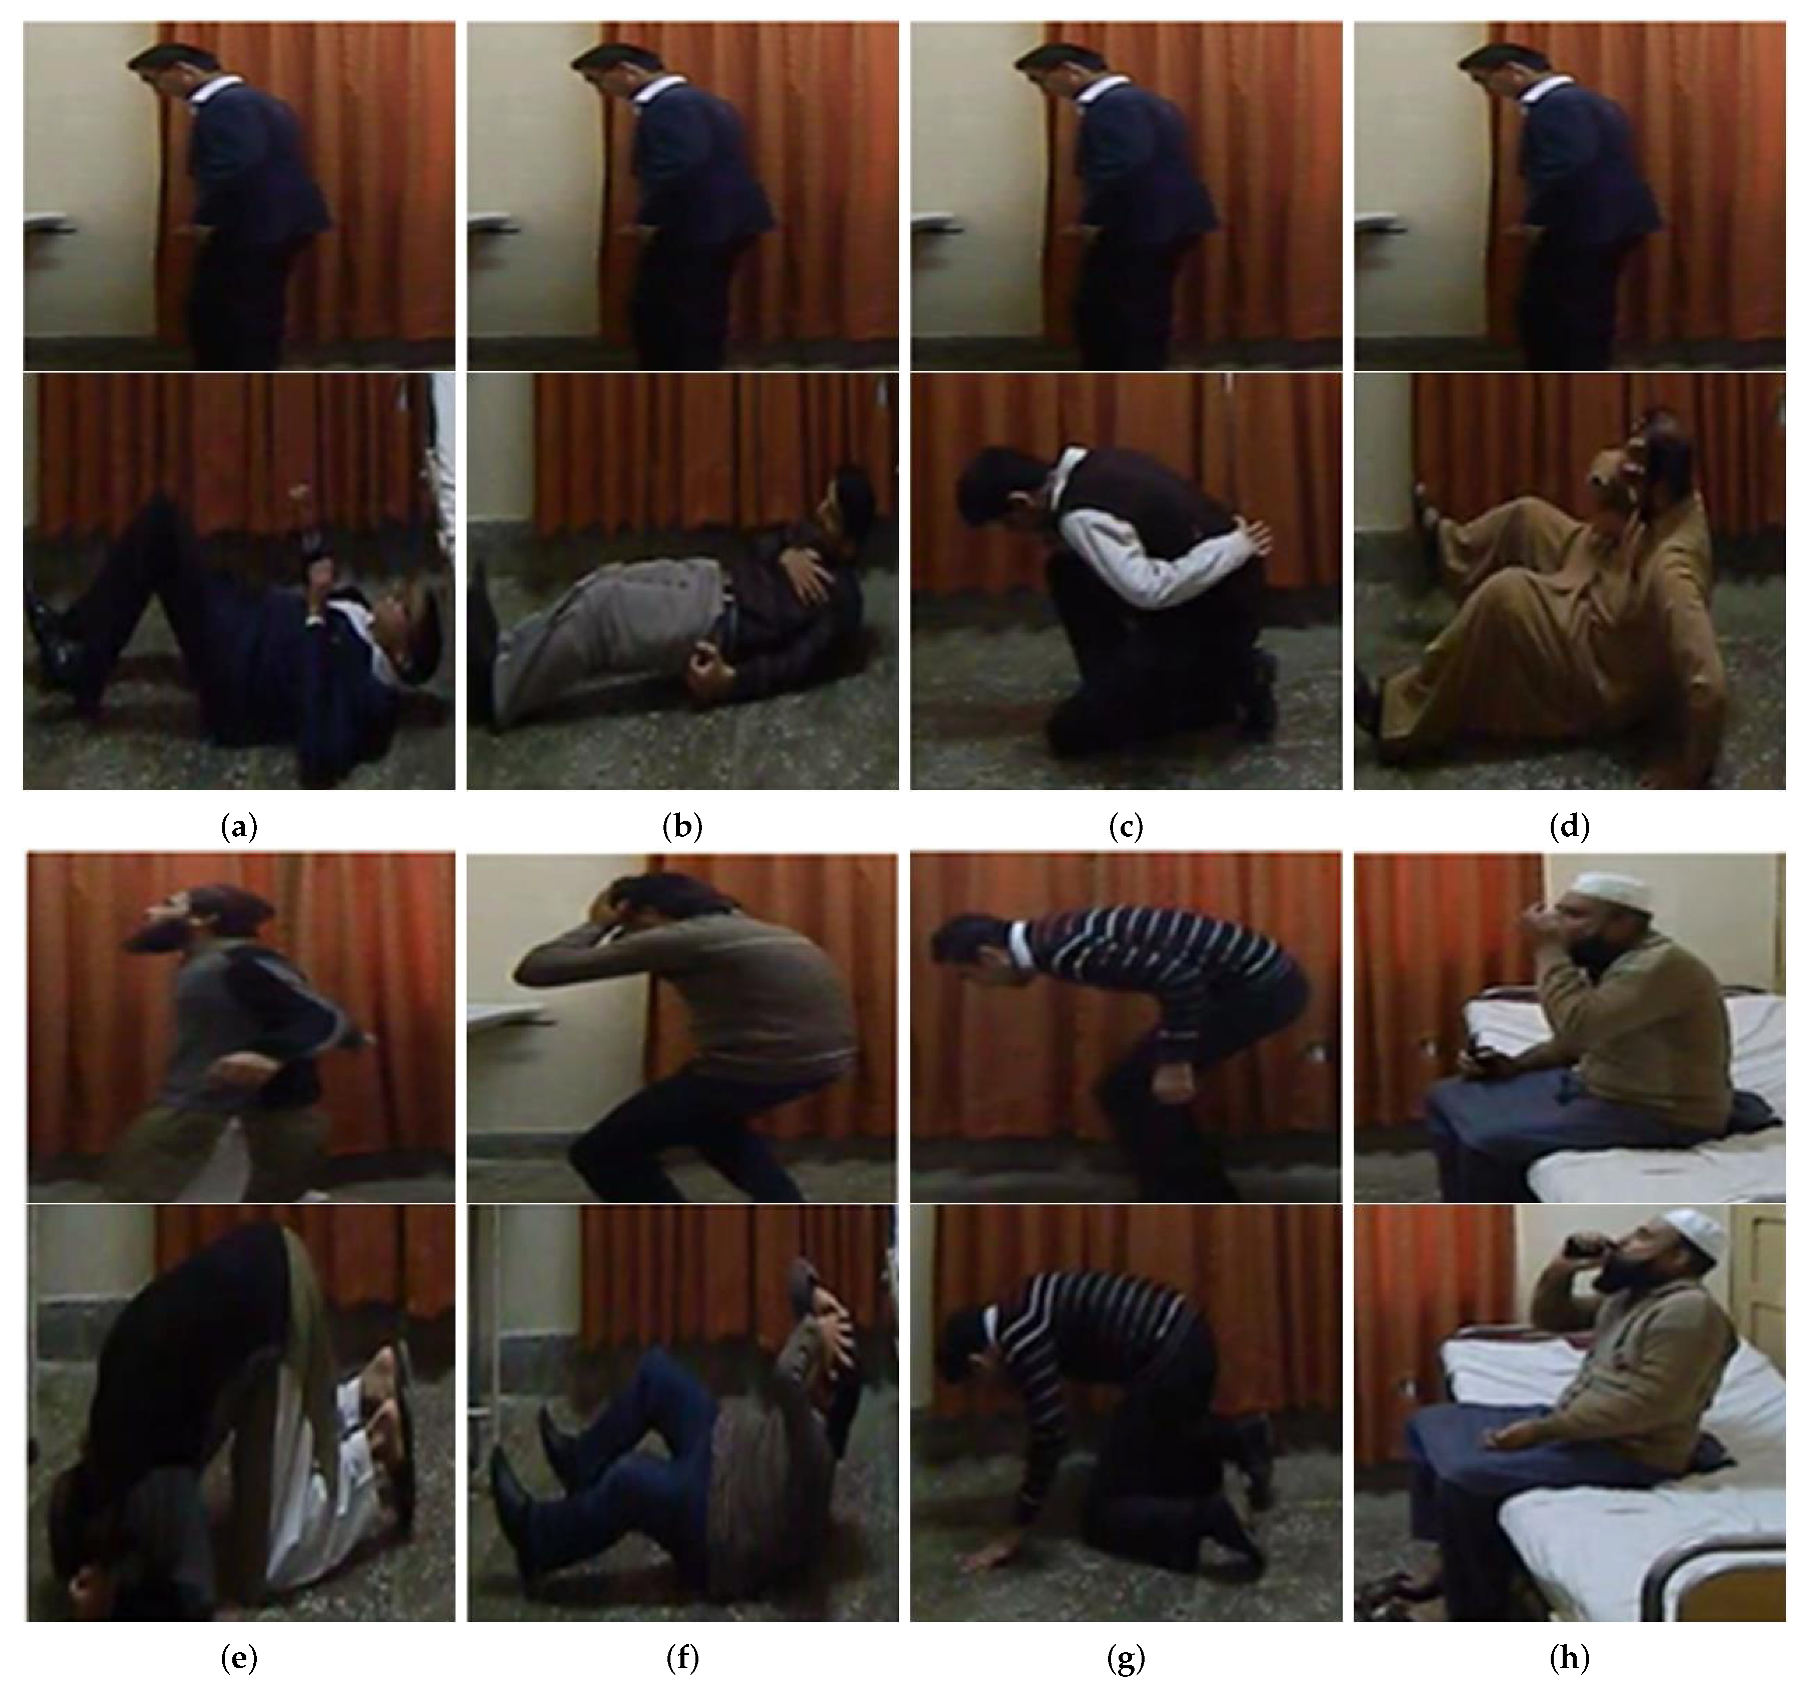
Figure 5.
The two sets of multiple frames of human activities are performed: (a) backward fall (b) chest pain (c) coughing (d) faint (e)l forward fall (f) headache (g) vomit and (h) taking medicine.
Figure 5.
The two sets of multiple frames of human activities are performed: (a) backward fall (b) chest pain (c) coughing (d) faint (e)l forward fall (f) headache (g) vomit and (h) taking medicine.

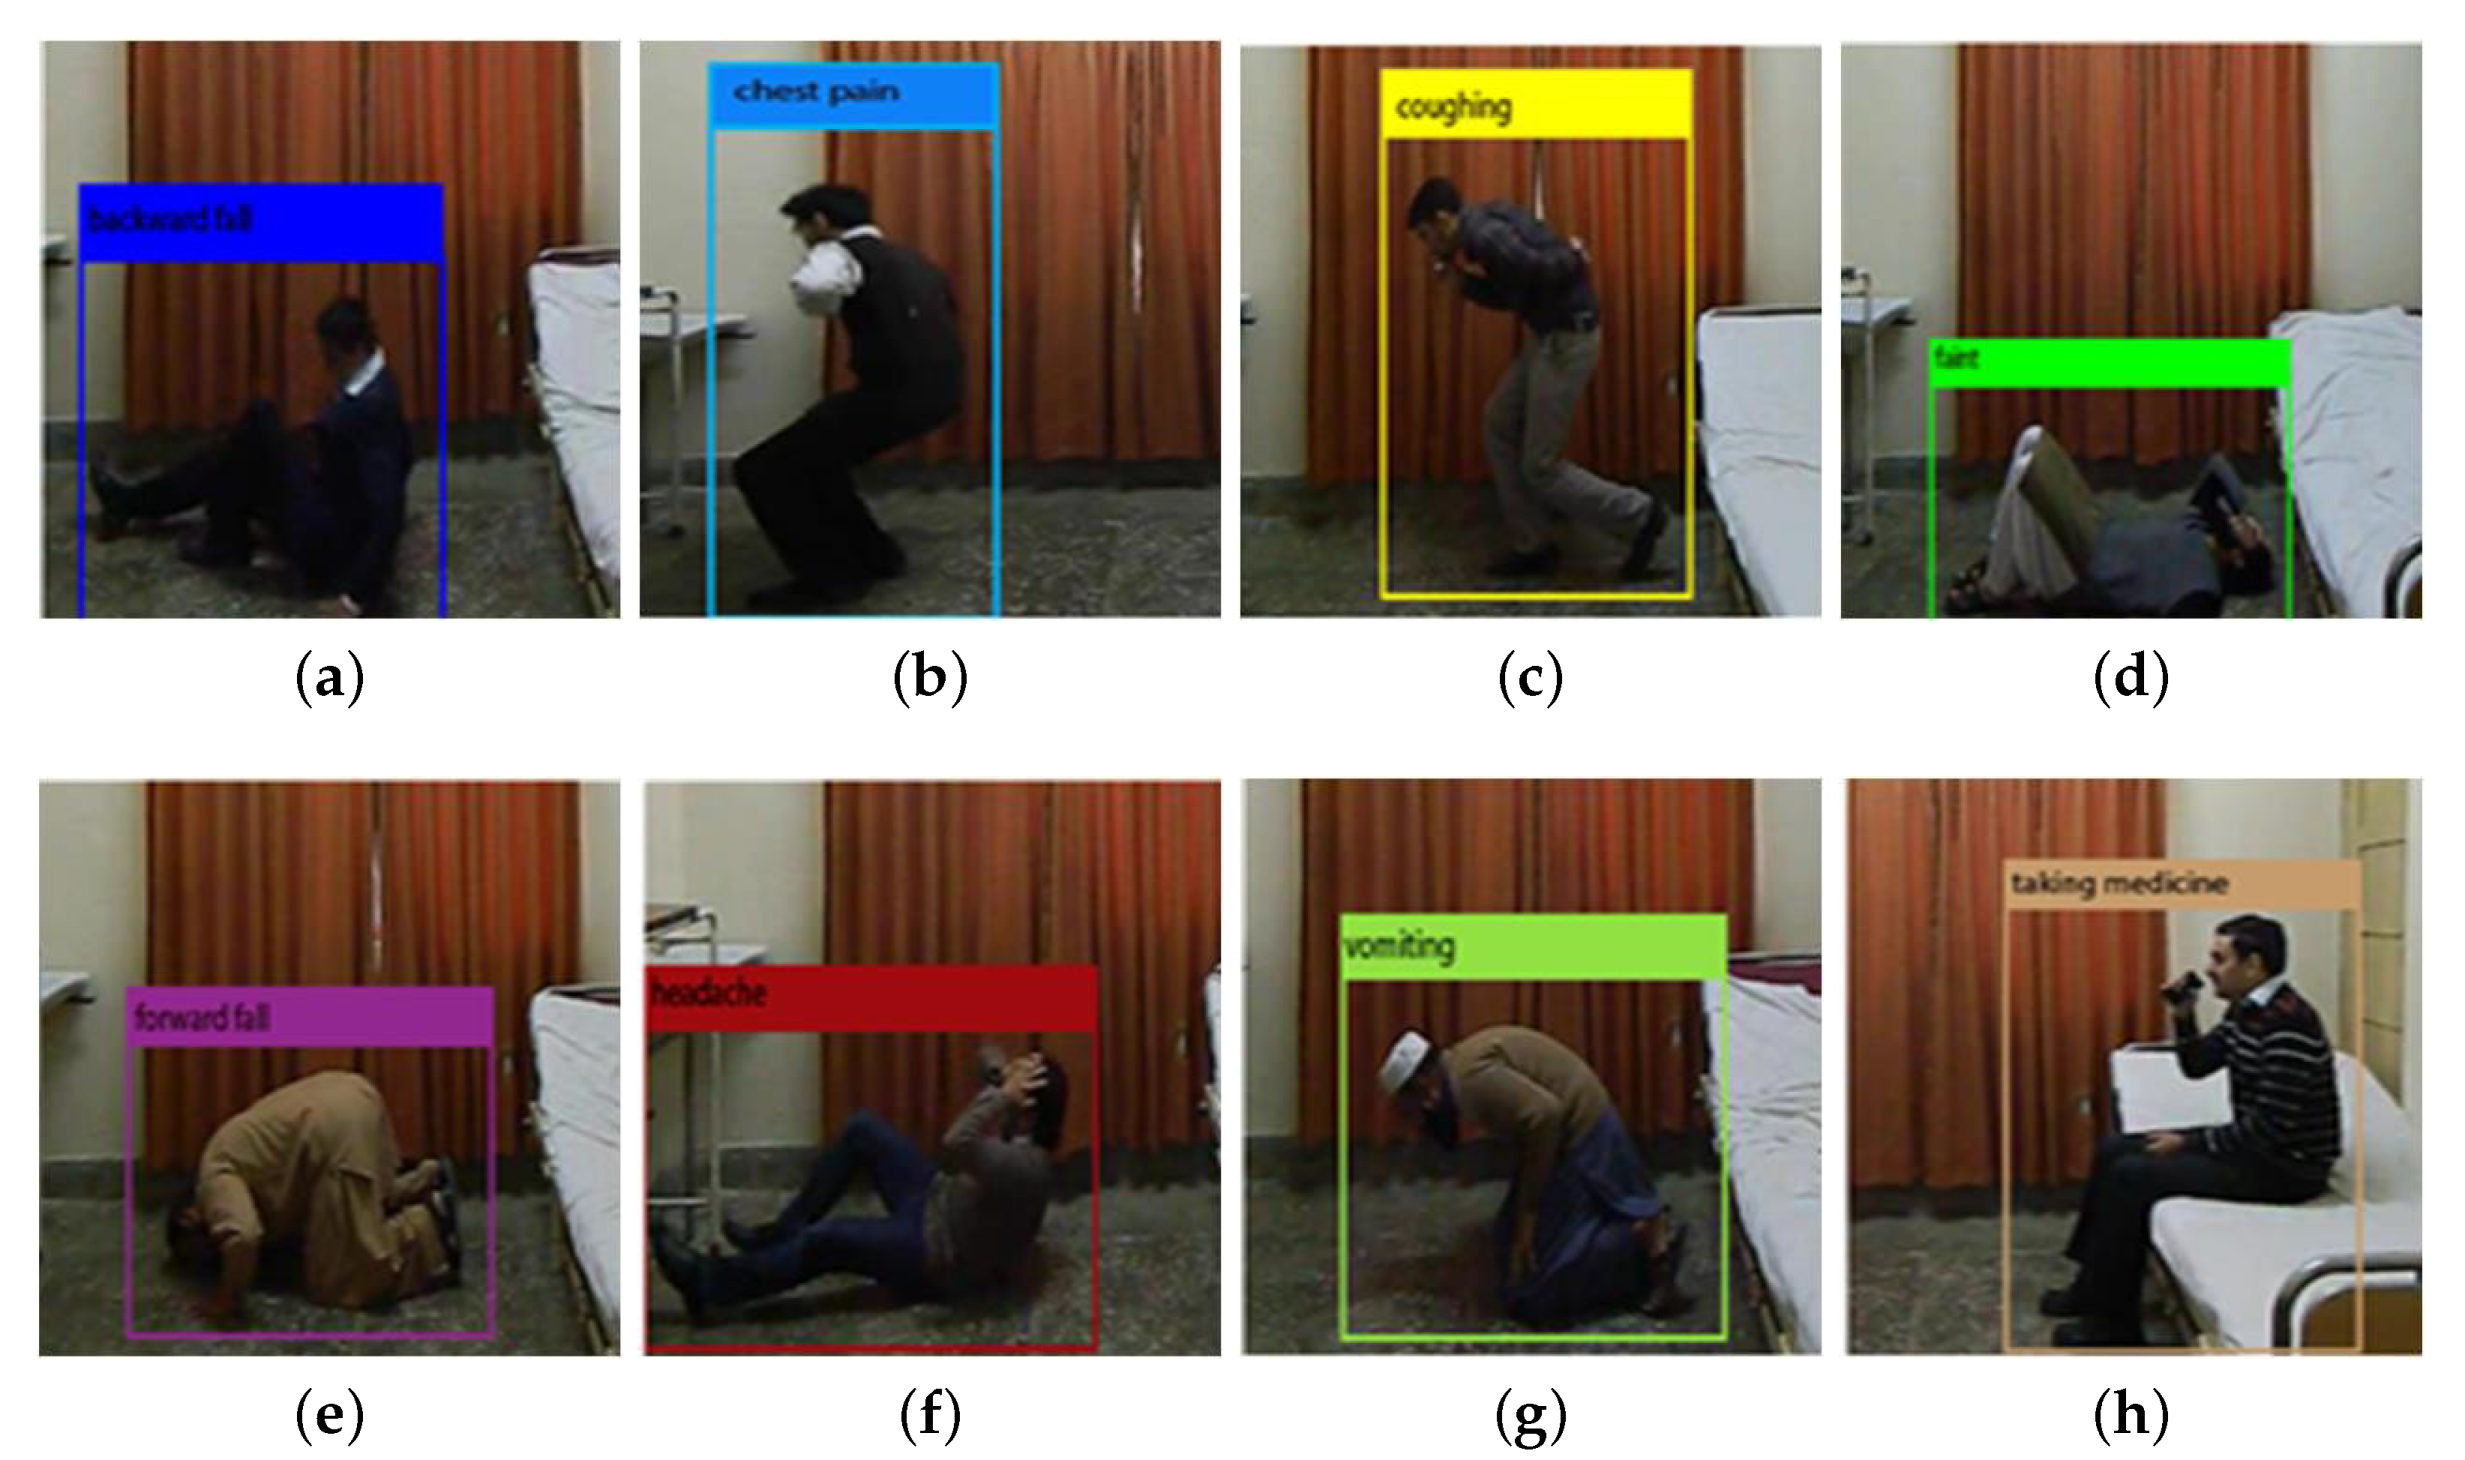
Figure 6.
Different abnormal activities recognized: (a) backward fall; (b) chest pain; (c) coughing; (d) faint; (e) forward fall; (f) headache; (g) vomit; and (h) taking medicine.
Figure 6.
Different abnormal activities recognized: (a) backward fall; (b) chest pain; (c) coughing; (d) faint; (e) forward fall; (f) headache; (g) vomit; and (h) taking medicine.


Table 1.
Comparison between the classical machine learning and deep learning benefits on their key properties.
Table 1.
Comparison between the classical machine learning and deep learning benefits on their key properties.
| Sr. No. | Property | Machine Learning | Deep Learning |
|---|---|---|---|
| 1 | Data Requirement | Can Train on smaller data | Require larger data |
| 2 | Accuracy | Gives lower accuracy | Provides higher accuracy |
| 3 | Training Time | Short training time | Longer training time |
| 4 | Hardware requirement | Lower cost CPU | Higher cost GPU to train properly |
| 5 | Hyperparamter Tuning | Limited tuning capabilities | Provide various tuning ways |
Table 2.
A brief comparison based on mean average precision (mAP) and frame per second (FPS) is made here and this study is taken from the following source [13].
Table 2.
A brief comparison based on mean average precision (mAP) and frame per second (FPS) is made here and this study is taken from the following source [13].
| Sr. No. | Detection Frame Work | mAP | FPS |
|---|---|---|---|
| 1 | Faster RCNN-VGG16 | 73.2 | 7 |
| 2 | Faster RCNN-ResNet | 76.4 | 5 |
| 3 | YOLO | 63.4 | 45 |
Table 3.
Brief description of our dataset. It contains information about the activities performed and about videos counts.
Table 3.
Brief description of our dataset. It contains information about the activities performed and about videos counts.
| Sr. No. | Activity Performed | No. of Videos | No. of Frames |
|---|---|---|---|
| 1 | Backward Fall | 24 | 2880 |
| 2 | Chest pain | 24 | 2880 |
| 3 | Coughing | 24 | 2880 |
| 4 | Faint | 24 | 2880 |
| 5 | Forward Fall | 24 | 2880 |
| 6 | Headache | 24 | 2880 |
| 7 | Vomiting | 24 | 2880 |
| 8 | Taking Medicine | 24 | 2880 |
| 9 | Total | 192 | 23,040 |
Table 4.
Performance evaluation of dataset with the ratio of 60:40.
| Sr. No. | Parameters → | Precision | Recall | F1-Score | Accuracy |
|---|---|---|---|---|---|
| Abnormalities ↓ | |||||
| 1 | Backward Fall | 83.004 | 92.105 | 87.318 | 96.296 |
| 2 | Chest Pain | 86.638 | 75.281 | 80.561 | 94.236 |
| 3 | Coughing | 87.037 | 80.342 | 83.556 | 95.542 |
| 4 | Faint | 74.131 | 88.073 | 80.503 | 94.461 |
| 5 | Forward Fall | 86.726 | 81.328 | 83.94 | 95.485 |
| 6 | Headache | 77.406 | 78.39 | 77.895 | 93.791 |
| 7 | Taking Medicine | 91.703 | 96.33 | 93.96 | 98.326 |
| 8 | Vomiting | 95.327 | 90.265 | 92.727 | 98.022 |
| Average | 85.246 | 85.264 | 85.057 | 95.77 |
Table 5.
Performance evaluation of dataset with the ratio of 70:30.
| Sr. No. | Parameters → | Precision | Recall | F1-Score | Accuracy |
|---|---|---|---|---|---|
| Abnormalities ↓ | |||||
| 1 | Chest Pain | 91.25 | 81.716 | 86.22 | 95.982 |
| 2 | Coughing | 88.393 | 85.714 | 87.033 | 96.592 |
| 3 | Faint | 84.339 | 88.889 | 83.843 | 95.762 |
| 4 | Forward Fall | 89.13 | 85.774 | 87.42 | 96.592 |
| 5 | Headache | 87.845 | 83.193 | 83.019 | 95.379 |
| 6 | Taking Medicine | 95.217 | 96.476 | 95.842 | 98.876 |
| 7 | Vomiting | 95.475 | 91.342 | 93.363 | 98.237 |
| Average | 90.134 | 88.421 | 89.269 | 96.8 |
Table 6.
Confusion matrix of dataset with the ratio of 60:40.
| Sr. No. | Abnormalities↓ → | Backward Fall | Chest Pain | Coughing | Faint | Forward Fall | Headache | Taking Medicine | Vomiting |
|---|---|---|---|---|---|---|---|---|---|
| 1 | Backward Fall | 210 | 0 | 0 | 6 | 0 | 8 | 4 | 0 |
| 2 | Chest Pain | 20 | 201 | 8 | 20 | 10 | 6 | 2 | 0 |
| 3 | Coughing | 0 | 5 | 188 | 8 | 0 | 18 | 9 | 6 |
| 4 | Faint | 17 | 0 | 4 | 192 | 0 | 3 | 0 | 2 |
| 5 | Forward Fall | 2 | 10 | 0 | 18 | 196 | 13 | 0 | 2 |
| 6 | Headache | 4 | 12 | 0 | 15 | 16 | 185 | 4 | 0 |
| 7 | Taking Medicine | 0 | 0 | 2 | 0 | 0 | 6 | 210 | 0 |
| 8 | Vomiting | 0 | 4 | 14 | 0 | 4 | 0 | 0 | 204 |
Table 7.
Confusion matrix of dataset with the ratio of 70:30.
| Sr. No. | Abnormalities↓ → | Backward Fall | Chest Pain | Coughing | Faint | Forward Fall | Headache | Taking Medicine | Vomiting |
|---|---|---|---|---|---|---|---|---|---|
| 1 | Backward Fall | 230 | 0 | 0 | 6 | 0 | 6 | 4 | 0 |
| 2 | Chest Pain | 16 | 219 | 8 | 11 | 6 | 6 | 2 | 0 |
| 3 | Coughing | 0 | 5 | 198 | 8 | 0 | 11 | 5 | 6 |
| 4 | Faint | 15 | 0 | 4 | 192 | 0 | 3 | 0 | 2 |
| 5 | Forward Fall | 3 | 6 | 0 | 14 | 205 | 9 | 0 | 2 |
| 6 | Headache | 4 | 6 | 0 | 11 | 15 | 198 | 4 | 0 |
| 7 | Taking Medicine | 0 | 0 | 2 | 0 | 0 | 6 | 216 | 0 |
| 8 | Vomiting | 0 | 4 | 12 | 0 | 4 | 0 | 0 | 204 |
Table 8.
Comparison of proposed method with the state-of-the-art in terms of performance matrices.
| Sr. No. | Scheme | Recall | Accuracy | Precision | F1-Score |
|---|---|---|---|---|---|
| 1 | Shinde, et al. [13] | 88.083 | N/A | 89.881 | 88.358 |
| 2 | Proposed Technique (1st batch) | 85.264 | 95.77 | 85.246 | 85.057 |
| 3 | ProposedTechnique (2nd batch) | 88.421 | 96.8 | 90.134 | 89.269 |
Publisher’s Note: MDPI stays neutral with regard to jurisdictional claims in published maps and institutional affiliations. |
© 2020 by the authors. Licensee MDPI, Basel, Switzerland. This article is an open access article distributed under the terms and conditions of the Creative Commons Attribution (CC BY) license (http://creativecommons.org/licenses/by/4.0/).
Share and Cite
MDPI and ACS Style
Gul, M.A.; Yousaf, M.H.; Nawaz, S.; Ur Rehman, Z.; Kim, H. Patient Monitoring by Abnormal Human Activity Recognition Based on CNN Architecture. Electronics 2020, 9, 1993. https://doi.org/10.3390/electronics9121993
AMA Style
Gul MA, Yousaf MH, Nawaz S, Ur Rehman Z, Kim H. Patient Monitoring by Abnormal Human Activity Recognition Based on CNN Architecture. Electronics. 2020; 9(12):1993. https://doi.org/10.3390/electronics9121993
Chicago/Turabian StyleGul, Malik Ali, Muhammad Haroon Yousaf, Shah Nawaz, Zaka Ur Rehman, and HyungWon Kim. 2020. "Patient Monitoring by Abnormal Human Activity Recognition Based on CNN Architecture" Electronics 9, no. 12: 1993. https://doi.org/10.3390/electronics9121993
Note that from the first issue of 2016, this journal uses article numbers instead of page numbers. See further details here.