Article

Role of Big Data in the Development of Smart City by Analyzing the Density of Residents in Shanghai

1
School of Communication & Information Engineering, Shanghai University, Shanghai 200444, China
2
Institute of Smart City, Shanghai University, Shanghai 200444, China
3
Office of Research, Innovation and Commercialization, Allama Iqbal Open University, Islamabad 44000, Pakistan
4
Raptor Interactive (Pty) Ltd., Eco Boulevard, Witch Hazel Ave, Centurion 0157, South Africa
5
Department of Computer Engineering, Kangwon National University, Samcheok 25806, Korea
*
Author to whom correspondence should be addressed.
Electronics 2020, 9(5), 837; https://doi.org/10.3390/electronics9050837
Submission received: 13 April 2020 / Revised: 13 May 2020 / Accepted: 14 May 2020 / Published: 19 May 2020
(This article belongs to the Special Issue Transforming Future Cities: Smart City)

Abstract

:
In recent decades, a large amount of research has been carried out to analyze location-based social network data to highlight their application. These location-based social network datasets can be used to propose models and techniques that can analyze and reproduce the spatiotemporal structures and symmetries in user activities as well as density estimations. In the current study, different density estimation techniques are utilized to analyze the check-in frequency of users in more detail from location-based social network dataset acquired from Sina-Weibo, also referred as Weibo, over a specific period in 10 different districts of Shanghai, China. The aim of this study is to analyze the density of users in Shanghai city from geolocation data of Weibo as well as to compare their density through univariate and bivariate density estimation techniques; i.e., point density and kernel density estimation (KDE) respectively. The main findings of the study include the following: (i) characteristics of users’ spatial behavior, the center of activity based on their check-ins, (ii) the feasibility of check-in data to explain the relationship between users and social media, and (iii) the presentation of evident results for regulatory or managing authorities for urban planning. The current study shows that the point density and kernel density estimation. KDE methods provide useful insights for modeling spatial patterns using geo-spatial dataset. Finally, we can conclude that, by utilizing the KDE technique, we can examine the check-in behavior in more detail for an individual as well as broader patterns in the population as a whole for the development of smart city. The purpose of this article is to figure out the denser places so that the authorities can divide the mobility of people from the same routes or at least they can control the situation from any further inconvenience.

1. Introduction

A large amount of individuals’ location-based social network (LBSN) like Facebook, Twitter, WeChat and Weibo [1,2] data are available in the modern era due to the increased usability of smart devices, which provide geo-location (longitude and latitude) as well as other demographic information about human behavior such as social media activities, phone calls, text messages and more. With the widespread generation of these data, researchers have been encouraged to study numerous topics to create accurate models for characterizing the spatiotemporal distribution of individuals and the population as a whole, considering humans as a source of information due to their movements and use of LBSNs (i.e., Twitter, Facebook, and Foursquare) via some smart device which records the day-to-day activities and whereabouts of users. By collecting such kind of data about users’ information, they can be analyzed in collaboration with temporal, social and geo-spatial factors, enabling us to observe patterns such as the difference between the sleeping routine of people around the globe or how people from different parts of the world like to spend their summer or winter vacations, and so on.
Point density is defined as the calculation of the density of points around each output cell based on its features. A neighborhood is calculated around each cell-center; all the points within the neighborhood are totaled and divided by its area. It is stated that the radius does not affect the density value calculation. Although the number of points in a large neighborhood increases, for density calculation, it is divided by the area, which increases relatively. The purpose of using a larger radius is to calculate a more generalized output by increasing the number of points in a wide area [3]. Although the point density function is a relatively straightforward and simple technique, it does not express any information about the spatiotemporal configuration within the bandwidth. Kernel density estimation (KDE) is a classic approach for spatial point pattern analysis. In many applications, KDE with spatially adaptive bandwidths is preferred over KDE with an invariant bandwidth. However, bandwidth determination for adaptive KDE is extremely computationally intensive, particularly for the point pattern analysis with a large sample size. This computational challenge impedes the application of adaptive KDE to analyze large point data sets, which are common in this big data era [4]. In this paper, we deeply explore the spatial characteristics and extend the usage of check-in data. Moreover, the following research points will be investigated in this study: (i) the main center of activity based on users’ check-ins, and (ii) whether using LBSN data is feasible to explain the relationship between users and social media use.
In addition, we demonstrated the effect of univariate density (point density) and multivariate density (KDE) through density estimation maps. We used point Density and KDE to mine Weibo data to visualize the users’ check-in patterns. We analyzed the different aspects of LBSN data to observe activities at the individual level and check-in density during a specific period in Shanghai. Furthermore, we investigated LBSN data for check-in behavior in 10 districts of Shanghai: Pudong New Area, Changning, Baoshan, Jingan, Huangpu, Hongkou, Putuo, Yangpu, Minhang, and Xuhui. The word check-in behavior in the context of this research means how users interact with LBSN and perform different activities like, sharing location by posting a geotagged picture or comment. The basic reason for selecting these 10 districts is that they all are connected to the city-center. We used a dataset from Weibo for our empirical exploration, which is considered one of the most popular social media networks in China. Our contributions include the check-in density of users for a sample of the general population in Shanghai city and comparison of point density and KDE through results from the geo-location database. This study can be beneficial in various fields such as urban functionalities and its environmental effects, urban sustainability, development, and emergency response based on crowd densities within the city and further research in these areas. This work is carried upon the final master’s degree thesis [5].

2. Related Work

The use of social media has increased with the frequent use of mobile phones and the Internet, which has enhanced the ability of people to explore different places around the world. Emails, messages, tweets, and various other methods of communication are mostly supported by social network applications and allow users around the world to communicate with each other [3]. With everyday developments in mobile gadget technologies, users are able to share information such as text, audio and video containing geo-location information and, with the progressive use of smartphones in recent years, a vital revolution is occurring in geo-location abilities, motivating users to utilize location-based services (LBSs), which results in the rise and commercialization of LBSs [4]. One of the early studies on the usage of LBSNs [5] discussed why and how people use LBSNs. An empirical analysis on LBSNs is presented in [6], while an investigation in the spatiotemporal proprieties related to LBSNs is presented in [7].
More recently, tracking a user’s location has become easier with the availability and development of mobile devices. Cranshaw et al. [6] presented a dataset containing 100,000 users’ data for a period of six months. The information in the dataset contained the location of a user’s closest base station tower for every call made through mobile phones, allowing researchers to gain approximations of each user’s data and location within a specific time period. Using this data, Gray et al. [7] conducted an analysis using KDE for the predictability of activity patterns. Researchers [8,9] found that the ability to share information with millions of LBSNs users is a simple method to manage one’s identity, make new friends, meet with friends, and experience new things. Methods for predicting the future transitions of users have been surveyed in [10]. Moreover, advanced techniques for prediction in LBSNs are presented in [11]; e.g., Sadilek et al. [12] used geo-location data from Twitter to analyze the spread of infectious diseases, leading to the potential to develop new approaches for real-time epidemiology computations. Cranshaw et al. [6] used the check-in data from Foursquare within urban areas to discover local spatial clusters, which can be valuable in urban planning to resource allocation and economic development.
Point density and kernel density estimation are used in past for different purposes. Paul Evangelista and David Beskow introduced a spatial point density method to understand spatial point activity density with precision and meaning [13]. Chao et al. conducted a study on the spatial distribution of archaeological sites in China using Point Density analysis [14]. Detailed documentation on Point Density function can be found in [15]. Meullenet et al. studied the use of point density with Euclidian distance to optimize the formulation of grape juices [16]. The KDE approach has been used by Zhang et al. for the efficient pattern analysis of spatial big data [4]. Warangkana et al. evaluated the user-defined parameter (bandwidth) of KDE, which influences the resolution of mapping through the application of KDE on various diseases [17]. An investigative study on the typical sparsity of data and heterogeneity of spatial mobility patterns using KDE was carried out by Lichman and Smyth [18]. A comprehensive study on designing users’ travel preferences from location-based data using KDE was done by Arain et al. [19]. Carlos et al. used both point density and kernel density to study health disparities and other health issues in public [20]. The authors used Kernel density estimates with selection biased data [21]. A lot of work has been carried out by using KDE. The previous studies in density estimation from Weibo data mostly used a single technique such as KDE to estimate density on the maps and applied this for a specific task such as gender analysis in green parks and also focused upon the green spaces [22,23], tourism [24,25], and point of interest recommendations [26], etc. Researchers used Weibo to explore the spatial characteristics of check-in data using a single technique; i.e., the spatial analysis of check-in data was carried out using point density in Wuhan [27], and in [28], the authors used KDE to observe gender-based check-in behavior using Weibo data. KDE has been used for what concerns the choice of bandwidth and intensity parameters according to local conditions and also been used for measuring spatial segregation [29,30]. The KDE approach has been used for the spatial modeling of geo-location data, providing a more general and flexible framework for spatial-density estimation [21].

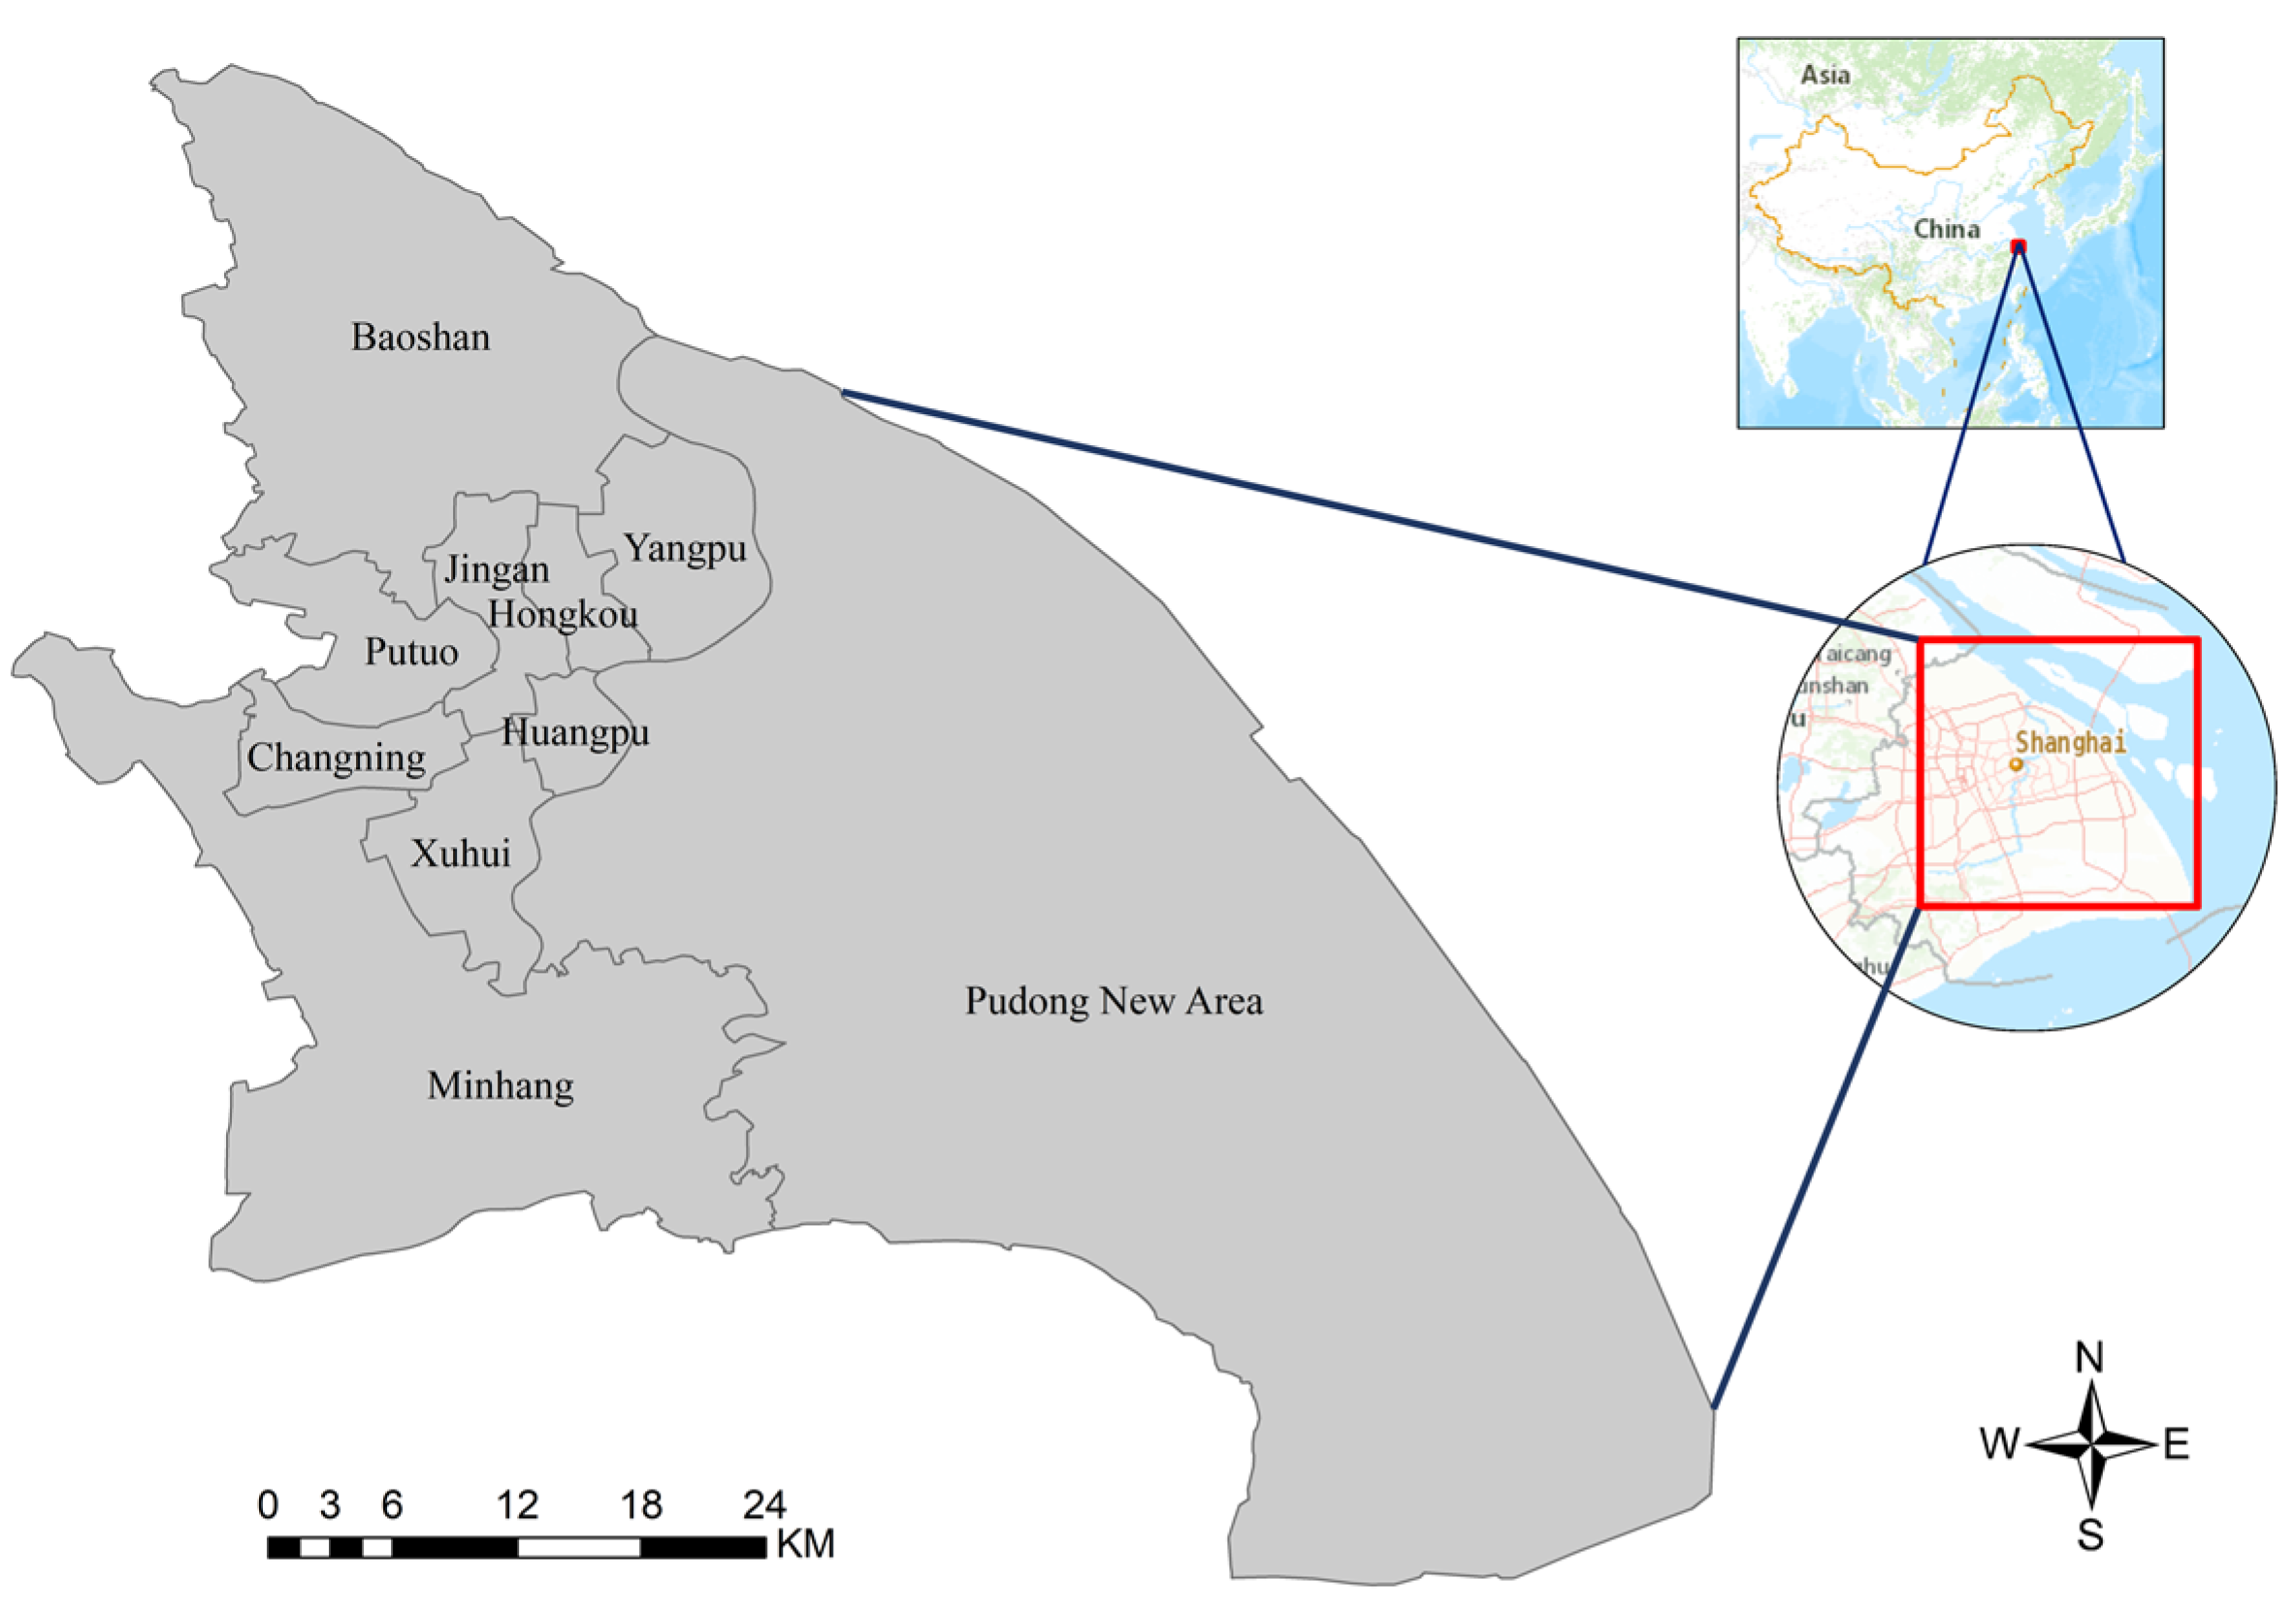
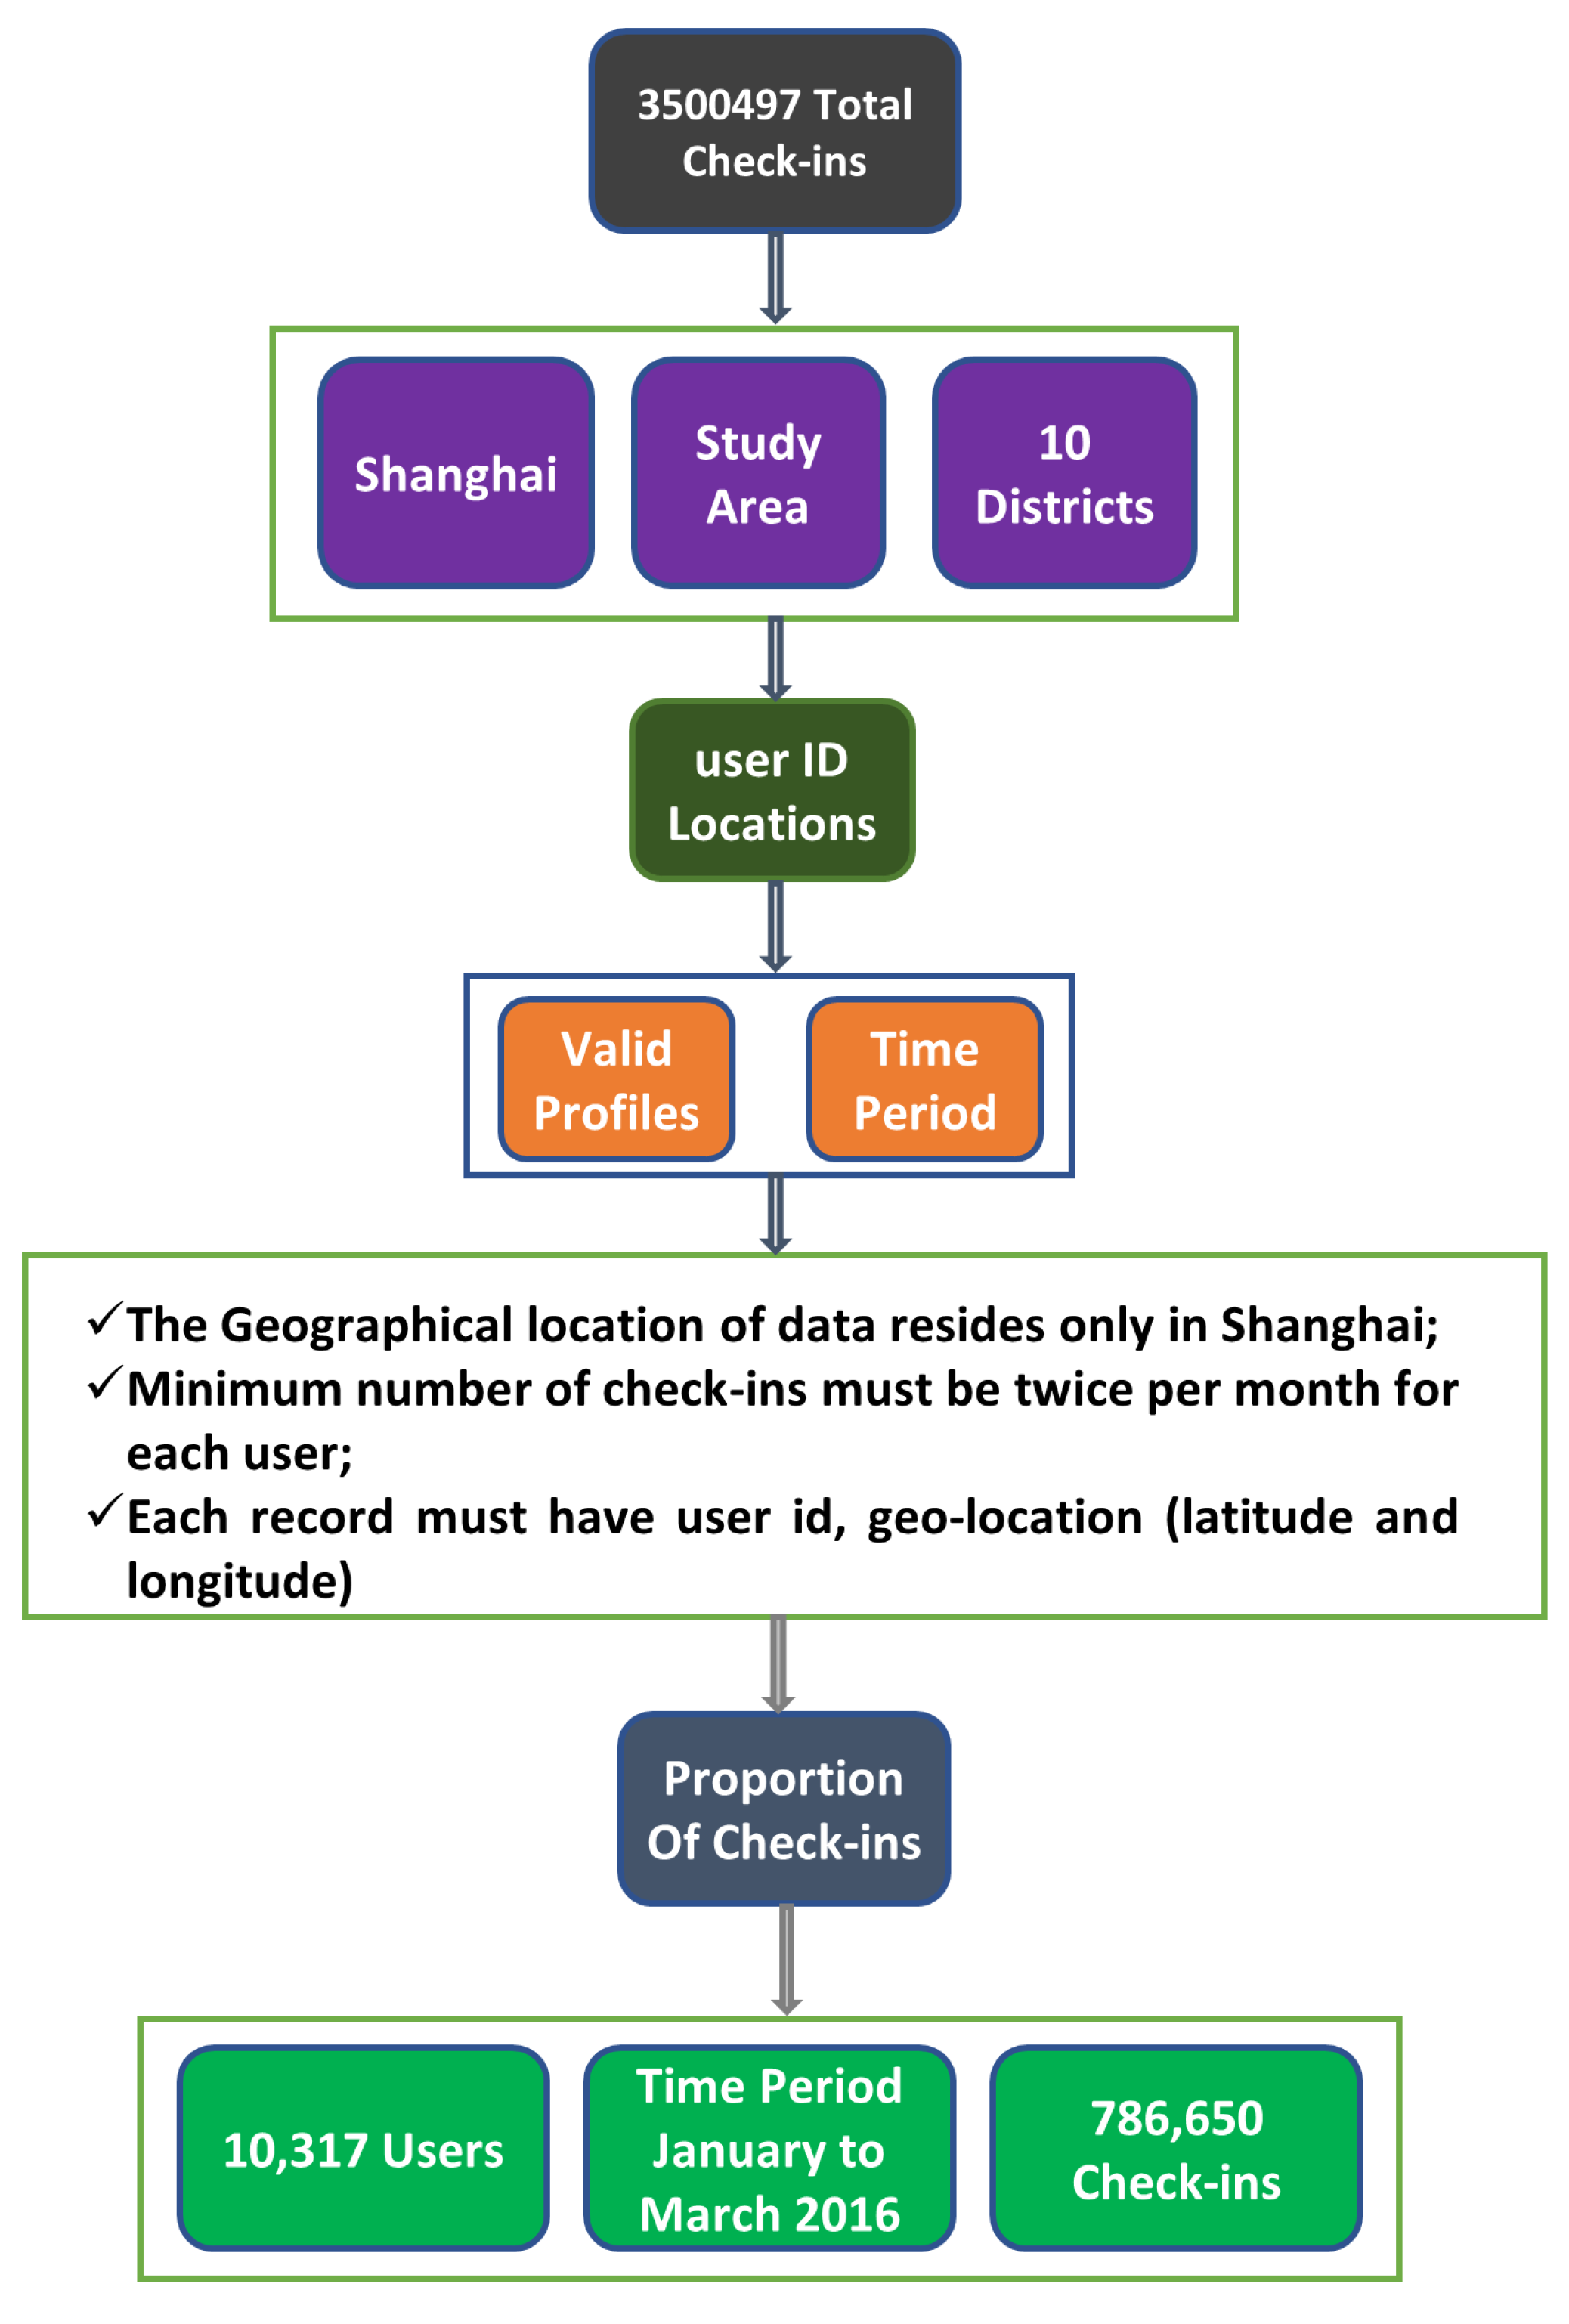
3. Study Area and Dataset

Shanghai, China (lying between 30°40′–31°53′ N and 120°52–122°12′ E [31,32]) is located on the eastern edge of the Yangtze River Delta [33]. The total area of Shanghai is 8359 km2, and the gross domestic product (GDP) was 480 billion dollars (USD) in 2018 [34,35].
Shanghai is partitioned into 16 sub-divisions: one county (Chongming) and 15 districts (Fengxian, Minhang, Huangpu, Jingan, Putuo, Hongkou, Jinshan, Changning, Jiading, Songjiang, Qingpu; Baoshan, Yangpu, and Pudong New Area) in 2016 [36]. For this study, the 10 districts of Shanghai (Baoshan, Xuhui, Changning, Huangpu, Minhang, Jingan, Yangpu, Putuo, Hongkou, and Pudong New Area) are considered, which are interconnected. Changning, Huangpu, Putuo, Hongkou, Xuhui, Jingan, and Yangpu are situated in Puxi (Huangpu West). All of these seven districts are collectively called the downtown area or the city-center of Shanghai [26,37], as shown in Figure 1.
The dataset used in our study is gathered from the Chinese microblog “Weibo.” This location-based network is focused on sharing the user’s current location with geo–spatial coordinates, which is a real-world place specified by the user. As with any other LBSN, users connect with the application by checking-in and interact with others in the network.
Immediately after it was launched on 14 August 2009, Weibo, one of the most important LBSNs in China, saw an exponential boom in activity and awareness and has now reached maturity. We used data from Weibo because it is not only the largest LBSN in China but also contains complex geo-data of various modalities and provides different social features that encourage users to check-in repeatedly and frequently. Weibo announced that they had over 500 million registered users actively using the platform in 2018, and monthly active users reached 462 million in December of 2018 [38]. The last official estimate of the number of daily active users was 200 million in 2018. Therefore, we must concentrate on users that use the application regularly in order to explore the patterns of user activities. The data collected from the use of LBSN applications have serious privacy concerns and restrictions. Finding open and dependable geo-location-based data is very difficult in China. The LBSN dataset for this study is taken from Weibo for a period of January–March 2016. Weibo has an open geodatabase which can be downloaded by using the Weibo API based on python [26].
As Weibo has an open geodatabase, the dataset provides information such as user ID, date, and time, with additional information such as geo-locations (longitude and latitude), categories, and names of venues. Taking into account the privacy of the users, no private information is available. Therefore, the check-in data shows the day-to-day activity patterns of users and their behaviors, and it exhibits the average person’s everyday life operations [31,39]. Shanghai was chosen as the study area since it has a large volume of check-ins and active users. Within the Shanghai administrative boundaries, 824,304 check-ins made by 11,108 users from January to March 2016 were collected through the application programming interface (API). Weibo data were preprocessed to eliminate noises, wild card entries and invalid records. The following criteria were taken into account for data preprocessing and cleaning to overcome the heterogeneity issue and for the significance of the dataset: it can be seen in Figure 2.
Given the heterogeneity issue, it is necessary to select only active users to constitute the sample of users in order to ensure a relatively high level of representativeness. The dataset used in our study contains the user ID, Latitude and Longitude shown in Table 1, from January to March 2016, in which there are 10,317 valid users with total number of check-ins of 786,650. The study is undertaken in the financial city of China, Shanghai.

4. Methodology

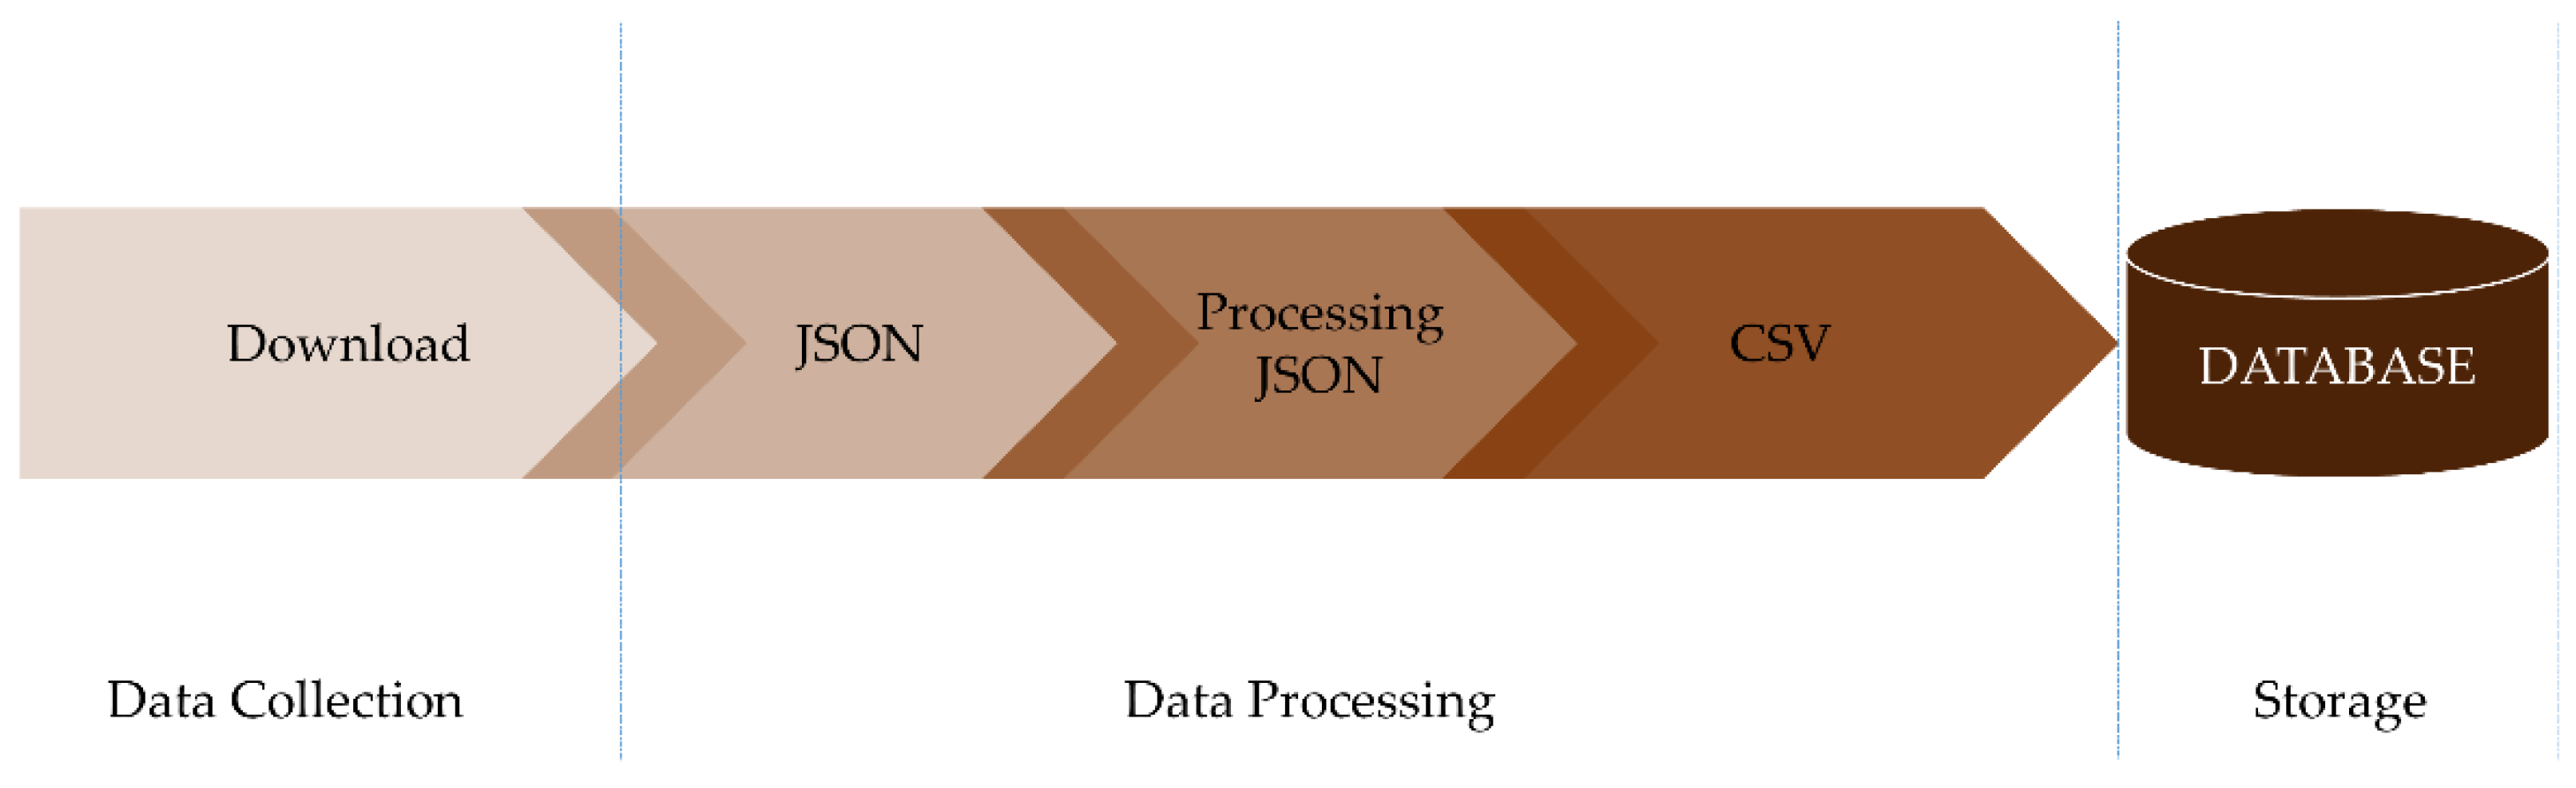
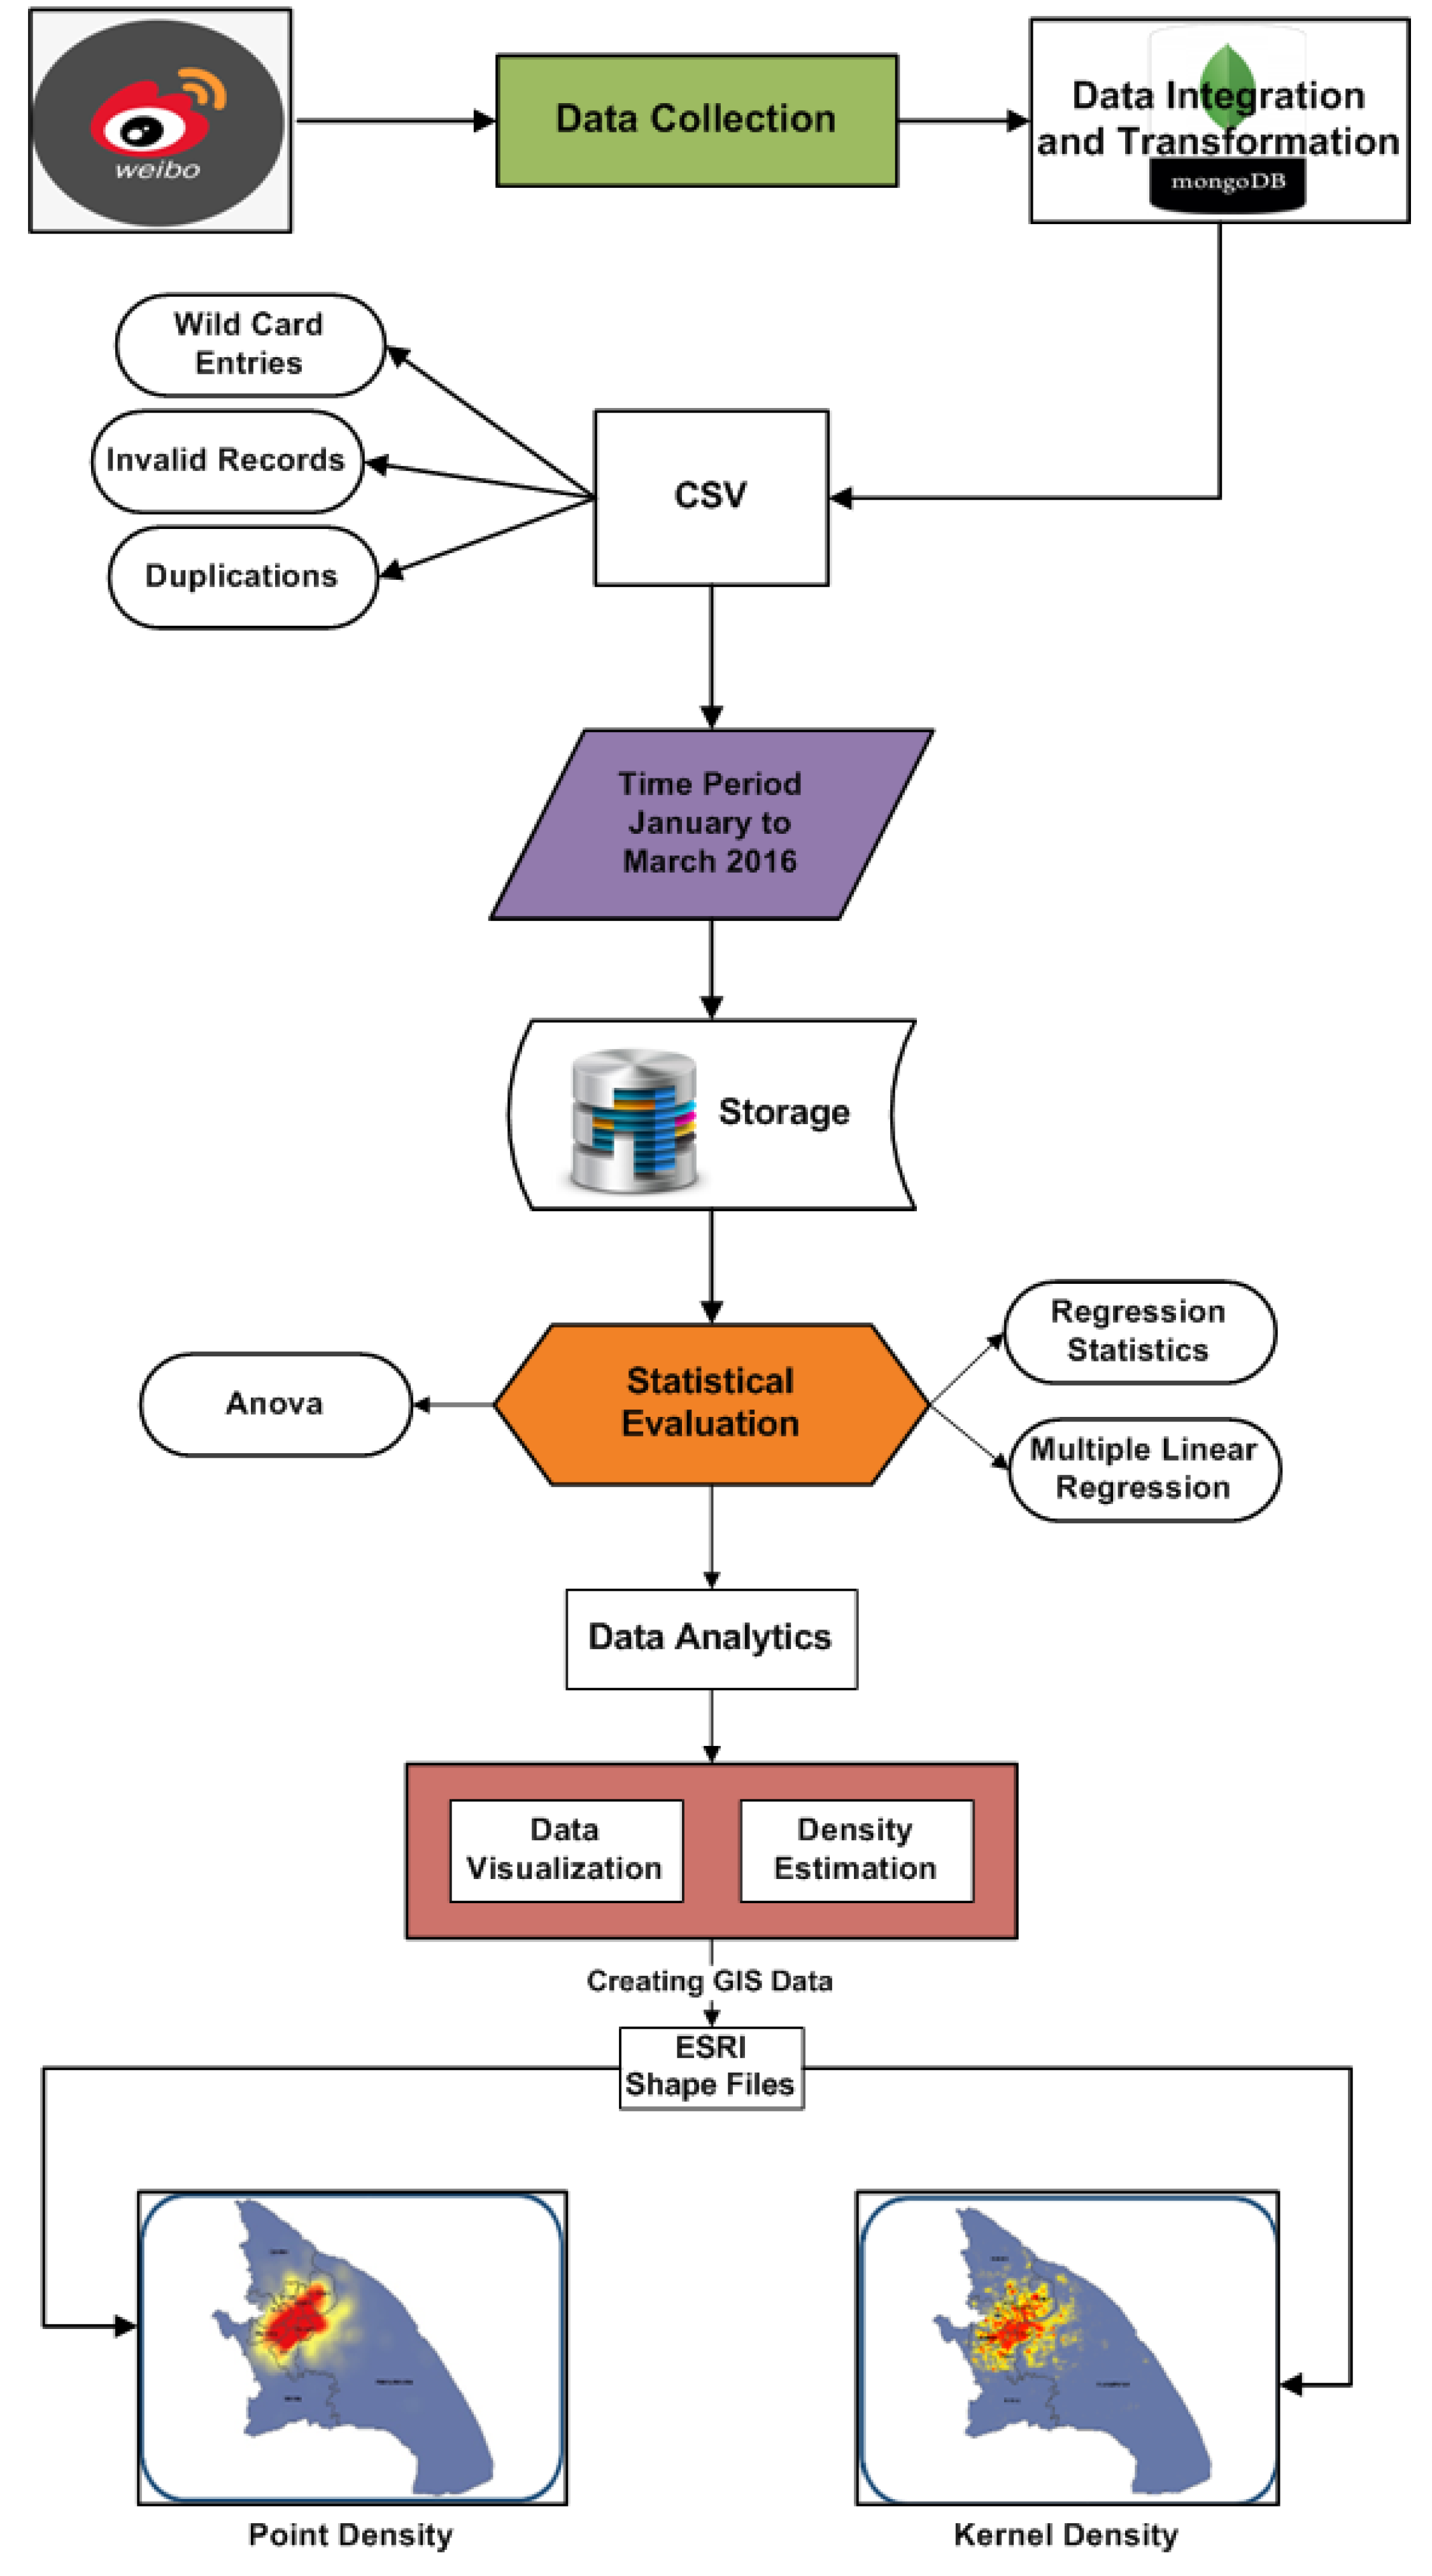
4.1. Data Acquisition and Preparation

The primary task for the collection of data and the storage phase was to download a huge amount of data. In the data collection task, the downloaded data came in multiple JavaScript Object Notation (JSON) file formats by using an application programming interface (API) [40] based on Python. The process flow of data acquisition is shown in Figure 3.
JSON is a lightweight data-interchange format that uses human-readable text to transmit data objects, while Java is an object-oriented programming platform [41,42,43]. For further operations and analysis through the selected software, the data were converted into one single file in the CSV (comma-separated values) format so all the users’ information along with geo-locations could be listed regarding their publishing time and stored in the database as shown in Figure 2. CSV is a commonly used format for data exchange that is widely adopted in various fields, such as businesses and scientific applications [44]. The CSV file format separates various values by commas as delimiters. For simple JSON data, keys (ID, Latitude, Longitude, etc.) are taken as headers for the CSV file and values (5404478798, 121.54444, 31.26815, etc.) as the descriptive data. An example of a “check-in” is presented in Table 2.

4.2. Statistical Analysis and Parameters

In order to discover the significance of explanatory variables, it was imperative to explore the predictors (explanatory variables) and their impact on the response variable (number of check-ins) statistically. To execute this model, we used the following regression equation:
Y = β 0 + β 1 x 1 + β 2 x 2 + β 3 x 3 + + β k x k + ϵ
Table 3 shows the parameters and explanatory variables used in our regression model.
Y = β 0 + β 1 B a o s h a n + β 2 Changning + β 3 Hongkou + β 4 Huangpu + β 5 Jingan + β 6 Minhang + β 7 Pudong   New   Area + β 8 Putuo + β 9 Xuhui + β 10 Yangpu + ϵ
After applying the linear regression model, our fitted value equation becomes
y ^ = b 0 + b 1 B a o s h a n + b 2 Changning + b 3 Hongkou + b 4 Huangpu + b 5 Jingan + b 6 Minhang + b 7 Pudong   New   Area + b 8 Putuo + b 9 Xuhui + b 10 Yangpu   + ϵ
Table 3 presents the model coefficients, in which Baoshan shows that for each unit increase in the value, the number of check-ins is increased on average by approximately 1.6% with a very low p-value; similarly, for each unit increase in the value of Huangpu, Minhang, Putuo, and Xuhui, the number of check-ins is increased on average by approximately 1.5%, 1.5%, 0.8%, and 0.9%, respectively, with a very low p-value.
With regards to the inference of the model, the p-value of the model’s F-statistic indicates that the model as a whole is significant [45]. It should be noted that not all predictors have a significant p-value, as the model was developed using the highest adjusted R2 presented in Table 4.
Here, we can see that all independent variables are significant predictors based on their p-values, as shown in Table 5. For statistical analysis, we used the statistical programming language R [46] and used RStudio [47] to perform basic descriptive and regression analysis.

4.3. Social Media Data Analytics Framework

Figure 4 depicts our general framework for spatial analysis. The first phase includes two parts: data acquisition, which was downloading data from Weibo, and data cleaning. The next phase is the analysis of LBSN data. The analysis phase used statistical analysis (probabilities of check-ins) and data visualization with two different techniques (point density and KDE) by using ArcGIS [48] to produce density maps.
After the preprocessing of more than 1,000,000 records, 786,652 records were considered for this study within the period of January–March 2016. For data analysis, we first investigated our dataset for significance by finding the check-in frequency of each user along with data distribution in all districts considered in the study area with the number of users, the number of check-ins and the percentage of check-ins followed by the percentage of check-ins using a donut chart in each district. This analysis provides an idea about data in the dataset before density analysis. The density is established using two different techniques to obtain a detailed view of the data for the whole study area. We analyzed the spatial patterns using point density and KDE, while ArcGIS was used for density estimation and visualization.
Spatial analysis was subsequently conducted using the ArcGIS 10.6.1 software to analyze the spatial distribution characteristics of these spaces. ArcGIS 10.6.1 software (Environmental Systems Research Institute, Inc., Redlands, CA, USA) was applied for the study with a map of Shanghai produced in 2016, and this was considered as a working base map with Geodetic Coordinate System WGS1984.

4.4. Analytical Method

4.4.1. Point Density

The point density method used in the current study calculates the frequency of the event intensity (density) within the neighborhood of a given point, accounting for a geo-spatial projection. The number of points per unit area at each location throughout an area of interest is referred to as the Point Density function. A “neighborhood” is defined for each point to calculate this density surface, usually by specifying a bandwidth (or search radius); the total number of points within the neighborhood is divided by the total area of the neighborhood. The point density function is expressed as [3]:
λ ( a , b ) = n | A |
where λ is the point density at a location ( a , b ) , the number of events is represented by n , the area of the neighborhood is denoted by | A | , and λ ( a , b ) is the unit of users per unit area. When neighborhoods overlap, the results are summed to indicate a higher density of users.

4.4.2. Kernel Density Estimation
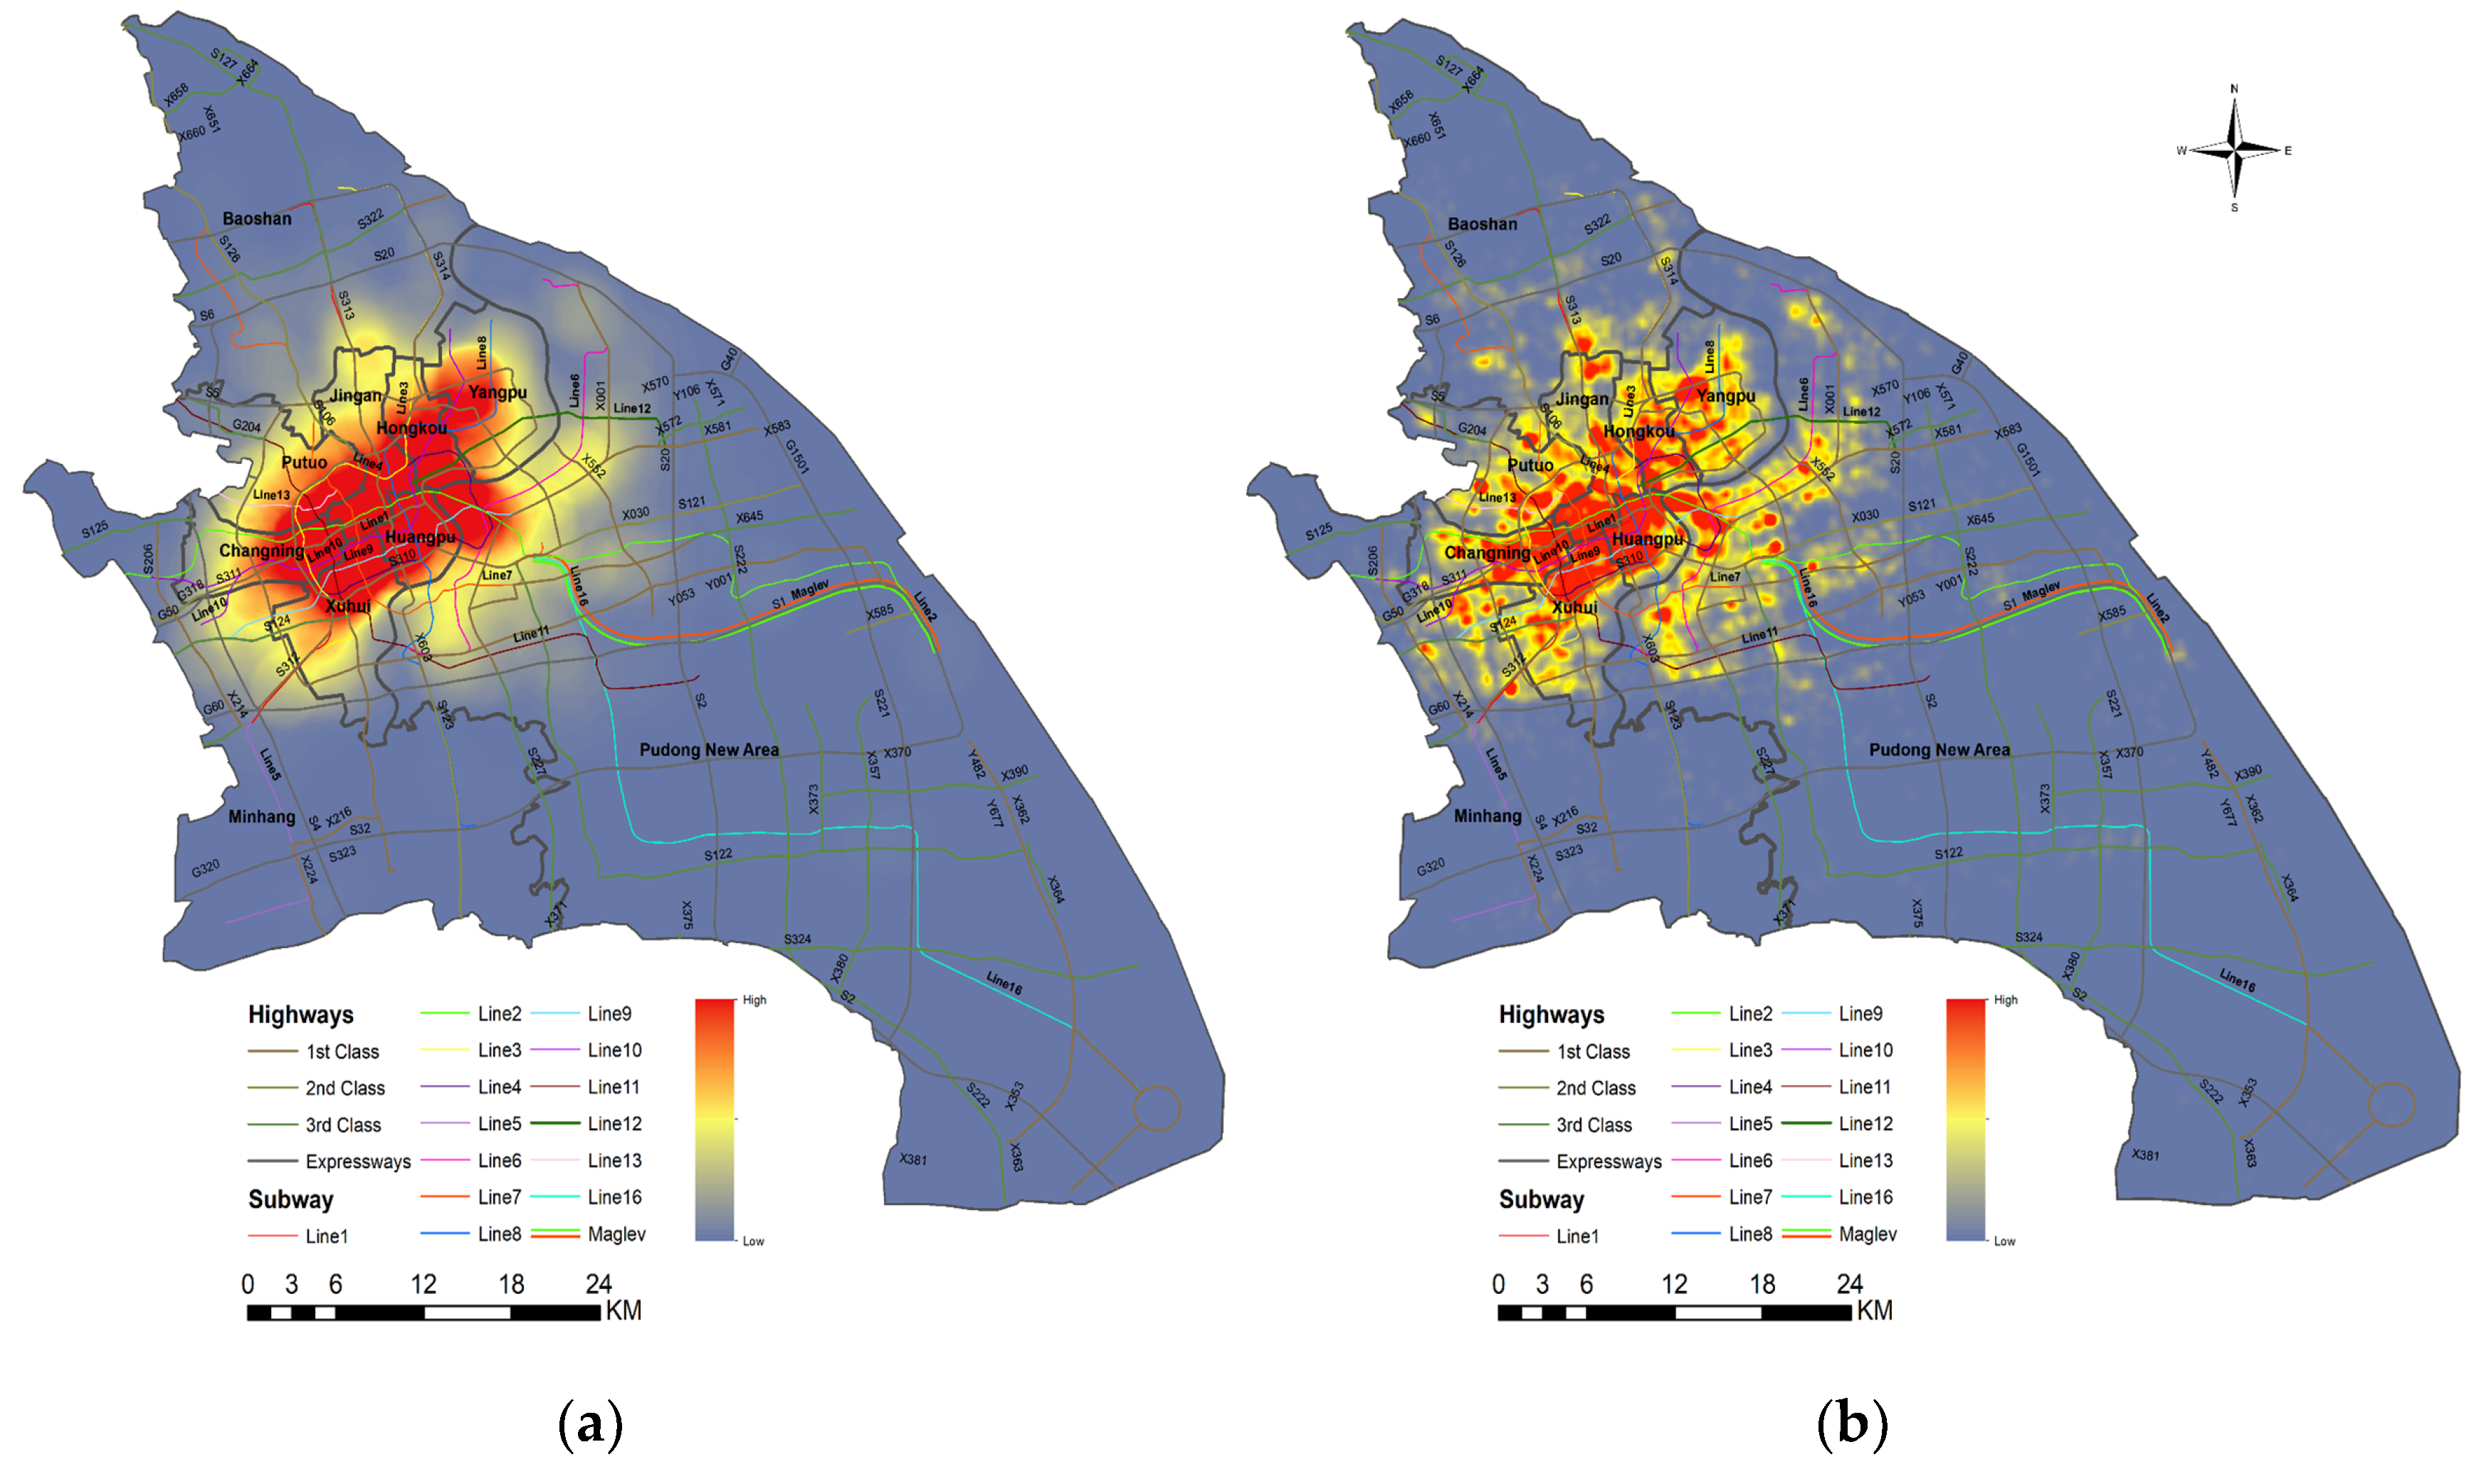
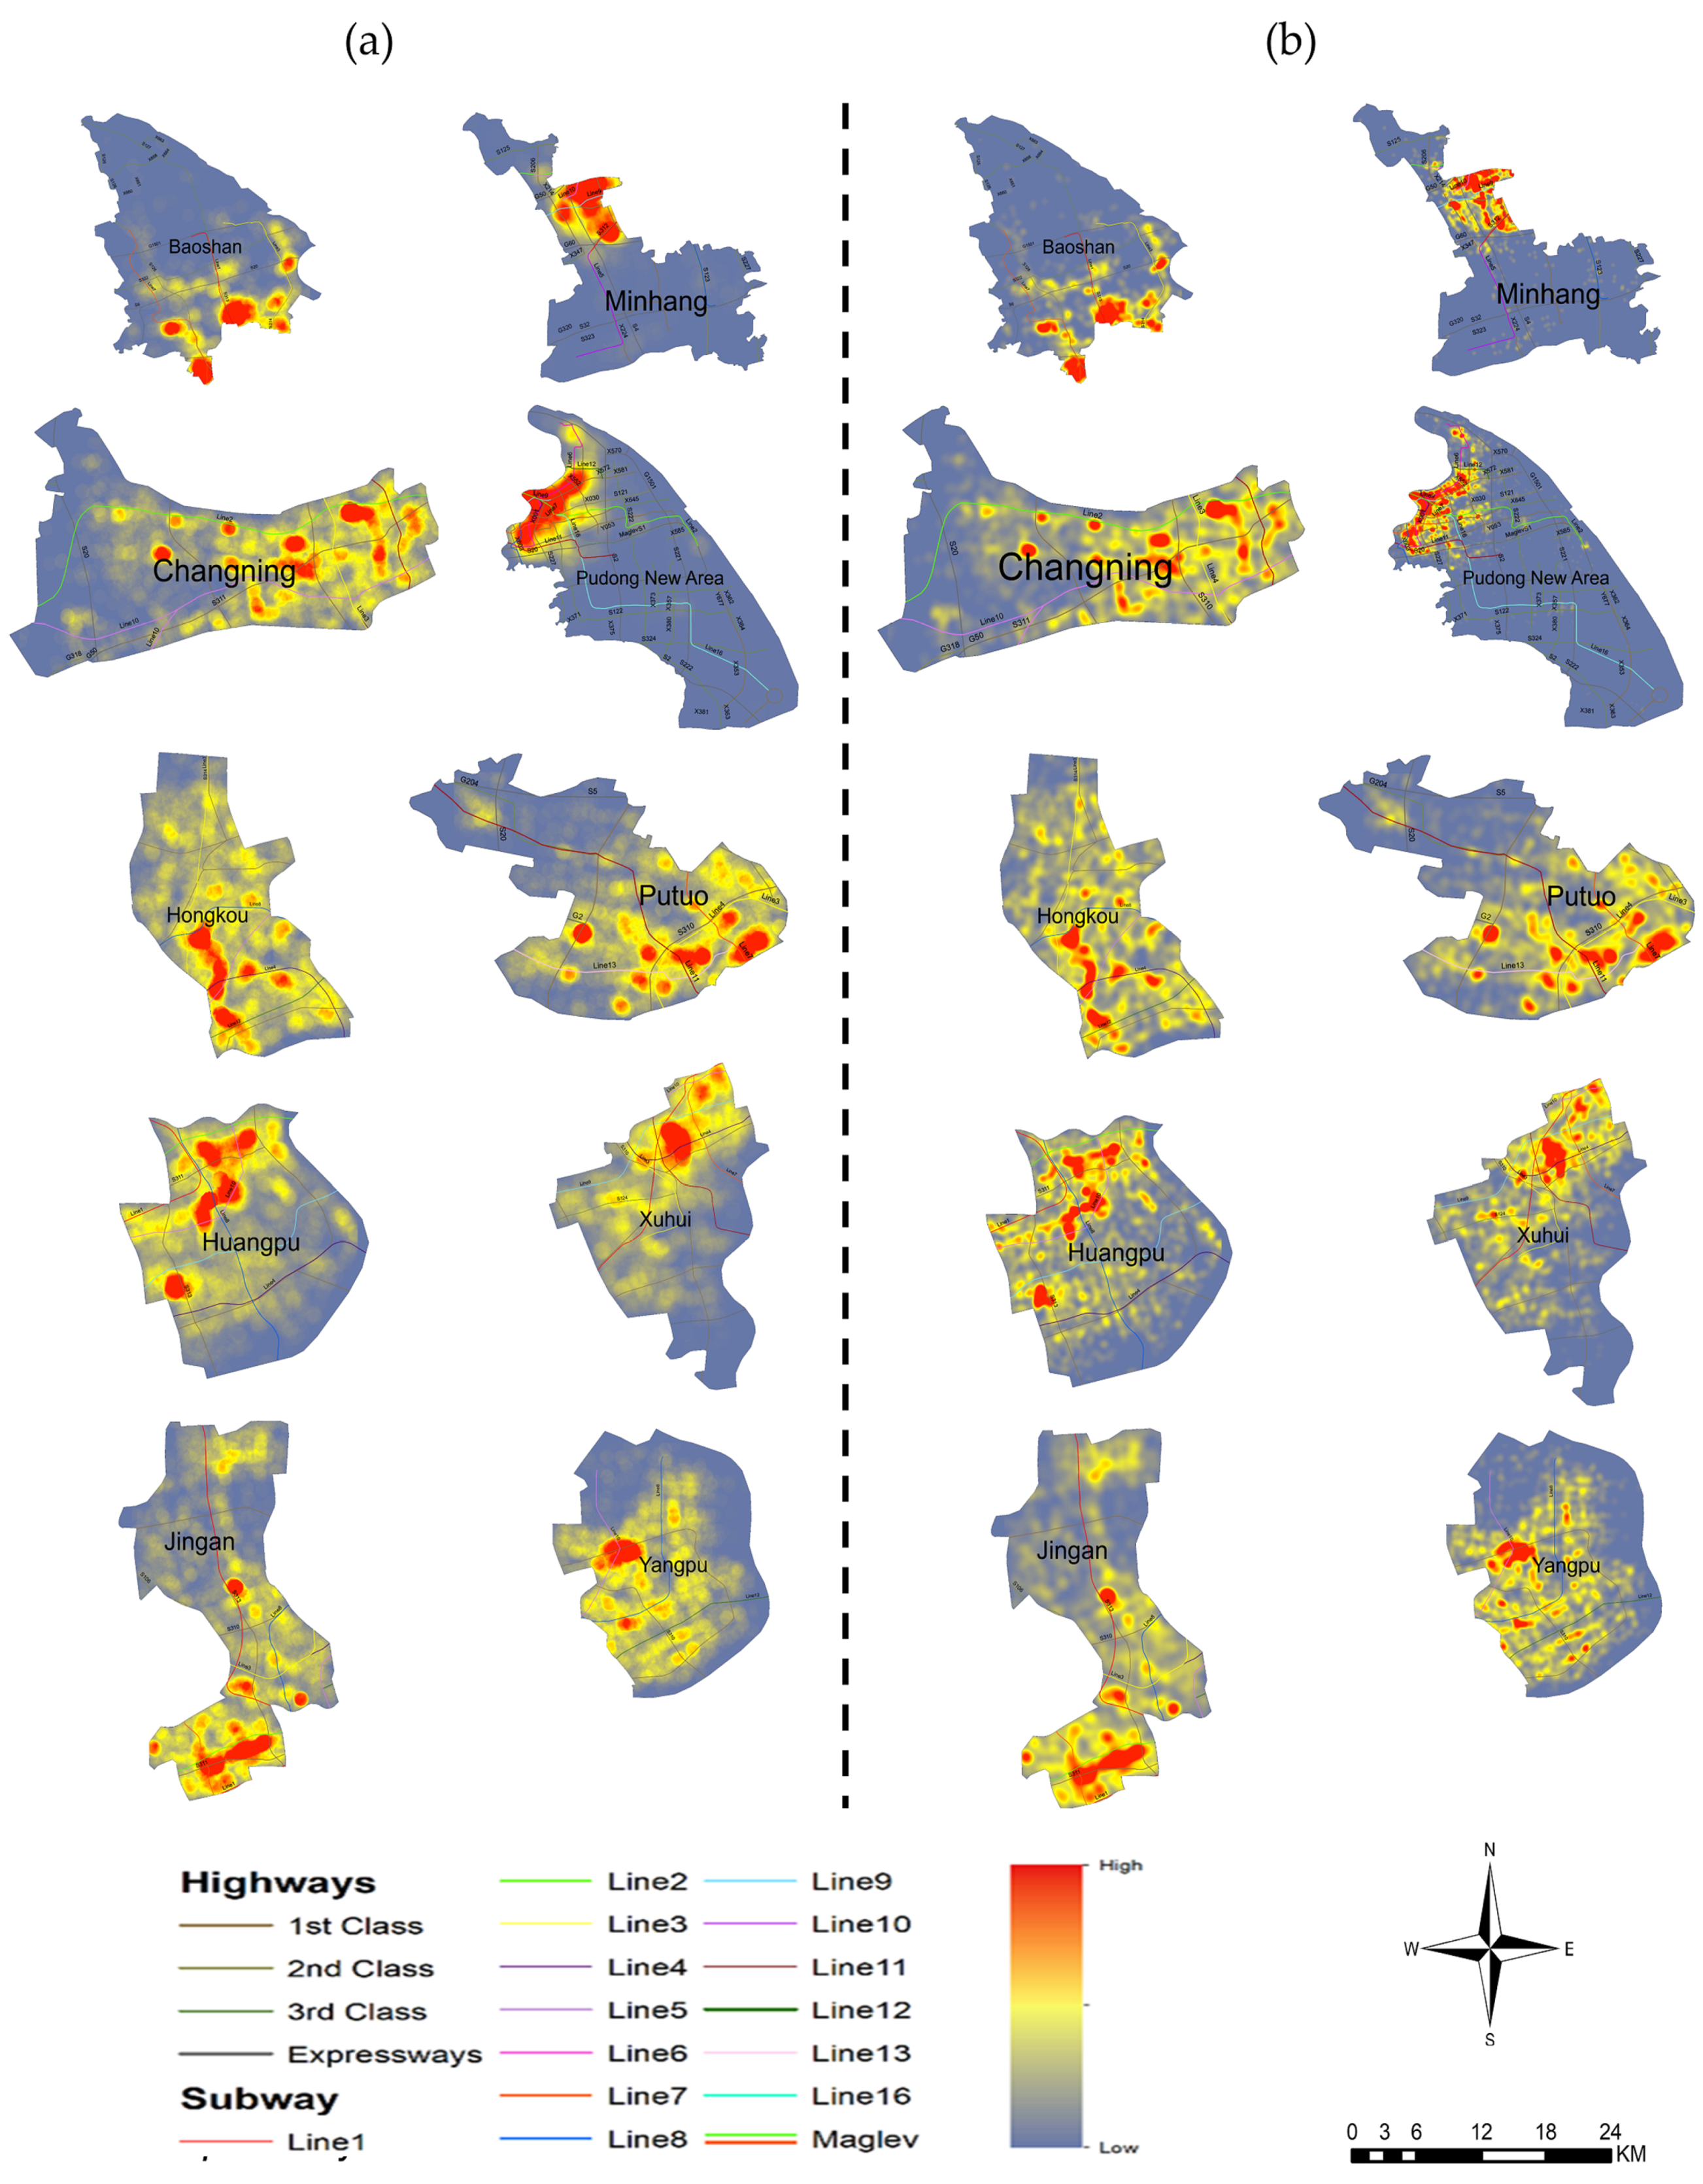
KDE is a non-parametric approach for estimating a density from a random sample taken out of the data [10]. KDE calculates smooth distributions by excluding the local noise to a particular degree, which minimizes the error by providing a non-parametric probability distribution with optimum bandwidth.
KDE is a density analysis method used to identify various location-based features such as time and destination in relation with each other and is an important density estimation technique that has been widely studied [49,50,51] for the analysis of different aspects of location-based social media data such as defining city boundaries [52], user activity and mobility patterns [53], point of interest recommendation [29] and check-in behavior [54]. The KDE approach has also been implemented in application areas such as epidemiology [55], marketing [56], and ecology [57] for modeling spatial-densities.
Let E be a set of historical data where e j = x ,   y is the geo-coordinates of a location, 1   j n , for an individual i . h j is the Euclidean distance to k th nearest neighbor e j in the training data. The KDE is expressed as follows:
f K D ( e | E ) = 1 n j = 1 n K h j ( e , e j )
K h = 1 2 π h exp ( 1 2 ( e , e i ) t h 1 ( e , e i ) )

5. Results

We used the geo-location/check-in dataset from Weibo for the analysis. The dataset contains multiple check-ins for every individual user. The check-in frequency of individuals can be observed in Figure 4.
Figure 5 represents the individual user’s check-ins during the study duration. It can be seen that some of the users made more than 2000 check-ins; similarly, the number of check-ins for every individual user is listed in the figure.
Table 6 illustrates the detailed distribution of users and their check-ins. Although the number of users in different districts is relatively similar, there is a huge variation in the number of check-ins at the district level. Table 6 indicates that the number of users and their check-ins are different in each district, yielding different concentrations and densities all over the study area as well as within these districts. The benefit of using such a dataset is that it is not focused on specific venues of specific regions but represents the general population of Shanghai.
The first method used to estimate the density of check-ins in Shanghai and for each district is point density estimation. The point density technique is univariate, therefore taking into account the location as a single case or point and calculating the density by considering the nearby cases/points. The data used for this analysis contain information only about the user location and user ID. Figure 6a interprets the point density of users in the study area of Shanghai, which clearly shows that the downtown area (city-center) of Shanghai is denser compared to the other districts. The density in the border of other districts close to the city-center is denser than suburban areas of Shanghai.
The city center demonstrates a higher check-ins density, taking in the account the whole study area, but given the variations in the area size of each district, we may not be able to determine the crowded areas specifically. In order to further analyze our results and visualization, we used the KDE technique with kth nearest neighbor, giving us a smooth density based on the same dataset. Figure 6b describes the overall density of users in the study area of Shanghai. We can observe that the check-in concentration in districts of Hongkou and Huangpu is high, followed by Xuhui, Changning, Putuo, Jingan, and Yangpu, while the districts with a large area size—i.e., Pudong New Area, Baoshan, and Minhang—show a lower concentration of check-ins because of the diverse population.
Figure 6b reveals the more accurate density at more specific areas as compared to the results from the point density. KDE is a bivariate technique for density estimation; thus, it does not only consider the individual points with a fixed number of check-ins with a certain area but gives us the relative density by distributing the area relative to the check-in, providing more accurate density for the whole study area. Compared to the results of Figure 6a, we can observe the concentration of users’ check-ins in specific areas of Hongkou and Huangpu instead of considering all of the districts as red (high density).
However, it is demonstrated that the areas near the city center are more crowded, having a higher density as compared to the suburban areas away from the city center. In order to gain a clearer understanding of the density in these districts, we apply the same technique—i.e., point density—for each district, giving us the density of check-ins at the district level, as shown in Figure 7a.
The red color depicts a high density of people in terms of the high concentration of social media users and high activity frequency. As the density estimation is based on the number of check-ins in relation to the area, the results for individual districts show different densities as compared to the densities of districts in the overall study area, as shown in Figure 7a. However, even on the district level, we can see that the density in Hongkou, Huangpu, Putuo, Jingan, Xuhui, and Yangpu show more and dispersed density all over these districts, and Baoshan, New Pudong Area, and Minhang show concentrations of density in the areas near the city center, confirming our observation that the city center has a higher density compared to other areas of the city.
Applying the KDE at the district level gives us the district level density, as shown in Figure 7b. Although the overall density remains the same, we can see the density of specific areas more clearly. The results in Figure 7b are based on data distribution in districts of Shanghai. It can be observed that even though the data in Pudong is highest, due to the large size of the area, the check-ins are scattered, which in turn shows the lowest density as compared to the city-center districts because the density is calculated as magnitude per area and Pudong is the biggest district in our study area. The areas of Jingan, Hongkou, and Huangpu are denser than other districts. It is important to consider that these three districts are the commercial center of Shanghai. Therefore, these areas are more facilitated in almost every aspect of life, including transportation, food, shopping malls, government offices, nightlife spots, etc.

6. Discussion

This study used geolocated social network check-in data as proxy for estimating the number of visits. This approach is time-efficient and labor-intensive, and also provide outstanding spatial coverage. LBSs are not only involve sharing information by the users about their activities and preferences, but also about where, what, why, and with whom they are sharing this information through the integration of technologies that have spurred on the development of LBSNs. As the research shows, Weibo data is a valuable tool for the evaluation of urban functionality and the study of spatiotemporal factors. The advantage of using social media data to evaluate user’s behavior is that we can collect contextual and large-scale knowledge about an entire city in more detail, for this reason Weibo data is the best source for geospatial data analysis.
KDE is a function in which events are balanced according to their distances and necessary two parameters. The first of these is the bandwidth, the distance of control. Bandwidth selection has a big effect on performance. The second parameter is the weighting function K, most often a normal function. The bandwidth of the kernel is a free parameter which displays a strong impact on the resulting estimate. The density is a normal density with mean 0 and variance 1. An extreme situation is encountered in the limit h → 0 (no smoothing), where the estimate is a sum of n delta functions centered at the coordinates of analyzed dataset.
Data availability has been the main obstacle for LBSN research, mainly because of privacy and personal security. With the ability of LBSNs to share the current geo-location of users and their friends’, there are major concerns about users’ privacy. Privacy is not only an issue for individuals, but it also extends to institutional or organizational users sharing their information in LBSNs. The private data can sometimes be shared either voluntarily or unsuspectingly. While sometimes the data can be extracted by offering some rewards and benefits to users, for which they provide their information intentionally, the location of a user can be identified through the LBSN services, such as Wechat Nearby. Some of the LBSN services provide features to identify their friends’ location as well [25,26].
From the results presented above, it can be concluded that the city-center of Shanghai has the highest check-in density. Moreover, the density is higher near the highways and subway, mainly due to the ease of access to transportation facilities. The results prove to be true to the ground reality as it is obvious that the city center and areas connected through the subway are the most crowded areas in any big city, along with some other tourism and educational institutions away from the city center [26,31,55]. To the best of our knowledge, this research might be the first study using Weibo data to analyze the denser places through KDE and Point density estimation by using check-in behavior in Shanghai. The identification of more dense and crowded areas in our study can be useful in many domains, allowing authorities to improve urban planning, crowd control in major events, or provide relevant insights to users on when to visit a specific place, among others.

7. Conclusions and Future Work

It is effective to use LBSNs to study activity patterns providing metadata of various modalities (photos, text, etc.) related to each user. To date, this information has been used and analyzed for different purposes, such as activity and location recommendation or characterizing neighborhoods. In this study, we have analyzed check-in patterns from the geo-information of the users based on the area. We have revealed interesting patterns (e.g., weak densities at borders and strong densities in the city-center) which mostly relate to and are in accordance with real-world expectations. Our data provide the advantage of representing the general behavior of an enormous number of users from assorted backgrounds. We analyzed the users’ check-in distribution in 10 different districts of Shanghai, highlighting various aspects of geo-referenced data. We applied point density to show the magnitude of users in Shanghai as well as in certain districts. To visualize our dataset in two dimensions, we applied kernel density to the same study area and dataset. We also used regression models for the significance of the dataset. This study can be helpful in identifying crowded areas in Shanghai so that regulatory or managing authorities can monitor and facilitate those areas more efficiently, especially in festivals, public events, disasters, urban planning, etc. However, by using and comparing two different techniques i.e., point density and KDE, we not only provide comparisons among results but validate our results as well. This study can play a useful role in the development and maintenance of a smart city. The purpose of this research is to provide the evidences of denser places to the authorities and it will be helpful to control the mobility of people and making the places safer for the visitors or residents, because Shanghai is one the most populated area in China and its really necessary to overcome this situation by arrangements for the people to make it secure smart city.
There are a number of aspects that can be explored further in the future; the study can be carried out for other traits such as gender, venue categories and spatial distribution across different timescales with more attributes such as age, income, marital status, etc., and also highlight the point of interest objects in the study area to explore the spatial distribution of users in more depth.

Author Contributions

S.A.H. conceived the research; S.A.H. designed the research; S.A.H., S.S.R., S.J.K., H.U., and N.U.K. performed the simulations; S.A.H., H.U., N.U.K. and K.F. wrote the article and S.J.K. and S.S.R. proofread the article for language editing. All authors have read and agreed to the published version of the manuscript.

Funding

This work was supported by the Basic Science Research through the National Research Foundation of Korea (NRF) funded by the Ministry of Education under Grant NRF-2017R1D1A3B04031440.

Conflicts of Interest

The authors declare no conflicts of interest.

References

  1. Tenkanen, H.; Di Minin, E.; Heikinheimo, V.; Hausmann, A.; Herbst, M.; Kajala, L.; Toivonen, T. Instagram, Flickr, or Twitter: Assessing the usability of social media data for visitor monitoring in protected areas. Sci. Rep. 2017, 7, 17615. [Google Scholar] [CrossRef] [PubMed] [Green Version]
  2. Weibo. Available online: https://www.weibo.com (accessed on 25 June 2019).
  3. Waller, L.A.; Gotway, C.A. Applied Spatial Statistics for Public Health Data; John Wiley & Sons: Hoboken, NJ, USA, 2004; Volume 368. [Google Scholar]
  4. Zhang, G.; Zhu, A.-X.; Huang, Q. A GPU-accelerated adaptive kernel density estimation approach for efficient point pattern analysis on spatial big data. Int. J. Geogr. Inf. Sci. 2017, 31, 2068–2097. [Google Scholar] [CrossRef]
  5. Haidery, S.A. Spatial Analysis To Observe Urban Functionalities Using Location-Based Social Network; Shanghai Uinversity: Shanghai, China, 2019. [Google Scholar]
  6. Cranshaw, J.; Schwartz, R.; Hong, J.; Sadeh, N. The livehoods project: Utilizing social media to understand the dynamics of a city. In Proceedings of the 6th International AAAI Conference on Weblogs and Social Media, Dublin, Ireland, 4–7 June 2012. [Google Scholar]
  7. Gray, A.G.; Moore, A.W. Nonparametric density estimation: Toward computational tractability. In Proceedings of the 2003 SIAM International Conference on Data Mining, San Francisco, CA, USA, 1–3 May 2003; pp. 203–211. [Google Scholar]
  8. Huang, H.-Y. Examining the beneficial effects of individual’s self-disclosure on the social network site. Comput. Hum. Behav. 2016, 57, 122–132. [Google Scholar] [CrossRef]
  9. Chang, J.; Sun, E. Location3: How users share and respond to location-based data on social. In Proceedings of the 5th International AAAI Conference on Weblogs and Social Media, Barcelona, Spain, 17–21 July 2011. [Google Scholar]
  10. Silverman, B.W. Density Estimation for Statistics and Data Analysis; Routledge: London, UK, 2018. [Google Scholar]
  11. Wang, Y.; Yuan, N.J.; Lian, D.; Xu, L.; Xie, X.; Chen, E.; Rui, Y. Regularity and conformity: Location prediction using heterogeneous mobility data. In Proceedings of the 21th ACM SIGKDD International Conference on Knowledge Discovery and Data Mining, Sydney, Australia, 10–13 August 2015; pp. 1275–1284. [Google Scholar]
  12. Sadilek, A.; Kautz, H.; Silenzio, V. Modeling spread of disease from social interactions. In Proceedings of the 6th International AAAI Conference on Weblogs and Social Media, Dublin, Ireland, 4–7 June 2012. [Google Scholar]
  13. Evangelista, P.F.; Beskow, D. Geospatial Point Density. R J. 2018, 10. [Google Scholar] [CrossRef] [Green Version]
  14. Gao, C.; Wang, X.; Jiang, T.; Jin, G. Spatial distribution of archaeological sites in lakeshore of Chaohu Lake in China based on GIS. Chin. Geogr. Sci. 2009, 19, 333. [Google Scholar] [CrossRef] [Green Version]
  15. Point Density for Geospatial Data. Available online: https://cran.r-project.org/web/packages/pointdensityP/index.html (accessed on 18 February 2019).
  16. Meullenet, J.F.; Lovely, C.; Threlfall, R.; Morris, J.; Striegler, R. An ideal point density plot method for determining an optimal sensory profile for Muscadine grape juice. Food Qual. Prefer. 2008, 19, 210–219. [Google Scholar] [CrossRef]
  17. Ruckthongsook, W.; Tiwari, C.; Oppong, J.R.; Natesan, P.R. Evaluation of threshold selection methods for adaptive kernel density estimation in disease mapping. Int. J. Health Geogr. 2018, 17, 10. [Google Scholar] [CrossRef] [Green Version]
  18. Lichman, M.; Smyth, P. Modeling human location data with mixtures of kernel densities. In Proceedings of the 20th ACM SIGKDD International Conference on Knowledge Discovery and Data Mining, New York, NY, USA, 24–27 August 2014; pp. 35–44. [Google Scholar]
  19. Qasim, A.A.; Hina, M.; Imran, M.; Muhammad Hammad, M.; Riaz Ahmed, S.; Farman Ali, M. Intelligent travel information platform based on location base services to predict user travel behavior from user-generated GPS traces. Int. J. Comput. Appl. 2017, 39, 155–168. [Google Scholar]
  20. Carlos, H.A.; Shi, X.; Sargent, J.; Tanski, S.; Berke, E.M. Density estimation and adaptive bandwidths: A primer for public health practitioners. Int. J. Health Geogr. 2010, 9, 39. [Google Scholar] [CrossRef] [Green Version]
  21. Wu, C.O. A cross-validation bandwidth choice for kernel density estimates with selection biased data. J.Multivar. Anal. 1997, 61, 38–60. [Google Scholar] [CrossRef] [Green Version]
  22. Ullah, H.; Wan, W.; Haidery, S.A.; Khan, N.U.; Ebrahimpour, Z.; Muzahid, A.A.M. Muzahid. Spatiotemporal Patterns of Visitors in Urban Green Parks by Mining Social Media Big Data based upon WHO reports. IEEE Access 2020, 8, 39197–39211. [Google Scholar] [CrossRef]
  23. Rizwan, M.; Wan, W.; Cervantes, O.; Gwiazdzinski, L. Using location-based social media data to observe check-in behavior and gender difference: Bringing weibo data into play. ISPRS Int. J. Geo-Inf. 2018, 7, 196. [Google Scholar] [CrossRef] [Green Version]
  24. Khan, N.U.; Wan, W.; Yu, S. Spatiotemporal Analysis of Tourists and Residents in Shanghai Based on Location-Based Social Network’s Data from Weibo. ISPRS Int. J. Geo-Inf. 2020, 9, 70. [Google Scholar] [CrossRef] [Green Version]
  25. Ebrahimpour, Z.; Wan, W.; Velázquez García, J.L.; Cervantes, O.; Hou, L. Analyzing Social-Geographic Human Mobility Patterns Using Large-Scale Social Media Data. ISPRS Int. J. Geo-Inf. 2020, 9, 125. [Google Scholar] [CrossRef] [Green Version]
  26. Li, H.; Ge, Y.; Hong, R.; Zhu, H. Point-of-interest recommendations: Learning potential check-ins from friends. In Proceedings of the 22nd ACM SIGKDD International Conference on Knowledge Discovery and Data Mining, San Francisco, CA, USA, 13–17 August 2016; pp. 975–984. [Google Scholar]
  27. Bao, M.; Yang, N.; Zhou, L.; Lao, Y.; Zhang, Y.; Tian, Y. The Spatial Analysis of Weibo Check-in Data: The Case Study of Wuhan. In Proceedings of the International Conference on Geo-Informatics in Resource Management and Sustainable Ecosystem, Ypsilanti, MI, USA, 3–5 October 2014; pp. 480–491. [Google Scholar]
  28. Rizwan, M.; Wan, W. Big Data Analysis to Observe Check-in Behavior Using Location-Based Social Media Data. Information 2018, 9, 257. [Google Scholar] [CrossRef] [Green Version]
  29. Lazzari, M.; Murgante, B. Kernel density estimation methods for a geostatistical approach in seismic risk analysis: The case study of potenza hilltop town (Southern italy). In Proceedings of the International Conference on Computational Science and Its Applications, Saint Petersburg, Russia, 1–4 July 2019; pp. 415–429. [Google Scholar]
  30. O’Sullivan David, W.D.W. A surface-based approach to measuring spatial segregation. Geogr. Anal. 2007, 39, 147–168. [Google Scholar] [CrossRef]
  31. Li, J.; Fang, W.; Wang, T.; Qureshi, S.; Alatalo, J.; Bai, Y. Correlations between socioeconomic drivers and indicators of urban expansion: Evidence from the heavily urbanised shanghai metropolitan area, China. Sustainability 2017, 9, 1199. [Google Scholar] [CrossRef] [Green Version]
  32. Hidayat Ullah, W.W.; Wan, W.; Ali Haidery, S.; Khan, N.U.; Ebrahimpour, Z.; Luo, T. Analyzing the Spatiotemporal Patterns in Green Spaces for Urban Studies Using Location-Based Social Media Data. ISPRS Int. J. Geo-Inf. 2019, 8, 506. [Google Scholar] [CrossRef] [Green Version]
  33. Guo, R. Regional China: A Business and Economic Handbook; Springer: Berlin, Germany, 2013. [Google Scholar]
  34. Shanghai’s GDP. Available online: http://www.xinhuanet.com/english/2019-01/22/c_137765564.htm (accessed on 29 December 2019).
  35. Shanghai National Economic and Social Development Statistics. Available online: http://tjj.sh.gov.cn/html/sjfb/201903/1003219.html (accessed on 29 December 2019).
  36. Xiong, X.; Jin, C.; Chen, H.; Luo, L. Using the fusion proximal area method and gravity method to identify areas with physician shortages. PLoS ONE 2016, 11, e0163504. [Google Scholar] [CrossRef]
  37. Shen, J.; Kee, G. Shanghai: Urban development and regional integration through mega projects. In Development and Planning in Seven Major Coastal Cities in Southern and Eastern China; Springer: Berlin, Germany, 2017; pp. 119–151. [Google Scholar]
  38. Weibo Report. Available online: http://ir.weibo.com/news-releases/news-release-details/weibo-corporation-report-fourth-quarter-and-fiscal-year-2018 (accessed on 10 June 2019).
  39. Rizwan, M.; Wan, W.; Gwiazdzinski, L. Visualization, Spatiotemporal Patterns, and Directional Analysis of Urban Activities Using Geolocation Data Extracted from LBSN. ISPRS Int. J. Geo-Inf. 2020, 9, 137. [Google Scholar] [CrossRef] [Green Version]
  40. Weibo API. Available online: https://open.weibo.com/wiki/API (accessed on 14 July 2019).
  41. Batrinca, B.; Treleaven, P. Social media analytics: A survey of techniques, tools and platforms. AI Soc. 2015, 30, 89–116. [Google Scholar] [CrossRef] [Green Version]
  42. JavaScript Object Notation. Available online: https://en.wikipedia.org/wiki/JSON (accessed on 29 December 2019).
  43. Savitch, W.; Mock, K. Java: An Introduction to Problem Solving and Programming, 6th ed.; Pearson Education: London, UK, 2011. [Google Scholar]
  44. CSV Format. Available online: https://en.wikipedia.org/wiki/Comma-separated_values (accessed on 26 December 2019).
  45. Abidi, S.; Hussain, M.; Xu, Y.; Zhang, W. Prediction of Confusion Attempting Algebra Homework in an Intelligent Tutoring System through Machine Learning Techniques for Educational Sustainable Development. Sustainability 2019, 11, 105. [Google Scholar] [CrossRef] [Green Version]
  46. R Language. Available online: https://cran.rproject.org (accessed on 12 May 2019).
  47. R Studio. Available online: https://www.rstudio.com (accessed on 12 May 2019).
  48. Mougiakou, E.; Photis, Y.N. Urban green space network evaluation and planning: Optimizing accessibility based on connectivity and raster GIS analysis. Eur. J. Geogr. 2014, 5, 19–46. [Google Scholar]
  49. Wu, C.; Ye, X.; Ren, F.; Wan, Y.; Ning, P.; Du, Q. Spatial and Social Media Data Analytics of Housing Prices in Shenzhen, China. PLoS ONE 2016, 11, e0164553. [Google Scholar] [CrossRef]
  50. Rizwan, M.; Mahmood, S.; Wanggen, W.; Ali, S. Location based social media data analysis for observing check-in behavior and city rhythm in shanghai. In Proceedings of the 4th International Conference on Smart and Sustainable City (ICSSC), Shanghai, China, 5–6 June 2017. [Google Scholar]
  51. Silverman, B. Density Estimation for Statistics and Data Analysis; CRC Press, Inc.: Boca Raton, FL, USA, 1986. [Google Scholar]
  52. Sun, Y.; Fan, H.; Li, M.; Zipf, A. Identifying the city center using human travel flows generated from location-based social networking data. Environ. Plan. B Plan. Design 2016, 43, 480–498. [Google Scholar] [CrossRef]
  53. Hasan, S.; Zhan, X.; Ukkusuri, S.V. Understanding urban human activity and mobility patterns using large-scale location-based data from online social media. In Proceedings of the 2nd ACM SIGKDD International Workshop on Urban Computing, Chicago, IL, USA, 11 August 2013; p. 6. [Google Scholar]
  54. Li, L.; Goodchild, M.F.; Xu, B. Spatial, temporal, and socioeconomic patterns in the use of Twitter and Flickr. Cartogr. Geogr. Inf. Sci. 2013, 40, 61–77. [Google Scholar] [CrossRef]
  55. Kirby, R.S.; Delmelle, E.; Eberth, J.M. Advances in spatial epidemiology and geographic information systems. Ann. Epidemiol. 2017, 27, 1–9. [Google Scholar] [CrossRef]
  56. Mukherjee, A. Characterizing Product Lifecycle in Online Marketing: Sales, Trust, Revenue, and Competition Modeling. arXiv 2017, arXiv:1704.02993. [Google Scholar]
  57. Estes, L.; Elsen, P.R.; Treuer, T.; Ahmed, L.; Caylor, K.; Chang, J.; Choi, J.J.; Ellis, E.C. The spatial and temporal domains of modern ecology. Nat. Ecol. Evol. 2018, 2, 819–826. [Google Scholar] [CrossRef]
Figure 1. Study area.
Electronics 09 00837 g001
Figure 2. Criteria.
Figure 2. Criteria.
Electronics 09 00837 g002
Figure 3. The process flow for data acquisition. CSV: comma-separated values.
Electronics 09 00837 g003
Figure 4. Methodology.
Electronics 09 00837 g004
Figure 5. The frequency of check-ins per user.
Electronics 09 00837 g005
Figure 6. (a) Point density and (b) kernel density estimation (KDE) of check-ins distribution in the study area.
Electronics 09 00837 g006
Figure 7. Check-ins distribution in the districts of Shanghai. (a) Point density; (b) kernel density.
Electronics 09 00837 g007
Table 1. Dataset sample.
IDLatitudeLongitude
1987068471121.501210731.2605724
3292139955121.53046131.334979
2425639602121.539946131.27232846
5404478798121.54444931.268159
Table 2. Example of Weibo check-in.
Status_IDUser_IDUser_NameMonthDateTimeYearGenderLongitudeLatitudeAddress
3943172612597320### *### *03133:02:122016M121.396931.3984### *, Jufengyuan Road, Baoshan District
* For information privacy reasons, data are represented as “#”.
Table 3. Final multiple linear regression model interpretation.
Min  1Q  Median  3Q  Max
−23.7348 −0.6238 0.2834 0.8349 2.0153
CoefficientsEstimateStd. Errort ValuePr (>|t|)
Intercept4.84210880.0164305294.703<2 × 10⁻¹⁶***
Baoshan0.01599320.00294415.4325.69 × 10−8***
Changning0.00658550.00215463.0560.002245**
Hongkou0.00791450.00246443.2110.001325**
Huangpu0.01479660.00192937.6691.88 × 10−14***
Jingan0.00160870.0019760.8140.415602
Minhang0.0149820.00280925.3339.86 × 10−8***
Pudong New Area0.00390080.00132752.9380.003307**
Putuo0.00848510.00228253.7170.000202***
Xuhui0.00917360.00194754.712.50 × 10−6***
Yangpu0.00899360.00214944.1842.89 × 10−5***
Significance codes: 0 ‘***’ 0.001 ‘**’ 0.01 ‘*’ 0.05 ‘.’ 0.1 ‘·’ 1, annotation = ***: Significance level: 0.001, p-value: [0, 0.001], **: significance level: 0.01, p-value: (0.001, 0.01], *: significance level: 0.05, p-value: (0.01, 0.05], significance level: 0.1, p-value: (0.05, 0.01], blank space: significance level: 1, p-value: (0.1, 1].
Table 4. Regression statistics summary.
Residual Standard ErrorDegrees of FreedomMultiple R-SquaredAdjusted R-SquaredF-Statisticsp-Value
1.19102990.39160.3951397.3<2.2 × 10⁻⁶
Table 5. Analysis of variance (ANOVA).
Response: Number of Check-ins
DfSum SqMean SqF ValuePr (>F)
Baoshan17238.27238.25109.7946<2.2 × 10⁻¹⁶***
Changning112511251883.1285<2.2 × 10⁻¹⁶***
Hongkou1307.7307.7217.2498<2.2 × 10⁻¹⁶***
Huangpu1339.1339.1239.3547<2.2 × 10⁻¹⁶***
Jingan135.935.925.33244.91 × 10−7***
Minhang177.777.754.86391.39 × 10−13***
Pudong New Area134.234.224.14149.09 × 10−7***
Putuo131.731.722.36382.29 × 10−6***
Xuhui130.430.421.43923.70 × 10−6***
Yangpu119.919.914.0680.0001773***
Residuals1029914588.91.4
Significance codes: 0 ‘***’ 0.001 ‘**’ 0.01 ‘*’ 0.05 ‘.’ 0.1 ‘·‘ 1, annotation = ***: significance level: 0.001, p-value: [0, 0.001], **: significance level: 0.01, p-value: (0.001, 0.01], *: significance level: 0.05, p-value: (0.01, 0.05], significance level: 0.1, p-value: (0.05, 0.01], blank space: significance level: 1, p-value: (0.1, 1].
Table 6. User and check-in distributions in districts of Shanghai.
DistrictNo. of UsersNo. of Check-Ins% Check-Ins
Baoshan507439,6035.02%
Changning672270,0268.88%
Hongkou597853,9836.84%
Huangpu750392,19511.69%
Jingan727685,40110.83%
Minhang546643,7395.55%
Pudong8802173,93822.06%
Putuo652164,0238.12%
Xuhui743291,18811.56%
Yangpu681172,5569.20%

