Article

Wearable Multimodal Skin Sensing for the Diabetic Foot

by
James Coates
1,*,†,
Andrew Chipperfield
1,† and
Geraldine Clough
2,†
1
Department of Engineering and the Environment, University of Southampton, University Rd, SO17 1BJ Southampton, UK
2
Inst. of Developmental Sciences — Faculty of Medicine, University of Southampton, Southampton General Hospital, SO16 6YD Southampton, UK
*
Author to whom correspondence should be addressed.
These authors contributed equally to this work.
Electronics 2016, 5(3), 45; https://doi.org/10.3390/electronics5030045
Submission received: 29 January 2016 / Revised: 27 May 2016 / Accepted: 4 July 2016 / Published: 28 July 2016
(This article belongs to the Special Issue Raspberry Pi Technology)

Abstract

:
Ulceration of the diabetic foot is currently difficult to detect reliably in a timely manner causing undue suffering and cost. Current best practice is for daily monitoring by those living with diabetes coupled to scheduled monitoring by the incumbent care provider. Although some metrics have proven useful in the detection or prediction of ulceration, no single metric can currently be relied upon for diagnosis. We have developed a prototype multivariate extensible sensor platform with which we demonstrate the ability to gather acceleration, rotation, galvanic skin response, environmental temperature, humidity, force, skin temperature and bioimpedance signals in real time, for later analysis, utilising low cost Raspberry Pi and Arduino devices. We demonstrate the utility of the Raspberry Pi computer in research which is of particular interest to this issue of electronics—Raspberry Pi edition. We conclude that the hardware presented shows potential as an adaptable research tool capable of gathering synchronous data over multiple sensor modalities. This research tool will be utilised to optimise sensor selection, placement and algorithm development prior to translation into a sock, insole or platform diagnostic device at a later date. The combination of a number of clinically relevant parameters is expected to provide greater understanding of tissue state in the foot but requires further volunteer testing and analysis beyond the scope of this paper which will be reported in due course.

Graphical Abstract

1. Introduction

In this paper we concentrate on the design and implementation of a prototype in shoe sensing device with which to investigate diabetic foot disorder. We have endeavoured to use low cost commodity technology as cost is a significant inhibitor to the adoption of new technology. This approach made the Raspberry Pi [1] an attractive option for controlling data acquisition with low purchase cost, native python environment together with LAN connection, multiple USB ports and a native desktop environment significantly reducing development time. The Rasbian OS [2] proved to be a very stable data collection platform benefiting from having few background tasks running, dramatically improving the stability of time critical tasks when compared to a PC or Apple computer.
Diabetes is a chronic endocrine condition that can develop at any stage of life and affects the body’s production and/or utilisation of insulin leading to poor regulation of blood glucose levels. Unless well controlled this can cause vascular disease and neuropathy throughout the body often leading to serious comorbidities such as retinopathy, renal failure and diabetic foot disorder [3]. Diabetic foot disorder is classed as a medical emergency as it can become sufficiently severe as to require amputation and is the second most feared comorbidity of diabetes after blindness. Diabetes is also financially constraining currently costing the NHS 10% of its annual budget which is expected to rise to 17% by 2035 in direct costs [3,4].
Current best practice recommends patients perform daily monitoring of their feet supported by regular physical examination by trained specialists, with the use of non-contact thermometry for those at greatest risk. With a ΔT of 2.2 C between the same sites on opposing feet being a reliable indicator of infection [5] and ΔT of 4.6 C being indicative of neuropathic ulcers [6]. Although non contact thermometry reduces the chance of ulceration it remains a significant risk.
Many single metrics such as temperature [7,8], plantar pressure/force [9,10] in various forms, gait change [11] and blood flow have been shown to be indicative of ulceration but none are wholly reliable predictors of ulceration. Comercial devices such as the Sensoria sock [12], which incorporates three force sensors and a triple axis accelerometer, are available as commodity devices. Devices such as the TekScan mat [13] and F-Scan [14] are specifically for laboratory or clinical use. We present a new extensible, wearable composite sensing system that is capable of measuring multiple factors simultaneously, providing an alternate multifactorial pathway for predicting tissue failure. The device increases the number of metrics previously measured in concert in predicate devices from 3 to 8 [15,16].
In Section 2 we present the design of the experimental platform noting architecture, module design considerations, structure, validation and calibration. In Section 3 we present our experimental method with results discussed in Section 4. Finally a discussion of the benefits, risks and challenges for in shoe monitoring both in the laboratory and free living environments is presented in Section 5.

2. Experimental Platform
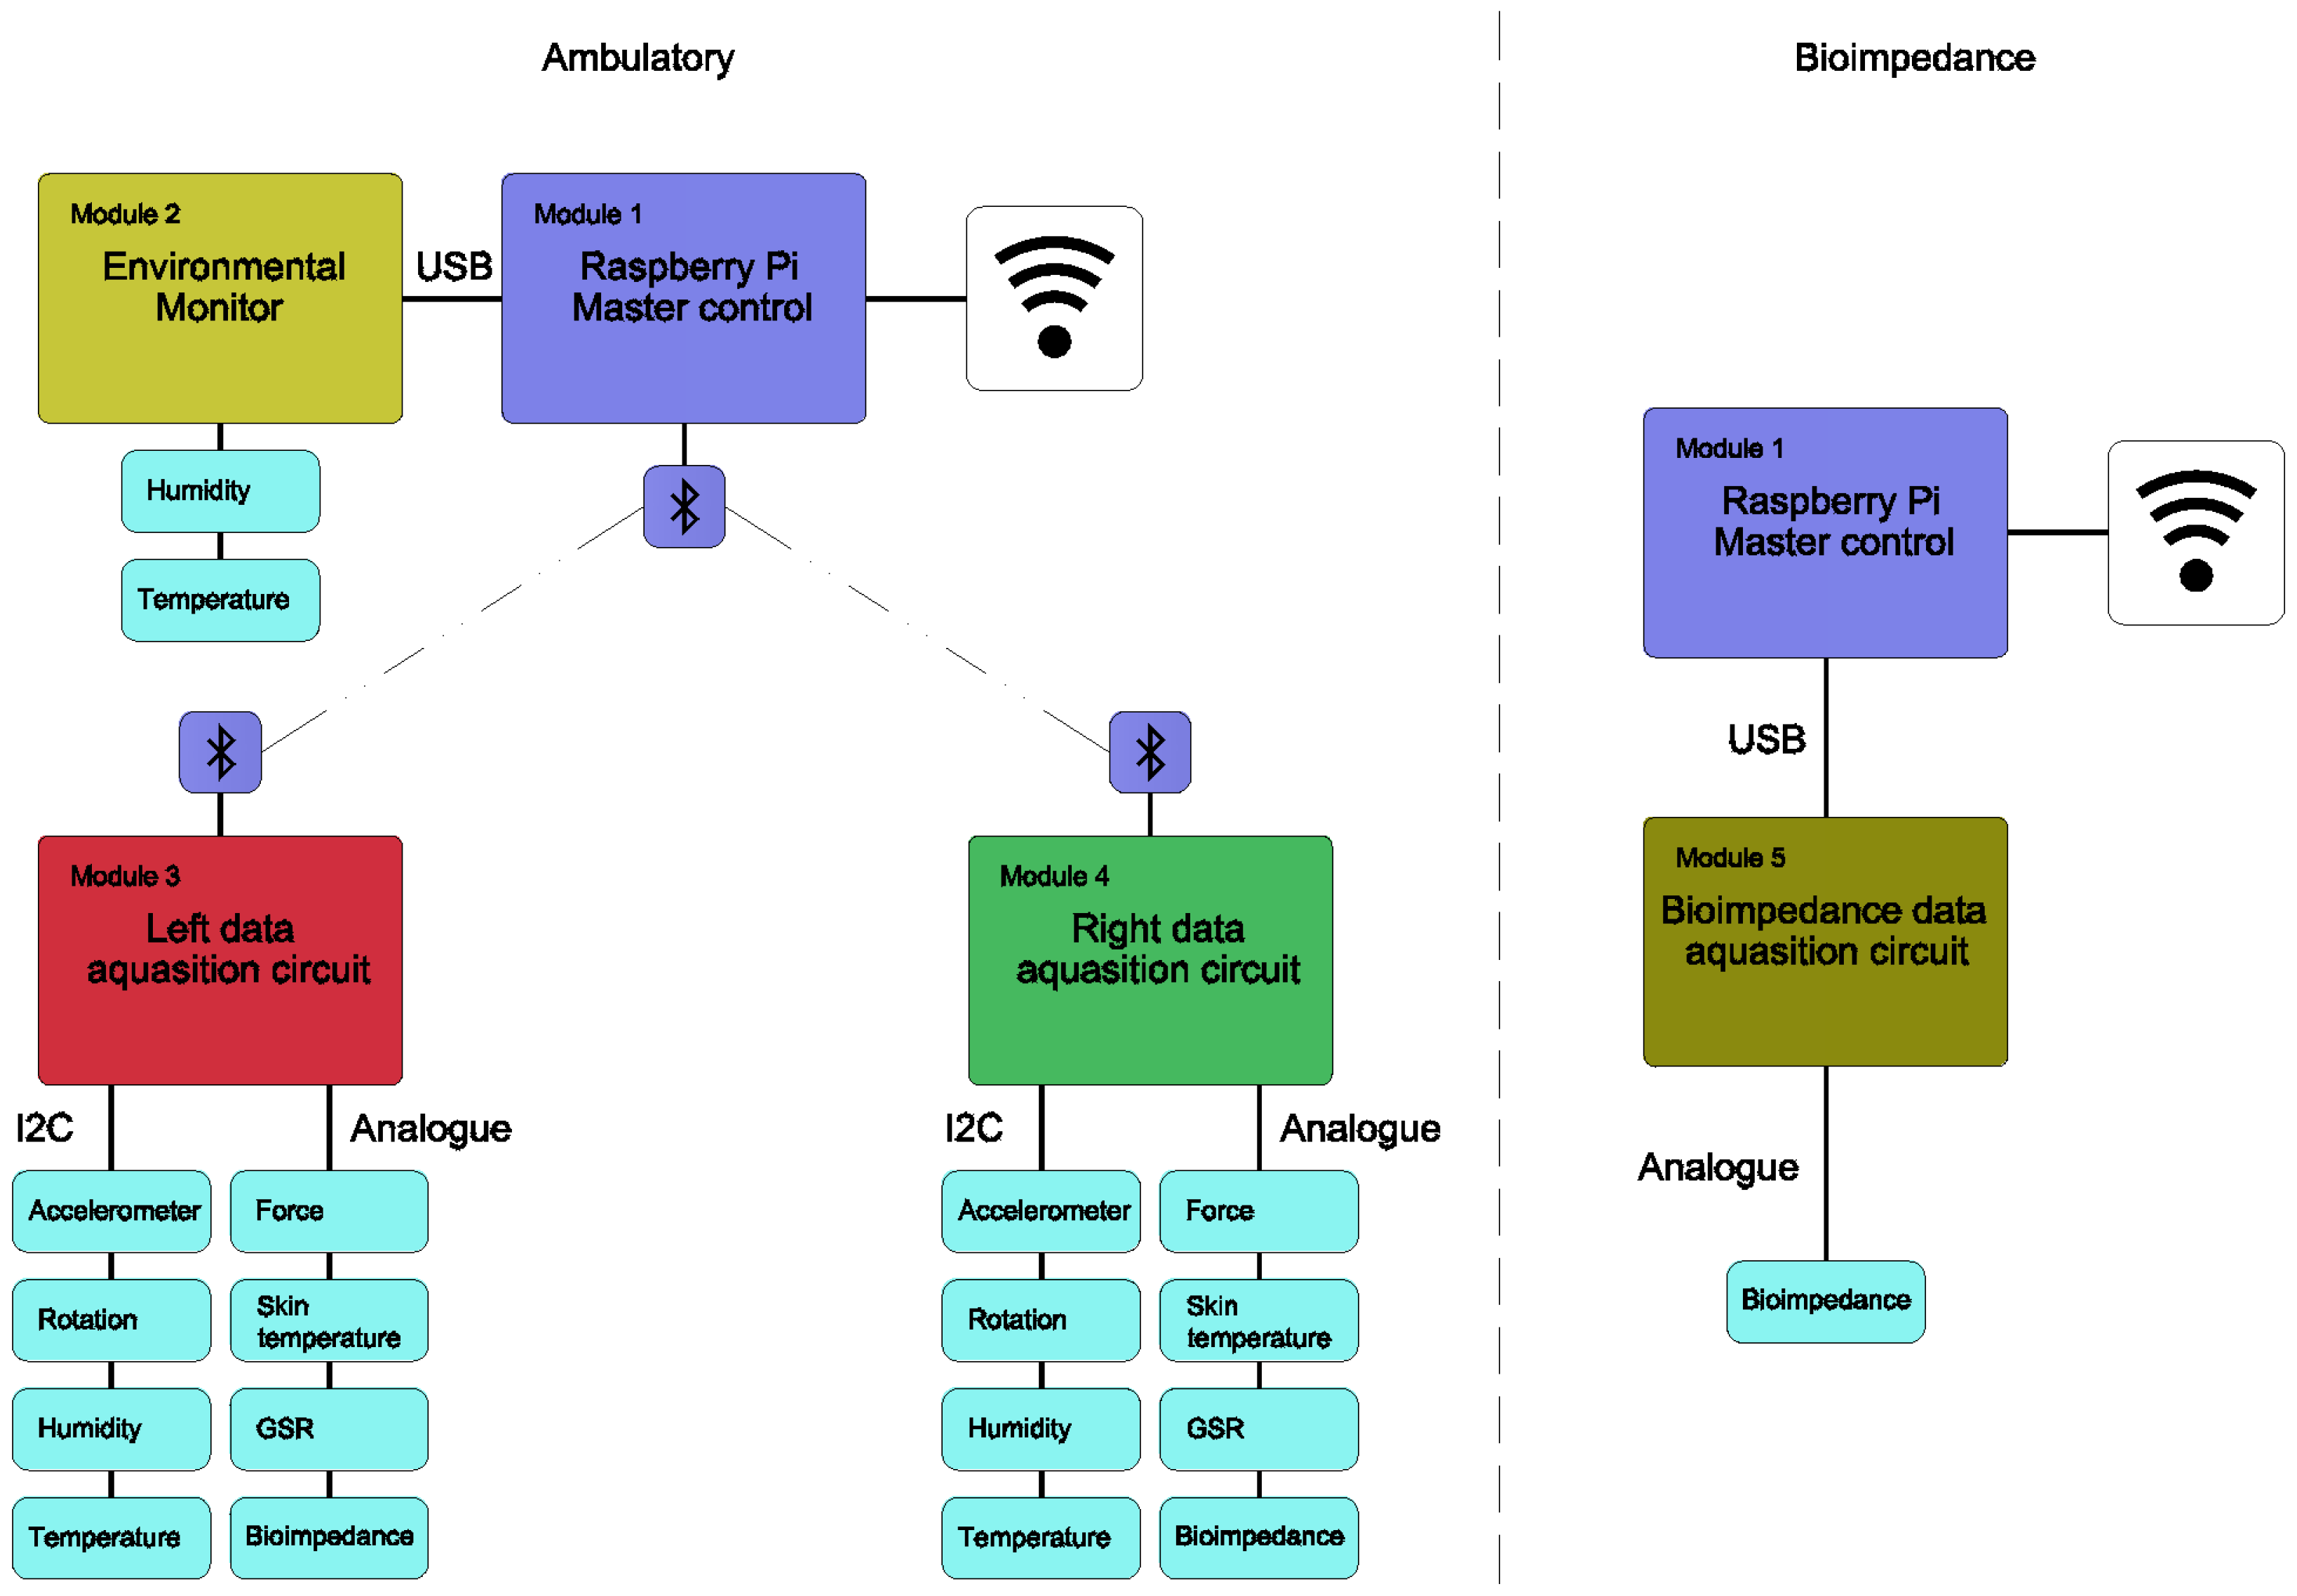
In this section we consider the design and configuration of the experimental platform. The new device incorporates measuring metrics useful in the determination or prediction of ulceration [5,17,18,19] as a means of establishing a baseline multivariate data set. The metrics include temperature, humidity, applied force, acceleration, rotation rate and galvanic skin response (GSR). We also propose the novel addition of capacitively coupled bioimpedance as a means of measuring inflammation. The sensors and instrumentation were mounted on each foot with data transmitted via Bluetooth to a Raspberry Pi acting as data acquisition controller and user interface. The use of wireless technology enables the devices’ use in many environments such as the laboratory, home, clinic, gymnasium or sports field without the incumbent trip hazard associated with wired sensors. The device is not limited to the observation of diabetic feet but holds promise for the monitoring of other conditions, sports performance and testing of novel worn sensing devices such as those developed by Segev-Bar [20].
Bioimpedance is a complex measurement comprising real (resistance) and imaginary (capacitive) components. Extracellular fluid forms the resistive path while intracellular fluid forms the capacitive component with the plasma membrane between the two acting as the dielectric. Inflammation is a systemic response to injury in the soft tissues where increased blood flow and blood vessel permeability results in extravasation. Fluid entering the intra cellular space changes the balance of resistive and capacitive pathways. Impedance examines a materials’ response to a range of induced frequencies with phase shift and gain being the metrics. The outer layer of the skin, the stratum corneum, comprises a layer of densely packed dead skin cells which have high electrical resistivity. As the thickness, hydration, sweat gland density and sweat gland activity vary from individual to individual and are affected by pathology skin resistance is also extremely variable. To over come this, techniques such as skin stripping and or conductive gells have been utilised for normalising skin contact resistance. Short term use of such contact mediums are a minor inconvenience however they are known to predicate dermal irritation if used for extended periods. By utilising capacitive coupling we have removed the need to use galvanic contact mediums reducing the likelihood of skin irritation where used for extended periods.
The data acquisition system comprises five separate components with either wired or wireless interfaces dependent on function and physical location. Figure 1 shows the use of the Raspberry Pi operating as the master controller to capture both in-shoe, environemntal and bioimpedance measurement devices while Table 1 presents the chosen sensors.

2.1. System Modules

Master control, see Figure 1—module 1, the Raspberry Pi 2 model B V1.1 single board computer performs data acquisition, control, formatting and recording. This device was chosen due to the low cost, availability, connectivity and the native python support allowing rapid development and deployment of the data acquisition system. For any such solution to be viable in the longer term, cost of deployment becomes as big a hurdle as the many technical problems faced.
Ambulatory data was gathered from the environmental monitor first, see Figure 1—module 2, followed by the left foot, module 3, and then right foot, module 4, in shoe monitors with a single CSR 4.0 Bluetooth device being utilised to communicate with the in shoe sensors. With biological frequencies of interest being below 1.5 Hz (heart rate while walking) [21] we utilised a sampling frequency of 20 Hz to enable the gathering of larger data sets with the available hardware. Inputs were low pass filtered at 10 Hz and sampled at 20 Hz to obey the Nyquist sampling theorem. Utilising this sample frequency any signal of less than 10 Hz can be accurately reproduced.
Bioimpedance data was gathered directly from the bioimpedance sensor, module 5, at 20 Hz .

2.2. Enviromental Monitor

The environmental monitor, see Figure 1—module 2, controlled event timing while providing environmental temperature and humidity monitoring for the test environment. An HYT271 sensor was locally controlled by a dedicated Arduino Nano with USB connection to the controller.

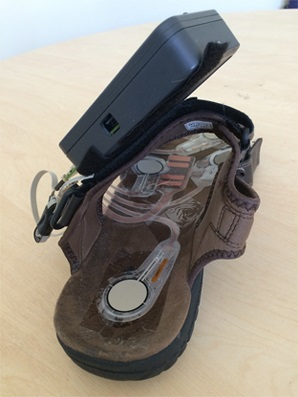
2.3. In Shoe Data Acquisition Circuit

The left and right data acquisition circuits, see Figure 1—modules 3 and 4—are controlled by dedicated Arduino Nano processors with Bluetooth connection to the master controller. A custom PCB was designed to provide connectivity and signal conditioning for the sensors with the sensor modalities noted in Figure 1 and Table 1.

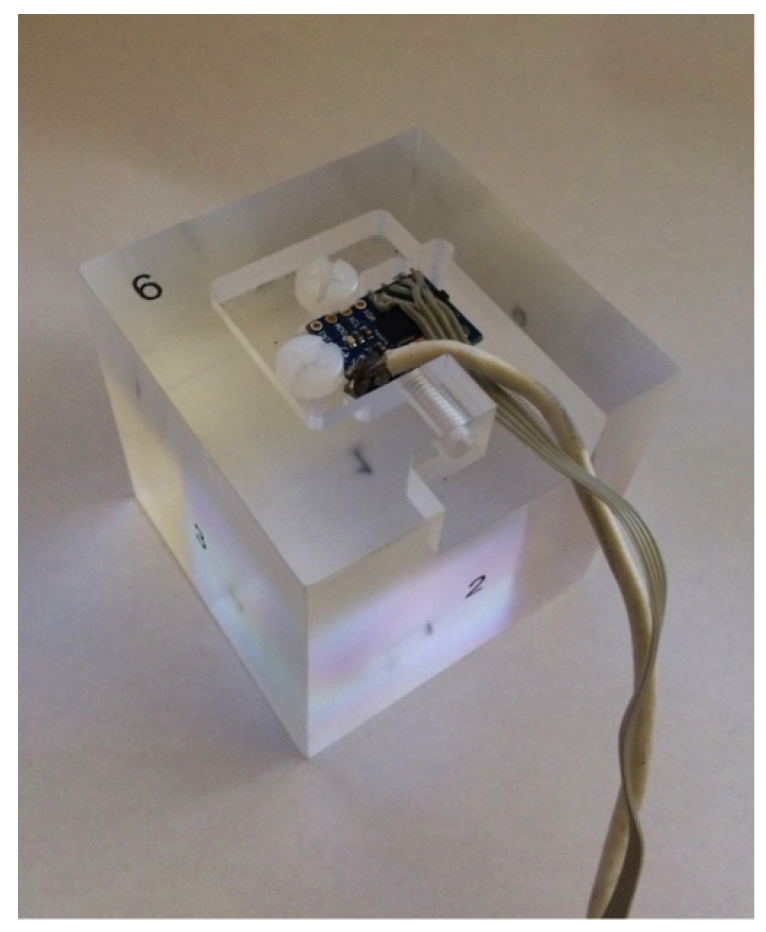
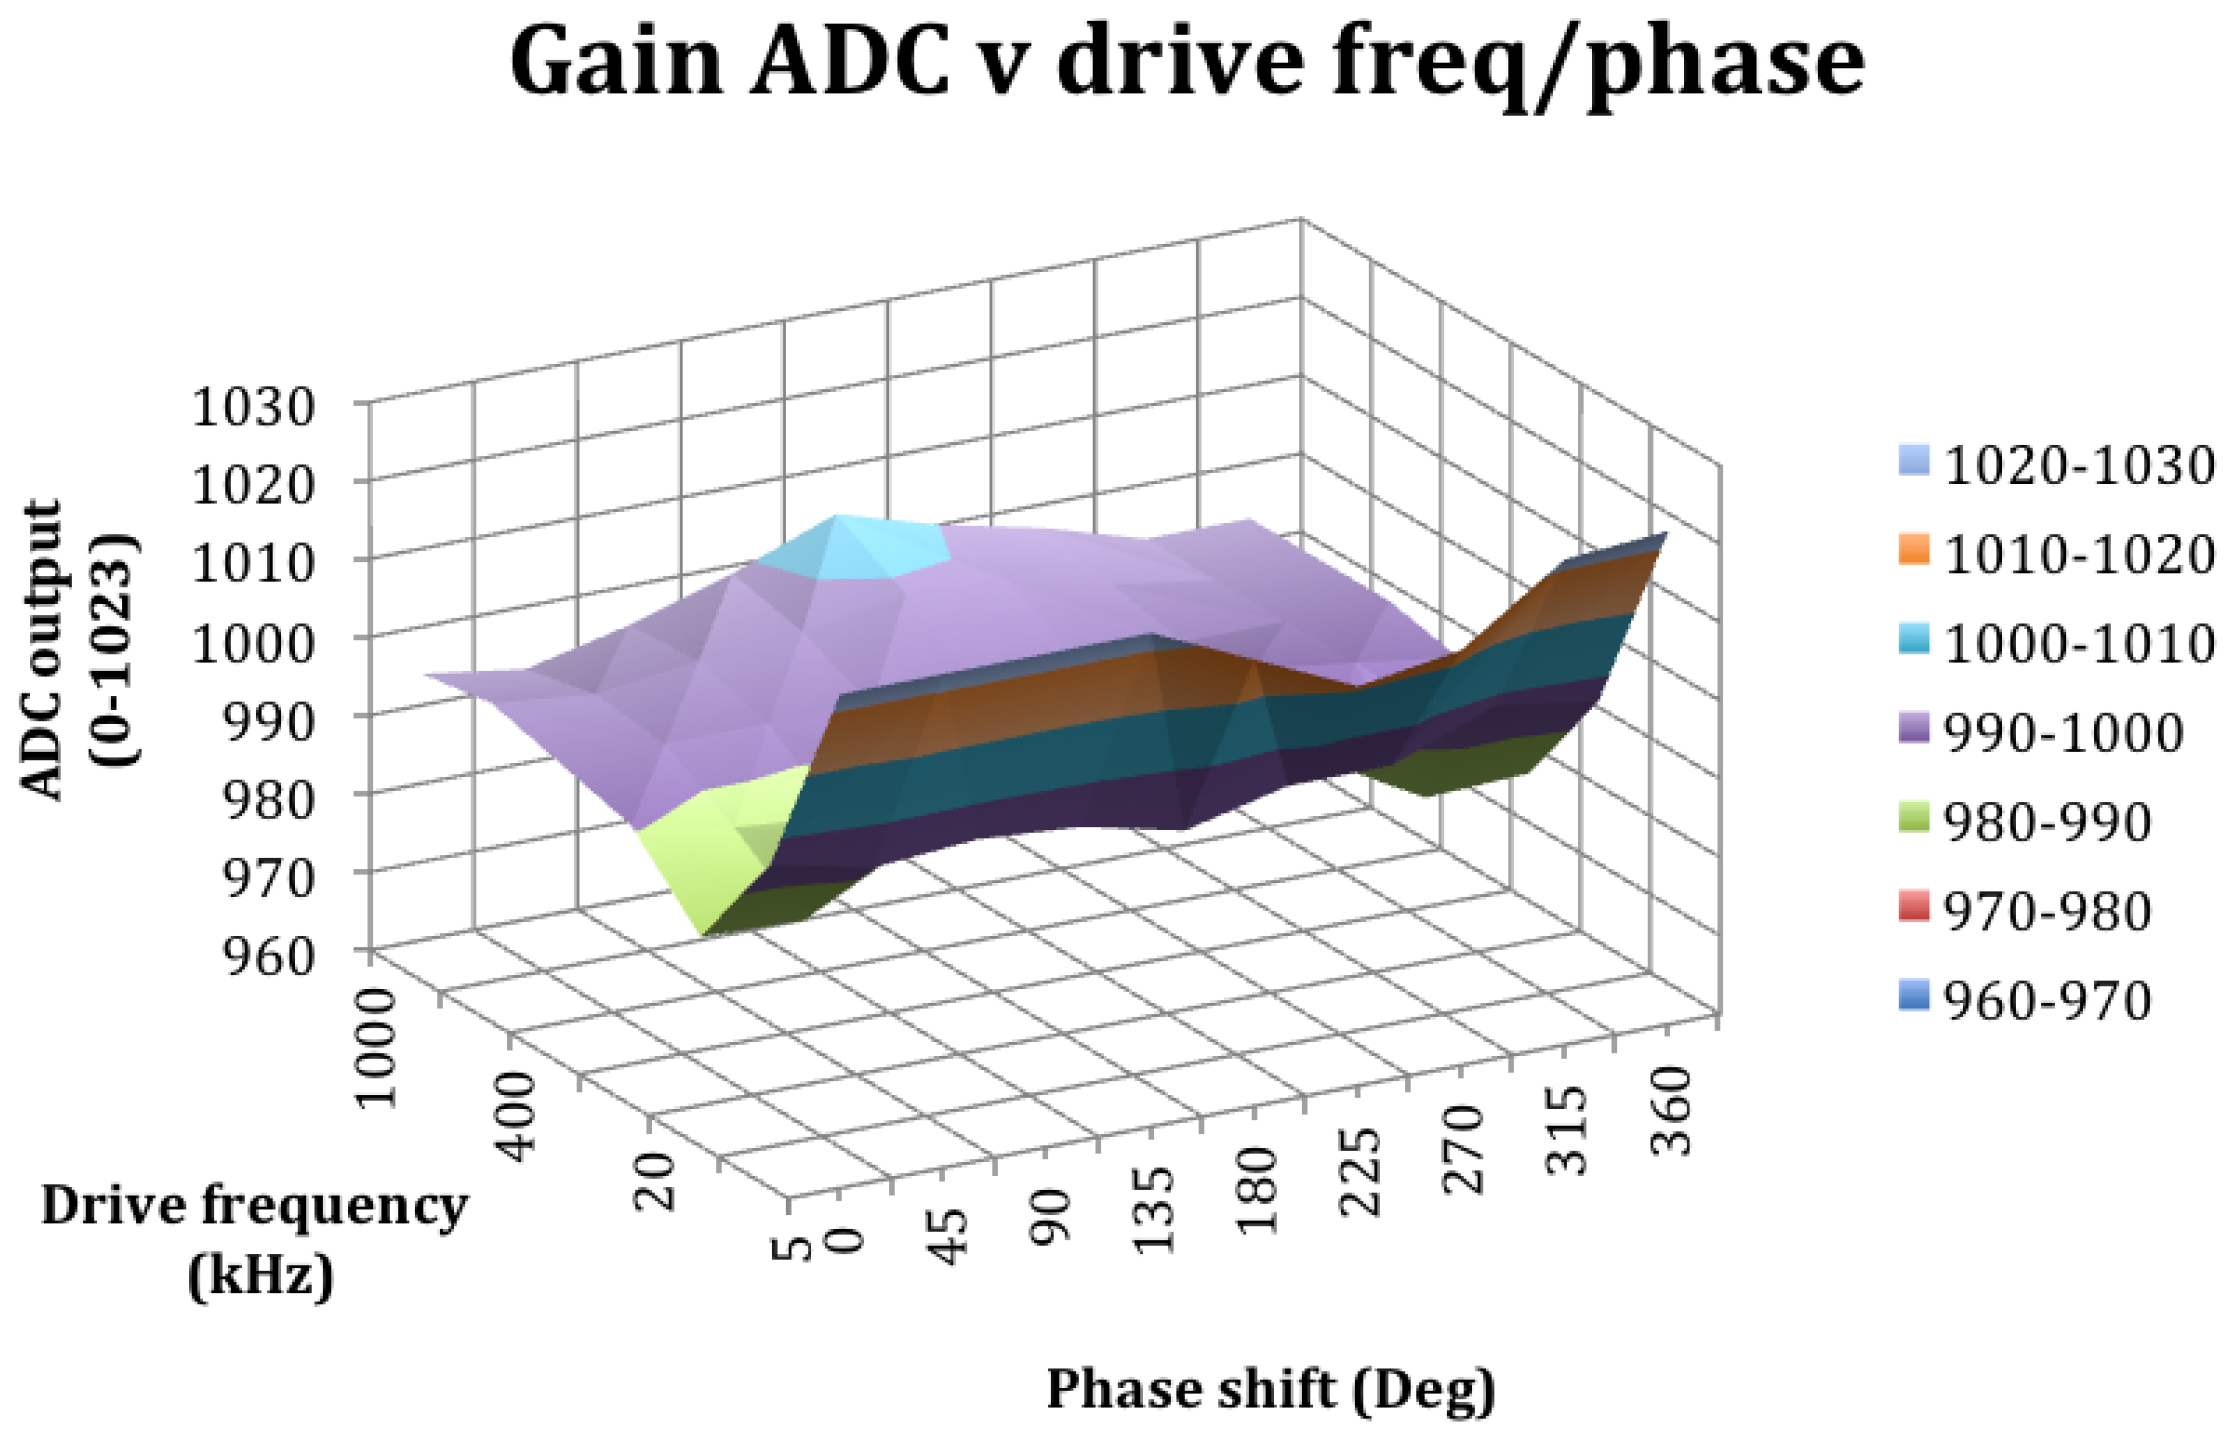
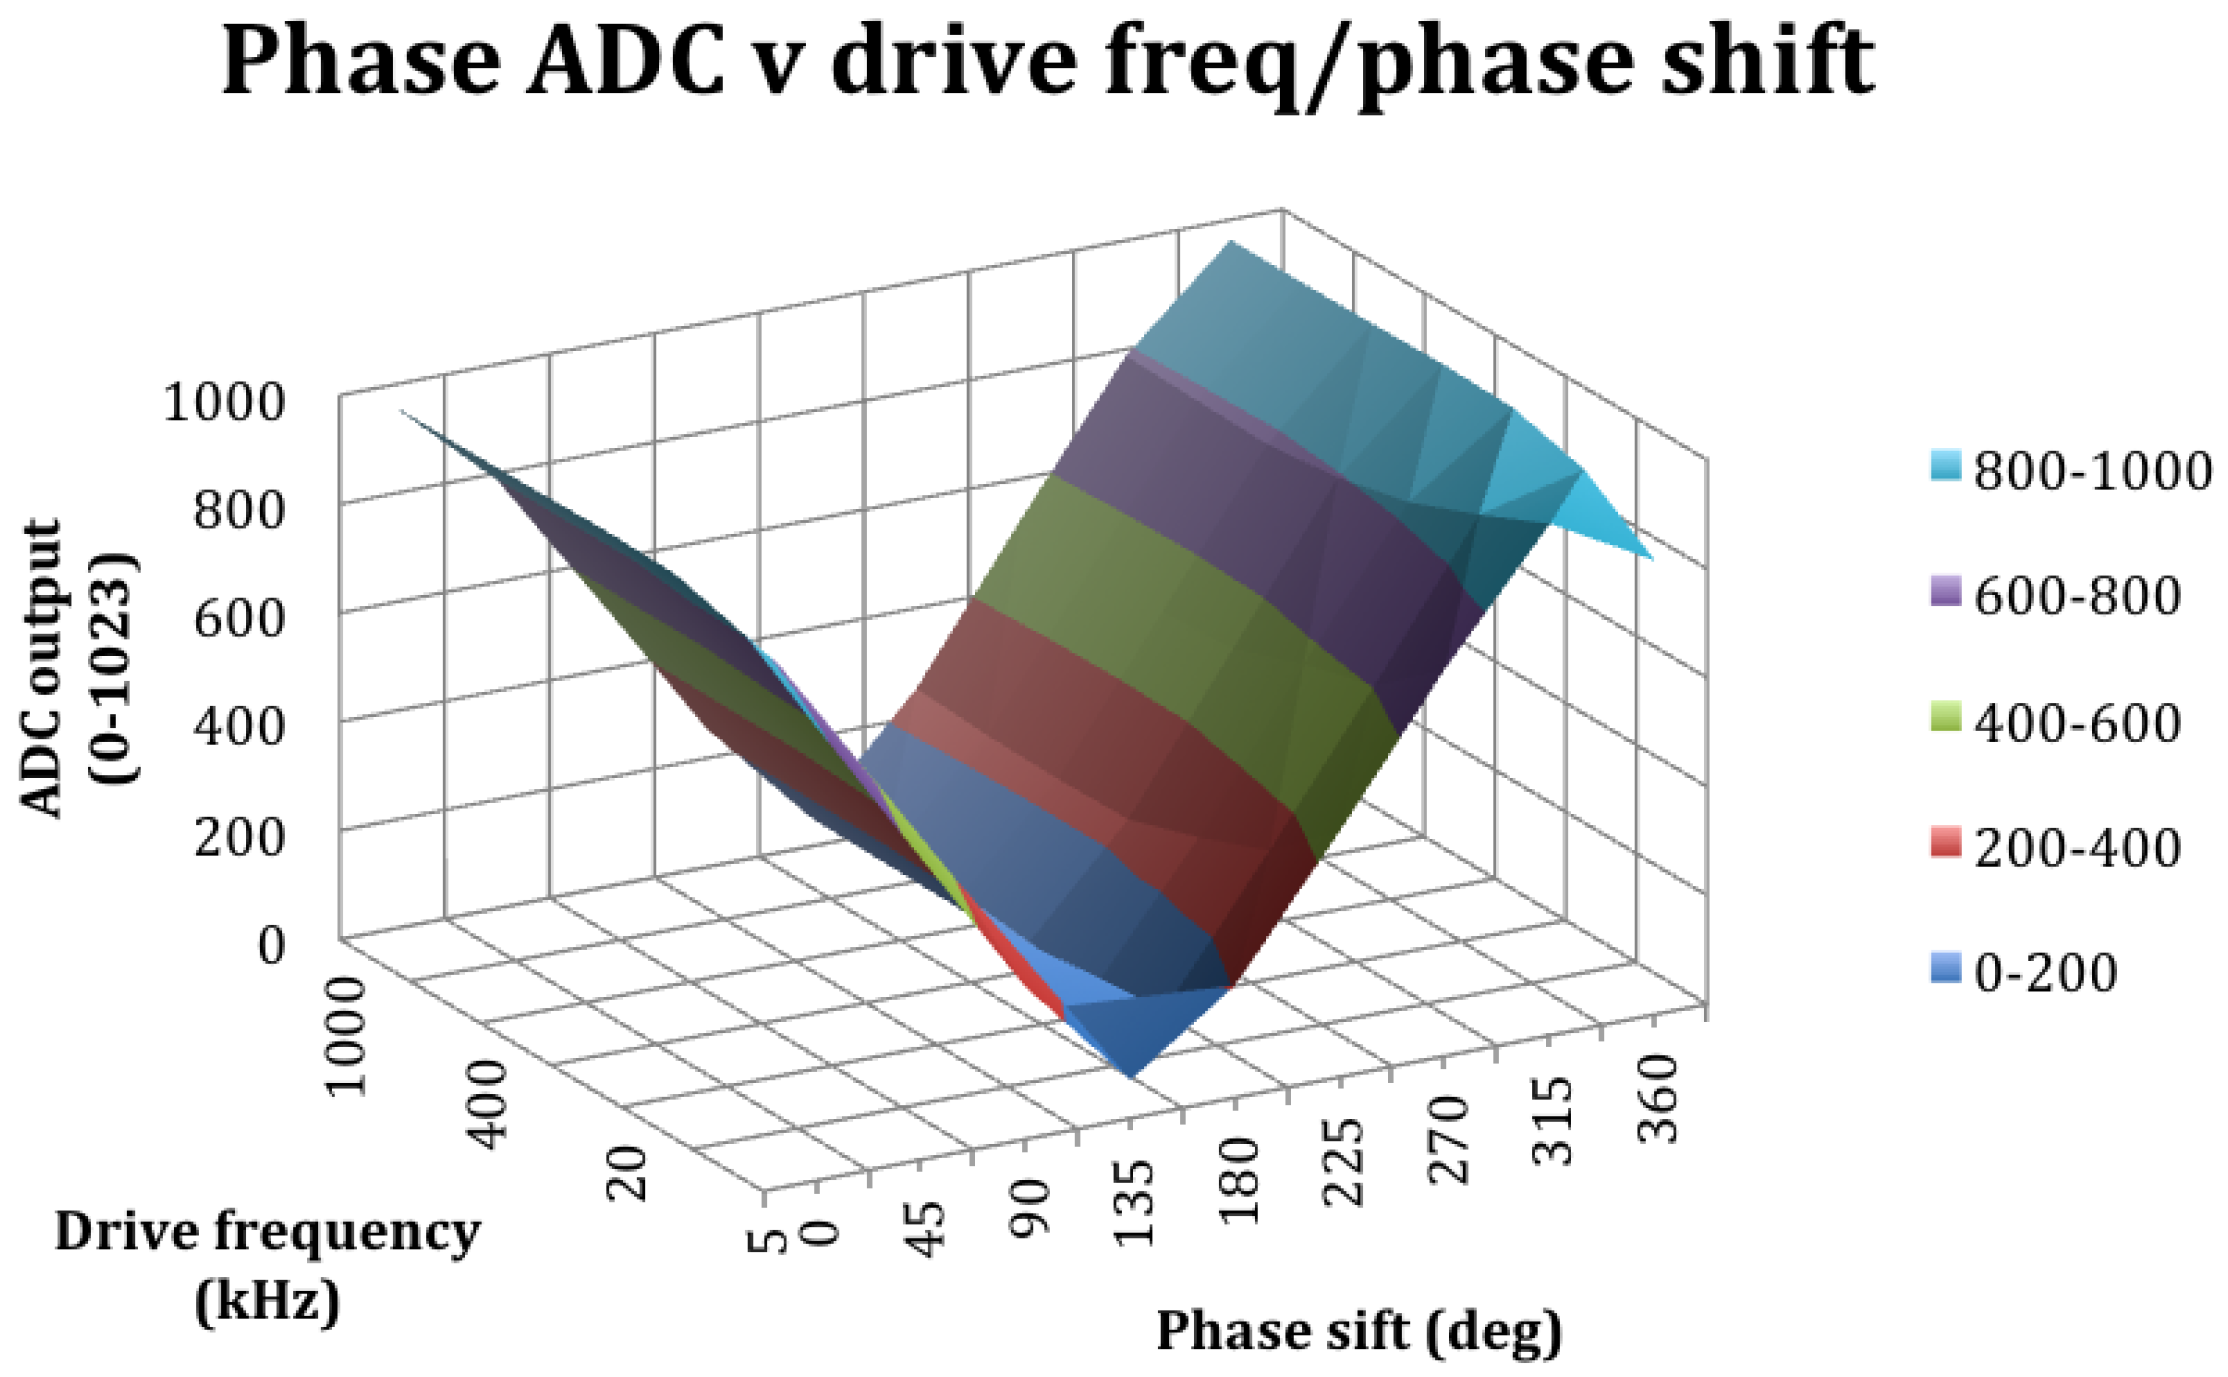
2.4. Bioimpedance Sensor

The bioimpedance circuit from the in shoe data acquisition circuit was utilised for stand alone bioimpedance testing. The software was reconfigured to output only bioimpedance data and control the sample frequency to 20 Hz .

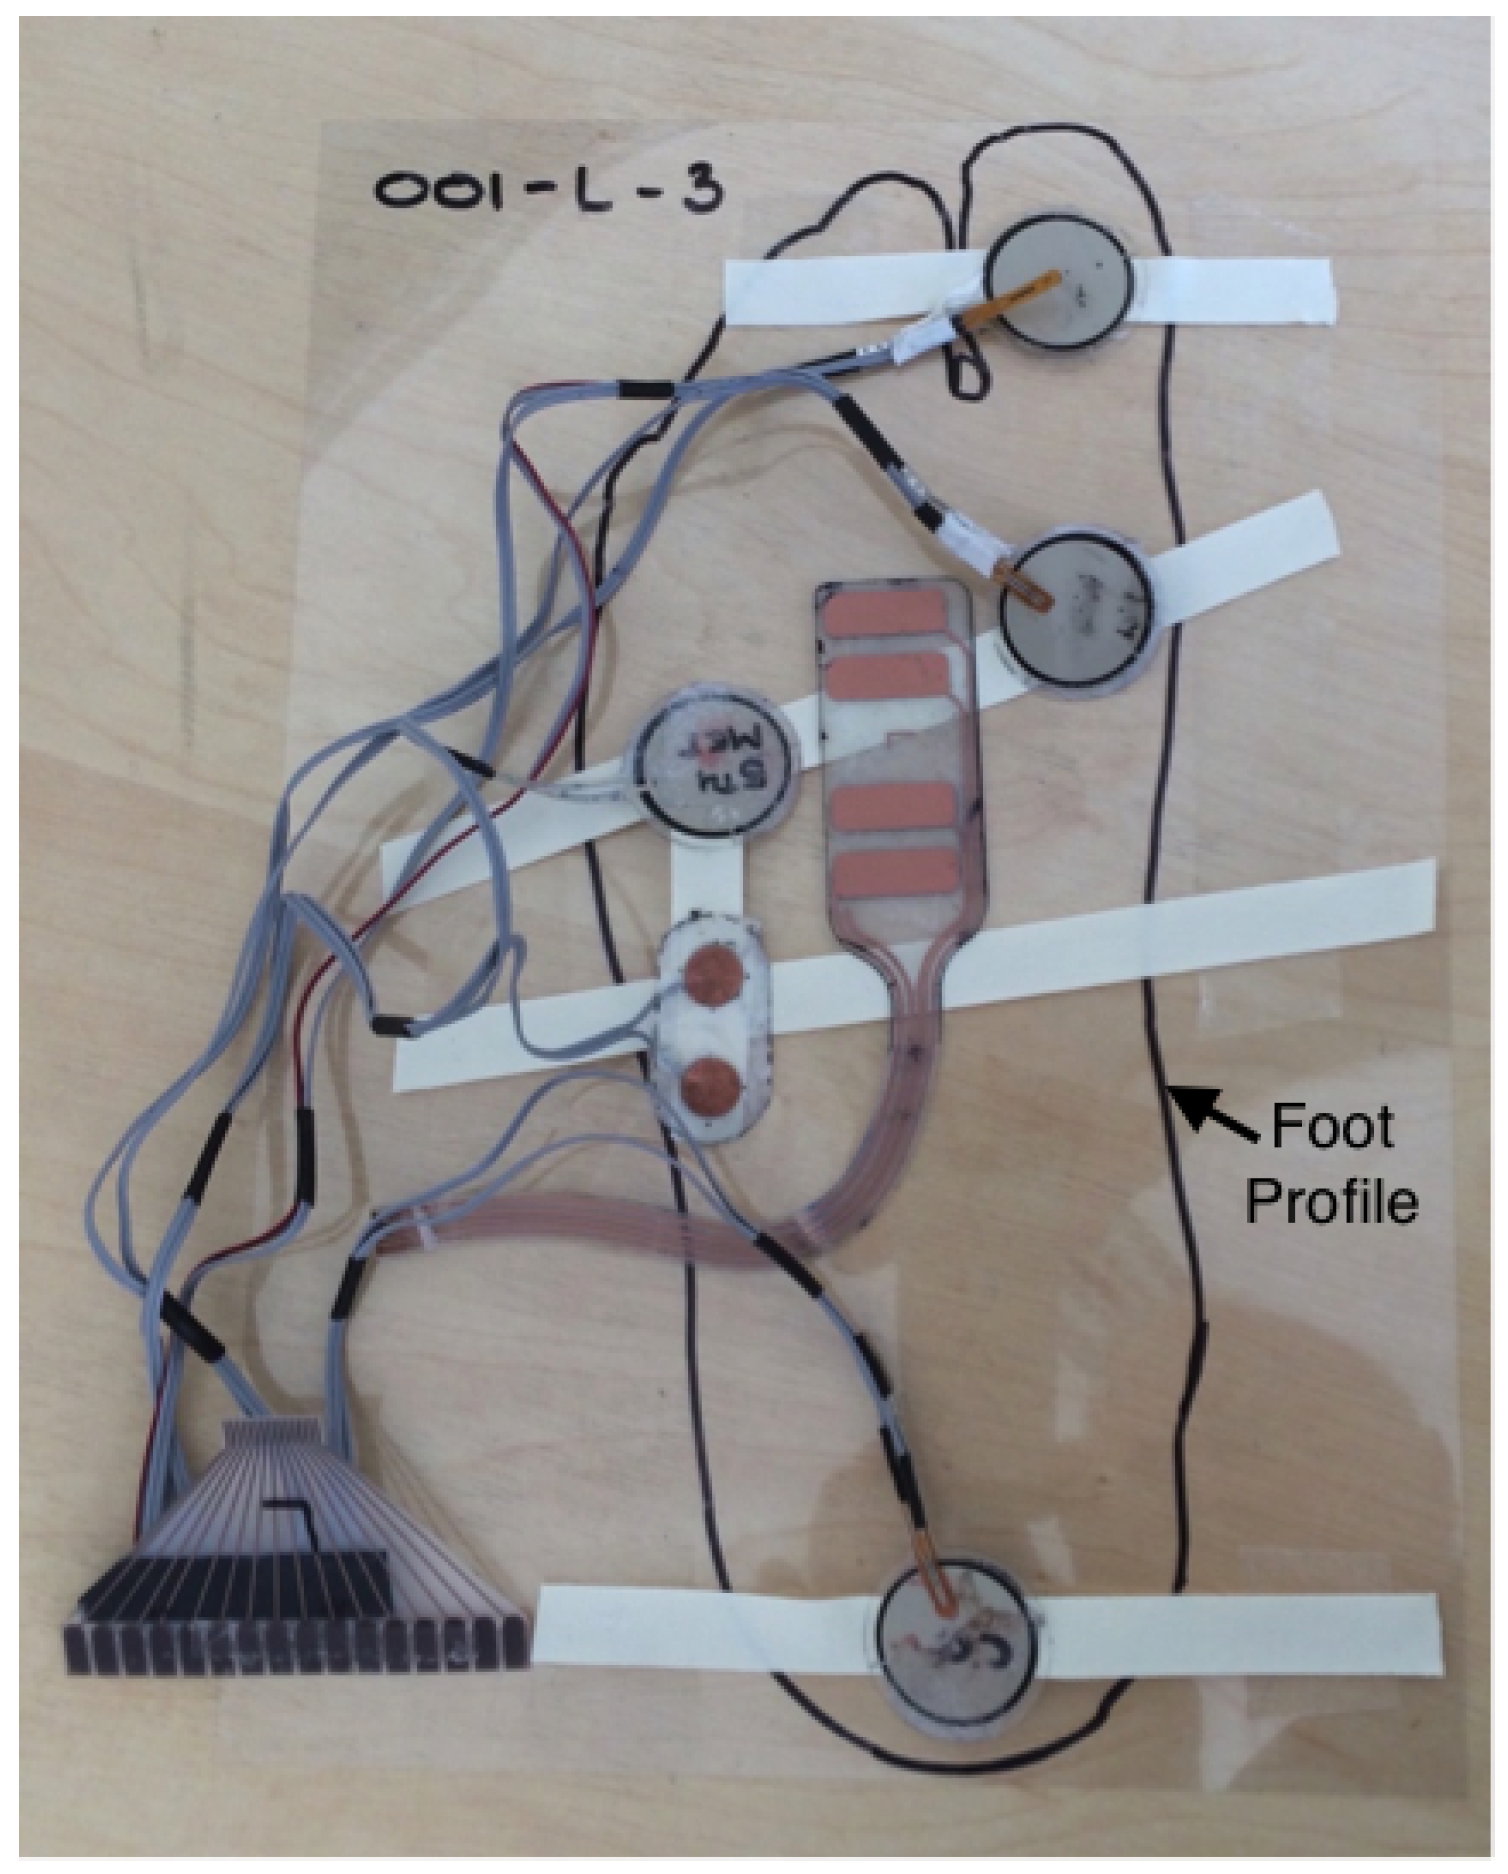
2.5. Foot Mounted Sensor Array

The sensors for temperature, humidity, acceleration and rotation were wired to a micro USB connector for robustness also allowing the flexibility to re-configure the sensors. The bioimpedance sensor was designed as a flexible printed circuit (FPC) as shown in Figure 2, produced by electroless copper plating on Polyethylene Terephthalate (PET) film. This enabled the fitting of sensors inside the shoe maintaining comfort of fit and flexibility while minimising cost. The sensors for force, skin temperature and GSR were connected with multi-strand wire for robustness. The FPCs were found to be unreliable in this application during early testing due to the fragile nature of the FPC—sensor interface.

2.6. Calibration and Validation

Devices that were pre-calibrated at manufacture were validated to ensure conformance to expected performance criteria, those that were not required calibration (see Table 1) for further details. The following section provides an overview of the procedures used.
Humidity validation was undertaken using a small humidity chamber in which sensor output was compared to a calibrated Rotronic HygroWin HC2-Win-USB humidity probe. Sensors were tested in ambient conditions, 2 % and 73.5 % R H with a ± 1.0 % error being accepted. Desiccated colloidal silica gel and saturated NaCl water solution were used to generate the respective conditions.
Temperature validation was undertaken in a PID controlled oven in which sensors were compared to a calibrated Pico Technology PT104. Sensors were tested at ambient temperature, ≈30 and ≈38 C with a ±0.5 C error being accepted.
GSR was validated against reference resistances of 100–5000 kΩ calibrated to ± 1 % , a ± 2 % error was accepted. By convention electrical conductivity (S/m) would be used for GSR but as the cell factor was unknowable due to the changing morphology of the skin as a response to exercise and/or disease state [18,22], resistance was utilised.
The acceleration and rotation validation was performed by presenting each axis of the sensor to accelerations of + 1 g , 0 g and 1 g utilising the reference block shown in Figure 3. Errors of ± 0.05 g were accepted. Integrating the rotation data with respect to time and comparing this with the known rotation angle validated rotation with ± 2 error accepted. Implementation of the on-board low pass filter was verified by changing the filter cut off frequency while exciting the accelerometer with a mechanically coupled 44 Hz input frequency and verifying that appropriate attenuation in signal was achieved.
Bioimpedance excitation signal was validated against a Picoscope 2206A oscilloscope over the frequencies of 5, 10, 20, 100, 400, 700, 1000 kHz at a voltage of ±2.0 V (peak-peak). Signal analysis was validated against a dual channel signal generator (UDB1300), providing artificial excitation and sensor signal, monitored with a Picoscope 2206A oscilloscope utilising a dummy sensor. The on board signal output amplifier was temporarily disconnected. The excitation signal was set at ±1.73 V (peak-peak) with a sensor signal of ±0.09 V (peak-peak). For each frequency of 5, 10, 20, 100, 400, 700, 1000 kHz the phase was changed through the range 0, 45, 90, 135, 180, 225, 270, 315, 360 degrees and output recorded. This calibration method was chosen over the use of phantom materials as the input phase and gain could be readily compared against output phase and gain though calibrated phantoms would be the preferred validation technique once appropriate ranges could be established for the new device. As can be seen in Figure 4 the gain response is linear over phase and frequency at approximately 1% of full scale deflection over the range 100–1000 kHz. For frequencies lower than 100 kHz the response is non linear in both phase and gain. A similar effect can be seen in phase Figure 5 which again occurs below 100 kHz. Output was left in 10 bit format without calibration to enable the collection of data over a broad range of frequencies. This approach allows greater variation in measured frequency with frequency specific calibration applied post hoc if required.
Force transducers were calibrated utilising an Applied Measurements DBBSMM-50kg-002-000 calibrated for output in Newtons. Sensors were first clamped at 170 N for 5 min to precondition them as advised in the manufacturers data-sheet. Five cycles of loading with 0, 10, 20, 50, 90, 140, 90, 50, 20, 10, 0 N were manually applied to the sensors. Sensor output was quadratically matched to the applied force as a means of calibration with R 2 values of higher than 0.995 obtained in all cases.
Temperature transducers were calibrated in a PID controlled oven, monitored by calibrated Pico Technology PT104 and probes. Temperature was sequentially stabilised at room temperature (≈22) and ≈24, ≈28, ≈33, ≈37 C . Sensor output was quadratically matched to the test temperatures as a means of calibration with R 2 values of higher than 0.995 obtained in all cases.

2.7. Sensor Evaluation

To fit the sensors in the correct anatomical positions a sensor map was generated for each of the volunteers feet on PET film at known high load sites [18,23]. Sensor positions were established for the calcaneus, 1st metatarsal, 5th metatarsal and the pad of the great toe by palpation and transferred to the map using soft pigmented wax. The calcaneus force sensor was positioned so as to detect heal strike while all other force sensors were positioned under the local load centre. Temperature was sensed adjacent to the force sensor on the calcaneus, 1st metatarsal and great toe while GSR was fitted behind the 5th metatarsal with bioimpedance sited between the 1st and 5th metatarsals over a sensed area 22 mm wide ×55 mm long. The sensors were mounted on zinc oxide tape as shown in Figure 6 prior to aligning the foot to the map and taping the sensors into position as seen in Figure 2. Shoes were then fitted to the volunteer and the appropriate (left/right) data acquisition circuit installed over the dorsal surface of the foot. The footwear chosen for the task were walking sandals which provide a secure fit while maintaining access to the insole for fitting sensors with multiple access points for wiring. Having fitted the footwear the system was allowed to stabilise for a period of 5 min, during which time the volunteer was seated and data was recorded to demonstrate that the system was operational.
The bioimpedance sensor was attached to the foot sensor map with the whole ensemble mounted on a toughened glass plate for stability. Batteries were fitted to the sensor circuit which was connected to the Master control via USB cable see Figure 1.

3. Test Protocol

3.1. Laboratory Setup

All testing was undertaken in the same laboratory setup in an office environment with temperature kept above 21 C . No air conditioning or humidity control was available. A JLL S300 digital treadmill was used to control walking speed with the platform horizontal. A Tanita segmental body impedance scale BC-545N was used to characterise volunteers’ body types. Resting blood pressure was obtained with a Kodea KD202F automatic blood pressure cuff with heart rate and SPO2 obtained using a Contec Pulse Oxymeter CMS50DL. Occlusion of blood supply to the leg was effected with an A&D Medical UM101 sphygmomanometer and Banmanometer V-Loc pressure cuff manually inflated by hand pump. The study protocol was approved by the University of Southampton ethics committee (ID: 8997) and conformed to the principles outlined in the Declaration of Helsinki. All participants gave their informed consent to participate in the study. All data were stored in an open format.

3.2. Test Subject Demographic

In line with the ethics approval stated above all volunteers involved in this study were nominally healthy individuals without a diagnosis of diabetes. Table 2 presents volunteer data for graphical data presented while Table 3 gives a statistical summery of those male volunteers (n = 15) involved in the test program. 1 female participant took part in the study. Volunteer 009 has been diagnosed with mild arthritis in both ankles.

3.3. Test Setup

Basic biometric data was gathered from each volunteer including: age, gender, blood pressure, height and weight. The volunteer then walked on the treadmill in their own footwear for 4 min to acclimatise prior to fitting the sensors and sandals. After fitting, the sensors were allowed to stabilise for a period of 5 min with the volunteer seated prior to testing. Table 4 presents.

3.4. In Shoe Testing

A sequence of 9 tests were undertaken to characterise the in-shoe conditions for the events shown in Table 4. For each test 200 s of data was captured on the Raspberry Pi master controller to ensure 3 × 60 s data cycles were acquired per test.

3.5. Bioimpedance Testing

Two bioimpedance tests were undertaken on each foot utilising a range of 100–1000 kHz at 100 kHz increments. The first investigated the sensors ability to differentiate between unloaded, lightly loaded and standing load on the sensor. For this each volunteer placed a foot on the sensor 10 s into the test while seated, then standing at 100 s with weight evenly distributed between both feet, the test concluding at 200 s. The second test investigated the difference between occluded and non occluded blood flow. We utilised this test to increase fluid load to the tissue hence creating a perturbation in the balance of resistive and capacitive conduction pathways. The volunteer was seated and a pressure cuff placed around the upper thigh of the test leg, data recording was started, with the foot placed on the sensor after 10 s. The cuff was manually inflated to 20 mmHg above the volunteers systolic pressure 70 s after the start of data recording and maintained for 60 s before rapid deflation. 500 s of data was collected during this test.

4. Results and Discussion

The following section presents illustrative results to demonstrate the system measurement capability. From this data it is possible to elucidate the relationship between events measured with different sensors or modalities, for example vertical acceleration in opposing feet or force and acceleration on the same foot. The use of our bioimpedance meter is also discussed, demonstrating changes in output due changes to tissue loading and blood flow. Finally we discuss the limitations of the current device.

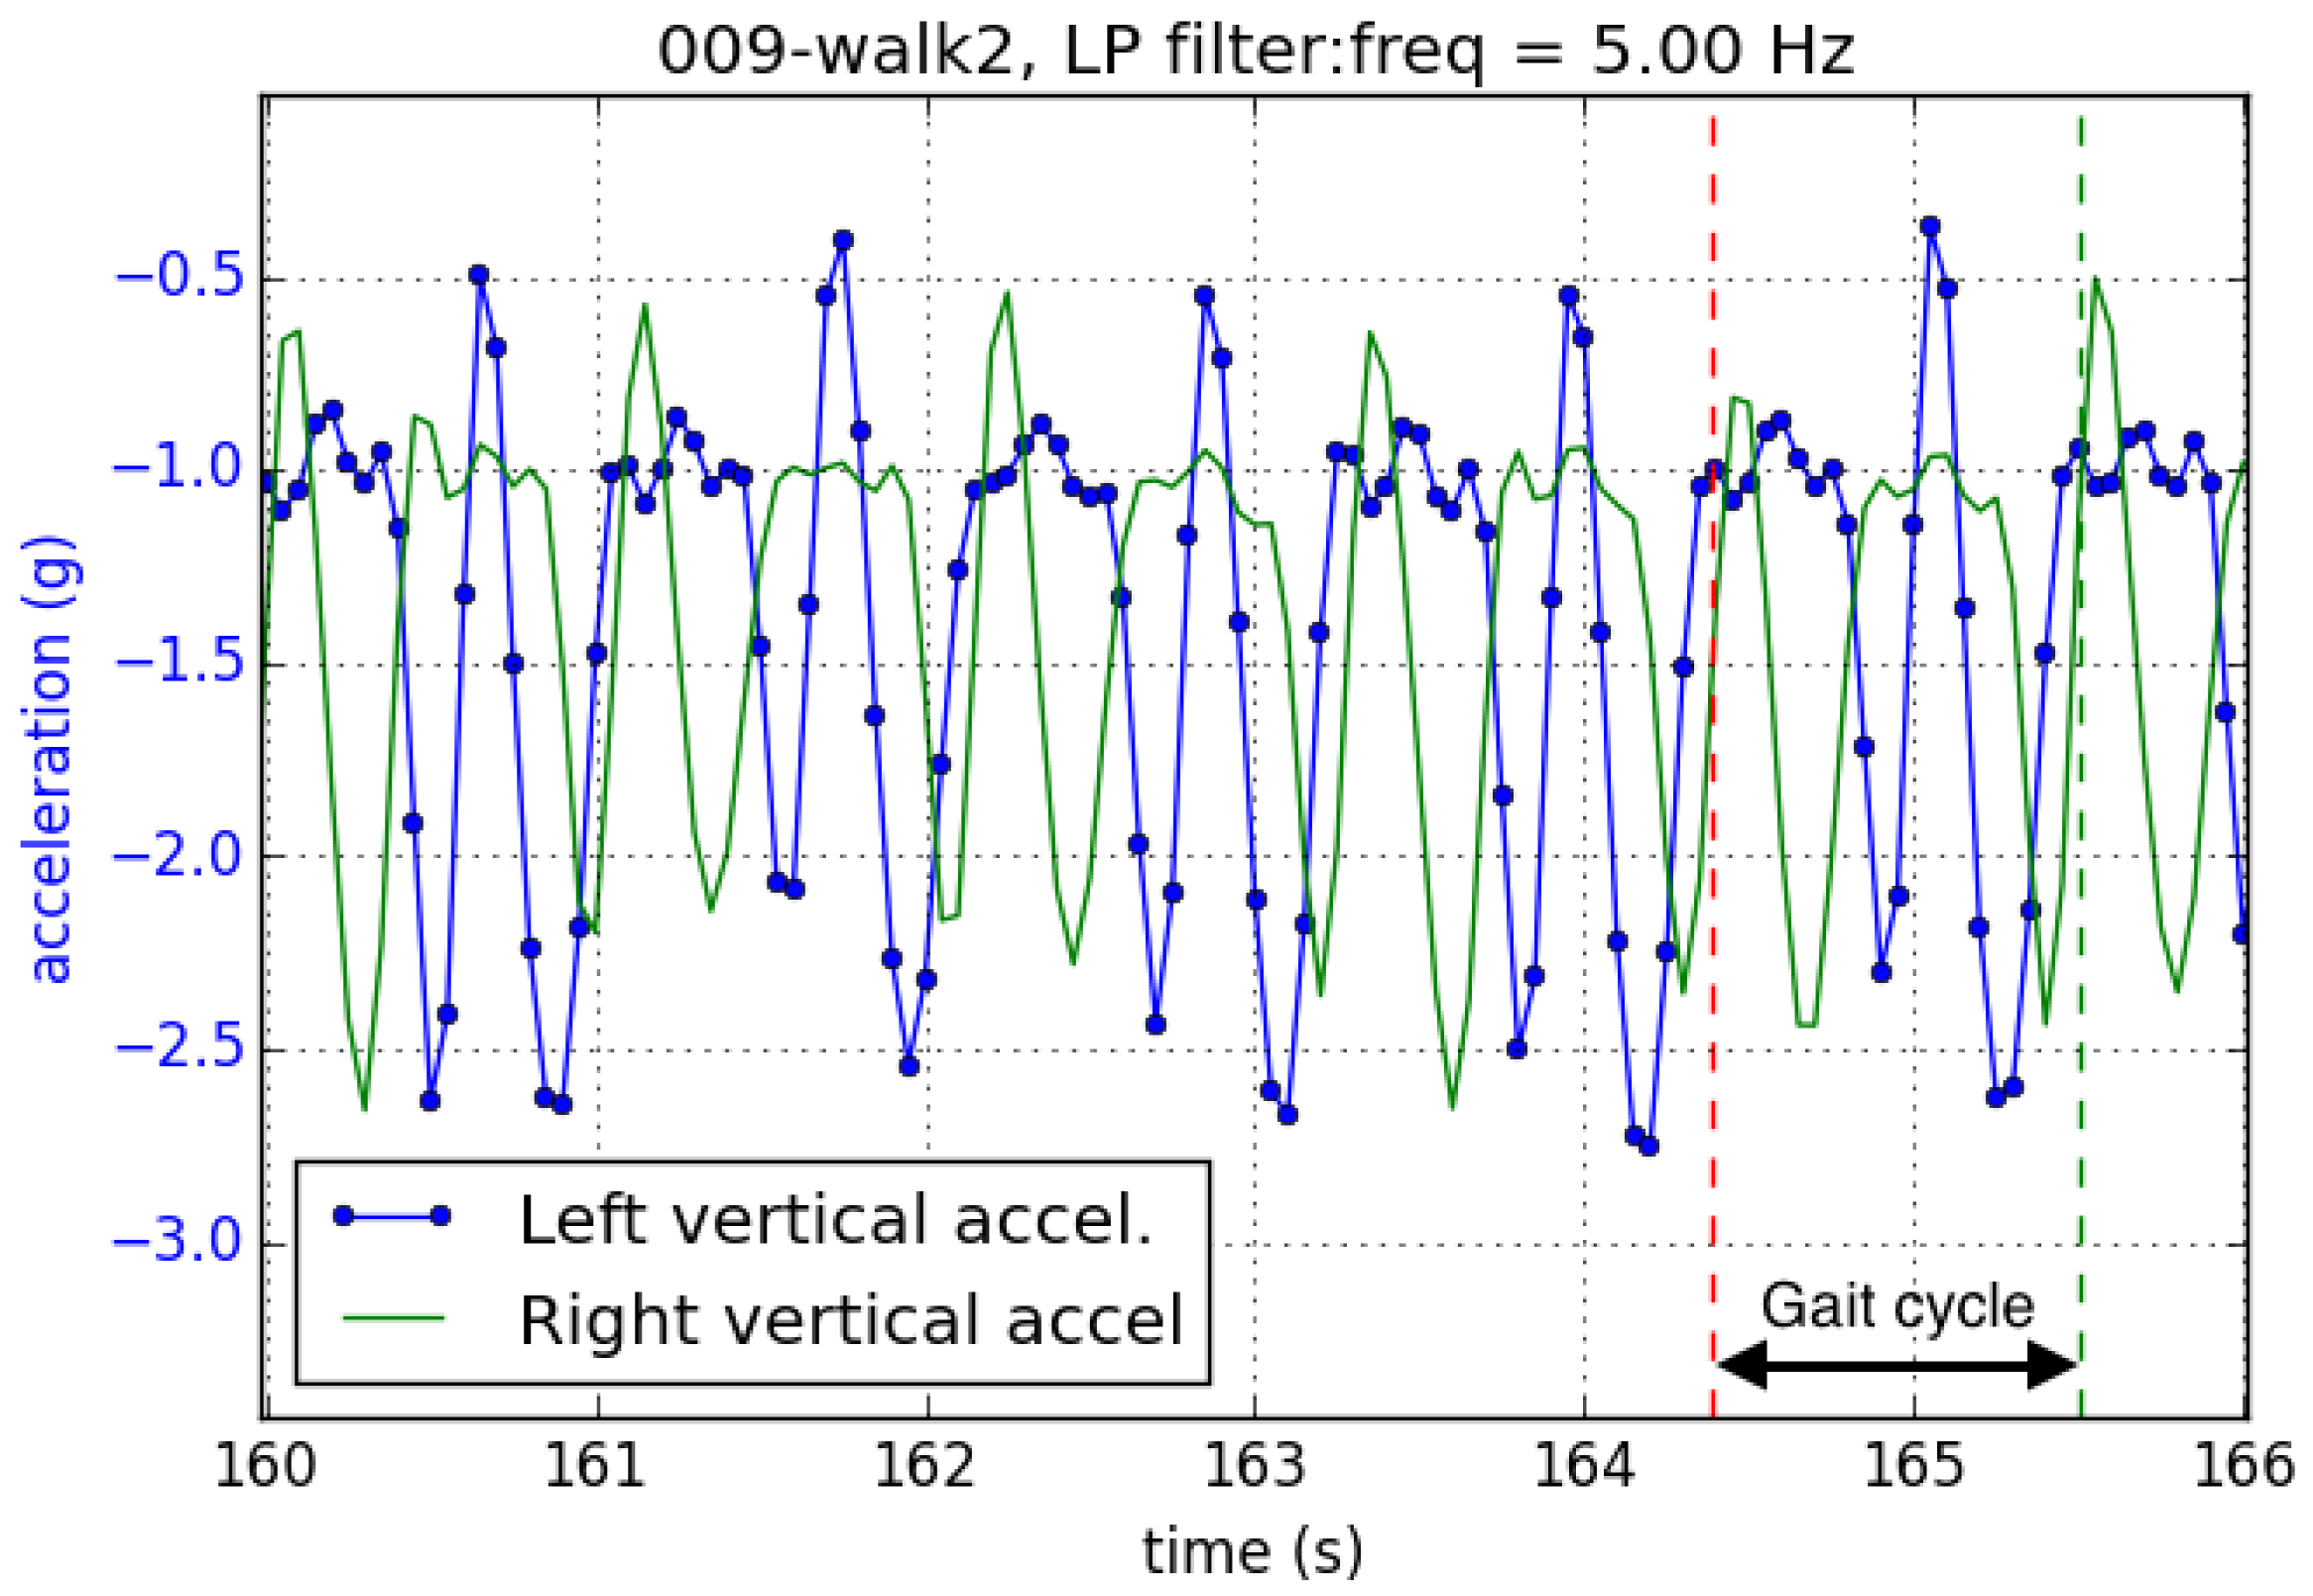
4.1. Vertical Acceleration

Typical acceleration data is shown in Figure 7 asymmetry in the gate pattern. The accelerations in the left foot are rapidly followed by similar accelerations in the right foot with a lag before the accelerations repeat in the left foot, indicating an irregular gait.

4.2. Acceleration and Force

The vertical acceleration and force data shown in Figure 8 clearly demonstrates the timing of the heal strike as being coincident with the deceleration from 2.5 to 1.0 g of the foot under test.

4.3. Humidity and GSR
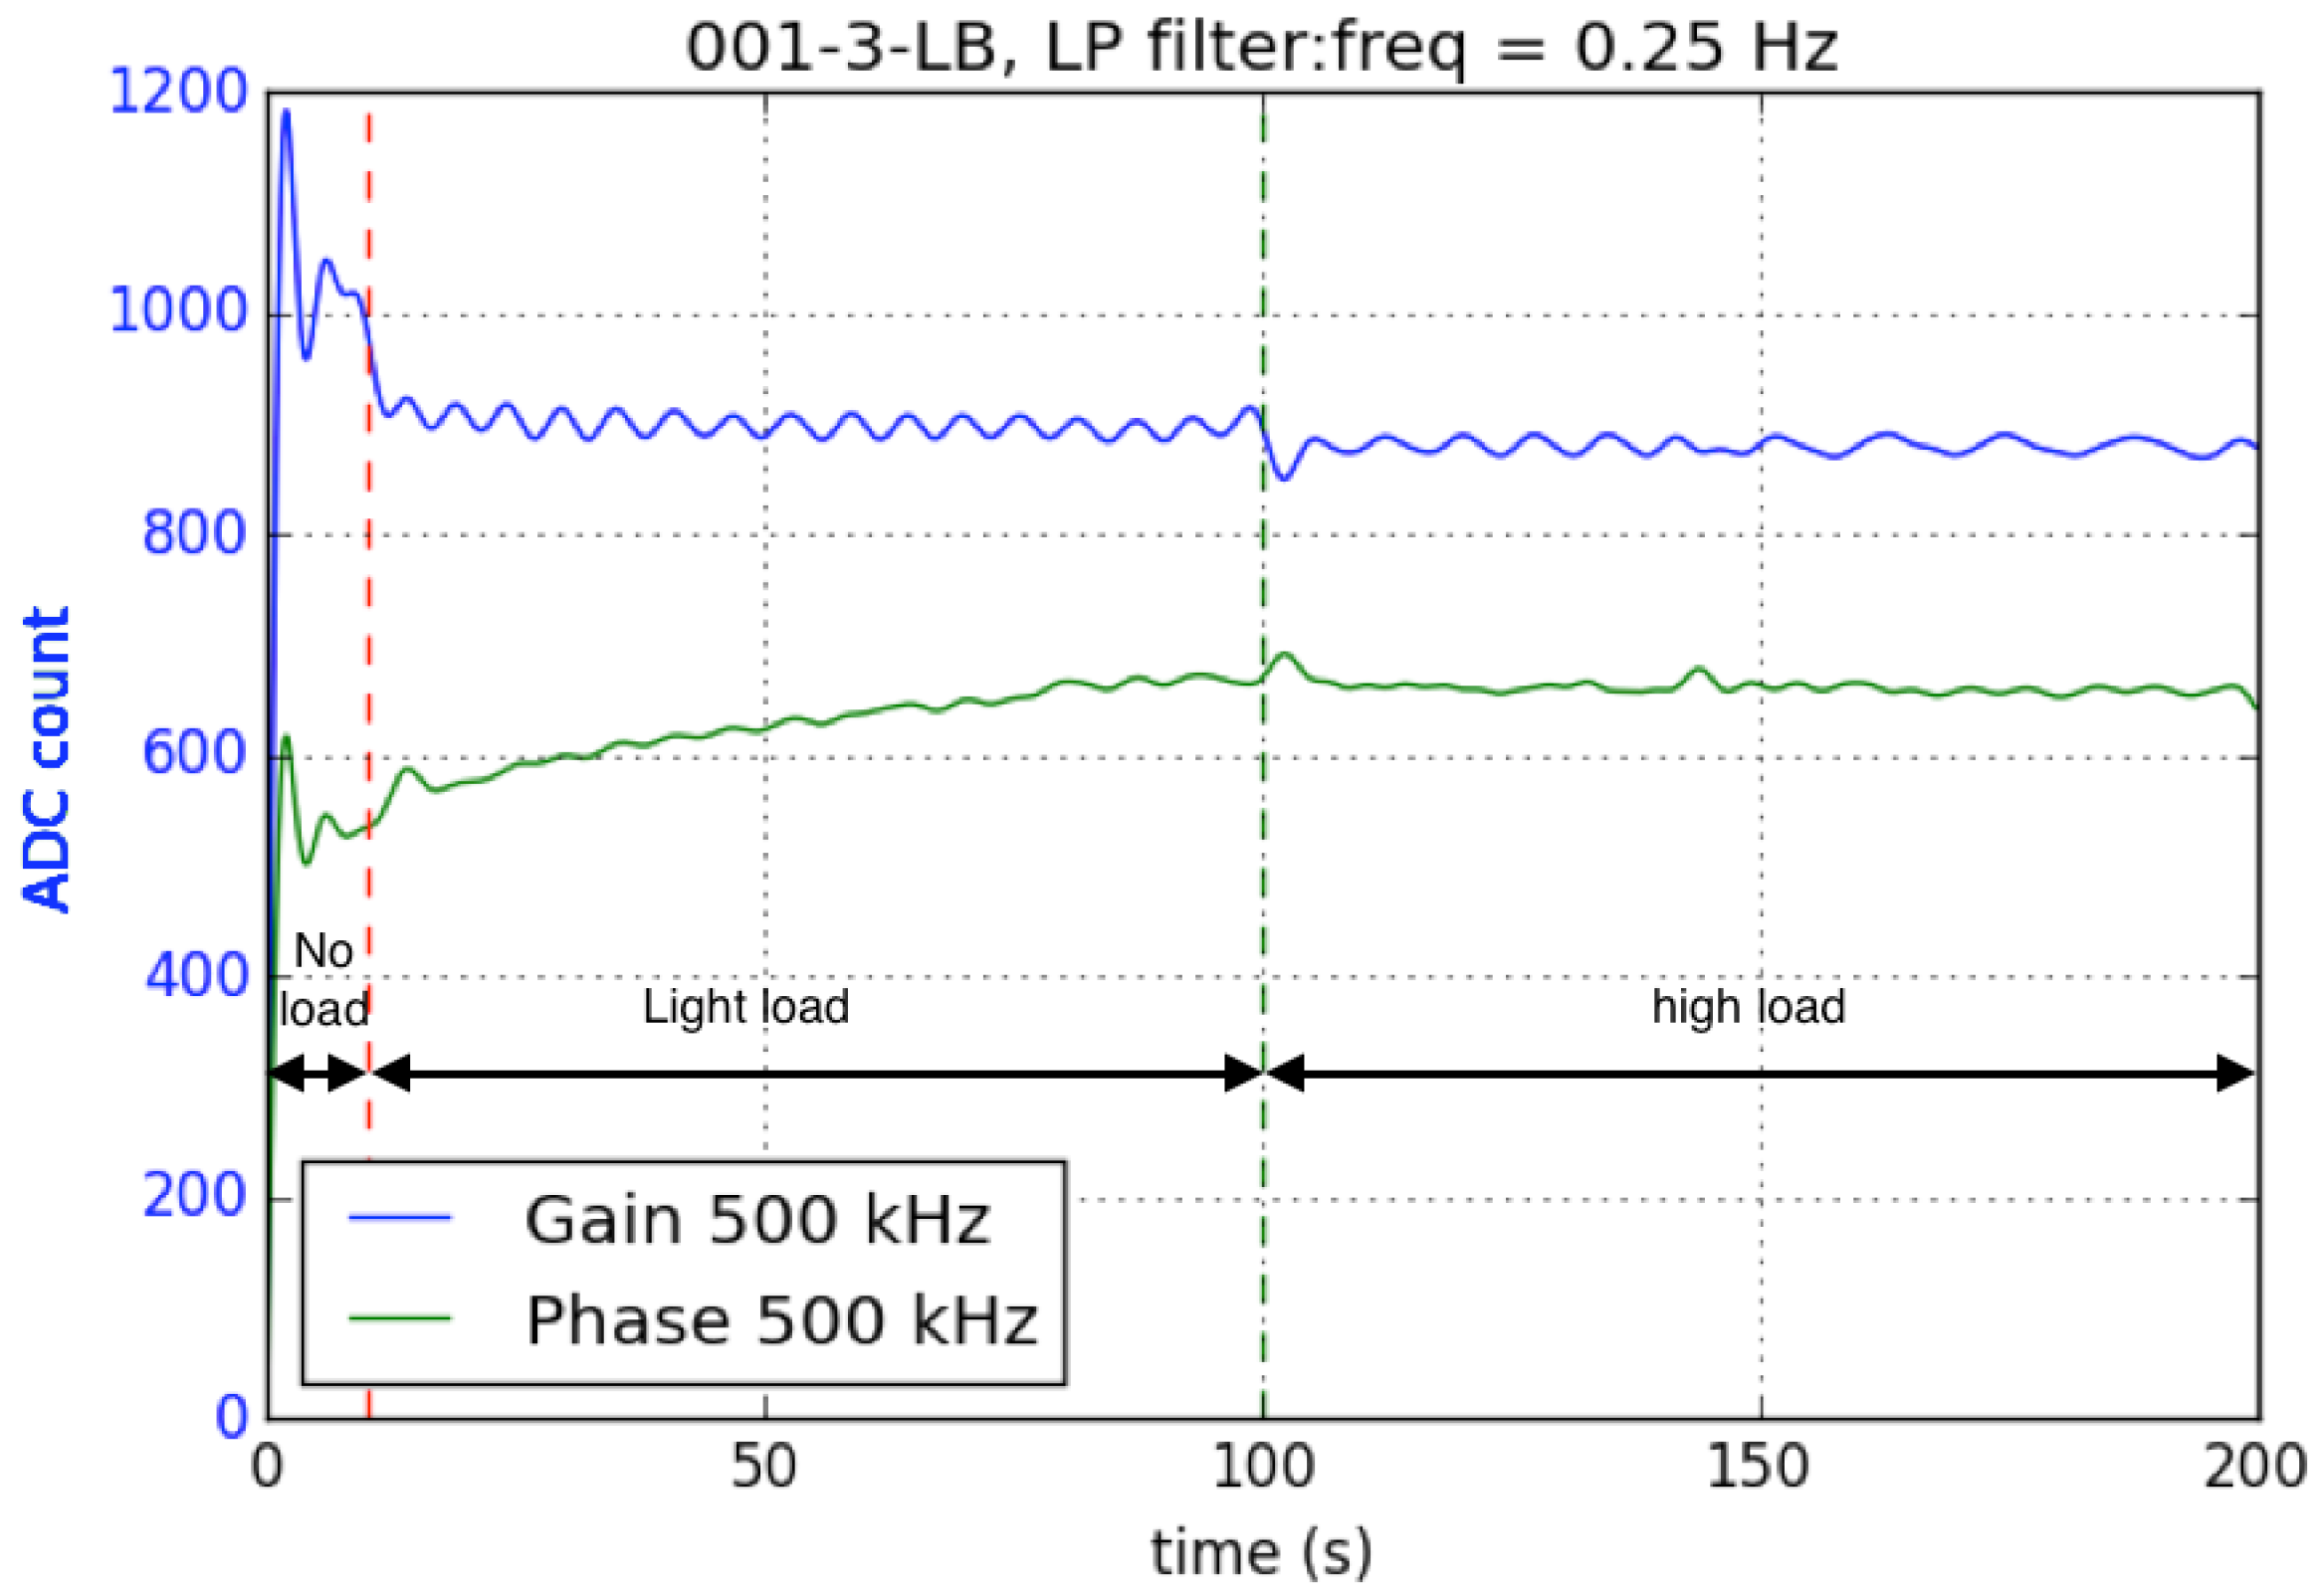
Sweat and in shoe humidity are useful factors for monitoring podiatric skin health, both dry and overly hydrated skin are prone to breakdown and infection. GSR is a useful metric for monitoring the moisture content of the skin and aids the prediction of future condition [24]. Humidity affects evaporation of sweat which may be significant in some environments. Gait frequency can be observed in both signals in Figure 9.

4.4. Bioimpedance

The data in Figure 10 shows the tissue response to 500 kHz capacitively coupled to the sole of the foot and is given for indication. The test causes a reduction in blood flow from the base line due to the pressure exerted while standing and as can be seen in the figure a reduction in frequency of oscillation can be observed. In Figure 11 we see opposite phenomena where the release of the restriction causes hyperaemia and an increase in frequency of osccilation can be observed. This implies that it is feasible to measure the no-load, light load and high load states with the capacitively coupled impedance measurement device presented.

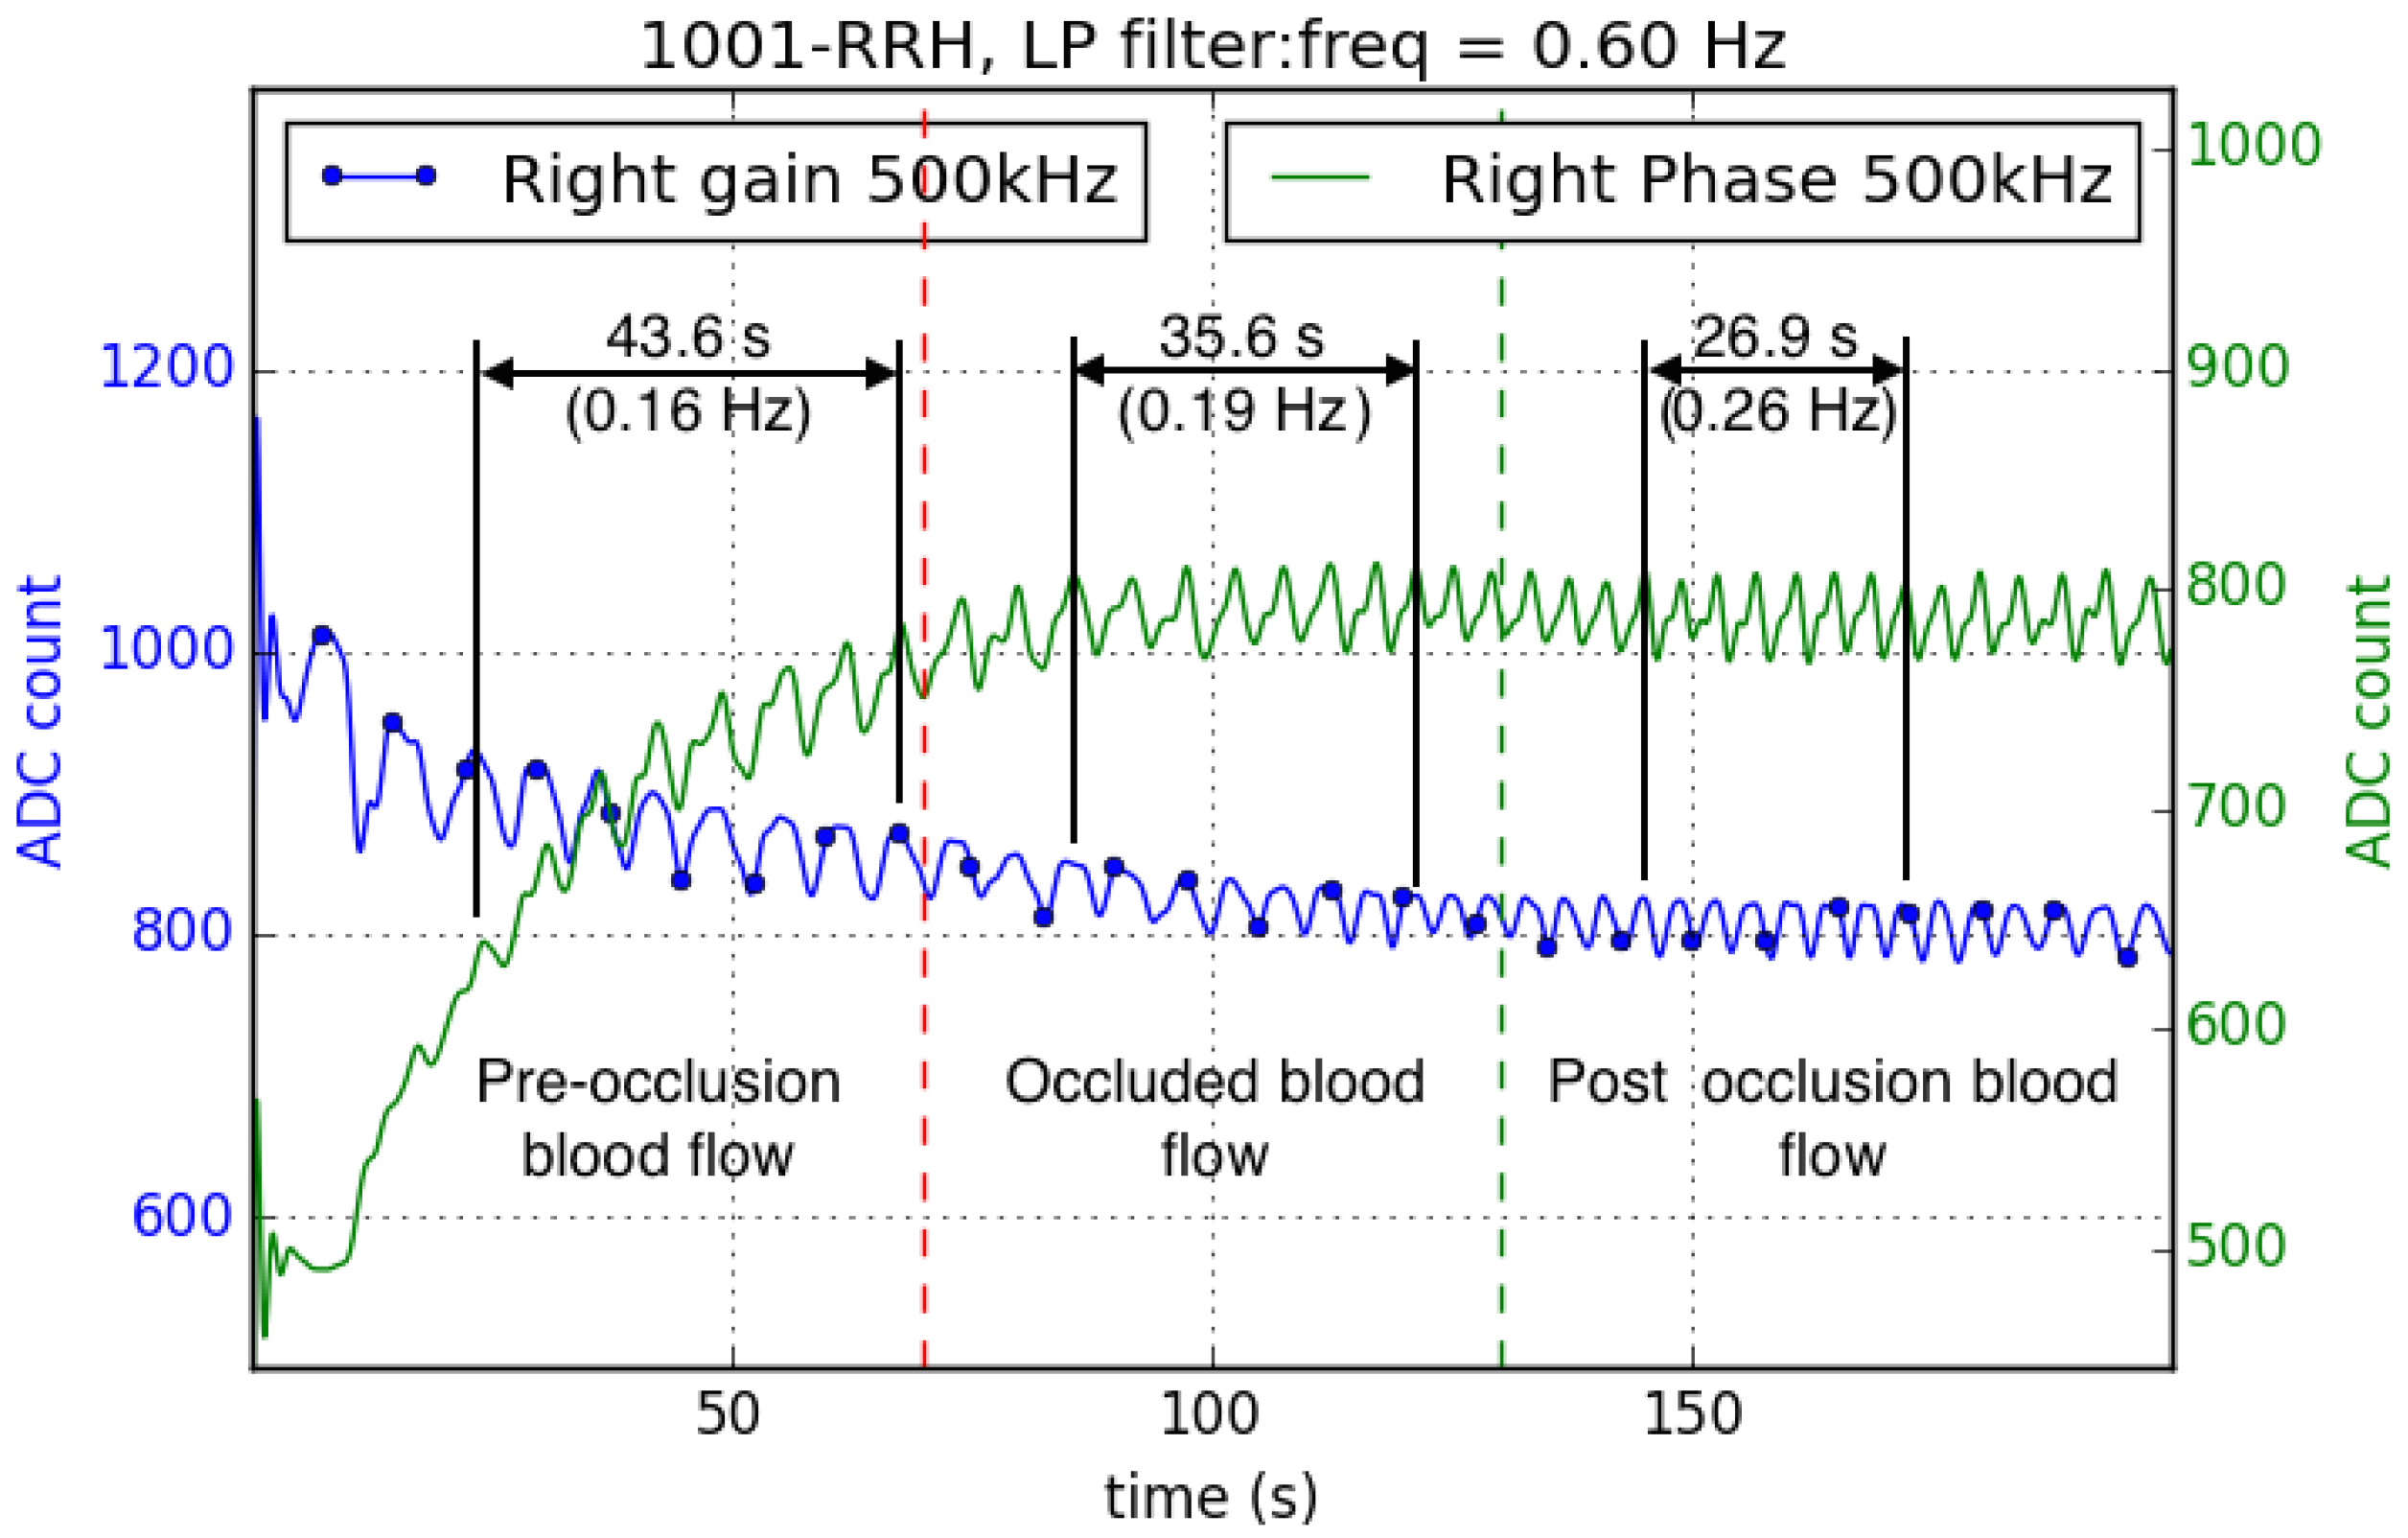
4.5. Occluded Blood Flow

The occluded blood flow test was undertaken with a 1 min occlusion which provided adequate change in the measurable signal to demonstrate device efficacy with minimal volunteer discomfort. As can be seen from Figure 11 the frequency of the signal has increased from 0.16 Hz prior to the occlusion to –0.26 Hz post occlusion in the example given, with some change in the magnitude of the phase measurement. As with a post-occlusive reactive hyperemia test it was noted that stabilisation to a the pre-test condition took a number of minutes [25] this is due to the time taken to normalise the O 2 , C O 2 , N O and metabolites in the tissues after restoration of blood flow. We are currently investigating the utility of this new metric as we are able to observe a measurable effect in tissue in vivo.

4.6. Limitations of the Current Device for Long Term Use

The current device is a useful research tool as sensor positions can be adapted or alternate sensors utilised to suit the test in hand, though it is intended that this be developed into a wearable device for long term monitoring. Sensors currently require 30 min to fit and 10 min to remove with batteries being replaced every two hours. The current electronic package, though not physically intrusive, allowing full articulation of the foot and weighing only 172 g is visually intrusive at 28 × 70 × 130 mm.
Further investigations will be required, after gaining a revised ethical approval, to ensure that the device has a suitable sensitivity and specificity to detect the conditions of concern in a timely manner with diabetic patients. Furthermore output from the device must be intuitive to both the patient and the clinician.
To make this a viable daily wearable monitoring device a number of modifications would be necessary. The embedded electronics and batteries need to be a third of the current volume or smaller. Sensors would be fitted to a standard insole or sock and wearable in any shoe with discrete monitoring and data storage as the sensing must be unobtrusive. Though none of the volunteers complained about discomfort during of after the test careful re-design and subsequent review of the sensor layout, wiring and implementation should be undertaken to ensure there is no hazard to the diabetic foot.
Currently the main 3.7 V 900 m A h battery lasts 2.5 h though no power saving measures have been implemented and a simple though inefficient BlueTooth 2.0 device is used for communication. Consequently low power electronics capable of achieving 16 h of continuous use per day would be required. Finally a robust sensor connection will be required for daily use.

5. Conclusions

Previous devices have combined up to three measurement modalities. The device presented measures eight, 42 individual sensors, bilaterally plus environmental temperature and humidity. This gives the opportunity to evaluate interdependencies in the metrics used and hence quantify the value of each measurement and multifactorial sensing algorithm. Evaluation of the interrelationship of some factors has historically been difficult due the inability to measure multifactorial data in an unconstrained manner, this device alleviates that restriction.
With eight metrics implemented it is now possible to gather comprehensive data from the in shoe environment. This development will give an enhanced understanding of the biomechanics and local environmental considerations that affect the well-being of the foot.
With an increasing understanding of the problems associated with the diabetic foot it will be necessary to modify the sensor arrays to suit specific investigations. This device is an extensible and adaptable measurement system which can be modified to optimise the sensor choices and location as required. The presented device demonstrated the measurement of multifactorial data utilising both analogue, 10 bit , and I 2 C interfaces in real time. These interfaces can be rapidly adapted to measure other sensors required by individual investigators enabling the customisation of the measurement array.
The presented system demonstrates the feasibility of measuring complex multifactorial data in the laboratory, clinic, gymnasium or sports field based on commodity hardware. Though the use of a battery pack and touch screen would allow the Raspberry Pi to be used in a mobile situation, further development could lead to either conversion to BTLe (BT4) with data logging on other mobile devices or peer to peer, in shoe, data logging for increased utility at a later date. We utilised a sampling frequency, 20 Hz , which is lower than commercially available devices such as the Sensoria Sock [12] 35 Hz or the TekScan MatScan [13] 40 Hz to enable the gathering of larger data sets with the available hardware. Inputs were low pass filtered at 10 Hz and sampled at 20 Hz to obey the Nyquist sampling theorem. Utilising this sample frequency any signal of less than 10 Hz can be accurately reproduced.
The Raspberry Pi has been a reliable, robust and adaptable device for conducting this research. The basic Rasbian OS has been stable in the laboratory allowing the Python scripts to run unhindered by the background tasks that affect desktop computers. The low cost has enabled us to leave test set ups permanently configured, reducing the time to commence testing, while networking the devices allowed remote access over a secure local network.

Acknowledgments

James Coates was funded by PhD studentship awards from the Gerald Kerkut Charitable Trust, the Institute for Life Sciences (IfLS) UOS & EPSRC, (EP/K503150/). All data supporting this study are openly available from the University of Southampton repository at: http://dx.doi.org/10.5258/SOTON/386374.

Author Contributions

All three authors have equally contributed to this paper.

Conflicts of Interest

The authors declare no conflict of interest.

References

  1. Raspberry Pi Foundation. Available online: https://www.raspberrypi.org (accessed on 21 May 2016).
  2. Raspbian OS. Available online: https://www.raspbian.org (accessed on 21 May 2016).
  3. NICE. Diabetic Foot Problems: Prevention and Management (NG19); NICE: London/Manchester, UK, 2015. [Google Scholar]
  4. Hex, N.; Bartlett, C.; Wright, D.; Taylor, M.; Varley, D. Estimating the current and future costs of Type 1 and Type 2 diabetes in the UK, including direct health costs and indirect societal and productivity costs. Diabet. Med. 2012, 29, 855–862. [Google Scholar] [CrossRef] [PubMed]
  5. Lavery, L.A.; Higgins, K.R.; Lanctot, D.R.; Constantinides, G.P.; Zamorano, R.G.; Armstrong, D.G.; Athanasiou, K.A.; Agrawal, C.M. Home monitoring of foot skin temperatures to prevent ulceration. Diabet. Care 2004, 27, 2642–2647. [Google Scholar] [CrossRef]
  6. Armstrong, D.G.; Lavery, L.A.; Liswood, P.J.; Todd, W.F.; Tredwell, J.A. Infrared dermal thermometry for the high-risk diabetic foot. Phys. Therapy 1997, 77, 169–175. [Google Scholar]
  7. Edmonds, M. The Neuropathic Foot in Diabetes Part I: Blood Flow. Diabet. Med. 1986, 3, 111–115. [Google Scholar] [CrossRef] [PubMed]
  8. Flynn, M.; Edmonds, M.; Tooke, J.; Watkins, P. Direct measurement of capillary blood flow in the diabetic neuropathic foot. Diabetologia 1988, 31, 652–656. [Google Scholar] [CrossRef] [PubMed]
  9. Soames, R. Foot pressure patterns during gait. J. Biomed. Eng. 1985, 7, 120–126. [Google Scholar] [CrossRef]
  10. Maluf, K.S.; Morley, R.E.; Richter, E.J.; Klaesner, J.W.; Mueller, M.J. Foot pressures during level walking are strongly associated with pressures during other ambulatory activities in subjects with diabetic neuropathy. Arch. Phys. Med. Rehabil. 2004, 85, 253–260. [Google Scholar] [CrossRef] [PubMed]
  11. Nardone, A.; Grasso, M.; Schieppati, M. Balance control in peripheral neuropathy: are patients equally unstable under static and dynamic conditions? Gait Posture 2006, 23, 364–373. [Google Scholar] [CrossRef] [PubMed]
  12. D’Addio, G.; Iuppariello, L.; Pagano, G.; Biancardi, A.; Bifulco, P.; Cesarelli, M. New Posturographic Assessment by mean of Novel E-textile and Wireless Socks Device in Normal Subjects. Available online: http://www.gamant.it/download/IEEE%20EMBS%202015%20-%20D’Addio%20-%20Sensoria.pdf (accessed on 21 May 2016).
  13. Zammit, G.V.; Menz, H.B.; Munteanu, S.E. Research Reliability of the TekScan MatScan® system for the measurement of plantar forces and pressures during barefoot level walking in healthy adults. J. Foot. Ankle Res. 2010, 3. [Google Scholar] [CrossRef] [PubMed]
  14. Nicolopoulos, C.; Anderson, E.; Solomonidis, S.; Giannoudis, P. Evaluation of the gait analysis FSCAN pressure system: clinical tool or toy? Foot 2000, 10, 124–130. [Google Scholar] [CrossRef]
  15. Morley, R.E., Jr.; Richter, E.J.; Klaesner, J.W.; Maluf, K.S.; Mueller, A.J. In-shoe multisensory data acquisition system. IEEE Trans. Biomed. Eng. 2001, 48, 815–820. [Google Scholar] [CrossRef] [PubMed]
  16. Maluf, K.S.; Morley, R.E.; Richter, E.J.; Klaesner, J.W.; Mueller, M.J. Monitoring in-shoe plantar pressures, temperature, and humidity: Reliability and validity of measures from a portable device. Arch. Phys. Med. Rehabil. 2001, 82, 1119–1127. [Google Scholar] [CrossRef] [PubMed]
  17. Armstrong, D.G.; Holtz-Neiderer, K.; Wendel, C.; Mohler, M.J.; Kimbriel, H.R.; Lavery, L.A. Skin temperature monitoring reduces the risk for diabetic foot ulceration in high-risk patients. Am. J. Med. 2007, 120, 1042–1046. [Google Scholar] [CrossRef] [PubMed]
  18. Gefen, A. Plantar soft tissue loading under the medial metatarsals in the standing diabetic foot. Med. Eng. Phys. 2003, 25, 491–499. [Google Scholar] [CrossRef]
  19. Sawacha, Z.; Gabriella, G.; Cristoferi, G.; Guiotto, A.; Avogaro, A.; Cobelli, C. Diabetic gait and posture abnormalities: A biomechanical investigation through three dimensional gait analysis. Clin. Biomech. 2009, 24, 722–728. [Google Scholar] [CrossRef] [PubMed]
  20. Segev-Bar, M.; Landman, A.; Nir-Shapira, M.; Shuster, G.; Haick, H. Tunable touch sensor and combined sensing platform: Toward nanoparticle-based electronic skin. ACS Appl. Mater. Interfaces 2013, 5, 5531–5541. [Google Scholar] [CrossRef] [PubMed]
  21. Stefanovska, A.; Bračič, M.; Kvernmo, H.D. Wavelet analysis of oscillations in the peripheral blood circulation measured by laser Doppler technique. IEEE Trans. Biomed. Eng. 1999, 46, 1230–1239. [Google Scholar] [CrossRef] [PubMed]
  22. Klaesner, J.W.; Hastings, M.K.; Zou, D.; Lewis, C.; Mueller, M.J. Plantar tissue stiffness in patients with diabetes mellitus and peripheral neuropathy. Arch. Phys. Med. Rehabil. 2002, 83, 1796–1801. [Google Scholar] [CrossRef] [PubMed]
  23. Orlin, M.N.; McPoil, T.G. Plantar pressure assessment. Phys. Therapy 2000, 80, 399–409. [Google Scholar]
  24. Petrofsky, J.S.; McLellan, K. Galvanic skin resistance—A marker for endothelial damage in diabetes. Diabet. Technol. Therap. 2009, 11, 461–467. [Google Scholar] [CrossRef] [PubMed]
  25. De Mul, F.F.; Morales, F.; Smit, A.J.; Graaff, R. A model for post-occlusive reactive hyperemia as measured with laser-Doppler perfusion monitoring. IEEE Trans. Biomed. Eng. 2005, 52, 184–190. [Google Scholar] [CrossRef] [PubMed]
Figure 1. Ambulatory and bioimpedance data-capture schematic.
Electronics 05 00045 g001
Figure 2. Sensors fitted to the foot.
Electronics 05 00045 g002
Figure 3. Accelerometer reference block.
Electronics 05 00045 g003
Figure 4. Bioimpedance effect of drive frequency and phase change on measured gain. Gain measurement is constant, 990–1010 from 100–1000 kHz, though an inflection in the data is clearly visible showing the output to be non linear below this range.
Electronics 05 00045 g004
Figure 5. Bioimpedance effect of drive frequency and phase change on measured phase. Phase measurement is proportional to the phase from 100–1000 kHz, below this range a perturbation is seen that increases with decreasing signal frequency.
Electronics 05 00045 g005
Figure 6. Sensor layout over the foot profile. Force and temperature sensors are positioned over the calcaneus (heal), great toe, 1st metatarsal (joint at the base of the great toe), 5th metatarsal (joint at the base of the small toe). GSR can be seen below the 5th metatarsal force sensor with bioimpedance placed mid foot.
Electronics 05 00045 g006
Figure 7. Comparison of vertical accelerations between the left and right feet while walking at 4.5 km/h. Asymmetry in the gait cycle is shown.
Electronics 05 00045 g007
Figure 8. Comparison of vertical acceleration to timing of peak force at the calcaneus (heal) while walking at 4.5 m/s.
Electronics 05 00045 g008
Figure 9. Comparison of GSR and humidity on the left foot while walking at 4.5 m/s.
Electronics 05 00045 g009
Figure 10. Bioimpedance sensor measuring unloaded—light load (foot resting on sensor, volunteer seated)—high load (volunteer standing). The data for gain show differences in the frequency and magnitude of signal for all three load conditions confirming the sensors ability to sense such changes.
Electronics 05 00045 g010
Figure 11. Bioimpedance of occluded and un-occluded blood flow. The characteristic frequency for each condition was estimated by dividing the cycle count by the corresponding Δ t .
Electronics 05 00045 g011
Table 1. Sensor table.
Sensing ModalityPart NumberManufacturerInterfaceRangeUnitsCalibration or Validation
AccelerometerMPU6050InvensenseI2C±16gValidation
RotationMPU6050InvensenseI2C±2000 s 1 Validation
HumidityHYT271HygrochipI2C0–99% RHValidation
TemperatureHYT271HygrochipI2C–40–125 C Validation
GSR-Self builtAnalogue0–5000Validation
BioimpedanceAD9850 AD8302Analogue DevicesAnalogue0–1023AUValidation
ForceA401-25FlexiforceAnalogue0–140NCalibration
Temperature skin104JT-25ATC-SemitecAnalogue20–40 C Calibration
Table 2. Volunteer details for graphical data presented in this article.
VolunteerGenderAgeHeight (m)Weight (kg)BMI
001M46.001.7897.0030.61
009M29.001.8075.8023.40
1001F27.001.7055.7019.27
Table 3. Male volunteer details.
Participants AgeHeight (m)Weight (kg)BMI
Min24.001.6759.8019.31
n = 15Mean33.401.8080.8324.88
Max49.001.9099.0030.61
Table 4. Test table.
TestExerciseDescription
1Stand 1free standing
2Sit 1sitting in a rigid office chair
3Walk 1walk at 2.0 km/h on the treadmill
4Walk 2walk at 4.5 km/h on the treadmill
5Stand 2free standing
6Walk 3walk at a self-selected pace
7Walk 4walk at a self-selected pace
8Stand 3free standing
9Sit 2sitting in a rigid office chair

