
Ultra-Low-Cost and Ultra-Low-Power, Miniature Acoustic Modems Using Multipath Tolerant Spread-Spectrum Techniques


1
Intelligent Sensing and Communications Group, School of Engineering, Newcastle University, Newcastle upon Tyne NE1 7RU, UK
2
Department of Electronic Engineering, University of York, York YO10 5DD, UK
*
Author to whom correspondence should be addressed.
Electronics 2022, 11(9), 1446; https://doi.org/10.3390/electronics11091446
Submission received: 30 March 2022
/
Revised: 27 April 2022
/
Accepted: 28 April 2022
/
Published: 29 April 2022
(This article belongs to the Special Issue Underwater Optical and Acoustic Communications: Research and Challenges)
Abstract
:To enable long-term, large-scale, dense underwater sensor networks or Internet of Underwater Things (IoUT) this research investigates new novel waveforms and experimental prototypes for robust communications on ultra-low-cost and ultra-low-power, miniature acoustic modems. Spread-spectrum M-ary orthogonal signalling (MOS) is used with symbols constructed from subsequences of long pseudorandom codes. This decorrelates multipath signals, even when the time-spread spans many symbols, so they present as random noise. A highly cost-engineered and miniaturised prototype acoustic modem implementation was created, for the 24 kHz–32 kHz band, with low receive power consumption (12.5 mW) and transmit power of <1 W. Simulations show that the modulation scheme achieves 640 bit/s at −4.5 dB with AWGN or the equivalent level of multipath energy. Experimental validation of the hardware shows successful point-to-point communication at ranges of >3 km in lakes and >2 km in the sea including severe multipath. In lake testing of a 7-node, multi-hop, sensor network with TDA-MAC protocol, packet delivery was near 100% for all nodes. Trials of acoustic sensor nodes in the North Sea achieved 99.5% data delivery over a 3-month period and a wide range of sea conditions. Modulation and hardware have proven reliable in a variety of underwater environments. Competitive range and throughput with low cost and power are attractive for large-scale and long-term battery-operated networks. This research has delivered a viable and affordable communication technology for future IoUT applications.
1. Introduction
There is great demand for fixed and distributed subsea sensors deployed in large numbers to measure the marine environment with high spatial and temporal resolution. Underwater acoustic modems are a key enabling technology for these large-scale wireless sensor networks in the field of Internet of Underwater Things (IoUT).
Several research and commercial organisations are exploring the use of miniature autonomous platforms for cost effective oceanographic sensing. For example, ecoSUB Robotics are a spin out from the National Oceanography Centre and Planet Ocean with the mission of “advanced, small, low-cost AUV technology” [1]. The EU H2020 subCULTron project developed heterogeneous robots, including underwater platforms carried by the current, for investigating environments such as the Venice Lagoon [2]. The University of Washington and PMEC developed microFloat “an underwater float–a trackable, drifting sensor package–that is inexpensive enough to be deployed in swarms to perform simultaneous, distributed measurements in energetic tidal currents.” [3,4].
These projects had a need for miniature, low-cost, and low-power, underwater acoustic modems for data communication as well as positioning/tracking of AUVs. Finding nothing available that met their requirements, they approached the team at Newcastle University. This collaboration led to the development of initial academic experimental prototypes of a first generation of miniature acoustic modems with size, weight, power, and cost (SWaP-C) as the driving requirements for design.
These first experimental modems utilised robust and well known waveforms as described below. The research outlined in this paper looks at new novel waveforms to increase the datarate and robustness in multipath channels and the hardware optimisations for the next generation device.
1.1. First Generation Experimental Prototypes
The first generations of miniature acoustic modems, the NMv1 and NMv2, were developed to support these projects [5,6], providing low-data-rate communications for telemetry/command-and-control and localisation/positioning of the robots. The NMv2 modem performance specifications are shown in Table 1. The NMv2 modem uses spread-spectrum binary orthogonal keying using LFM chirps for data modulation. It has achieved ranges of 2 km and has a low-power receiver listening state of 10 mW.
Climent et al., as part of an overview paper on underwater acoustic communications in 2014, listed commercially available modems [7], and research group developed modems [7]. Sendra et al. conducted a review of underwater acoustic modems, published in 2015, with key parameters listed [8]. The review covered commercially available modems as well as modems developed by research groups to support specific projects. Sendra et al. also show the relationship between all of the reviewed modems’ operating frequency and the maximum range achieved. It is notable that the research group developed modems fall well short of the benchmark with respect to the operating range [8]. The lowest stated receiver listening power consumption was 24 mW by Sánchez et al. [9,10].
Results from field testing the NMv2 modems in the above projects, and further sea trials [11], were positive and so led to research into novel waveforms and a next generation device in the NMv3, with the goal of greatly improved data throughput whilst maintaining the key desirable features of the NMv2, i.e., ultra-low cost and power, small dimensions and robust communication over a range of at least 2 km.
1.2. Paper Outline
This paper describes the novel acoustic signal and modulation design, the hardware design, and optimised software receiver structures used, all of which are incorporated into the academic experimental prototypes of the NMv3. The simulations are compared with experimental validation for the PHY layer. A TDA-MAC network protocol is then added with experimental validation of a seven node network with dynamic multi-hop routing in Loch Earn.
Point-to-point communications from battery-operated sensor nodes deployed in the North Sea over an extended period of time are analysed using audio recordings of the acoustic transmissions to determine channel conditions and packet delivery success rates.
Performance characteristics of the prototype NMv3 modem incorporating the new waveforms and hardware are then compared against those of the precursor prototype NMv2 modem to validate the aim of increased throughput and robustness in multipath channels whilst maintaining key SWaP-C characteristics.
This paper explores the research, design, and simulation of novel waveforms, and the subsequent experimental validation of a low cost/complexity prototype modem, with performance that is competitive with much more complex and costly commercial modems when operating frequency, power, and range are taken into account.
2. Aim
The aim of this paper is to capture the research, development, and experimental validation of new novel waveforms incorporated into academic experimental prototype hardware, resulting in an underwater acoustic modem capable of meeting the following criteria:
- Operating Range: up to 2 km in typical sea conditions, including shallow-water, reverberation limited channels;
- Data rate: >100 bit /s;
- Battery Life in IoUT application: >12 months;
- Volume: <100 cm3 (including transducer) for use on micro AUV platforms;
- Production cost: <£100.
For the long term operation of large scale sensor networks, there is also a driver to minimise the potential impact of acoustic emissions on marine mammals [15,16,17,18,19,20,21]. The NMv2 modem already limits the transmit power levels, however repetitive, frequency modulated waveforms are potentially disruptive to marine mammals, e.g., they are known to cause behavioural effects on Harbour Porpoises [20]. Previous research into bio-friendly spread-spectrum techniques has informed the design of the waveforms used in this design [22,23,24].
The paper is organised into the following structure. The signal design is investigated in Section 3. The hardware platform design of an acoustic modem, including packet structure definition, is covered in Section 4. Experimental validation of the modem hardware and physical layer performance is covered in Section 5. The use of modems as part of the network experiments is investigated in Section 6. Finally, the results are discussed in depth in Section 7 followed by the conclusions in Section 8.
3. Signal Design
One of the key criteria of the design is for the modem to be low-power, which as well as the receiver consumption translates to a greatly reduced transmit power, <1 W, which is significantly lower than typical commercially available modems. In order to target usable communication ranges of up-to 2 km this requires a receiver with the ability to process signals at low SNR, typically approaching 0 dB. Processing gain through the use of spread-spectrum techniques is hence a key part of the design shown here.
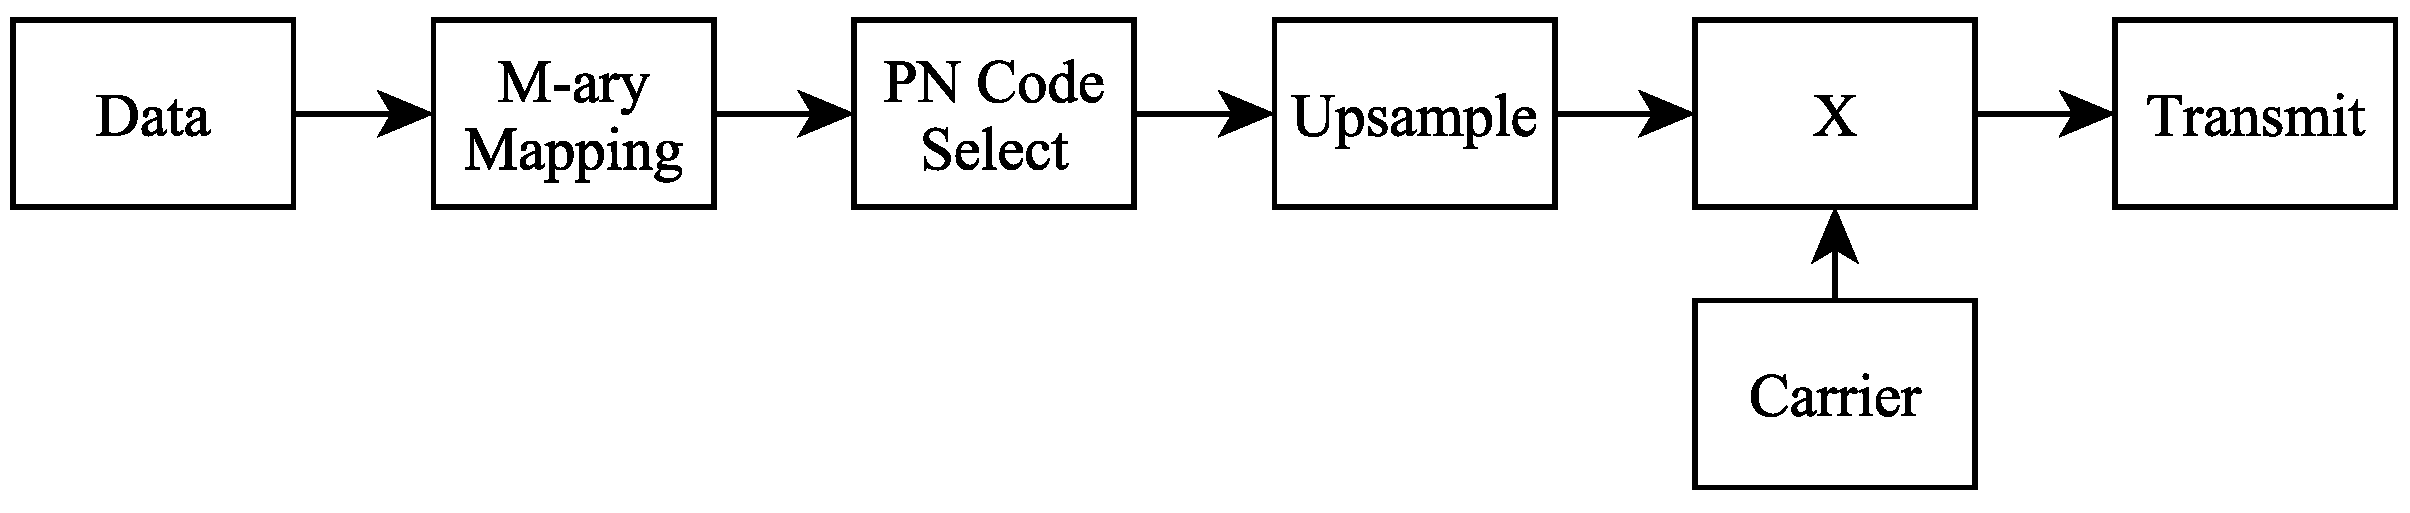
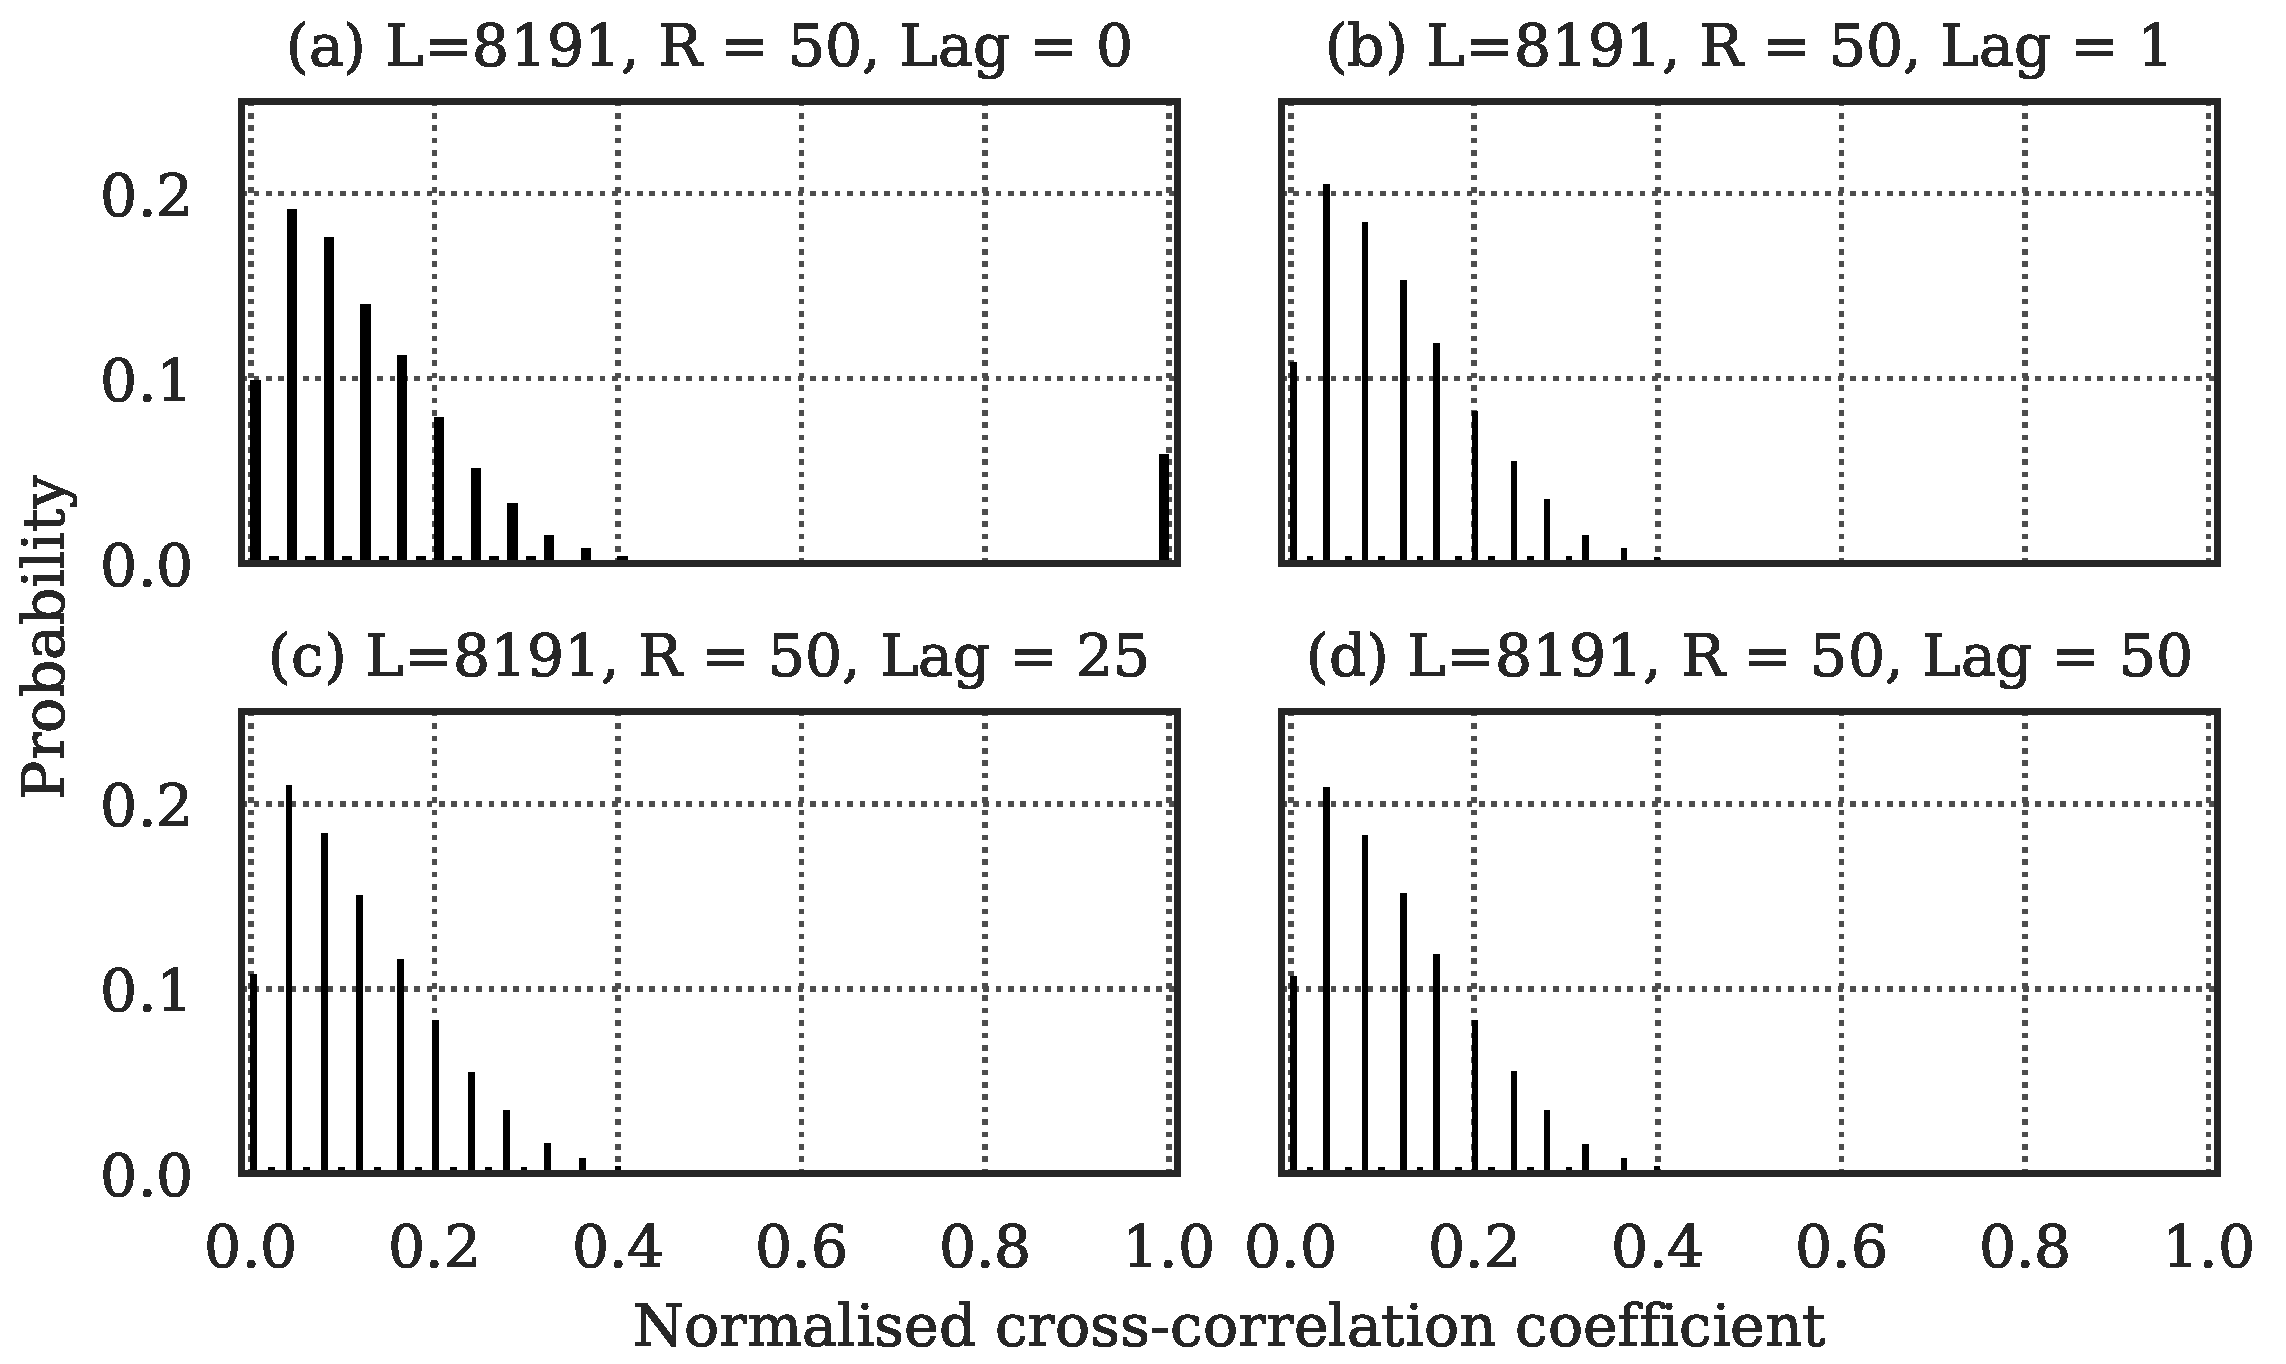
The PHY layer is based on M-ary orthogonal signalling (MOS) principles, referred to here as M-ary orthogonal code keying (M-OCK) [22,23,24], with BPSK modulation. In this case, a carrier is BPSK-modulated with 1 of 16 pseudorandom sequences, of length N chips, to represent a 4 bits data symbol. The BT product, and hence processing gain, for each symbol, is therefore equal to N. The received baseband signal is correlated against each of the 16 sequences to extract the transmitted data. The performance of this form of modulation in multipath interference and additive noise is strongly dependent on the auto and cross correlation properties of the transmitted sequences and many options exist for the design of these sequences. For instance, maximal length sequences (m-sequences) have ideal cross correlation functions when repeated with period N but this cannot be harnessed in M-OCK as different sequences must be concatenated. Likewise orthogonal sequence sets such as Hadamard matrices have zero cross correlation but very poor auto-correlation functions which makes them very susceptible to multipath interference. Gold and Kasami sequences have well bounded auto and cross correlation functions but, again, these are only achieved with periodicity of N chips. In this scheme, N-chip sub-sequences are extracted from 16 longer m-sequences, each of duration as long as the transmitted packet, and used to form the M-OCK symbols. The block diagram for signal generation is shown in Figure 1. The effectiveness of such long m-sequences as a spreading waveform for DSSS-QPSK is demonstrated in [25] and similar properties are exploited here. For relatively large values of N (of the order of 50), the statistical properties of auto and cross correlation for these subsequences across the whole packet are very favourable and represent a good compromise between the competing metrics. Furthermore, since there is no periodicity in the transmitted waveform, decorrelation of multipath interference (ISI rejection) is independent of the channel time-spread, which can span any number of symbols and may include paths delayed by exact multiples of the symbol period. Another useful feature of this form of M-OCK, is that any value of N may be chosen rather than being limited to powers of 2, as with discrete pseudorandom sequences. Hence the BT product/processing gain and data rate are completely scalable. Figure 2 shows histograms of normalised correlation coefficients for all permutations of 50 chip subsequences drawn from 16 × 8191 chip m-sequences. This demonstrates that correlation sidelobes have low mean values and are well bounded for all values of lag, including multiples of the symbol period.
The resultant noise-like signal packets, with low peak power, means that potential discomfort to marine mammals should be minimised [18,20,26]. The lack of any periodicity (repetition) in the packet also maintains a white spectrum and is a desirable property for low probability of detection/exploitation (LPD/LPE) in some applications.
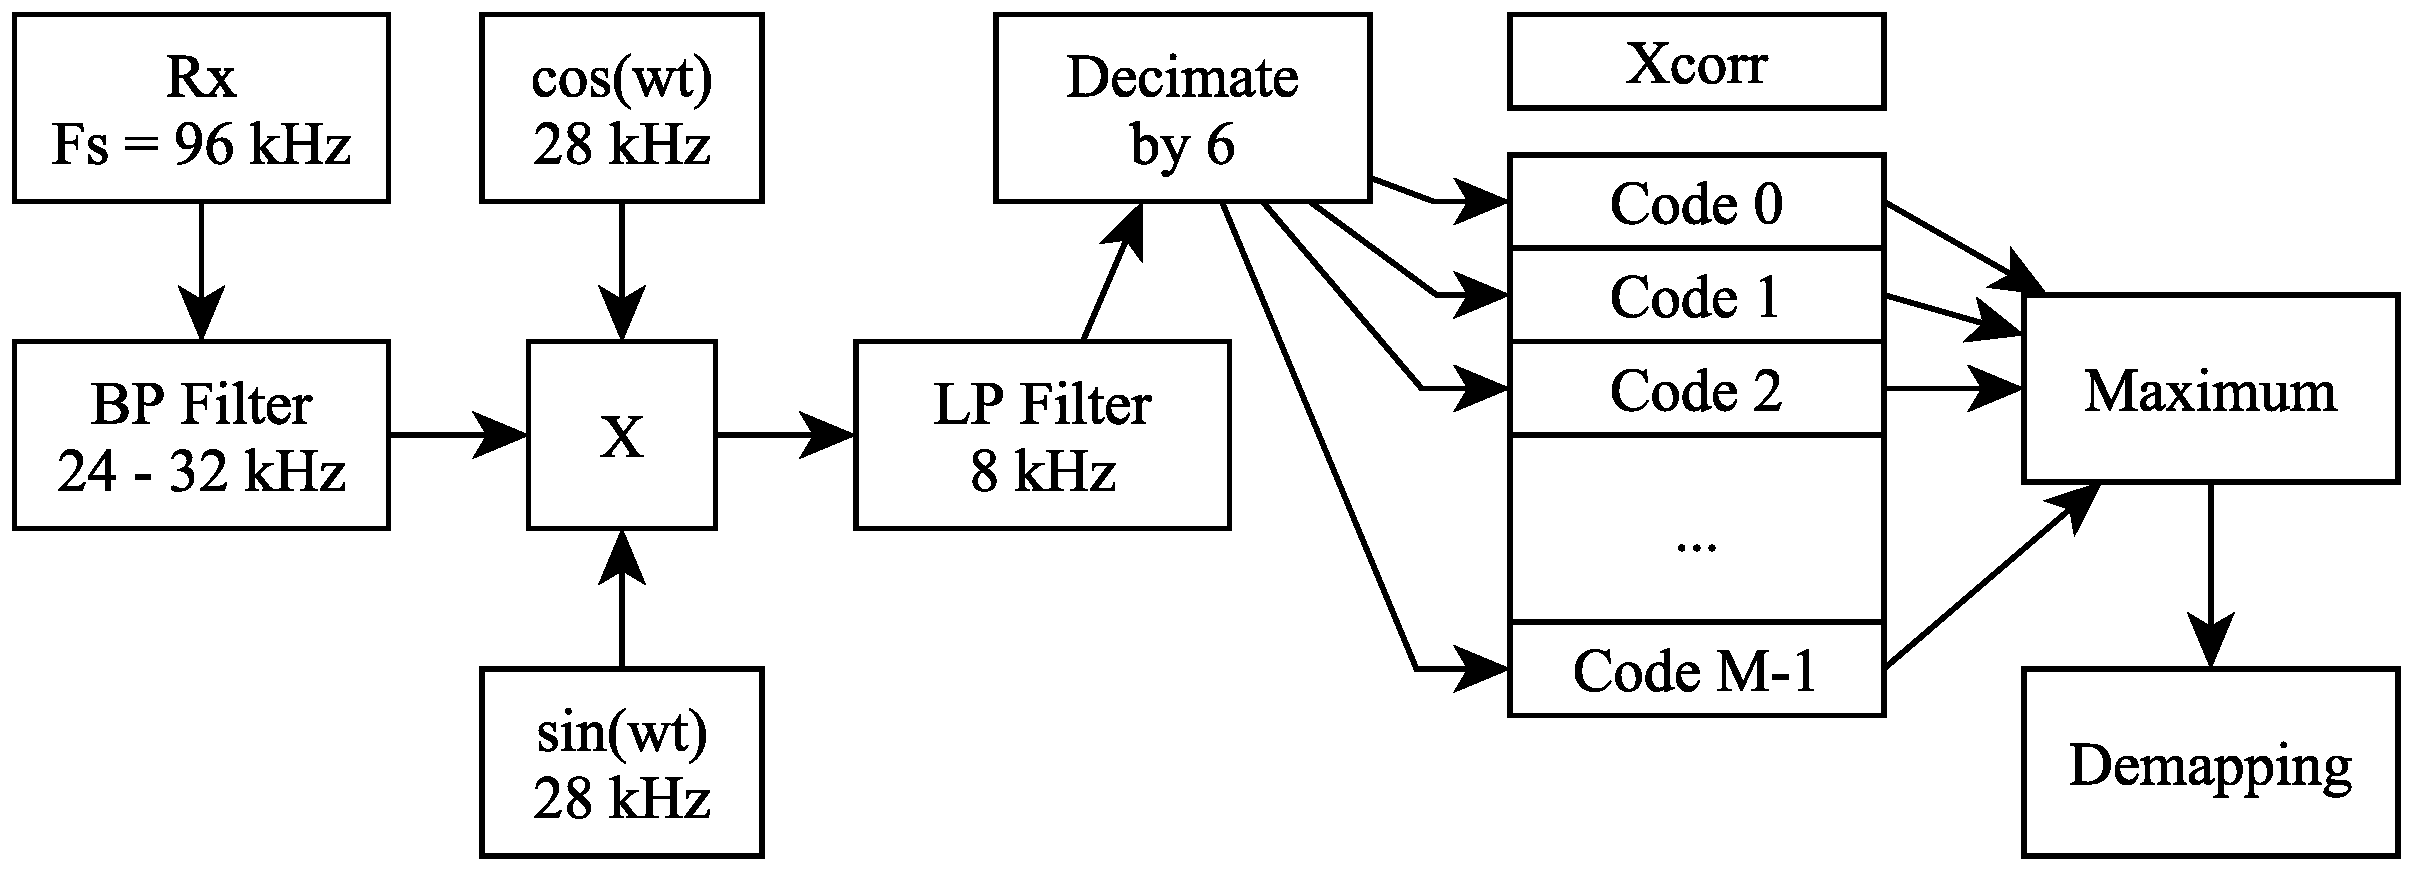
An idealised receiver structure for this modulation scheme is shown in Figure 3. Here the received signal with a carrier frequency of 28 kHz and chip rate of 8 kHz is bandpass filtered, then converted to complex baseband before cross-correlating with the set of M PN subsequences and the maximum value taken to demap the symbol.
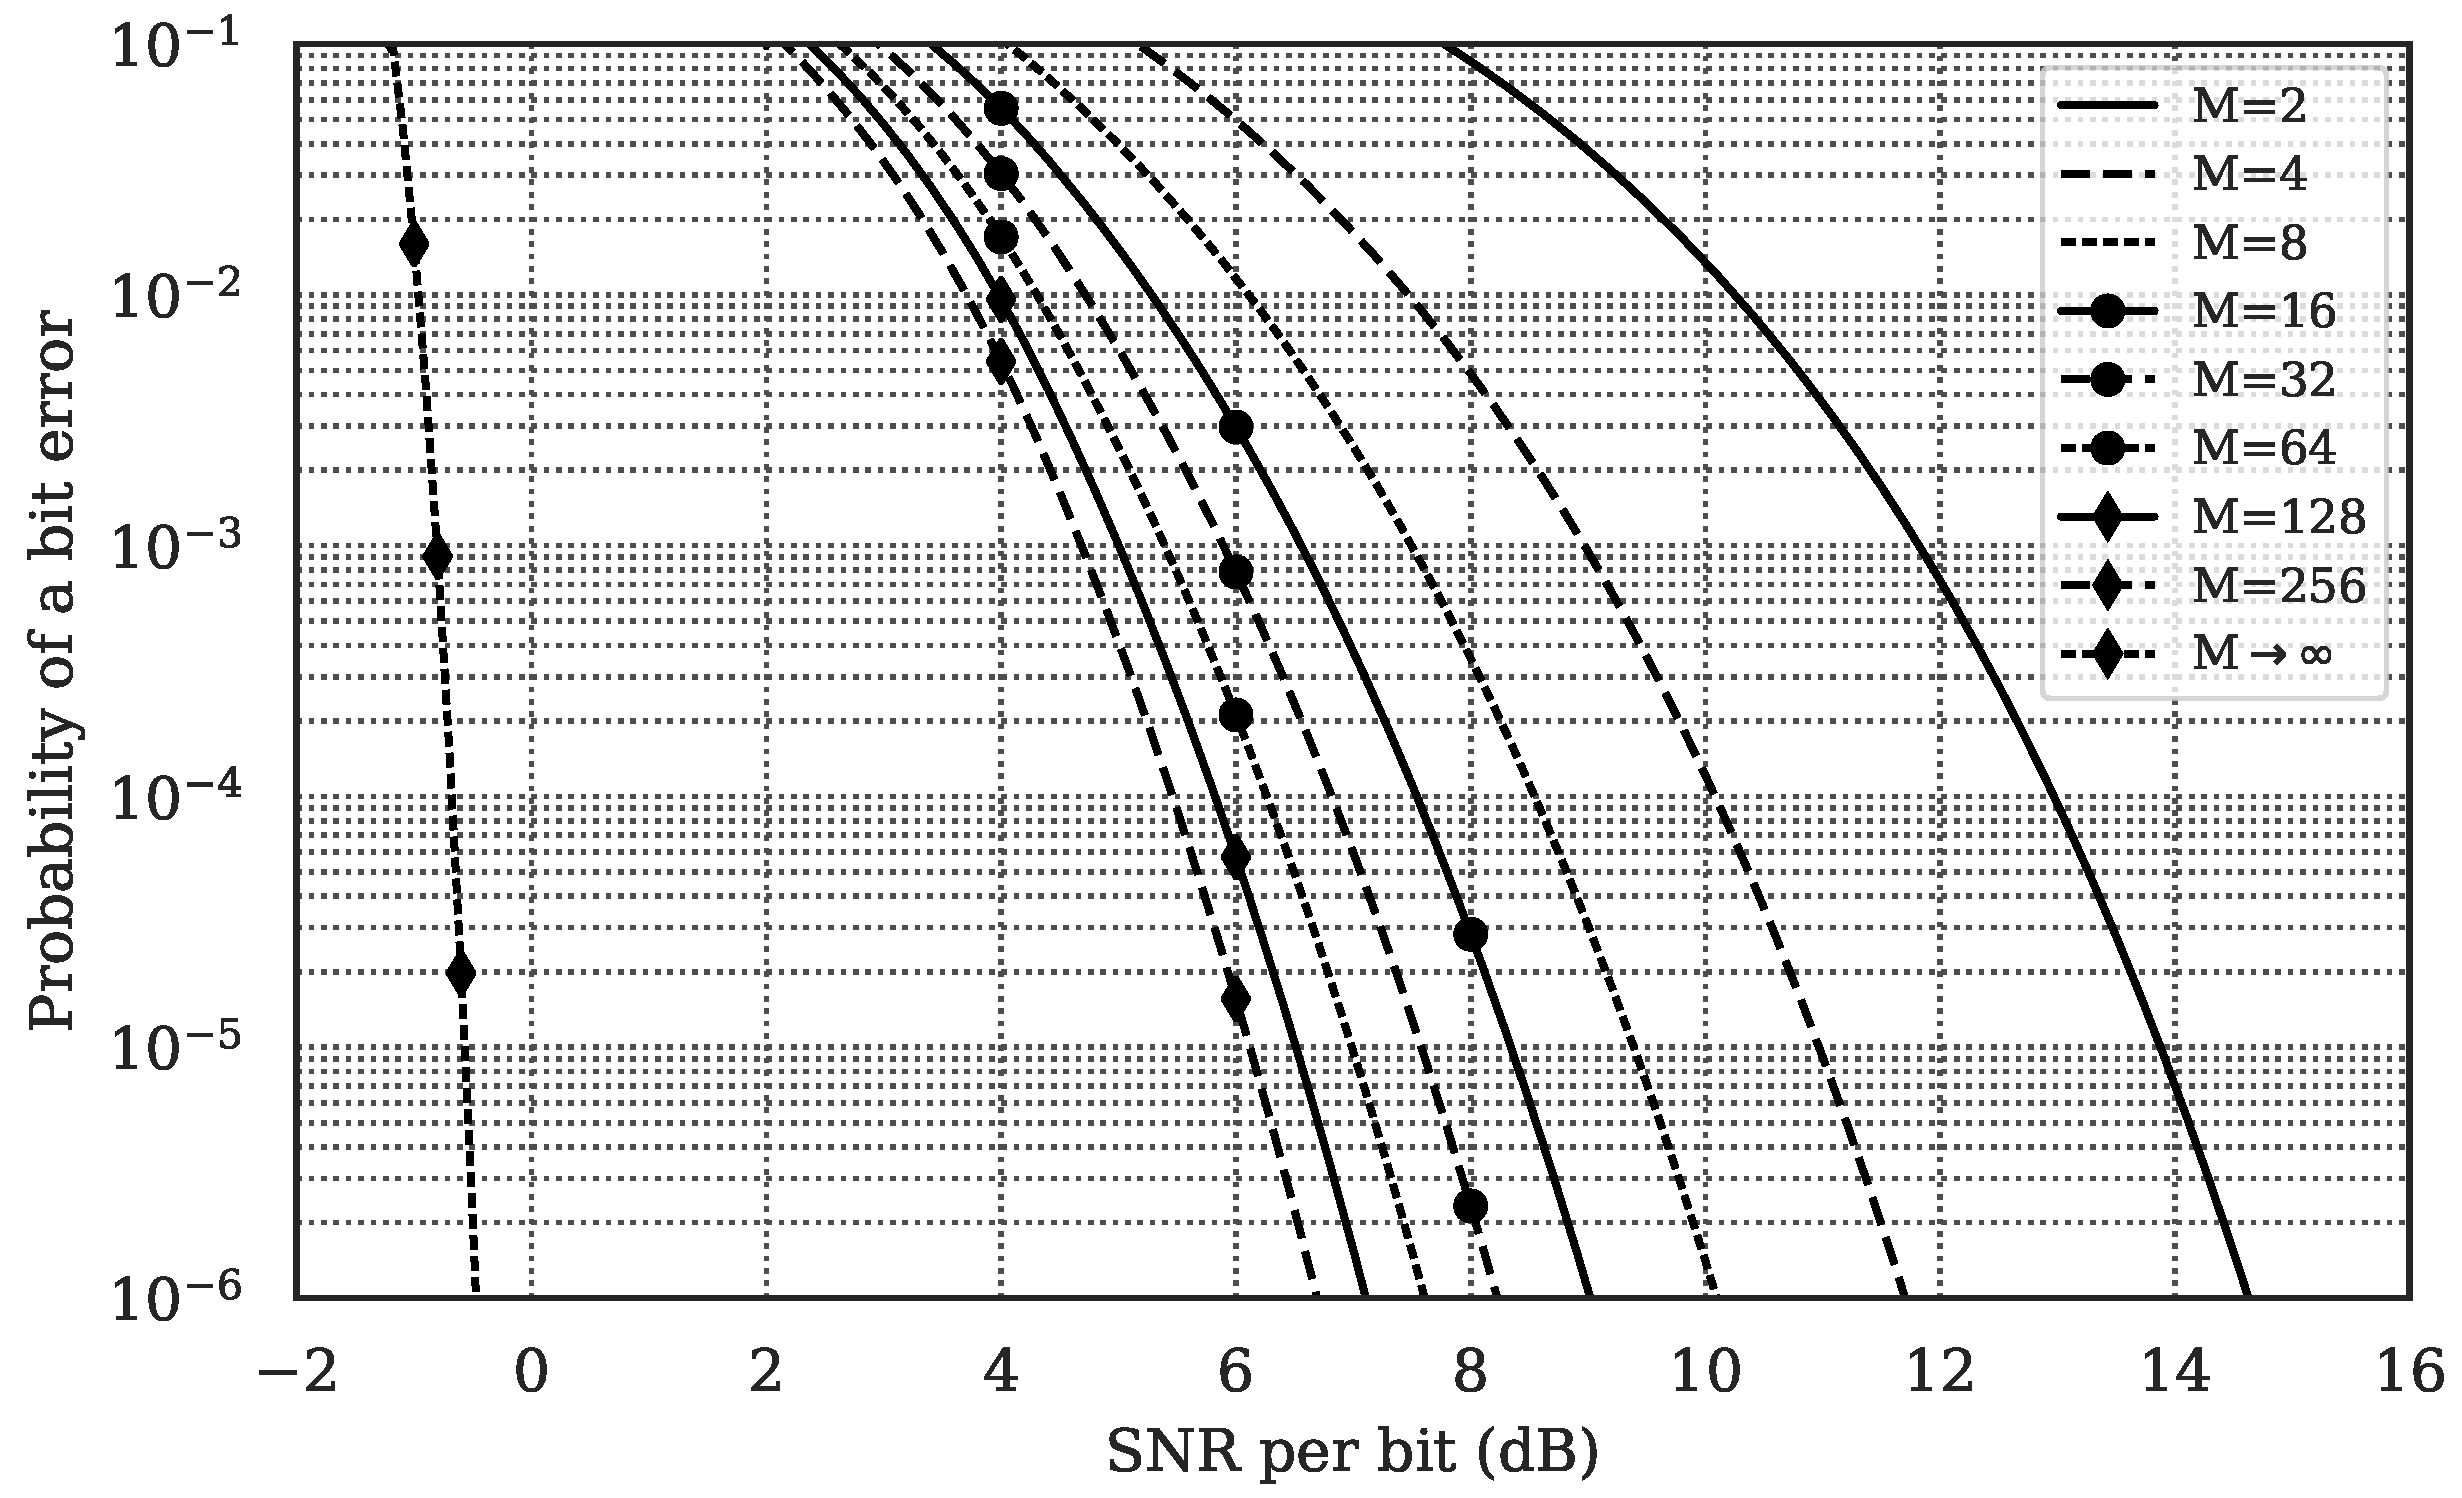
The AWGN performance of the M-OCK BPSK signals can be compared to the analytic upper performance bound for M-ary Orthogonal Signalling (MOS) in an AWGN channel, as shown in Figure 4 from [22,27].
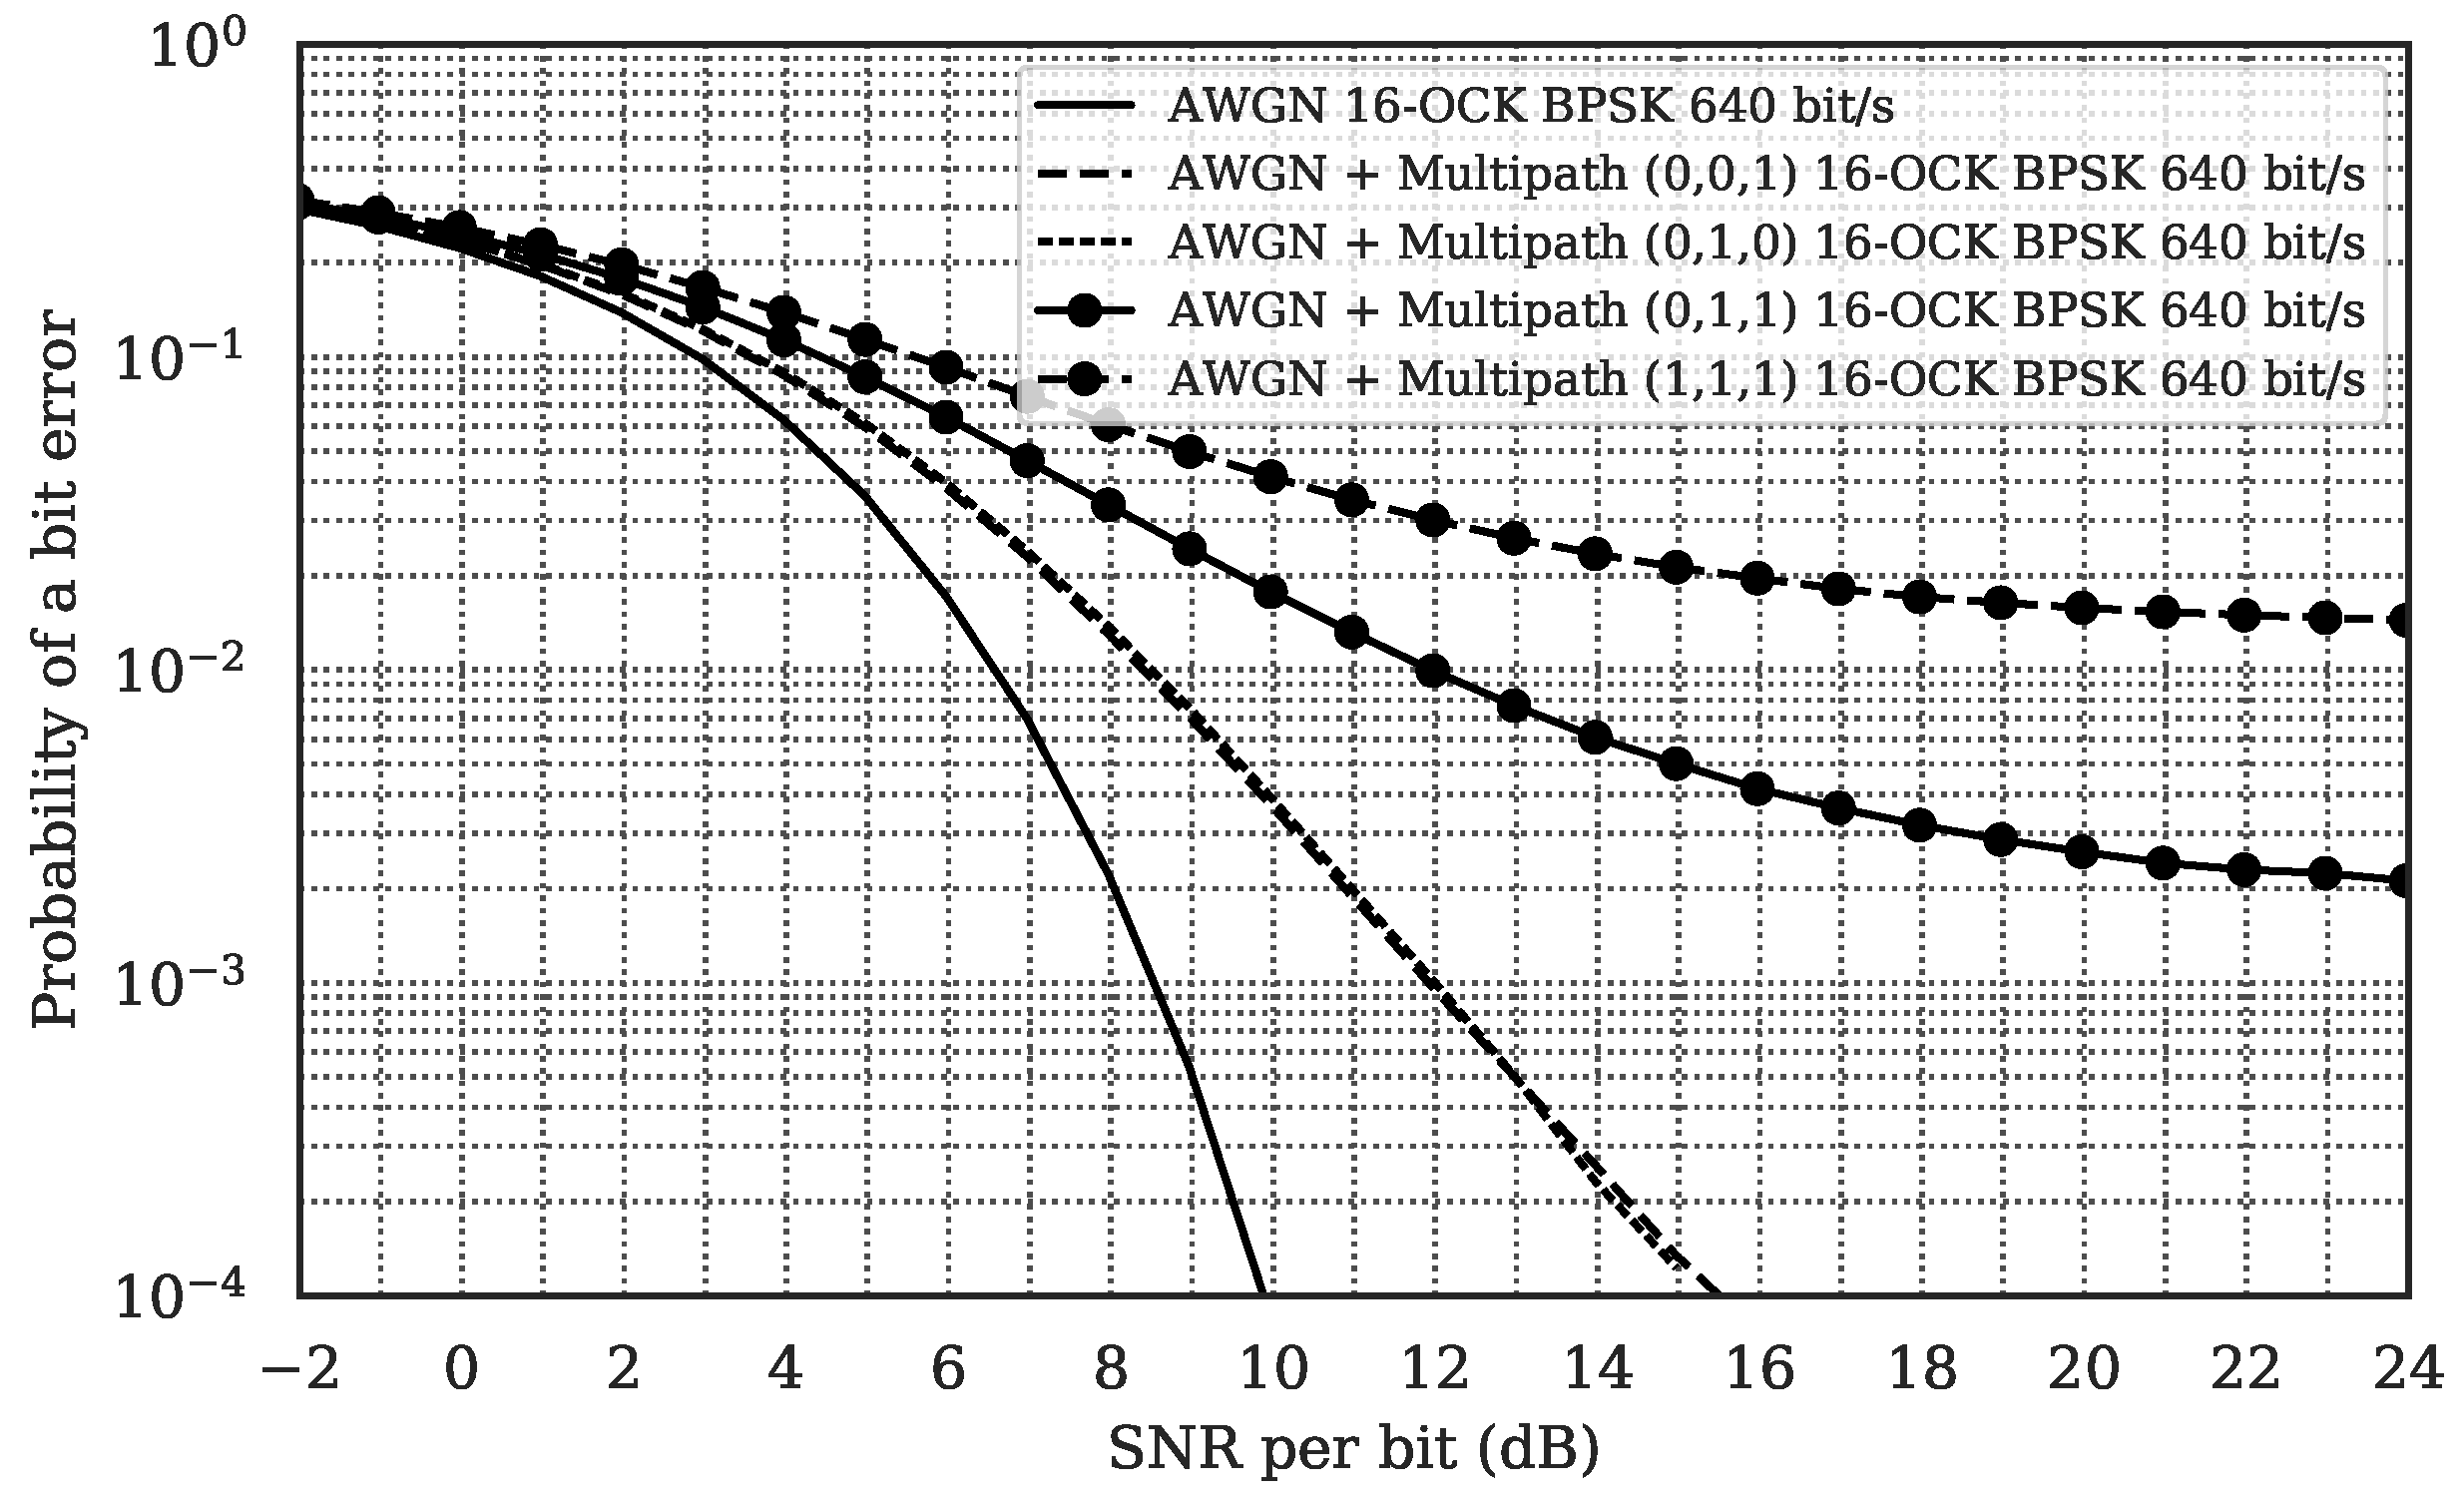
The simulated performance of the M-OCK BPSK with M = 16 and BT = 50, corresponding to a data rate of 640 bit/, is shown in Figure 5 for BER vs. , and in Figure 6 for BER vs. SNR. The figures show performance in an AWGN channel with a single arrival, as well as with one, two and three multipath arrivals.
The conversion between SNR in Figure 6 and SNR per bit () in Figure 5 takes into account the spectral efficiency based on the bit rate, , and the bandwidth, B, as shown in (1) [28].
For 16-OCK BPSK with a bit rate, , of 640 bit/, and bandwidth, B, of 8 , the formula in (1) becomes:
From the above simulations we see that the chosen modulation scheme, with M = 16 and BT = 50, is within approximately 2.5 dB of the theoretical bound for ideal orthogonal signalling with the same parameters. Alternative spreading sequences are possible, using QPSK modulation and/or combining an outer spreading code with inner orthogonal codes, and these can perform within 1 dB of the theoretical bound. However, this comes at the expense of increased implementation complexity and receiver power. The effect of the multipath is also shown, resulting in an error floor that is very close to the AWGN performance at SNR equal to the signal to multipath ratio. For example, the error floor for two multipath arrivals is equivalent to AWGN at dB and for three multipath arrivals it is equivalent to AWGN at dB. This correspondence confirms that the spreading code is very effective in transforming multipath signals into uncorrelated noise and, as shown earlier, this property is practically independent of the multipath delays. This error floor is effectively dealt with by error correction coding described in the later sections.
4. Implementation: Modem Hardware, Packet Structure, and Receiver Design
Section 3 considered the detection of data symbols with ideal frame, symbol, and carrier synchronisation assumed. This section now explores the hardware platform design, the transmitter and receiver structures and the data packet structure with frame synchronisation. The simulated performance of the hardware receiver structure is also shown. Power consumption case studies are also considered for potential applications using the NMv3 modem.
4.1. Hardware Assembly and Electronics
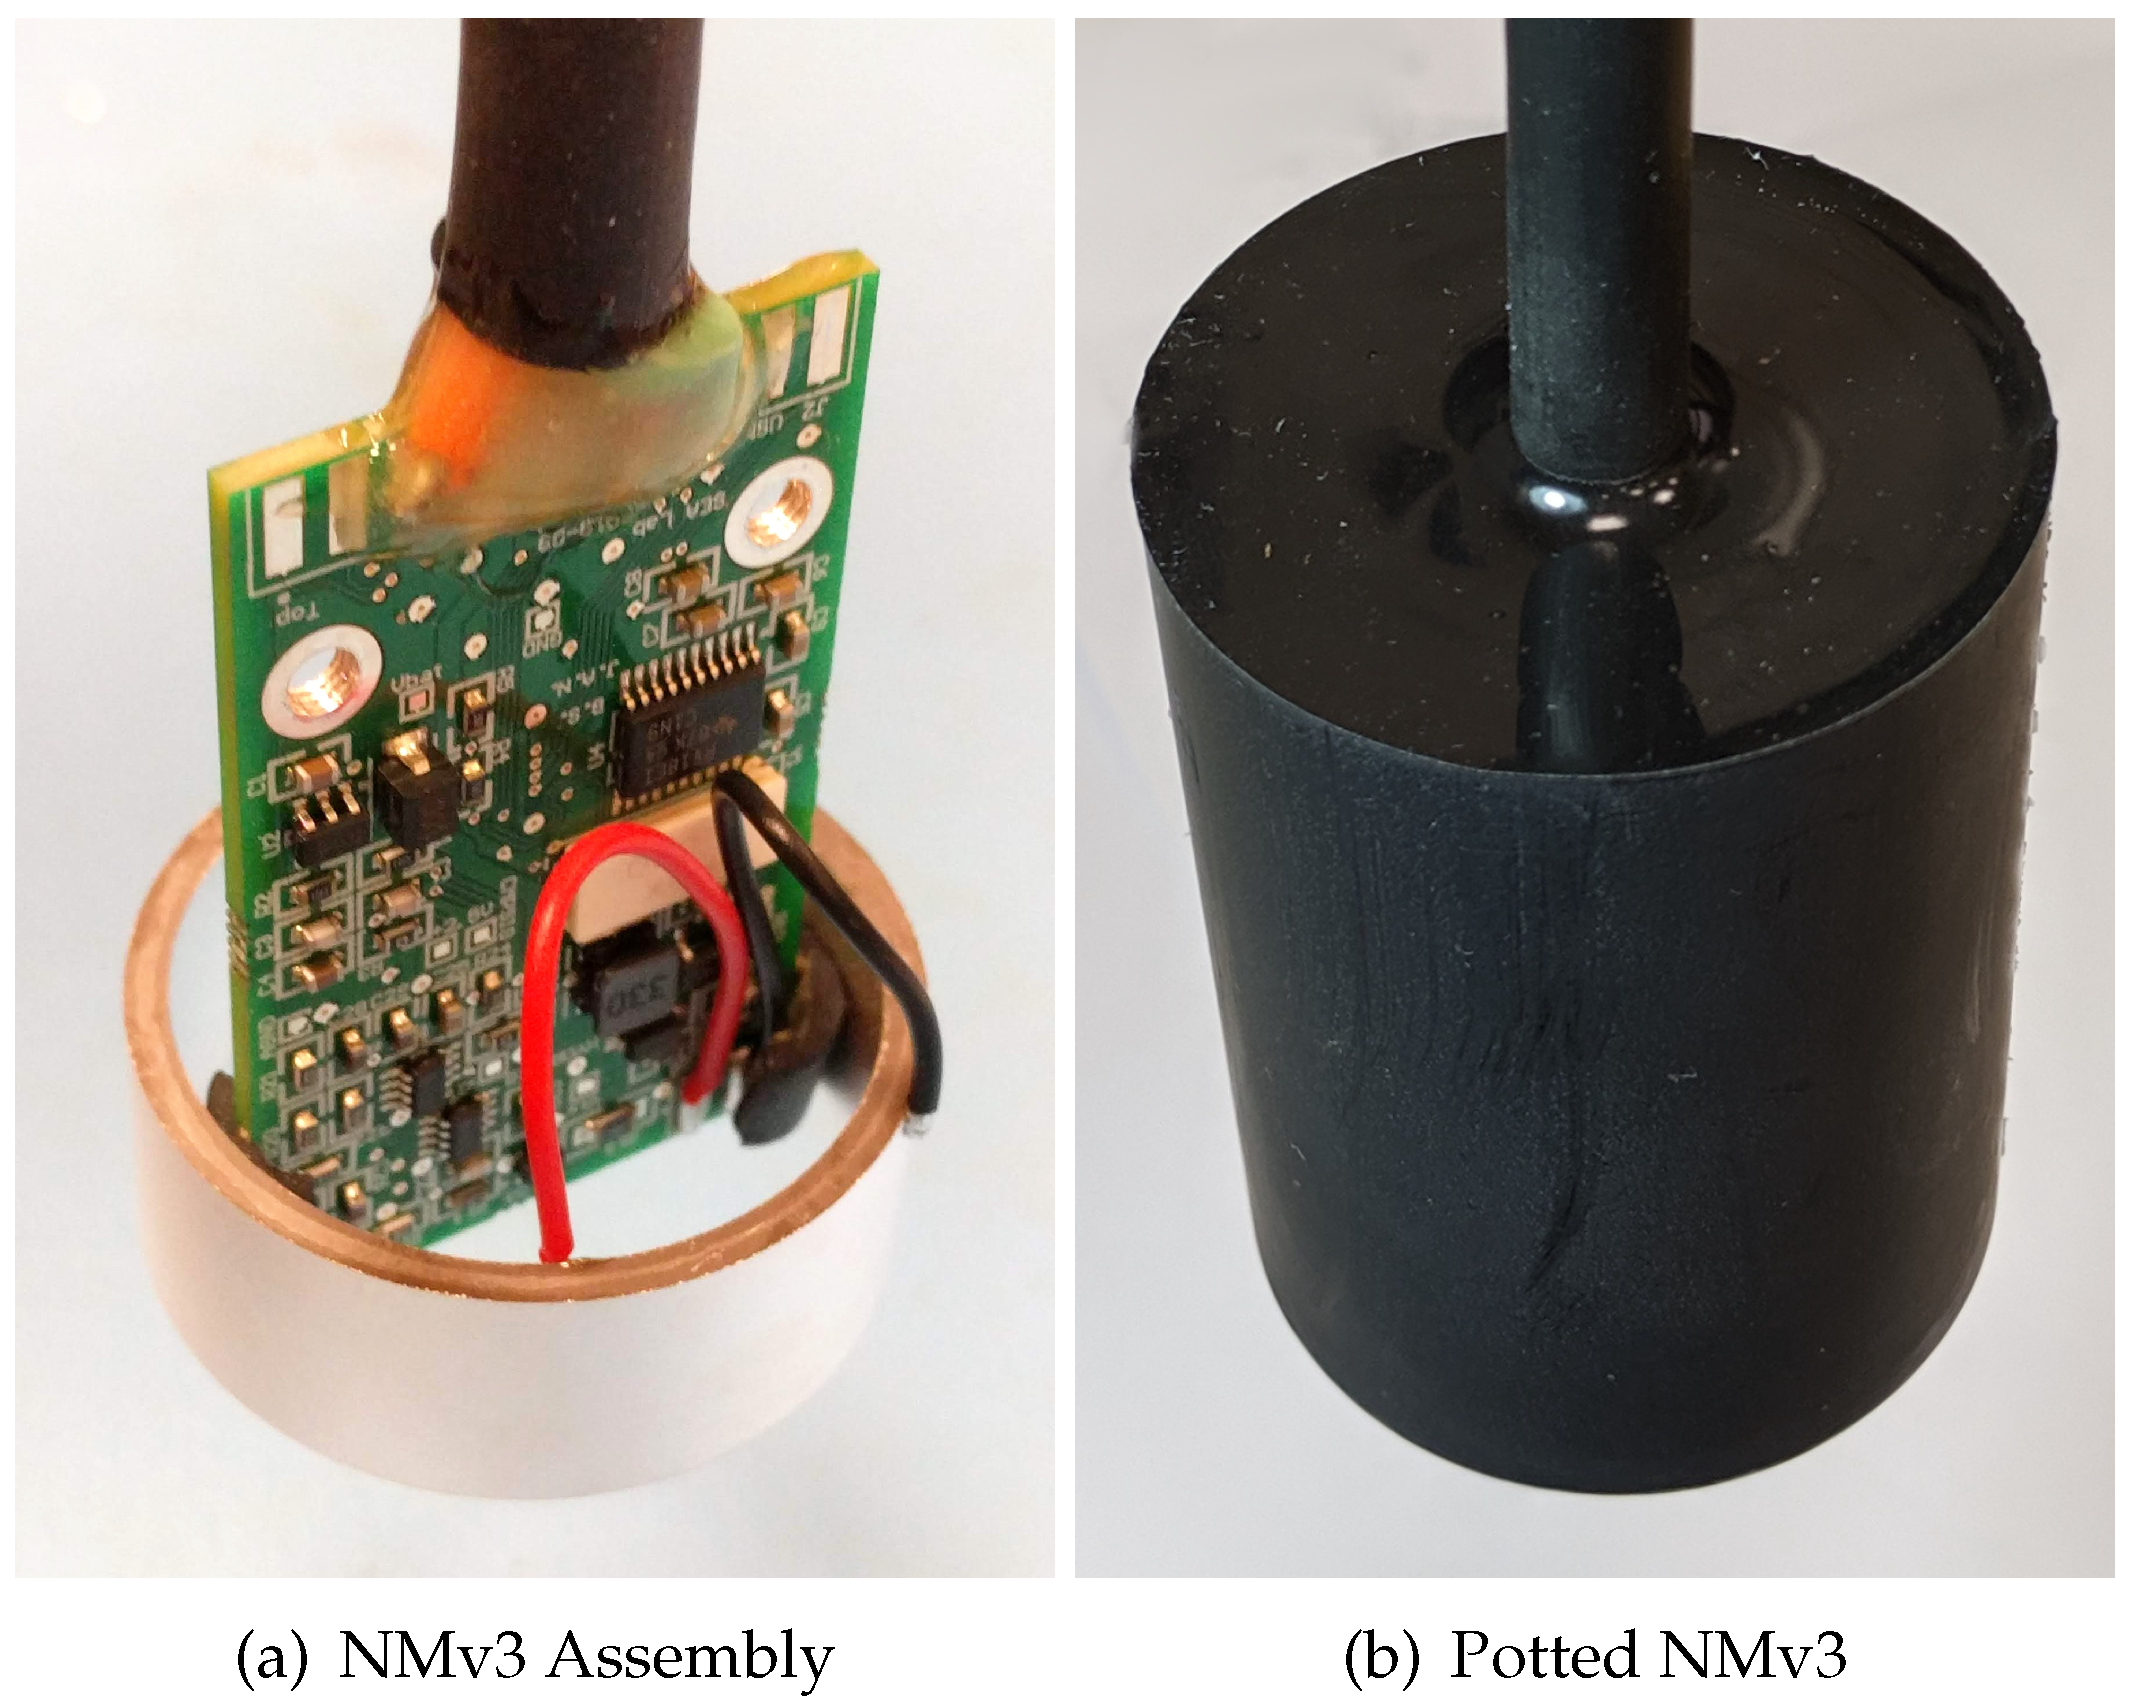
The NMv3 modem hardware broadly consists of: a single electronics PCB; a tubular piezoceramic transducer element; underwater rated cable, all encapsulated in a potting compound. The final PCB in Figure 7 measures by and fits within the internal diameter of the crystal transducer. The assembly pre- and post-potting is shown in Figure 8a,b respectively.
The authors’ component costs for production of 200 NMv3 devices, at the time of writing, are: Board production: £30; Transducer: £10; Encapsulation: £5; Cable ( ): £5; Total per Unit: £50.
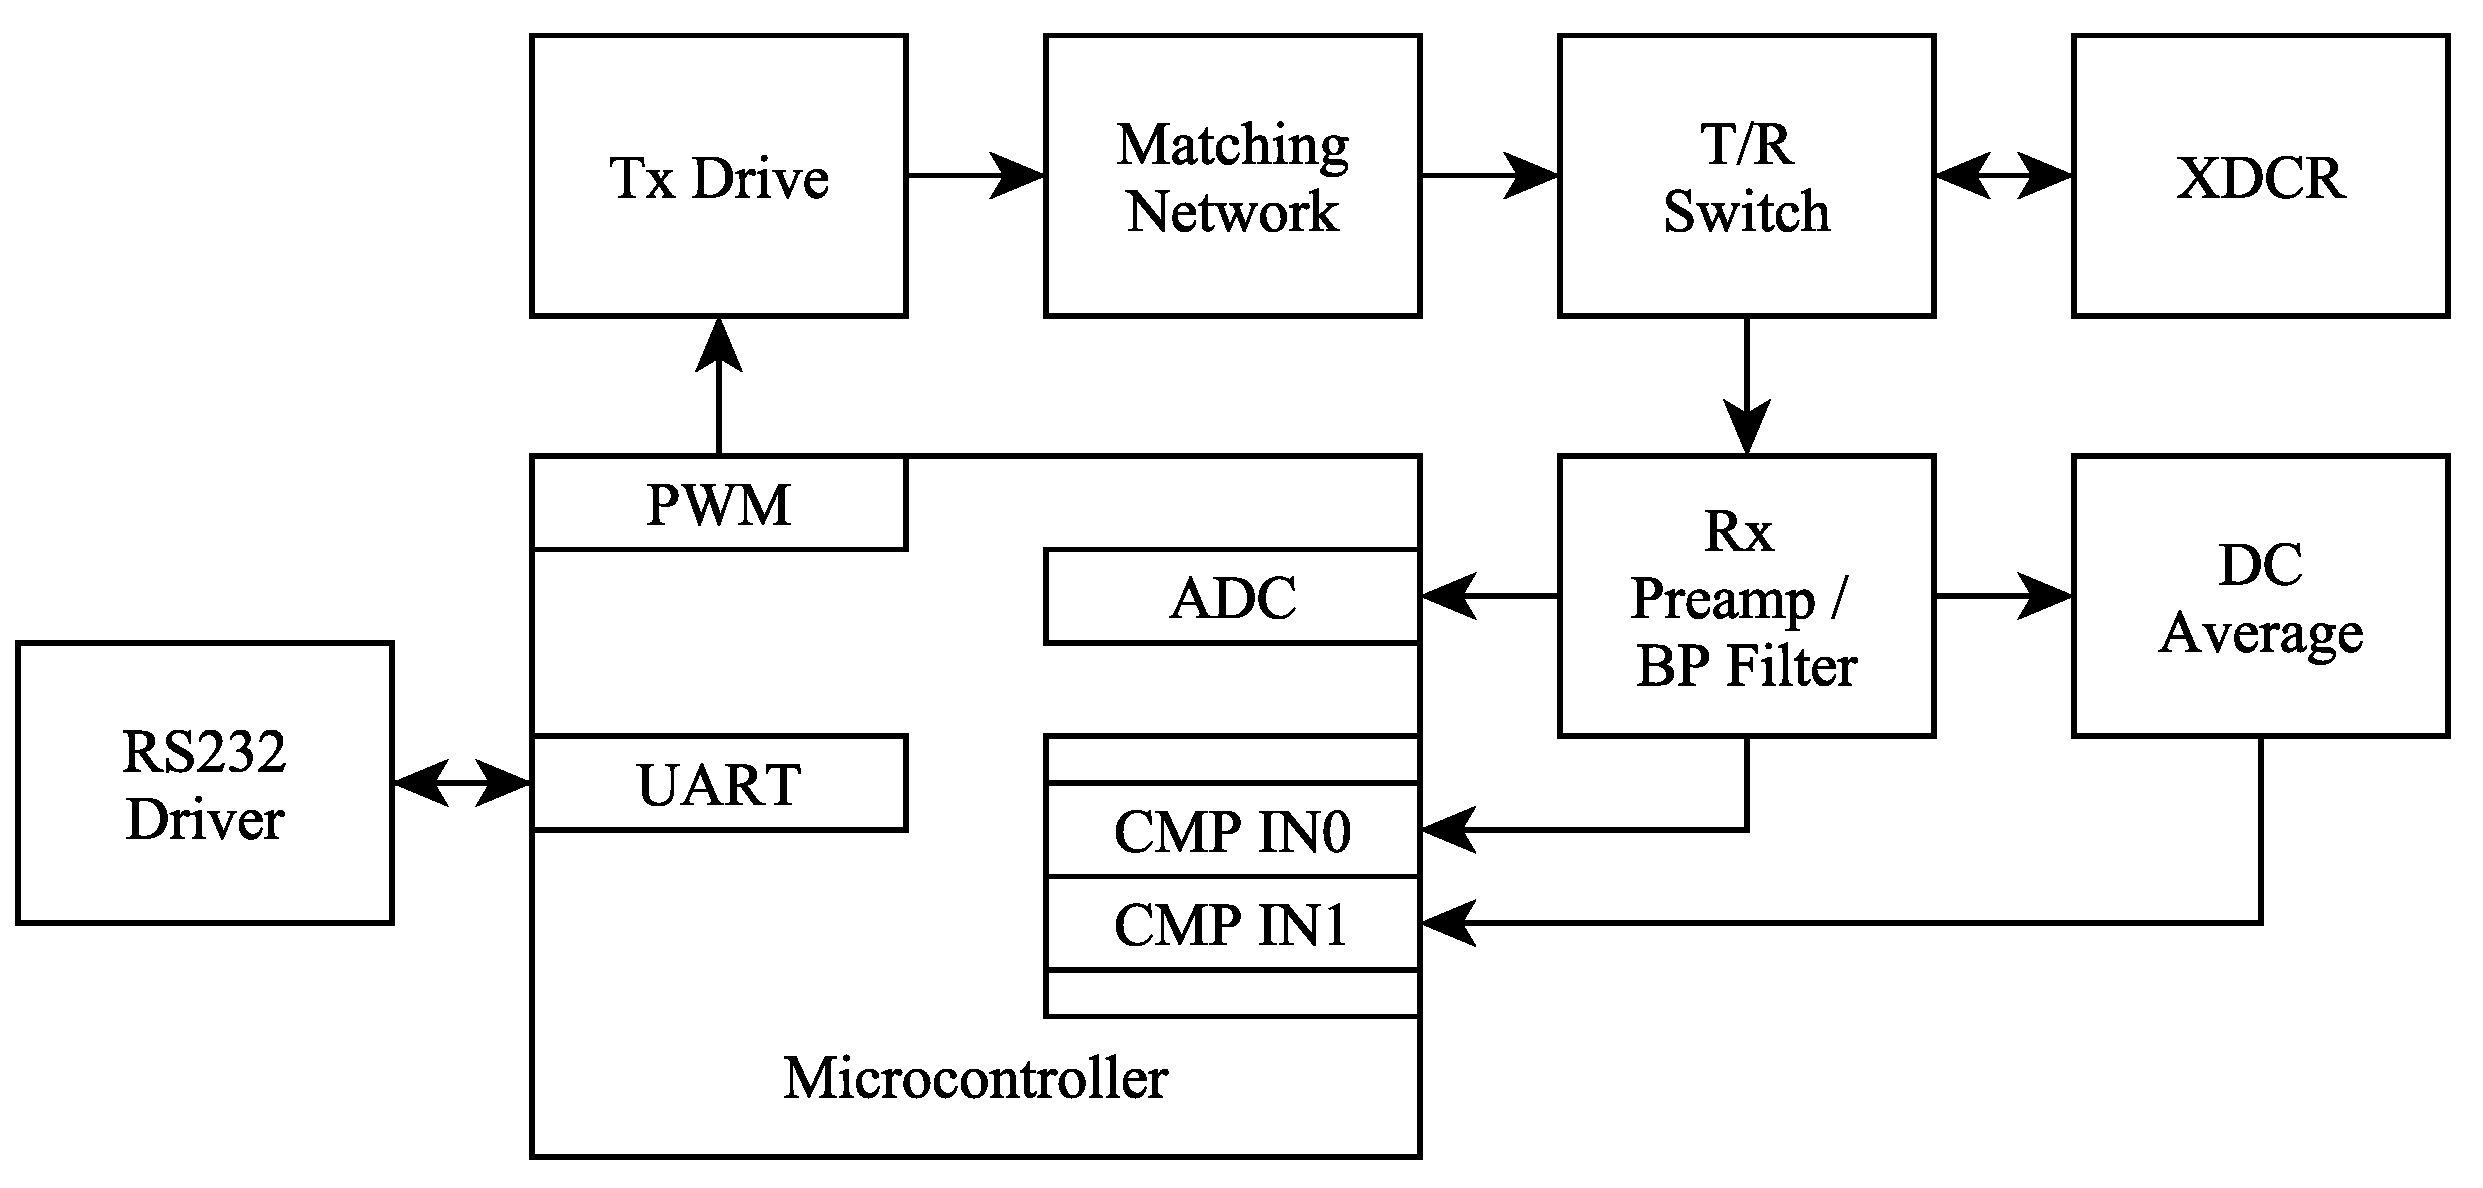
Figure 9 shows a block diagram of the electronic subsystems in the modem circuit, which is built around the low-power ARM Cortex M0+ microcontroller. The RS232 serial command/data interface enables a connected device to send and receive acoustic messages and to update the modem firmware via a serial bootloader. An extremely compact class D amplifier is driven directly by the pulse width modulation (PWM) output of the ARM microcontroller to synthesise the transmitted waveforms and a tuned L-C circuit boosts the transmit voltage to 200 V peak-peak. The received signals are routed via the Transmit/Receive switch to a preamp and bandpass filter. The conditioned signal is then fed into the 16-bit ADC, sampling at 96 kHz for linear signal processing operations. This signal is also fed into a comparator along with a DC average of the signal to enable hard-limited signal processing operations.
4.2. Packet Structure
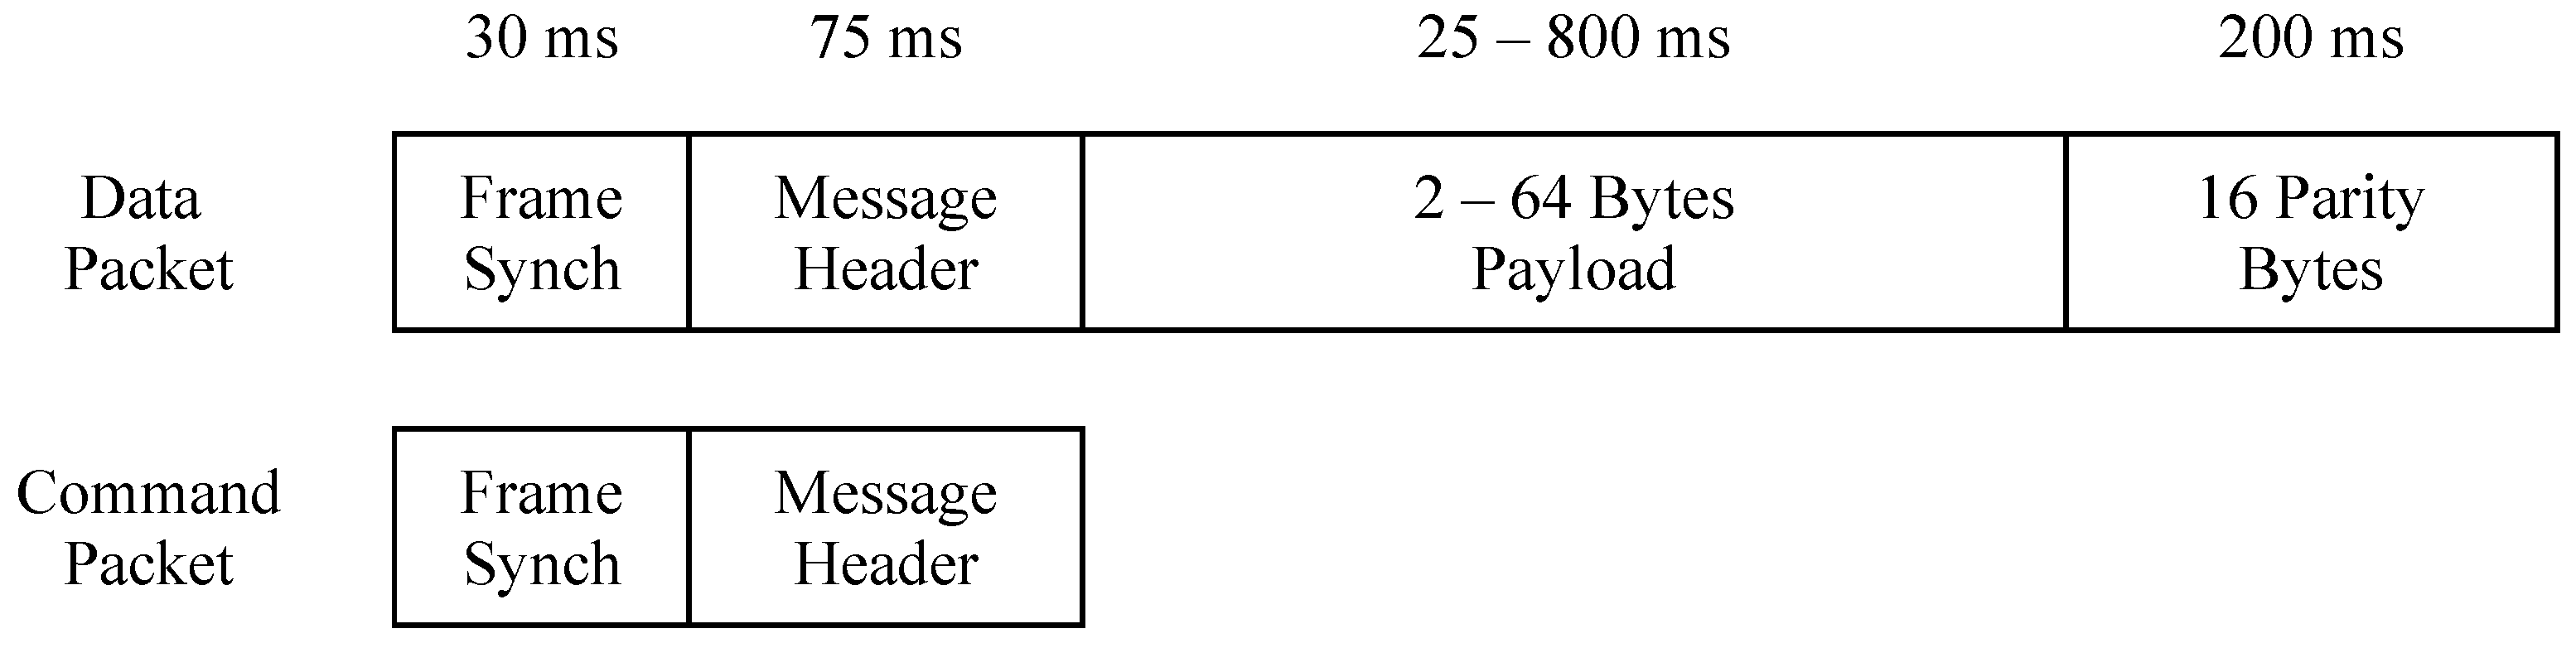
There are two general packet types, command and data, as shown in Figure 10. Both contain a frame synch waveform and a message header, but a data packet appends to this as payload and parity bytes. The frame synchronisation waveform is a single LFM chirp between 24 and 32 over a duration of 30 . The LFM chirp provides timing synchronisation of the order of 125 μ, processing gain of 24 dB, and a large range of Doppler tolerance with a single matched filter detector.
The message header consists of two bytes carrying a command code, address, and payload length (with zero to define no payload). A simple Hamming (3,1) code is applied to these two bytes to provide a degree of error detection and correction for the header with very low decoding complexity. Since command codes in themselves only define what type of payload is to follow or internal modem commands that initiate a response such as a positioning ’ping’, a relatively high undetected error rate is tolerable. For messages with payload, this header information is also encoded in the much more robust payload FEC to prevent erroneous messages from being delivered to the user.
The variable length payload bytes are followed by a fixed length block of 16 parity bytes. This forms a Reed Solomon [29] error correction code based on a block of (RS ), which is shortened to between 18 and 80 bytes (2–64 bytes of payload data). This code is capable of correcting up to 8 bytes within a message or otherwise detecting erroneous packets with an undetected error rate of <. With a constant number of parity symbols, the code rate changes with payload length (between 0.11 and 0.8) and hence the coding gain increases for shorter payload lengths. The header address field can be either the link source or destination address depending on the packet type. There are two LFM chirps used for frame synchronisation, an up-sweep (UP) from 24 to 32 , and a down-sweep (DN) from 32 to 24 . The down-sweep is used for the Ack or Ping Response packets so that the requesting node receiver avoids synchronising on to an echo of the original request, potentially masking the incoming Ack/Ping Response. Packet types are shown in Table 2.
4.3. Hardware Receiver Structure
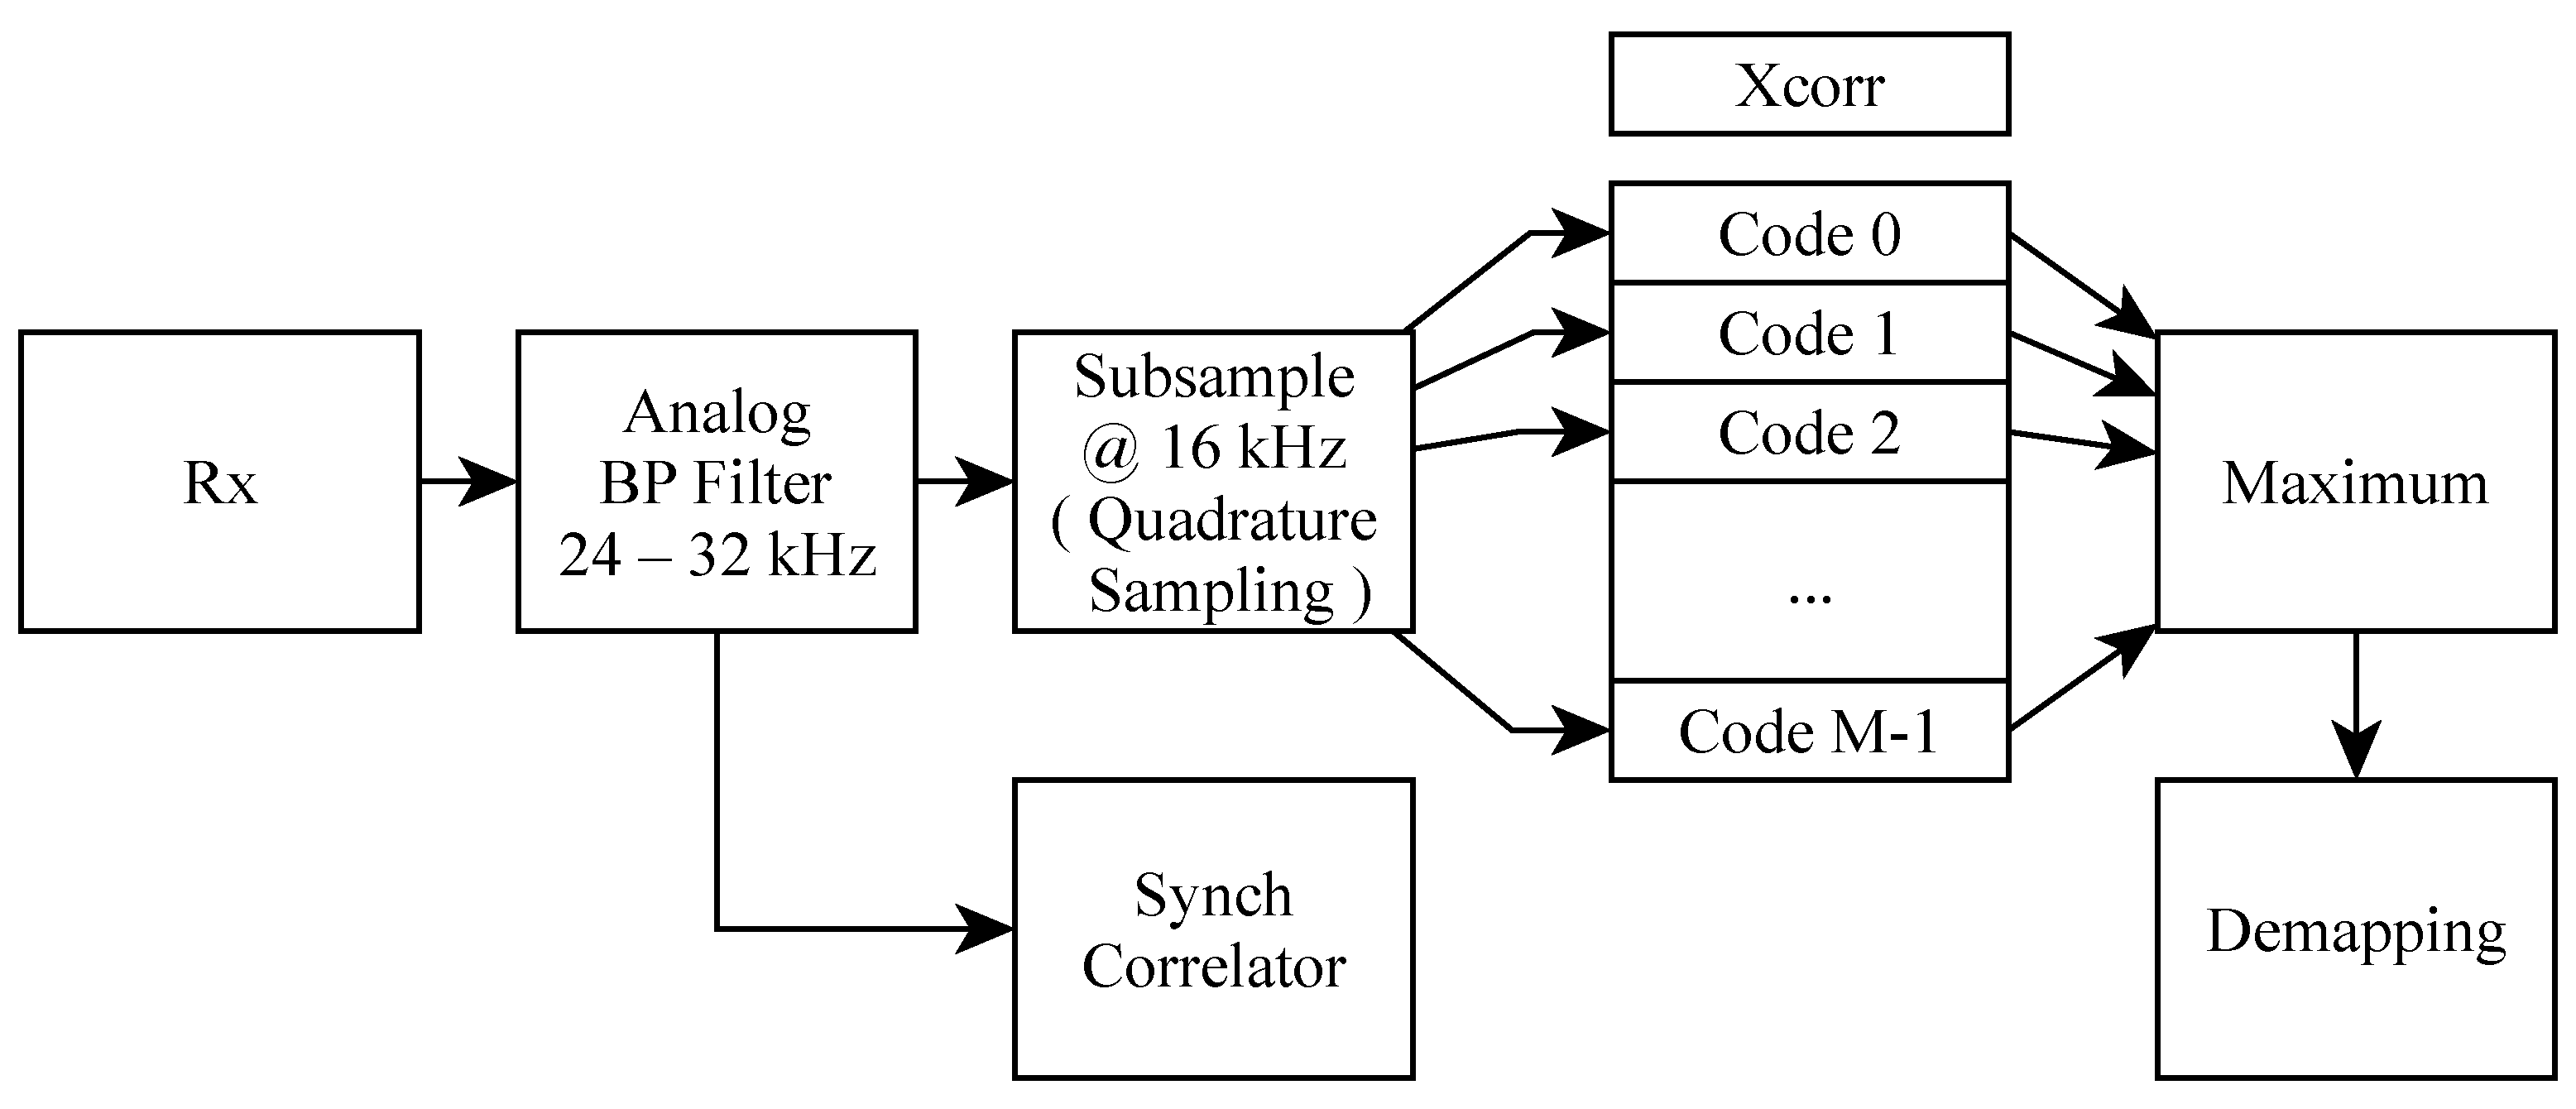
The NMv3 hardware receiver implementation differs from the ideal receiver structure described previously in Section 3. A number of optimisations are introduced to reduce the computational power required to both synchronise and demodulate the signals. The block diagram for the receiver structure is shown in Figure 11. The analog bandpass filter is a 4th order Butterworth that limits the signal bandwidth to 8 . Using sub-sampling techniques, the sample rate can then be reduced to 16 , which results in the signal being aliased to between 0 to 8 . This reduces the ADC processing load and eliminates the need for down-conversion, resulting in a substantial reduction in processor operations, clock frequency and hence power.
4.4. Frame Synchronisation
The frame synchronisation (FS) process is critical to successful communication and, since the modem spends most of its time in this mode (listening), this dominates the power consumption of the device. The FS waveform is ideally detected by a normalised cross-correlation process as expressed in (4) where h is the code, y is the input signal, L is the length of the code, and is the mean of the input signal, y. This enables a fixed threshold to be chosen, which balances the probability of true detection and false detection in the presence of noise.
To achieve a dramatic reduction in power consumption, FS detection in the NMv3 is implemented as a binary cross-correlation on a hard-limited signal, which also serves to implicitly normalise the correlation result. The bandpass filtered analog signal is hard-limited by the on-chip comparator and sampled at a frequency of 16 , exploiting the subsampling technique. The resulting binary sequence is fed into a delay line and the correlation process is then reduced to the XOR of this sequence with a binary version of the reference FS waveform and a count of ones and zeros in the result.
Highly optimised ARM assembler routines were written for the above process, exploiting the processor cache, to reduce the instructions per processed sample. Hence this enables the processor clock speed to be reduced to 12 and so reducing the total power consumption of the circuit during the active listening state to .
4.5. Data Demodulation
Figure 11 shows the overall block diagram for the hardware receiver implementation. On detection of the FS, the micro-controller instantaneously steps up the system clock speed to 48 . The signal is now sampled using the 16-bit ADC at 16 for the I component, with a short delay of μ ( at the 28 carrier frequency) before immediately sampling the Q component. This achieves quadrature subsampling, which preserves the carrier phase information in a PSK modulated signal. For each symbol, the samples are multiplied by the chips of each of the M spreading sequences and integrated over one symbol period. At the end of each symbol period, the maximum correlation magnitude indicates which M-ary sequence was detected and hence the data bits received. A simple delay locked loop (DLL) is implemented, by comparing early and late correlation values, to maintain symbol and chip synchronisation throughout the packet in the presence of Doppler. Other data level operations such as header decoding are able to be carried out in real time due to their trivial complexity and decoding of the RS encoded data payload is completed within a period of approximately 2 at the end of packet reception, which has negligible impact on latency.
4.6. Simulated NMv3 Receiver Structure
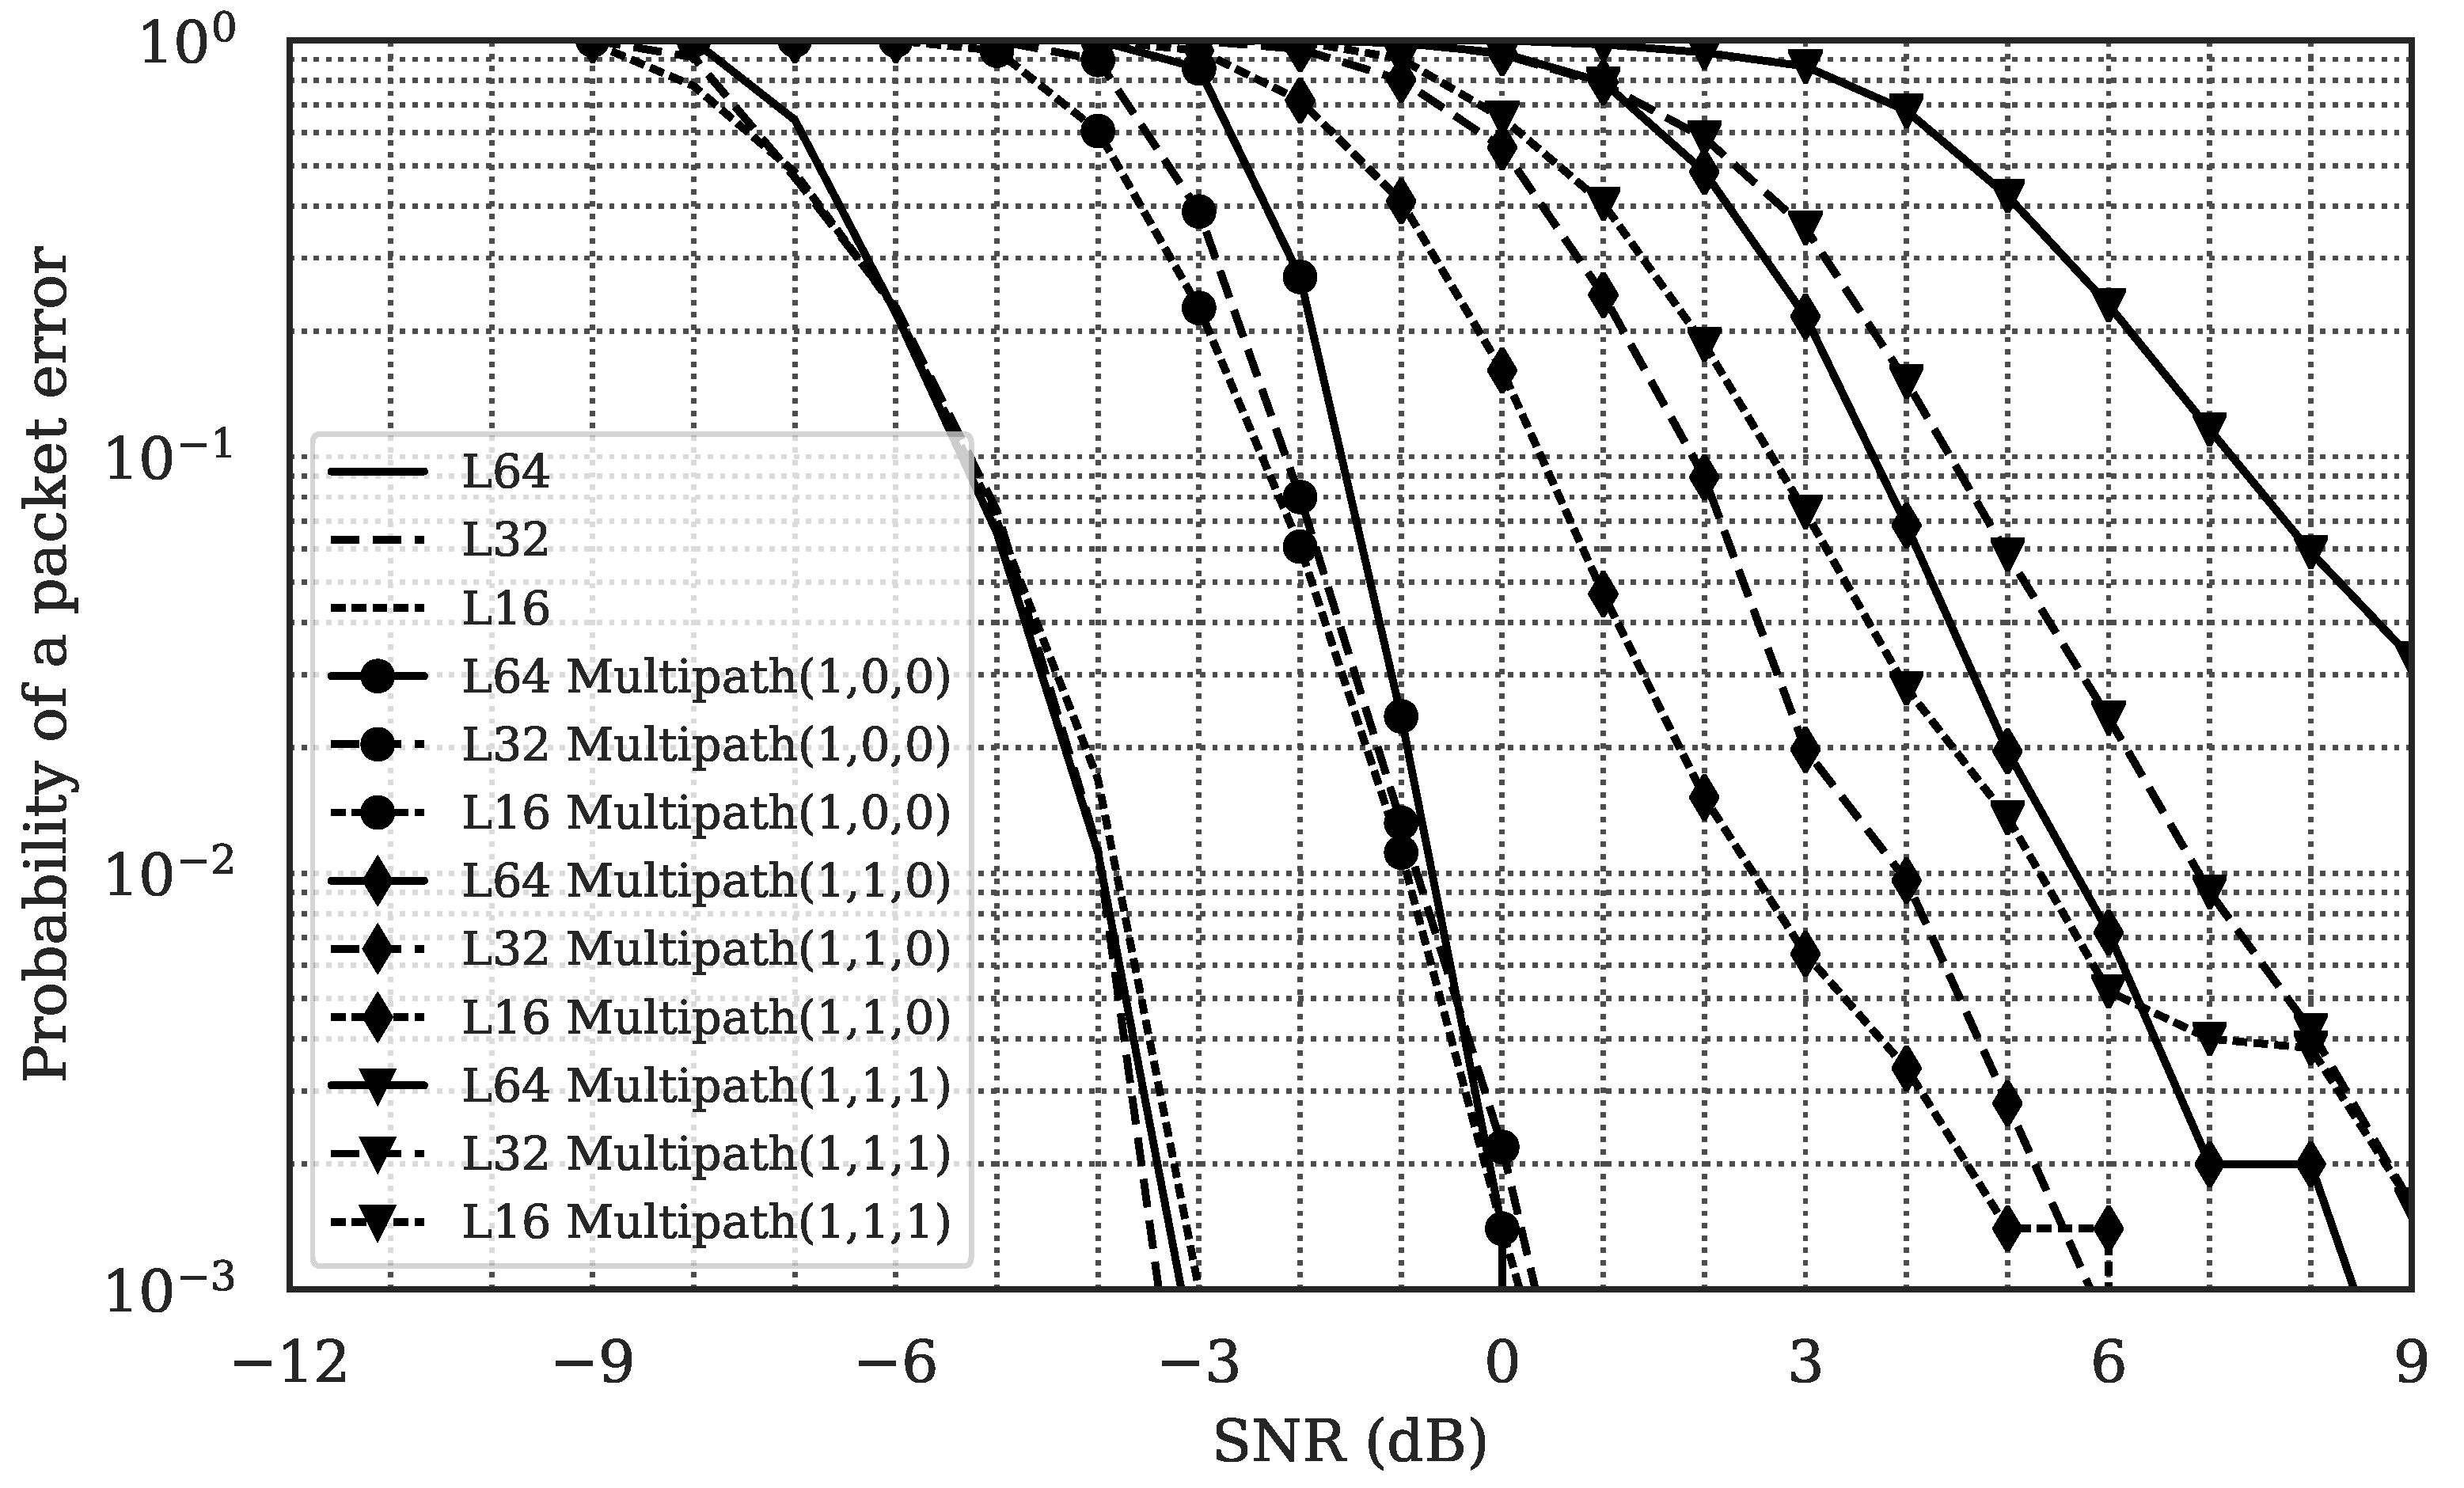
The sub-optimal hardware receiver implementation described above has been developed with a strong emphasis on minimising complexity, cost, and power. However, this comes at a very modest cost in terms of communication performance compared to a theoretically optimal receiver. To quantify this, the full hardware receiver algorithm was simulated, including bandpass filter, subsampling and hardlimited FS detection. Packet Error Rates for a number of simulated channels are shown in Figure 12. Three payload lengths, with randomised data per simulation run, were transmitted through a number of multipath channels along with additive noise (AWGN). Failure to detect the FS waveform or errors in the header information are included as packet failures in these statistics.
In a pure AWGN channel the packet delivery performance for all payload lengths of 16, 32, and 64 bytes is near identical. This suggests that all errors are correctable and it is in fact the FS detection that is dominating packet delivery. It is also broadly consistent with the performance bounds of the idealised simulations shown in Figure 6 with packet error rate (PER) approaching zero at an SNR of dB. When a single multipath arrival of equivalent magnitude is added, all three payload lengths are again comparable with a PER of at 0 dB. The addition of a second and third multipath arrival of equal magnitude begins to show a differentiation in performance between payload lengths. The 16 byte packets show a 3 dB improvement over 64 byte packets at a PER of for two multipath arrivals and dB difference for three multipath arrivals. This indicates that in more typical channel conditions with multipath, it is the error rate in the data payload that dominates packet delivery and the increased coding gain from shorter packets can improve packet delivery in harsher channel conditions.
4.7. Software NMv3 Receiver Structure
In order to enable opportunistic reception of NMv3 transmissions via any available hydrophone signal, a real-time capable software receiver has also been created mwhich can be cross compiled to run on any Windows/Linux platform and a suitable standard digital audio interface (96 sample rate and at least 32 analog bandwidth). The software receiver is based on Figure 3 in Section 3 and benefits from Nyquist sampling, IQ demodulation, and complex baseband correlation of the chirp and PN sequences.
4.8. Power Usage Case Studies
The modem is intended to be used in long-term deployments of battery-powered sensor networks and so, assuming that low energy sensors are deployed, the modem’s power consumption is a critical factor in network life. The modem can be viewed to have a number of discrete modes, each of which have a defined power consumption and for a given application an expected duration spent in each of the modes. These modes are as follows: Receive Listening, Receive Demodulate, Transmit, and Sleep. Where:
- Receive Listening mode is primarily where the device is listening for the FS signal;
- Receive Demodulate mode starts as soon as the FS is detected and continues until the packet demodulation is complete, whereupon the modem returns to listening mode;
- Transmit mode occurs when the device is sending an acoustic signal and is the highest power consumption mode but only for a relatively low duty cycle;
- Sleep mode is where the device is not listening for signals or transmitting, and instead as much of the circuitry as possible has been put into either an off-state or else a very low power run state. Usually only the real-time clock is operational in order to wake up the device based on a set time schedule.
Two example use cases are now described, with the operating states and power consumption taken from Table 3.
- Transponder for locating subsea assets. Spends 100% of its time in Receive Listening mode. Assuming a compact design running from four AA alkaline cells with a total energy capacity of 15 and a power consumption of , this equates to a lifespan of 1200 or 50 days;
- Sensor node transmitting and relaying data once an hour. Spends 59 min of the hour in Sleep mode, during the 1 min awake it transmits and receives 5 packets, where each packet is of duration. The remaining 55 is spent in Receive Listening mode. This equates to a total energy usage in a given hour of , equating to an average power consumption of . Assuming a slightly larger device than the transponder containing four C alkaline cells with a total energy capacity of 40 this equates to a lifespan of 16,666 h or 694 days.
5. Experimental Validation of NMv3
This section describes point-to-point transmission experiments in both marine and freshwater environments to assess maximum transmission range and reliability. Results are included for bi-directional data exchange between pairs of NMv3 modems and transmission from a NMv3 modem to the software defined receiver processing a hydrophone signal.
5.1. Range Testing in Loch Ness
Initial range testing of NMv3 modems was carried out in January 2019 in Loch Ness over a number of distances between 100 and 3000 . One near modem, deployed from a shallow jetty, was used to send a command to a far modem, suspended 10 below a drifting RHIB, which would reply with a broadcast message packet with a known 64-byte payload. A hydrophone at the near modem was used to record the signals arriving from the far modem to enable channel impulse response and SNR to be measured. As a result, 100% packet reception was achieved at all ranges during this test. Channel impulse responses are shown for ranges between 1500 and 3000 in Figure 13 with 4 examples overlaid for each range. Given the favourable impulse response and estimated SNR of 10 dB at 3000 , it is likely that ranges of at least 4 could also have been achieved in this test. However, it is clear that this a near perfect environment for acoustic communication with very low multipath, low attenuation (fresh water), and low background noise. Nevertheless, this served as a useful validation of the dynamic range of the modem electronics and processing.
5.2. Range Testing in the North Sea
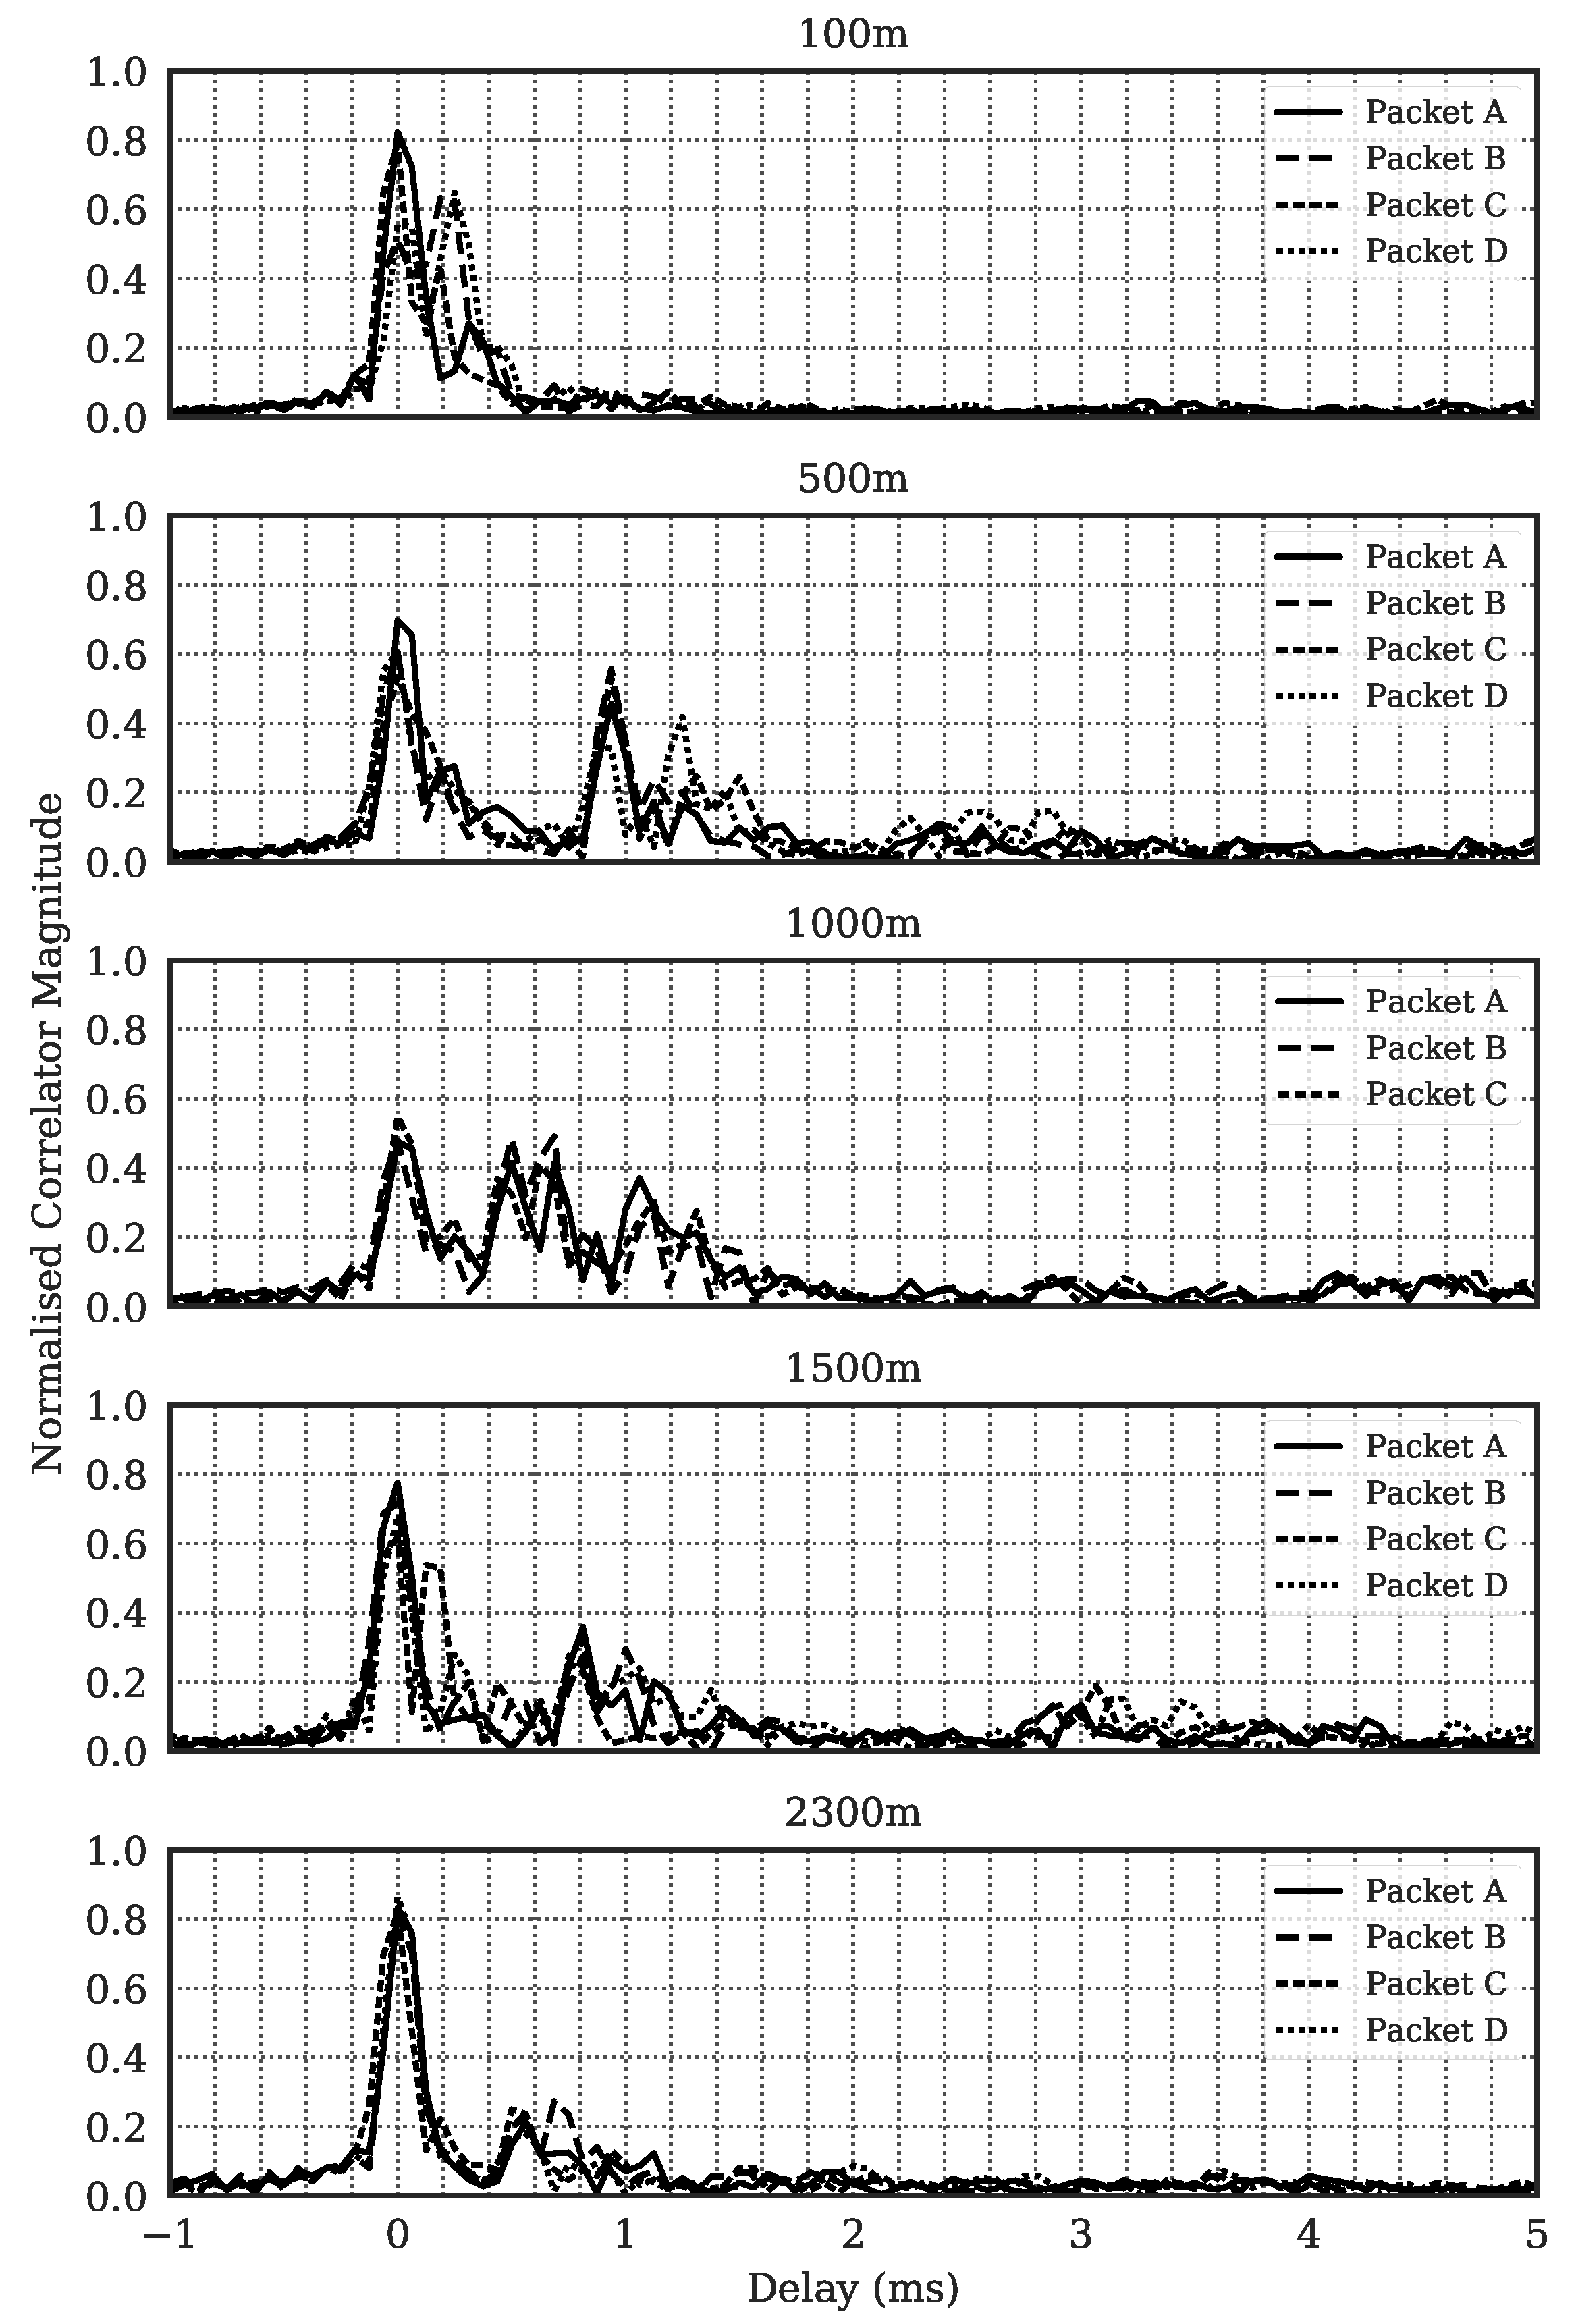
Range testing of NMv3 modems in a more challenging environment was carried out in September 2019 in the North Sea off the Northumberland coast. A modem and hydrophone suspended from Newcastle University’s anchored wireless databuoy acted as the near end as in the Loch Ness trials. A far NMv3 modem was suspended 5 to 10 below a RHIB drifting at distances of 100 , 500 , 1000 , 1500 , and 2300 from the databuoy. The channel impulse responses for these ranges are shown in Figure 14 with four examples overlaid for each range. As expected, the North Sea channels showed more severe multipath, greater time variability and lower SNR than in the Loch Ness. The NMv3 modems were able to reliably receive commands and 64-byte test packet transmissions (>90%) over ranges up to 2300 . Beyond this range, packet reception tailed off, with receiver performance being SNR limited rather than multipath limited. Detailed analysis of NMv3 packet delivery statistics for long term experiments in the North Sea and other environments, as well as multi-hop sensor networks, is provided in the following sections.
5.3. Long-Term Sensor Node Deployments in the North Sea
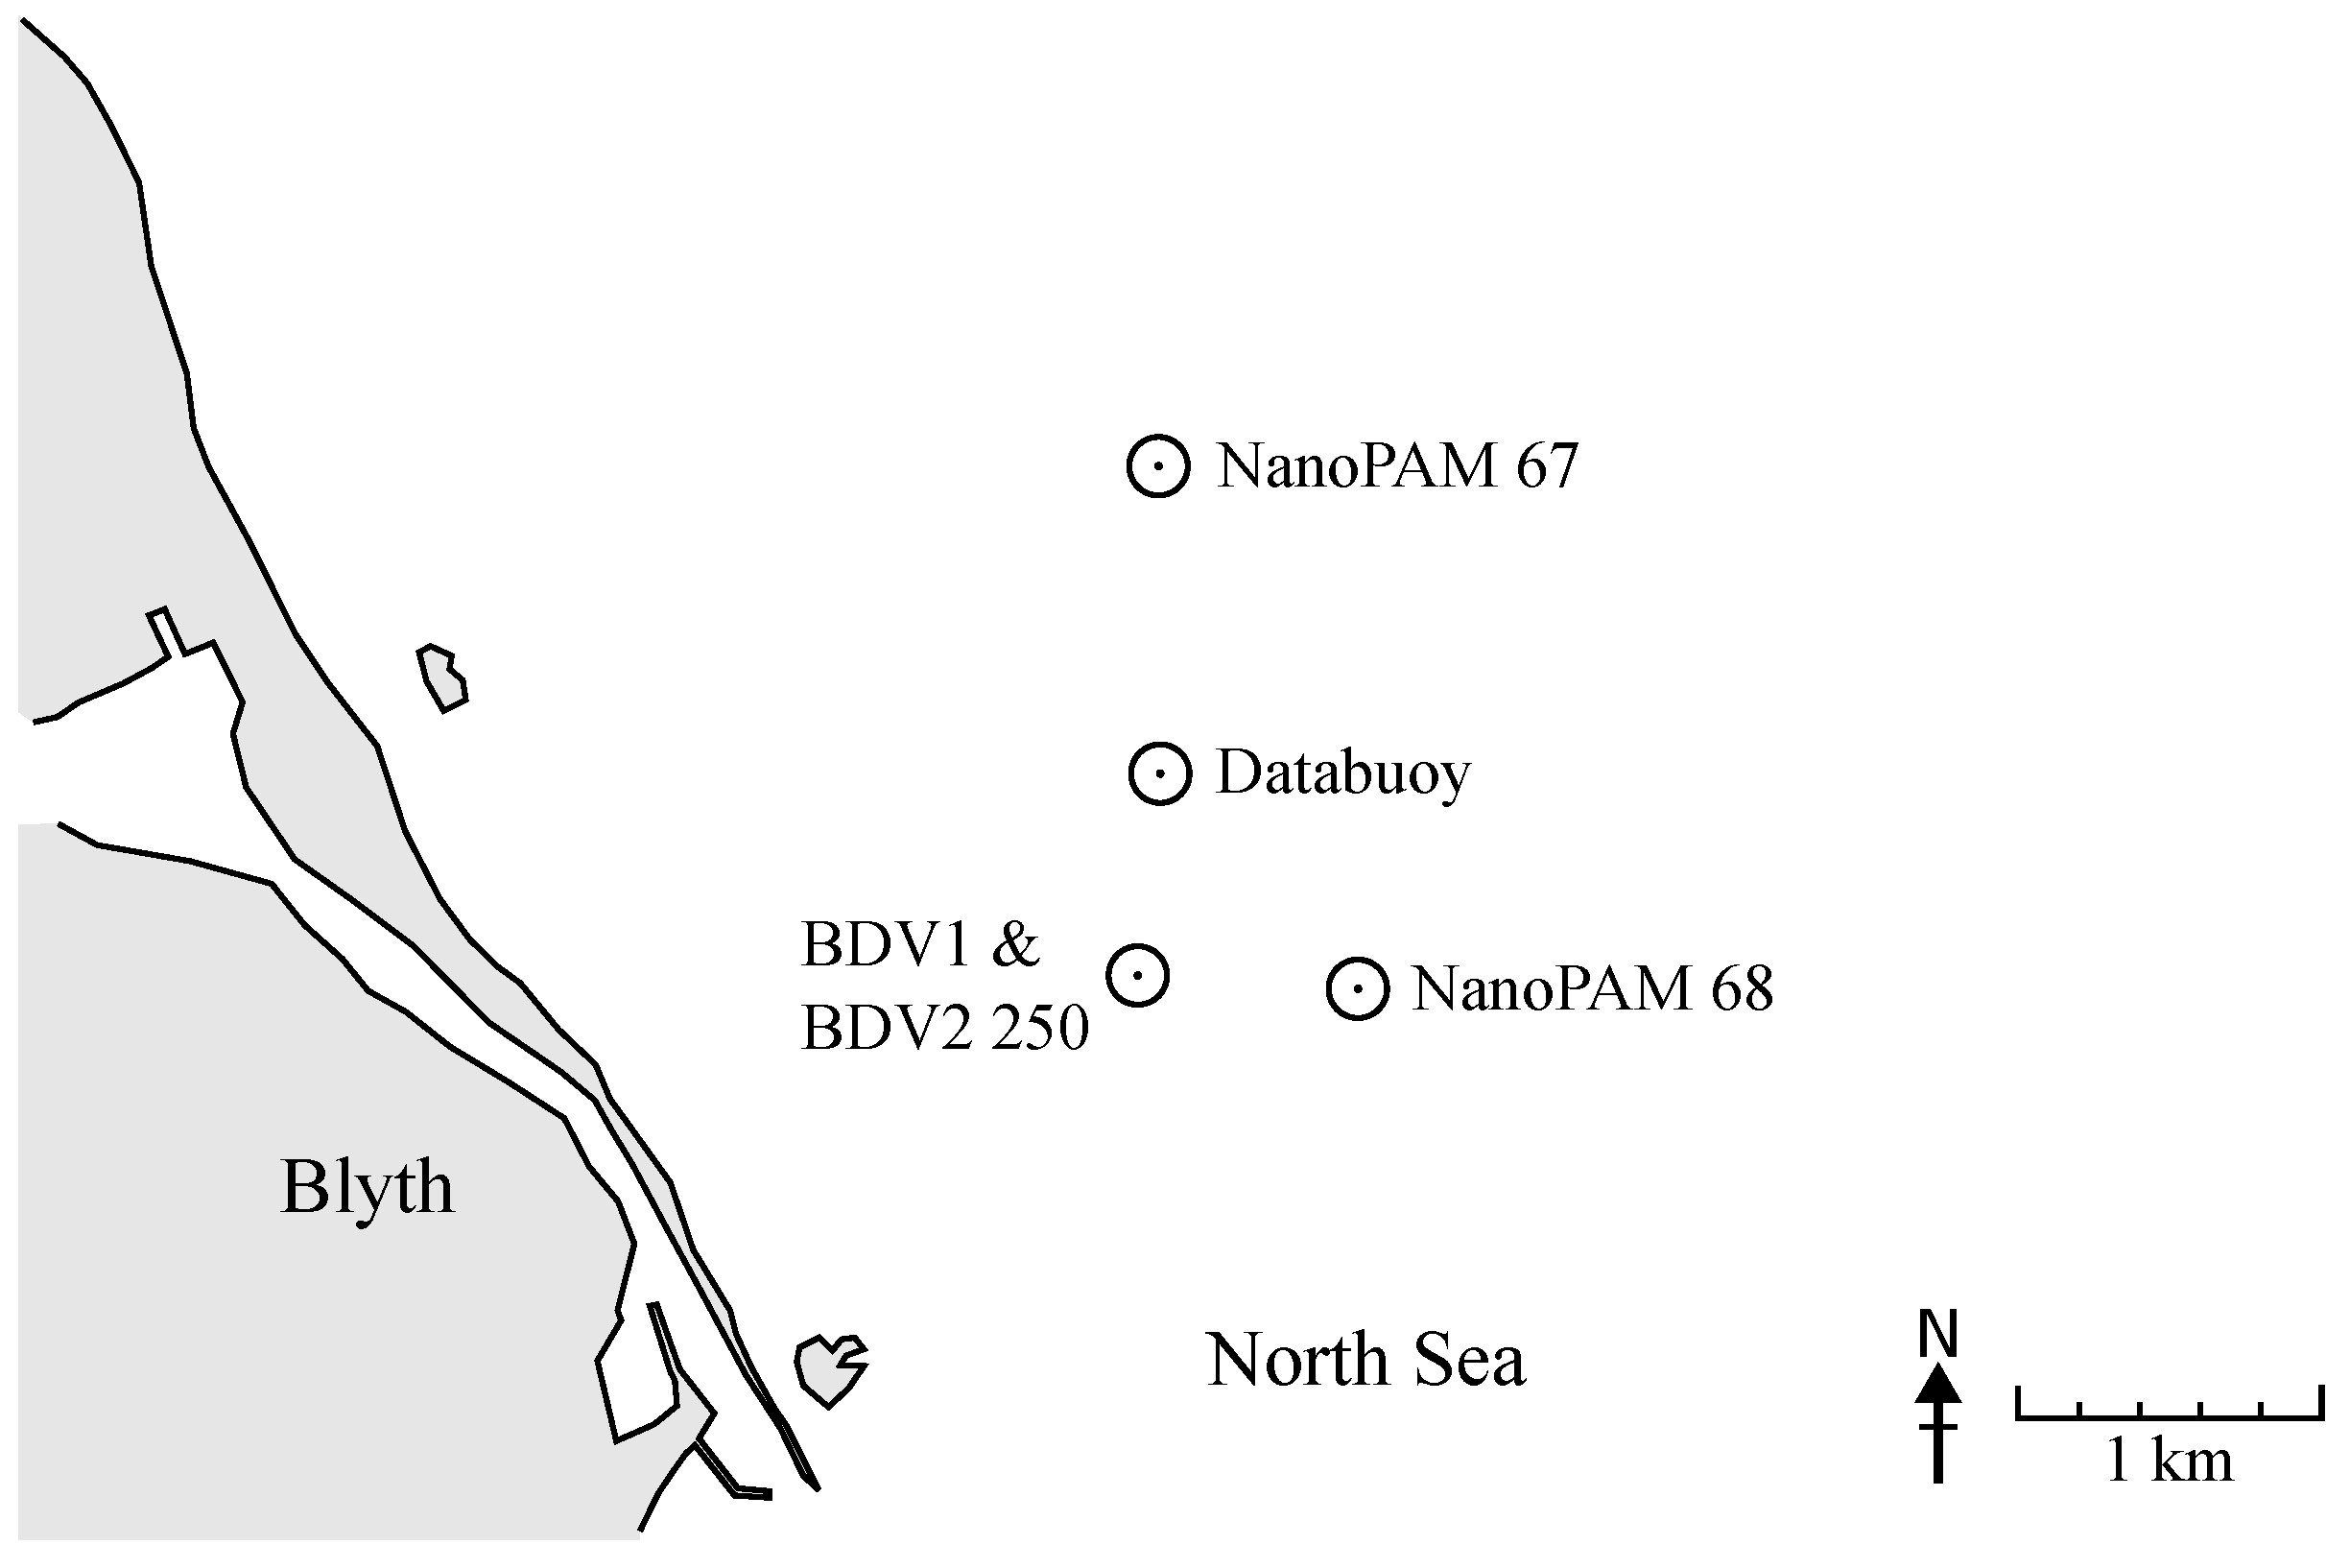
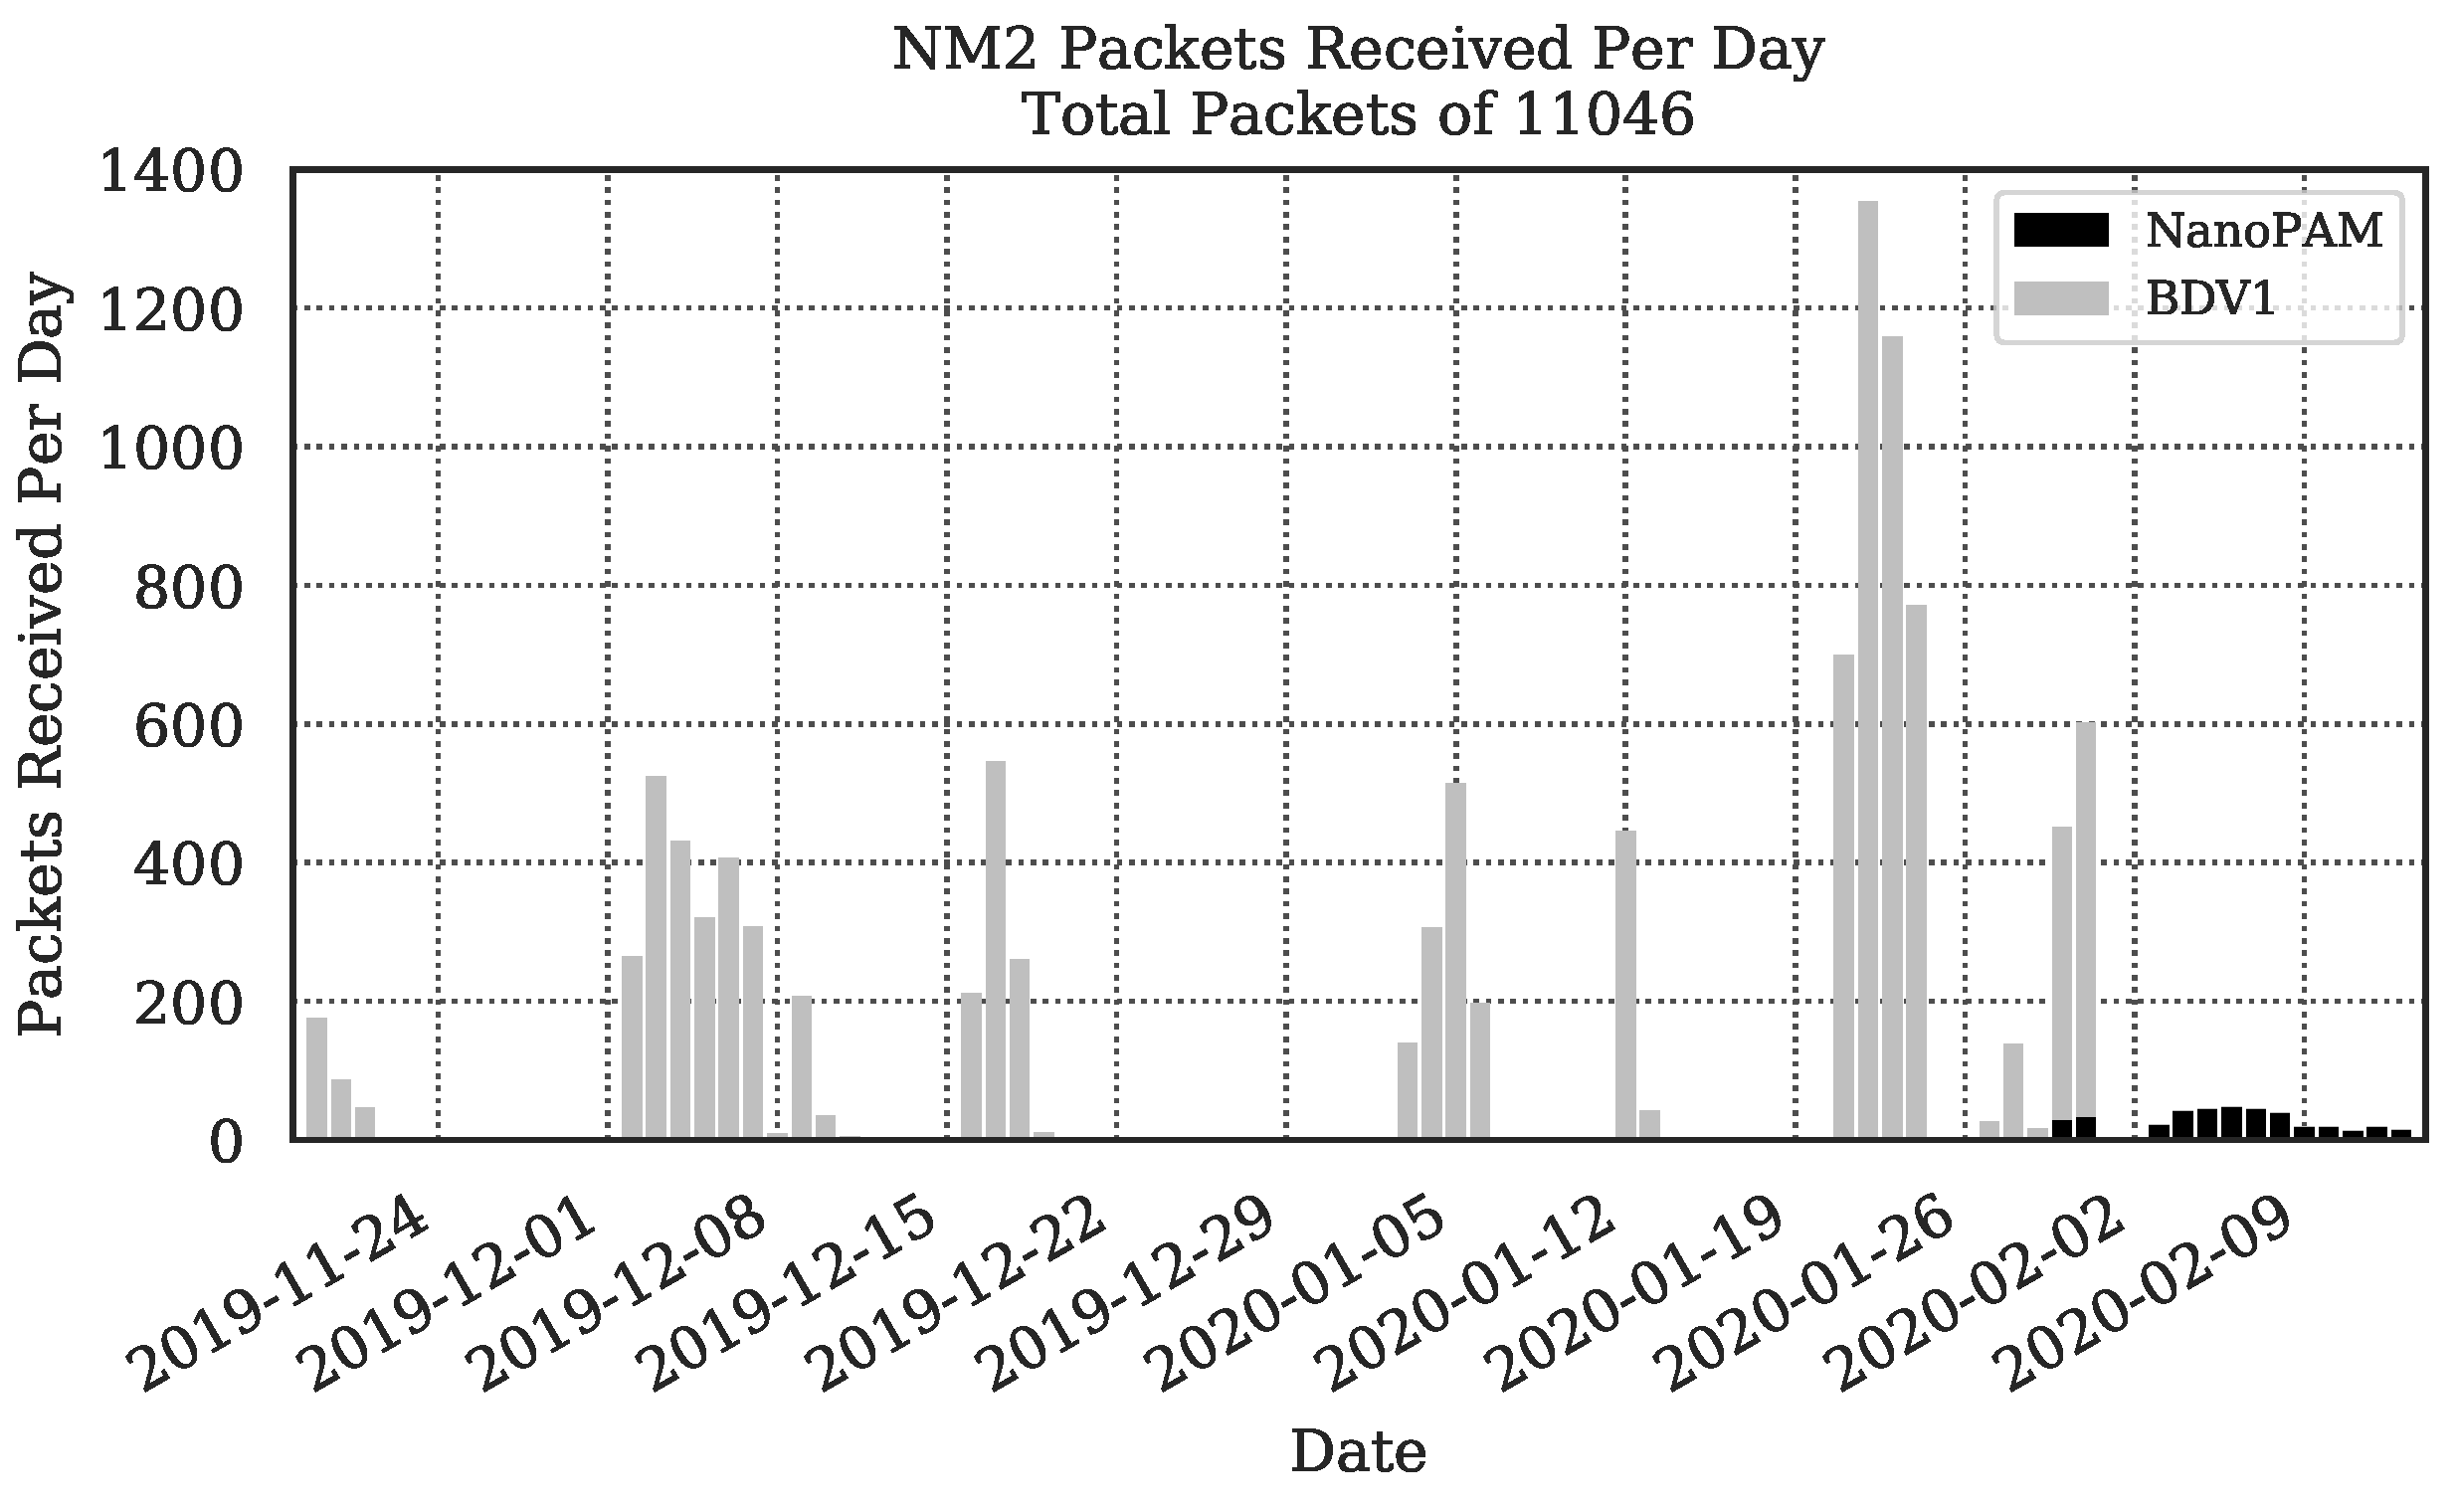
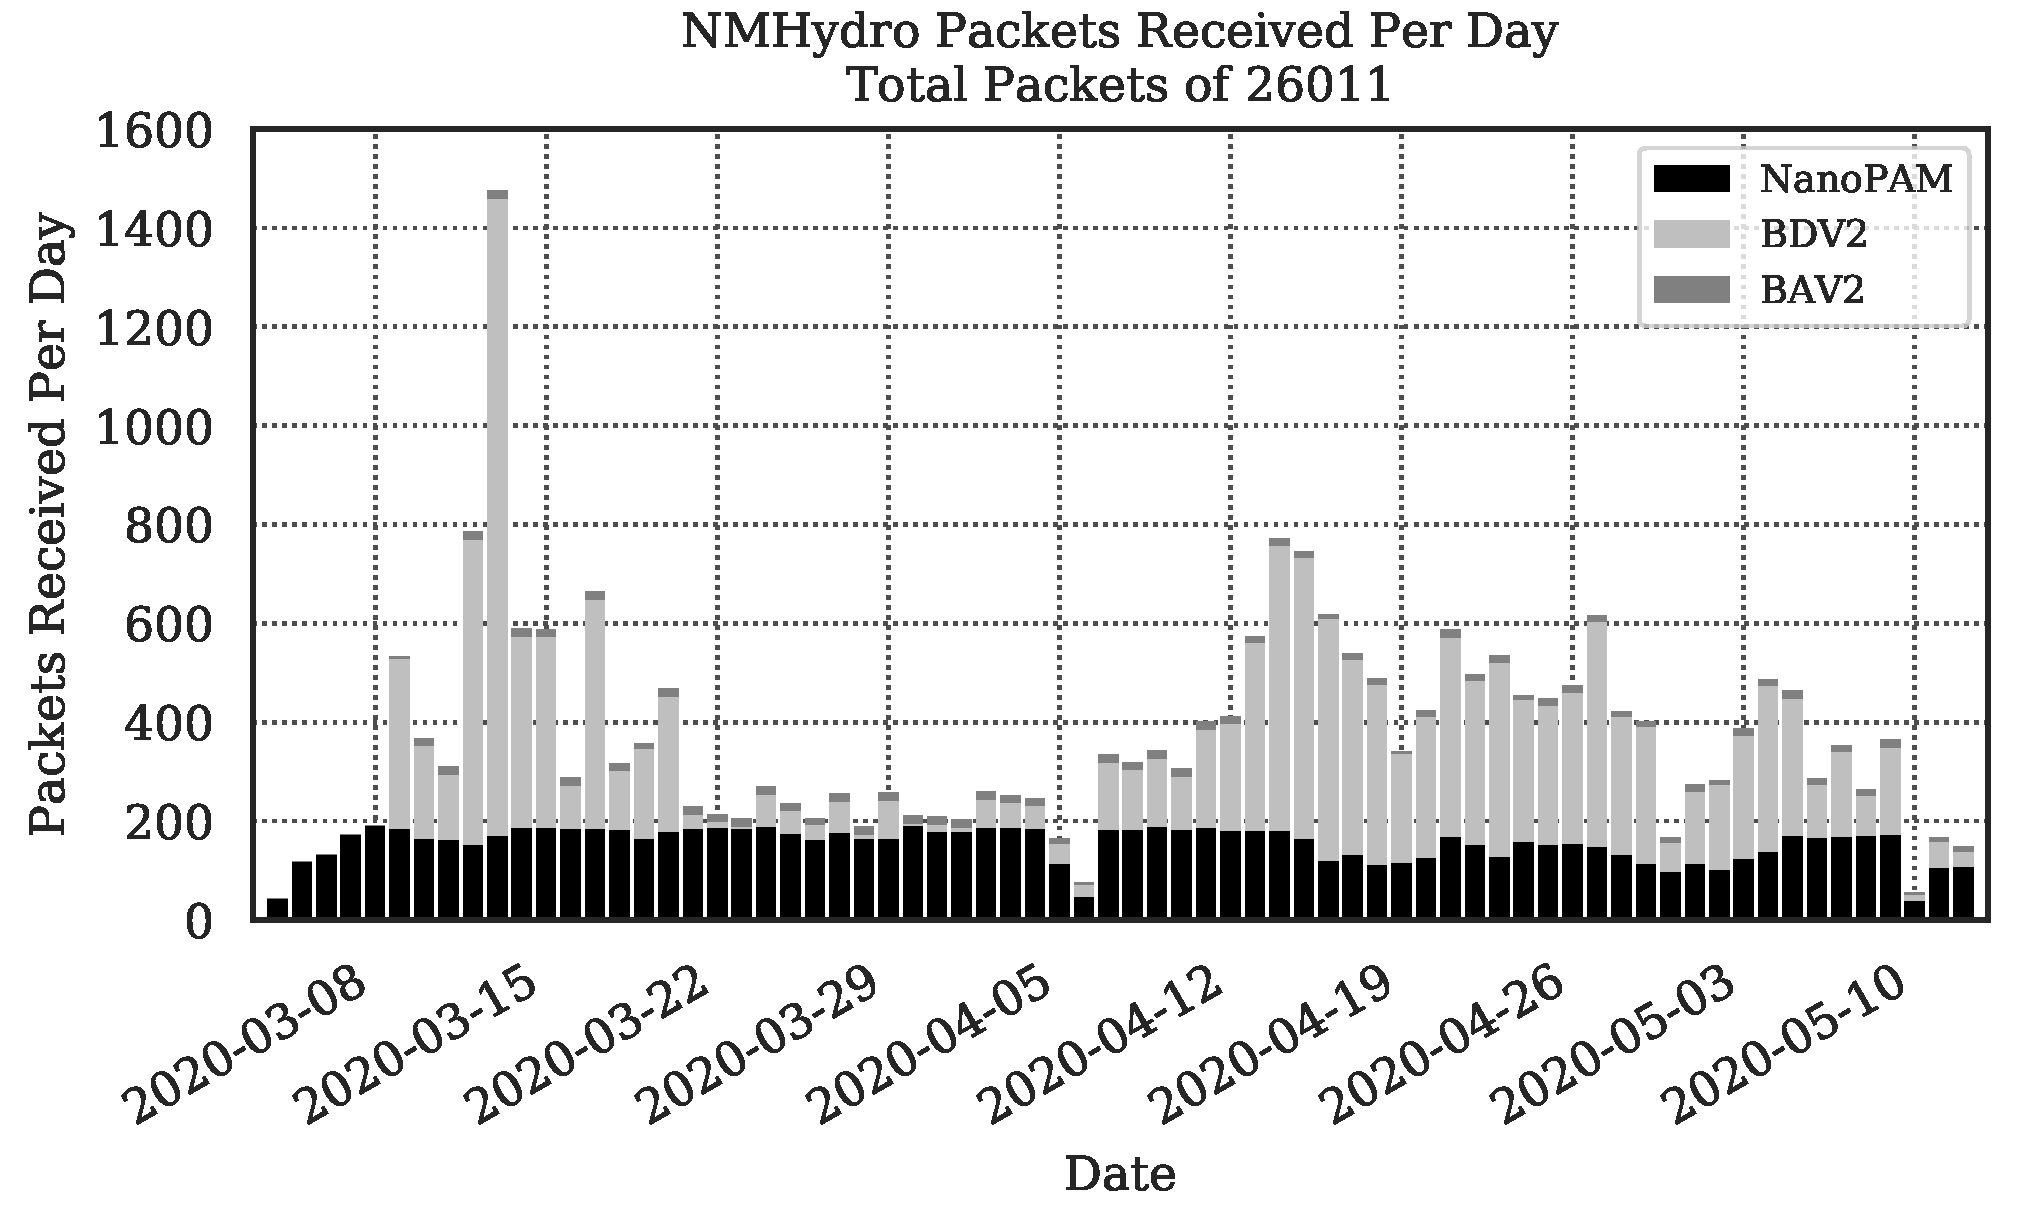
Two types of subsea passive acoustic sensors, using NMv3 acoustic modems for data transmission, were deployed in the North Sea. Vessel cavitation noise detectors [30,31,32] (with a message identifier of BDV1) were in operation from November 2011. NanoPAM cetacean click detectors were deployed along with the V2 vessel detectors (with message identifiers of BDV2 and BAV2) from February and March 2020, respectively. Locations of the nodes and databuoy are shown in Figure 15. Two NMv3 modems, NM1 and NM2, were originally installed on the buoy. Until the end of February 2020 all acoustic packets were received by the NMv3 modem installed on the buoy (NM2). After heavy storms damaged cabling on the buoy, acoustic messages were then received via the hydrophone on the buoy with the audio streamed in real-time to a software defined receiver (NMHydro). Figure 16 shows the daily packet count over the period between late November and early February received by the NMv3 modem, a total of 11,046 packets. Operation of the gateway buoy was unfortunately intermittent over this period due to low solar energy availability, resulting in many days over this period where the receiver was powered down. The vast majority of packet transmissions over this period are from the vessel detector node, which has event-driven transmissions whenever a vessel detection occurs. Conversely NanoPAM data transmissions are periodic with an accurately controlled 1 h interval. Figure 17 shows those received by the hydrophone and real-time software defined receiver, with a total of more than 26,000 packets between early March and early May.
Each sensor node utilises “unicast with ack” messages and multiple retries should it fail to receive the ack from the modem at the gateway buoy. When the receiver was switched to the software defined receiver using the hydrophone, this was not able to respond with the ack. Therefore, each message was sent four times from all sensors. In addition to this, each message had a unique sequence number that was repeated in the retries and incremented on the next message. The NanoPAM packets also include a retry count, allowing us to uniquely identify each of the four packets transmitted for a given message. It is possible to use this information to determine communications reliability by analysing how many packets were received with the same sequence number, and identifying missing sequence numbers for an entirely lost message.
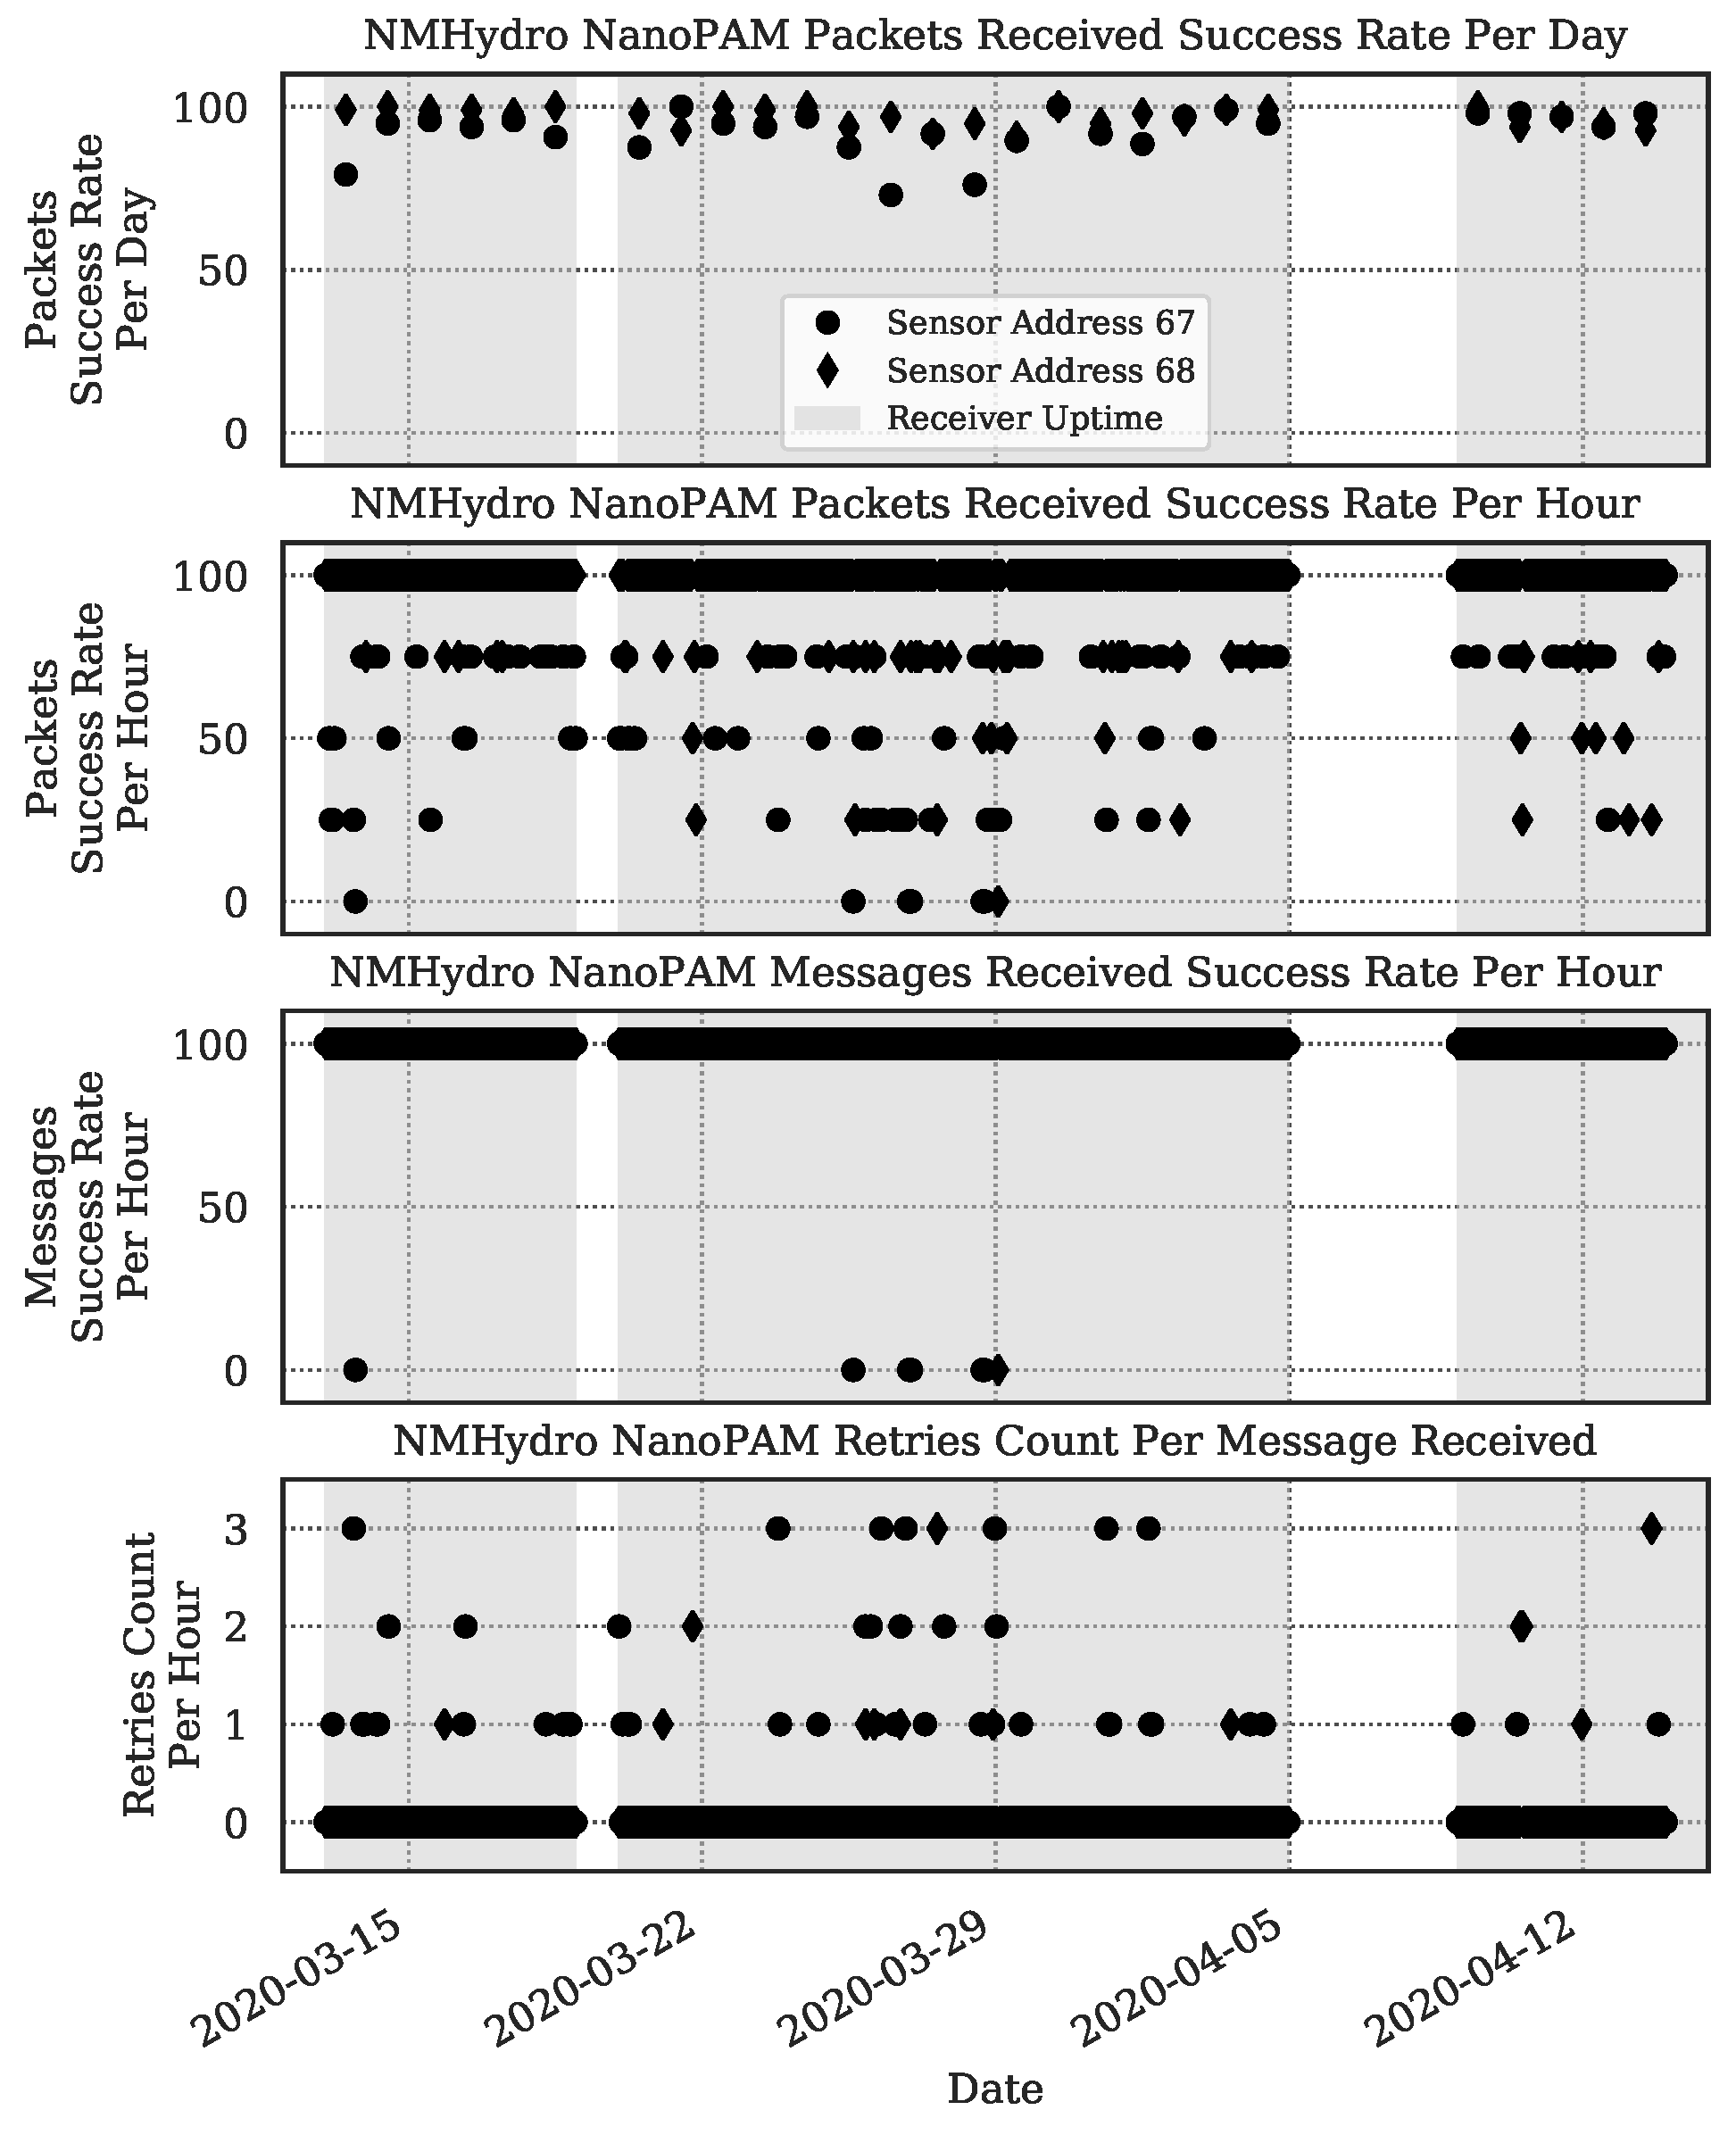
Investigating transmissions for the NanoPAM nodes over the course of a month and using the above characteristics of the packet structure it is possible to determine various success rates of packets and messages. Figure 18 shows this duration, where the shaded area indicates confirmed receiver uptime. For each sensor node, 67 and 68, one message is expected per hour. Each message is transmitted in a packet four times. For a given 24 h period, 24 messages × 4 packets are expected. The received packet success rate per day is therefore shown for both sensor nodes, as well as the packet success rate per hour. Looking at the message success rate per hour, whereby a minimum of one successfully demodulated packet is required, it is possible to see that of a total of 1296 messages were expected and a total of 7 messages were lost, giving a message success rate of 99.5%.
Given that the ack packet is considerably shorter in duration, and hence more robust than a full data packet, we could assume that any transmitted ack would have been successfully received at the sensor node. It is possible therefore to determine the performance based on the packet retry count of the first packet received per message from the sensor node. These are shown in Figure 18 where a retry count of zero indicates a successful receipt of the first packet sent.
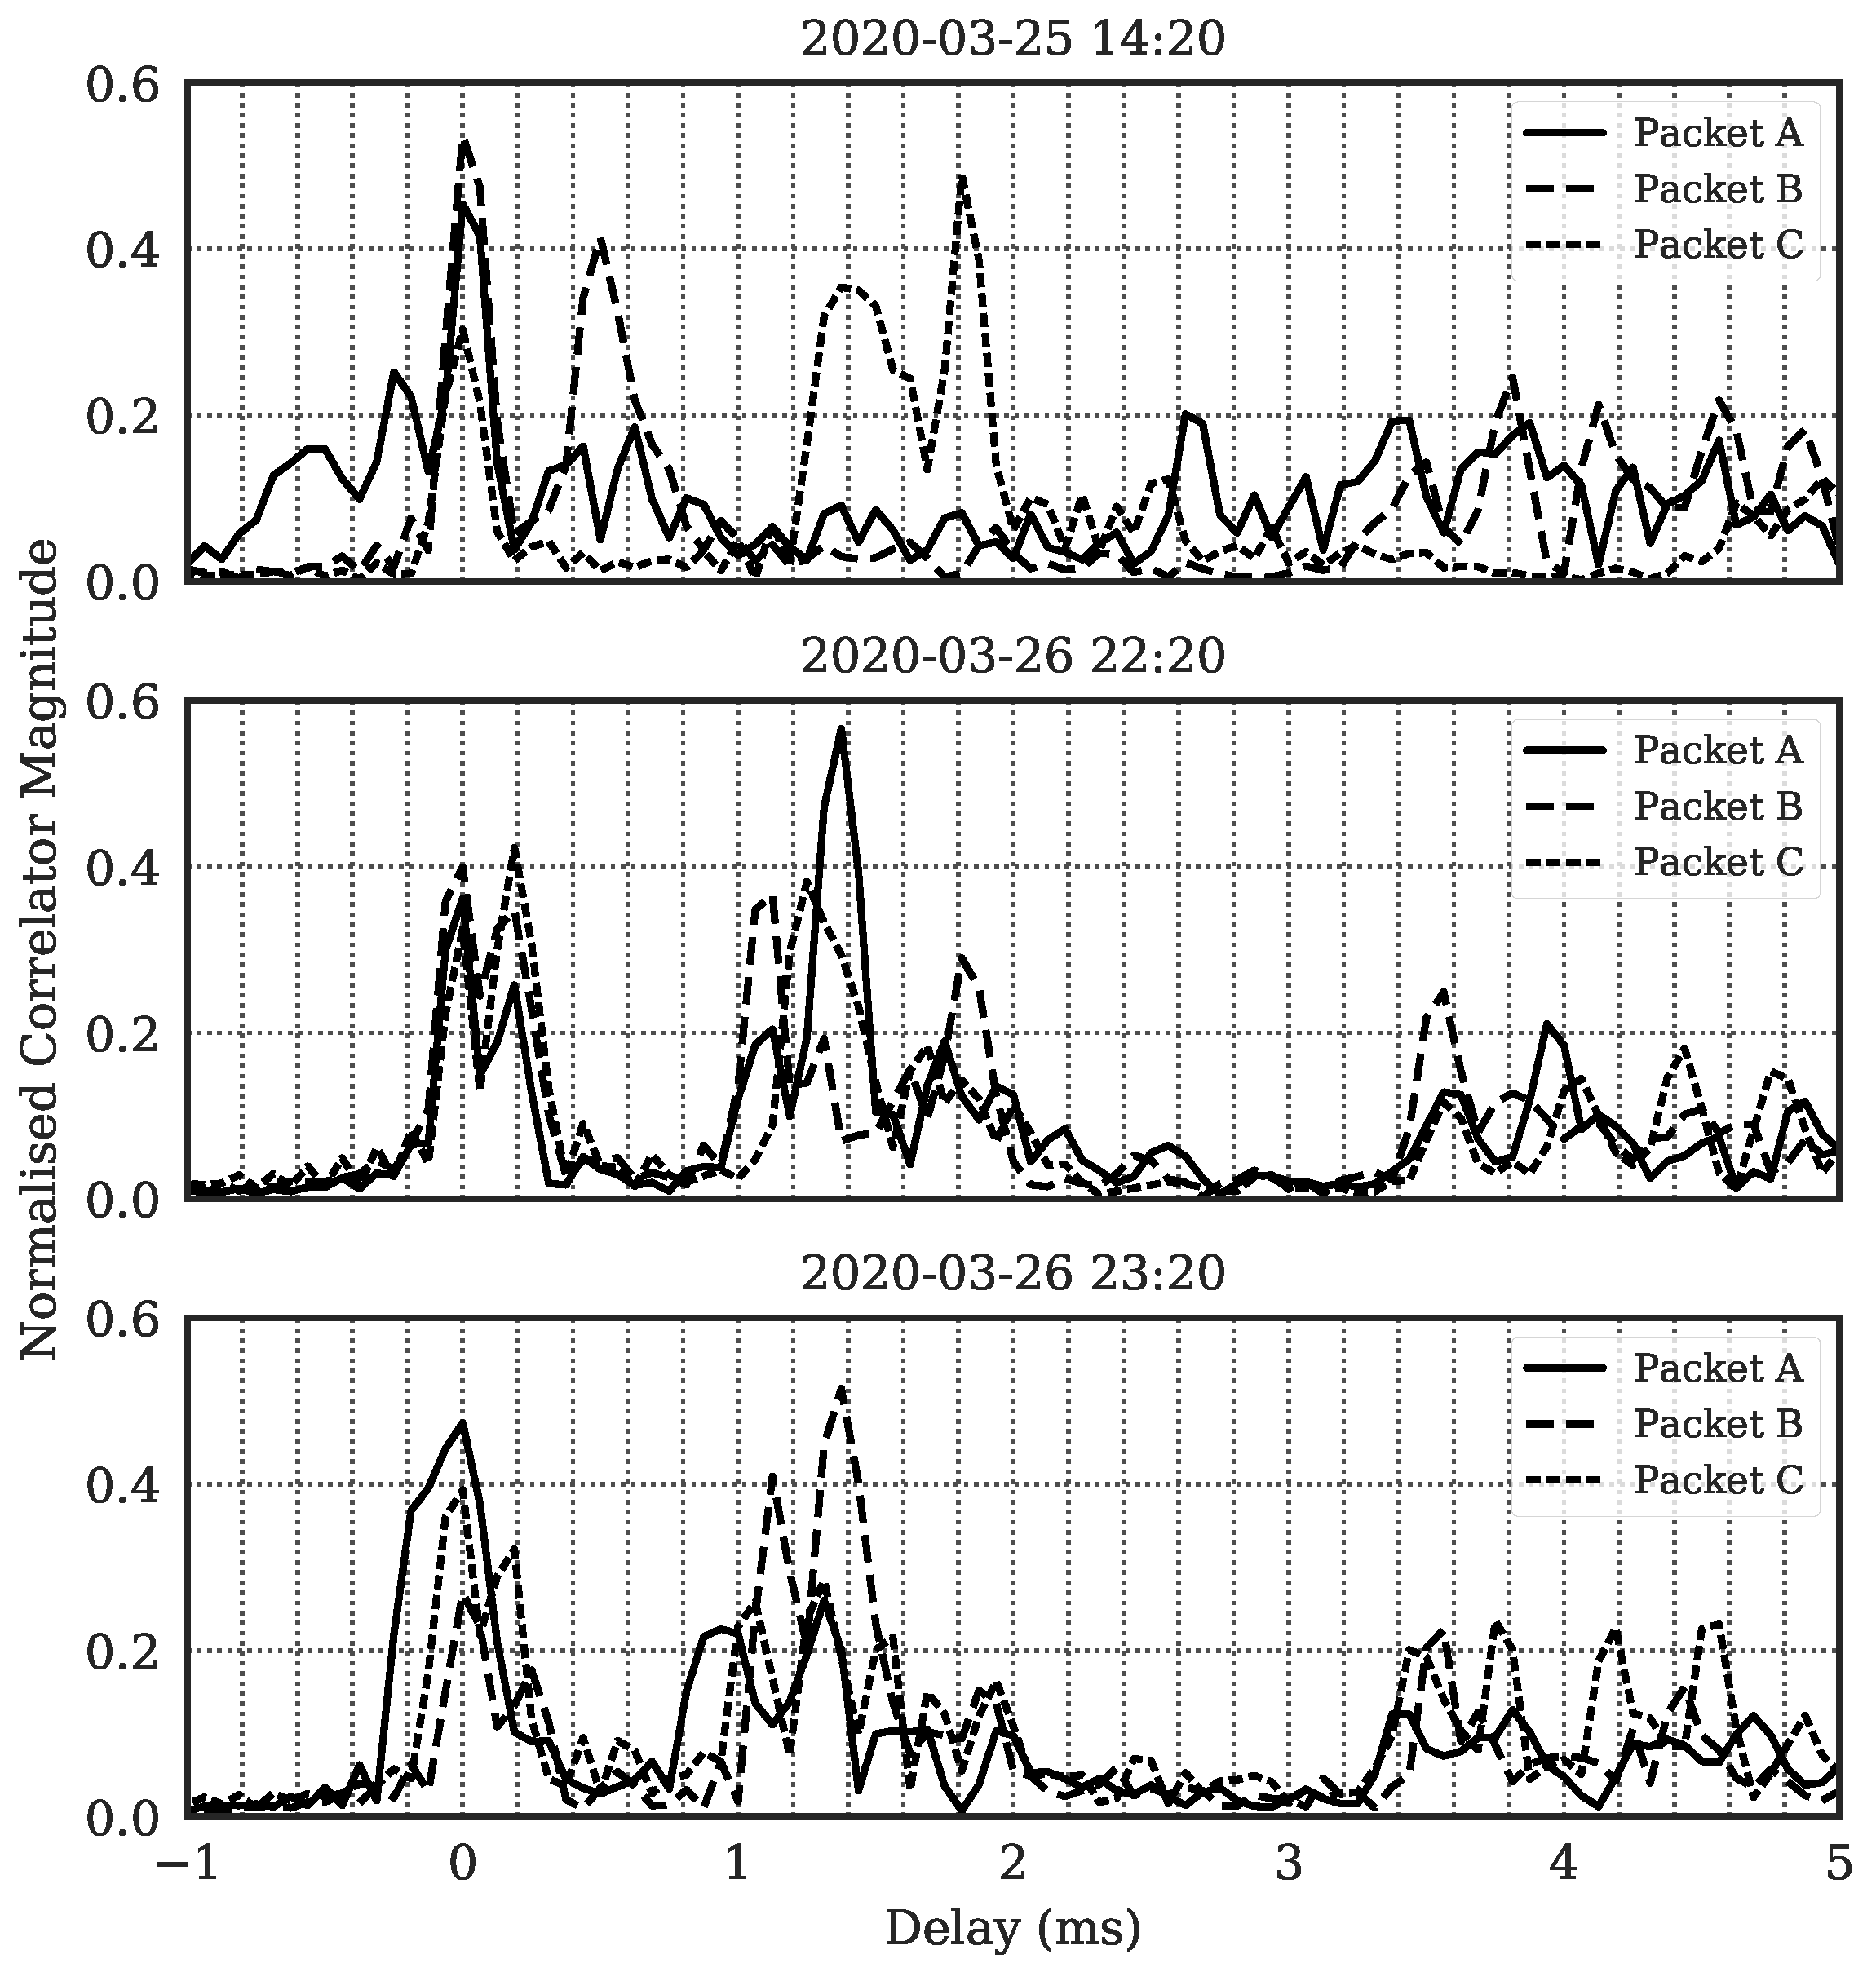
A number of the failed messages, for which the packets synchronised but subsequently failed to decode, showed particularly severe multipath channels as shown in Figure 19. It is also possible in these cases that the first arrival path locked onto by the receiver then subsequently faded in magnitude. It was observed that these instances generally occurred in peak tidal currents where the modem moorings were pulled over and hence the transducer (with toroidal beam-pattern) was oriented away from the gateway.
6. Network Experiments
Experiments with NMv3 based sensor network nodes, using a TDA-MAC protocol with multi-hop routing, were carried out in Loch Earn during March 2019. This section describes the TDA-MAC protocol and the experiment setup before presenting the results and discussions.
6.1. Centralised Networking Using Dual-Hop TDA-MAC
TDA-MAC [33] is a protocol for centralised scheduling of data transmissions from multiple underwater sensor nodes connected to a single gateway node. It was designed to achieve high network throughput, efficiently utilizing the limited UWA channel capacity, without clock synchronisation at the sensor nodes. Instead, the transmission times are determined locally at the nodes, based on the node-specific delays between receiving a request packet and transmitting their data packets. A practical application of TDA-MAC was successfully demonstrated in sea trials with a small underwater sensor network in July 2018 in Fort William, UK [11].
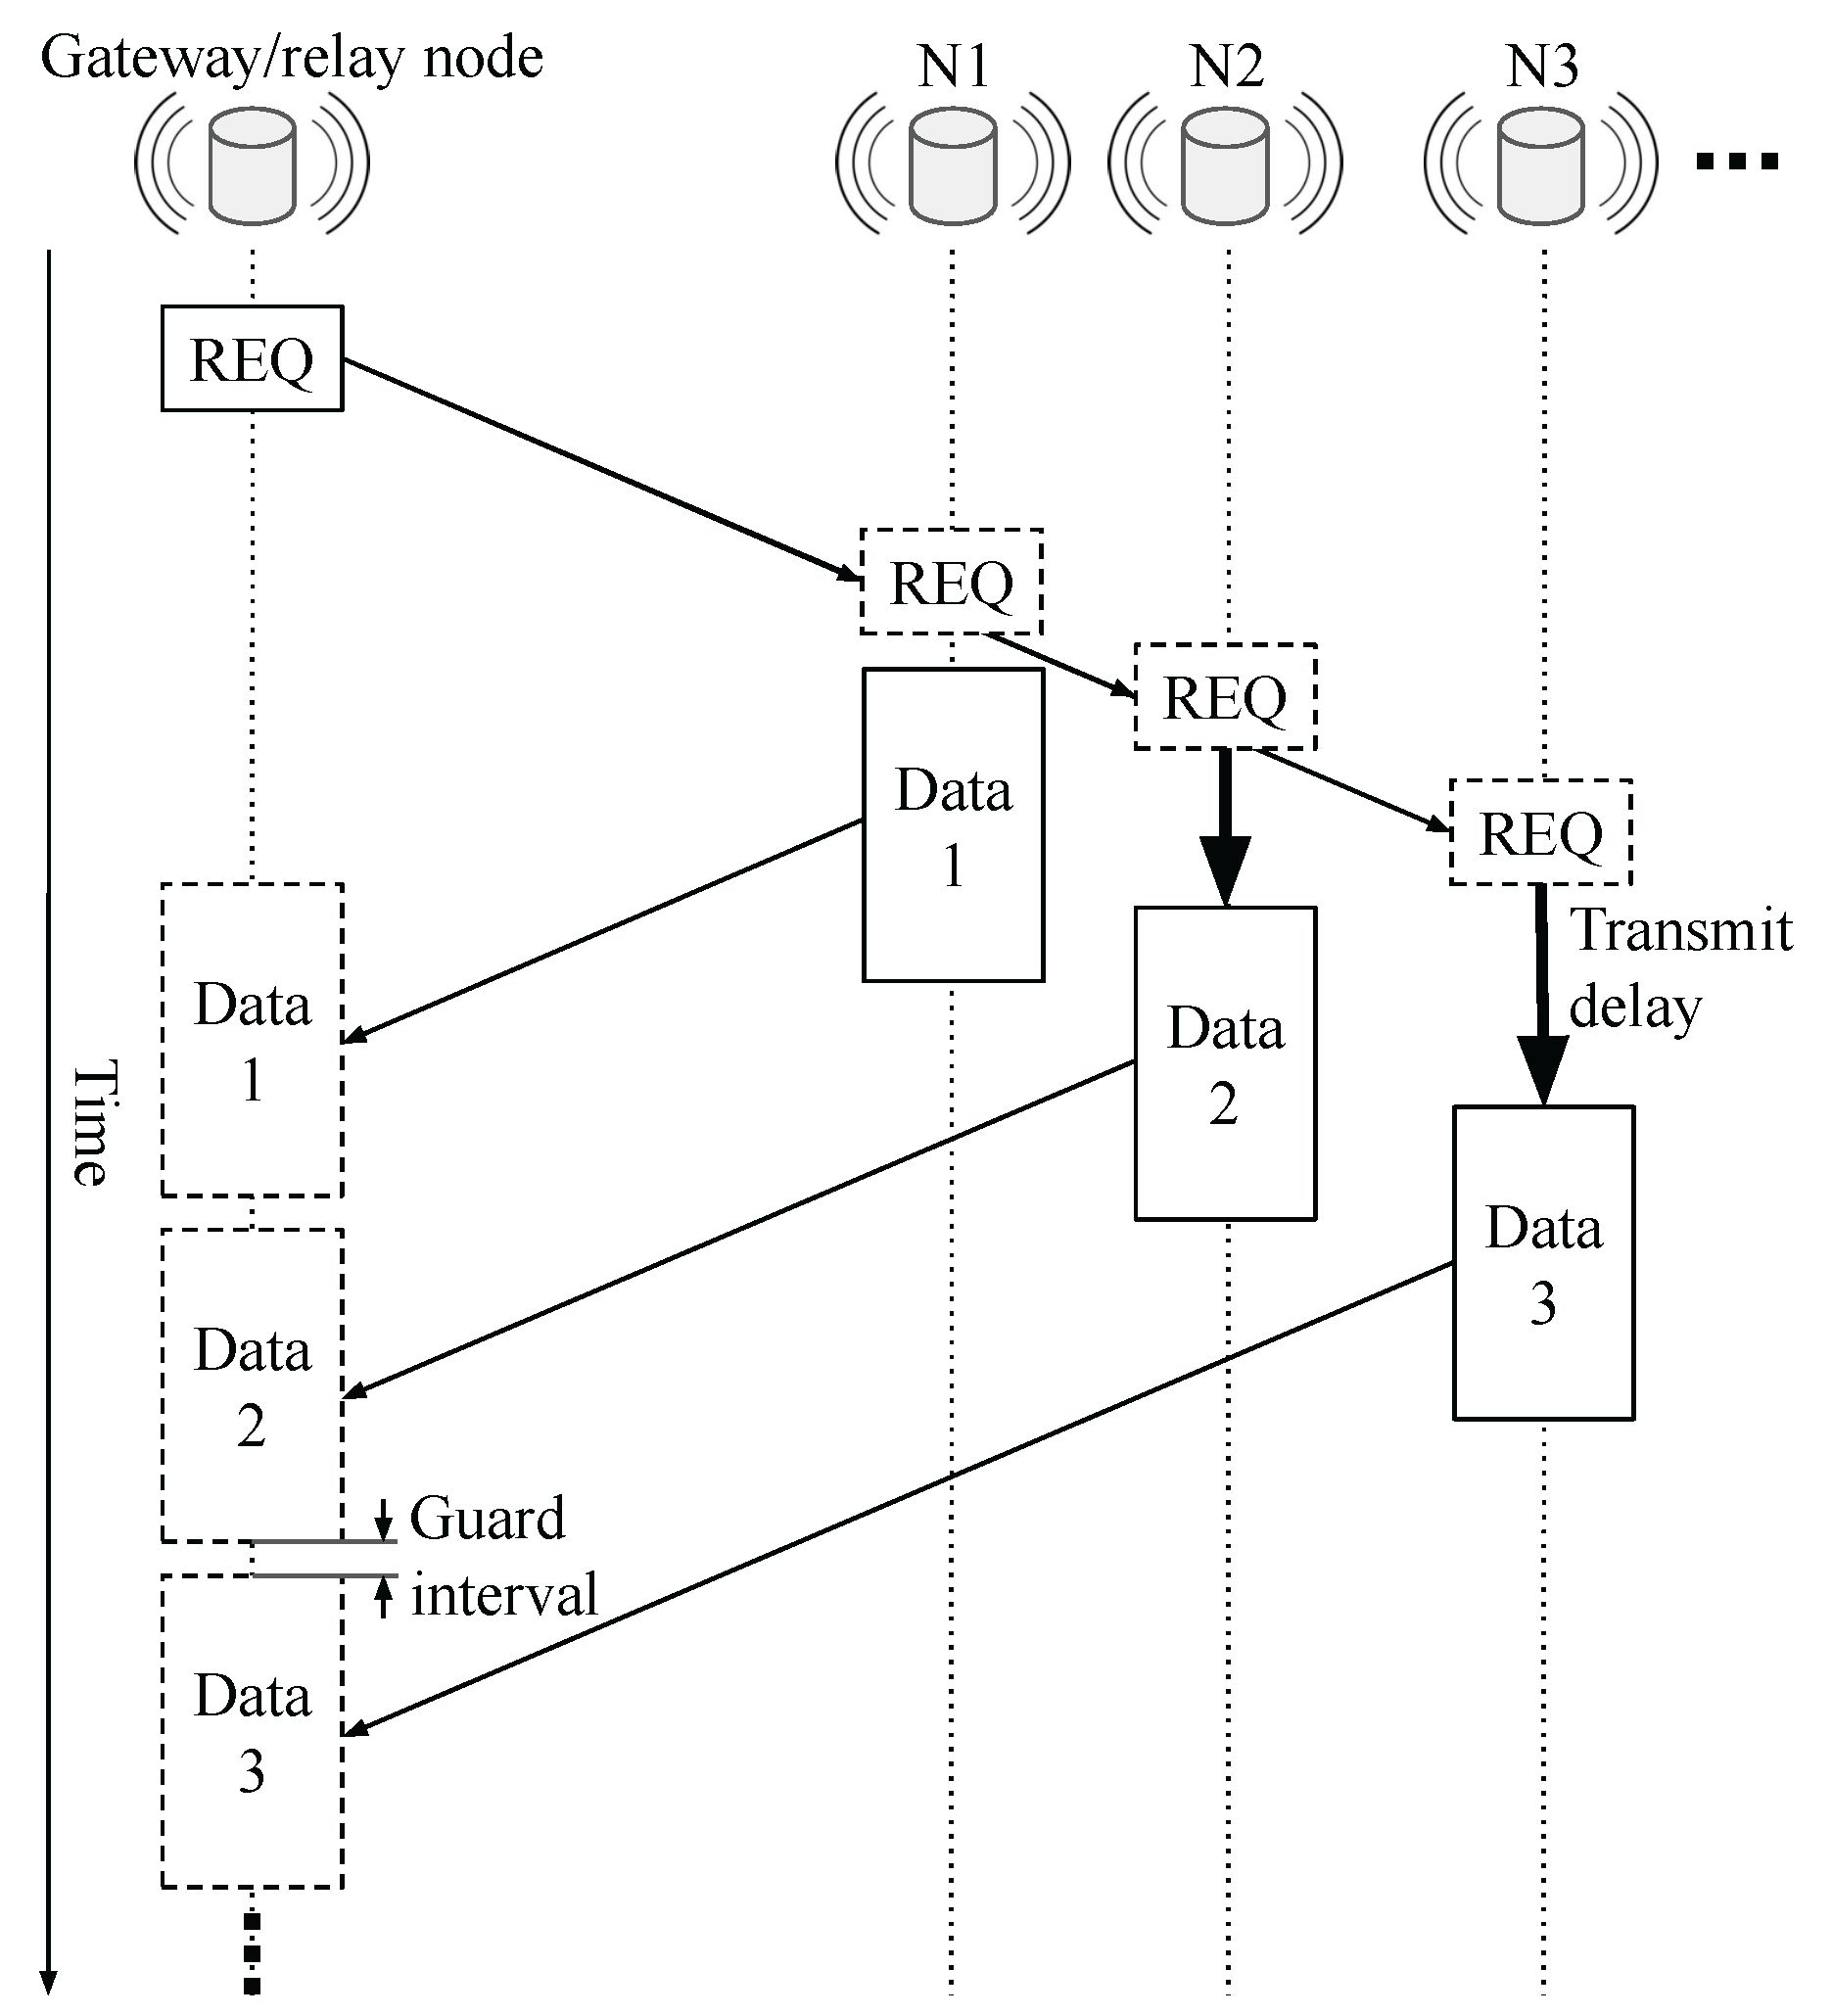
Figure 20 shows an illustrative example of the packet flow in TDA-MAC. The gateway node broadcasts a data request (REQ) packet, which is received by every sensor node at a different time (due to the differences in propagation delays of the acoustic links). Each sensor node then waits for a specific (individually assigned) transmit delay before sending their data packet back to the gateway node. TDA-MAC was also shown to work as a general centralised MAC protocol, regardless of whether a sensor node has a packet to transmit at any particular time [33]. The “DATA” blocks in Figure 20 can be viewed as the time window in which a sensor node is allowed to transmit a packet, if it decides to transmit anything. The gateway node computes the transmit delay values assigned to each node based on the measured propagation delays, which are obtained via a series of ping packet exchanges between the gateway and every sensor node during the network setup stage (see [33] for more detail). Afterwards, during the normal operation of the network, the gateway node can continuously monitor the accuracy of the estimated propagation delays by measuring the error in the timing of the received data packets. This approach is suitable for maintaining a TDA-MAC schedule in quasi-stationary sensor networks, such as that used in the experiments discussed in this section.
Crucially, the allocation of transmit delay values to the sensor nodes is designed to include a guard interval separating consecutive data packets received at the gateway node, as depicted in Figure 20. It should be long enough to avoid packet collisions due to inaccuracies in propagation delay estimates, slow variations in node positions and the multipath channel delay spread. However, extending the guard interval also increases the amount of idle time on the channel and, thus, reduces the throughput and increases the latency. Therefore, the length of the guard interval should be chosen to achieve a trade-off between link reliability and network throughput, taking into account the network size, the link lengths, the expected node drift, the reflectivity of the sea surface and bottom, etc.
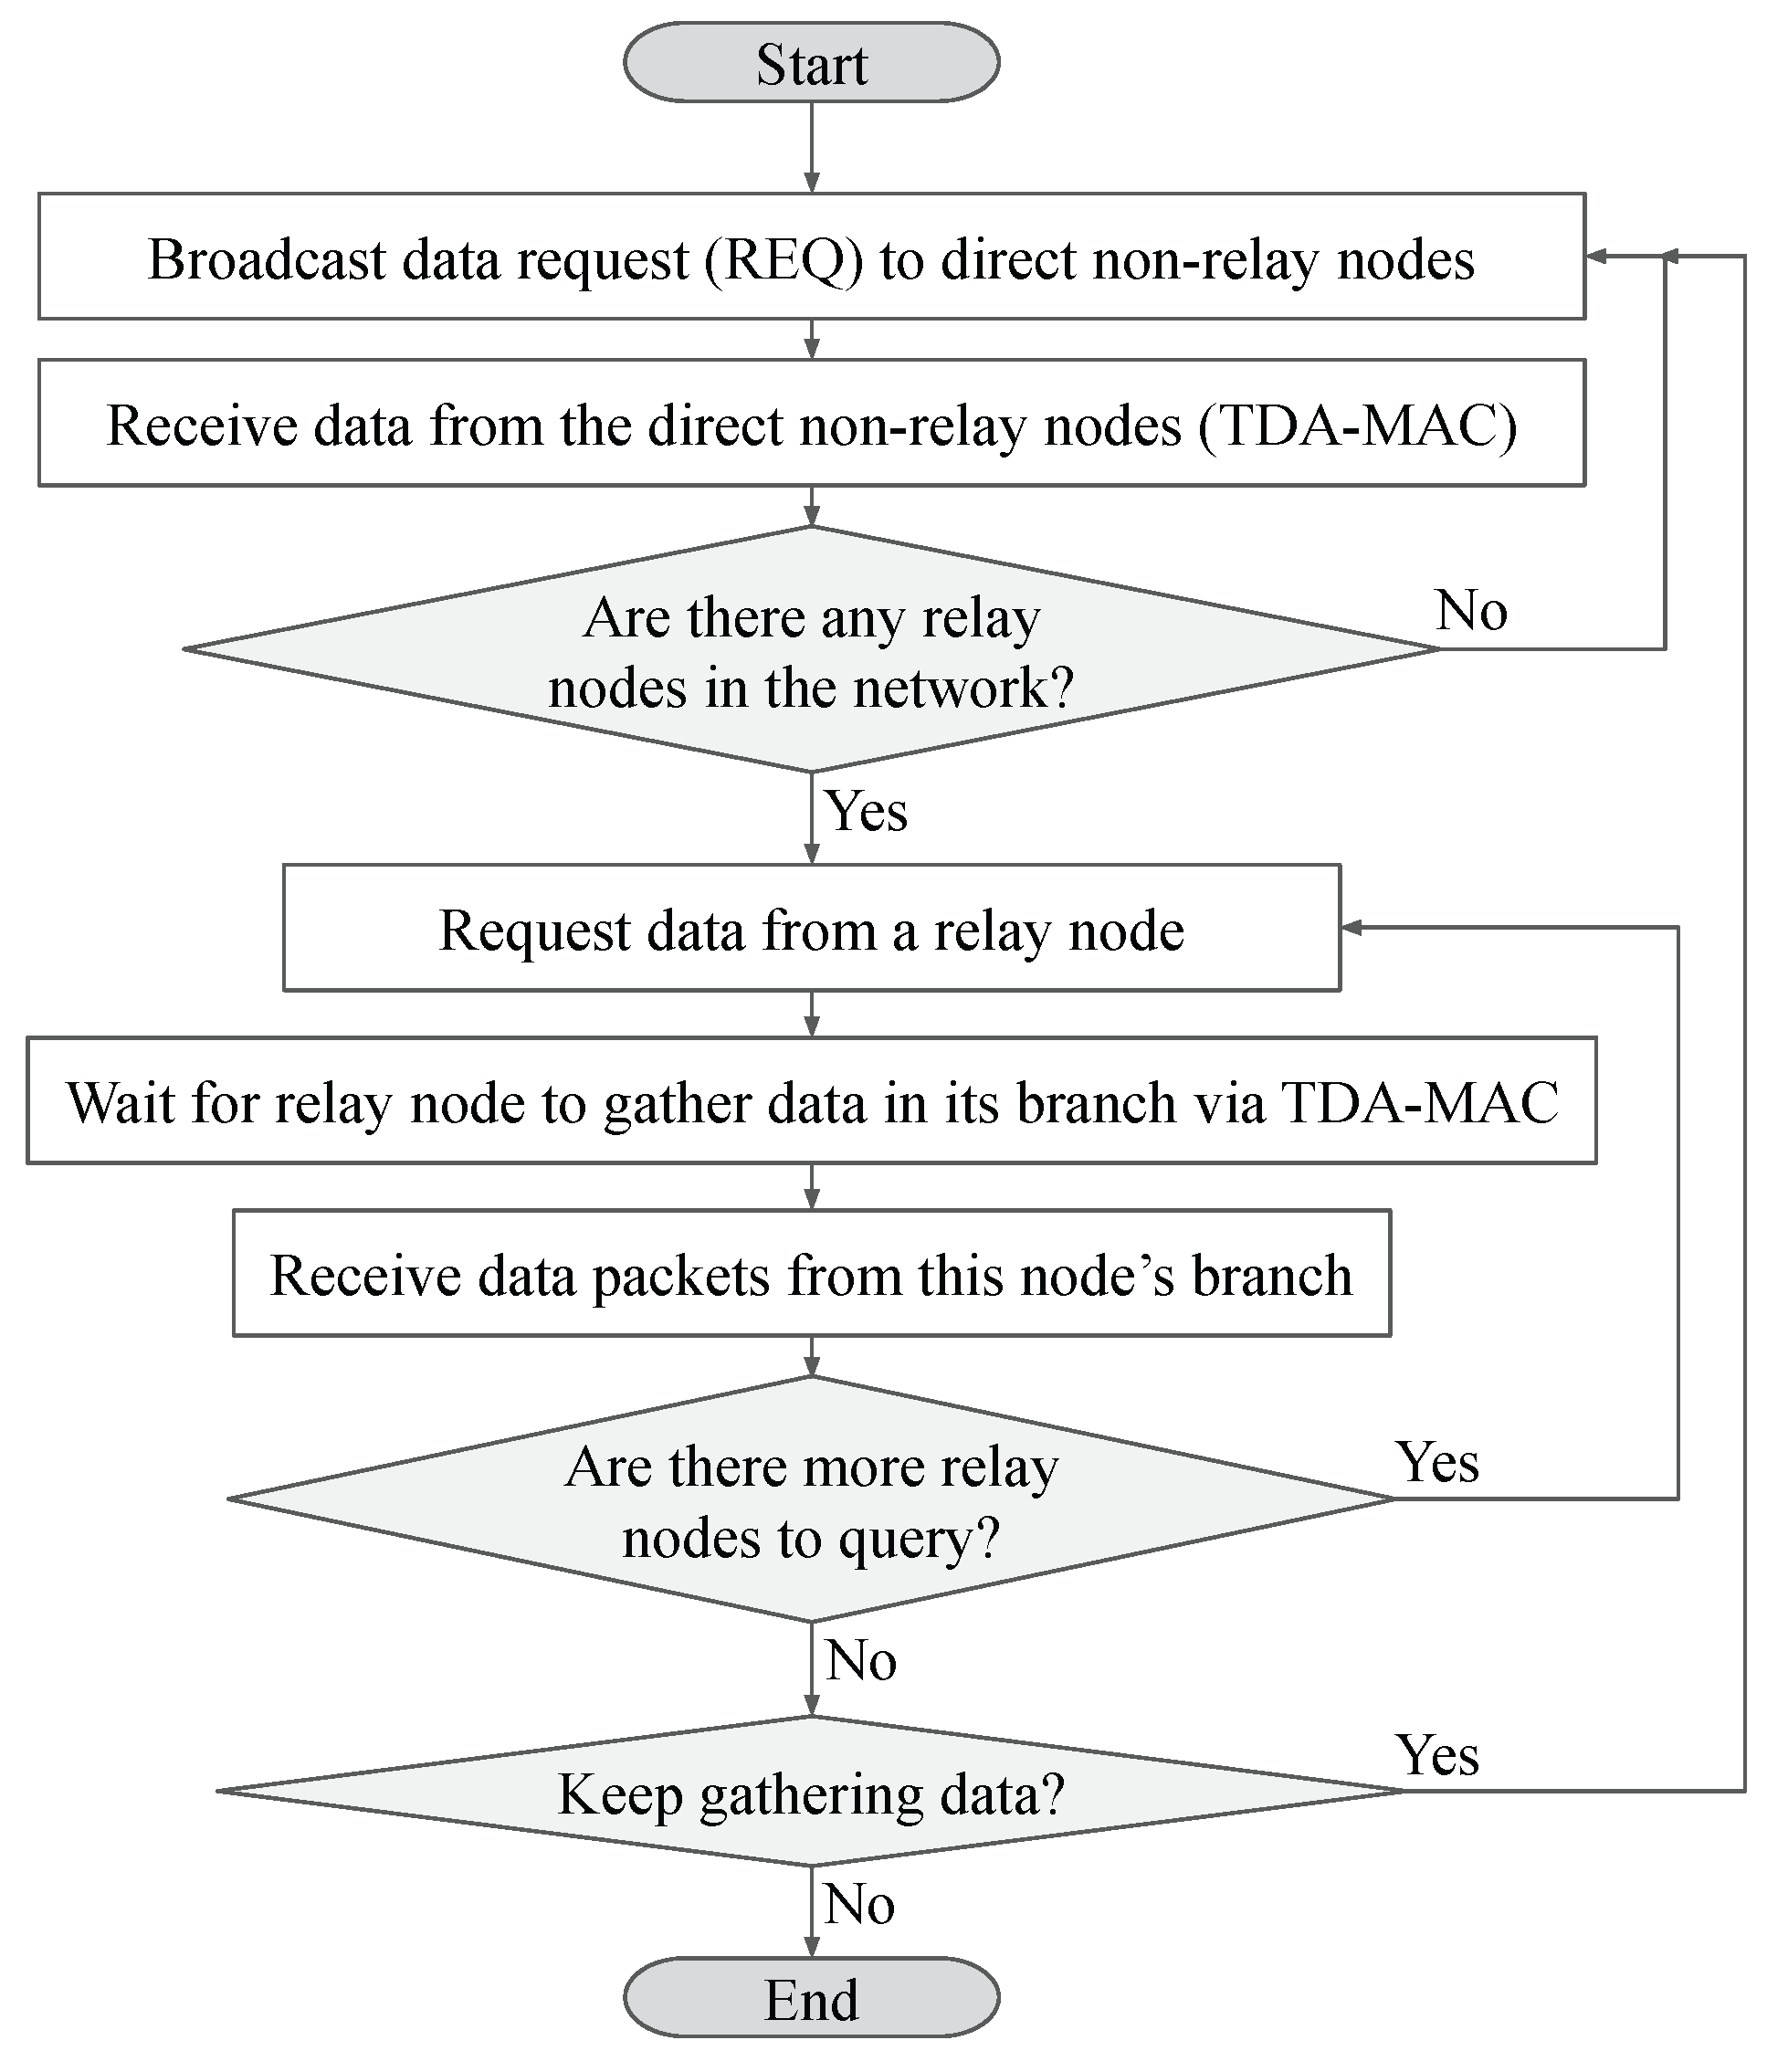
The TDA-MAC protocol can be extended to dual-hop networks, as proposed in [35], where nodes that do not have a direct link with the gateway node are connected via another sensor node that acts as a relay. Figure 21 shows the flowchart of the Sequential Dual-Hop TDA-MAC protocol [35]. There, the single-hop TDA-MAC packet flow from Figure 20 is used at two levels of network hierarchy:
- The gateway node gathering data from directly connected sensor nodes;
- Every relay node gathering data packets within their respective network branch.
This approach was shown to achieve high network throughput by leveraging the many-to-one connections in centralised dual-hop UASNs. The experiments discussed in this section involve an underwater sensor network that coordinates the transmissions between the sensor nodes and an on-shore gateway node using the Sequential Dual-Hop TDA-MAC protocol described above.
6.2. Experimental Setup
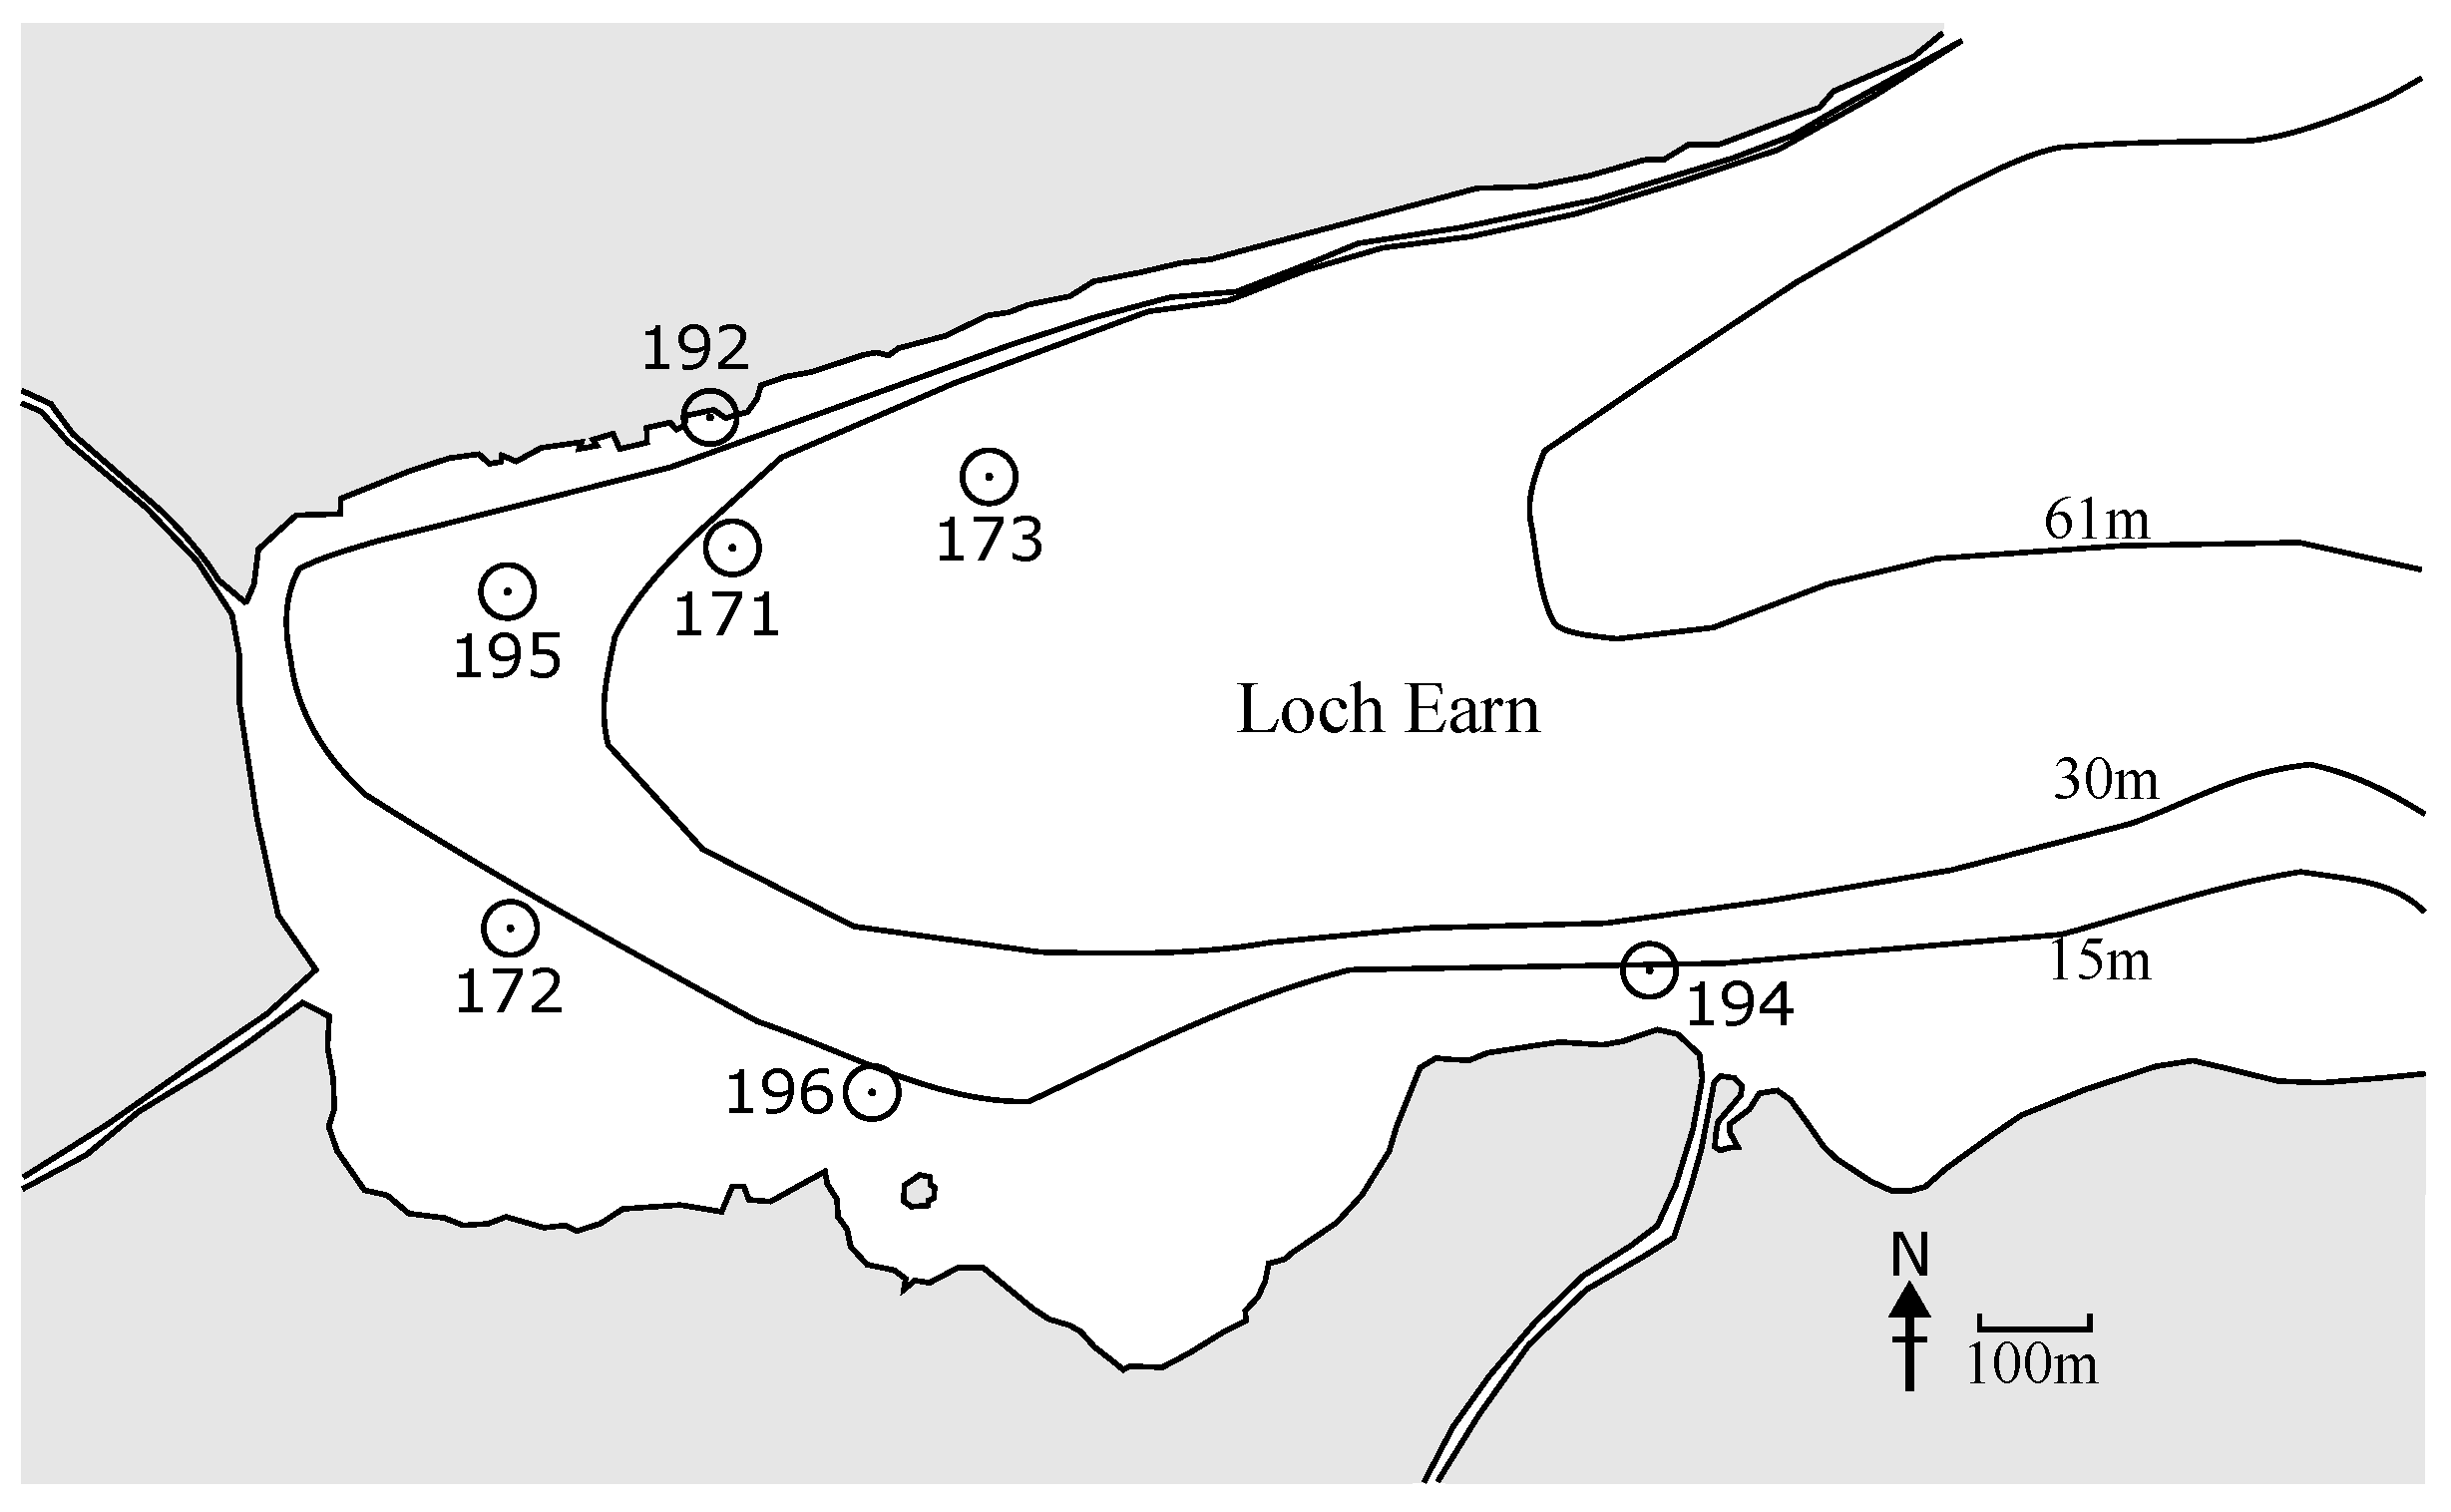
Six sensor nodes, each with a NMv3 modem, were deployed in Loch Earn as shown in Figure 22. Another node with a NMv3 modem was located at the water’s edge (node 192 in Figure 22), and was used as the gateway node: initiating network discovery, setting up the TDA-MAC schedule, and gathering data packets from the six sensor nodes.
Each sensor node has an embedded Raspberry Pi 3B+/Zero running a Python implementation of the network protocol, with external connections to a temperature and pressure sensor and a NMv3 modem, as shown in Figure 23. The gateway node protocol runs on a laptop on shore, connected to a NMv3 modem via serial port. This hardware was also used in later sea trials in [14].
At the start of an experiment, the network discovery process established a network topology for data gathering. This process was based on a series of ping packet exchanges between the gateway node and all sensor nodes, and between the relay nodes and those sensor nodes that are out of range of the gateway. Afterwards, the gateway node computed the transmit delay values for each node and distributed the “transmit delay instruction” packets to each node until all of them were acknowledged, as described in [11]. Afterwards, during the data gathering stage, each sensor node would transmit its sensor data after their allocated transmit delay, either directly to the gateway or to their assigned relay.
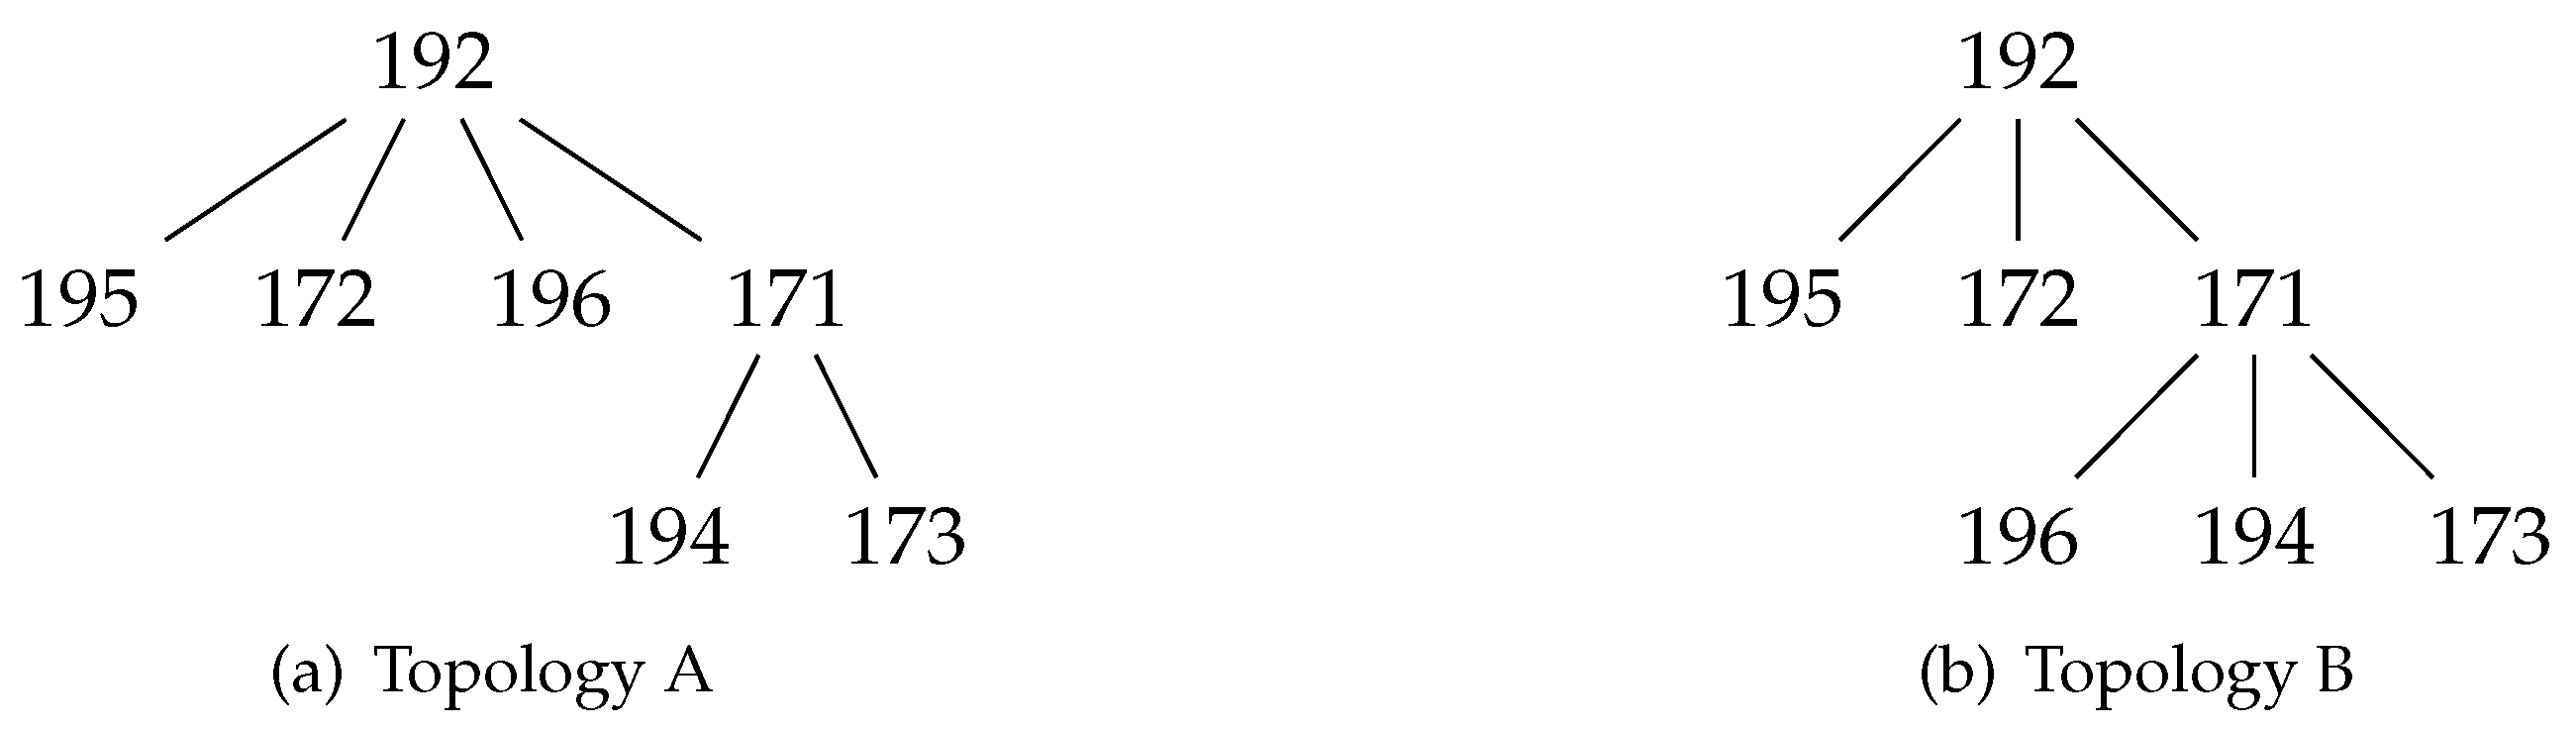
Four runs produced two network topologies, A and B, shown in Figure 24. The guard interval between scheduled packet receptions, depicted in Figure 20, was initially set to 200 for the first three experiments (Topology A–Run 1 and 2; Topology B–Run 1), but was increased to 500 for the final experiment (Topology B–Run 2), to assess its effect on network reliability.
The weather over the period of the experiments was highly variable, with the wind changing intensity and the water surface varying between almost flat calm and wave heights of up to .
The network established a topology using 171 as a relay node to 173 and 194. The channel from 194 to the hydrophone on shore near the gateway 192 was especially challenging; therefore, the packets from 194 had to be routed via a dual-hop connection.
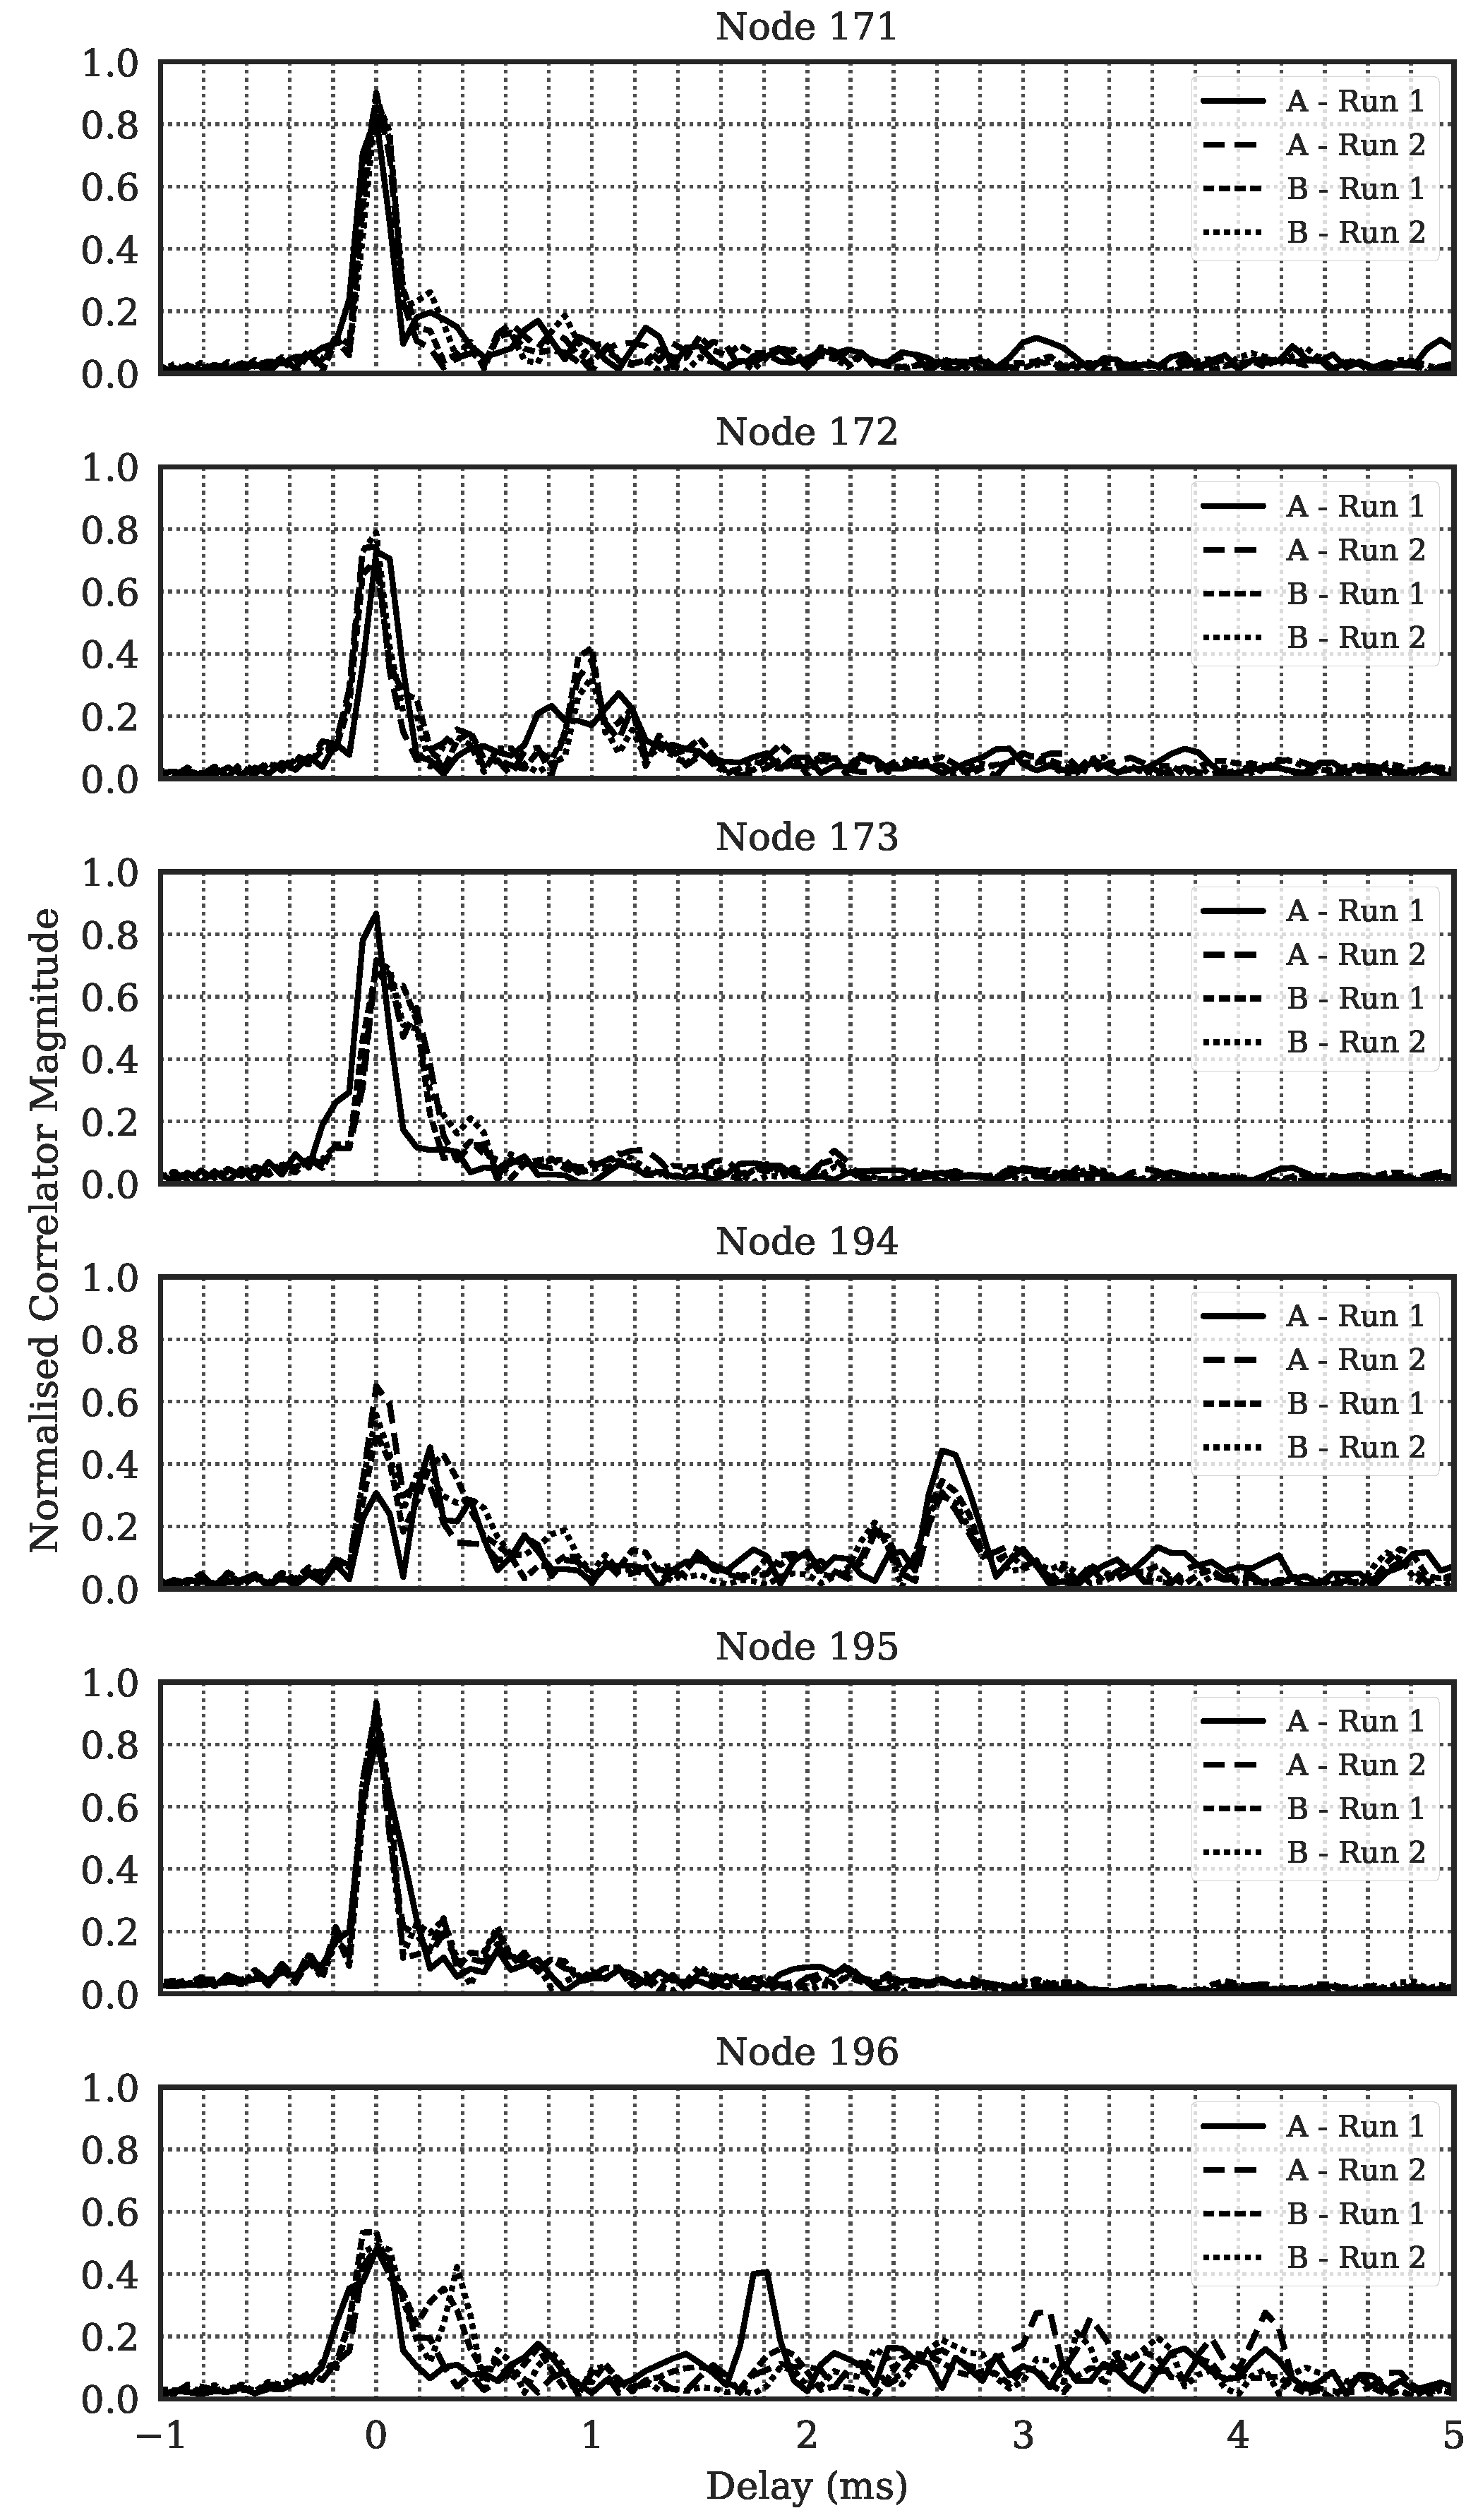
A number of the channel impulse responses of packets transmitted from the sensor nodes, observed on a reference hydrophone close to node 192, are shown in Figure 25. Nodes 171–173 and 195 show a strong first arrival and relatively little multipath energy. Between runs these channels appear stable. Nodes 194 and 196 however show very weak multiple arrivals arriving at 192. Again, these channels are quite consistent across multiple runs.
In every TDA-MAC frame a data response was expected from each node, either transmitted directly or routed via a relay node. The frame counts for each run and the end-to-end delivered data packet counts are shown in Table 4. For both topologies, A and B, the node 171 acted as a relay. Table 5 shows the packet statistics at the relay node 171.
Node 194 shows a decrease in performance in Topology A between Run 1 and 2 despite no change in guard interval. Node 196 results showed improvement when the topology changed to relay its packets via 171 rather than communicating directly with the gateway. The difference in results in Table 4 between Topology A and Topology B Run 2 shows a dramatic improvement in the packet delivery ratio for node 196, from 43–60% to 99%.
The high reliability of the dual-hop link with Node 196 was achieved with the increase in the guard interval from 200 to 500 . Between Topology B Run 1 and Run 2 as seen in the stats at the relay, Table 5, and henceforth at the gateway, in Table 4. Based on the order of node transmissions, it is likely that the Node 196 receiver was processing the header of the packet transmission from node 173 at the exact time that it was scheduled to transmit its own data packet. The NMv3 modem will not have responded to the request to transmit as it prioritises reception of an incoming packet. This provided us with a new insight into potential vulnerabilities of the TDA-MAC protocol, prompting another update to the future versions of this protocol, making it more robust in practical deployments. By increasing the guard interval it meant that the header of the incoming packet had completed processing, with the NMv3 modem discarding the remainder of the irrelevant packet and was now free to transmit on schedule.
7. Discussion
This paper has covered the development of the NMv3 acoustic modem from signal design to hardware receiver structures and a wide variety of real-world experiments.
The performance characteristics for the NMv3 modem are drawn from the various results throughout the paper and compared with the original NMv2 modem in Table 6. From the aims set out in Section 2 it is clear to see these have been achieved, with ranges of >2 in sea and lake underwater channels and greatly increased data throughput of 470 bit/ for 64 byte packets. The power consumption in receiver listening mode was still kept to a low value of and the same small dimensions were maintained. Ranging resolution for use in positioning and tracking applications was also improved from 10 to 5 due to the increased signal bandwidth.
Estimated unit manufacturing costs of £50 for the NMv3 make this acoustic modem a very attractive option for large-scale underwater distributed sensor networks with a long deployment life of >1 year possible from small alkaline battery packs. Modems have operated successfully for periods of up to 6 months in trials to date, validating the resilience of the low cost encapsulated construction.
Comparing the performance of the NMv3 experimental prototype acoustic modem with other commercial and research group developed modems, the NMv3 shows competitive performance of operating range for the acoustic frequency band used, even with the limited transmit power of and especially considering the very low receive power consumption [8]. When the communications performance and low power consumption is combined with the low manufacture cost, this is key for enabling dense underwater sensor networks and the internet of underwater things (IoUT) in scientific research fields.
8. Conclusions
The objective of greatly improving on the specification of the NMv2 modem without sacrificing any of its desirable properties has been achieved. The key criteria outlined in Section 2 of range, data rate, battery life, size, and cost have been met with the NMv3 modem. The signal design has produced waveforms that are noise-like and along with the low peak transmit power, this should mitigate the potential impact of large scale subsea sensor networks on marine mammals. Numerous field trials in a variety of locations, network configurations, and underwater environments have proven the reliability, flexibility, and capabilities of these modems.
9. Further Work
Long term testing (>6 months) of a large scale subsea sensor network (25 nodes) based on NMv3 modems was planned for spring/summer 2020 but had to be postponed due to the Covid 19 lockdown imposed in the UK from March 2020. This deployment took place over winter 2021/22 and aims to deliver a comprehensive analysis of modem and network performance in the demanding North Sea environment. Work continues to further enhance the performance of the modulation schemes, including alternative spreading sequence design to improve correlation properties, higher order modulation, and improved channel coding. Further optimisation of the receiver correlation engines, including programmable logic implementations, are being explored to reduce receiver power consumption towards a target of 1 .
Author Contributions
Conceptualization, B.S., N.M., J.N. and P.M.; methodology, B.S., N.M., J.N. and P.M.; software, B.S., J.N. and N.M.; validation, B.S., N.M., J.N. and P.M.; formal analysis, B.S., N.M., J.N. and P.M.; investigation, B.S., N.M., J.N. and P.M.; resources, B.S., N.M., J.N. and P.M.; data curation, B.S. and N.M.; writing—original draft preparation, B.S. and N.M.; writing—review and editing, B.S., N.M., J.N. and P.M.; visualization, B.S. and N.M.; supervision, J.N. and P.M.; project administration, B.S., N.M., J.N. and P.M.; funding acquisition, J.N. and P.M. All authors have read and agreed to the published version of the manuscript.
Funding
The research in this paper was supported by the UK Engineering and Physical Sciences Research Council (EPSRC) through the USMART project (EP/P017975/1).
Institutional Review Board Statement
Not applicable.
Informed Consent Statement
Not applicable.
Data Availability Statement
Not applicable.
Acknowledgments
The authors would like to thank the staff at Royal Quays Marina, North Shields; the SEA Lab team at Newcastle University; the staff and School of Marine Science for the use of the RV Princess Royal; and the Ocean Systems Laboratory team at Heriot-Watt University.
Conflicts of Interest
The authors declare no conflict of interest.
Abbreviations
The following abbreviations are used in this manuscript:
| AUV | Automated Underwater Vehicle |
| AWGN | Additive White Gaussian Noise |
| BER | Bit Error Rate |
| BPSK | Binary Phase-shift Keying |
| BT | Bandwidth-Time Product |
| IoUT | Internet of Underwater Things |
| M-OCK | M-ary Orthogonal Code Keying |
| MOS | M-ary Orthogonal Signalling |
| PWM | Pulse Width Modulation |
| QPSK | Quadrature Phase-shift Keying |
| SWaP-C | Size Weight and Power and Cost |
| TDA-MAC | Transmit Delay Allocation Media Access Control |
| XDCR | Transducer |
References
- ecoSUB Robotics Ltd. Company Website. Available online: https://web.archive.org/web/20200716112625/https://www.ecosub.uk/ (accessed on 16 July 2020).
- European Commission. Submarine Cultures Perform Long-Term Robotic Exploration of Unconventional Environmental Niches. Available online: https://cordis.europa.eu/project/id/640967 (accessed on 16 July 2020).
- PMEC. Microfloat—A Simple Underwater Robot for Distributed Sensing in Coastal Waters. Available online: https://web.archive.org/web/20200716112347/https://www.pmec.us/research-projects/microfloat (accessed on 16 July 2020).
- Harrison, T.W.; Noe, J.; Joslin, J.; Mundon, T.R.; Crisp, C.; Murphy, P.; Polagye, B.L. Design and Performance Benchmarking of the μFloat: A Buoyancy-actuated Float for Swarm Sensing in Coastal Waterways. In Proceedings of the Ocean Sciences Meeting 2020, San Diego, CA, USA, 16–21 February 2020. [Google Scholar]
- Fenucci, D.; Munafo, A.; Phillips, A.B.; Neasham, J.; Gold, N.; Sitbon, J.; Vincent, I.; Sloane, T. Development of smart networks for navigation in dynamic underwater environments. In Proceedings of the 2018 IEEE/OES Autonomous Underwater Vehicle Workshop (AUV), Porto, Portugal, 6–9 November 2018; pp. 1–6. [Google Scholar]
- Lončar, I.; Babić, A.; Arbanas, B.; Vasiljević, G.; Petrović, T.; Bogdan, S.; Mišković, N. A Heterogeneous Robotic Swarm for Long-Term Monitoring of Marine Environments. Appl. Sci. 2019, 9, 1388. [Google Scholar] [CrossRef] [Green Version]
- Climent, S.; Sanchez, A.; Capella, J.V.; Meratnia, N.; Serrano, J.J. Underwater acoustic wireless sensor networks: Advances and future trends in physical, MAC and routing layers. Sensors 2014, 14, 795–833. [Google Scholar] [CrossRef] [PubMed]
- Sendra, S.; Lloret, J.; Jimenez, J.M.; Parra, L. Underwater acoustic modems. IEEE Sens. J. 2015, 16, 4063–4071. [Google Scholar] [CrossRef]
- Sánchez, A.; Blanc, S.; Yuste, P.; Serrano, J. A low cost and high efficient acoustic modem for underwater sensor networks. In Proceedings of the OCEANS 2011 IEEE, Santander, Spain, 6–9 June 2011; pp. 1–10. [Google Scholar]
- Sánchez, A.; Blanc, S.; Yuste, P.; Perles, A.; Serrano, J.J. An ultra-low power and flexible acoustic modem design to develop energy-efficient underwater sensor networks. Sensors 2012, 12, 6837–6856. [Google Scholar] [CrossRef] [PubMed] [Green Version]
- Morozs, N.; Mitchell, P.D.; Zakharov, Y.; Mourya, R.; Petillot, Y.R.; Gibney, T.; Dragone, M.; Sherlock, B.; Neasham, J.A.; Tsimenidis, C.C.; et al. Robust TDA-MAC for practical underwater sensor network deployment: Lessons from USMART sea trials. In Proceedings of the Thirteenth ACM International Conference on Underwater Networks & Systems, Shenzhen, China, 3–5 December 2018; p. 11. [Google Scholar]
- Mandić, F.; Mišković, N.; Lončar, I. Underwater Acoustic Source Seeking Using Time-Difference-of-Arrival Measurements. IEEE J. Ocean. Eng. 2019, 45, 759–771. [Google Scholar] [CrossRef]
- Babic, A.; Vasiljevic, G.; Miskovic, N. Vehicle-in-the-loop framework for testing long-term autonomy in a heterogeneous marine robot swarm. IEEE Robot. Autom. Lett. 2020, 5, 4439–4446. [Google Scholar] [CrossRef]
- Morozs, N.; Mitchell, P.D.; Diamant, R. Scalable Adaptive Networking for the Internet of Underwater Things. IEEE Internet Things J. 2020, 7, 10023–10037. [Google Scholar] [CrossRef]
- Richardson, W.J.; Greene, C.R., Jr.; Malme, C.I.; Thomson, D.H. Marine Mammals and Noise; Academic Press: Cambridge, MA, USA, 1995. [Google Scholar]
- OSPAR Commission. Overview of the impacts of anthropogenic underwater sound in the marine environment. Report 2009, 441, 134. [Google Scholar]
- Lucke, K.; Siebert, U.; Lepper, P.A.; Blanchet, M.A. Temporary shift in masked hearing thresholds in a harbor porpoise (Phocoena phocoena) after exposure to seismic airgun stimuli. J. Acoust. Soc. Am. 2009, 125, 4060–4070. [Google Scholar] [CrossRef] [PubMed]
- Kastelein, R.; De Haan, D.; Vaughan, N.; Staal, C.; Schooneman, N. The influence of three acoustic alarms on the behaviour of harbour porpoises (Phocoena phocoena) in a floating pen. Mar. Environ. Res. 2001, 52, 351–371. [Google Scholar] [CrossRef]
- Kastelein, R.A.; Hoek, L.; Gransier, R.; Rambags, M.; Claeys, N. Effect of level, duration, and inter-pulse interval of 1–2 kHz sonar signal exposures on harbor porpoise hearing. J. Acoust. Soc. Am. 2014, 136, 412–422. [Google Scholar] [CrossRef] [PubMed]
- Kastelein, R.; Verboom, W.; Muijsers, M.; Jennings, N.; Van der Heul, S. The influence of acoustic emissions for underwater data transmission on the behaviour of harbour porpoises (Phocoena phocoena) in a floating pen. Mar. Environ. Res. 2005, 59, 287–307. [Google Scholar] [CrossRef] [PubMed]
- Kastelein, R.A.; van der Heul, S.; Verboom, W.C.; Triesscheijn, R.J.; Jennings, N.V. The influence of underwater data transmission sounds on the displacement behaviour of captive harbour seals (Phoca vitulina). Mar. Environ. Res. 2006, 61, 19–39. [Google Scholar] [CrossRef] [PubMed]
- Sherlock, B.; Neasham, J.A.; Tsimenidis, C.C. Spread-Spectrum Techniques for Bio-Friendly Underwater Acoustic Communications. IEEE Access 2018, 6, 4506–4520. [Google Scholar] [CrossRef]
- Sherlock, B. Spread-Spectrum Techniques for Environmentally-Friendly Underwater Acoustic Communications. Ph.D. Thesis, Newcastle University, Newcastle upon Tyne, UK, 2018. [Google Scholar]
- Sherlock, B.; Tsimenidis, C.C.; Neasham, J.A. Signal and receiver design for low-power acoustic communications using M-ary orthogonal code keying. In Proceedings of the OCEANS 2015, Genova, Italy, 18–21 May 2015; pp. 1–10. [Google Scholar]
- Neasham, J.A.; Goodfellow, G.; Sharphouse, R. Development of the Seatrac miniature acoustic modem and USBL positioning units for subsea robotics and diver applications. In Proceedings of the OCEANS 2015, Genova, Italy, 18–21 May 2015; pp. 1–8. [Google Scholar]
- Kastelein, R.; Rippe, H.; Vaughan, N.; Schooneman, N.; Verboom, W.; Haan, D.D. The effects of acoustic alarms on the behavior of harbor porpoises (Phocoena phocoena) in a floating pen. Mar. Mammal Sci. 2000, 16, 46–64. [Google Scholar] [CrossRef]
- Proakis, J.G.; Salehi, M. Digital Communications; McGraw-Hill: New York, NY, USA, 2008. [Google Scholar]
- John R. Barry, J.R.; Lee, E.A.; Messerschmitt, D.G. Digital Communication, 3rd ed.; Springer: Berlin/Heidelberg, Germany, 2004. [Google Scholar]
- Reed, I.S.; Solomon, G. Polynomial codes over certain finite fields. J. Soc. Ind. Appl. Math. 1960, 8, 300–304. [Google Scholar] [CrossRef]
- Lowes, G.J.; Neasham, J.A.; Burnett, R.; Tsimenidis, C.C. Low Energy, Passive Acoustic Sensing for Wireless Underwater Monitoring Networks. In Proceedings of the OCEANS 2019 MTS/IEEE SEATTLE, Seattle, WA, USA, 27–31 October 2019; pp. 1–9. [Google Scholar]
- Lowes, G.J.; Neasham, J.; Burnett, R.; Sherlock, B.; Tsimenidis, C. Passive Acoustic Detection of Vessel Activity by Low-Energy Wireless Sensors. J. Mar. Sci. Eng. 2022, 10, 248. [Google Scholar] [CrossRef]
- Neasham, J.; Lowes, G. Impact of United Kingdom lockdown on subsea noise from vessel propulsion. J. Acoust. Soc. Am. 2021, 149, A28. [Google Scholar] [CrossRef]
- Morozs, N.; Mitchell, P.; Zakharov, Y.V. TDA-MAC: TDMA without clock synchronization in underwater acoustic networks. IEEE Access 2018, 6, 1091–1108. [Google Scholar] [CrossRef]
- Morozs, N.; Mitchell, P.D.; Zakharov, Y. Routing Strategies for Dual-Hop TDA-MAC: Trade-Off Between Network Throughput and Reliability. In Proceedings of the UACE’19, Hersonissos, Greece, 30 June–5 July 2019; pp. 303–310. [Google Scholar]
- Morozs, N.; Mitchell, P.D.; Zakharov, Y. Dual-Hop TDA-MAC and Routing for Underwater Acoustic Sensor Networks. IEEE J. Ocean Eng. 2019, 44, 865–880. [Google Scholar] [CrossRef] [Green Version]
Figure 1.
Block Diagram for Signal Generation.

Figure 2.
Cross-correlation statistics for 50 chip subsequences of 16 × 8191 chip binary m-sequence set with (a) zero lag, (b) 1 chip lag, (c) 25 chip lag, (d) 50 chip (1 symbol) lag.
Figure 2.
Cross-correlation statistics for 50 chip subsequences of 16 × 8191 chip binary m-sequence set with (a) zero lag, (b) 1 chip lag, (c) 25 chip lag, (d) 50 chip (1 symbol) lag.

Figure 3.
Block Diagram for Ideal Receiver Design.

Figure 4.
Upper Bound BER vs. for M-ary Orthogonal Signaling (MOS) generated using the formula by Proakis [27], as shown by Sherlock et al. [22]. With various values of M ranging from 2 to 256. For M the value used is M.

Figure 5.
Simulated BER vs. for 16-OCK BPSK in AWGN + multipath channels. Multipath configurations: (A,B,C), where position A = 2, B = 34, C = 67 chips delay. The value indicates relative amplitude compared to the direct path.
Figure 5.
Simulated BER vs. for 16-OCK BPSK in AWGN + multipath channels. Multipath configurations: (A,B,C), where position A = 2, B = 34, C = 67 chips delay. The value indicates relative amplitude compared to the direct path.

Figure 6.
Simulated BER vs. SNR for 16-OCK BPSK in AWGN + multipath channels. Multipath configurations: (A,B,C), where position A = 2, B = 34, C = 67 chips delay. The value indicates relative amplitude compared to the direct path.
Figure 6.
Simulated BER vs. SNR for 16-OCK BPSK in AWGN + multipath channels. Multipath configurations: (A,B,C), where position A = 2, B = 34, C = 67 chips delay. The value indicates relative amplitude compared to the direct path.

Figure 7.
Photo of NMv3 PCB. Dimensions: by .

Figure 8.
Photo of (a) NMv3 Assembly, and (b) Potted NMv3. Crystal outer diameter: 34 . Potted NMv3 length: 60 , diameter: 42 .
Figure 8.
Photo of (a) NMv3 Assembly, and (b) Potted NMv3. Crystal outer diameter: 34 . Potted NMv3 length: 60 , diameter: 42 .

Figure 9.
Block diagram for the NMv3 hardware design.

Figure 10.
NMv3 packet structure.

Figure 11.
Block diagram for the hardware receiver design.

Figure 12.
Simulated packet error rate vs. SNR for 16-OCK BPSK in AWGN + multipath channels. Multipath configurations: (A,B,C), where position A = 2, B = 34, C = 67 chips delay. The value indicates relative amplitude compared to the direct path.
Figure 12.
Simulated packet error rate vs. SNR for 16-OCK BPSK in AWGN + multipath channels. Multipath configurations: (A,B,C), where position A = 2, B = 34, C = 67 chips delay. The value indicates relative amplitude compared to the direct path.

Figure 13.
Loch Ness channel impulse responses for range trials.

Figure 14.
North Sea channel impulse responses for range trials.

Figure 15.
Map of Nodes in North Sea. Two NanoPAM nodes of address 67 and 68. One BDV1 node present from November 2019 to February 2020. One BDV2 node of address 250 present from February 2020 onwards.
Figure 15.
Map of Nodes in North Sea. Two NanoPAM nodes of address 67 and 68. One BDV1 node present from November 2019 to February 2020. One BDV2 node of address 250 present from February 2020 onwards.

Figure 16.
NM packets received per day. Mid-winter solar levels being low meant that there were periods where the buoy was powered down.
Figure 16.
NM packets received per day. Mid-winter solar levels being low meant that there were periods where the buoy was powered down.

Figure 17.
NM software defined receiver packets received per day. A power outage disabled the network from 6th April to 7th April.
Figure 17.
NM software defined receiver packets received per day. A power outage disabled the network from 6th April to 7th April.

Figure 18.
NM SDR NanoPAM packet and message success per day and per hour. Analysis is over the duration of 13 March 2020 to 14 April 2020. The receiver infrastructure suffered downtime due to building power failure 6 April 2020 to 9 April 2020. Accounting for receiver downtime, a total of 648 messages were expected from each sensor. Of 1296 expected messages, a total of 7 were lost, giving a message success rate of 99.5%.

Figure 19.
Channel impulse responses for failed messages showing particularly severe multipath channels.
Figure 19.
Channel impulse responses for failed messages showing particularly severe multipath channels.

Figure 20.
TDA-MAC packet flow example, where a single gateway or relay node gathers data from three directly connected sensor nodes [34].
Figure 20.
TDA-MAC packet flow example, where a single gateway or relay node gathers data from three directly connected sensor nodes [34].

Figure 21.
Sequential Dual-Hop TDA-MAC protocol [34]. The gateway node first gathers data packets from directly connected non-relay nodes using single-hop TDA-MAC, as depicted in Figure 20. It then instructs every relay node (sequentially) to gather data within its network branch (also using single-hop TDA-MAC) and relay it back to the gateway.

Figure 22.
Map of nodes with addresses in Loch Earn. One gateway node (192) positioned at the wharf. Six sensor nodes distributed in the loch.
Figure 22.
Map of nodes with addresses in Loch Earn. One gateway node (192) positioned at the wharf. Six sensor nodes distributed in the loch.

Figure 23.
Underwater acoustic sensor nodes used in the Loch Earn experiments: Raspberry Pi 3B+/Zero encapsulated in a 3 BlueRobotics enclosure, with external connections to a temperature and pressure (T&P) sensor and the NMv3 acoustic modem.
Figure 23.
Underwater acoustic sensor nodes used in the Loch Earn experiments: Raspberry Pi 3B+/Zero encapsulated in a 3 BlueRobotics enclosure, with external connections to a temperature and pressure (T&P) sensor and the NMv3 acoustic modem.

Figure 24.
Loch Earn network topologies, A and B.

Figure 25.
Loch Earn channel impulse response of packets as observed at the shore near 192. A packet for each run is shown.
Figure 25.
Loch Earn channel impulse response of packets as observed at the shore near 192. A packet for each run is shown.


Table 1.
NMv2 Characteristics and performance.
| Parameter | Value |
|---|---|
| Operating Frequency Band | 24 to 28 |
| Data Rate | 40 bit/ |
| Payload | Fixed 7 bytes |
| Transmit Power SL (W) | 168 dB re 1 μ @ 1 ( ) |
| Receiver Power Consumption | 10 |
| Operating Range | Up to 2 |
| Range Resolution | 10 |
| Interface | RS232 at 9600 baud |
Table 2.
Packet message header structure.
| LFM (UP/DN) | Payload Length | CMD | Address (Src/Dest) | Packet Type |
|---|---|---|---|---|
| UP | 0 | 0 | Dest | Ping Request |
| DN | 0 | 1 | Src | Ack / Ping Response |
| UP | 0 | 2 | Dest | Test Message Request |
| UP | 0 | 3 | Dest | VBatt Request |
| UP | 1–63 | 0 | Dest | Unicast Message |
| UP | 1–63 | 1 | Src | Broadcast Message |
| UP | 1–63 | 2 | Dest | Unicast Message With Ack Request |
| UP | 1–63 | 3 | Dest | Echo Message Request |
Table 3.
Power consumption.
| Operating Mode | Measured Current @ 5 V | Power Consumption |
|---|---|---|
| Receive: Listening | 2.5 | 12.5 |
| Receive: Demodulate | 5 | 25 |
| Transmit | 300 | 1.5 |
| Sleep | 240 μ | 1.2 |
Table 4.
End-to-end packet delivery statistics at the gateway node.
| Node Addresses | |||||||
|---|---|---|---|---|---|---|---|
| Topology | Frames | 171 | 172 | 173 | 194 | 195 | 196 |
| A–Run 1 | 173 | 171 | 169 | 169 | 173 | 169 | 103 |
| 99% | 98% | 98% | 100% | 98% | 60% | ||
| A–Run 2 | 14 | 14 | 14 | 14 | 7 | 14 | 6 |
| 100% | 100% | 100% | 50% | 100% | 43% | ||
| B–Run 1 | 28 | 28 | 27 | 27 | 26 | 28 | 6 |
| 100% | 96% | 96% | 93% | 100% | 21% | ||
| B–Run 2 | 96 | 94 | 96 | 96 | 78 | 96 | 95 |
| 98% | 100% | 100% | 81% | 100% | 99% | ||
Table 5.
Packet statistics at the relay node 171.
| REQ Packets Received | Data Packets Received | |||||
|---|---|---|---|---|---|---|
| Topology | Frames | Broadcast | Unicast | N173 | N194 | N196 |
| A–Run 1 | 173 | 173 | 173 | 171 | 173 | - |
| 100% | 100% | 99% | 100% | |||
| A–Run 2 | 14 | 14 | 14 | 14 | 17 | - |
| 100% | 100% | 100% | 50% | |||
| B–Run 1 | 28 | 28 | 28 | 27 | 26 | 6 |
| 100% | 100% | 96% | 93% | 21% | ||
| B–Run 2 | 96 | 94 | 96 | 96 | 78 | 95 |
| 98% | 100% | 100% | 81% | 99% | ||
Table 6.
NMv2 and NMv3 characteristics and performance.
| NMv2 | NMv3 | |
|---|---|---|
| Operating Frequency Band | 24 to 28 | 24 to 32 |
| Data Rate | 40 bit/s raw, 30 bit/s net | 640 bit/s raw, 470 bit/s net |
| Payload | Fixed 7 bytes | Variable 2 bytes to 64 bytes |
| Payload FEC | None (CRC only) | RS 16 parity bytes |
| Transmit Power SL (W) | 168 dB re 1 μ @ 1 ( ) | 168 dB re 1 μ @ 1 ( ) |
| Receiver Listening Power Consumption | 10 | |
| Operating Range | Up to 2 | Up to |
| Range Resolution | 10 | 5 |
| Interface | RS232 at 9600 baud | RS232 at 9600 baud |
Publisher’s Note: MDPI stays neutral with regard to jurisdictional claims in published maps and institutional affiliations. |
© 2022 by the authors. Licensee MDPI, Basel, Switzerland. This article is an open access article distributed under the terms and conditions of the Creative Commons Attribution (CC BY) license (https://creativecommons.org/licenses/by/4.0/).
Share and Cite
MDPI and ACS Style
Sherlock, B.; Morozs, N.; Neasham, J.; Mitchell, P. Ultra-Low-Cost and Ultra-Low-Power, Miniature Acoustic Modems Using Multipath Tolerant Spread-Spectrum Techniques. Electronics 2022, 11, 1446. https://doi.org/10.3390/electronics11091446
AMA Style
Sherlock B, Morozs N, Neasham J, Mitchell P. Ultra-Low-Cost and Ultra-Low-Power, Miniature Acoustic Modems Using Multipath Tolerant Spread-Spectrum Techniques. Electronics. 2022; 11(9):1446. https://doi.org/10.3390/electronics11091446
Chicago/Turabian StyleSherlock, Benjamin, Nils Morozs, Jeffrey Neasham, and Paul Mitchell. 2022. "Ultra-Low-Cost and Ultra-Low-Power, Miniature Acoustic Modems Using Multipath Tolerant Spread-Spectrum Techniques" Electronics 11, no. 9: 1446. https://doi.org/10.3390/electronics11091446
Note that from the first issue of 2016, this journal uses article numbers instead of page numbers. See further details here.