Article

An Approximate Mixed-Integer Convex Model to Reduce Annual Operating Costs in Radial Distribution Networks Using STATCOMs

by
Oscar Danilo Montoya
1,2,*,
Lázaro Alvarado-Barrios
3 and
Jesus C. Hernández
4,*
1
Facultad de Ingeniería, Universidad Distrital Francisco José de Caldas, Bogotá 110231, Colombia
2
Laboratorio Inteligente de Energía, Universidad Tecnológica de Bolívar, Cartagena 131001, Colombia
3
Department of Engineering, Universidad Loyola Andalucía, 41704 Sevilla, Spain
4
Department of Electrical Engineering, Campus Lagunillas s/n, University of Jaén, Edificio A3, 23071 Jaén, Spain
*
Authors to whom correspondence should be addressed.
Electronics 2021, 10(24), 3102; https://doi.org/10.3390/electronics10243102
Submission received: 26 October 2021 / Revised: 22 November 2021 / Accepted: 10 December 2021 / Published: 13 December 2021

Abstract

:
The problem of optimal siting and sizing of distribution static compensators (STATCOMs) is addressed in this research from the point of view of exact mathematical optimization. The exact mixed-integer nonlinear programming model (MINLP) is decoupled into two convex optimization sub-problems, named the location problem and the sizing problem. The location problem is addressed by relaxing the exact MINLP model, assuming that all the voltages are equal to 1 0 , which allows obtaining a mixed-integer quadratic programming model as a function of the active and reactive power flows. The solution of this model provides the best set of nodes to locate all the STATCOMs. When all the nodes are selected, it solves the optimal reactive power problem through a second-order cone programming relaxation of the exact optimal power flow problem; the solution of the SOCP model provides the optimal sizes of the STATCOMs. Finally, it refines the exact objective function value due to the intrinsic non-convexities associated with the costs of the STATCOMs that were relaxed through the application of Taylor’s series expansion in the location and sizing stages. The numerical results in the IEEE 33- and 69-bus systems demonstrate the effectiveness and robustness of the proposed optimization problem when compared with large-scale MINLP solvers in GAMS and the discrete-continuous version of the vortex search algorithm (DCVSA) recently reported in the current literature. With respect to the benchmark cases of the test feeders, the proposed approach reaches the best reductions with 14.17 % and 15.79 % in the annual operative costs, which improves the solutions of the DCVSA, which are 13.71 % and 15.30 % , respectively.

1. Introduction

Electrical distribution networks represent the largest portion of power systems, which are entrusted with providing electrical energy from a transmission/sub-transmission substation to all end-users at medium- and low-voltage levels [1,2]. Owing to economic restrictions, investment distribution networks are typically constructed with radial configurations since this allows reducing inversion in the infrastructure, simplifying also the protective devices’ coordination [3]. However, the radial structure of these systems implies that they experience high power and energy losses when compared with transmission systems, being that the energy losses in these grids are between 6% and 18% of the total power input at the substation bus, while in transmissions networks, these are between 1.5% and 2.0% [4,5].
Owing to the high energy losses in distribution networks, utilities implement different methodologies to reduce them as much as possible. Some recurrent strategies are the optimal location of fixed-step capacitor banks [6,7,8]; optimal grid reconfiguration [9,10]; optimal siting and sizing of dispersed generators [11,12]; optimal siting and sizing of battery energy storage systems [13,14]; and reactive power compensation via distribution static compensators, i.e., STATCOMs [15,16,17]. In the case of fixed-step capacitor banks, these are attractive technologies due to their low cost and high reliability; however, these devices inject reactive power in discrete steps, which implies that, due to the daily load variability, the total grid power losses are not completely minimized. The strategies that use the grid reconfiguration to minimize power losses are efficient regarding the percentage of energy losses reduction; however, these require important modifications of the grid topology, including new line construction and redesign of the protective devices schemes, which is more expensive when compared with shunt reactive power compensation. The optimal integration of dispersed generators based on renewables is undoubtedly the most efficient option to reduce the total energy losses of the network, especially when active and reactive power capabilities of these devices are used [12]. However, from an economical point of view, the main application of the renewables is a reduction in greenhouse gas emissions and the reduction in the total energy purchasing costs in the substation buses. In the case of batteries, these devices help with the total energy losses reduction. However, their investment costs are bigger when compared with shunt reactive power compensation; the main application of the batteries is to extend the usability of the renewables in periods of time with high demand and low generation [18]. Finally, STATCOMs are excellent devices to reduce the amount of grid energy losses costs, with the main advantage that these can inject variable reactive power as a function of the grid load behavior, even if these are more expensive that the capacitor banks; these allow important improvements in the total annual grid operation costs. Moreover, these devices present useful life times of about 25 years, with minimum maintenance costs, which make these appropriate devices for improving the grid performance regarding energy losses and voltage profiles [19].
In the current literature regarding STATCOMs and their usage in distribution systems applications, some of the most relevant works are discussed below. Authors of [16] presented the application of the discrete-continuous version of the vortex-search algorithm (DCVSA), where the discrete part is entrusted with determining the nodes where the STATCOMs must be located and the continuous part defines their optimal sizes. Numerical results demonstrated that the DCVSA approach reaches the best optimal solution in the IEEE 33- and 69-bus systems when compared with the GAMS optimization package. Authors of [17] presented a complete revision of the strategies used to locate and size STATCOMs in distribution grids by making a classification in five categories, including analytical methods, artificial neural network-based approaches, metaheuristic methods, sensitivity approaches, and a combination of sensitivity approaches and metaheuristic methods. The main contribution of this research is the revision of the complete revision of the state of the art regarding distribution static compensators and their applications to improve the distribution system performance. In [20] was proposed a hybrid optimization approach based on the classical Chu and Beasley genetic algorithm in the master optimization stage that determines the nodes where the STATCOMs must be installed, while the slave stage uses a second-order cone programming reformulation of the multiperiod optimal power flow problem to determine their optimal sizes. Numerical results demonstrate the efficiency of the proposed approach when compared with the GAMS solvers in the IEEE 33- and 69-bus systems. Castiblanco-Pŕez et al. in [4] proposed the application of the discrete-continuous version of the Chu and Beasley genetic algorithm to locate and size STACOMs in distribution networks, with numerical results comparable with the DCVSA reported in [16]. The main contribution of the authors was the usage of differentiated load zones classified in residential, commercial, and industrial users, including the possibility of having radial and mesh distribution system topologies. Computational validations were made in the IEEE 33-bus systems, and numerical results demonstrated the possibility of having high-quality solutions when compared with the MINLP solvers available in the GAMS optimization package.
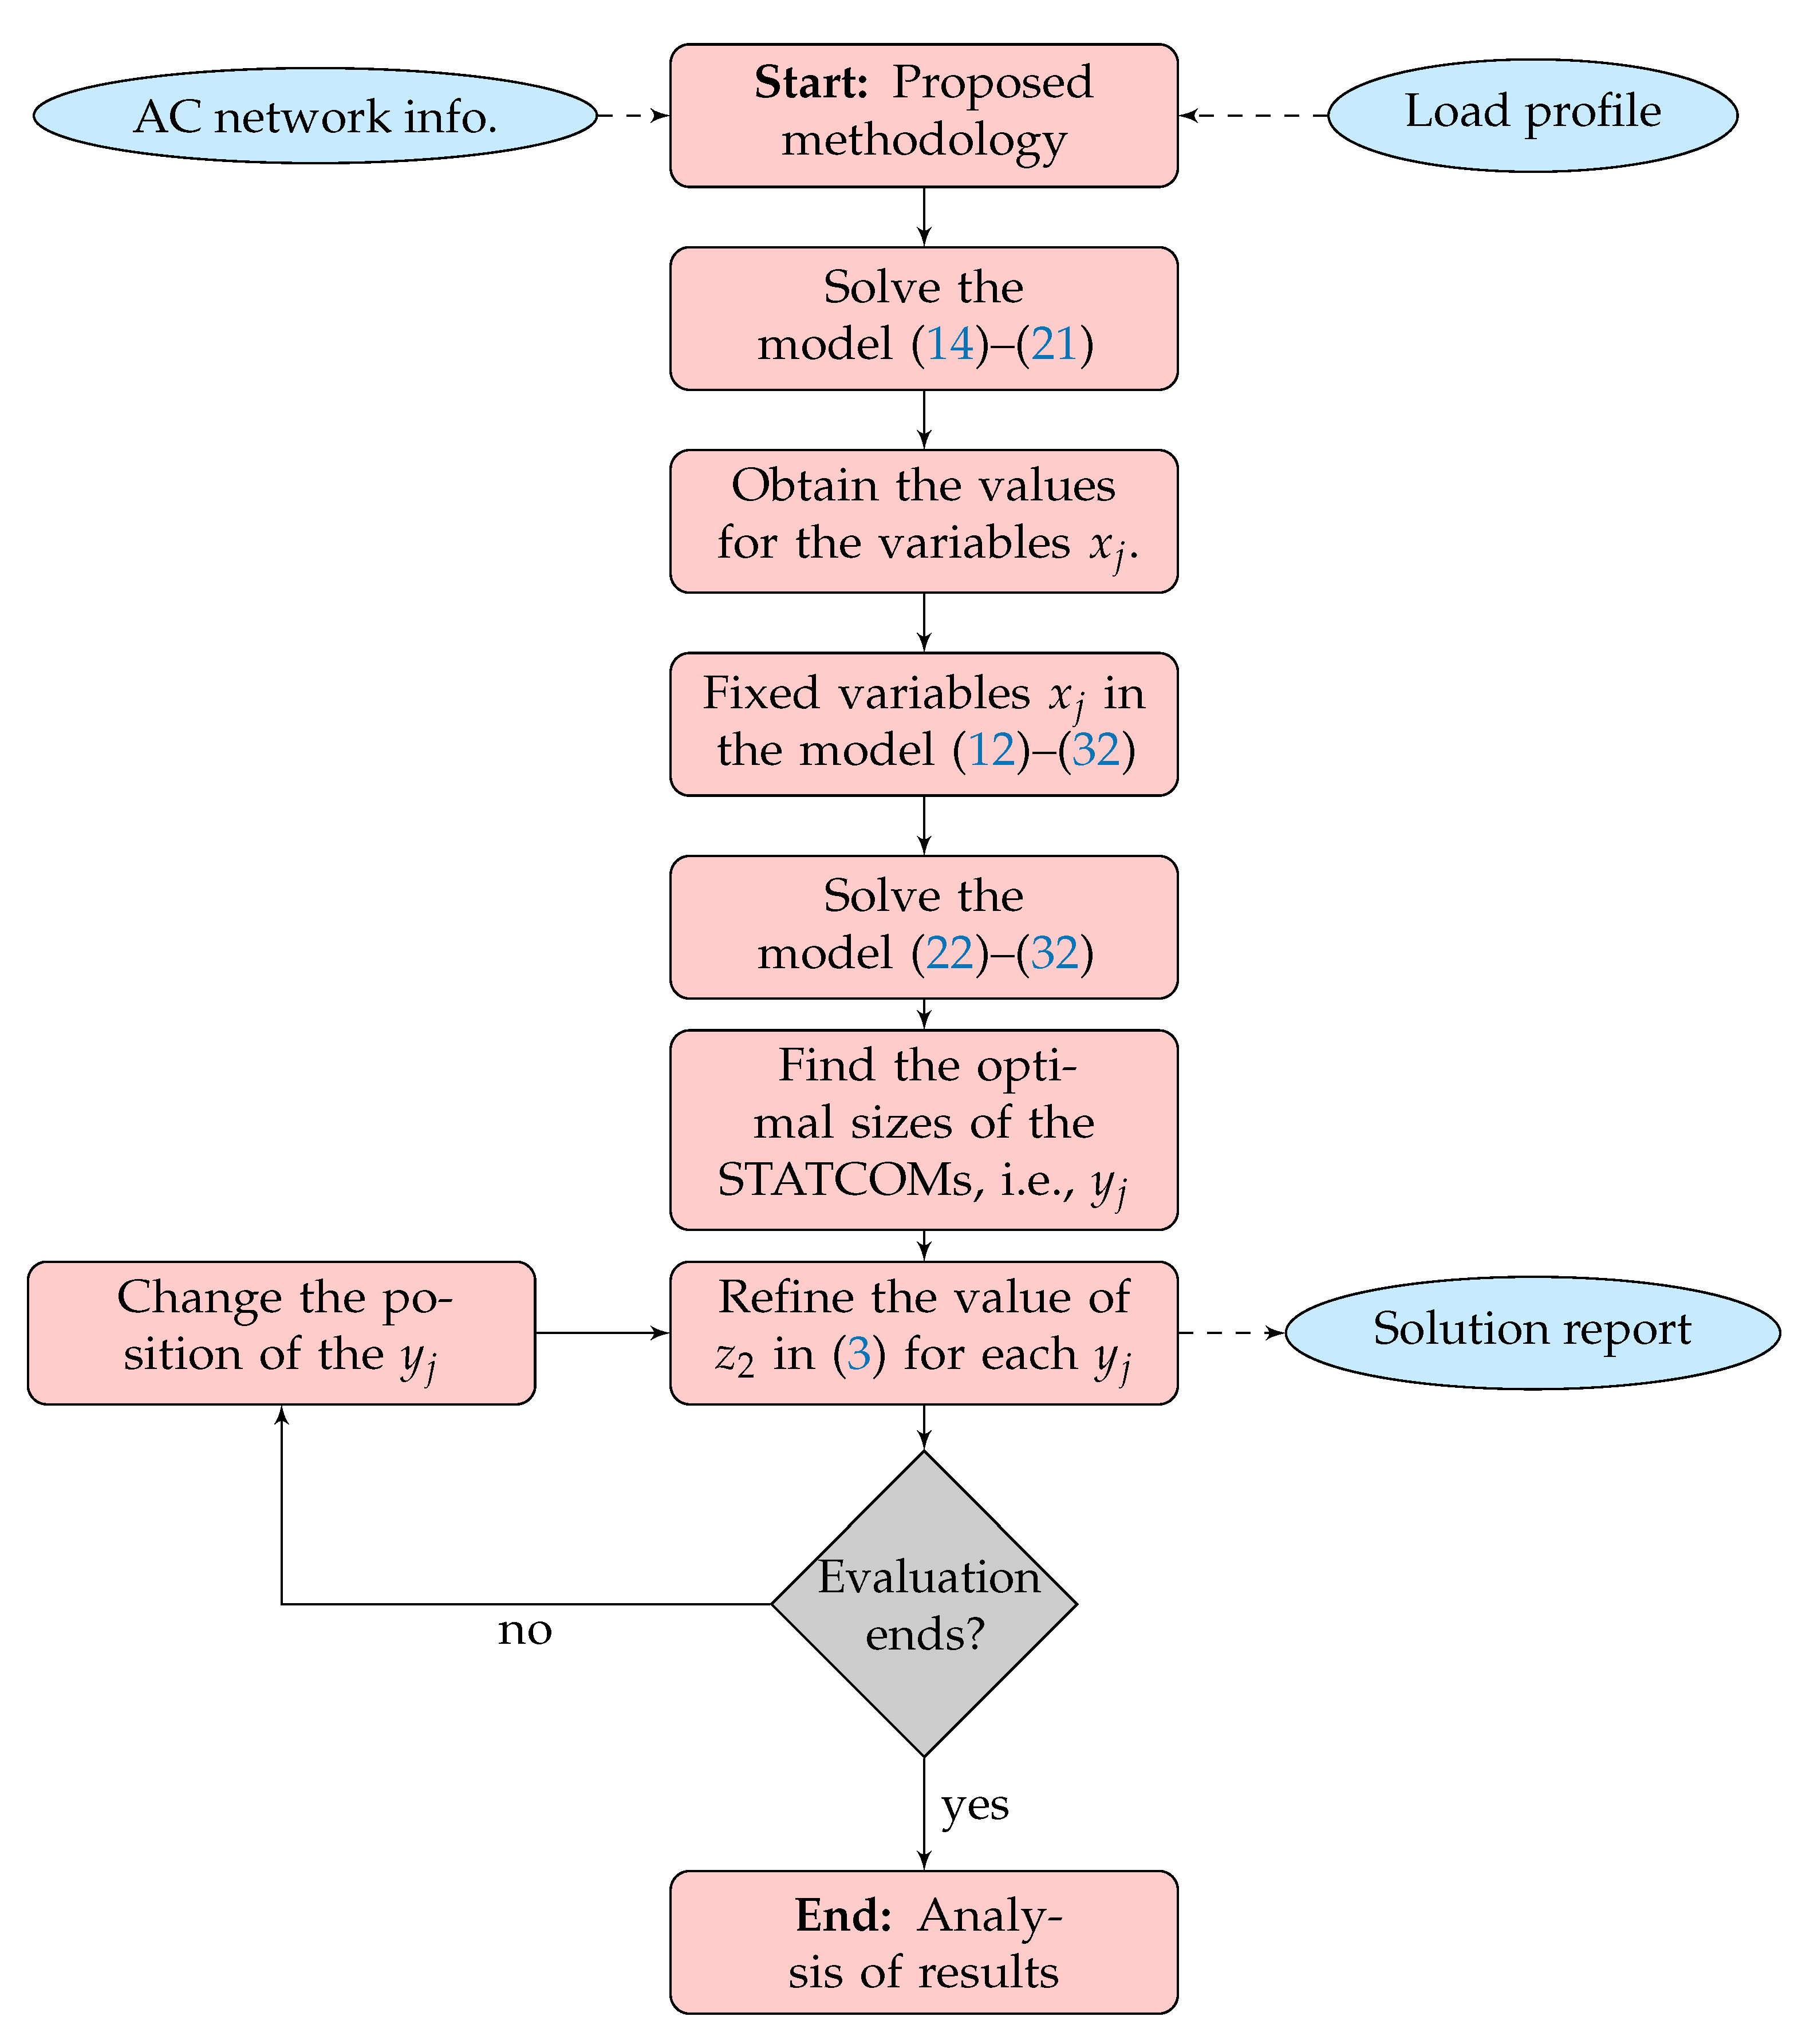
Even if the previous optimization methodologies are efficient to solve the problem addressed in this research, these have two main problems, which are (i) the usage of combinatorial methods to locate and size the STATCOMs since their random exploration and exploitative nature through the solution space makes it impossible to ensure the global optimum finding, and (ii) in the case of the exact MINLP approaches, the main complication is associated with the non-convexity of the solution space in their continuous component that highly increases the possibility of staying stuck in local optimal solutions. To deal with these problems, this research proposes a new methodology based on the hybridization of two convex-based models. The proposed methodology is completely described below.
Unlike aforementioned works regarding the optimal siting and dimensioning of STATCOMs in distribution networks, in this research, we propose a new optimization methodology based on mixed-integer convex optimization that decouples the location problem from the sizing problem. To solve the location problem, a mixed-integer quadratic formulation is employed considering that the voltage profiles are equal to 1.0 0 . This becomes the power balance equations in a set of linear equations that becomes the location problem into a mixed-integer approximation that ensures the optimality of the solution. The solution of the location problem allows fixing the values of the binary variables in the sizing problem. The assignation of the binary variables allow solving the sizing problem of the STATCOMs via the second-order cone programming reformulation proposed in [20] with the main advantage that the global optimum finding is ensured via convex optimization. Numerical results in the IEEE 33- and 69-bus systems demonstrate the effectiveness and robustness of the proposed optimization approach when compared with the DCVSA and the MINLP solvers in GAMS.
The main contributions of this research are the following:
  • The presentation of a new optimization methodology to solve separately the problems of optimal location and sizing of STATCOMs in distribution networks to reduce the annual operative costs of the network, where the location problem is solved through a mixed-integer quadratic formulation, and the sizing stage is addressed with a second-order cone programming equivalent.
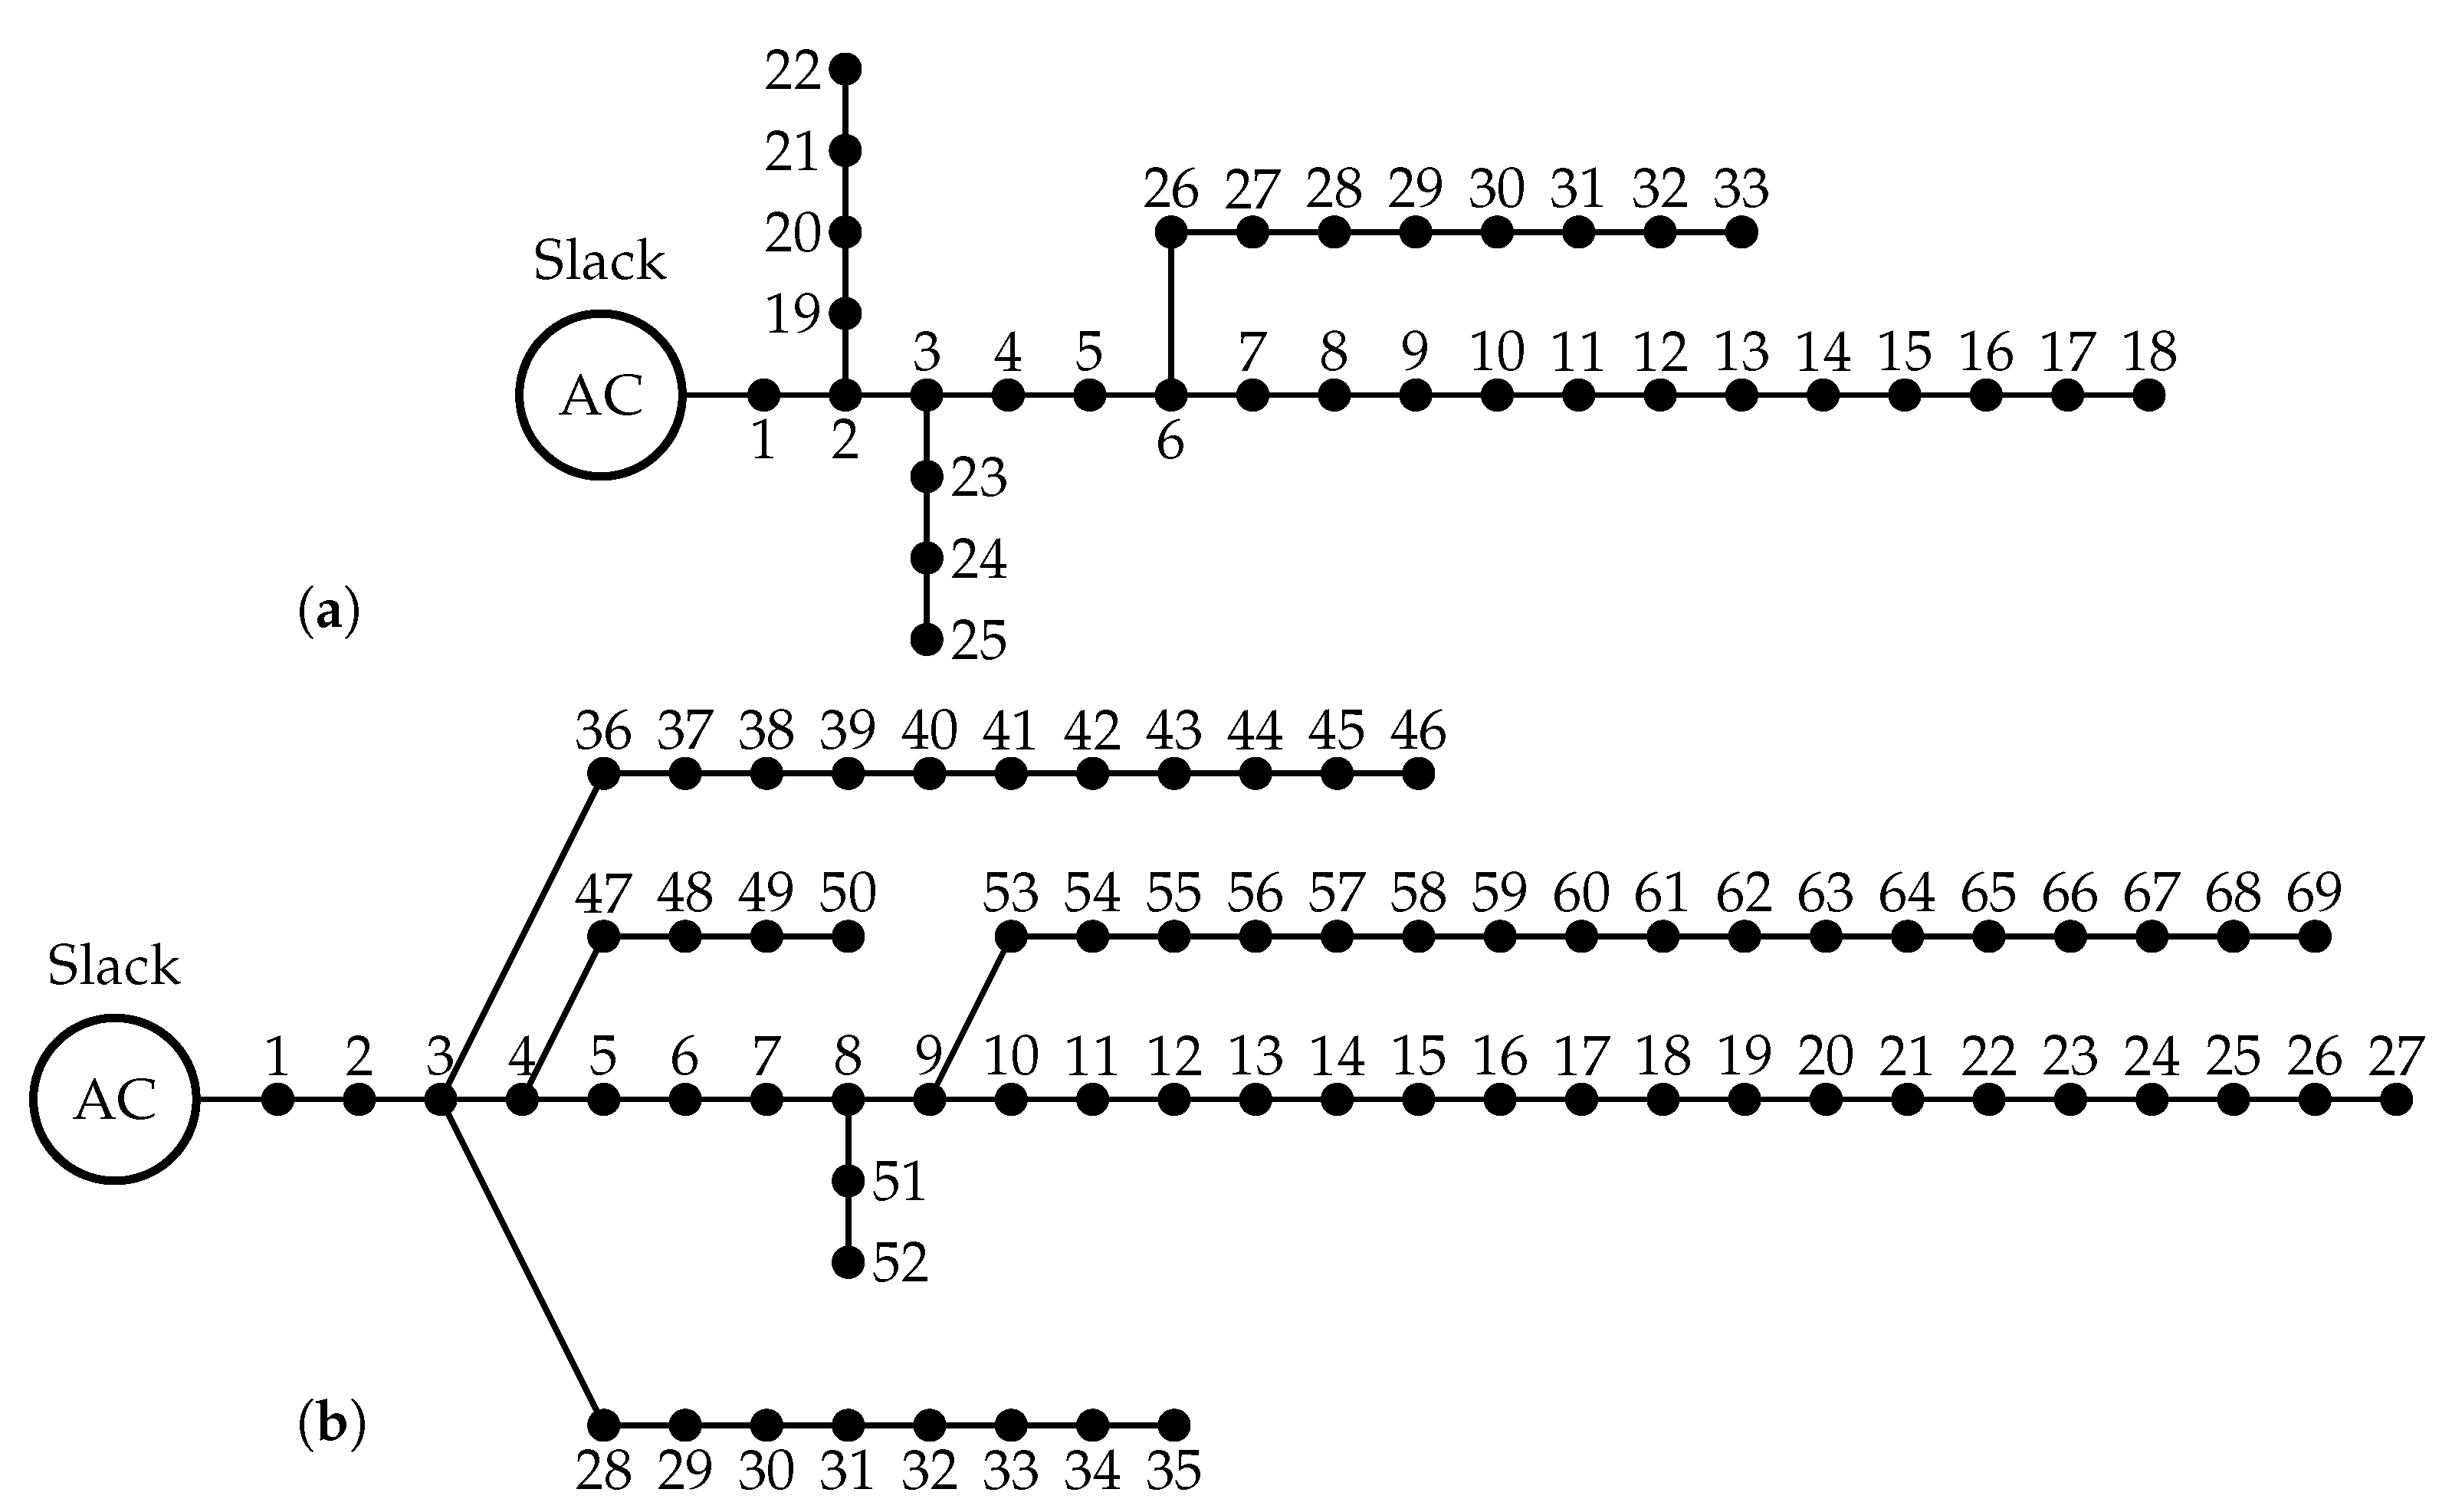
  • The validation of the proposed methodology in two classical test feeders composed of 33 and 69 nodes with better results than the best current approach reported in the current literature, i.e., the discrete-continuous version of the vortex search algorithm.
It is worth mentioning that in the scope of this research, distribution networks with meshed structures are not considered since the second-order cone programming reformulation of the optimal power flow problem proposed in [21] only deals with purely-radial distribution grids; however, this can be taken as a opportunity of research in future works.
The proposed decoupled optimization approaches to solve the problem of the location and sizing of STATCOMs in distribution networks based on mixed-integer convex and conic programming was not previously proposed in the current literature. This was identified as a gap in the current literature that this research work is aiming to fulfill.
This document is structured as follows: Section 2 presents the general optimization problem regarding the optimal placement and sizing of STATCOMs in distribution grids with a radial structure. Section 3 presents the main aspects of the proposed solution methodology based on decoupling the location from the sizing problem via mixed-integer quadratic and second-order cone programming. Section 4 shows the main characteristics of the IEEE 33- and 69-bus systems, including the parametrization of the costs function of the STATCOMs. Section 5 presents the main numerical results of the proposed solution methodology and their comparison with recent literature reports. Section 6 lists the main conclusions obtained from this research and defines some possible future works.

2. Optimization Problem

The problem of the optimal siting and sizing of STATCOMs in distribution networks corresponds to a mixed-integer nonlinear programming (MINLP) problem that involves binary variables associated with the location or not of a STATCOM in a particular node, and continuous variables regarding power flow equations, voltages and currents, among others. The complete MINLP model is presented below.

2.1. Objective Function

The objective function for the problem of the optimal annual cost reduction in distribution networks considering STATCOMs corresponds to the minimization of the energy losses cost in conjunction with the total investment cost. The objective function can be formulated as follows:
min A cost = z 1 + z 2 ,
z 1 = C kWh T i j L h H R i j i i j , h 2 Δ h ,
z 2 = T k 1 k 2 j N α y j 2 + β y j + γ y j ,
where A cost is the objective function value regarding the summation of the annual operating and investment costs; z 1 is the value of the annual operative costs of the grid associated with the energy losses; z 2 is a cubic function regarding the investment costs in STATCOMs; C kWh is the average cost of the energy losses; T is the number of days in an ordinary year (i.e., 365 days); R i j is the resistance parameter associated with the line that connects nodes i and j; i i j is the current magnitude that flows through this line; Δ h is the length of the period of time where electrical variables are constant (typically 0.25 h, 0.50 h, or 1 h); k 1 and k 2 are parameters associated with the annualization of investment costs of the STATCOMs; and α , β , and γ are the cubic, quadratic, and linear costs coefficients associated with the size y j assigned to the STATCOM connected at node j. Note that L , H , and N , are the sets that contain all the lines, periods of time, and nodes of the networks, respectively.
Remark 1.
The component z 1 of the objective function is a convex quadratic function; however, the component z 2 is a cubic non-convex function that makes that the total annual operative costs take a non-convex structure.

2.2. Set of Constraints

The set of constraints in the problem of the optimal placement and sizing of STATCOMs in distribution networks includes the active and reactive power balance equations, the voltage drops at each line, and the maximum and minimum voltage bounds and device capabilities among others. The complete list of constraints is listed below.
p i j , h R i j i i j , h 2 k : ( j k ) L p j k , h = P j , h d , j N , j slack , h H ,
q i j , h X i j i i j , h 2 k : ( j k ) L q j k , h + q j , h s t = Q j , h d , j N , j slack , h H ,
v j , h 2 = v i , h 2 2 R i j p i j , h + X i j q i j , h + R i j 2 + X i j 2 i i j , h 2 i j E , h H ,
p i j , h 2 + q i j , h 2 = v i , h 2 i i j , h 2 , i j L , h H
x j q j s t , min y j x j q j s t , max j N ,
y j q j , h s t y j j N , h H ,
v j min v j , h v j max j N , h H ,
i i j max i i j , h i i j max i j L , h H ,
i N x j N s t max ,
x j 0 , 1 , i N ,
where p i j , h ( p j k , h ) and q i j , h ( p j k , h ) are the active and reactive power flows through the line i j ( j k ) at the period of time h; P j , h d and Q j , h d represent the active and reactive power consumptions at node j in the period of time h; q j , h s t is the reactive power injection in the STATCOM connected at node j at each period of time; X i j is the reactance parameter of the line between nodes i and j; v i , h and v j , h are the voltage magnitudes at nodes i and j in the period of time h; q j s t , min and q j s t , max are the minimum and maximum reactive power injection bounds allowed for a STATCOM connected at node j; x j is the binary variable that decides if a STATCOM is connected ( x j = 1 ) or not ( x j = 0 ) in the node j; v j min and v j max are the minimum and maximum voltage regulation bounds permitted by regulatory policies in all the nodes of the network; i i j max is the thermal bound (maximum current) associated with the conductor that connects nodes i and j; and N s t max is the maximum number of STATCOMs available for installation along the distribution grid.

2.3. Model Interpretation

The complete interpretation of the mathematical model defined from (1) to (13) is the following: Equation (1) is the objective function value associated with the summation of the operative costs regarding the annual energy losses, i.e., Equation (2), and the annual investment costs regarding the installation of the STATCOMs along the grid, i.e., Equation (3). Equality constraints (4) and (5) represents the active and reactive power equilibrium equations in all nodes of the network at each period of time, respectively; Equation (6) represents the voltage drop at each line as a function of the current and active and reactive power flows; Equation (7) defines the application of Tellegen’s theorem at each sending power flow through the lines of the network at each period of time; and box-type constraints (8) and (9) define the possibility of installation of a STATCOM at node j and its maximum and minimum reactive power injection capabilities, respectively. Box-type constraints (10) and (11) define the grid voltage regulation limits and the maximum capabilities of the lines to transport current (i.e., thermal capabilities of the lines), respectively. Inequality constraint (12) limits the maximum number of STATCOMs that can be installed in the whole distribution network. Constraint (13) shows the binary nature of the decision variable.
Remark 2.
The main characteristic of the set of constraints (4)–(13) is the non-convexity of the solution space, specially caused by power equilibrium constraints, the voltage drops and the application of Tellegen’s theorem to define the hyperbolic relation between voltages, currents and powers at each line, respectively.
Owing to the complication of the optimization model, (1)–(13), that defines the optimal placement and sizing of STATCOMs in distribution grids with radial structure, this research proposes a mixed-integer convex approximation to solve the optimization by decoupling the optimal location problem from the optimal dimensioning problem. The proposed methodology is completely presented in the next section.

3. Solution Methodology

To deal with the problem of the optimal siting and sizing of STATCOMs in distribution networks, this research proposes a methodology based on the decoupling of the problem in the siting problem and sizing problem, respectively. In the problem of optimal sizing, we propose a mixed-integer quadratic that decides the best set of nodes for locating STATCOMs, and the sizing problem is solved in the MINLP model (1)–(13) by reducing it to an NLP equivalent.

3.1. Solution of the Location Problem

The location problem of the STATCOMs in distribution networks corresponds to the part of the complete optimization model associated with the definition of the binary variables, i.e., x j . To deal with this part of the problem, we employ the mixed-integer quadratic approximation proposed in [22] to solve the optimal reconfiguration problem in pure-radial distribution networks. The author of [22] proposes that the power flow equations in the optimization model (1)–(13) can be reduced by assuming that all the voltages are near the unity in per-unit representation; moreover, we can assume that the resistance and reactance power losses in the lines are negligible with respect to the magnitudes of the active and reactive power flows. With this simplification, the set of constraints (4)–(13) can be reduced as follows:
p i j , h k : ( j k ) L p j k , h = P j , h d , j N , j slack , h H ,
q i j , h k : ( j k ) L q j k , h + q j , h s t = Q j , h d , j N , j slack , h H ,
x j q j s t , min y j x j q j s t , max j N ,
y j q j , h s t y j j N , h H ,
i N x j N s t max ,
x j 0 , 1 , i N ,
The main advantage of the set of constraints (14)–(19) is that it is a mixed-integer linear group of constraints that can be solvable with a modified version of the branch and bound method. Moreover, component z 1 of the objective function can be replaced with the help of (7) as follows (this replacement can be made if we assume that all the voltages are equal to 1.0 0 ):
z 1 approx = C kWh T i j L h H R i j p i j , h 2 + q i j , h 2 Δ h .
In the case of the annual investment costs in STATCOMs, this can be approximated with the Taylor’s series expansion in the point y j = 0 since for values between 0 Mvar and 10 Mvar, their tendency is basically linear. With this approximation, the component z 2 of the objective function (1) can be approximated as presented below:
z 2 approx = T γ k 1 k 2 j N y j .
Remark 3.
Note that the relaxed set of constraints (14)–(19) with the algebraic sum of components z 1 approx and z 2 approx in (20) and (21) produce a mixed-integer quadratic convex model, which can be solved by ensuring the global optimum finding with the appropriate combination of the branch and bound method with interior point methods [23].

3.2. Solution of the Sizing Problem

Once the binary variables are obtained from the solution of the location problem presented in the previous section, the set of variables x j is fixed in the optimization model (1)–(13), which changes this model from an MINLP problem into a NLP problem. However, due to the non-convexity of the solution space, it is not possible to ensure the global optimum finding; for this reason, as recommended in [20], the equivalent second-order cone programming model can be obtained for it if we define two auxiliary variables, u j , h = v j , h 2 and l i j , h = i i j , h 2 . The second-order cone equivalent set of constraints for the problem of the optimal sizing of STATCOMs in pure-radial distribution networks takes the following form:
p i j , h R i j l i j , h k : ( j k ) L p j k , h = P j , h d , j N , j slack , h H ,
q i j , h X i j i i j , h k : ( j k ) L q j k , h + q j , h s t = Q j , h d , j N , j slack , h H ,
u j , h = u i , h 2 R i j p i j , h + X i j q i j , h + R i j 2 + X i j 2 i i j , h i j E , h H ,
p i j , h 2 + q i j , h 2 + 1 4 u i , h l i j , h 2 1 4 u i , h + l i j , h 2 , i j L , h H
x j q j s t , min y j x j q j s t , max j N ,
y j q j , h s t y j j N , h H ,
v j min 2 u j , h v j min 2 j N , h H ,
l i j , h i i j max 2 i j L , h H ,
Remark 4.
Note that the constraint (25) is obtained if the product of two continuous variables u i , h l i j , h is replaced by its equivalent hyperbolic formulation, i.e.,
u i , h l i j , h = 1 4 u i , h + l i j , h 2 1 4 u i , h l i j , h 2
In the case of the objective function, to ensure that it is also convex, we approximate z 2 as presented in (21), which allows obtaining the following approximate annual cost of the network:
min A cost = z 1 + z 2 approx ,
z 1 = C kWh T i j L h H R i j l i j , h Δ h ,
z 2 approx = T γ k 1 k 2 j N y j ,
Finally, the solution of the optimization model (22)–(32) ensures the global optimum finding of the sizes of the STATCOMs due to the convexity of the solution space [24].

3.3. Methodology Summary

The proposed optimization methodology to solve the problem of the optimal placement and sizing of STATCOMs in distribution networks is summarized in the flowchart diagram depicted in Figure 1.
Note that the proposed optimization methodology depicted in Figure 1 is independent of the optimization tool and it can be implemented in multiple software that deal with mixed-integer convex formulations, with the main advantage that its solution will always be the same due to the convexity of the solution space in the case that the binary variable input in the second optimization model is the same.

4. Test Feeders

The computational validation of the proposed decoupled methodology to determine the optimal size and location of STATCOMs in distribution networks is carried out in two classical test feeders composed of 33 and 69 buses. These test feeders are depicted in Figure 2.
The main characteristic of these test feeders is that both operate at the substation bus with an output voltage of 12.66 kV. The electrical parameters for these grids are reported in Table 1 and Table 2, respectively.
To emulate the daily behavior of the active and reactive power consumption of the network, Table 3 reports the daily variation of these consumptions in steps of half hours. Note that these values must be scaled by 2 during all simulations [16].
The assessment of the component of the objective function z 2 can be made with the parameters reported in Table 4. Some of these values were adapted from [25] and complemented with the information provided in [16].
To evaluate the objective function defined in (1), the parameters reported in Table 4 are considered. Some of these parameters were taken from [16,25]. To avoid mistakes during the evaluation of this objective function, it is important to mention that the variable y j must be defined in Mvar.

5. Computational Validation

The solution of the MINLP model defined from (1)–(13) and the decoupled models (14)–(21) and (22)–(32) were implemented in GAMS software with the solvers BONMIN and COUENNE and with the CVX programming tool in MATLAB with the help of the Gurobi solver. In the case of the MATLAB implementations, we used 2021 b on a PC with an AMD Ryzen 7 3700 2.3 -GHz processor and 16.0 GB RAM, running on a 64-bit version of Microsoft Windows 10 Single language. Moreover, the numerical results are also compared with the discrete-continuous version of the vortex search algorithm (DCVSA) proposed in [16].

5.1. Results in the IEEE 33-Bus System

Table 5 presents the numerical comparison between the GAMS solvers, the DCVSA and the proposed decoupled methodology.
Numerical results in Table 5 show that: (i) the proposed decoupled methodology identifies nodes 14, 30, and 32 to locate all the STATCOMs, which coincides with the solution reported by the DCVSA. However, the objective function obtained by our proposed approach is USD 516.80 more economic than the DCVSA, which is attributable to the optimal sizes reached by the proposed conic model in the sizing stage, being that this is greater than the sizes provided by the DCVSA in [16]; (ii) the exact approaches in the GAMS software with the BONMIM and COUENNE solvers are stuck in local optimal solutions, which is attributable to the non-convexity of the exact model (1)–(13); and (iii) with respect to the benchmark case, the proposed approach reaches a reduction of 14.17 % followed by the DCVSA with 13.71 % , and the COUENNE solution with 12.24 % , respectively.
To illustrate the daily dynamic performance of the proposed approach regarding the reactive power injection in the selected nodes of the network, in Figure 3 are reported the reactive power injections in all the periods of time for all the STATCOMs. In general, it is observed that between the periods of time 1 and 17, all the STATCOMs control their reactive power injection below the nominal capacity, as during these time periods, the active and reactive power demand of the grid is in a general low; however, after period 18, all the STATCOMs inject their rate capacities since in these time periods, the grid demand increases considerably. Finally, at the end of the operation period, the reactive power injections in the STATCOMs start to reduce, owing to the reduction in the apparent power consumption on the whole grid.
The most important fact that Figure 3 tries to show is that the reactive power compensation in distribution networks is indeed a dynamic compensation problem since the grid requirements vary as a function of the total active and reactive demand during the day. In this sense, depending on the active and reactive demand curves employed, the optimal location and sizes of the STACOMS can vary significantly as shown in [4], where residential, industrial, and commercial users were considered along with the distribution feeders.

5.2. Results in the IEEE 69-Bus System

Table 6 shows the comparison between the DCVSA and the proposed decoupled methodology. Note that solutions with the BONMIN and the COUENNE solvers in the GAMS software are not provided since these failed in the case of the IEEE 69-bus system due to the complexity of the solution space and the increase in the number of decision variables.
Numerical results in Table 6 show that (i) the DCVSA is stuck in a local optimum since it is obtained as the optimal location of the set of nodes 21, 61 and 64, while the proposed approach identifies node 22 instead of node 21; (ii) with respect to the benchmark case, the proposed approach could reach an annual cost reduction of 15.79 % , while the DCVSA obtains a reduction of 15.30 % . These values imply an additional gain of USD 592.98 per year of operation; and (iii) the optimal sizes of the STATCOMs reached by our proposal are bigger than the sizes provided by the DCVSA. However, this situation happens due to the fact that the DCVSA works in the first stage with constant power injections during all periods of time to define the STATCOMs’ sizes; then, an optimal multiperiod power flow is applied to refine their operation, while our proposal works directly under a multiperiod programming scenario that allows identifying better solutions as reported in Table 6.
On the other hand, Figure 4 shows the dynamic reactive power injection in all the STATCOMs installed for the IEEE 69-bus system.
Results in Figure 4 show in general that the STATCOMs inject dynamic reactive power as a function of the grid requirements. Note that in the periods between 1 and 18, these STATCOMs work with reactive power injections below their nominal capacities; however, when the demand increases considerably, these STATCOMs inject their maximum rates (see periods after 18 h).
It is worth mentioning that the behavior in the IEEE 69-bus system is very similar to the IEEE 33-bus case; which is explainable by the fact that for both systems, the same daily active and reactive power load profiles reported in Table 3 are used.
Note that Figure 3 and Figure 4 confirm that the problem of the optimal reactive power compensation in distribution grids is indeed a dynamical optimization problem, where the final solution is highly influenced by the characterization of the demand curve of the grid in terminals of the substation. This shows the importance of developing a previous study to the application of the proposed decoupled optimization approach that corresponds to the determination of the average load profile of the distribution. It is noteworthy that this curve is the main external input for the application of any optimization methodology, even if these are based on metaheuristics or exact approaches.

6. Conclusions and Future Works

The problem of the optimal siting and sizing STATCOMs in radial distribution grids to reduce the annual grid operative costs was addressed in this research from the point of view of mixed-integer convex optimization. The exact MINLP model was decoupled into two subproblems, named the location problem and the sizing problem. The former problem was formulated with a mixed-integer quadratic programming model that allows determining the optimal location of the STATCOMs. These locations are provided in the latter stage (sizing problem), where a second-order cone programming model was used to solve the multiperiod optimal power flow problem. To obtain these equivalent models, the component of the objective function regarding the annualized costs of the STATCOMs was linearized through Taylor’s series expansion. Numerical results demonstrated that the proposed decoupled approach improves the solutions reached by the DCVSA and the BONMIN and COUENNE solvers available in the GAMS optimization package for both test feeders under study.
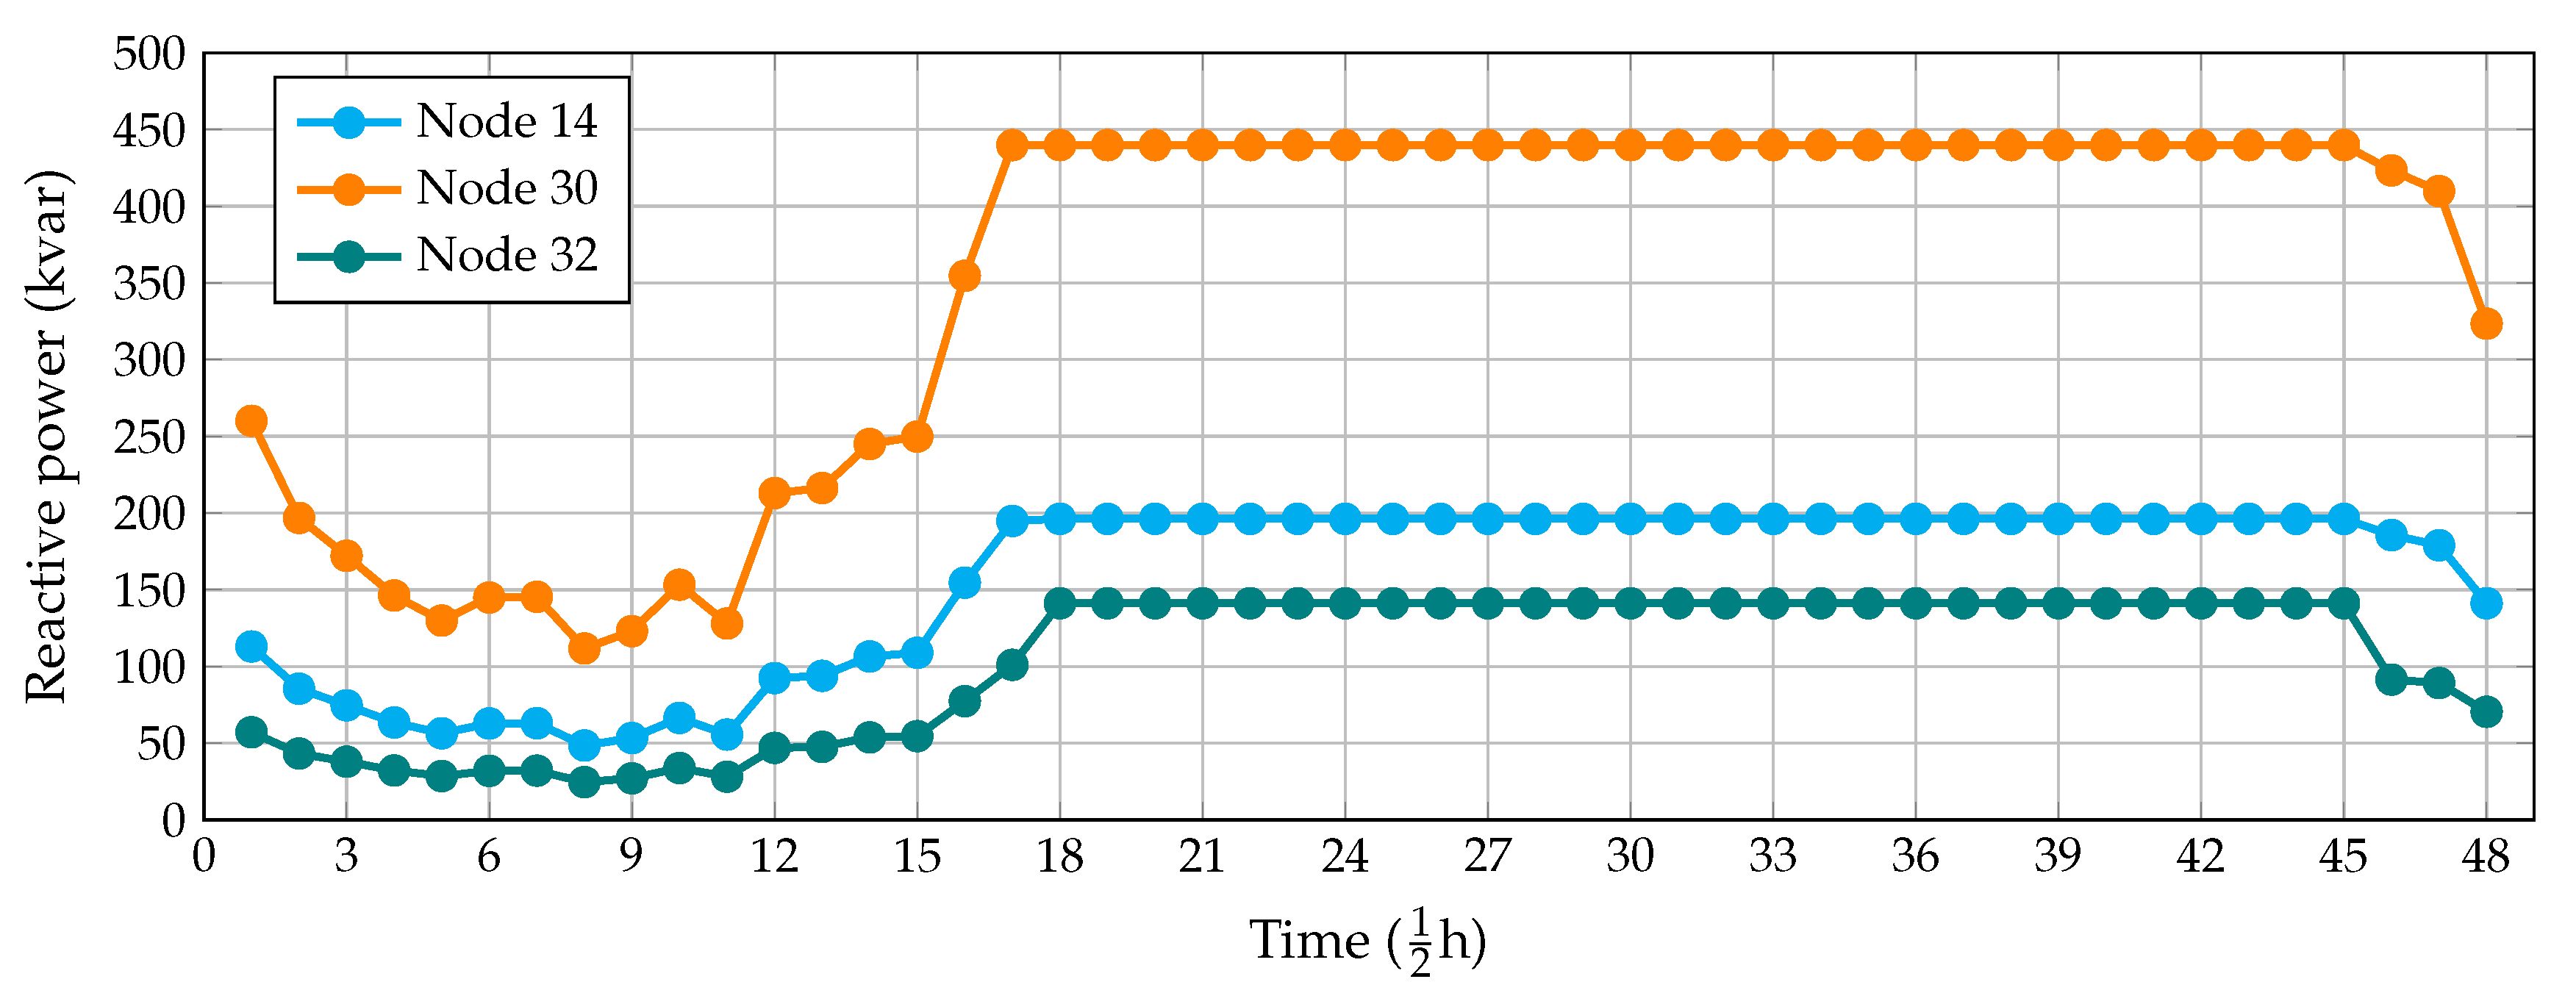
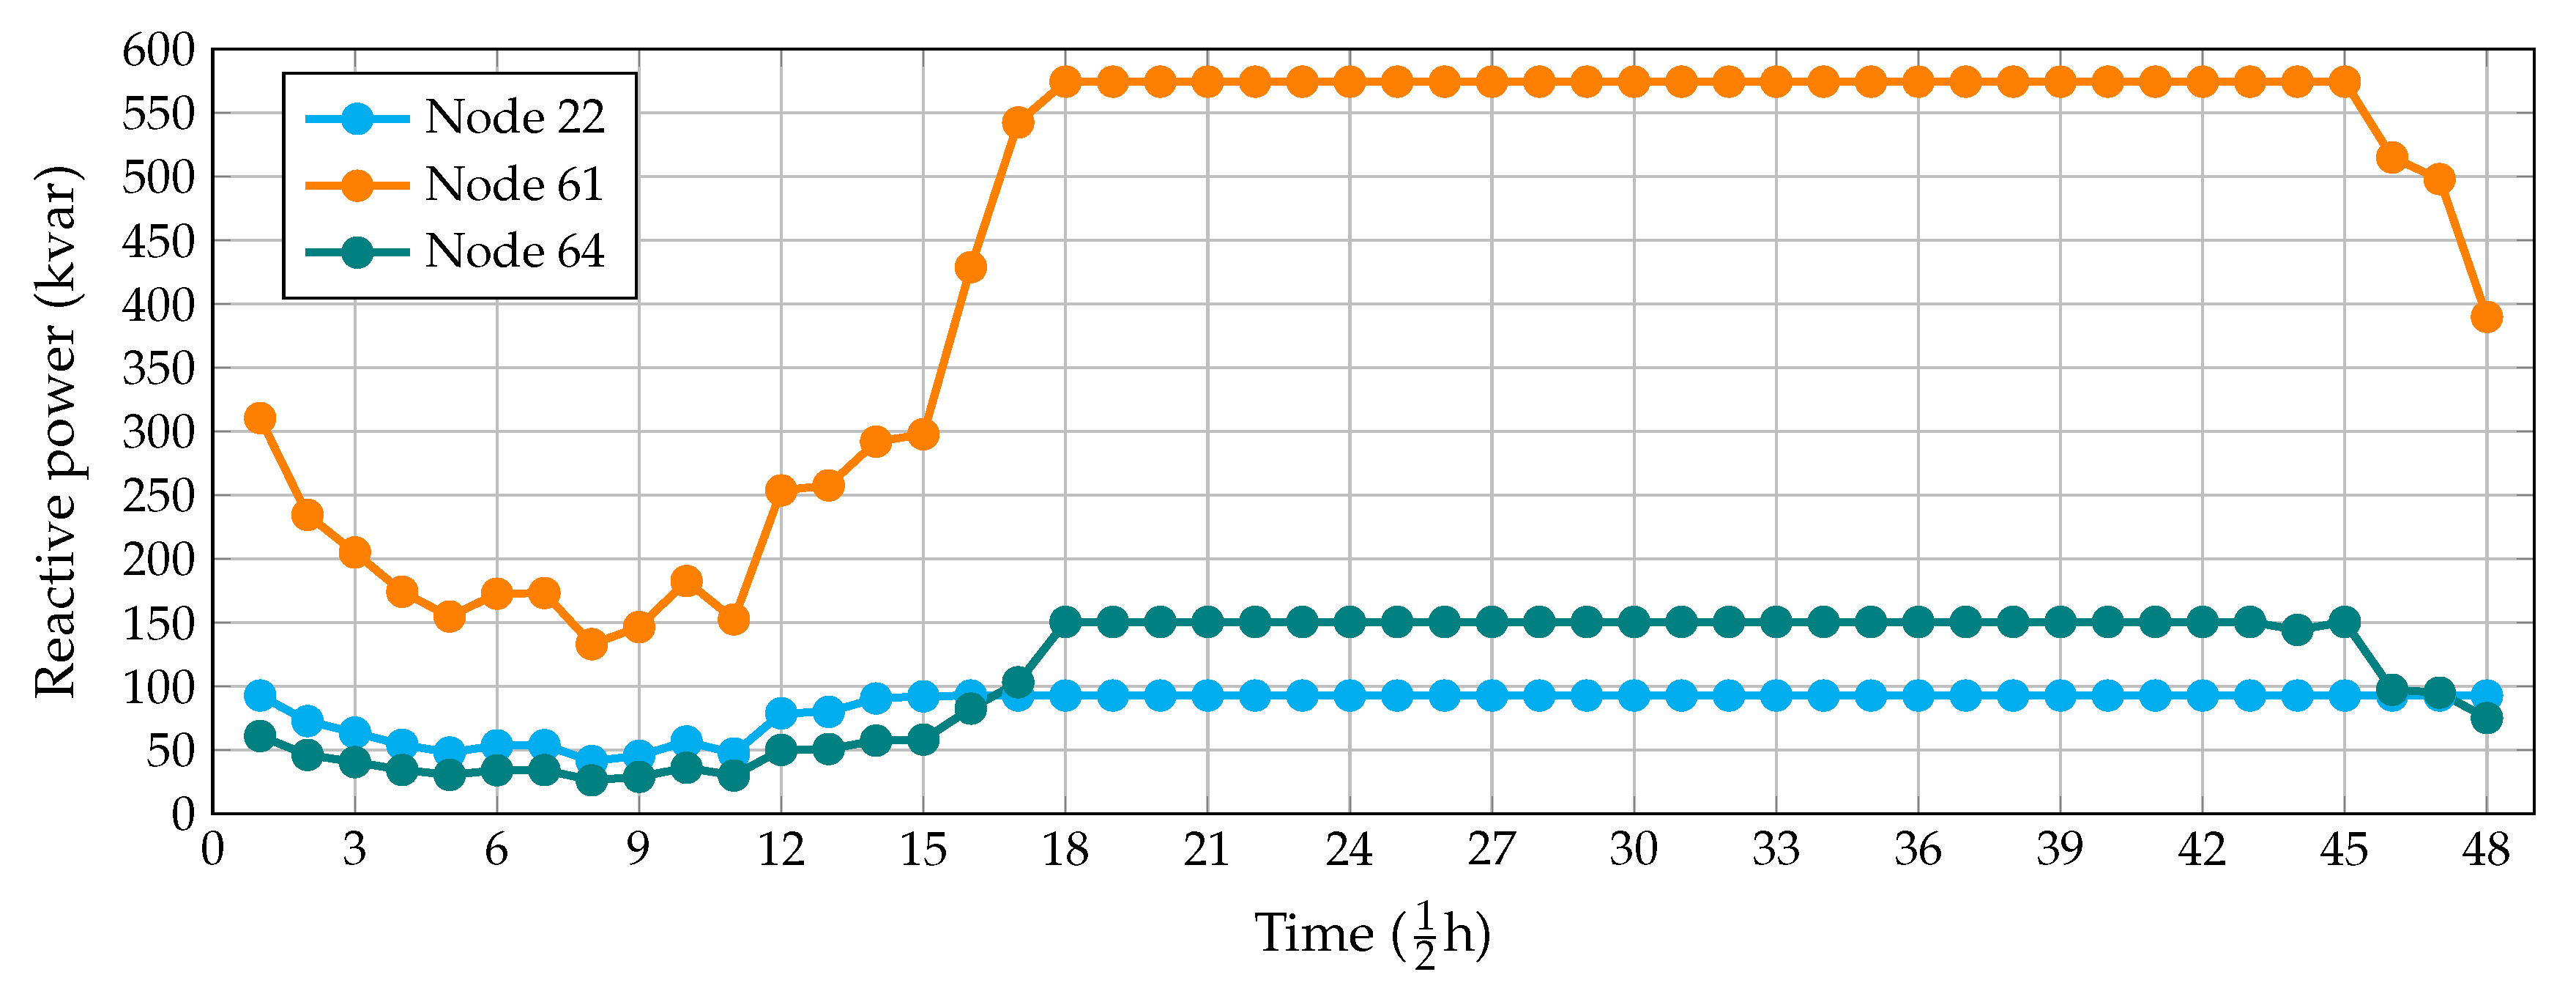
In the case of the IEEE 33-bus system, the general improvement with respect to the base case was 14.17 % , which implied a reduction of about USD 15,973.21 per year of operation; for the IEEE 69-bus system, this reduction was 15.79 % , i.e., USD 18,908.72 per year of operation. These results improved the best numerical solution reported in the literature with the DCVSA of about USD 516.80 for the IEEE 33-bus system and USD 592.98 in the case of the IEEE 69-bus system, which confirmed the effectiveness and robustness of the proposed approach regarding literature reports.
As future works, it will be possible to develop the following research studies: (i) to extend the proposed decoupled optimization methodology to integrate renewable sources (i.e., solar photovoltaic or wind sources) to minimize the total grid generation costs; (ii) to extend the proposed formulation to distribution grids with meshed topologies; and (iii) to apply the optimization paradigm known as poly-optimization to solve problems regarding the optimal placement and sizing of shunt devices in distribution networks.

Author Contributions

Conceptualization, methodology, software, and writing—review and editing, O.D.M., L.A.-B. and J.C.H. All authors have read and agreed to the published version of the manuscript.

Funding

This work was supported in part by the Centro de Investigación y Desarrollo Científico de la Universidad Distrital Francisco José de Caldas under grant 1643-12-2020 associated with the project: “Desarrollo de una metodología de optimización para la gestión óptima de recursos energéticos distribuidos en redes de distribución de energía eléctrica”.

Data Availability Statement

No new data were created or analyzed in this study. Data sharing is not applicable to this article.

Conflicts of Interest

The authors declare no conflict of interest.

References

  1. Temiz, A.; Almalki, A.M.; Kahraman, Ö.; Alshahrani, S.S.; Sönmez, E.B.; Almutairi, S.S.; Nadar, A.; Smiai, M.S.; Alabduljabbar, A.A. Investigation of MV Distribution Networks with High-Penetration Distributed PVs: Study for an Urban Area. Energy Procedia 2017, 141, 517–524. [Google Scholar] [CrossRef]
  2. Táczi, I.; Sinkovics, B.; Vokony, I.; Hartmann, B. The Challenges of Low Voltage Distribution System State Estimation—An Application Oriented Review. Energies 2021, 14, 5363. [Google Scholar] [CrossRef]
  3. Arulraj, R.; Kumarappan, N. Optimal economic-driven planning of multiple DG and capacitor in distribution network considering different compensation coefficients in feeder’s failure rate evaluation. Eng. Sci. Technol. Int. J. 2019, 22, 67–77. [Google Scholar] [CrossRef]
  4. Castiblanco-Pérez, C.M.; Toro-Rodríguez, D.E.; Montoya, O.D.; Giral-Ramírez, D.A. Optimal Placement and Sizing of D-STATCOM in Radial and Meshed Distribution Networks Using a Discrete-Continuous Version of the Genetic Algorithm. Electronics 2021, 10, 1452. [Google Scholar] [CrossRef]
  5. Abagiu, S.; Lepadat, I.; Helerea, E. Solutions for energy losses reduction in power networks with renewable energy sources. In Proceedings of the 2016 International Conference on Applied and Theoretical Electricity (ICATE), Craiova, Romania, 6–8 October 2016. [Google Scholar] [CrossRef]
  6. Soma, G.G. Optimal Sizing and Placement of Capacitor Banks in Distribution Networks Using a Genetic Algorithm. Electricity 2021, 2, 12. [Google Scholar] [CrossRef]
  7. Gnanasekaran, N.; Chandramohan, S.; Kumar, P.S.; Imran, A.M. Optimal placement of capacitors in radial distribution system using shark smell optimization algorithm. Ain Shams Eng. J. 2016, 7, 907–916. [Google Scholar] [CrossRef] [Green Version]
  8. Tamilselvan, V.; Jayabarathi, T.; Raghunathan, T.; Yang, X.S. Optimal capacitor placement in radial distribution systems using flower pollination algorithm. Alex. Eng. J. 2018, 57, 2775–2786. [Google Scholar] [CrossRef]
  9. Sedighizadeh, M.; Dakhem, M.; Sarvi, M.; Kordkheili, H.H. Optimal reconfiguration and capacitor placement for power loss reduction of distribution system using improved binary particle swarm optimization. Int. J. Energy Environ. Eng. 2014, 5, 3. [Google Scholar] [CrossRef] [Green Version]
  10. Salau, A.O.; Gebru, Y.W.; Bitew, D. Optimal network reconfiguration for power loss minimization and voltage profile enhancement in distribution systems. Heliyon 2020, 6, e04233. [Google Scholar] [CrossRef]
  11. Pruitt, K.A.; Leyffer, S.; Newman, A.M.; Braun, R.J. A mixed-integer nonlinear program for the optimal design and dispatch of distributed generation systems. Optim. Eng. 2013, 15, 167–197. [Google Scholar] [CrossRef]
  12. Kaur, S.; Kumbhar, G.; Sharma, J. A MINLP technique for optimal placement of multiple DG units in distribution systems. Int. J. Electr. Power Energy Syst. 2014, 63, 609–617. [Google Scholar] [CrossRef]
  13. Valencia, A.; Hincapie, R.A.; Gallego, R.A. Optimal location, selection, and operation of battery energy storage systems and renewable distributed generation in medium–low voltage distribution networks. J. Energy Storage 2021, 34, 102158. [Google Scholar] [CrossRef]
  14. Home-Ortiz, J.M.; Pourakbari-Kasmaei, M.; Lehtonen, M.; Mantovani, J.R.S. Optimal location-allocation of storage devices and renewable-based DG in distribution systems. Electr. Power Syst. Res. 2019, 172, 11–21. [Google Scholar] [CrossRef]
  15. Hassan, A.S.; Othman, E.A.; Bendary, F.M.; Ebrahim, M.A. Optimal integration of distributed generation resources in active distribution networks for techno-economic benefits. Energy Rep. 2020, 6, 3462–3471. [Google Scholar] [CrossRef]
  16. Montoya, O.D.; Gil-González, W.; Hernández, J.C. Efficient Operative Cost Reduction in Distribution Grids Considering the Optimal Placement and Sizing of D-STATCOMs Using a Discrete-Continuous VSA. Appl. Sci. 2021, 11, 2175. [Google Scholar] [CrossRef]
  17. Sirjani, R.; Jordehi, A.R. Optimal placement and sizing of distribution static compensator (D-STATCOM) in electric distribution networks: A review. Renew. Sustain. Energy Rev. 2017, 77, 688–694. [Google Scholar] [CrossRef]
  18. Ayodele, T.; Ogunjuyigbe, A.; Akpeji, K.; Akinola, O. Prioritized rule based load management technique for residential building powered by PV/battery system. Eng. Sci. Technol. Int. J. 2017, 20, 859–873. [Google Scholar] [CrossRef]
  19. Kerrouche, K.D.E.; Lodhi, E.; Kerrouche, M.B.; Wang, L.; Zhu, F.; Xiong, G. Modeling and design of the improved D-STATCOM control for power distribution grid. SN Appl. Sci. 2020, 2, 1519. [Google Scholar] [CrossRef]
  20. Montoya, O.D.; Chamorro, H.R.; Alvarado-Barrios, L.; Gil-González, W.; Orozco-Henao, C. Genetic-Convex Model for Dynamic Reactive Power Compensation in Distribution Networks Using D-STATCOMs. Appl. Sci. 2021, 11, 3353. [Google Scholar] [CrossRef]
  21. Farivar, M.; Low, S.H. Branch Flow Model: Relaxations and Convexification—Part I. IEEE Trans. Power Syst. 2013, 28, 2554–2564. [Google Scholar] [CrossRef]
  22. Taylor, J.A.; Hover, F.S. Convex Models of Distribution System Reconfiguration. IEEE Trans. Power Syst. 2012, 27, 1407–1413. [Google Scholar] [CrossRef]
  23. Zhao, Y.; Liu, S. Global optimization algorithm for mixed integer quadratically constrained quadratic program. J. Comput. Appl. Math. 2017, 319, 159–169. [Google Scholar] [CrossRef]
  24. Benson, H.Y.; Sağlam, Ü. Mixed-Integer Second-Order Cone Programming: A Survey. In Theory Driven by Influential Applications; INFORMS: Catonsville, MD, USA, 2013; pp. 13–36. [Google Scholar] [CrossRef] [Green Version]
  25. Sharma, A.K.; Saxena, A.; Tiwari, R. Optimal Placement of SVC Incorporating Installation Cost. Int. J. Hybrid Inf. Technol. 2016, 9, 289–302. [Google Scholar] [CrossRef]
  26. Montoya, O.D.; Fuentes, J.E.; Moya, F.D.; Barrios, J.Á.; Chamorro, H.R. Reduction of Annual Operational Costs in Power Systems through the Optimal Siting and Sizing of STATCOMs. Appl. Sci. 2021, 11, 4634. [Google Scholar] [CrossRef]
Figure 1. Main aspects of the proposed solution methodology.
Electronics 10 03102 g001
Figure 2. Distribution grids under study: (a) IEEE 33-bus system and (b) IEEE 69-bus system.
Electronics 10 03102 g002
Figure 3. Daily reactive power injection in the selected nodes where the STATCOMs were installed in the IEEE 33-bus system.
Electronics 10 03102 g003
Figure 4. Daily reactive power injection in the selected nodes where the STATCOMs were installed in the IEEE 69-bus system.
Electronics 10 03102 g004
Table 1. Branch and load parameters of the IEEE 33-bus system.
Node iNode j R ij ( Ω ) X ij ( Ω ) P j (kW) Q j (kvar)Node iNode j R ij ( Ω ) X ij ( Ω ) P j (kW) Q j (kvar)
120.09220.04771006017180.73200.57409040
230.49300.251190402190.16400.15659040
340.36600.18641208019201.50421.35549040
450.38110.1941603020210.40950.47849040
560.81900.7070602021220.70890.93739040
670.18720.61882001003230.45120.30839050
781.71141.235120010023240.89800.7091420200
891.03000.7400602024250.89600.7011420200
9101.04000.740060206260.20300.10346025
10110.19660.0650453026270.28420.14476025
11120.37440.1238603527281.05900.93376020
12131.46801.1550603528290.80420.700612070
13140.54160.71291208029300.50750.2585200600
14150.59100.5260601030310.97440.963015070
15160.74630.5450602031320.31050.3619210100
16171.28901.7210602032330.34100.53026040
Table 2. Branch and load parameters of the IEEE 69-bus system.
Node iNode j R ij ( Ω ) X ij ( Ω ) P j (kW) Q j (kvar)Node iNode j R ij ( Ω ) X ij ( Ω ) P j (kW) Q j (kvar)
120.00050.0012003360.00440.01082618.55
230.00050.00120036370.06400.15652618.55
340.00150.00360037380.10530.123000
450.02510.02940038390.03040.03552417
560.36600.18642.62.239400.00180.00212417
670.38100.194140.43040410.72830.85091.21
780.09220.0470755441420.31000.362300
890.04930.0251302242430.04100.047564.3
9100.81900.2707281943440.00920.011600
10110.18720.061914510444450.10890.137339.2226.3
11120.71140.235114510445460.00090.001239.2226.3
12131.03000.3400854470.00340.008400
13141.04400.345085.547480.08510.20837956.4
14151.05800.34960048490.28980.7091384.7274.5
15160.19660.065045.53049500.08220.2011384.7274.5
16170.37440.123860358510.09280.047340.528.3
17180.00470.0016603551520.33190.11143.62.7
18190.32760.1083009530.17400.08864.353.5
19200.21060.069010.653540.20300.103426.419
20210.34160.11291148154550.28420.14472417.2
21220.01400.004653.555560.28130.143300
22230.15910.05260056571.59000.533700
23240.34600.1145282057580.78370.263000
24250.74880.24750058590.30420.100610072
25260.30890.1021141059600.38610.117200
26270.17320.0572141060610.50750.25851244888
3280.00440.01082618.661620.09740.04963223
28290.06400.15652618.662630.14500.073800
29300.39780.13150063640.71050.3619227162
30310.07020.02320064651.04100.53025942
31320.35100.11600011660.20120.06111813
32330.83900.2816141066670.00470.00141813
33341.70800.564619.51412680.73940.24442820
34351.47400.48736468690.00470.00162820
Table 3. Daily active and reactive demand profiles.
PeriodAct. (pu)React. (pu)PeriodAct. (pu)React. (pu)
10.17000.1477250.47000.3382
20.14000.1119260.47000.3614
30.11000.0982270.45000.3877
40.11000.0833280.42000.3434
50.11000.0739290.43000.3771
60.10000.0827300.45000.4269
70.09000.0831310.45000.4224
80.09000.0637320.45000.3647
90.09000.0702330.45000.4226
100.10000.0875340.45000.3081
110.11000.0728350.45000.2994
120.13000.1214360.45000.3336
130.14000.1231370.43000.3543
140.17000.1390380.42000.3399
150.20000.1410390.46000.4234
160.25000.1998400.50000.4061
170.31000.2497410.49000.3820
180.34000.3224420.47000.3820
190.36000.3263430.45000.3887
200.39000.3661440.42000.2751
210.42000.3585450.38000.3383
220.43000.3316460.34000.2355
230.45000.4187470.29000.2301
240.46000.3652480.25000.1818
Table 4. Parameters to evaluate the component z 2 of the objective function.
Par.ValueUnitPar.ValueUnit
C kWh 0.1390US$kWhT365Days
Δ h 0.50h α 0.30US$/MVAr 3
β −305.10US$/MVAr 2 γ 127,380US$/MVAr
k 1 6/21901/Days k 2 10Years
Table 5. Numerical results in the IEEE 33-bus system for the proposed and comparative methods.
MethodLocation (node)Size (kvar) A cost (US$/year)
Benchmark case112,740.90
BONMIN [26] 18 , 19 , 33 171.15 , 0.00 , 472.69 103,945.49
COUENNE [26] 6 , 7 , 12 296.47 , 165.64 , 248.4 98,936.36
DCVSA [16] 14 , 30 , 32 159.90 , 359.10 , 107.20 97,284.49
Proposed 14 , 30 , 32 196.22 , 439.80 , 141.20 96,767.69
Table 6. Numerical results in the IEEE 69-bus system for the proposed and comparative methods.
MethodLocation (node)Size (kvar) A cost (US$/year)
Benchmark case119,715.63
DCVSA [16] 21 , 61 , 64 83.87 , 460.06 , 113.88 101,399.89
Proposed 22 , 61 , 64 92.80 , 574.49 , 150.55 100,806.91
Publisher’s Note: MDPI stays neutral with regard to jurisdictional claims in published maps and institutional affiliations.

