
A Hadoop Based Framework Integrating Machine Learning Classifiers for Anomaly Detection in the Internet of Things

 and
and 
Abstract
:1. Introduction
1.1. Attacks in the IoT Network
- Hadoop based framework to distribute the processing of huge IoT traffic datasets for minimizing the computational time.
- Class imbalance of IoT datasets is mitigated by deploying a modified Tomek-linked under-sampling technique.
- Tuning the individual machine learning models like SVM, KNN, and NB using artificial immune network for better cross-validation accuracy.
- The proposed model is evaluated with benchmark IoT datasets to show the superiority of the technique over existing baseline approaches.
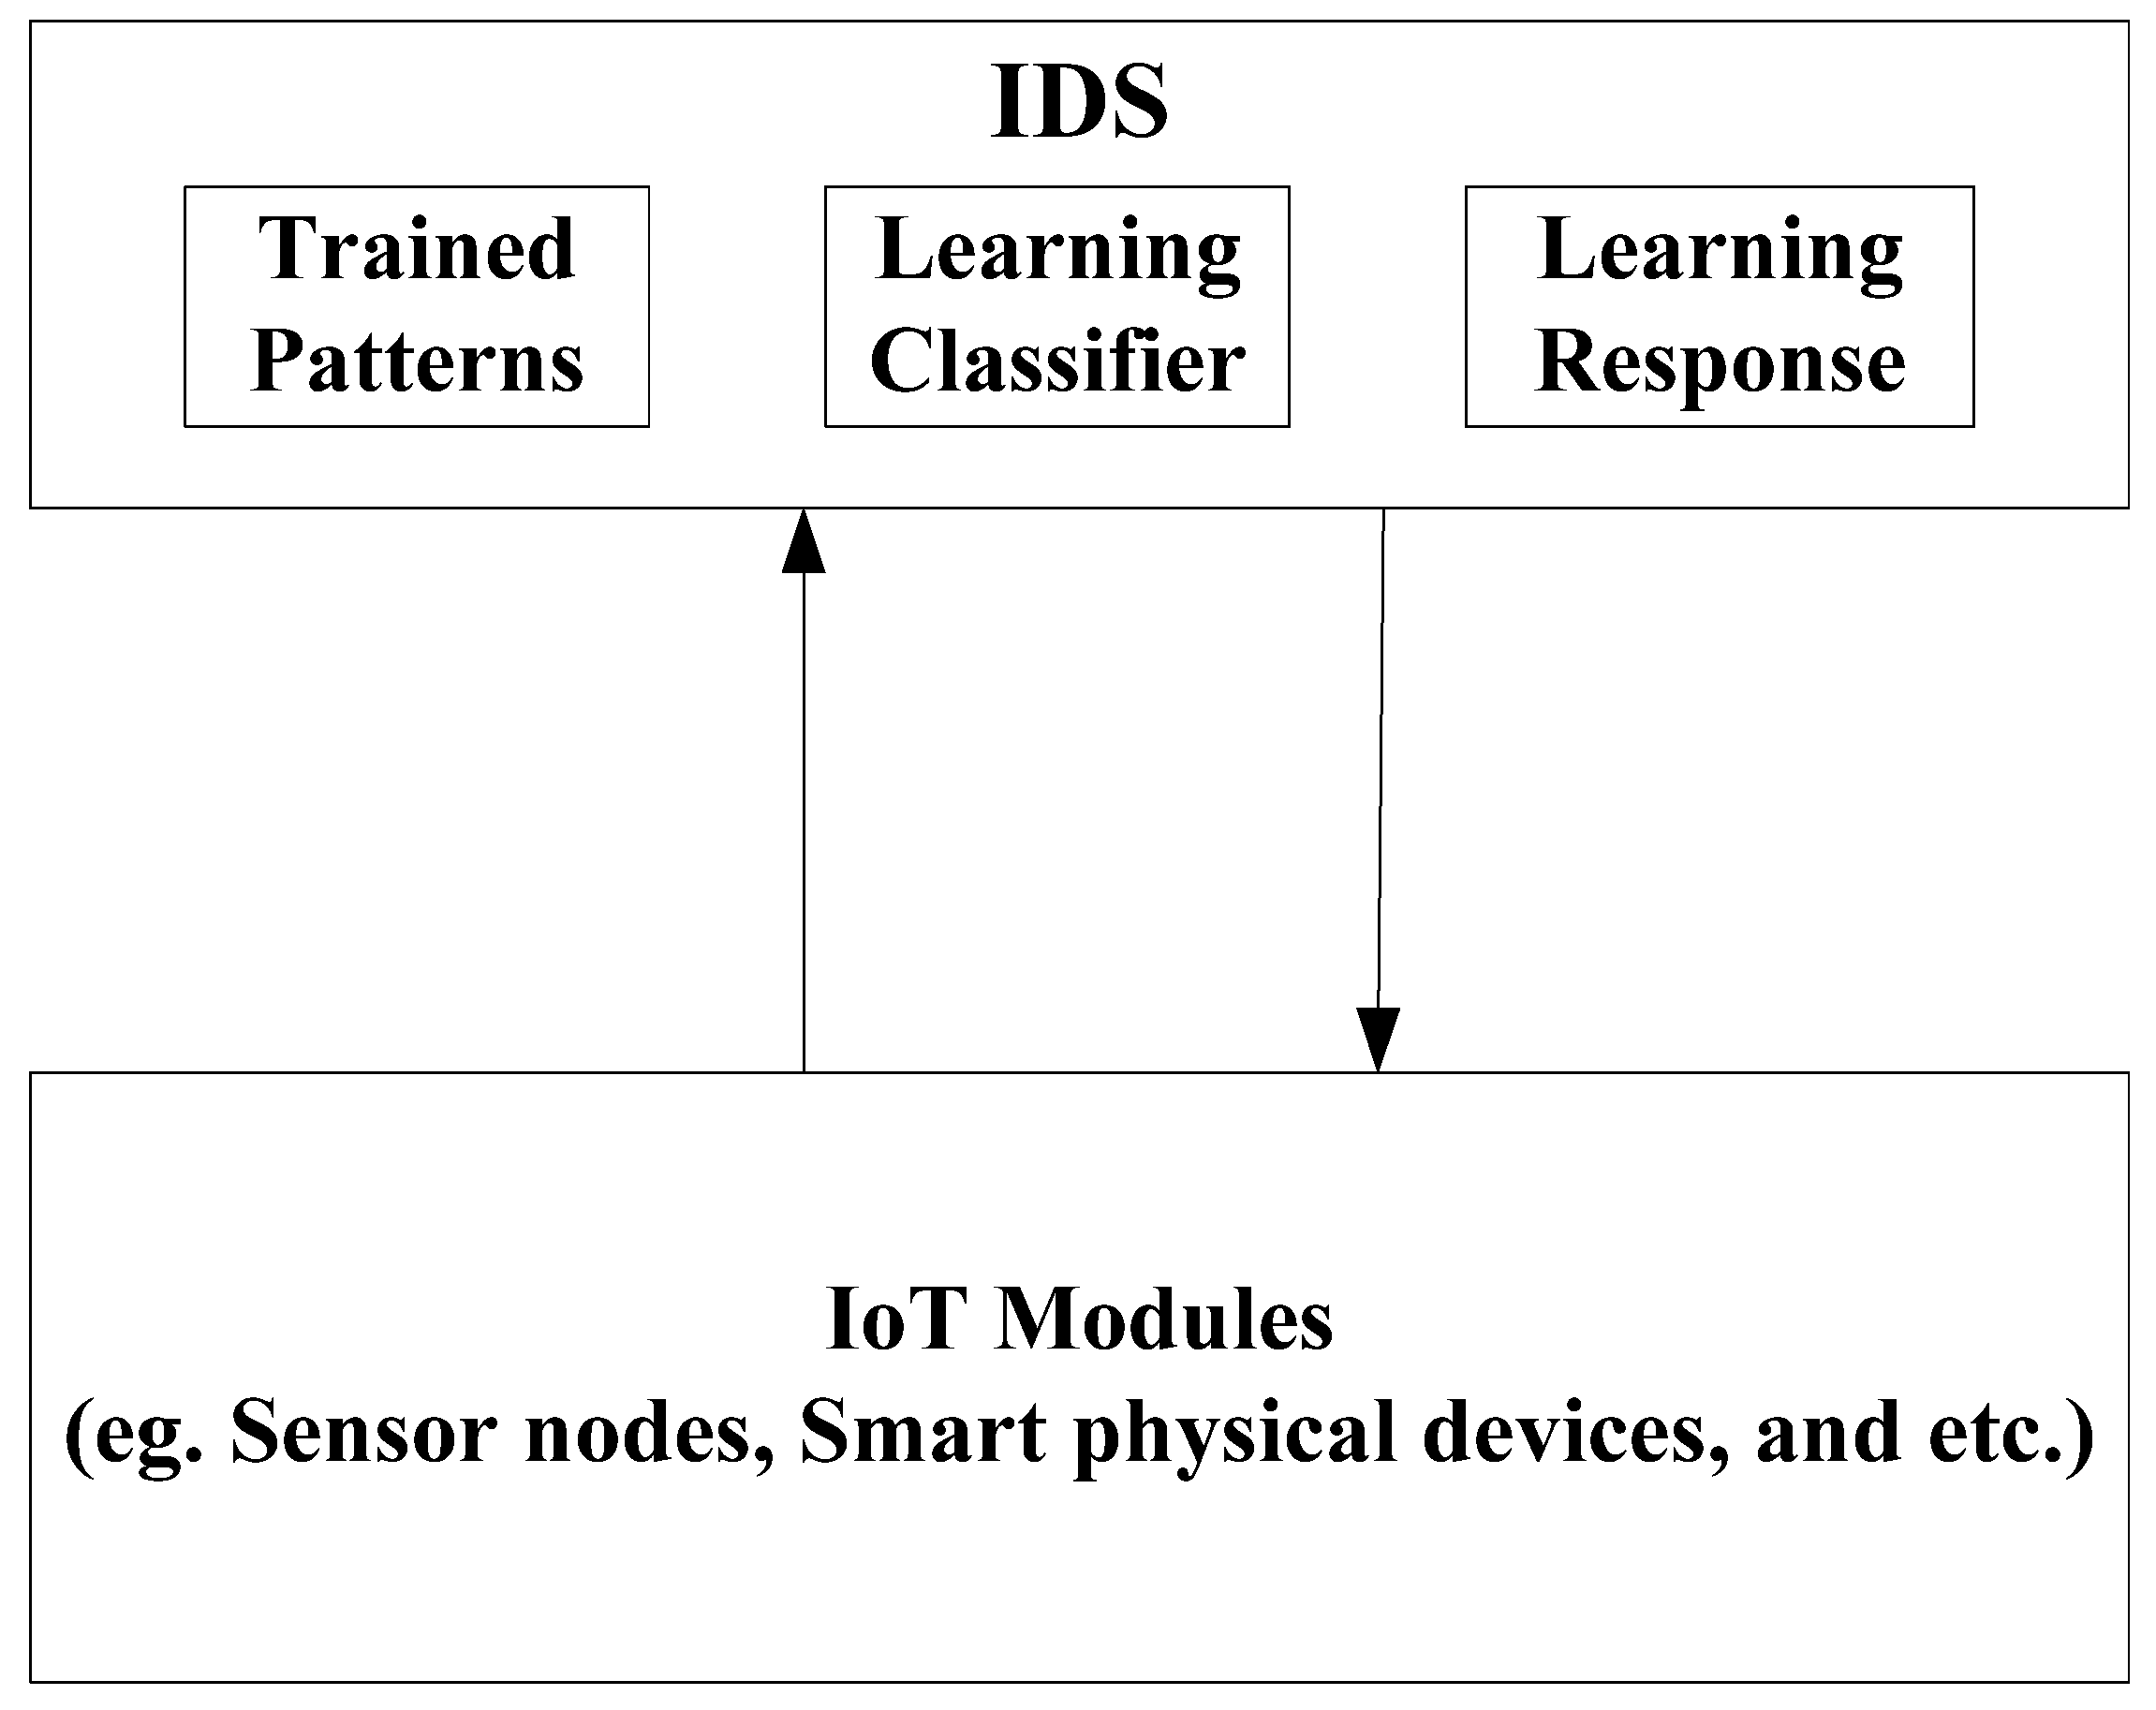
1.2. Intrusion Detection Systems (IDS)
2. Related Work
2.1. Vulnerability Mitigation Approaches and Security Testbeds
2.2. IDS for IoT Using Machine Learning
2.3. Enhancements for Upcoming IoT Applications
- Severe penetration testing of IoT devices is required to analyze the risk levels in device installation for various applications. A priority list can be made according to the risk involved and appropriately the devices can be deployed.
- Different layers of IoT and protocols are suing encryption techniques. There are different phases in the application such as encrypt, decrypt, and re-encrypt which makes the system susceptible to threats. Hence, a viable solution suggested for preventing various threats is end-to-end encryption.
- An authentication service must be implemented for interaction between devices. Digital certificates can provide seamless authentication that is integrated with cryptographic protocols could be a promising solution
- Encryption approaches like RSA and hashing techniques like SHA256 or hash chains must be deployed for securing the user and environment.
- Cloud services are used by most of the applications for storage and retrieval of data and hence cloud storage risks must be analyzed. Data security can be enhanced by storing the encrypted data in the cloud and the provider cannot decrypt any ciphertext.
- IoT devices can be secured by the use of artificial-intelligence-based approaches.
2.4. Class Imbalance Problem in IoT Datasets
- Data level solutions
- Algorithmic level
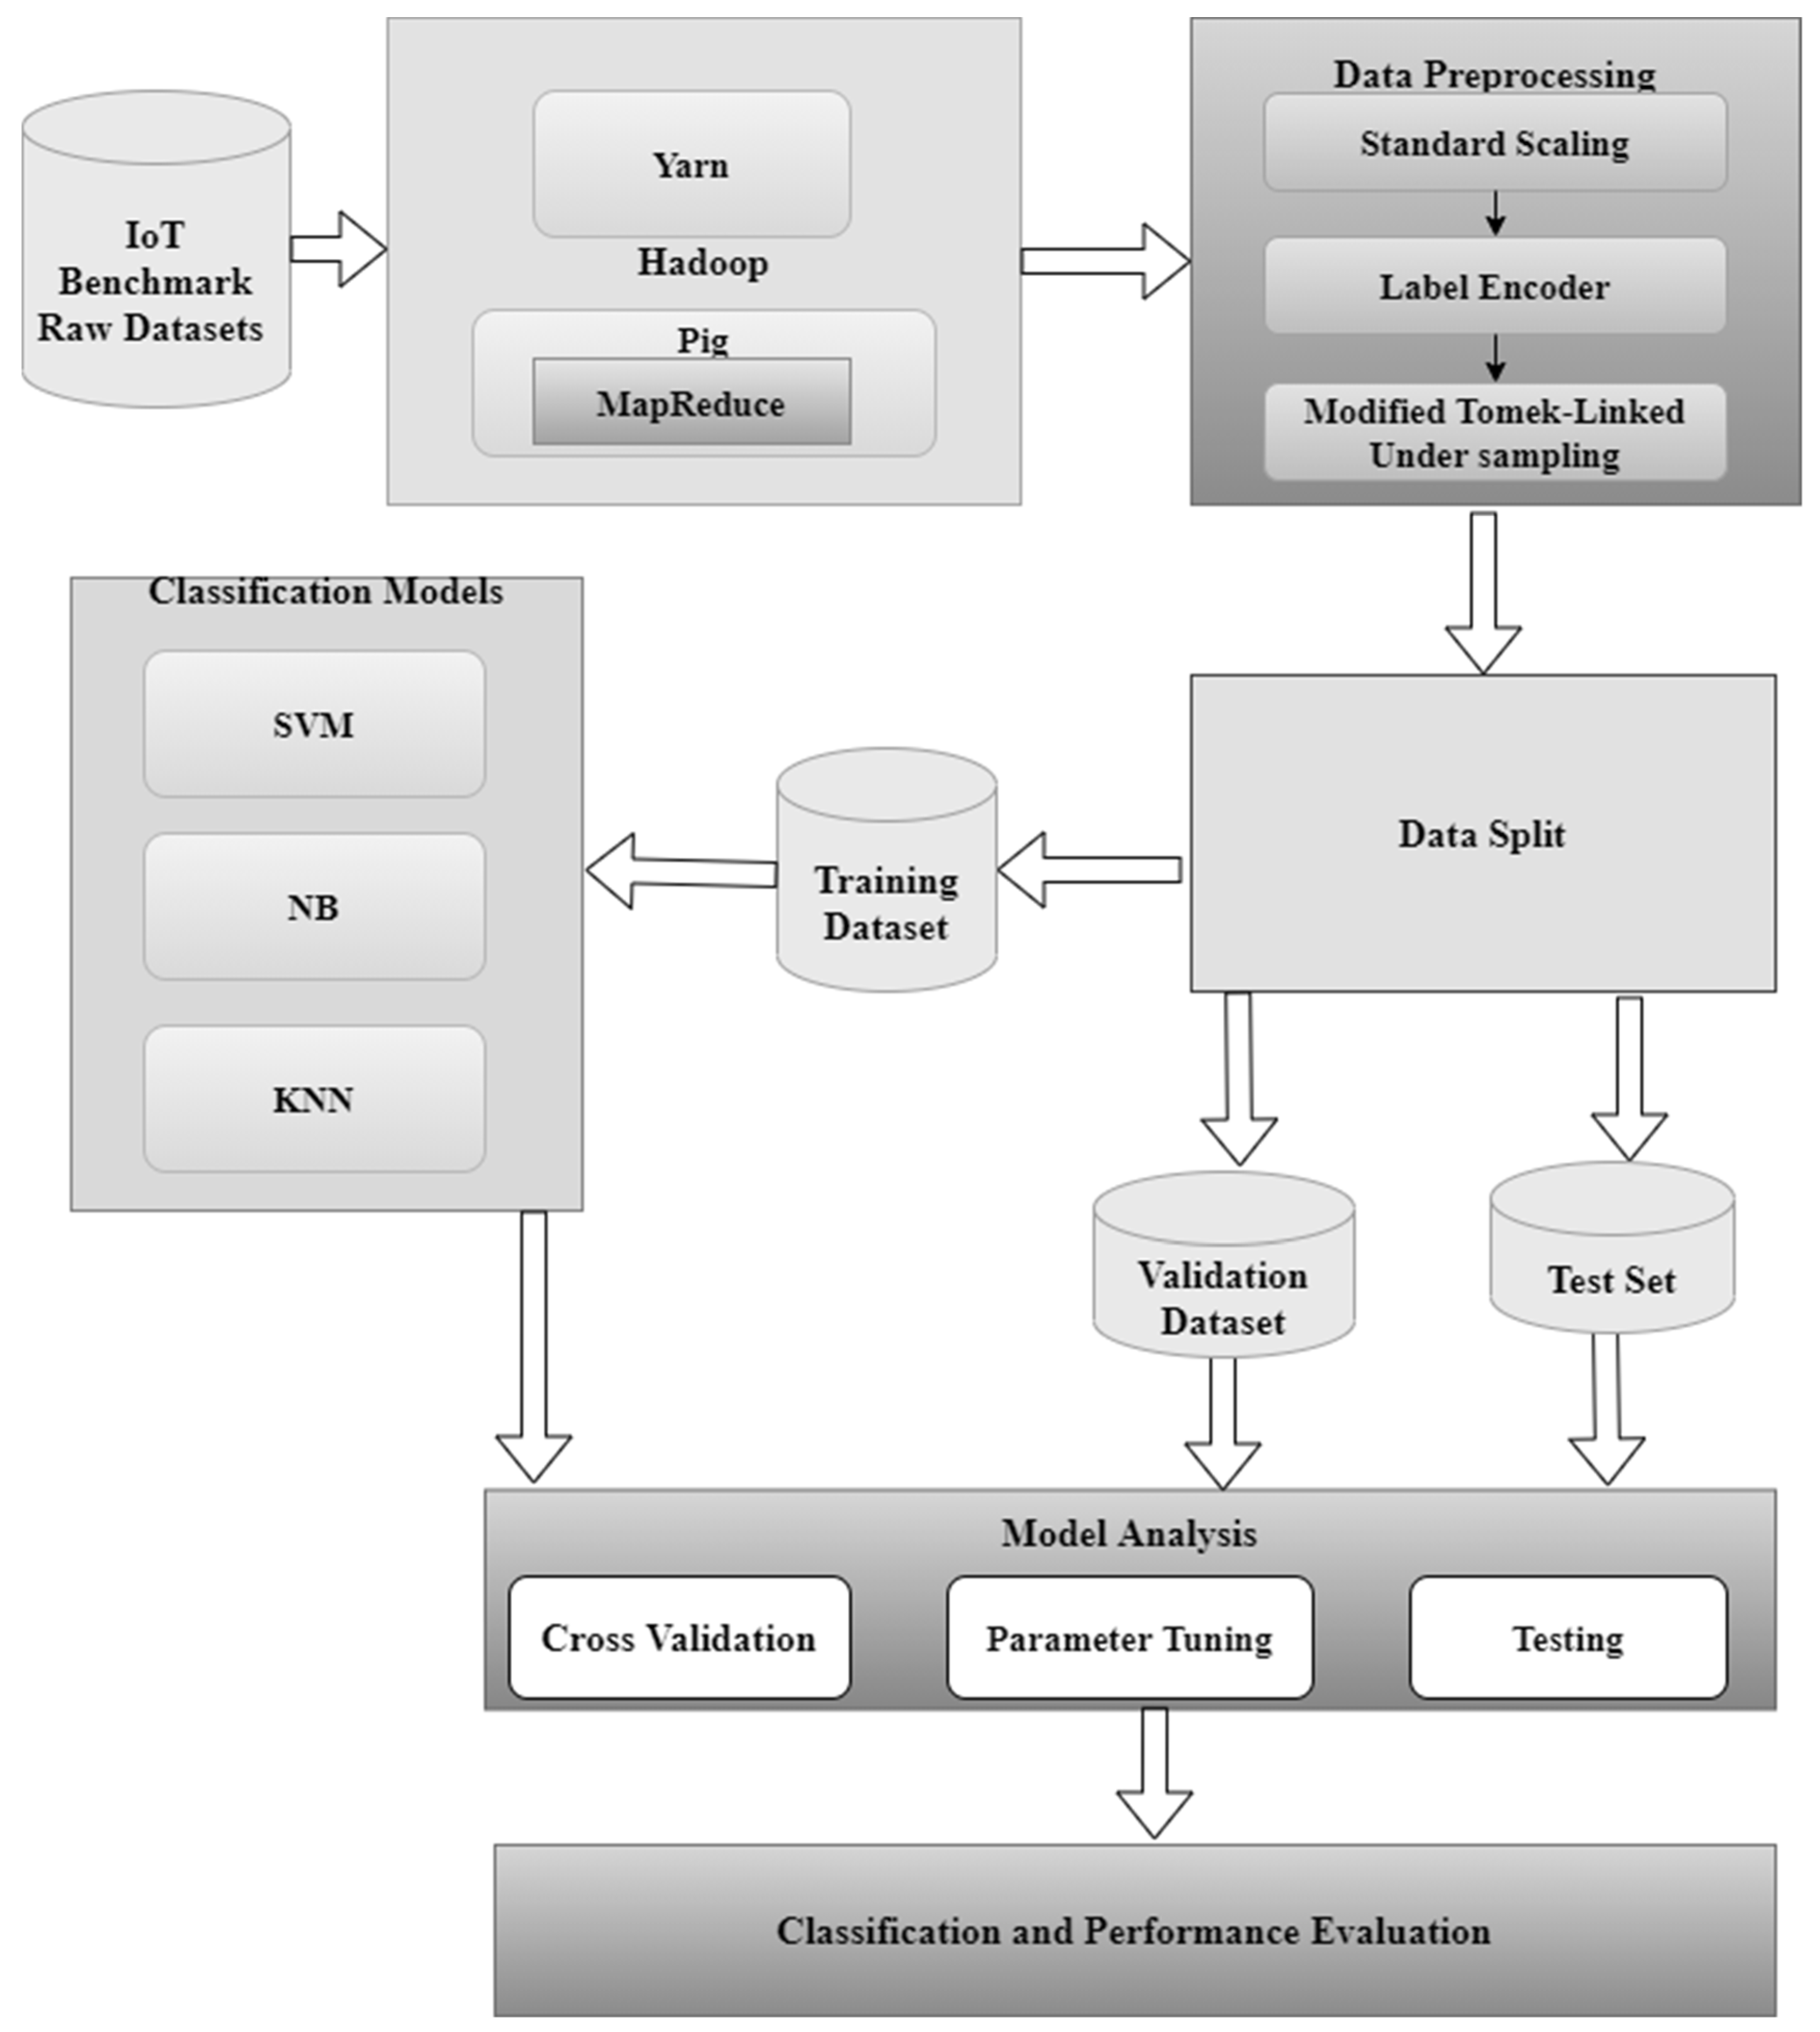
3. Methods and Framework Adopted for Proposed Approach
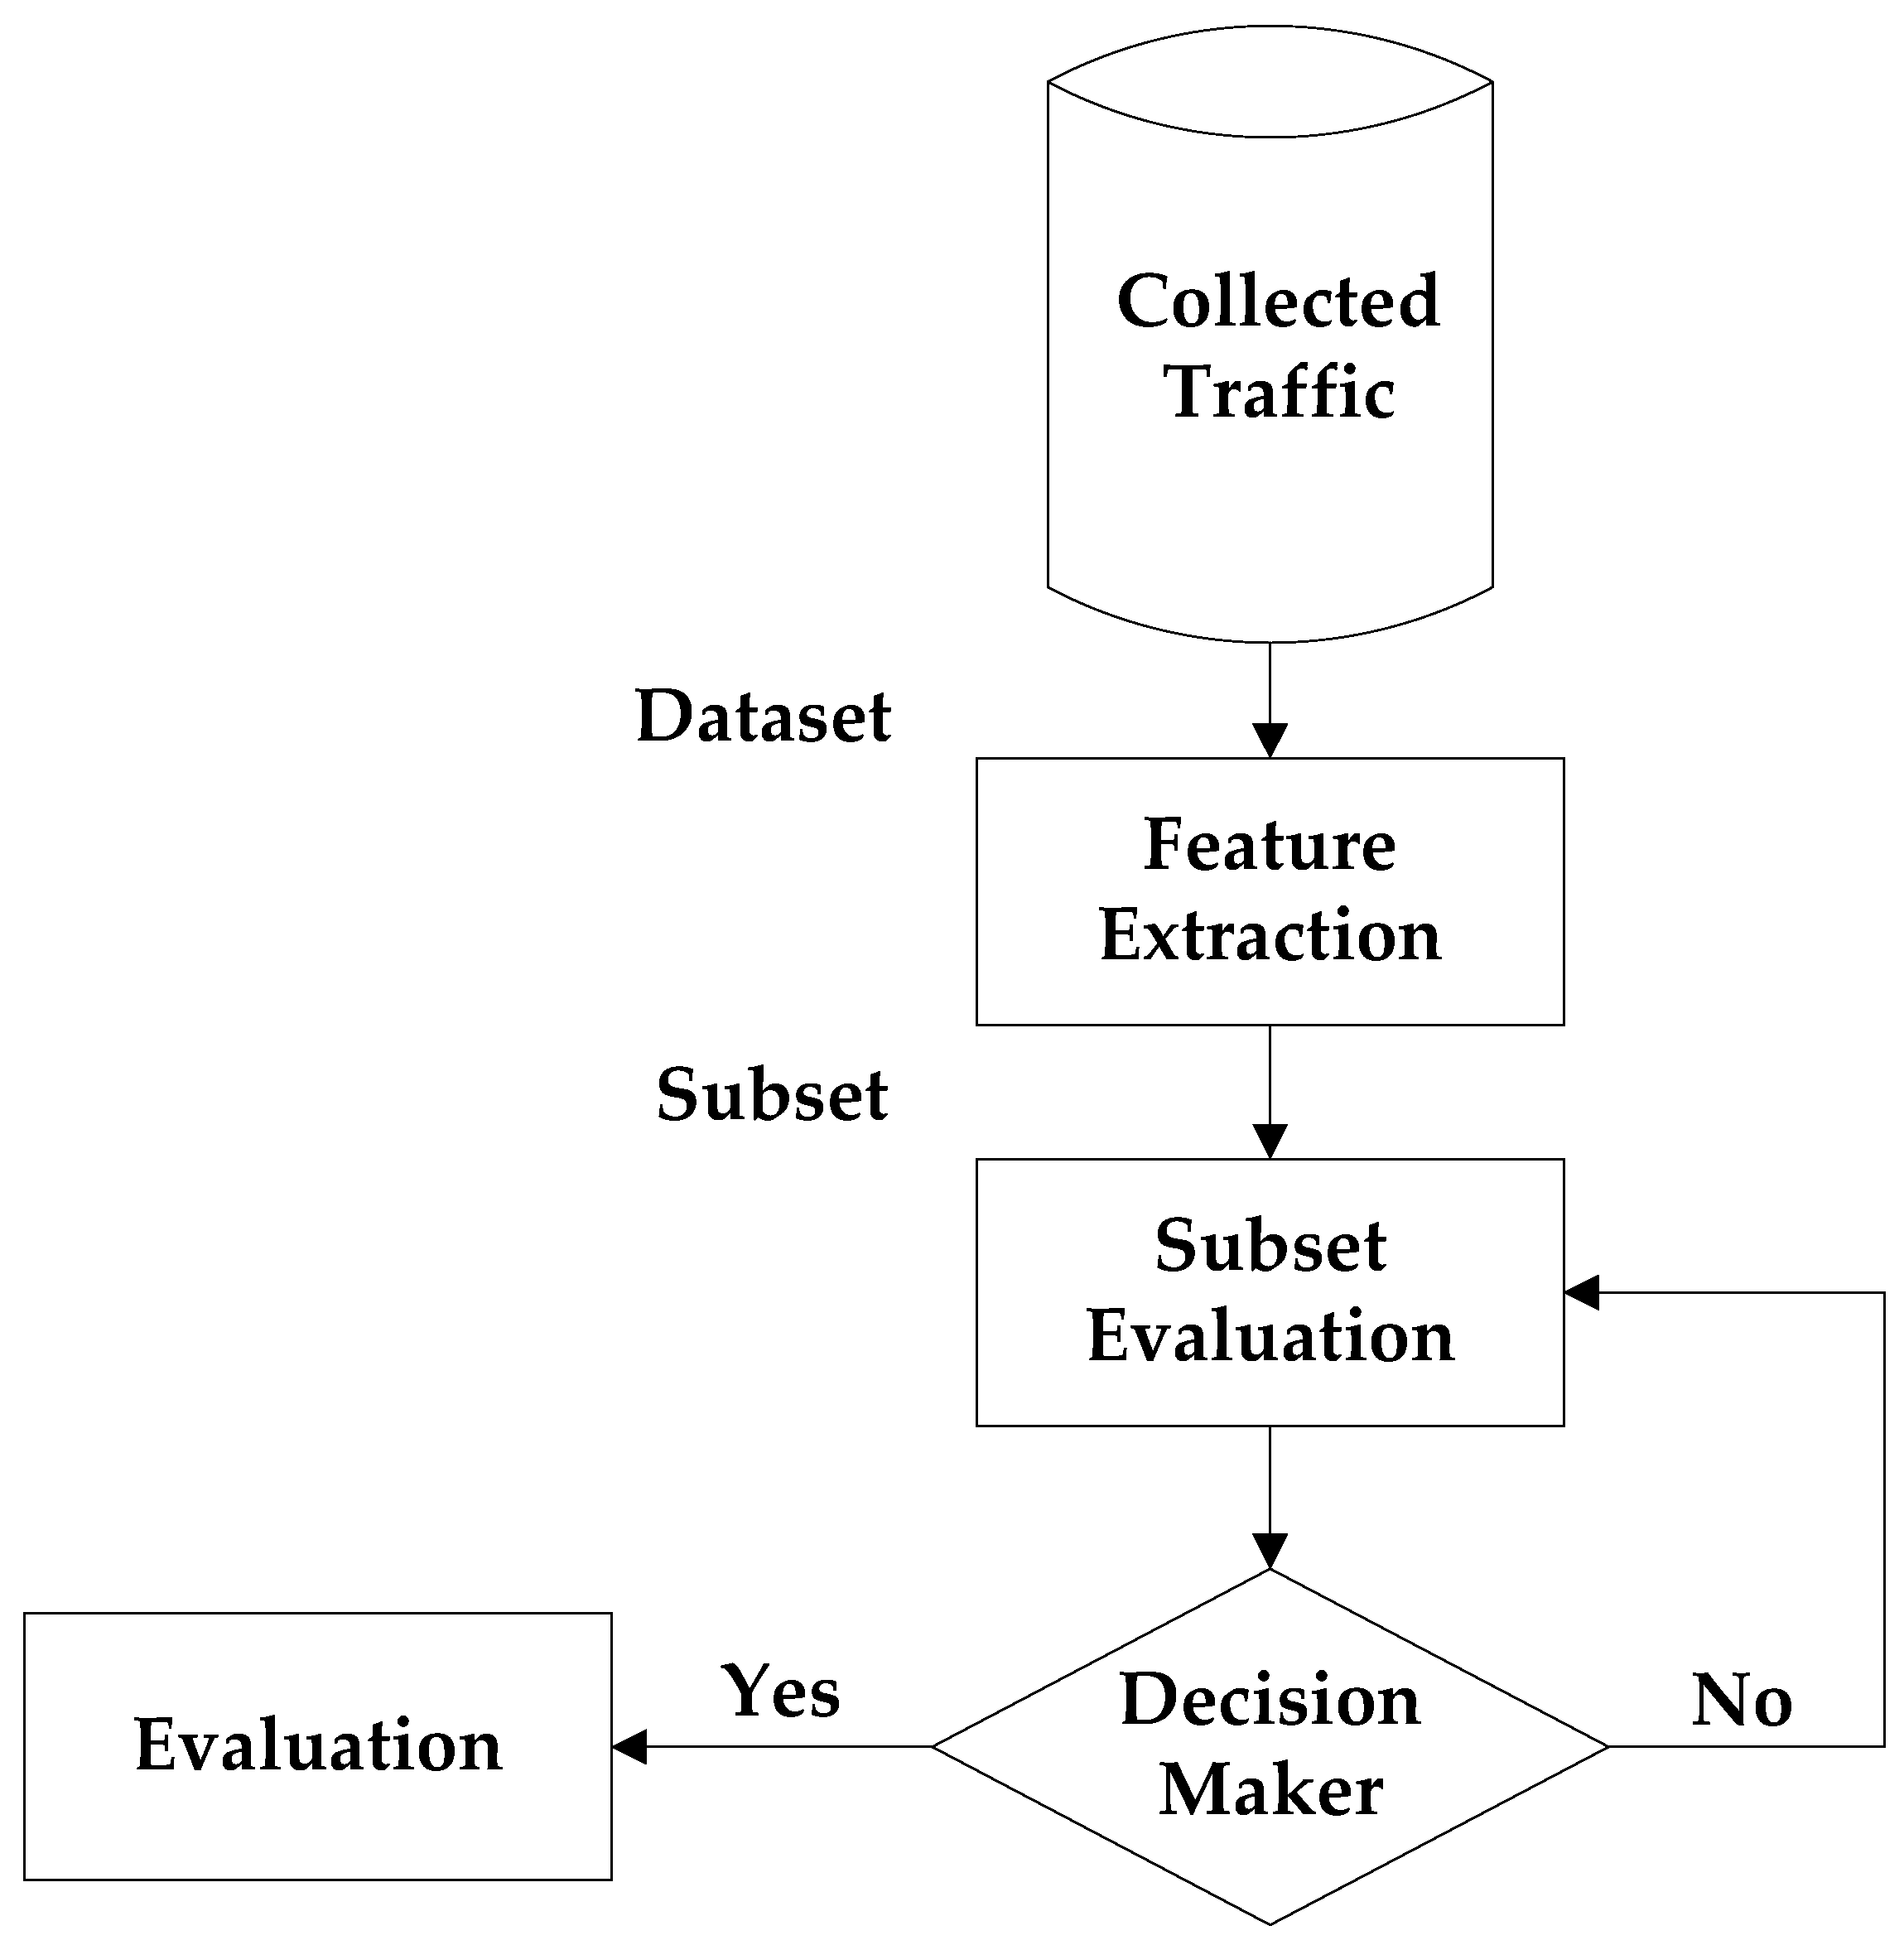
3.1. Identification of Outlier
3.2. Identification of Redundant and Noisy Samples
- (i).
- City-block distance () is represented in Equation (1).and
- (ii).
- Euclidean distance () for two samples and is represented in Equation (3).and
- (iii).
- Cosine similarity is a similarity degree which determines the cosine angle among two samples, and where the result is within the series . Cosine similarity is given in Equation (5).
- (iv).
- Euclidean dot product is defined by
- (v).
- By substituting the value of in (6)
3.3. Contribution Element, ()
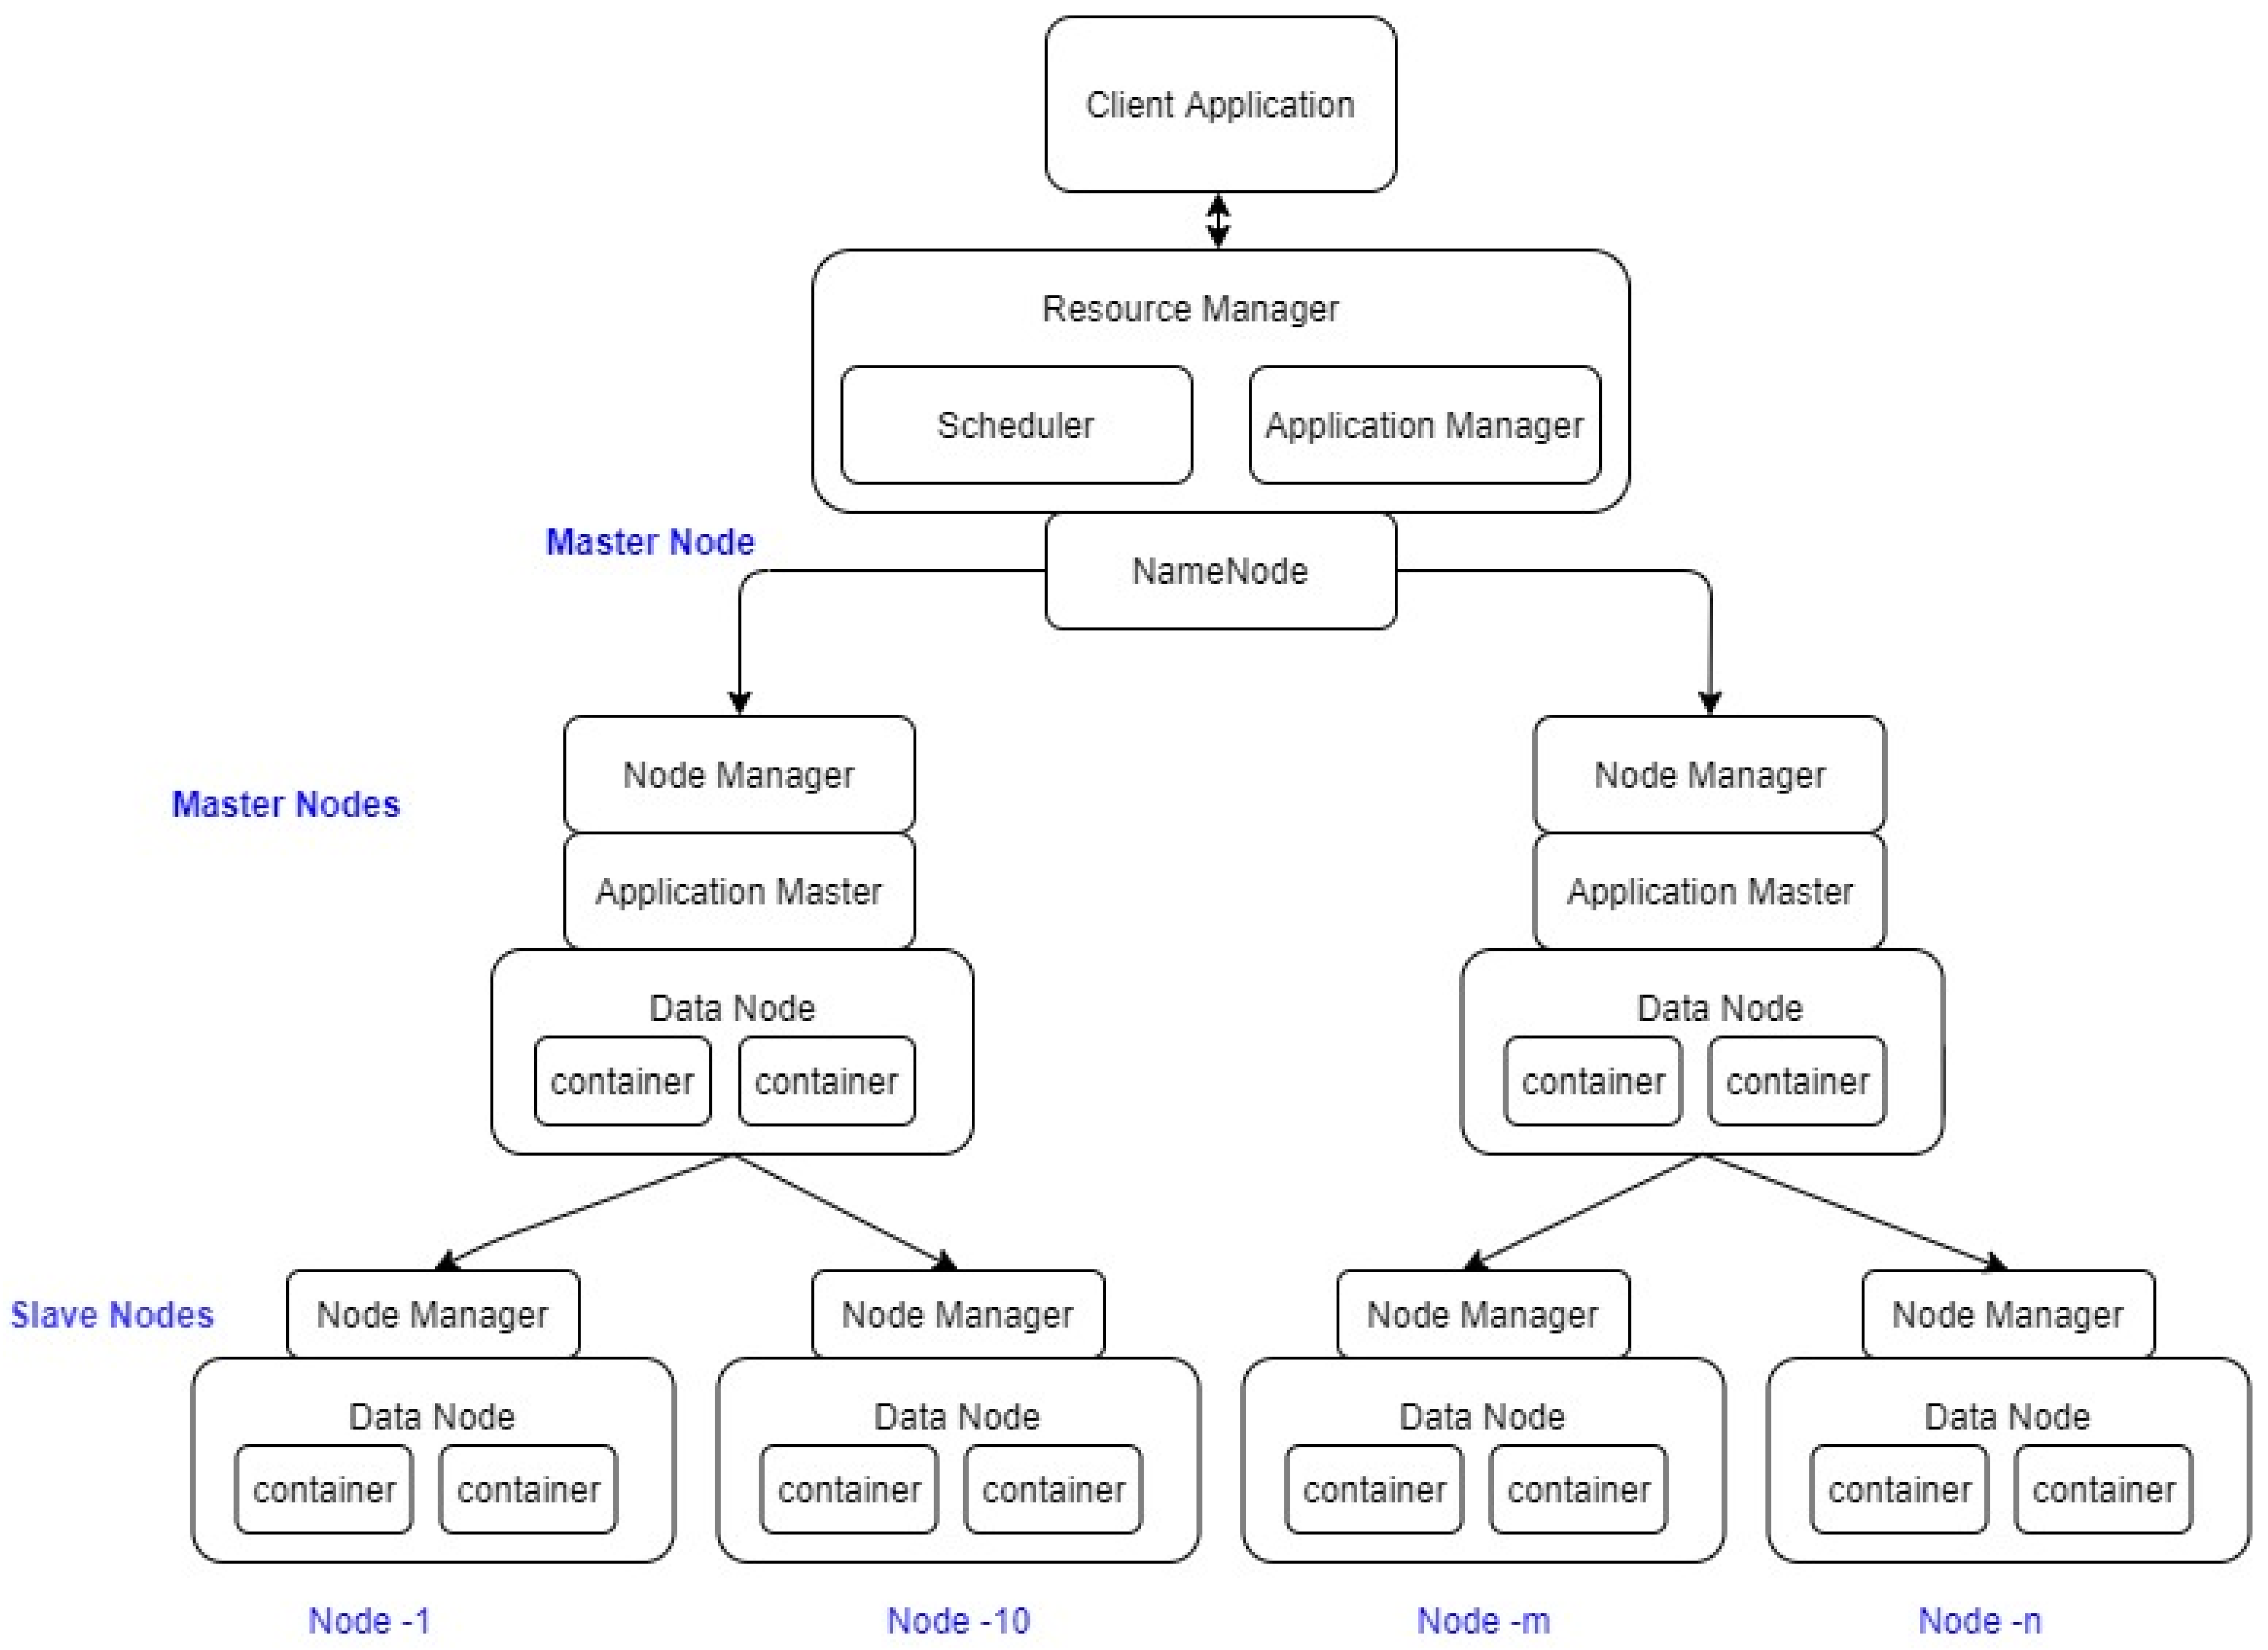
3.4. Hadoop Architecture Overview
4. Proposed IoT Intrusion Detection Model
4.1. Machine Learning to Predict IoT Threats
- DoS Attacks: A serious concern is DoS attacks that originate from IoT devices. Multi-Layer Perceptron (MLP) is one approach that secures networks against such attack. MLP trained by integrating particle swarm optimization with backpropagation technique [53] was proposed which can enhance the security of wireless networks. The detection accuracy will increase by using ML techniques and IoT devices will be secured from the DoS attacks.
- Privacy Leakage: IoT application trust [56] is developed by commodity integrity detection algorithm (CIDA) developed from Chinese remainder theorem (CRT).
- Digital Fingerprinting: IoT systems can be secured by digital fingerprinting and thereby end users will be confident to utilize applications. Smartphones, payments, unlocking car and home doors are implementing fingerprinting. Nontraditional solutions are developed using various machine learning algorithms which are given below.
4.2. Secure Model for IoT Traffic
4.3. Data Pre-Processing
4.3.1. Identification of Outlier and Tomek-Link Pairs
- Dataset, using ‘’ samples and the feature space consisting of ‘’ number of attributes.
- , , and threshold () to calculate the majority index samples, .
- —An imbalanced dataset, with ‘’ number of samples and ‘’ represents the number of attributes
- —Minority class set samples, , ‘’ is the sum of minority class samples.
- —Majority class set samples, , ‘’ is the sum of majority class samples.
- —Set of Tomek-linked samples.
- —Total minority samples, to which majority sample, is connected as Tomek-linked pair.
- —Improved subset of , after removing samples, identified to be outliers.
- Split the complete dataset, into two subsets, and .
- For every , calculate the k-nearest neighbor using Euclidean measure, , for .
- The nearest neighbor pairs are included in the subset, .
- For each , determine index .
- If index , where h represents threshold; is identified as ‘outlier’, existing in the minority area of the subset, and are removed.
- Updating the subset to as
- Updating the subset to as .
4.3.2. Estimation of Redundancy among Majority Samples
- , r = number of utmost redundant samples which helps to create, . Set .
- For every , deploy the various distance measures like ED, CB and CS to calculate the redundant pairs, specified in Equations (1)–(7) and transferred to the subset, as .
- A revised subset, is generated by eliminating the majority samples contributing to redundancy and noise. Thus, the intersection of and , is given as: .
4.3.3. Estimation of the Contribution Factor
4.3.4. Under-Sampling of Majority Samples
4.3.5. Algorithm
| Algorithm 1. Tomek-linked and redundancy-based under-sampling |
| Input: A dataset, S with “n” samples and the feature space using “h” features. Each sample is represented by () where is the vector input for th-sample, identified as with a sum of h-features and are the chosen category labels from the samples containing the sum of c-classes; where k = total of nearest neighbors with set k = 1 to identify Tomek-link pair. Begin:
|
4.4. Classification
- Naive Bayes;
- KNN; and
- SVM
4.4.1. Naive Bayes (NB)
4.4.2. KNN
4.4.3. SVM
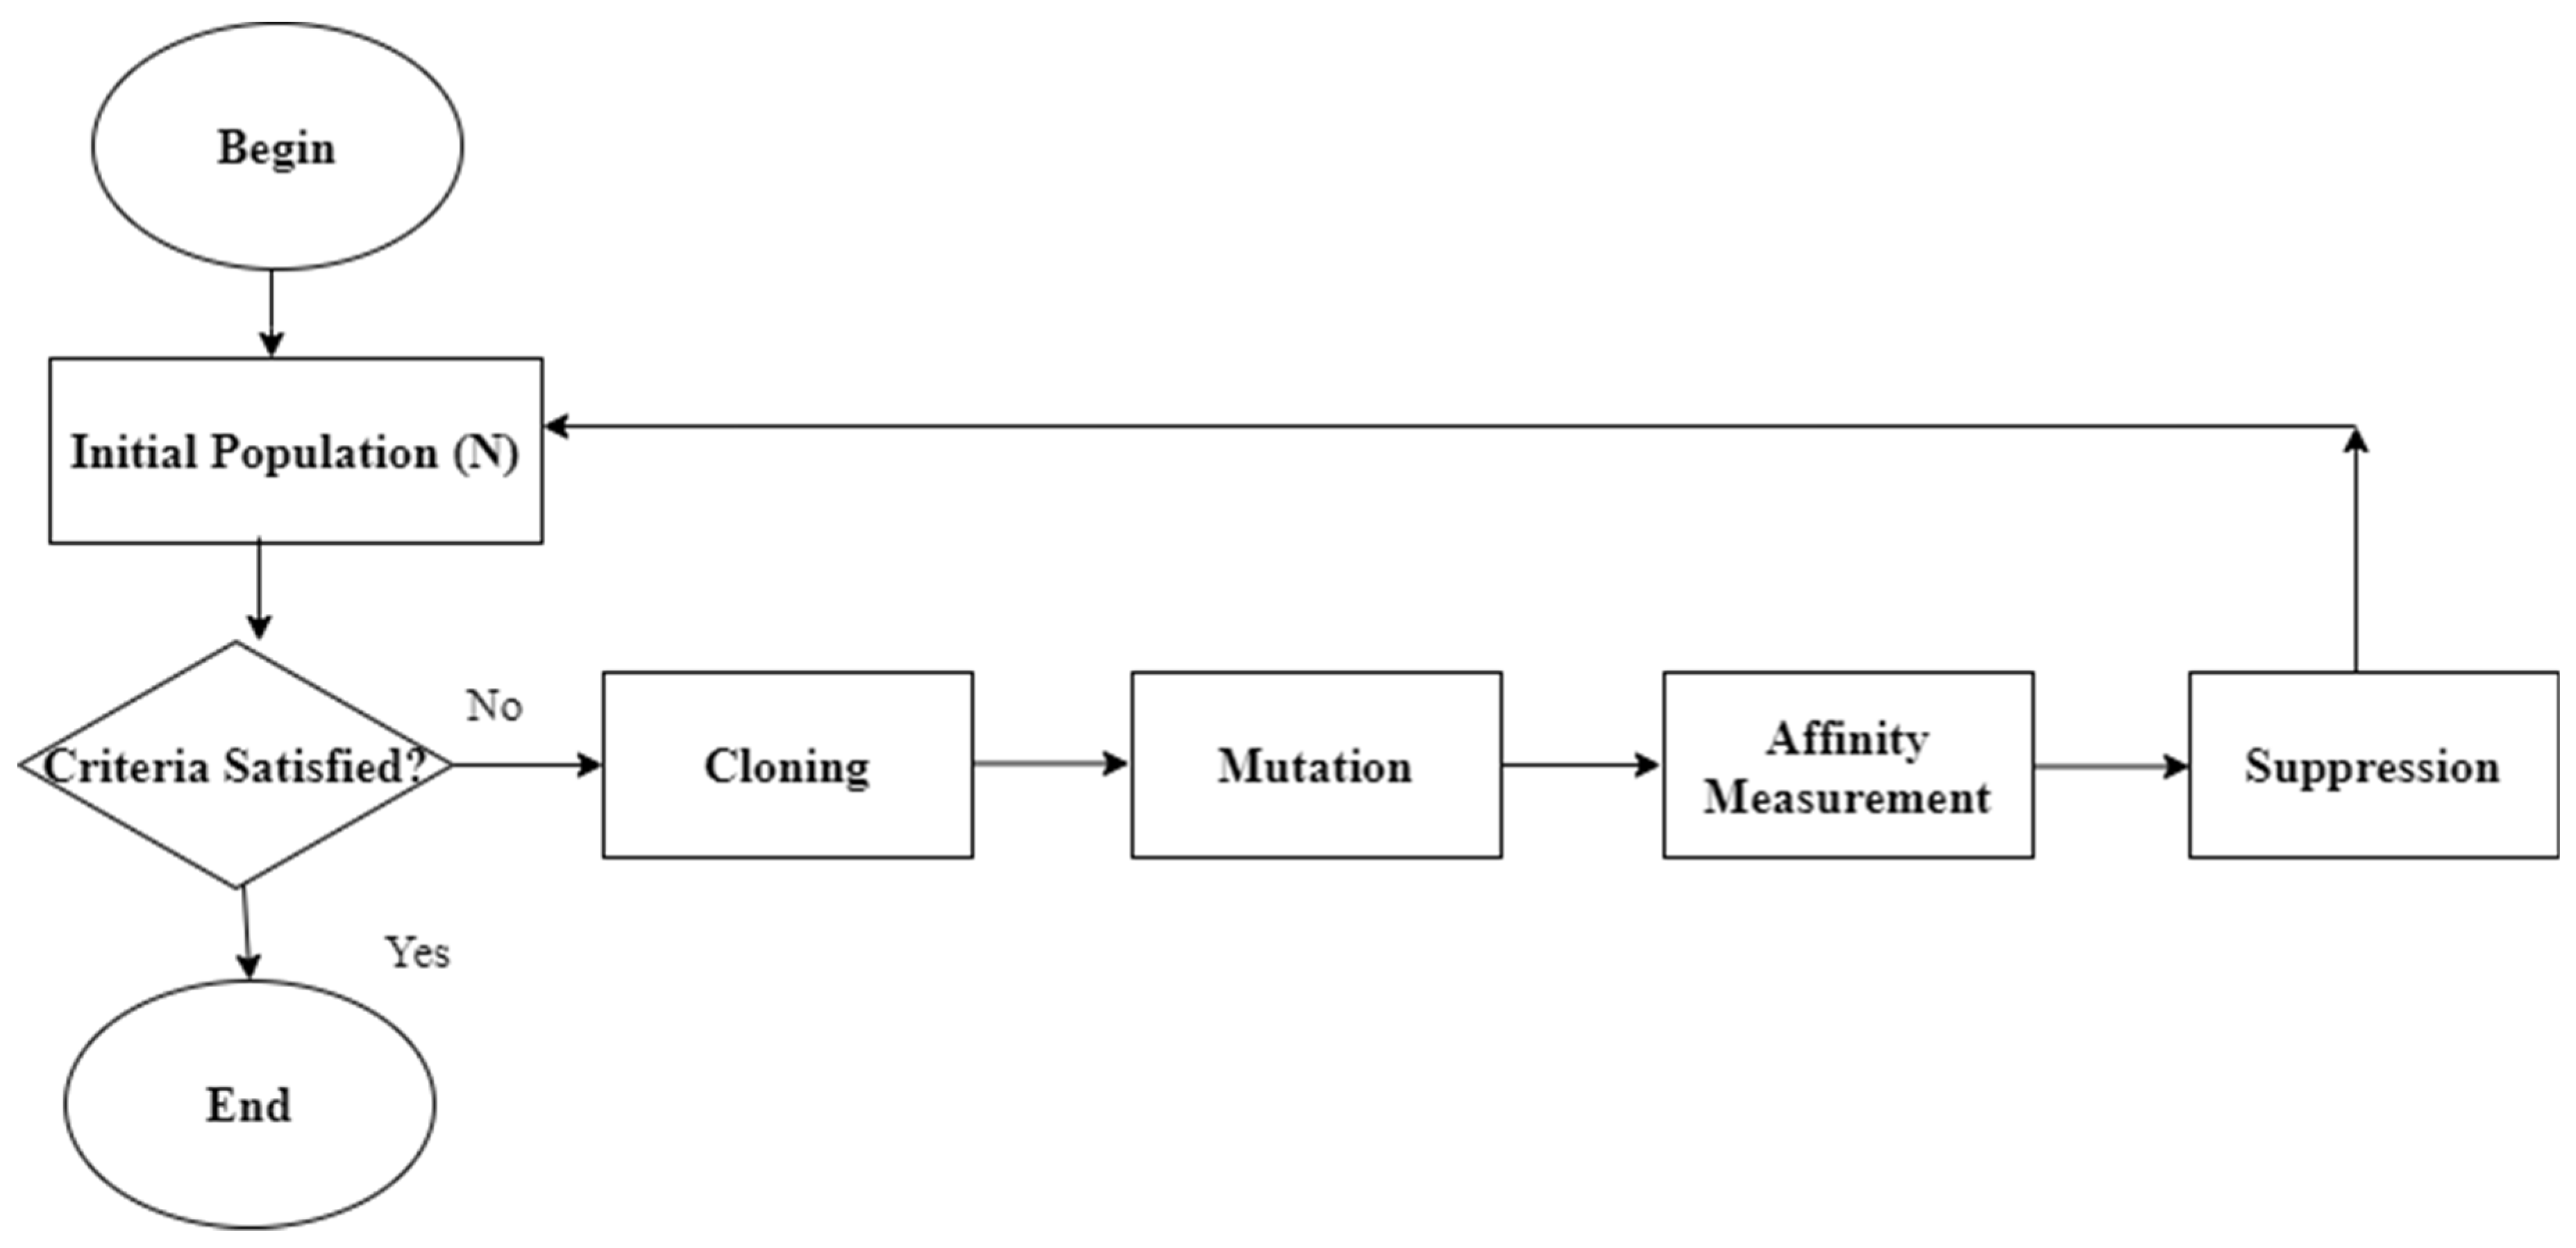
4.5. Artificial Immune Network (aiNet) for Hyperparameter Optimization
5. Results and Analysis
5.1. Datasets
5.1.1. ToN-IoT Dataset
5.1.2. BoT-IoT Dataset
5.2. Comparison with Baseline Approaches
- Random under-dampling (RUS): This is one of the basic techniques for undersampling to eliminate majority samples randomly.
- Condensed nearest neighbor (CNN): This approach eliminates samples randomly concerning nearest neighbor rule.
- Tomek-link: This is a modification of CNN which eliminates interior samples that are in the closeness of the decision boundary.
5.3. Setting Appropriate Values for Parameter ‘t’
5.4. Hyper Tuning Parameters Using AiNet
5.5. Results
6. Performance Analysis
6.1. Confusion Matrix
- True Positive (TP)—represents the total ‘positive’ samples characterized as positive
- False Positive (FP)—represents the total ‘negative’ samples characterized as positive
- False Negative (FN)—represents the total ‘positive’ samples characterized as negative
- True Negative (TN)—represents the total ‘negative’ samples characterized as negative
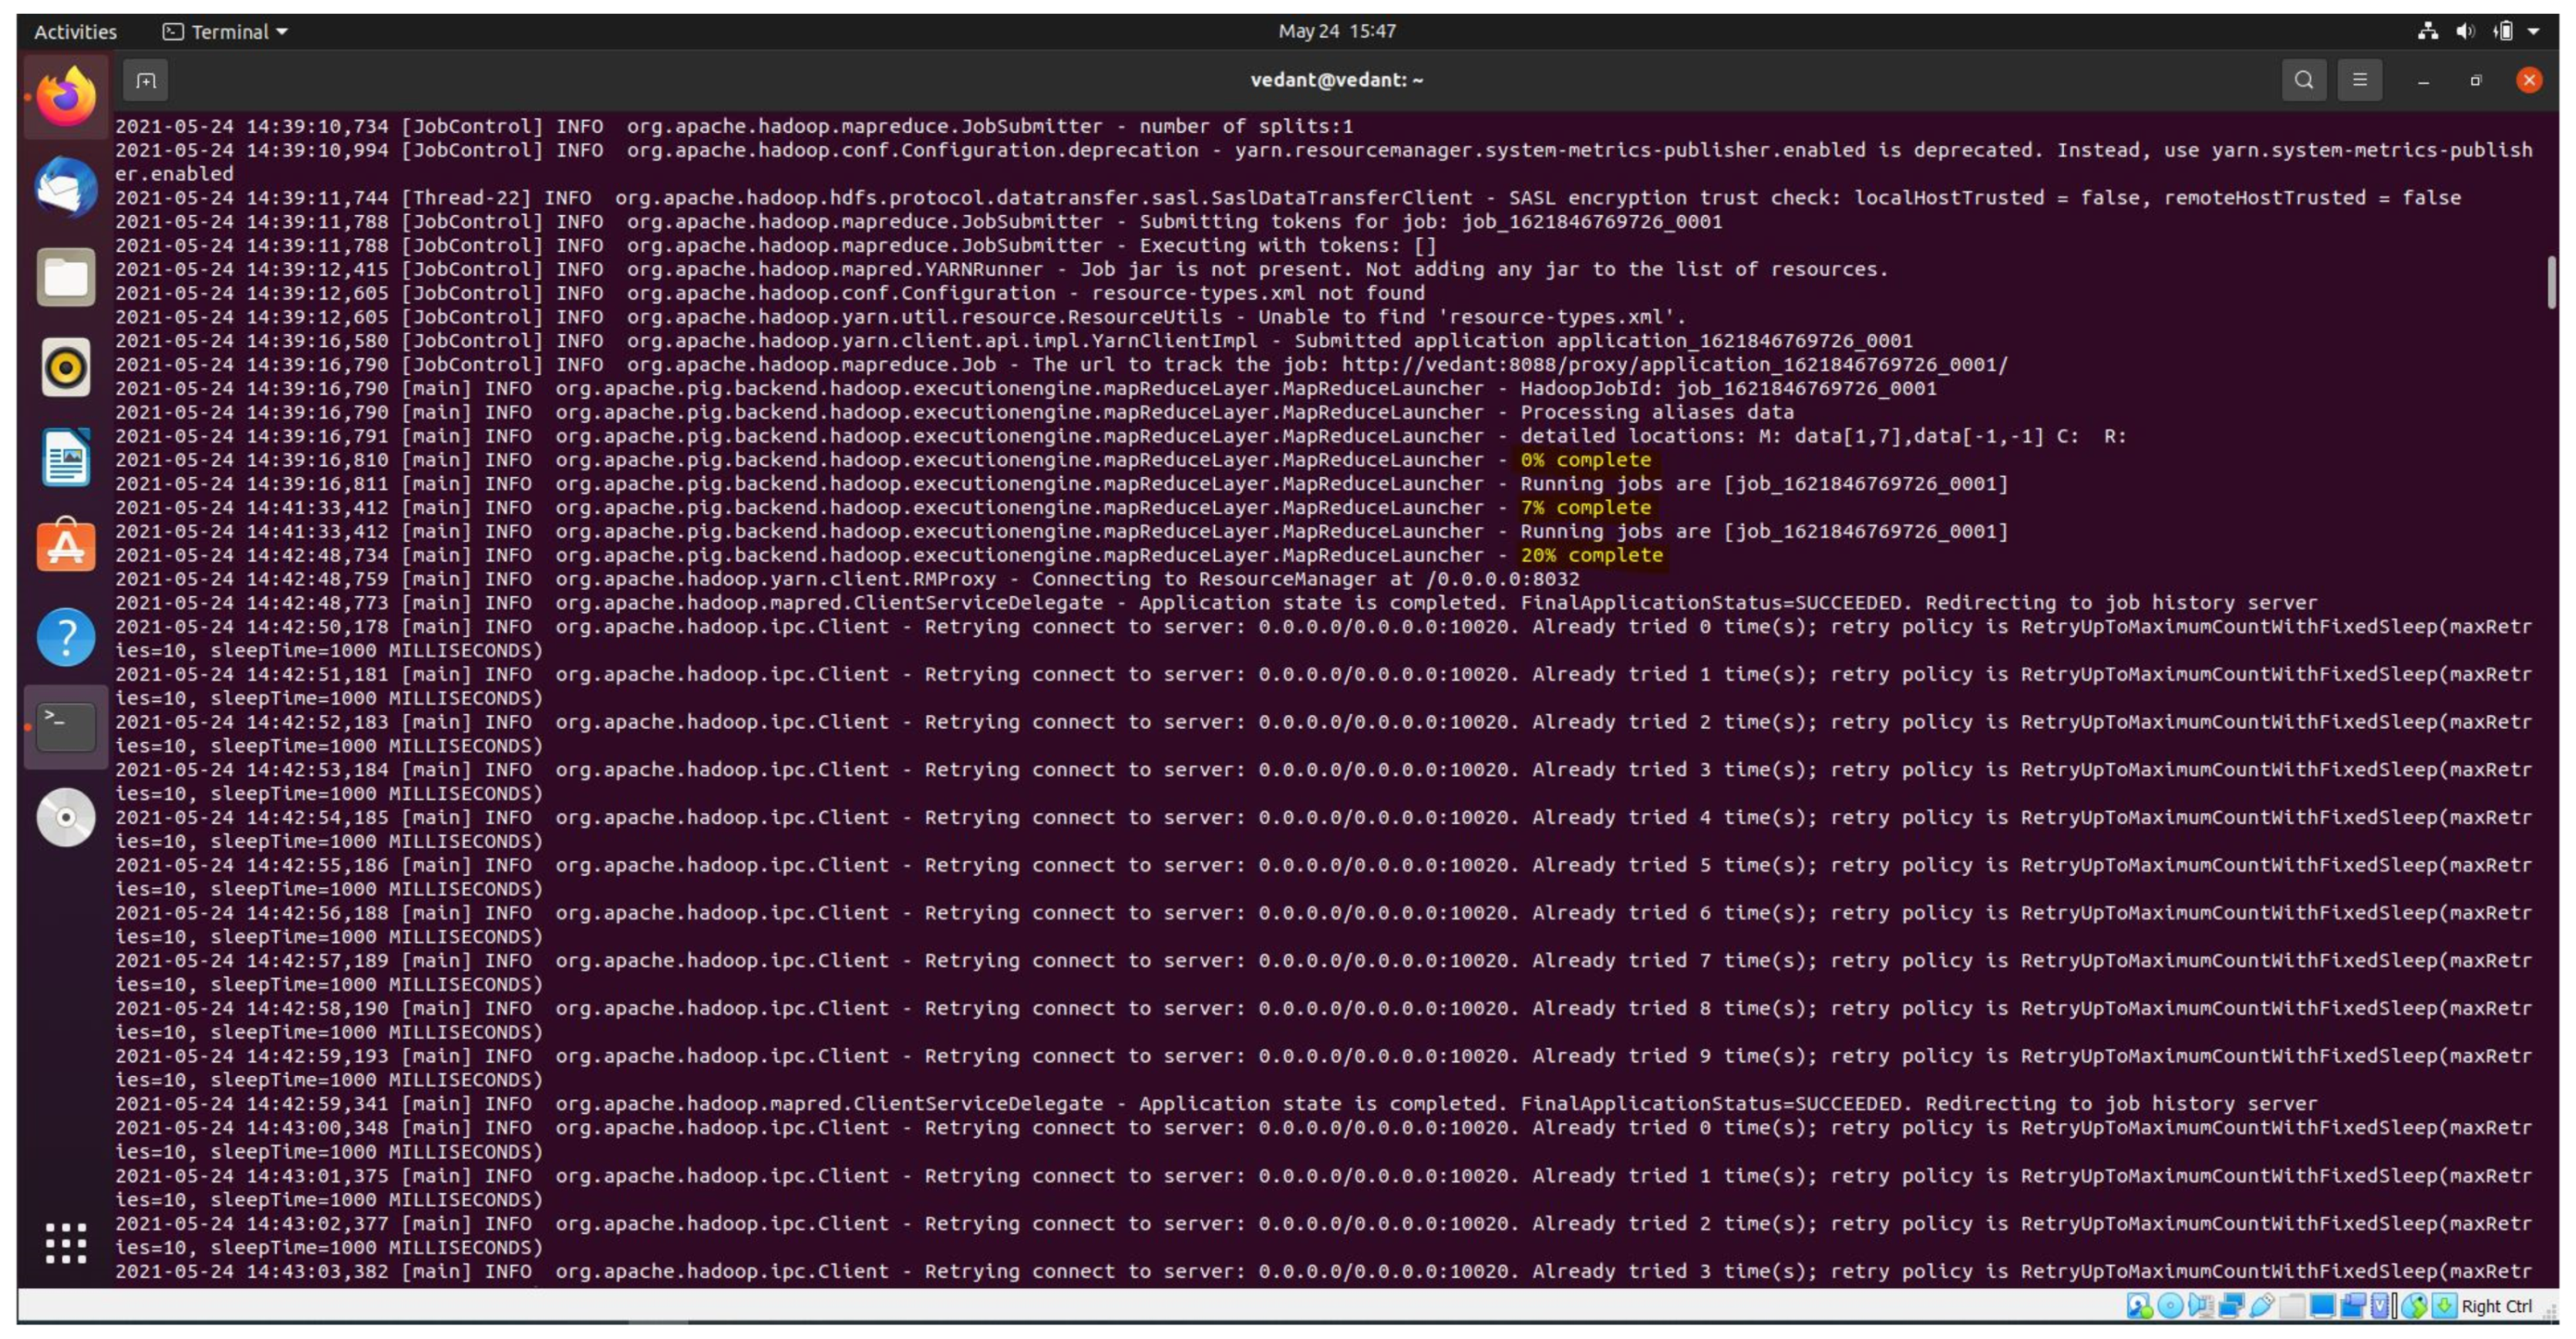
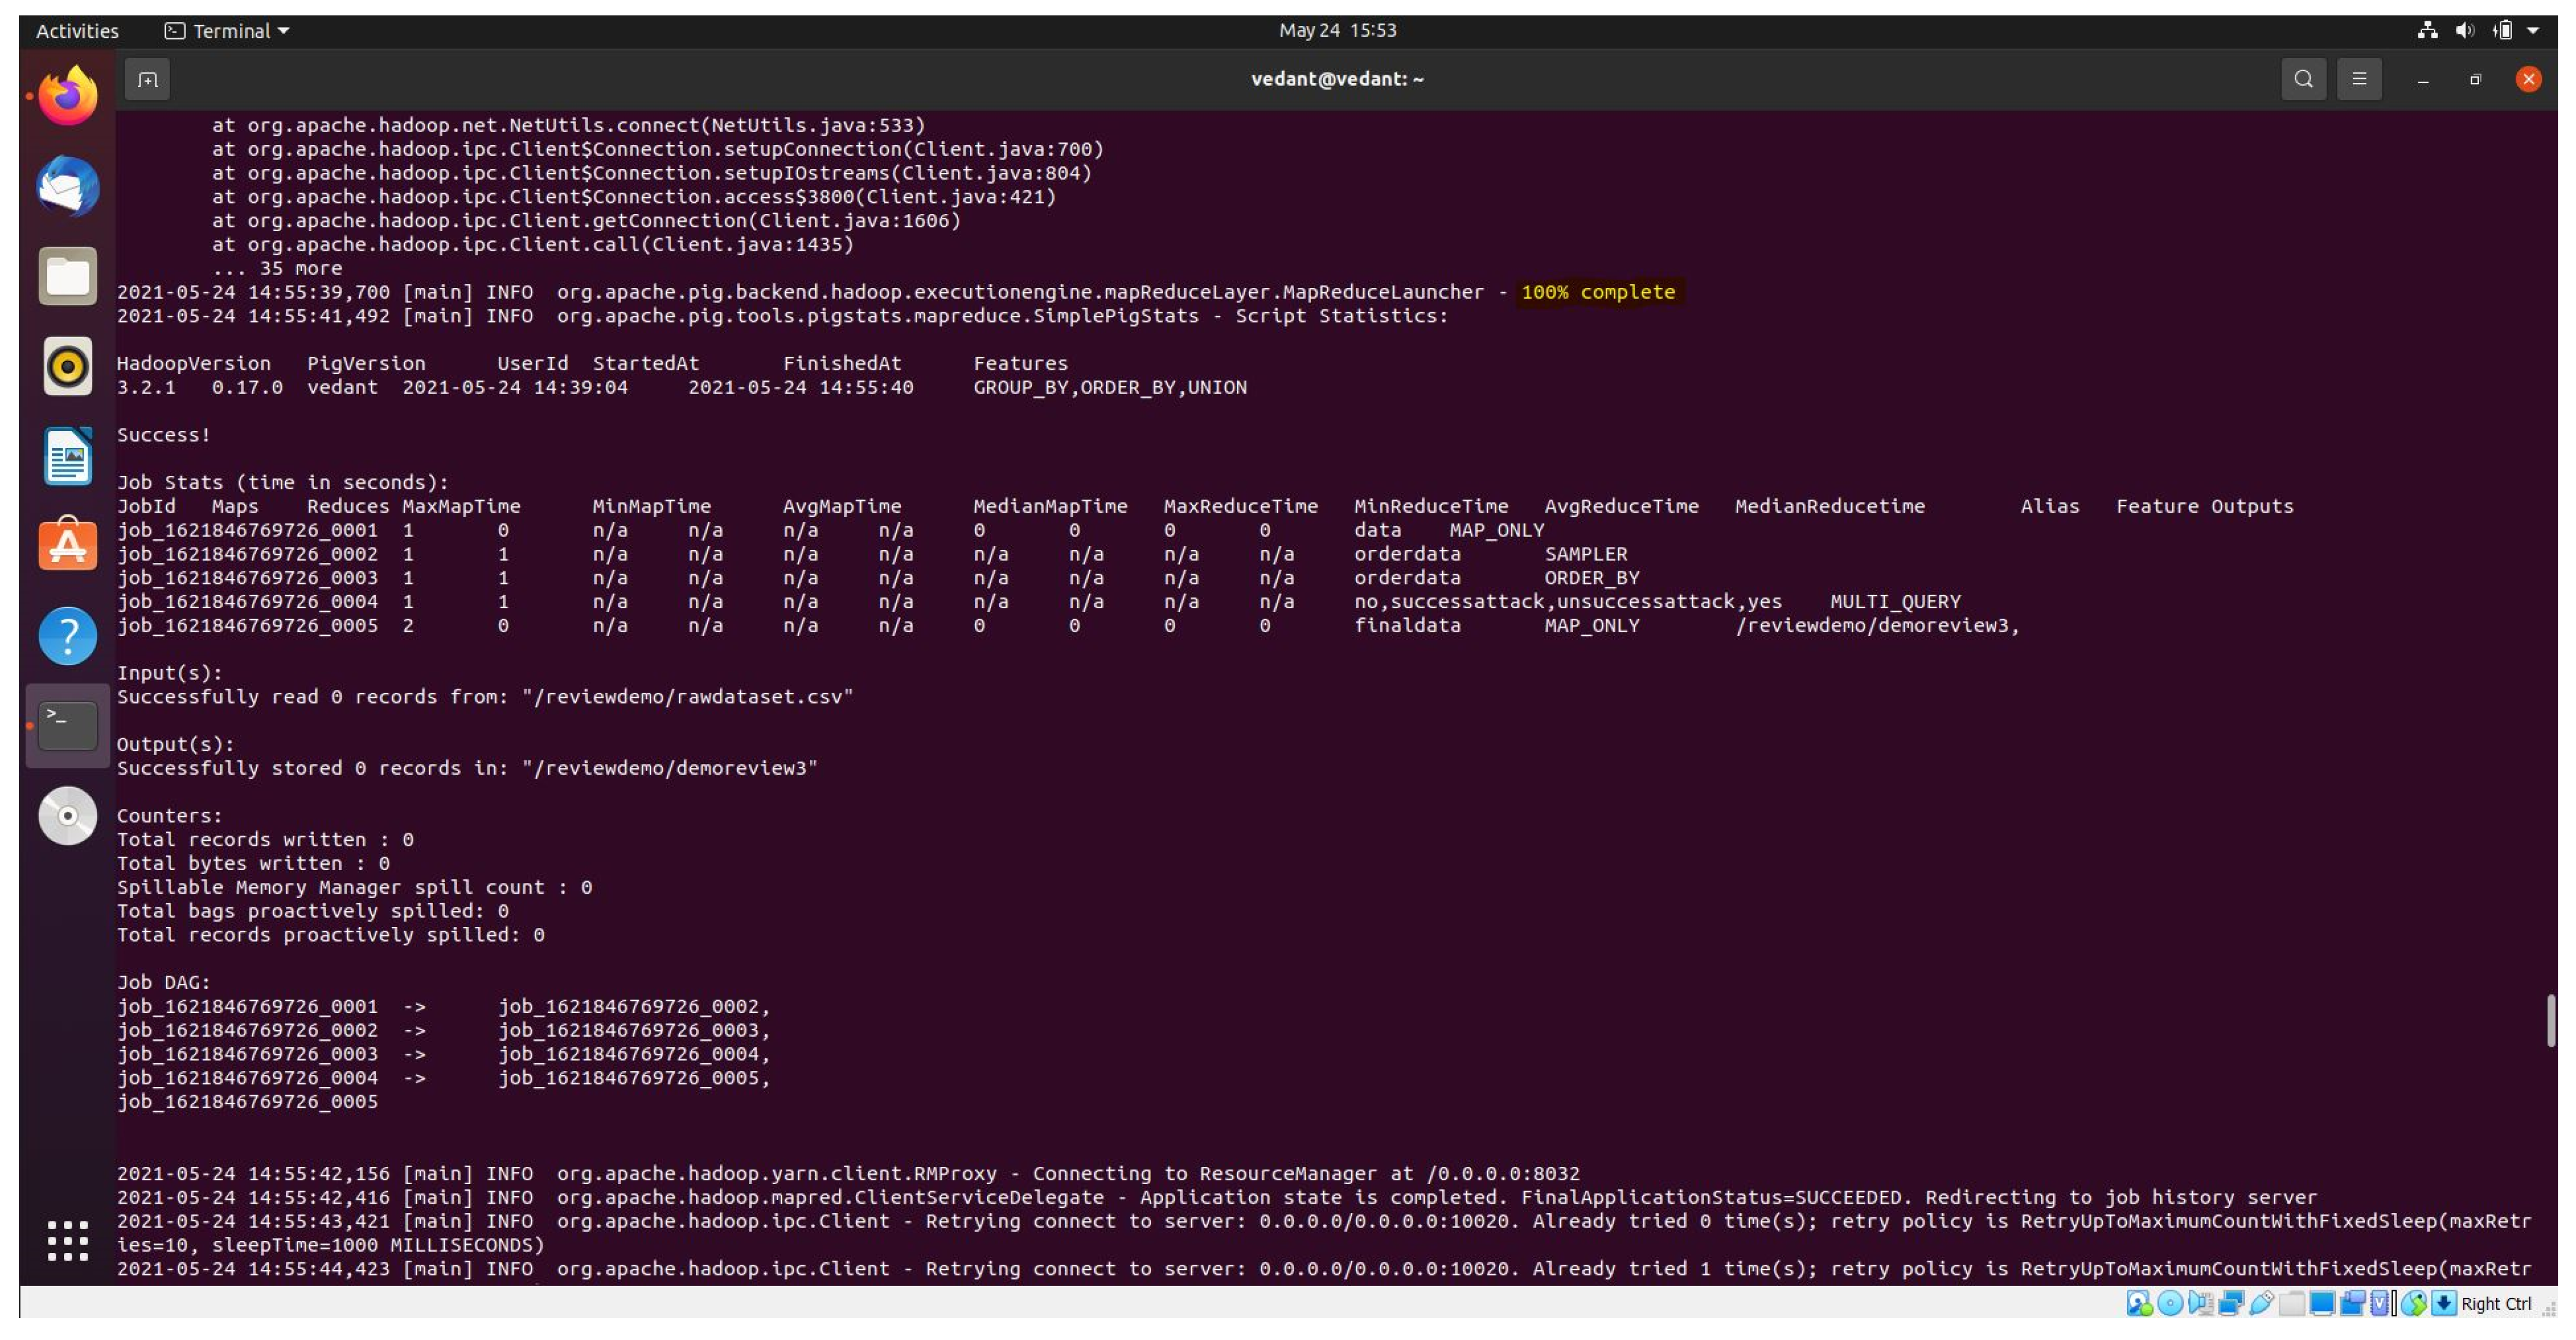
6.2. Intrusion Detection in Hadoop
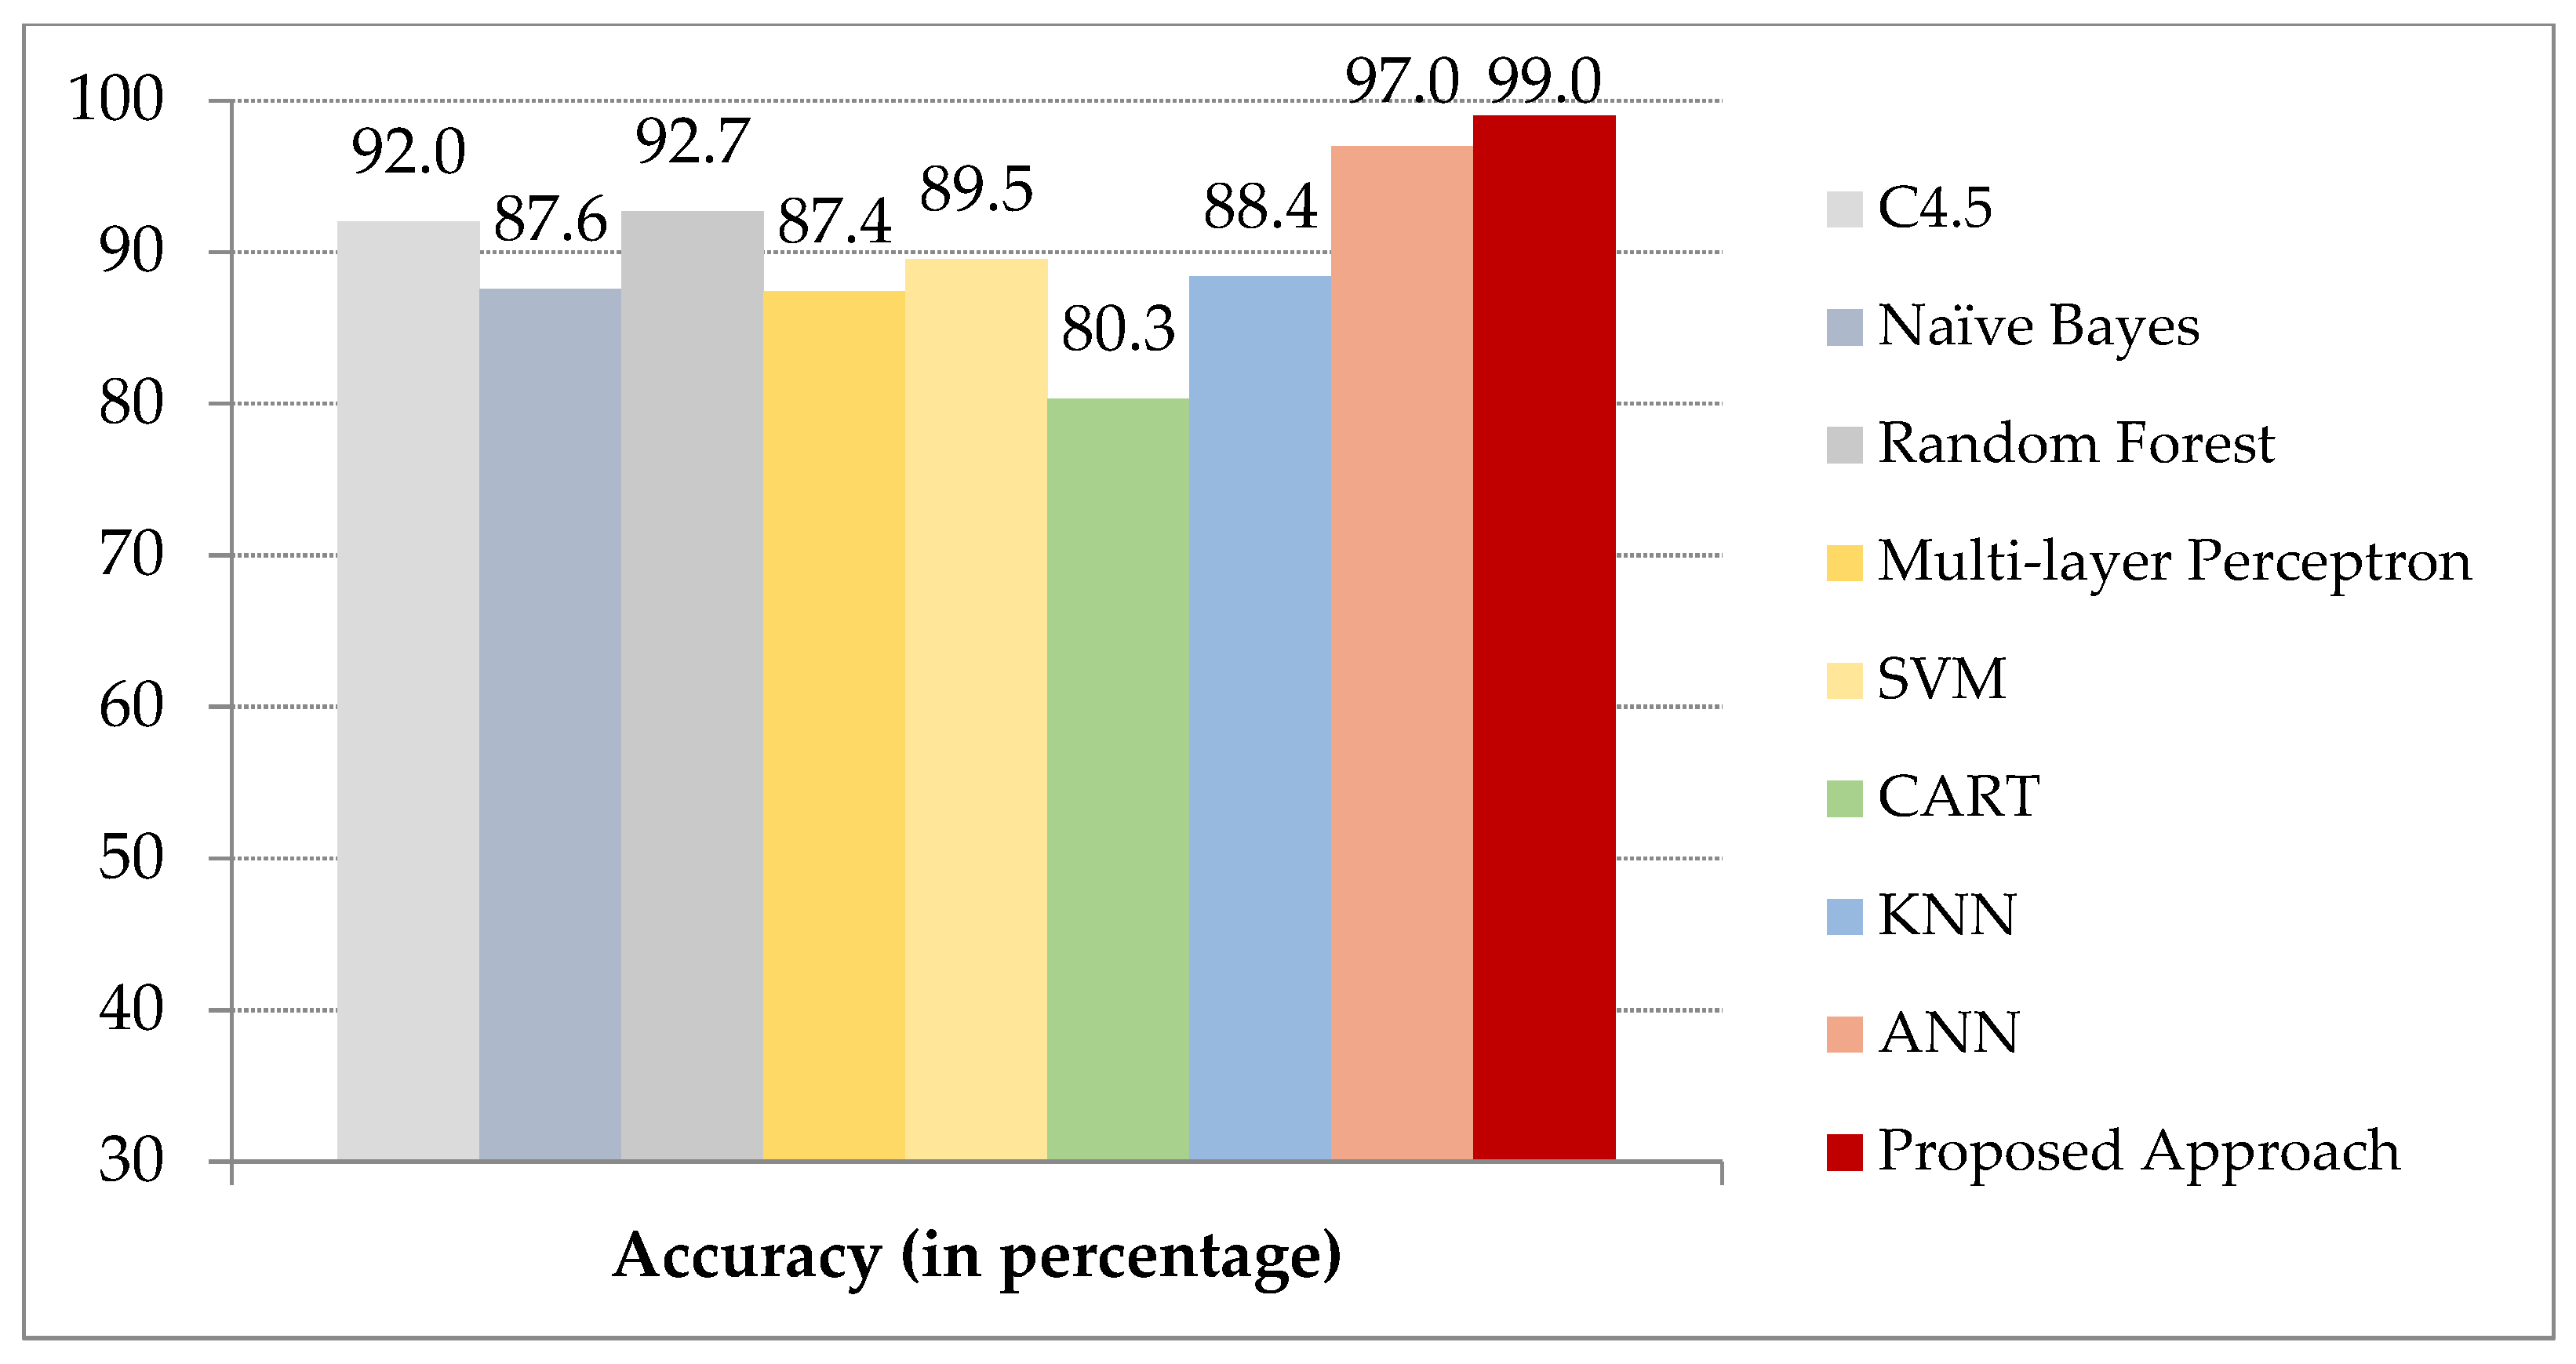
6.3. Discussion
7. Conclusions
Author Contributions
Funding
Conflicts of Interest
Abbreviations
| CFS | Correlation based Feature Selection |
| CST-GR | Correlated-set thresholding on gain-ratio |
| DNS | Domain Name System |
| ELM | Extreme Learning Machine |
| FAR | False Alarm Rate |
| IDS | Intrusion Detection System |
| IoMT | Internet of Medical Things |
| IoT | Internet of Things |
| KNN | K-Nearest Neighbor |
| LDA | Linear Discriminant Analysis |
| LMT | Logistic Model Tree |
| NB | Naïve Bayes |
| PCA-GWO | Principal Component Analysis-Grey Wolf Optimization |
| RF | Random Forest |
| SVM | Support Vector Machine |
| VFDT | Very Fast Decision Tree |
| VoIP | Voice Over Internet Protocol |
| WSN | Wireless Sensor Network |
Appendix A
| Algorithm A1. Proposed Approach |
| Given: Classifier |
Input: Optimal featured dataset D Output: Class label
|
References
- Demiris, G.; Hensel, B.K. Technologies for an aging society: A systematic review of “smart home” applications. Yearb. Med. Inform. 2008, 3, 33–40. [Google Scholar]
- Denning, T.; Tadayoshi, K. Empowering consumer electronic security and privacy choices: Navigating the modern home. In Proceedings of the Symposium on Usable Privacy and Security (SOUPS), Newcastle, UK, 24–26 July 2013. [Google Scholar]
- Amini, P.; Araghizadeh, M.A.; Azmi, R. A survey on Botnet: Classification, detection and defense. In Proceedings of the 2015 International Electronics Symposium (IES), Surabaya, Indonesia, 29–30 September 2015; pp. 233–238. [Google Scholar]
- Koroniotis, N.; Moustafa, N.; Sitnikova, E.; Turnbull, B. Towards the development of realistic botnet dataset in the internet of things for network forensic analytics: Bot-iot dataset. Future Gener. Comput. Syst. 2009, 100, 779–796. [Google Scholar] [CrossRef] [Green Version]
- Hassija, V.; Chamola, V.; Saxena, V.; Jain, D.; Goyal, P.; Sikdar, B. A survey on IoT security: Application areas, security threats, and solution architectures. IEEE Access 2019, 7, 82721–82743. [Google Scholar] [CrossRef]
- Jain, M.; Kaur, G. Distributed anomaly detection using concept drift detection based hybrid ensemble techniques in streamed network data. Clust. Comput. 2021, 2021, 1–16. [Google Scholar]
- Devi, D.; Purkayastha, B. Redundancy-driven modified Tomek-link based undersampling: A solution to class imbalance. Pattern Recognit. Lett. 2017, 93, 3–12. [Google Scholar] [CrossRef]
- Hilton, S. Dyn Analysis Summary of Friday October 21 Attack. Dyn, 2016. Dyn Blog. Available online: https://dyn.com/blog/dyn-analysis-summary-of-friday-october-21-attack (accessed on 2 June 2021).
- Xiao, L.; Xiaoyue, W.; Zhu, H. PHY-layer authentication with multiple landmarks with reduced overhead. IEEE Trans. Wirel. Commun. 2017, 17, 1676–1687. [Google Scholar] [CrossRef]
- Cong, S.; Liu, J.; Liu, H.; Chen, Y. Smart user authentication through actuation of daily activities leveraging WiFi-enabled IoT. In Proceedings of the 18th ACM International Symposium on Mobile Ad Hoc Networking and Computing, Chennai, India, 10–14 July 2017; pp. 1–10. [Google Scholar]
- Jerkins, J.A. Motivating a market or regulatory solution to IoT insecurity with the Mirai botnet code. In Proceedings of the 2017 IEEE 7th annual computing and communication workshop and conference (CCWC), Las Vegas, NV, USA, 9–11 January 2017; pp. 1–5. [Google Scholar]
- Badve, O.; Gupta, B.B.; Gupta, S. Reviewing the security features in contemporary security policies and models for multiple platforms. In Handbook of Research on Modern Cryptographic Solutions for Computer and Cyber Security; IGI Global: Hershey, PA, USA, 2016; pp. 479–504. [Google Scholar]
- Starr, M. Fridge Caught Sending Spam Emails in Botnet Attack. 2014. Available online: https://www.cnet.com/home/kitchen-and-household/fridge-caught-sending-spam-emails-in-botnet-attack/ (accessed on 19 January 2014).
- Kumar, N.; Naveen, C. Collaborative trust aware intelligent intrusion detection in VANETs. Comput. Electr. Eng. 2014, 40, 1981–1996. [Google Scholar] [CrossRef]
- Bailey, M.; Evan, C.; Farnam, J.; Yunjing, X.; Manish, K. A survey of botnet technology and defenses. In Proceedings of the 2009 Cybersecurity Applications & Technology Conference for Homeland Security, Institute of Electrical and Electronics Engineers (IEEE), Washington, DC, USA, 3–4 March 2009; pp. 299–304. [Google Scholar]
- Tahaei, H.; Afifi, F.; Asemi, A.; Zaki, F.; Anuar, N.B. The rise of traffic classification in IoT networks: A survey. J. Netw. Comput. Appl. 2020, 154, 25–38. [Google Scholar] [CrossRef]
- Churcher, A.; Ullah, R.; Ahmad, J.; Rehman, S.U.; Masood, F.; Gogate, M.; Alqahtani, F.; Nour, B.; Buchanan, W. An Experimental Analysis of Attack Classification Using Machine Learning in IoT Networks. Sensors 2021, 21, 446. [Google Scholar] [CrossRef]
- Hussain, F.; Hussain, R.; Hassan, S.A.; Hossain, E. Machine Learning in IoT Security: Current Solutions and Future Challenges. IEEE Commun. Surv. Tutor. 2020, 22, 1686–1721. [Google Scholar] [CrossRef] [Green Version]
- Alsamiri, J.; AlSubhi, K. Internet of Things Cyber Attacks Detection using Machine Learning. Int. J. Adv. Comput. Sci. Appl. 2019, 2019, 10. [Google Scholar] [CrossRef] [Green Version]
- Wurm, J.; Hoang, K.; Arias, O.; Sadeghi, A.; Jin, Y. Security analysis on consumer and industrial IoT devices. In Proceedings of the 21st Asia and South Pacific Design Automation Conference (ASP-DAC), Macau, China, 25–28 January 2016; pp. 519–524. [Google Scholar]
- Khraisat, A.; Gondal, I.; Vamplew, P.; Kamruzzaman, J.; Alazab, A. A novel ensemble of hybrid intrusion detection system for detecting internet of things attacks. Electronics 2019, 8, 1210. [Google Scholar] [CrossRef] [Green Version]
- Murad, G.; Badarneh, A.; Quscf, A.; Almasalha, F. Software Testing Techniques in IoT. In Proceedings of the 8th International Conference on Computer Science and Information Technology (CSIT), Amman, Jordan, 11–12 July 2018; pp. 17–21. [Google Scholar]
- Siboni, S.; Shabtai, A.; Elovici, Y. Leaking data from enterprise networks using a compromised smartwatch device. In Proceedings of the 33rd Annual ACM Symposium on Applied Computing, Pau, France, 9–13 April 2018; pp. 741–750. [Google Scholar]
- Moody, M.; Hunter, A. Exploiting known vulnerabilities of a smart thermostat. In Proceedings of the 14th IEEE Annual Conference on Privacy, Security and Trust (PST), Auckland, New Zealand, 12–14 December 2016; pp. 50–53. [Google Scholar]
- Ronen, E.; Shamir, A. Ronen, Eyal; Adi Shamir. Extended functionality attacks on IoT devices: The case of smart lights. In Proceedings of the IEEE European Symposium on Security and Privacy (EuroS&P), Saarbrucken, Germany, 21–24 March 2016; pp. 3–12. [Google Scholar]
- Fernandez, E.; Pelaez, J.; Larrondo-Petrie, M. Attack patterns: A new forensic and design tool. In Proceedings of the IFIP International Conference on Digital Forensics, Orlando, FL, USA, 28–31 January 2021; Springer: New York, NY, USA, 2007; pp. 345–357. [Google Scholar]
- Alghamdi, T.A.; Lasebae, A.; Aiash, M. Security analysis of the constrained application protocol in the Internet of Things. In Proceedings of the Second International Conference on Future Generation Communication Technology, London, UK, 12–14 November 2013; pp. 163–168. [Google Scholar]
- Arias, O.; Wurm, J.; Hoang, K.; Jin, Y. Privacy and Security in Internet of Things and Wearable Devices. IEEE Trans. Multi-Scale Comput. Syst. 2015, 1, 99–109. [Google Scholar] [CrossRef]
- Bachy, Y.; Basse, F.; Nicomette, V.; Alata, E.; Kaaniche, M.; Courrege, J.-C.; Lukjanenko, P. Smart-TV Security Analysis: Practical Experiments. In Proceedings of the 45th Annual IEEE/IFIP International Conference on Dependable Systems and Networks, Rio de Janeiro, Brazil, 22–25 June 2015; pp. 497–504. [Google Scholar]
- Sivaraman, V.; Chan, D.; Earl, D.; Boreli, R. Smart-Phones Attacking Smart-Homes. In Proceedings of the 9th ACM Conference on Creativity & Cognition, Sydney, Australia, 17–20 June 2013; pp. 195–200. [Google Scholar]
- Ling, Z.; Liu, K.; Xu, Y.; Jin, Y.; Fu, X. An end-to-end view of iot security and privacy. In Proceedings of the GLOBECOM 2017 IEEE Global Communications Conference, Singapore, 4–8 December 2017; pp. 1–7. [Google Scholar]
- Ling, Z.; Luo, J.; Xu, Y.; Gao, C.; Wu, K.; Fu, X. Security Vulnerabilities of Internet of Things: A Case Study of the Smart Plug System. IEEE Internet Things J. 2017, 4, 1899–1909. [Google Scholar] [CrossRef]
- Seralathan, Y.; Oh, T.T.; Jadhav, S.; Myers, J.; Jeong, J.P.; Kim, Y.H.; Kim, J.N. IoT security vulnerability: A case study of a Web camera. In Proceedings of the 20th International Conference on Advanced Communication Technology (ICACT), Chuncheon-si, Korea, 11–14 February 2018; pp. 172–177. [Google Scholar]
- Xu, H.; Xu, F.; Chen, B. Internet protocol cameras with no password protection: An empirical investigation. In Proceedings of the International Conference on Passive and Active Network Measurement, Berlin, Germany, 27–28 March 2018; pp. 47–59. [Google Scholar]
- Classen, J.; Wegemer, D.; Patras, P.; Spink, T.; Hollick, M. Anatomy of a vulnerable fitness tracking system: Dissecting the fitbit cloud, app, and firmware. Proc. ACM Interact. Mob. Wearable Ubiquitous Technol. 2018, 2, 1–24. [Google Scholar] [CrossRef] [Green Version]
- Willingham, T.; Henderson, C.; Kiel, B.; Haque, S.; Atkison, T. Testing vulnerabilities in bluetooth low energy. In Proceedings of the ACMSE 2018 Conference, Richmond, KY, USA, 29–31 March 2018; pp. 1–7. [Google Scholar]
- Sachidananda, V.; Siboni, S.; Shabtai, A.; Toh, J.; Bhairav, S.; Elovici, Y. Let the cat out of the bag: A holistic approach towards security analysis of the internet of things. In Proceedings of the 3rd ACM International Workshop on IoT Privacy, Trust, and Security, Abu Dhabi, United Arab Emirates, 2 April 2017; pp. 3–10. [Google Scholar]
- Bagaa, M.; Taleb, T.; Bernabe, J.B.; Skarmeta, A. A Machine Learning Security Framework for Iot Systems. IEEE Access 2020, 8, 114066–114077. [Google Scholar] [CrossRef]
- Rahman, A.; Asyharia, A.T.; Leong, L.S.; Satrya, G.B.; Tao, M.H.; Zolkipli, M.F. Scalable Machine Learning-Based Intrusion Detection System for IoT-Enabled Smart Cities. Sustain. Cities Soc. 2020, 61, 10–23. [Google Scholar] [CrossRef]
- Arshad, J.; Azad, M.A.; Abdeltaif, M.M.; Salah, K. An intrusion detection framework for energy constrained IoT devices. Mech. Syst. Signal Process. 2020, 136, 106436. [Google Scholar] [CrossRef]
- Al-Hadhrami, Y.; Hussain, F.K. Real time dataset generation framework for intrusion detection systems in IoT. Future Gener. Comput. Syst. 2020, 108, 414–423. [Google Scholar] [CrossRef]
- Abdollahi, A.; Fathi, M. An Intrusion Detection System on Ping of Death Attacks in IoT Networks. Wirel. Pers. Commun. 2020, 112, 2057–2070. [Google Scholar] [CrossRef]
- Zheng, D.; Hong, Z.; Wang, N.; Chen, P. An Improved LDA-Based ELM Classification for Intrusion Detection Algorithm in IoT Application. Sensors 2020, 20, 1706. [Google Scholar] [CrossRef] [Green Version]
- Eskandari, M.; Janjua, Z.H.; Vecchio, M.; Antonelli, F. Passban IDS: An Intelligent Anomaly-Based Intrusion Detection System for IoT Edge Devices. IEEE Internet Things J. 2020, 7, 6882–6897. [Google Scholar] [CrossRef]
- Anthi, E.; Williams, L.; Slowinska, M.; Theodorakopoulos, G.; Burnap, P. A Supervised Intrusion Detection System for Smart Home IoT Devices. IEEE Internet Things J. 2019, 6, 9042–9053. [Google Scholar] [CrossRef]
- Cervantes, C.; Poplade, D.; Nogueira, M.; Santos, A. Detection of sinkhole attacks for supporting secure routing on 6LoWPAN for Internet of Things. In Proceedings of the IFIP/IEEE International Symposium on Integrated Network Management (IM), Ottawa, ON, Canada, 11–15 May 2015; pp. 606–611. [Google Scholar]
- Anthi, E.; Williams, L.; Burnap, P. Pulse: An adaptive intrusion detection for the internet of things. Living Internet Things Cybersecur. IoT 2018, 2018, 35–40. [Google Scholar]
- Nobakht, M.; Sivaraman, V.; Boreli, R. A host-based intrusion detection and mitigation framework for smart home IoT using OpenFlow. In Proceedings of the 11th International conference on availability, reliability and security (ARES), Salzburg, Austria, 31 August–2 September 2016; pp. 147–156. [Google Scholar]
- Fu, Y.; Yan, Z.; Cao, J.; Koné, O.; Cao, X. An Automata Based Intrusion Detection Method for Internet of Things. Mob. Inf. Syst. 2017, 2017, 1–13. [Google Scholar] [CrossRef] [Green Version]
- Soe, Y.N.; Feng, Y.; Santosa, P.I.; Hartanto, R.; Sakurai, K. Towards a Lightweight Detection System for Cyber Attacks in the IoT Environment Using Corresponding Features. Electronics 2020, 9, 144. [Google Scholar] [CrossRef] [Green Version]
- Azab, A.; Alazab, M.; Aiash, M. Machine Learning Based Botnet Identification Traffic. In Proceedings of the 2016 IEEE Trustcom/BigDataSE/ISPA, Tianjin, China, 23–26 August 2016; pp. 1788–1794. [Google Scholar]
- Kumar, N.; Singh, J.P.; Bali, R.S.; Misra, S.; Ullah, S. An intelligent clustering scheme for distributed intrusion detection in vehicular cloud computing. Clust. Comput. 2015, 18, 1263–1283. [Google Scholar] [CrossRef]
- Xiao, L.; Li, Y.; Han, G.; Liu, G.; Zhuang, W. PHY-layer spoofing detection with reinforcement learning in wireless networks. IEEE Trans. Veh. Technol. 2016, 16, 10037–10047. [Google Scholar] [CrossRef]
- Xiao, L.; Yan, Q.; Lou, W.; Chen, G.; Hou, Y.T. Proximity-based security techniques for mobile users in wireless networks. IEEE Trans. Inf. Forensics Secur. 2013, 8, 2089–2100. [Google Scholar] [CrossRef] [Green Version]
- Xiao, L.; Xie, C.; Chen, T.; Dai, H.; Poor, H.V. A mobile offloading game against smart attacks. IEEE Access 2016, 4, 2281–2291. [Google Scholar] [CrossRef]
- Oulhiq, R.; Ibntahir, S.; Sebgui, M.; Guennoun, Z. A fingerprint recognition framework using Artificial Neural Network. In Proceedings of the 10th International Conference on Intelligent Systems: Theories and Applications (SITA), Rabat, Morocco, 20–21 October 2015; pp. 1–6. [Google Scholar]
- Ly, K.; Jin, Y. Security studies on wearable fitness trackers. In Proceedings of the 38th Annual International Conference of the IEEE Engineering in Medicine and Biology Society, Orlando, FL, USA, 16–20 August 2016. [Google Scholar]
- Ali, N.; Neagu, D.; Trundle, P. Evaluation of k-nearest neighbour classifier performance for heterogeneous data sets. SN Appl. Sci. 2019, 1, 1559. [Google Scholar] [CrossRef] [Green Version]
- Li, C.; Wang, G. A light-weight commodity integrity detection algorithm based on Chinese remainder theorem. In Proceedings of the IEEE 11th International Conference on Trust, Security and Privacy in Computing and Communications, Liverpool, UK, 25–27 June 2012; pp. 1018–1023. [Google Scholar]
- Khan, F.; Kanwal, S.; Alamri, S.; Mumtaz, B. Hyper-Parameter Optimization of Classifiers, Using an Artificial Immune Network and Its Application to Software Bug Prediction. IEEE Access 2020, 8, 20954–20964. [Google Scholar] [CrossRef]
- UNSW Canberra Website. Available online: https://www.unsw.adfa.edu.au/unsw-canberra-cyber/cybersecurity/ADFA-NB15-Datasets/bot_iot.php (accessed on 2 June 2021).
- Foley, J.; Moradpoor, N.; Ochenyi, H. Employing a Machine Learning Approach to Detect Combined Internet of Things Attacks against Two Objective Functions Using a Novel Dataset. Secur. Commun. Netw. 2020, 2020, 1–17. [Google Scholar] [CrossRef]
- Wang, W.; Sheng, Y.; Wang, J.; Zeng, X.; Ye, X.; Huang, Y.; Zhu, M. HAST-IDS: Learning hierarchical spatial-temporal features using deep neural networks to improve intrusion detection. IEEE Access 2017, 6, 1792–1806. [Google Scholar] [CrossRef]
- Alsaedi, A.; Moustafa, N.; Tari, Z.; Mahmood, A.; Anwar, A. TON_IoT telemetry dataset: A new generation dataset of IoT and IIoT for data-driven intrusion detection systems. IEEE Access 2020, 8, 165130–165150. [Google Scholar] [CrossRef]


| Attack | Products Tested | Tools | Attack Approach | Results |
|---|---|---|---|---|
| Devices exposed to peripheral IP address to crash the server by creating a Trojan horse. [28] | Nest Thermostat | - | Backdoor and Hardware access by physical tampering | Modifiable firmware and checksum |
| Channel interception or attacks on running apps in [29]. | Smart TV | Binwalk | Firmware extraction by compromising devices in public network ADSL. Web browser vulnerable to XSS attacks. | Attack on firmware modification as it is updated in an insecure channel. |
| Kiddie Scripts utilized to exploit non-IT devices [24] | Nest Thermostat | Wireshark Kiddie scripts Ettercap Forensic Toolkit (FTK) Autopsy | Gaining credentials by physical access Packet analysis | Unable to gain root access. |
| Different attacks on Haier home systems [20] | Haier Smart Home Automation | Wireshark, UART | Brute force approach to access password. Gaining root access Network analysis | Root shell access by exposing telnet credentials. Updates on firmware sent in clear text. |
| Smart bulb security issues [25] | Limitless LED Philips Lux | Own receiver introduced | API used to extract secret information Control packets have eavesdropped | MITM attack caused the private data to be exposed. |
| Injected malware in an iOS mobile application. Peripheral IP devices were attacked [30] | Camera Netgear Nightawk WeMO plug | iOS app Scan results obtained from cloud-hosted server | Devices are located by nearby LANs Devices exposed to public IP address | Server enabled the attack on exposed devices. Device responses are collected by SSDP to check for IoT devices. |
| Smart socket reversed communication [31] | Socket Edimax plug | Python scripts | Brute Force Spoofing scanning Firmware | Device authentication absent. Insecure communication protocols Feeble password policy. |
| Communication protocols analyzed with Edimax IP camera architecture and vulnerabilities [32] | Camera | - | Determine all MAC combinations to check the status of online devices. Brute Force credentials. | Connection status exposed by the camera. Brute force attack. Authentication information is obtained by spoofing attack which impersonates real cameras. |
| IP Camera traffic is analyzed [33] | IP Cameras | Nmap Wireshark | MITM and network analysis Video streams obtained by Brute force port RTSP | Commands/credentials obtained in clear text. Video streams not obtained Real-time streams are exposed in RSTP port. |
| Insecam website sued to retrieve live streams of open cameras [34] | IP Cameras | Domain scans of angry IP | Check open-access devices | Passwords not set for many IP cameras. |
| Attacks and vulnerabilities on Fitbit analyzed [35] | Fitbit | Gattool APKtool | Modify protocols by analyzing firmware. Information leakage Access cloud by modifying mobile app of Fitbit | Leakage of information Firmware compromised Gain access to cloud by modifying app. |
| Smartwatches tested for exploiting BLE protocol [36] | Fitbit Keyboard LG watch | Wireshark | Sniffing of packets | Unable to read personal data by Ubertooth. Packet formats not recognizable due to unawareness. |
| Parameters | Default Values | Optimized Values |
|---|---|---|
| Threshold suppression | 0.1 | 0.1 |
| Number of clones generated | 30 | 50 |
| Number of clones multiplier (N) | 20 | 50 |
| Maximum number of generations | 100 | 50 |
| Machine Learning Classifiers | Parameter Name | Default Parameter Value | Optimized Parameter Range |
|---|---|---|---|
| SVM | Sigma (σ) | 0.7 | (0.1,0.9) |
| Cost (C) | 1 | (0.25,4) | |
| KNN | Number of Neighbors (k) | 3 | (1,17) |
| Exponent (E) | 3 | (0.5,5) | |
| NB | Distribution | 0 | Normal (0,1) |
| Dataset | Dataset_Files | Samples | Features | Minority Samples | Majority Samples | Imbalance Ratio (IR) |
|---|---|---|---|---|---|---|
| ToN-IoT dataset | Train_Test_IoT_Fridge | 59,944 | 5 | 24,944 | 35,000 | 1.40 |
| Train_Test_Iot_garage_door | 59,587 | 5 | 24,587 | 35,000 | 1.42 | |
| Train_Test_Iot_gps_tracker | 58,960 | 5 | 23,960 | 35,000 | 1.46 | |
| Train_test_iot_modbus | 51,106 | 7 | 16,106 | 35,000 | 2.17 | |
| Train_test_iot_thermostat | 52,775 | 5 | 17,774 | 35,000 | 1.96 | |
| Train_test_iot_weather | 59,260 | 6 | 24,260 | 35,000 | 1.44 | |
| Train_test_iot_motion_light | 59,488 | 5 | 24,488 | 35,000 | 1.42 | |
| Train_test_Network | 461,043 | 43 | 161,043 | 300,000 | 1.86 | |
| Train_test_Windows7 | 15,980 | 132 | 5980 | 10,000 | 1.67 | |
| Train_test_Windows10 | 21,104 | 124 | 10,000 | 11,104 | 1.11 | |
| BoT-IoT dataset | Final_10_Best_testing | 733,705 | 16 | 348,395 | 385,310 | 1.10 |
| Distance Measure | Classifier | Average Accuracy with Changing Values of ‘t’ | |||||
|---|---|---|---|---|---|---|---|
| t = 10 | t = 11 | t = 12 | t = 13 | t = 14 | t = 15 | ||
| Euclidean distance | KNN | 98.52% | 99.26% | 97.08% | 95.04% | 96.69% | 97.23% |
| SVM | 96.24% | 96.37% | 97.37% | 95.57% | 94.37% | 93.37% | |
| Naïve Bayes | 96.23% | 96.02% | 95.76% | 95.59% | 95.76% | 96.49% | |
| City-block Distance | KNN | 97.22% | 95.22% | 97.08% | 96.89% | 96.64% | 96.64% |
| SVM | 97.08% | 97.23% | 96.37% | 97.37% | 96.89% | 97.08% | |
| Naïve Bayes | 95.91% | 95.91% | 95.47% | 95.47% | 95.47% | 96.05% | |
| Cosine similarity | KNN | 97.22% | 97.22% | 98.22% | 96.93% | 96.78% | 96.78% |
| SVM | 96.67% | 96.79% | 96.79% | 96.85% | 96.85% | 97.08% | |
| Naïve Bayes | 95.76% | 96.05% | 96.05% | 95.85% | 97.61% | 95.61% | |
| Distance Measure | Classifiers | Average Accuracy with ‘t’ | |||||
|---|---|---|---|---|---|---|---|
| t = 10 | t = 11 | t = 12 | t = 13 | t = 14 | t = 15 | ||
| Euclidean distance | KNN | 92.26% | 92.37% | 92.67% | 90.89% | 92.37% | 91.37% |
| SVM | 91.29% | 91.37% | 91.37% | 91.37% | 91.37% | 92.54% | |
| Naïve Bayes | 94.45% | 92.20% | 90.59% | 90.59% | 92.34% | 93.34% | |
| City-block distance | KNN | 93.67% | 91.08% | 91.89% | 92.89% | 90.79% | 91.79% |
| SVM | 91.90% | 92.23% | 90.23% | 93.23% | 91.37% | 92.22% | |
| Naïve Bayes | 92.59% | 90.76% | 91.22% | 92.76% | 92.05% | 91.05% | |
| Cosine similarity | KNN | 91.69% | 91.37% | 91.37% | 91.69% | 90.64% | 92.12% |
| SVM | 93.02% | 90.37% | 92.37% | 90.37% | 91.37% | 90.89% | |
| Naïve Bayes | 92.64% | 91.64% | 90.64% | 91.23% | 92.61% | 93.61% | |
| Dataset | Dataset_Files | IR (Prior Undersampling) | IR (Post Undersampling) |
|---|---|---|---|
| ToN-IoT dataset | Train_Test_IoT_Fridge | 1.40 | 0.41 |
| Train_Test_Iot_garage_door | 1.42 | 0.44 | |
| Train_Test_Iot_gps_tracker | 1.46 | 0.48 | |
| Train_test_iot_modbus | 2.17 | 1.12 | |
| Train_test_iot_thermostat | 1.96 | 0.94 | |
| Train_test_iot_weather | 1.44 | 0.47 | |
| Train_test_iot_motion_light | 1.42 | 0.44 | |
| Train_test_Network | 1.86 | 0.91 | |
| Train_test_Windows7 | 1.67 | 0.90 | |
| Train_test_Windows10 | 1.11 | 0.25 | |
| BoT-IoT dataset | Final_10_Best_testing | 1.10 | 0.23 |
| Model Name | Precision | Recall | F1-Score | Accuracy | MCC Score |
|---|---|---|---|---|---|
| SVM | 92.05% | 91.62% | 92.22% | 90.07% | 91.71% |
| NB | 90.56% | 91.12% | 90.14% | 91.57% | 90.03% |
| KNN | 91.86% | 91.93% | 91.07% | 90.73% | 93.00% |
| Model Name | Precision | Recall | F1-Score | Accuracy | MCC Score |
|---|---|---|---|---|---|
| SVM | 97.15% | 95.58% | 94.26% | 95.11% | 95.71% |
| NB | 98.45% | 96.11% | 96.15% | 98.59% | 98.03% |
| KNN | 96.77% | 96.89% | 98.10% | 97.73% | 99.05% |
| Datasets | Existing Approaches | Proposed Approach | ||||
|---|---|---|---|---|---|---|
| RUS | CNN | TOMEK-LINK | Euclidean | City-Block | Cosine Similarity | |
| Train_Test_IoT_Fridge | 91.90% | 92.70% | 91.10% | 91.90% | 93.00% | 94.90% |
| Train_Test_Iot_garage_door | 90.80% | 91.90% | 89.80% | 96.67% | 92.81% | 93.37% |
| Train_Test_Iot_gps_tracker | 91.37% | 92.17% | 93.56% | 94.68% | 92.67% | 93.82% |
| Train_test_Iot_modbus | 91.60% | 92.80% | 89.80% | 91.00% | 92.00% | 91.40% |
| Train_test_Iot_thermostat | 87.00% | 86.00% | 89.00% | 90.00% | 89.90% | 88.78% |
| Train_test_Iot_weather | 90.30% | 91.70% | 91.50% | 92.38% | 92.78% | 92.80% |
| Train_test_Iot_motion_light | 90.00% | 90.22% | 90.30% | 93.00% | 92.00% | 92.80% |
| Train_test_Network | 82.70% | 80.20% | 80.20% | 81.80% | 82.05% | 80.00% |
| Train_test_Windows7 | 81.48% | 80.60% | 82.30% | 81.70% | 80.40% | 80.00% |
| Train_test_Windows10 | 92.80% | 91.30% | 92.50% | 93.00% | 93.40% | 92.75% |
| Final_10_Best_testing | 96.01% | 97.21% | 95.10% | 98.10% | 97.50% | 98.40% |
| Datasets | Existing Approaches | Proposed Approach | ||||
|---|---|---|---|---|---|---|
| RUS | CNN | TOMEK-LINK | Euclidean Distance | City-Block Distance | Cosine Similarity | |
| Train_Test_IoT_Fridge | 89.10% | 88.10% | 89.60% | 92.80% | 91.10% | 92.10% |
| Train_Test_Iot_garage_door | 87.94% | 88.37% | 89.80% | 90.80% | 91.80% | 92.80% |
| Train_Test_Iot_gps_tracker | 89.30% | 90.30% | 91.24% | 93.65% | 94.10% | 92.70% |
| Train_test_Iot_modbus | 87.50% | 88.00% | 86.90% | 89.00% | 89.30% | 89.70% |
| Train_test_Iot_thermostat | 86.40% | 87.60% | 88.70% | 89.00% | 90.00% | 90.40% |
| Train_test_Iot_weather | 89.70% | 88.50% | 89.00% | 90.14% | 92.10% | 93.30% |
| Train_test_Iot_motion_light | 92.30% | 93.40% | 91.30% | 93.70% | 94.00% | 95.51% |
| Train_test_Network | 87.00% | 88.73% | 86.50% | 89.70% | 89.00% | 88.40% |
| Train_test_Windows7 | 86.26% | 88.00% | 89.60% | 90.10% | 90.56% | 91.00% |
| Train_test_Windows10 | 89.90% | 87.75% | 89.40% | 90.00% | 91.30% | 92.43% |
| Final_10_Best_testing | 96.30% | 97.30% | 96.75% | 98.40% | 99.10% | 99.30% |
| Datasets | Existing Approaches | Proposed Approach | ||||
|---|---|---|---|---|---|---|
| RUS | CNN | TOMEK-LINK | Euclidean | City-Block | Cosine Similarity | |
| Train_Test_IoT_Fridge | 91.10% | 90.10% | 92.50% | 94.50% | 93.10% | 94.10% |
| Train_Test_Iot_garage_door | 91.50% | 92.10% | 90.80% | 92.30% | 94.00% | 95.00% |
| Train_Test_Iot_gps_tracker | 92.94% | 94.60% | 93.70% | 96.00% | 94.10% | 94.70% |
| Train_test_iot_modbus | 88.53% | 87.37% | 90.00% | 94.80% | 95.00% | 93.00% |
| Train_test_iot_thermostat | 89.40% | 87.23% | 82.30% | 88.50% | 88.34% | 89.56% |
| Train_test_iot_weather | 86.90% | 84.70% | 88.50% | 83.70% | 93.65% | 91.40% |
| Train_test_iot_motion_light | 94.30% | 92.75% | 91.40% | 94.70% | 96.00% | 96.61% |
| Train_test_Network | 89.80% | 89.60% | 85.90% | 89.30% | 90.60% | 91.10% |
| Train_test_Windows7 | 82.30% | 83.50% | 87.00% | 88.50% | 89.00% | 90.10% |
| Train_test_Windows10 | 91.37% | 93.90% | 94.50% | 95.80% | 98.10% | 96.61% |
| Final_10_Best_testing | 89.90% | 88.24% | 87.50% | 92.50% | 93.80% | 93.25% |
| Assessment | Formulae |
|---|---|
| Precision (P) | TP/(TP + FP) |
| Recall (TPR/Sensitivity/R) | TP/(TP + FN) |
| Specificity | TN/(TN + FP) |
| F-measure | 2 × P × R/(P + R) |
| AUC | ½((TP/(TP+FN)) + TN/(TN + FP)) |
| Range of AUC | Test Result |
|---|---|
| 0.5–0.6 | Fail |
| 0.6–0.7 | Poor |
| 0.7–0.8 | Fair |
| 0.8–0.9 | Good |
| 0.9–1.0 | Excellent |
| Type of Classifier | Distance Function | Precision | Recall | Specificity | F-Measure | AUC | |
|---|---|---|---|---|---|---|---|
| Classifier: KNN | RUS | - | 92.36% | 90.24% | 91.36% | 91.67% | 0.9231 |
| CNN | - | 92.36% | 91.15% | 91.29% | 90.08% | 0.9131 | |
| Tomek-link | Euclidean | 92.36% | 90.24% | 90.36% | 92.67% | 0.9231 | |
| Proposed scheme | Euclidean | 93.00% | 92.91% | 92.14% | 93.50% | 0.9459 | |
| City-block | 92.37% | 93.50% | 91.49% | 92.87% | 0.9377 | ||
| Cosine Similarity | 91.56% | 92.90% | 93.00% | 90.14% | 0.9495 | ||
| Classifier: SVM | RUS | - | 91.59% | 89.83% | 89.12% | 92.07% | 0.9023 |
| CNN | - | 92.45% | 90.82% | 93.31% | 91.11% | 0.9103 | |
| Tomek-link | Euclidean | 90.45% | 90.82% | 92.31% | 93.11% | 0.9204 | |
| Proposed scheme | Euclidean | 92.00% | 92.75% | 92.22% | 91.48% | 0.9075 | |
| City-block | 91.00% | 92.25% | 91.59% | 90.99% | 0.8907 | ||
| Cosine Similarity | 90.00% | 91.73% | 91.22% | 89.48% | 0.8857 | ||
| Classifier: Naive Bayes | RUS | - | 89.45% | 88.13% | 88.45% | 88.67% | 0.8873 |
| CNN | - | 89.27% | 89.11% | 89.01% | 87.18% | 0.8864 | |
| Tomek-link | - | 90.45% | 90.00% | 89.45% | 89.67% | 0.8973 | |
| Proposed scheme | Euclidean | 89.23% | 90.00% | 90.59% | 91.99% | 0.9112 | |
| City-block | 88.00% | 89.00% | 89.11% | 90.48% | 0.8934 | ||
| Cosine Similarity | 89.56% | 89.36% | 88.59% | 90.99% | 0.9056 | ||
| Type of Classifier | Distance Function | Precision | Recall | Specificity | F-Measure | AUC | |
|---|---|---|---|---|---|---|---|
| Classifier: KNN | RUS | - | 95.61% | 90.00% | 94.00% | 90.40% | 0.9189 |
| CNN | - | 90.25% | 100.00% | 93.33% | 97.27% | 0.9596 | |
| Tomek-link | - | 97.91% | 96.76% | 92.96% | 97.94% | 0.8987 | |
| Proposed scheme | Euclidean | 98.12% | 95.00% | 96.67% | 99.18% | 0.9424 | |
| City-block | 97.45% | 99.59% | 96.96% | 91.82% | 0.9088 | ||
| Cosine Similarity | 98.79% | 98.60% | 97.78% | 98.00% | 0.9626 | ||
| Classifier: SVM | RUS | - | 97.37% | 96.19% | 93.14% | 93.00% | 0.9231 |
| CNN | - | 95.54% | 91.58% | 94.55% | 92.06% | 0.9693 | |
| Tomek-link | - | 96.34% | 95.32% | 91.81% | 97.55% | 0.9525 | |
| Proposed scheme | Euclidean | 96.79% | 98.93% | 97.74% | 100.00% | 0.9754 | |
| City-block | 97.22% | 97.04% | 95.29% | 98.47% | 0.9683 | ||
| Cosine Similarity | 98.05% | 98.33% | 99.71% | 98.34% | 0.9895 | ||
| Classifier: Naive Bayes | RUS | - | 85.85% | 87.98% | 92.52% | 91.73% | 0.9071 |
| CNN | - | 88.89% | 93.94% | 91.33% | 90.73% | 0.9374 | |
| Tomek-link | Euclidean | 92.82% | 87.84% | 90.76% | 90.78% | 0.9104 | |
| Proposed scheme | Euclidean | 96.70% | 95.86% | 96.41% | 92.13% | 0.9163 | |
| City-block | 97.90% | 97.87% | 95.41% | 92.69% | 0.9214 | ||
| Cosine Similarity | 98.77% | 94.85% | 97.96% | 98.76% | 0.9591 | ||
| Datasets | No. of Samples | Computational Time |
|---|---|---|
| Train_Test_IoT_Fridge | 59,944 | 1 min 15 s |
| Train_Test_Iot_garage_door | 59,587 | |
| Train_Test_Iot_gps_tracker | 58,960 | |
| Train_test_iot_modbus | 51,106 | |
| Train_test_iot_thermostat | 52,775 | |
| Train_test_iot_weather | 59,260 | |
| Train_test_iot_motion_light | 59,488 | |
| Train_test_Network | 461,043 | 12 min 14 s |
| Train_test_Windows7 | 15,980 | 40 s |
| Train_test_Windows10 | 21,104 | |
| Final_10_Best_testing | 733,705 | 24 min 39 s |
Publisher’s Note: MDPI stays neutral with regard to jurisdictional claims in published maps and institutional affiliations. |
© 2021 by the authors. Licensee MDPI, Basel, Switzerland. This article is an open access article distributed under the terms and conditions of the Creative Commons Attribution (CC BY) license (https://creativecommons.org/licenses/by/4.0/).
Share and Cite
Thaseen, I.S.; Mohanraj, V.; Ramachandran, S.; Sanapala, K.; Yeo, S.-S. A Hadoop Based Framework Integrating Machine Learning Classifiers for Anomaly Detection in the Internet of Things. Electronics 2021, 10, 1955. https://doi.org/10.3390/electronics10161955
Thaseen IS, Mohanraj V, Ramachandran S, Sanapala K, Yeo S-S. A Hadoop Based Framework Integrating Machine Learning Classifiers for Anomaly Detection in the Internet of Things. Electronics. 2021; 10(16):1955. https://doi.org/10.3390/electronics10161955
Chicago/Turabian StyleThaseen, Ikram Sumaiya, Vanitha Mohanraj, Sakthivel Ramachandran, Kishore Sanapala, and Sang-Soo Yeo. 2021. "A Hadoop Based Framework Integrating Machine Learning Classifiers for Anomaly Detection in the Internet of Things" Electronics 10, no. 16: 1955. https://doi.org/10.3390/electronics10161955