
Statistical Model for Mobile User Positioning Based on Social Information
by
 , , , and
Juan Luis Bejarano-Luque
* ,
,
Matías Toril
,
Mariano Fernández-Navarro
,
Luis Roberto Jiménez
and
Salvador Luna-Ramírez
Instituto de Telecomunicaciones (TELMA), Universidad de Málaga, CEI Andalucía TECH, 29071 Málaga, Spain
*
Author to whom correspondence should be addressed.
Electronics 2021, 10(15), 1782; https://doi.org/10.3390/electronics10151782
Submission received: 19 June 2021
/
Revised: 12 July 2021
/
Accepted: 17 July 2021
/
Published: 26 July 2021
(This article belongs to the Special Issue Radio Access Network Planning and Management)
Abstract
:In spite of the vast set of measurements provided by current mobile networks, cellular operators have problems pinpointing problematic locations because the origin of such measurements (i.e., user location) is usually not registered. At the same time, social networks generate a huge amount of data that can be used to infer population density. In this work, a data-driven model is proposed to deduce the statistical distribution of connections, exploiting the knowledge of network layout and population density in the scenario. Due to the absence of GPS measurements, the proposed method combines data from radio connection traces stored in the network management system and geolocated posts from social networks. This information is enriched with user context information inferred from data traffic attributes. The method is tested with a large trace dataset from a live Long Term Evolution (LTE) network and a database of geotagged posts from social networks collected in real-time.
1. Introduction
It is a fact that, in recent years, the evolution and growth of mobile networks have been an unstoppable force. The constant development of new, cheaper, more accessible, and powerful equipment has democratized access to cellular networks, triggering requests for new and already established services, causing both the generation of network traffic and the number of devices connected and transmitting simultaneously to grow exponentially, with an increase of almost eight times the current traffic and a total of 31.4 billion active mobile devices expected by 2023 [1].
This exponential growth phenomenon has resulted in complex and extensive cellular networks making it impossible to manually perform management tasks, a fact that will be increased with the solutions implemented in 5G. In this context, the concept of Self-Organizing Networks (SON) was born to automate these tasks. SON techniques can be divided into three blocks, Self-Planning, Self-Optimization, and Self-Healing, covering all planning, deployment, monitoring, optimization, and troubleshooting processes. To optimize the solutions offered by SON techniques, the traditional network-centric approach, based on Quality of Service (QoS) parameters, has to step aside to a more novel end-user-centric approach, based on Quality of Experience (QoE) [2] parameters.
User context (e.g., terminal type, indoor/outdoor location, time of day, geolocation) is one of the most important factors influencing service perception [3]. Therefore, more sophisticated QoE models consider the user context (e.g., time of day or location). To recognize user activity, service providers can use active measurements from on-body sensors through ensemble learning [4]. Alternatively, network operators can infer user context by leveraging signaling events recorded by the network at each connection [5]. Once obtained, this information can be used to develop SON algorithms that use context in their tasks [6].
To meet the ambitious specifications of the new use cases, 5G operators will take network performance to the next level by combining multiple techniques. For example, network densification has been recognized as an efficient way to provide higher network capacity and better coverage, combining macrocellular infrastructure with Small Cell (SC) deployments. In these heterogeneous networks, discovering the best locations for new SCs is the key to making the most of the new infrastructure. However, most current site selection approaches are only based on signal quality indicators, due to the difficulty of modeling the dynamic performance of the network. The Minimization Drive Test (MDT) function can mitigate this difficulty, enabling the collection of geolocated measurements that can be used to build accurate network performance maps (Radio Environment Map (REM)). These maps can be used to detect coverage gaps [7]. Unfortunately, MDT is rarely activated in live networks due to the workload involved in processing these measurements. Therefore, network organizing tasks often have to be performed based on measurements only positioned by cell identifier and Timing Advance (TA) statistics. This approach leads to large localization errors, even more in areas with high TA, where the combination of cell identifier and TA produces a large area location ring, which prevents estimating the user context.
With recent advances in technology, which allows efficient processing of the vast amount of continuously generated information, interest in data science has grown in both the scientific and technical fields. As a result, many open data portals now offer direct and automated access to valuable assets that can be used to improve cellular network management. Some companies offer real metrics collected by anonymous users, which can be used to evaluate current deployments [8]. In contrast, other companies and some open data portals, usually governmental in nature, provide information on the main socio-economic activity occurring in each area of land (referred to in the literature as land use), which greatly influences how each person uses the network.
The indoor context of users is a key factor in cellular network maintenance and management tasks. It can be applied to several types of problems, such as connection classification for the application of different context-aware QoE models or the optimization of geolocation methods in the mobile network. In this work, a data-driven model is proposed to deduce the statistical distribution of connections, exploiting the knowledge of network layout and population density in the scenario, instead of other classical fingerprinting or triangulation positioning methods. Thus, the main contribution of this work is
- The finding of alternative data sources (i.e., social network information and user context information) for user positioning.
- A complete methodology for user positioning merging classical (cell ID and Time Advance statistics) and novel data sources.
User context is estimated from the connections Key Performance Indicators, KPIs, while the population distribution in the scenario is obtained from geo-positioned information of heavily used social networks.
This paper is composed of four sections. To contextualize the algorithm, different contributions of interest in the field of user positioning are discussed in Section 2. Next, Section 3 presents the statistical distribution model of users in the network, while Section 4 contextualizes the data used for testing the model, in addition to showing the obtained results. To conclude the paper, Section 5 provides a series of conclusions drawn from the work.
2. Related Work
Today, mobile networks include very sophisticated terminal-based and network-based user positioning methods [9]. Classical network positioning methods can be based on or assisted by both the network and the user equipment (UE). To summarize the main positioning methods described in the bibliography, Table 1 presents a brief description of the advantages and inconveniences of each method. Currently, in LTE, the main positioning method is Assisted GPS (A-GPS) [10], in which the UE determines its location by processing GPS signals. This requires a line-of-sight connection to several satellites and knowledge of the orbital parameters. These data are downloaded before the first position fix, which can take several minutes (cold fix). To speed up the process, a network server can provide assisting data (e.g., precise timing, satellite Doppler shift, approximate position of the mobile device, or differential corrections) to obtain a faster and more reliable GPS fix (warm fix). When the GPS signal is not available (e.g., in urban or indoor environments), other positioning methods are used.
In the main alternative method, the user’s position can be derived by the network from a combination of the Cell ID (CID) and the uplink Timing Advance (TA) (also known as Enhanced CID (E-CID)), from which a server approximates the location of the equipment. Other methods employed are multilateration techniques based on the Angle of Arrival (AOA) or the Time Difference Of Arrival (TDOA), in which UE measures the arrival angle/time of positioning reference signals from multiple cells, from which a server obtains the user’s position by multilateration [11]. Similarly, other techniques employ RSS measurements to perform distance estimation [12].
In contrast, mapping-based location methods capture signatures that are compared to a set of geotagged measurements to identify the location of a device [13]. These techniques, initially designed to locate the user on a 2D plane, have been extended with the introduction of 3D MIMO technology for 3D indoor scenarios [14]. In addition, the use of different sensors (e.g., barometric to determine indoor ground level [15], proximity [16], or inertial sensors [17]) has recently become more standardized. Position estimations with these techniques are affected by inaccuracies introduced by the radio channel (e.g., non-line-of-sight, shadows, multipath). To reduce their impact, data filtering algorithms (e.g., least-squares methods in overdetermined systems [11], Kalman filter [18], particle filter [19], or machine learning [20]) are employed in commercial GPS chipsets and positioning solutions.
However, despite all positioning methods working in real-time, the information recorded for network management is very limited. This problem was partly solved with the MDT feature [21], whereby operators can request user equipment to report radio measurements along with location information. Unfortunately, MDT is rarely activated for all users and is continuous over time among other things, the battery consumption required by the user, which means that the anonymous call traces provided by network equipment often lack detailed location information. Therefore, network replanning and optimization must be done based on E-CID geolocated traces, with location errors of hundreds of meters, excessive for estimating the communication context.
In parallel, interest in data science has been increasing in recent years due to recent advances in information technology. As a result, many open data initiatives have been launched around the world. Open data portals now offer direct and automated access to valuable assets that can be used to improve the management of cellular networks. Some companies (e.g., OpenSignal [22] or WeFi [23]) offer real metrics collected by anonymous (also known as crowdsourced) users, which can be used to evaluate current cellular deployments [8].
Social networks are gaining momentum in the interest of academia, due to the almost ubiquity of the service. Due to this, it is considered as another source of information for understanding user behavior. The work presented in [24] provides an analysis of the tourist flows in a city, combining both social media information and mobile positioning. At the same time, in Reference [25], Twitter information is applied to study home–work urban mobility. In Reference [26], a collaborative positioning methodology is proposed, employing social information to estimate position of all users based on the GPS information of a subset of the devices.
The relation between social networks activity and mobile user positioning is a demonstrated fact [27], and thus, it has been greatly studied. Some works aim to apply social network information to provide context awareness to crowdsensing applications [28,29], in order to improve the richness of the collected data. Other approaches are focused on applying the social network data to model different aspects of cellular networks. For example, activity on social networks can be used to predict cellular traffic, regardless of radio access technologies or network providers [30,31]. Similarly, areas of poor signal coverage or service performance (i.e., black spots) can be detected by processing geotagged text messages in social networks [32]. At the same time, social event information obtained from browser results or open data repositories can be used to explain abnormal network behavior during troubleshooting procedures [33], detect anomalies [34,35] or predict the network performance [36].
From the network operators’ point of view, a users’ exact position is not as relevant in maintenance tasks. Instead, accurate knowledge of the spatial distribution of UEs in the scenario and how they perform is key in SON tasks (e.g., detecting areas with capacity problems). For this purpose, geolocated information from social networks can be an interesting data source. However, no study has been found in the literature that combines social networks and users’ context information to estimate the spatial distribution of users in the network.
3. Methodology
The knowledge of users aggregations areas that could, for example, represent a bottleneck in the network is key for operators management tasks. Unfortunately, the only way for terminals to report users’ position coordinates to the OSS is to activate the MDT functionality, but it is not usually active due to the resource consumption involved, so the GPS position of users in the network is rarely known. However, from a mobile network management point of view, it is unnecessary to know the precise position of each UE in the scenario, but it is essential to know their statistical distribution. E-CID can be a decent approach to the problem of approximating the users’ position, mainly in rings close to the serving base station due to the small coverage area, but for other rings, the coverage area is too wide to determine the UE location properly, thus improving the method is key to optimize position-based processes.
One way to reduce this imprecision in the localization process is to add information about the users’ context. In particular, users’ location in indoor/outdoor environments is especially interesting, locating the user in the buildings served by the ring or in the streets/parks in that area, thus greatly reducing the area of imprecision.
On the other hand, social applications are in the spotlight, leading users to generate a constant traffic flow, sharing their experiences and impressions with the rest of the world. In this situation, social networks play a fundamental role, providing the general public with access to a portal where they can publish their ideas, photos, or videos on a massive scale and, in many cases (such as Twitter or Flickr), allowing the addition of metadata about the place, as the GPS coordinates where the publication was created. Thus, the inclusion of context information, as well as other information from outside the mobile network (e.g., geolocated data from social networks), is of great interest to provide granularity to the process of spatial distribution of users, thus increasing its overall accuracy and, mainly, in distant rings.
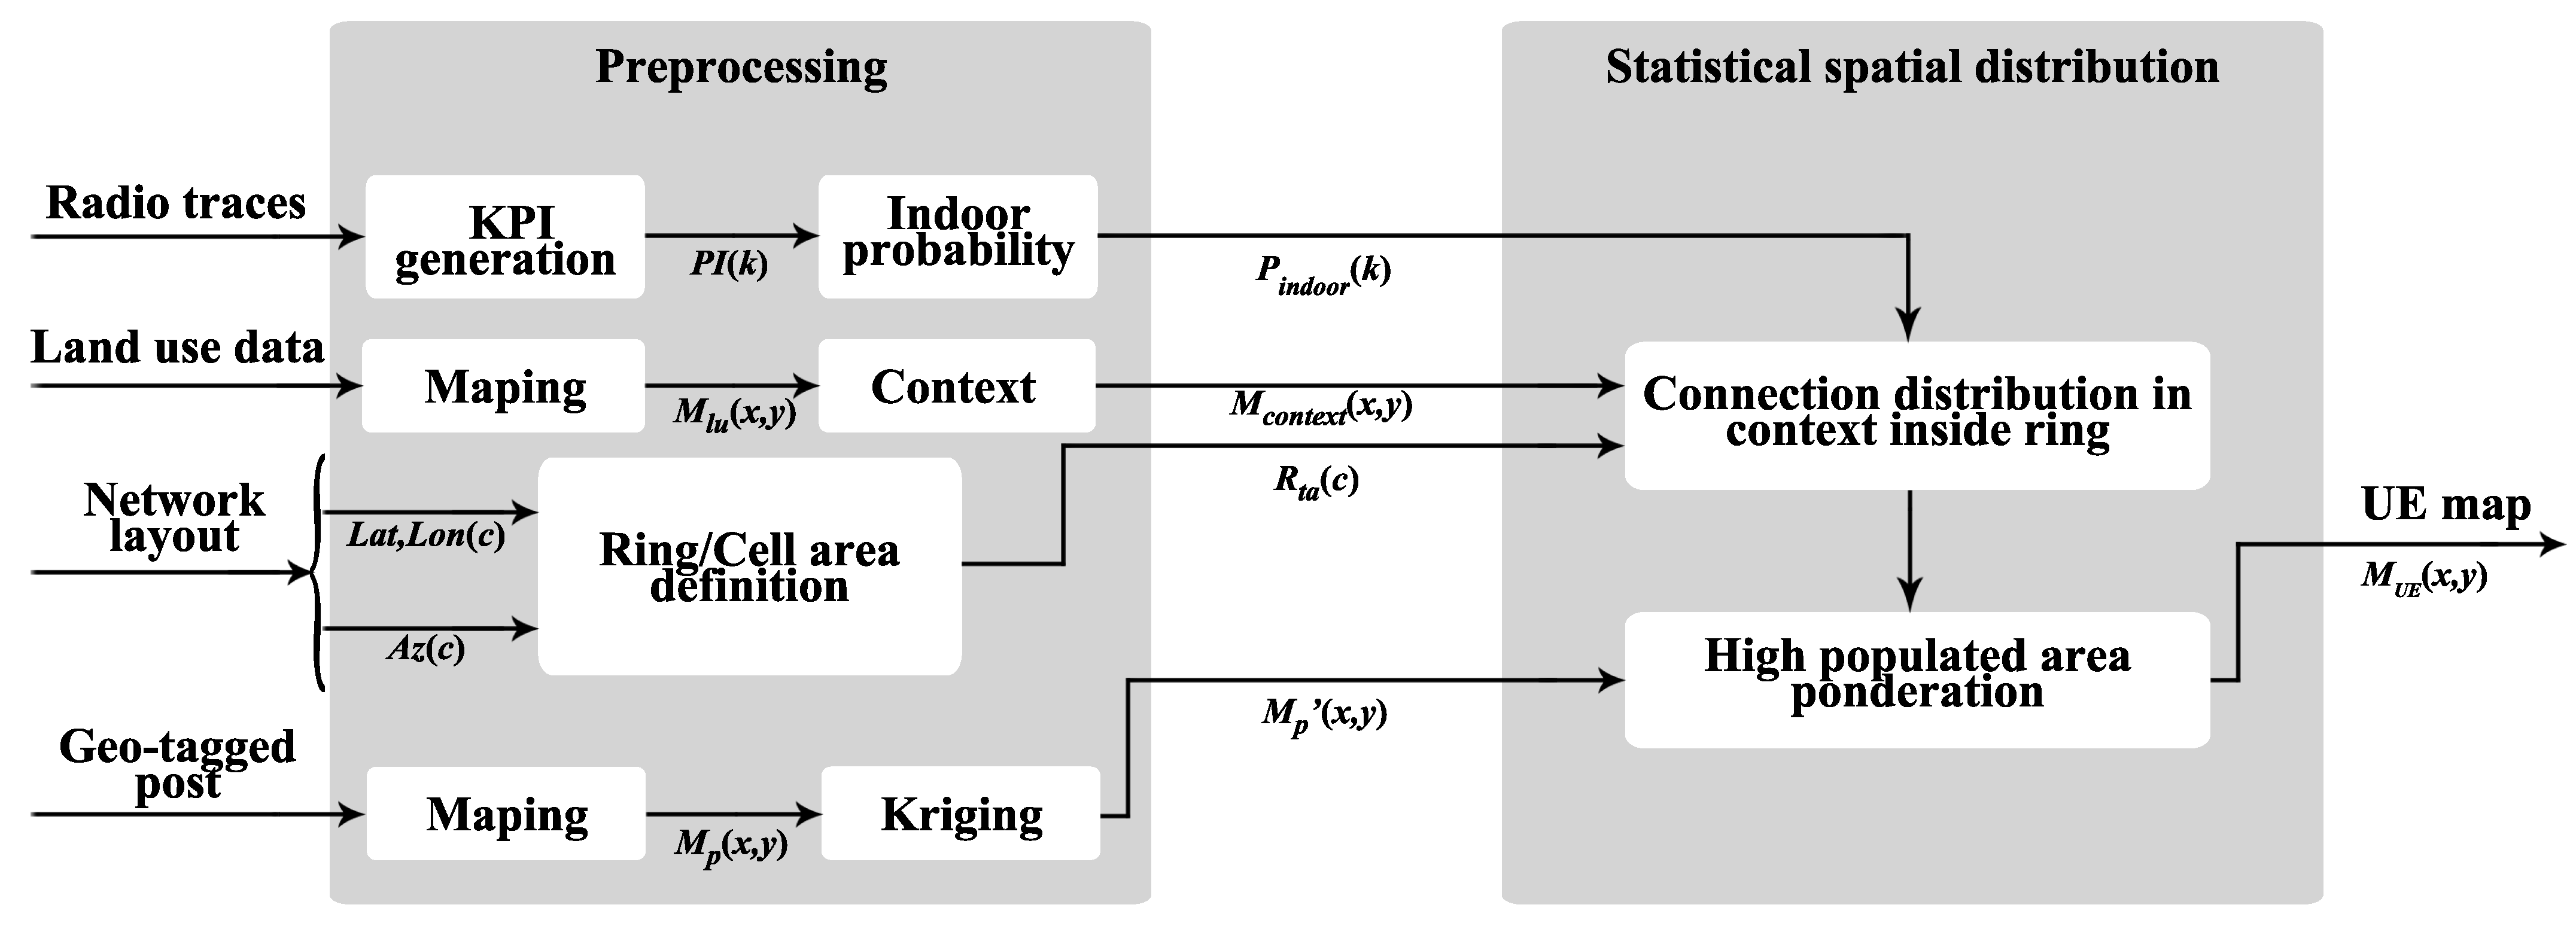
In order to estimate where the connections are located in the scenario, inputs described above must first be preprocessed. In this section, the processing applied to the input data is first described to learn the spatial characteristics of the scenario. Later, the process of statistical distribution of connections is explained. The flow diagram of the proposed algorithm is shown in Figure 1.
The model receives 4 inputs: (a) the information recorded in the radio connection traces, (b) data of land uses in the scenario, (c) information on the location and orientation of the cells in the scenario and (d) posts obtained from social networks that have associated geopositioning metadata. These data sources have been selected because of the important information they provide. On the one hand, the location and orientation of the cells in the scenario allows to delimit the area in which the user can be found, while, on the other hand, both the connection traces and the types of land use provide information about the user and its context. Finally, the geopositioned publications from social networks are used as an approximation of the spatial distribution of the population. Due to the increasing interest in the exploitation of huge amounts of data, privacy concerns have become highly significant. Data processing must ensure user privacy during the whole process of data management. This is usually achieved through anonymizing methods run at the very first stage by social network owners. The anonymizing process substitutes end-user data with some unique user ID. Client and user ID association is only available for social network managers, but not for positioning engineers, including all researchers involved in this work. A map with the statistical distribution of users in the scenario is obtained with these inputs, where each tile corresponds to an aggregation of the percentages of connections occurred in the rings that cover it.
In this work, the positioning process is based on the spatial context of the users in the scenario (i.e., indoor/outdoor), instead of the traditional measurement-based methods, which are susceptible to radio propagation conditions. Three main steps can be established. First, a delimitation of the area where the connection occurs is obtained from the network layout and the cell ID and TA statistics. Secondly, this area is further reduced, matching the user indoor context with the indoor/outdoor locations in the topology of the scenario. The user indoor context is obtained from the KPIs registered on radio traces. At the same time, the indoor/outdoor locations are obtained from the data of land uses. Finally, network population distribution, estimated from the social media posts, is applied to weight which parts of the limited area are more likely to embrace the studied connection.
3.1. Preprocessing
Although the E-CID method does not rely on users’ GPS coordinates, it makes use of data precisely located (e.g., server cell GPS coordinates), and, thus, this data supports the positioning process. This approximation of users’ location has great inaccuracies, so it is optimized applying other data, such as Timing Advance measurements. This is the approach followed in this work, where users’ environment information (e.g., indoor/outdoor labeling or population density) is determined through external data sources (i.e., land uses or posts from social networks) precisely located with geopositioning metadata and applied to enhance the optimization of users positioning.
The first essential element for the development of this work is to know the context of each user. As this information is not recorded in the OSS, operators need to estimate it. This is achieved with the algorithm described in [37], where the probability that a user has established the connection indoors (i.e., ) or outdoors (i.e., ) is estimated from its radio indicators.
After this, the next thing is to know the information of where the buildings are located (i.e., indoor) and which areas of the scenario are uncovered (i.e., outdoor). To do this, a land use map, , is constructed from information obtained either from data portals provided by official sources or from open data platforms (e.g., OpenStreetMap). The information from these platforms is usually composed of a list of geometric elements (i.e., polygons, lines and points), each with a label defining its main social activity and a list with the GPS coordinates of the element vertices. Due to the large range of values that these labels can adopt, they are classified into different types of land use, while the vertices of each element determine the area of land that is classified.
In this work, the E-CID is used to determine in which area of the scenario the connection is likely to occur. Using the E-CID, the possible area of establishment can be reduced to that area covered by the ring defined by the value of TA (i.e., ) that obtains the connection within the serving cell. In this work, the ring area in a cell, , is defined as all those tiles where its distance to the serving cell, , is in the range of the ring (i.e., ). This is because the length of a ring in LTE is approximately 78 m.
Finally, to estimate the spatial dispersion of the population, a matrix is constructed with equivalent dimensions to the land use map and, from the location information provided by the social networks, the number of geolocated posts per tile is added, generating a post distribution map, . This matrix has the problem that, in areas of low population density (e.g., in open country), the average number of posts per tile is much less than one, causing most grids to have no posts or, in some cases, only a few appear. For better estimation of these small density values, a Kriging process is applied to obtain the underlying spatial distribution of publications, . Kriging is a geostatistical interpolation process that, starting from reference points on a map, uses a variogram model to estimate the intermediate points. In simple Kriging processes, one of the most commonly used variogram models is the spherical variogram, defined as,
where is the threshold and a is the range of the variogram, while h is the vector of reference points.
3.2. Spatial Distribution
Once the input data have been processed, a map is constructed with the location of the connections. Unfortunately, traces are rarely geolocated, so they have to be located by the E-CID method. This leads to large positioning errors in rings far from the serving cell. To circumvent this problem, the spatial distribution of users within a ring can be inferred from the distribution of geotagged messages obtained from social networks since the transmission of short messages is not conditional on a good radio link [30].
The geolocation process starts with creating a grid with the same dimensions as the land use map, . Hereafter, the indices refer to the horizontal and vertical indices of the grid. A user context matrix of the same size, , is obtained from the land uses, indicating whether each tile is indoor or outdoor (i.e., ∈). With this map, together with the ring area where each connection occurs (i.e., ), connections are distributed in their context within that ring, based on the probability that each connection occurred in an indoor/outdoor context. In combination with this, the underlying spatial distribution of publications, , is used as an estimate of the population distribution in the scenario, and can be applied to weight which areas of the ring are more likely to embrace a connection (i.e., areas with higher population).
Thus, the data described above is used to compute the probability of a connection occurring in a tile labeled as context (i.e., ∈) in the ring r as
where is the number of tiles labeled as context (i.e., indoor or outdoor) in the ring r, and is the underlying spatial distribution of publications. Note that the same grid index can be served by rings of different cells and, thus, have different values of , associated with more than one ring. Further analysis of (2) shows that, in rings where the number of geotagged posts is 0 (as it could be in unpopulated areas), the connections recorded in the traces are evenly distributed over the ring context area (i.e., ). In contrast, in rings with a large number of geotagged publications, connections are distributed following the distribution of posts in the ring (i.e., ).
Once the probabilities of the ring connections in each tile have been calculated, these probabilities are projected on the map. To do so, they are distributed over the inner/outer tiles within the ring according to the probabilities in (2) and then aggregated among the rings serving the same tiles as
where is the statistical distribution map of connections in the scenario, and is the probability of connection k to have occurred in context .
4. Model Assessment
In this section, the validity of the model created is assessed. First, the data and scenario used for the development of the model are explained. Then, results of users’ statistical distribution are shown (referred to as social model). Results are compared with the other two preliminary models using, first, only the E-CID positioning (E-CID model) and, second, using only E-CID and context information (context model). Finally, the computational complexity of the model is evaluated.
4.1. Validation Scenario
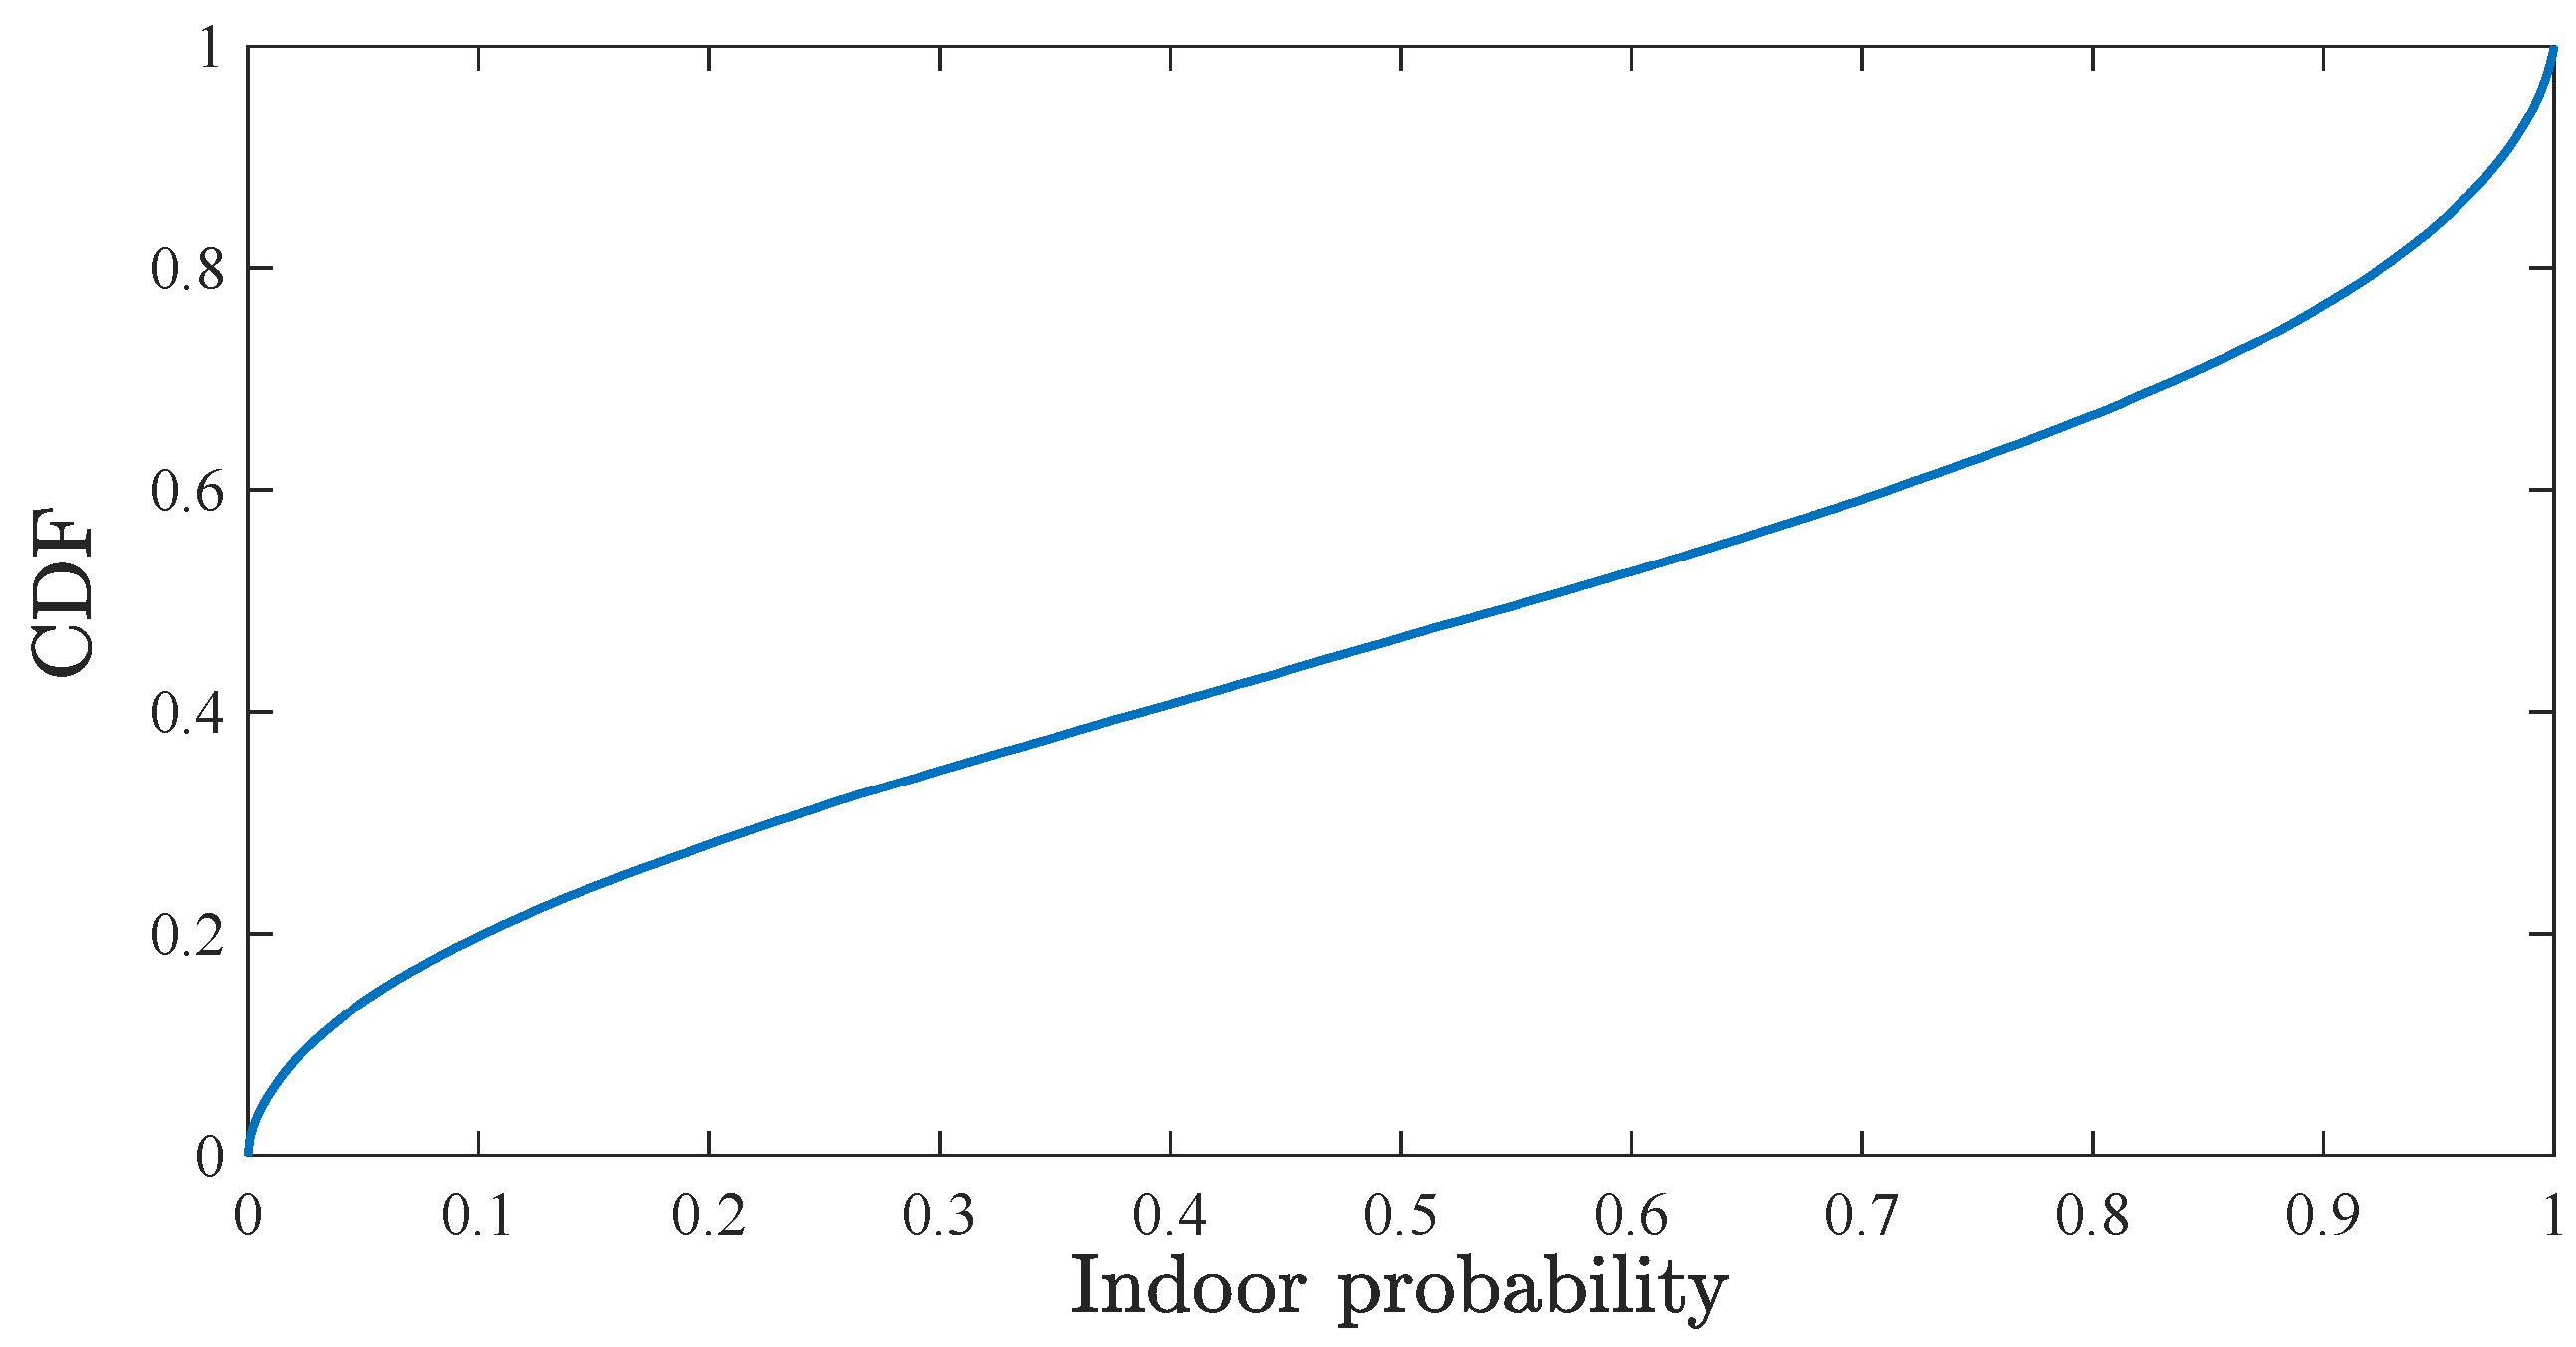
The scenario used to develop the proposed model corresponds to a city of 800,000 inhabitants and its suburbs, covering a geographical area of approximately 125 km. In this area, 400 LTE cells are located, grouped in 175 trisectorized sites, with a carrier frequency of 2325 MHz and a system bandwidth of 15 MHz. In these cells, traces are collected for 2 h, obtaining 166,561 connections. To present the indoor context of these connections, Figure 2 shows the Cumulative Distribution Function (CDF) of the probabilities of each connection to have occurred indoors.
The land use map and the geolocated publication distribution map are defined as a grid, with 10 × 10 m tiles for sufficient resolution. Table 2 shows a breakdown of the land use types, their description, indoor/outdoor classification and percentage of occupancy in the scenario.
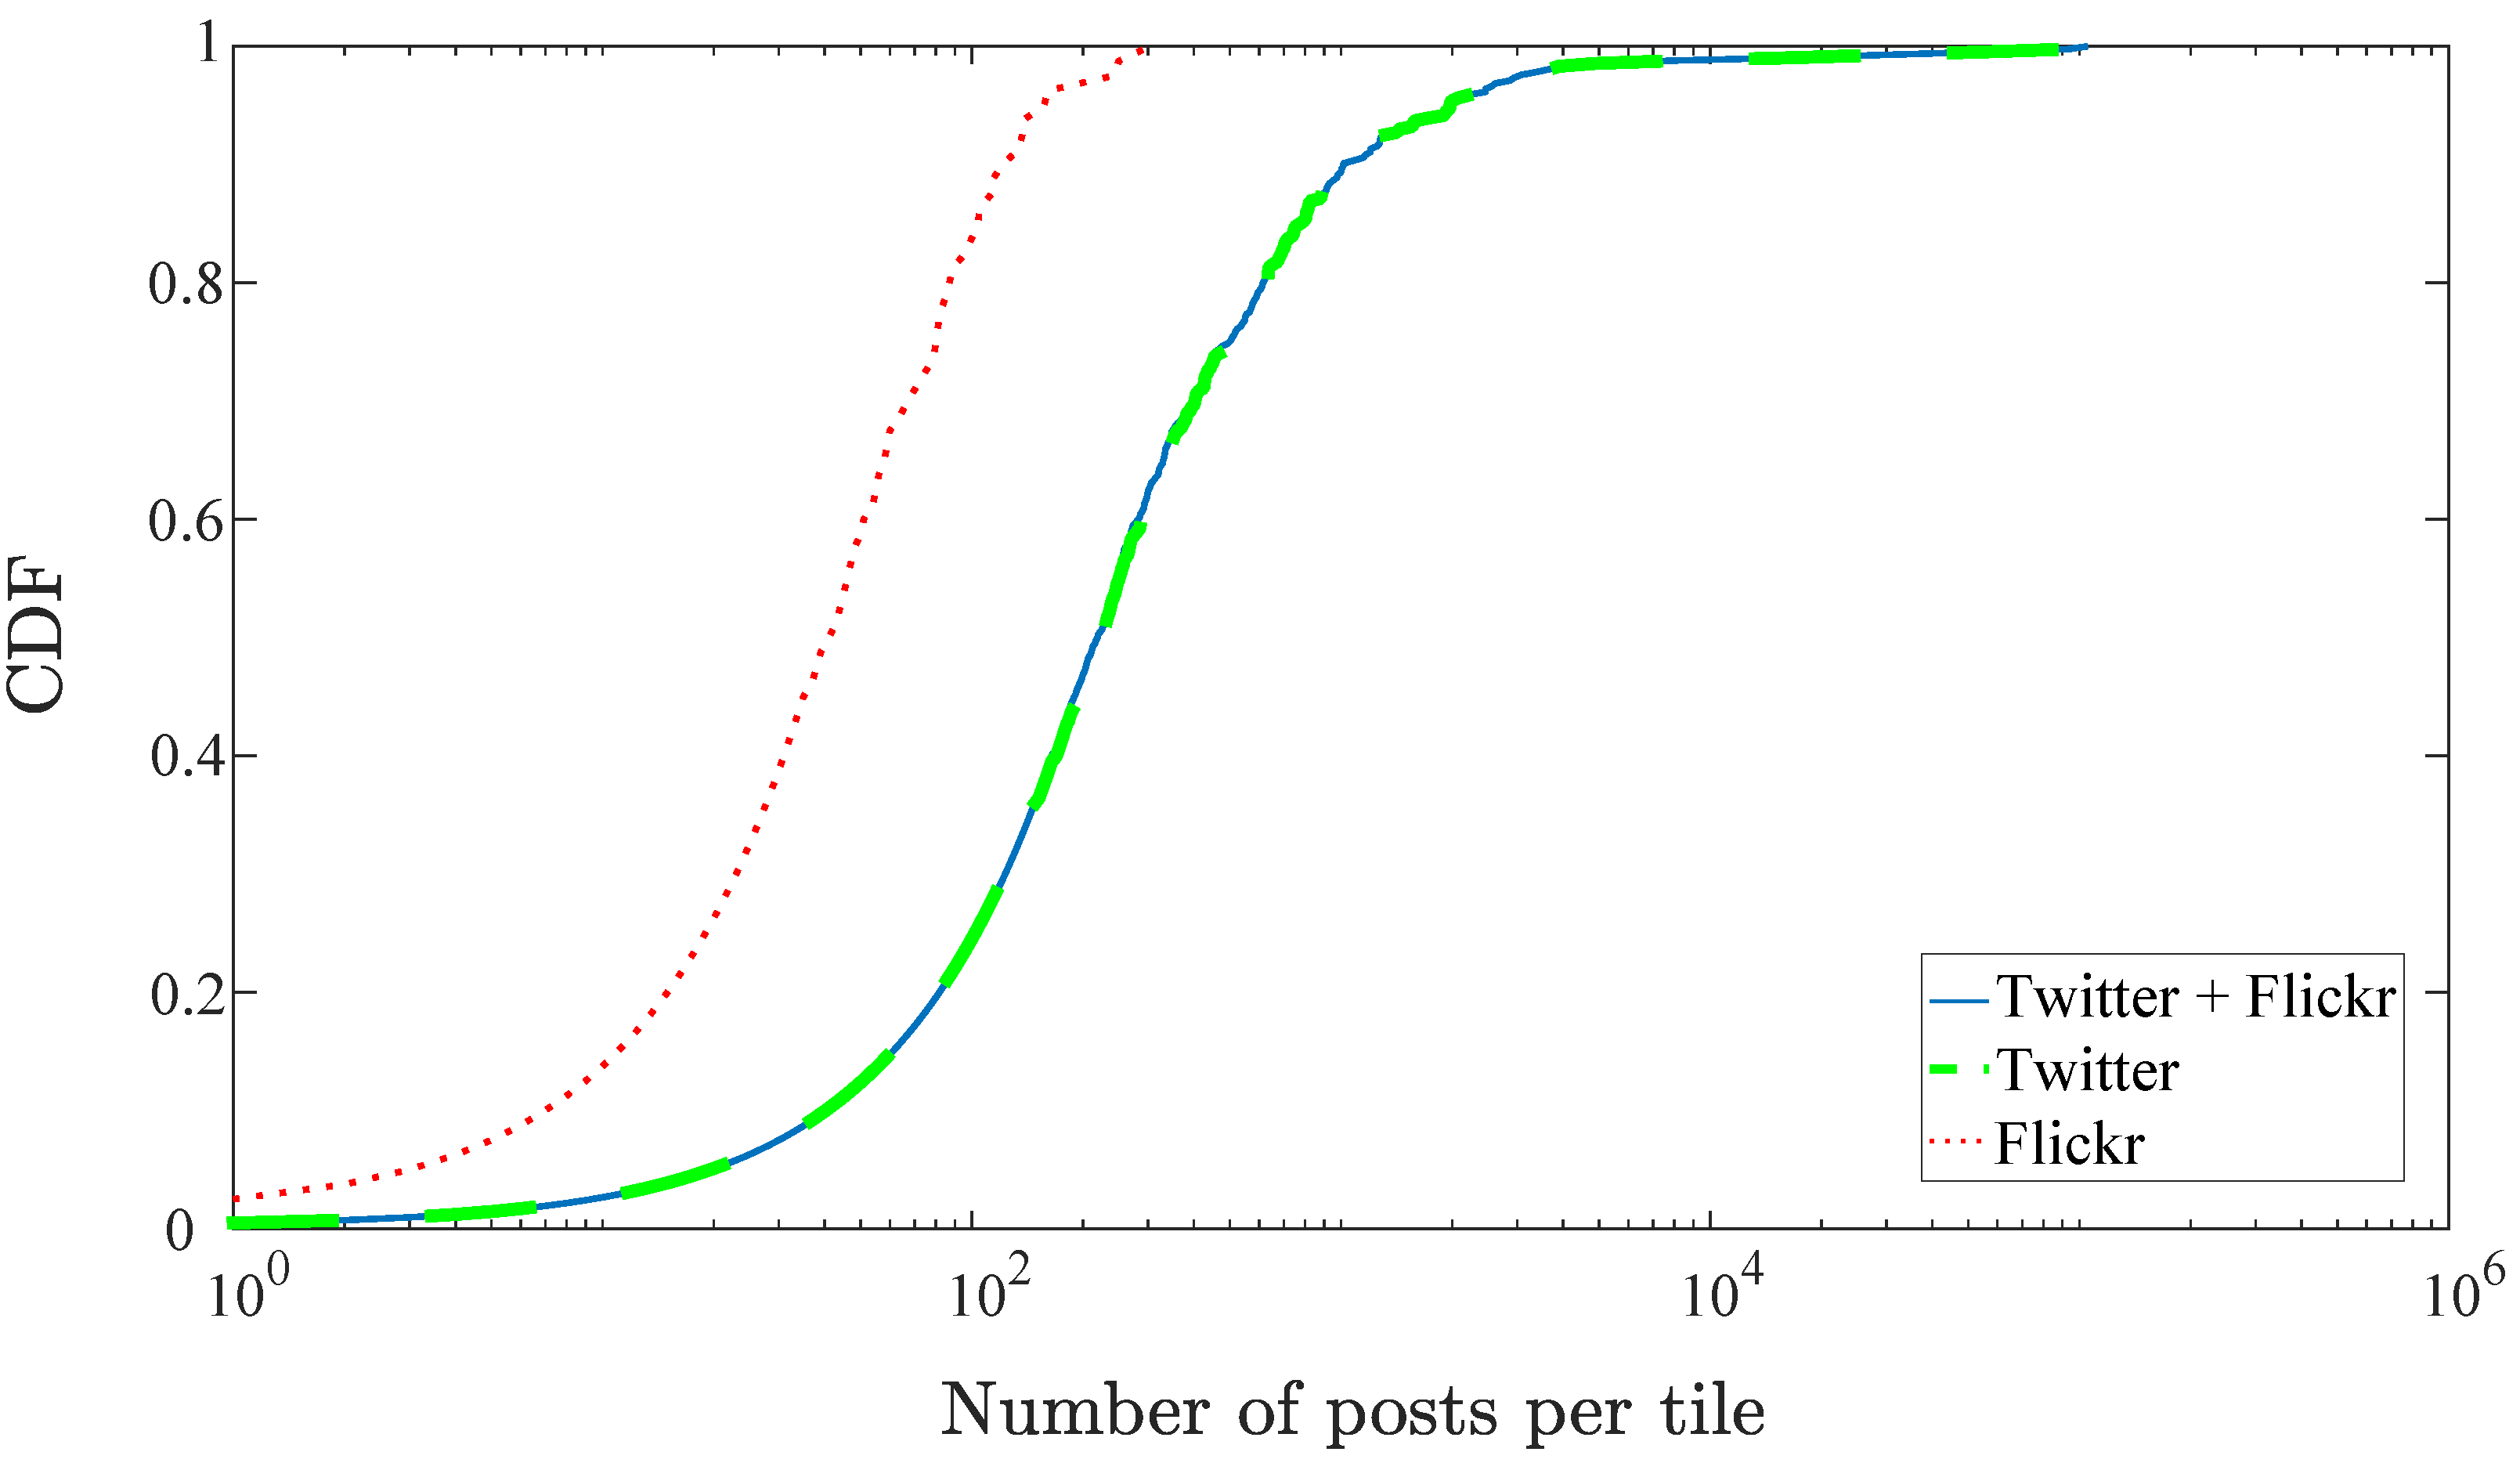
The geotagged social media posts in the area are collected in real-time for 16 months for Twitter and 12 months for Flickr, resulting in 785,515 and 33,519 posts, respectively. Figure 3 shows the CDF of the number of posts in each tile of the scenario, , broken down by application (dashed line for Twitter, and dotted line for Flickr). It can be seen that most of the messages come from Twitter posts (coinciding in their CDF with the distribution of total posts), so it will be the main source of information, leaving Flickr posts as an auxiliary source, to reinforce certain points in the scenario.
4.2. Results
The proposed method aims to solve the lack of the precise location of the users in the network, by means of exploiting the spatial context of both the connections and the scenario. The only way to obtain GPS measurements from the users is using the MDT functionality, which is rarely active and never to all the connections in the network. This missing information makes it impossible to estimate the error in the processing process, so a more exploratory evaluation is needed. For this, the results obtained with the proposed model are compared with the traditional E-CID method and an intermediate version, only adding the context dimension in the positioning. Thus, performance comparison assesses the inclusion of social data. First, a statistical comparison of the number of connections per tile is presented in Figure 5 and Table 3. Then, the spatial performance is checked in the two cases shown in Figure 4, to illustrate the resolution of the proposed method, in comparison to the other two models, presented in Figure 6.
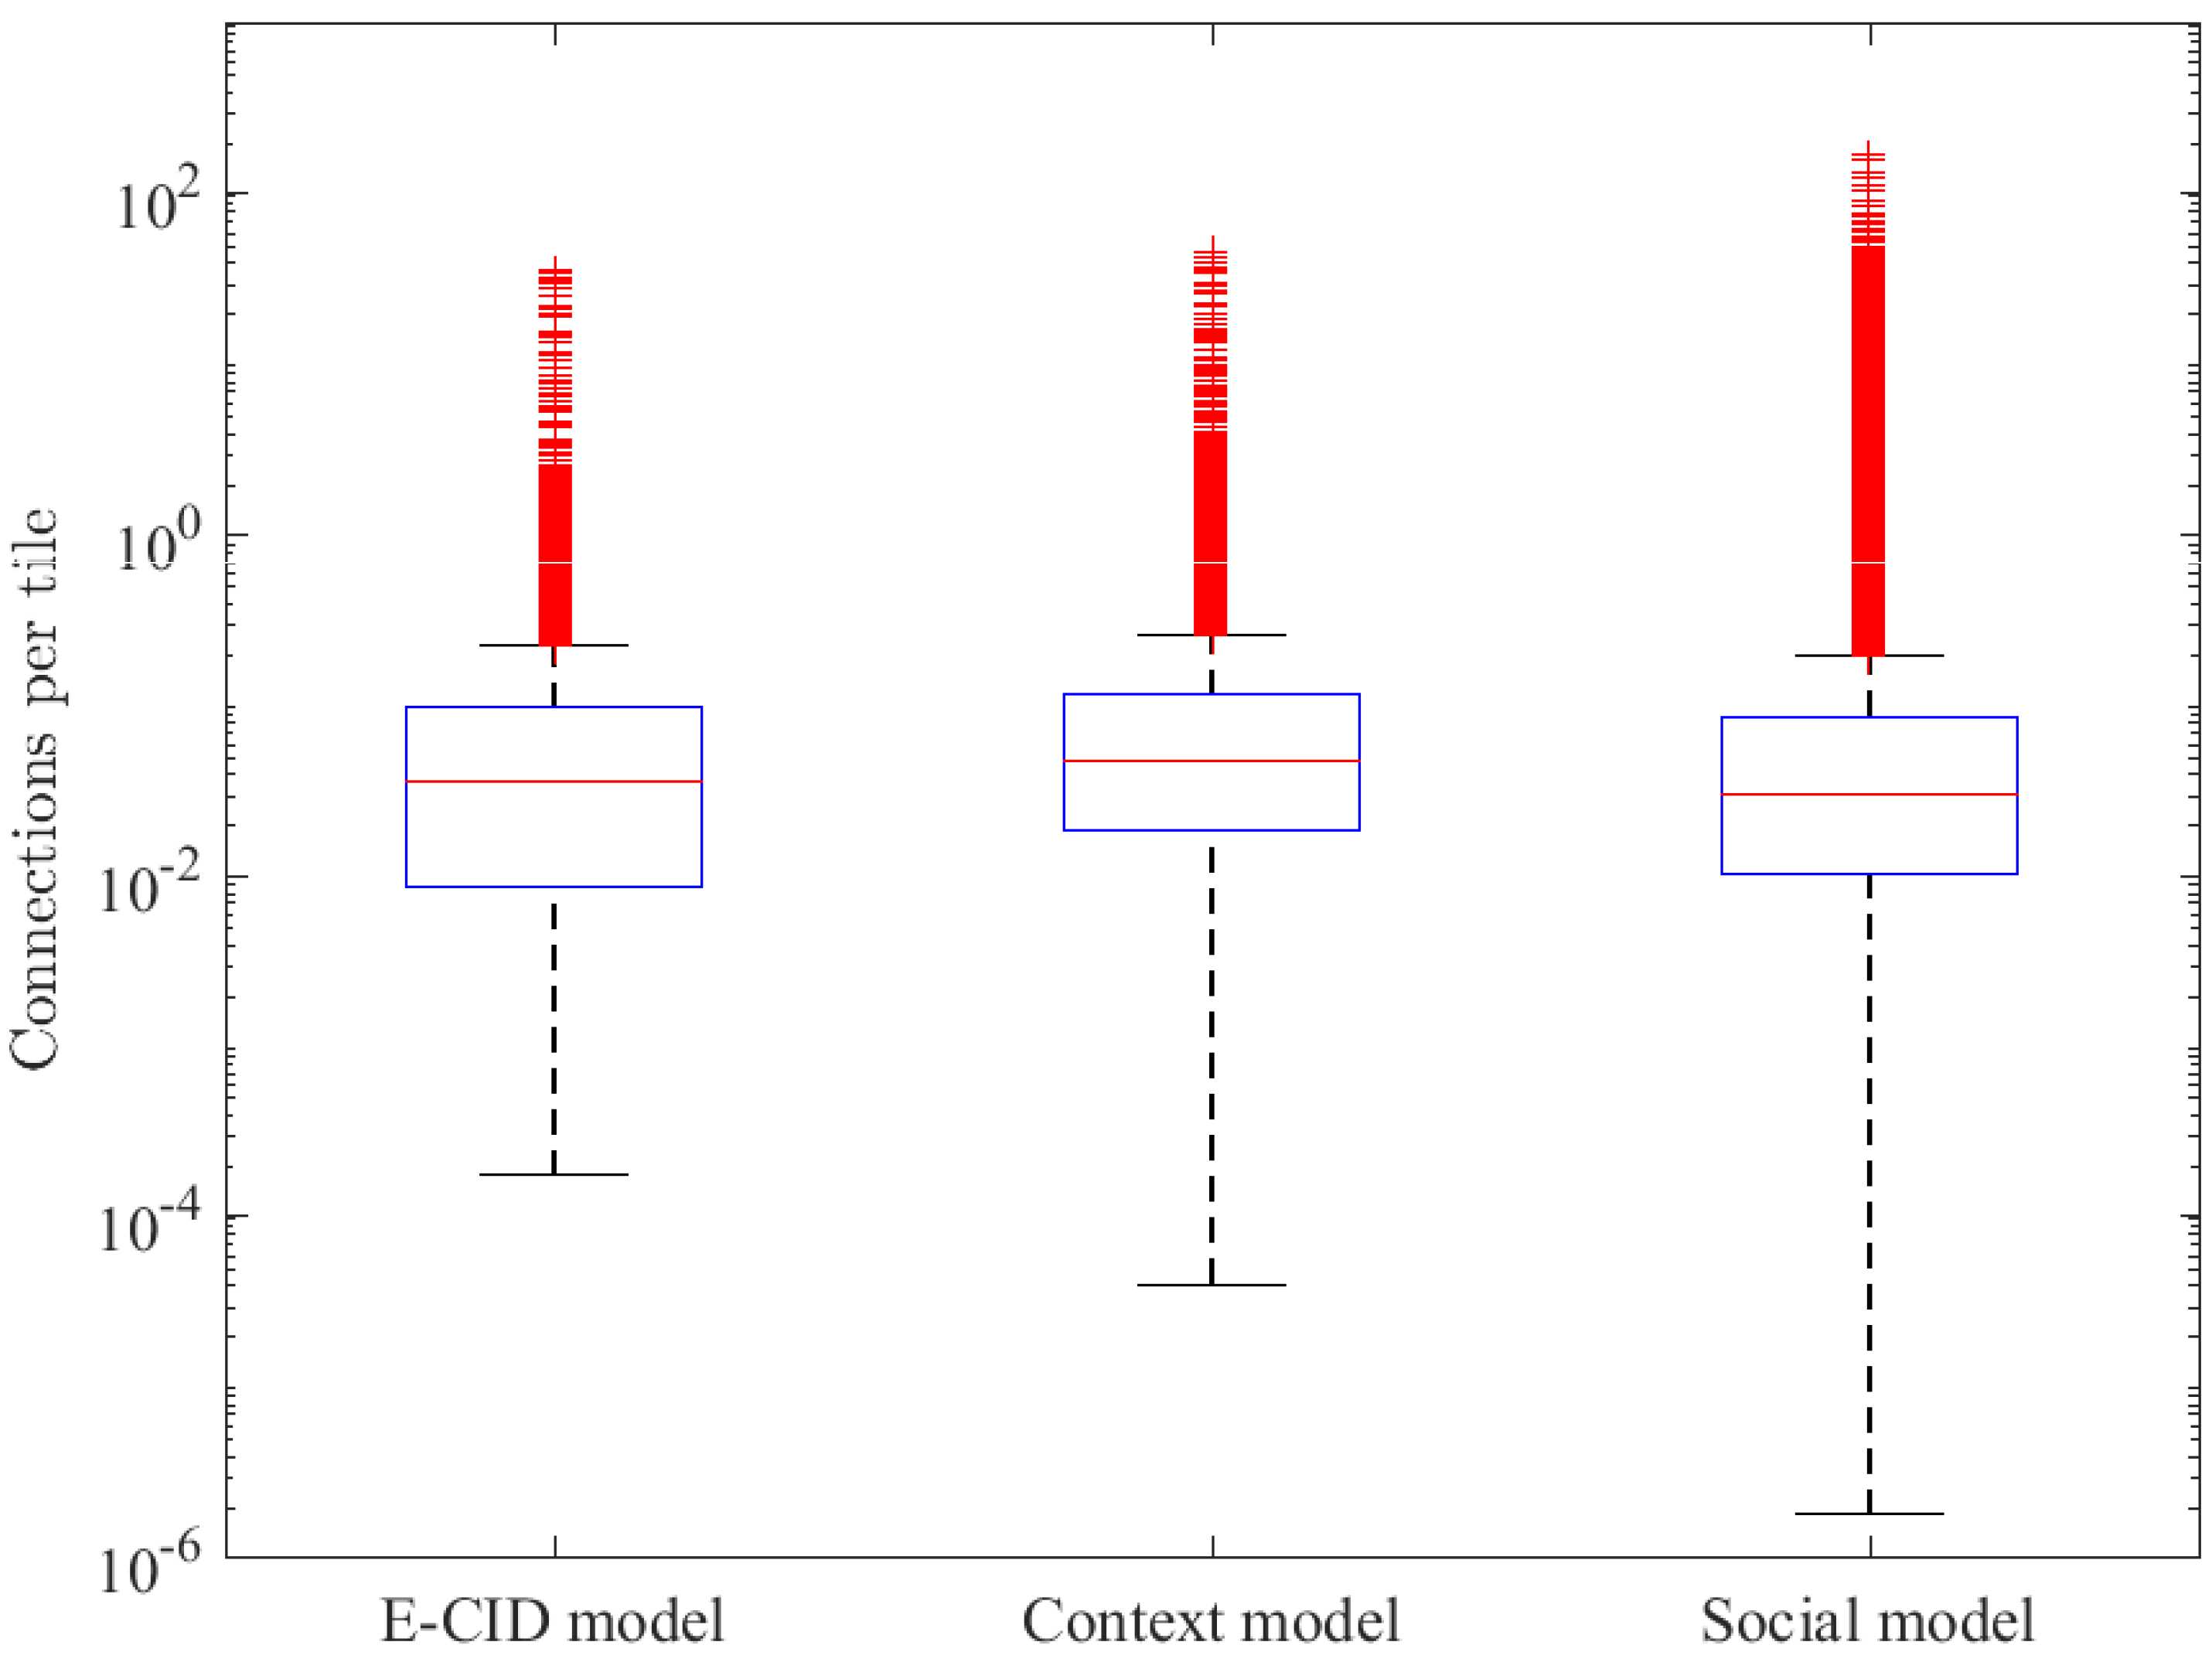
Figure 5 shows the number of connections per tile in the full scenario with a boxplot for the three models assessed (E-CID, context and social model). The ordinate axis is in logarithmic scale aiming to optimize the graphical representation.
The figure illustrates how context and social models (i.e., those models using additional information) can improve user positions in the ring area. In particular, by adding the indoor context of the connections (i.e., context model), clusters of users are detected, thus emptying areas where there were no connections and, then, diminishing the amount of connections in those tiles widening statistical distribution in the figure compared to E-CID model. This is greatly enhanced by the inclusion of geopositioned posts from social networks (i.e., social model), which allows the identification of tiles with high connection densities and unpopulated areas, masked in previous models. As a consequence, the statistical distribution for the social model is additionally widened.
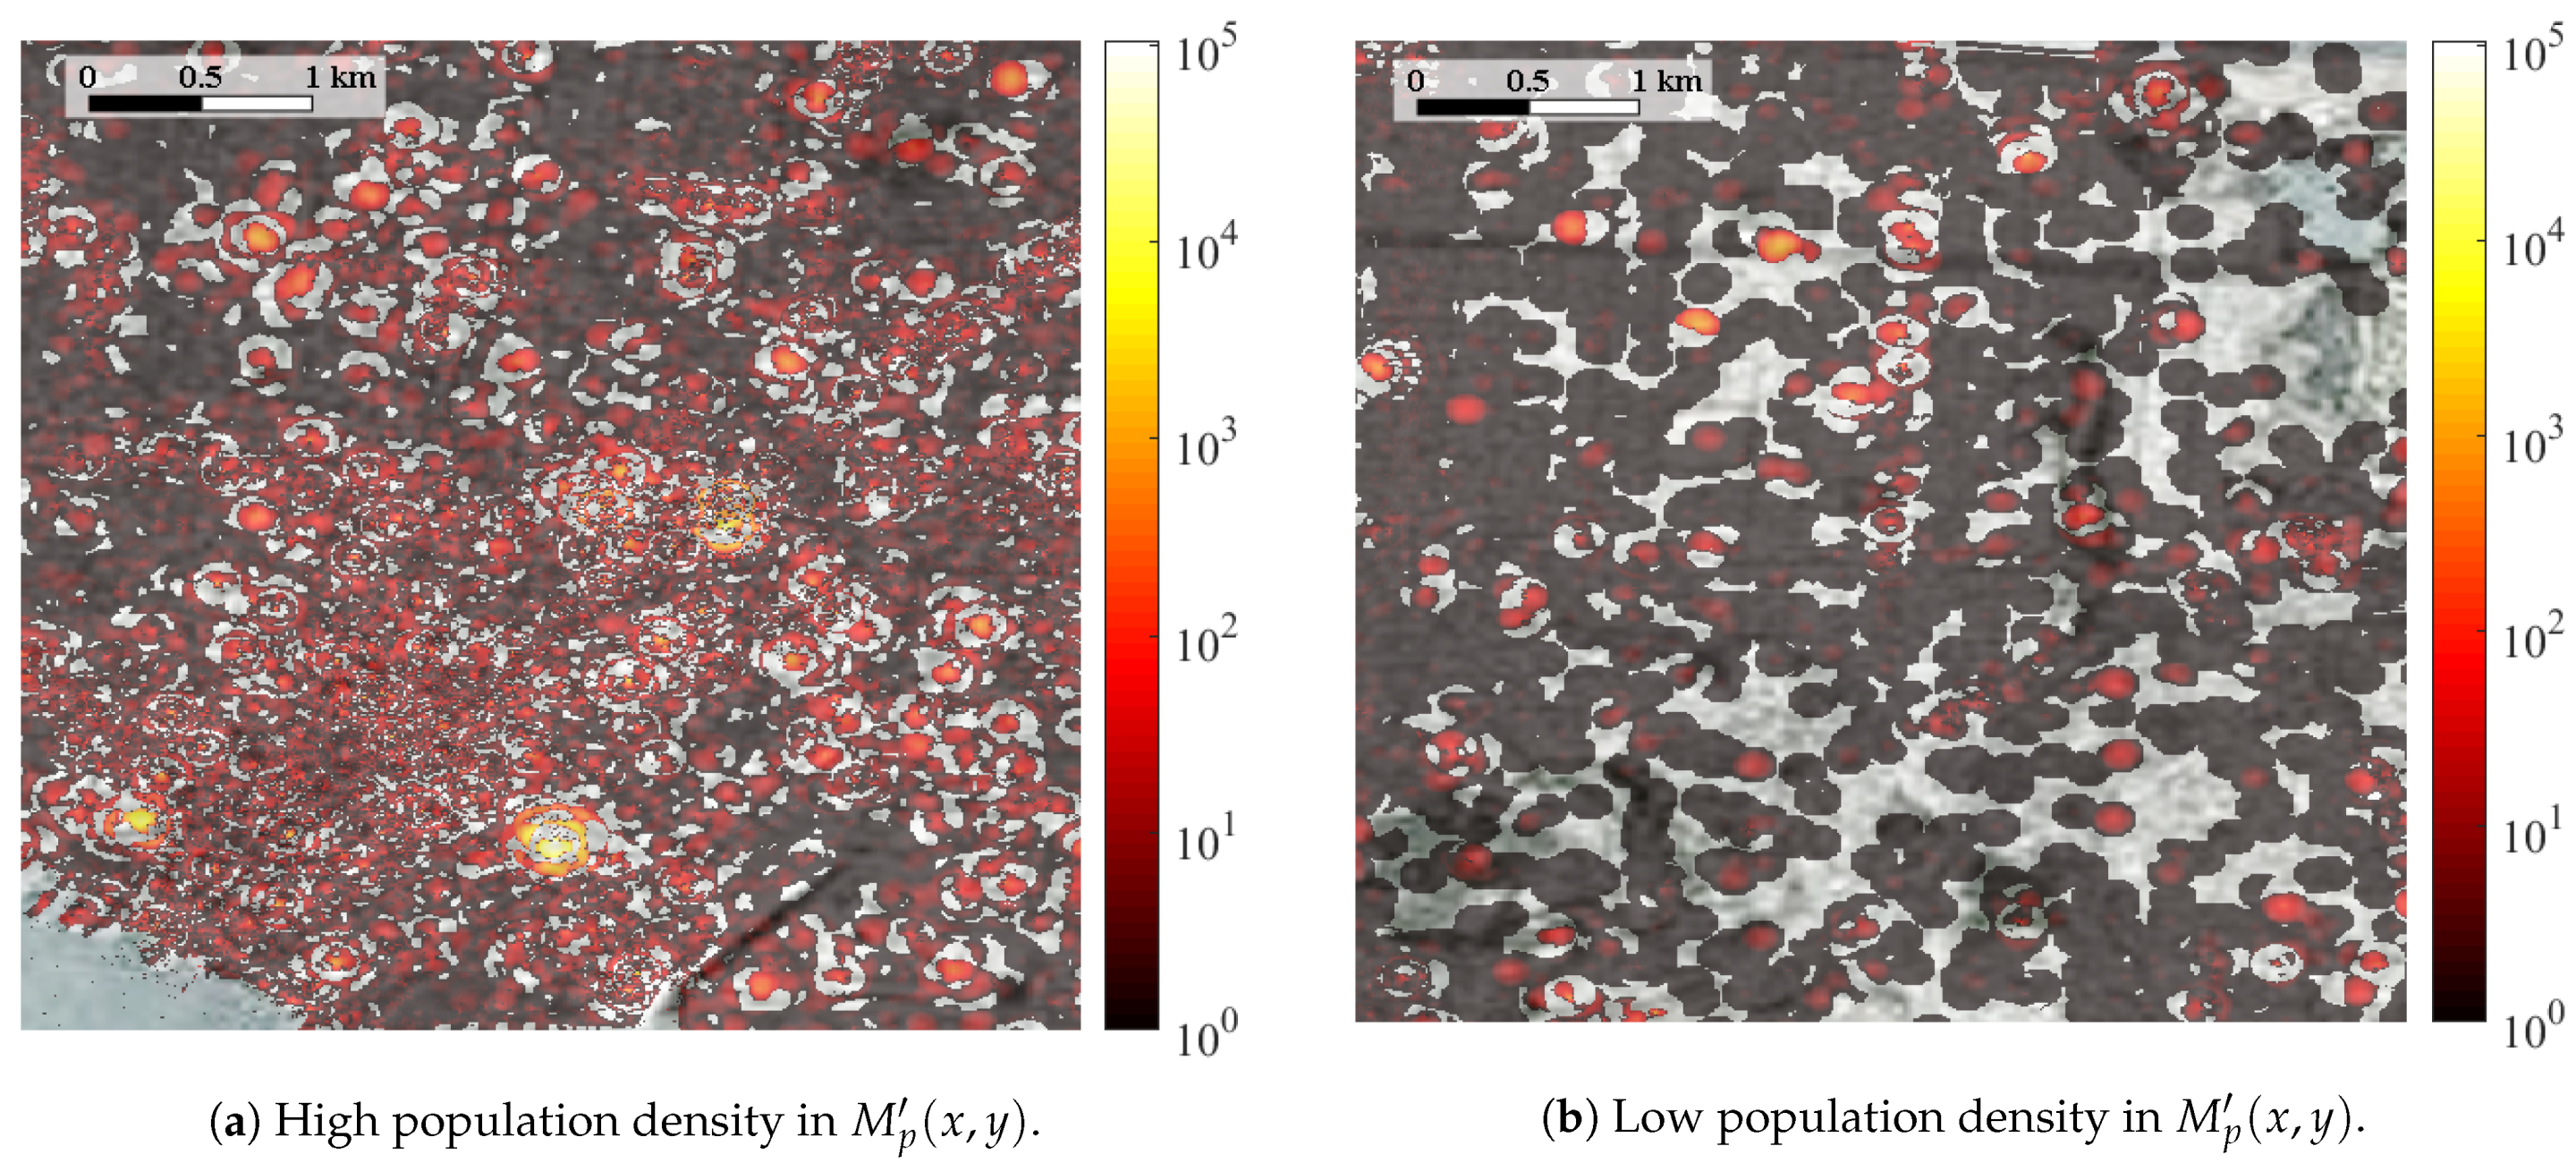
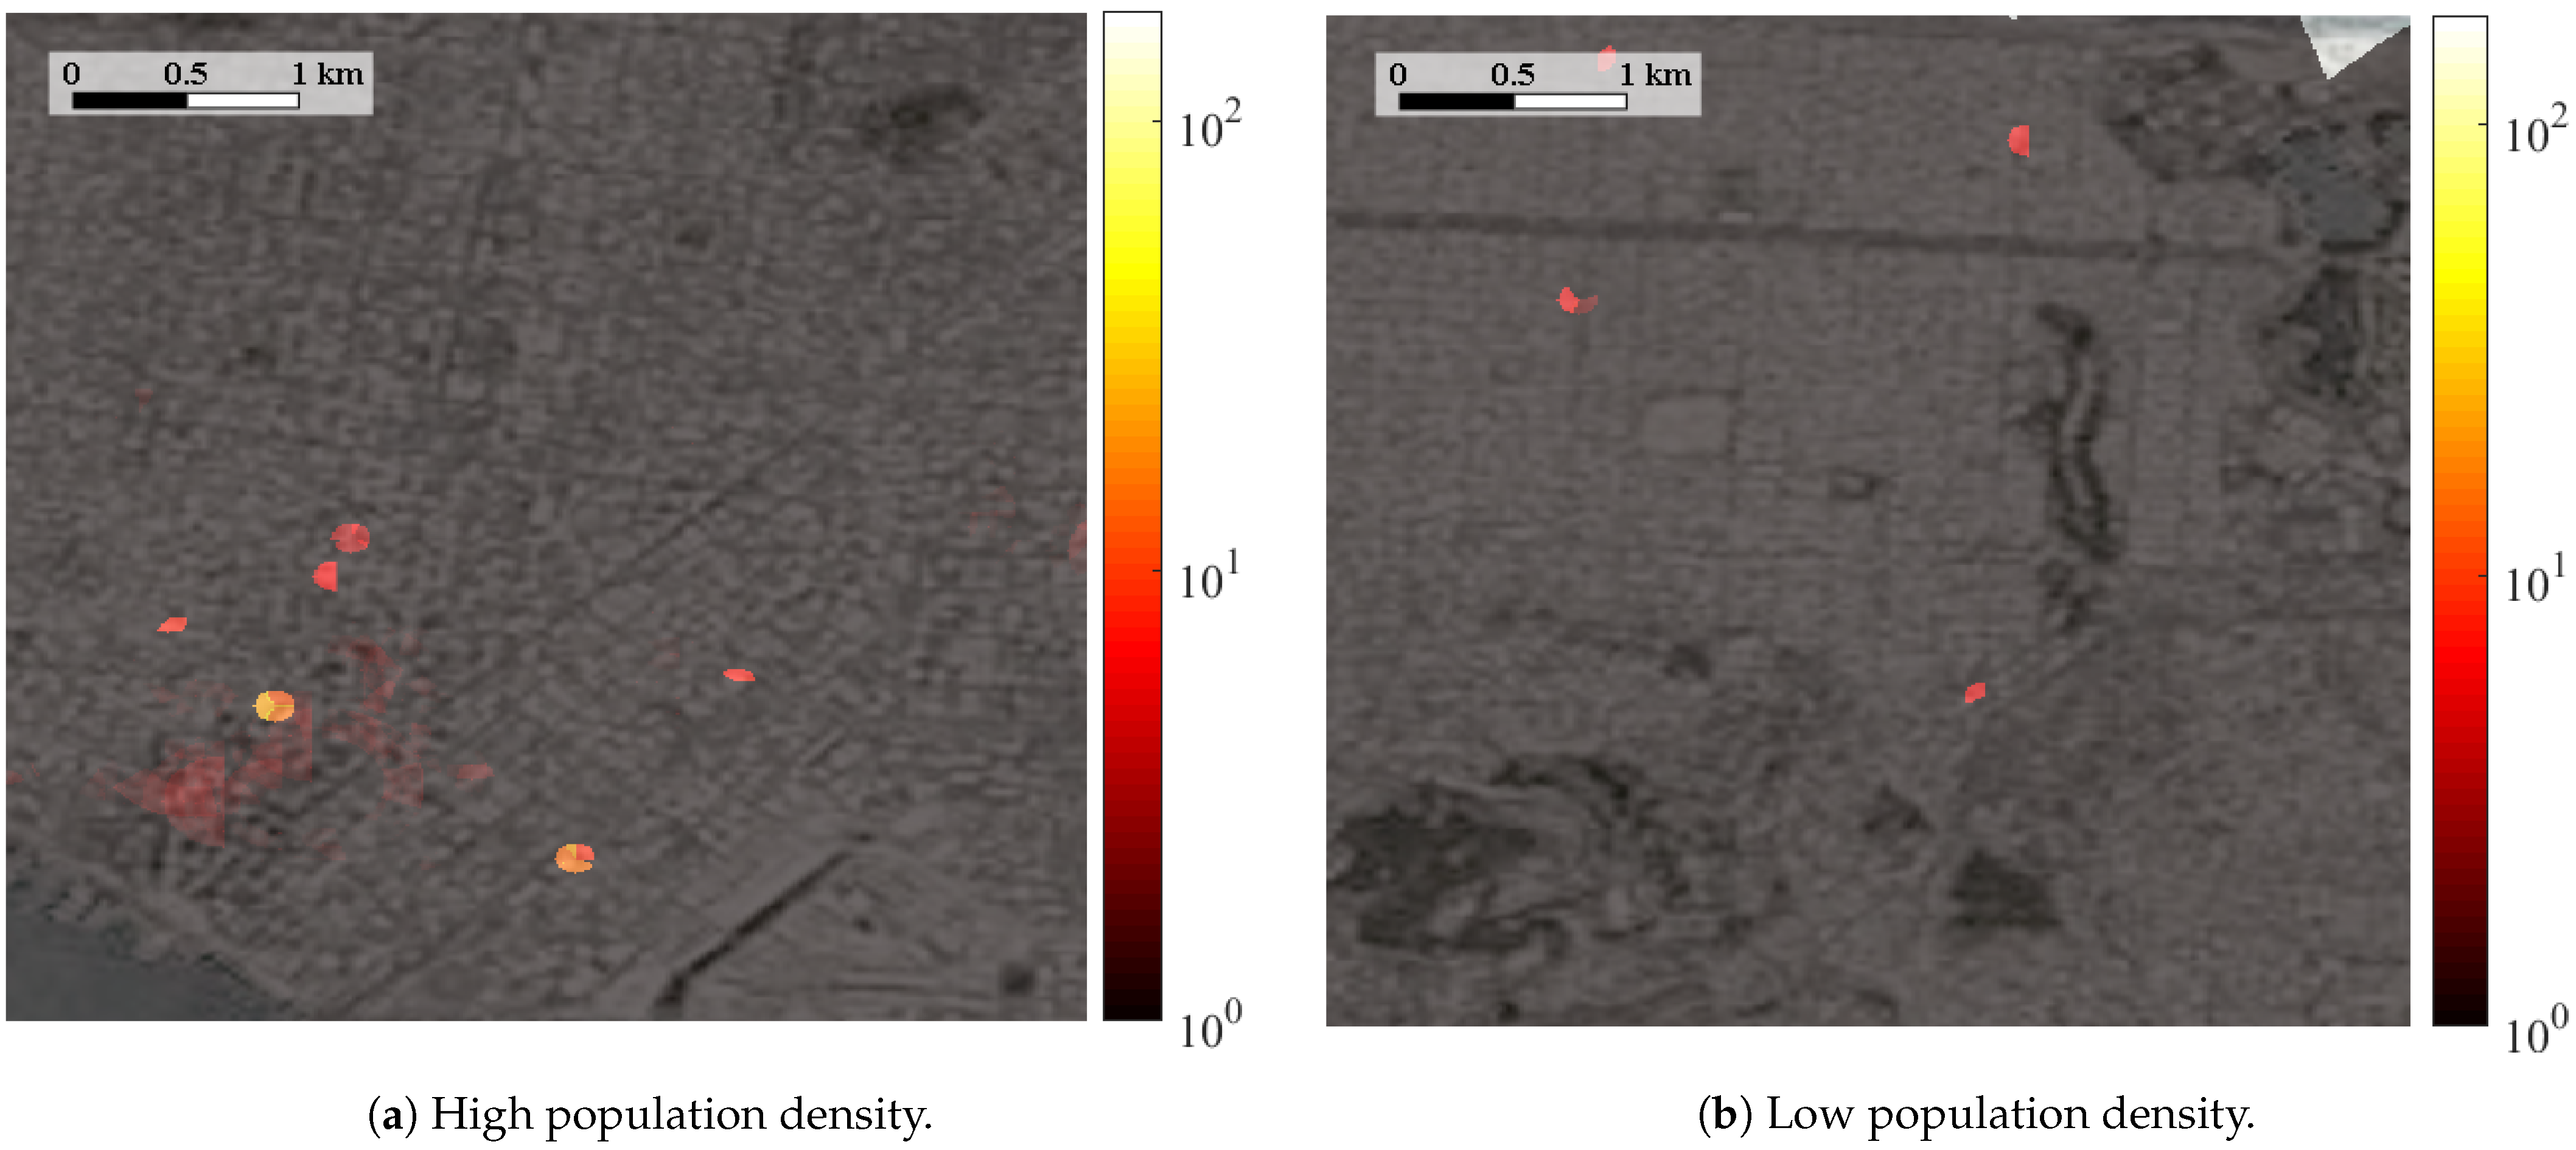
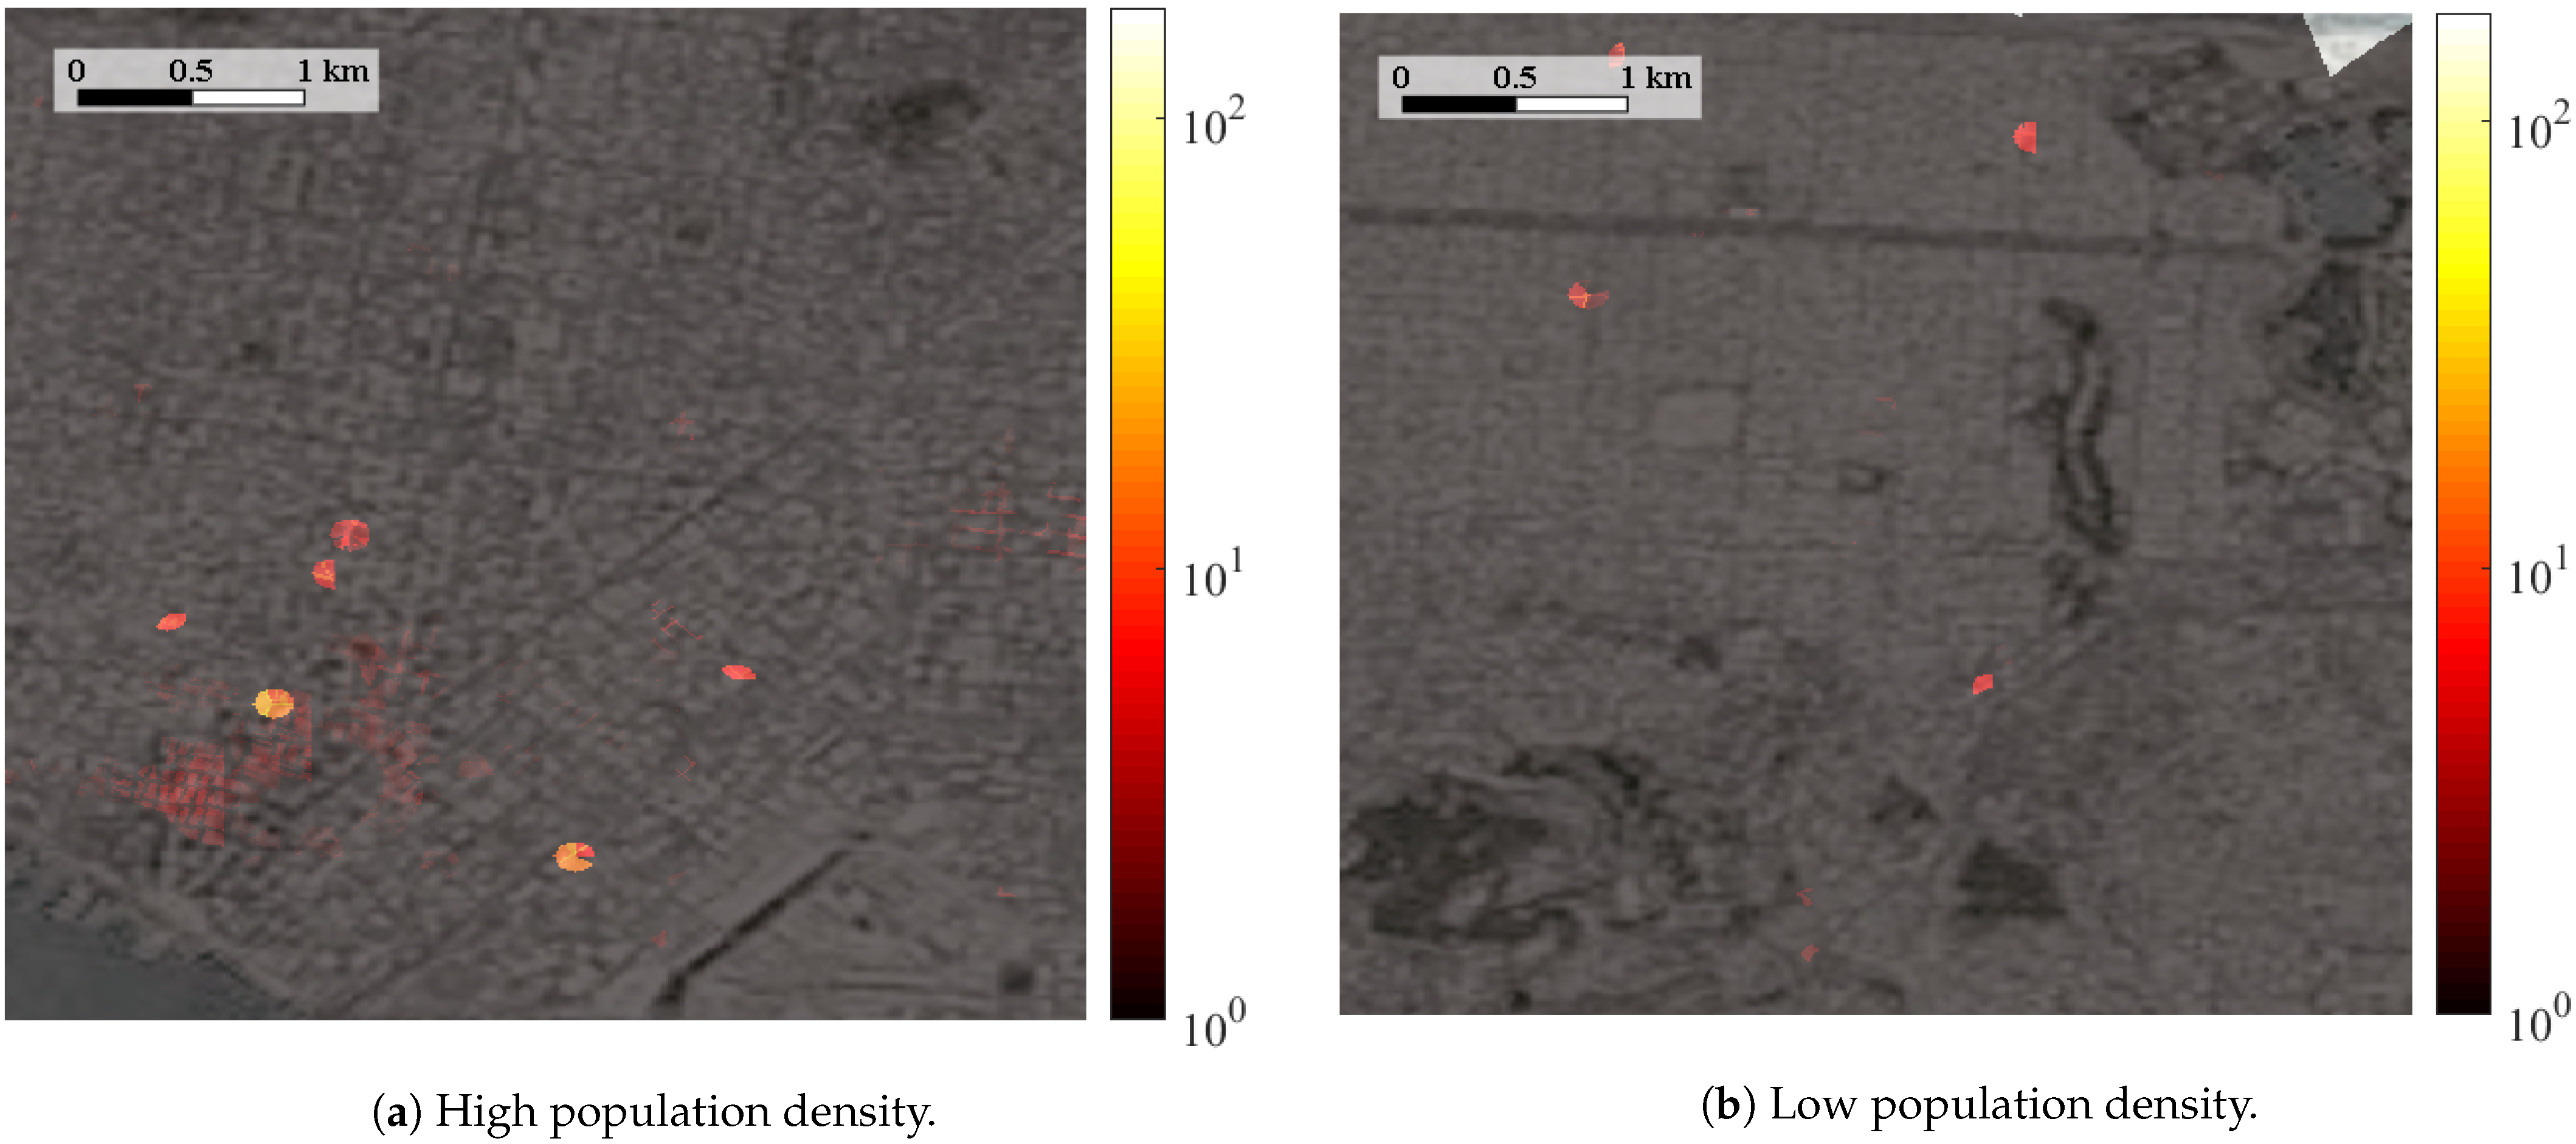
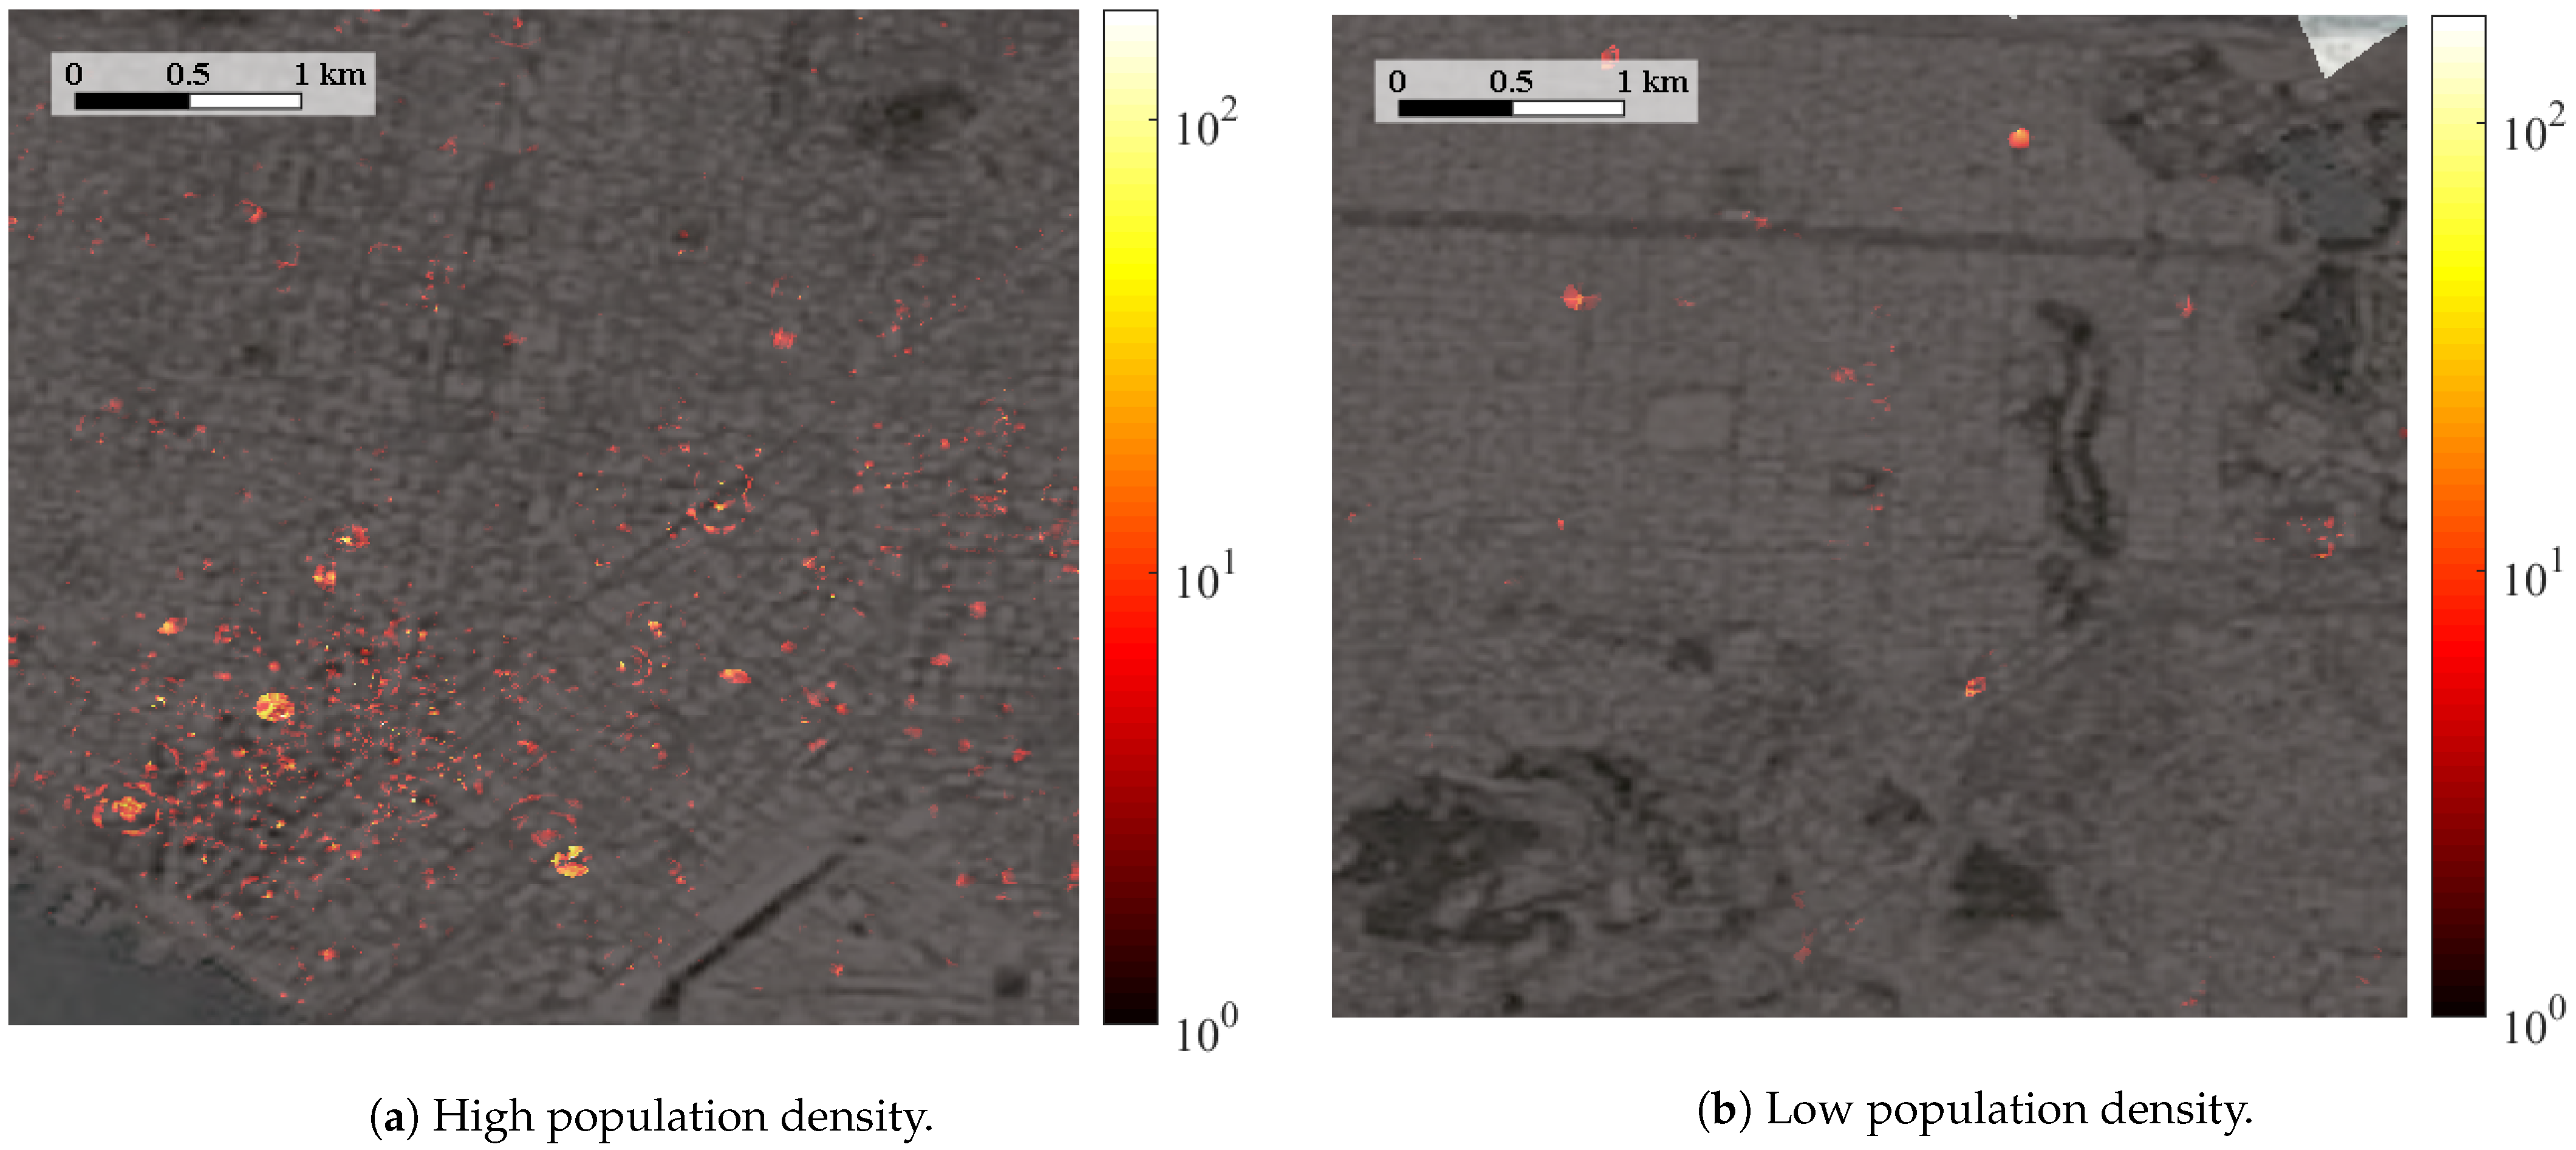
Moreover, and with the aim of checking the resolution for user distribution in the network, Figure 6, Figure 7 and Figure 8 show, respectively, a heatmap with the number of connections per tile in the three E-CID, Context and Social models with high and low population densities each (i.e., six subfigures in three figures), presented previously in Figure 4.
These figures highlight that the information provided by geolocated posts, when available, significantly improves the connection location process. Specifically, for high population density scenarios (Figure 6a, Figure 7a and Figure 8a), where the activity in social networks is high enough to generate a significant number of geolocated publications, the social model achieves a significant increase for the resolution of connection distribution. Granularity for the social model (Figure 8a) is not observed in either E-CID or context models (Figure 6a and Figure 7a). In contrast, context and social models behave similarly with a low population density (Figure 7b and Figure 8b), due to the lack of geopositioned publications. These subfigures also point out that, as expected, high population density scenarios (Figure 6a, Figure 7a and Figure 8a) embrace a greater number of connections than areas relatively depopulated, thus the use of population density to weigh the more probable areas is justified.
More specifically, Figure 6a,b shows the spatial distribution of the users applying the traditional E-CID method in both density cases. These subfigures evidence that the method equally distributes all the connections in the area covered by the serving ring, independently of the topology of the field or the high (Figure 6a) or low (Figure 6b) population density. The only variability is observed in Figure 6a, where the greater number of connections and overlapped rings of TA show some irregularities in ring areas.
Similarly, Figure 7a,b presents the results obtained in the same areas with the context model (i.e., adding indoor context to the E-CID method). This positioning methodology takes advantage of the indoor context to segregate connections between buildings and open space. Although this behavior can be observed in areas with peaks of connections of both subfigures, this is more evident in Figure 7a, where the amount of connections allowed to observe this effect, being able to clearly differentiate between connections on streets and inside buildings.
Finally, Figure 8a,b illustrates the results of the Social model, where the E-CID method is improved with both indoor context and social networks spatial information. With the inclusion of the social information, the context model is greatly improved in high populated areas (Figure 8a), enabling to obtain a much higher resolution in the location process. On the contrary, areas relatively depopulated (Figure 8b) are much less improved by the social information, performing similarly to the context model (Figure 7b).
4.3. Computational Complexity
As a preliminary process, previous to the statistical positioning methods, firstly, input data collection and preprocessing are required. The execution time of trace preprocessing grows linearly with the number of connections and data fields, while map construction grows linearly with the number of map tiles. In this preliminary stage, the task demanding the highest computational load is the kriging process. Its time complexity is [38] to solve linear equations for N source points.
Once the input data are available, the computational complexity of the social method is given by the algorithm constructing the spatial connection distribution. The algorithm distributes connections originating in the area covered by an r ring out of the rings in the scenario. Thus, the worst-case time complexity is .
Trace processing is performed by complex event processing with Esper routines, land uses are processed with Matlab, and social network data is obtained with the Twitter Streaming API using Java (Twitter4j library) and the Flickr API using Python [39,40,41], both processed with Matlab. Finally, the social model has been implemented using the image processing toolbox in Matlab.
All these processes have been tested on a server with a 2.4 GHz octa-core processor and 64 GB of RAM. To decode and process the connection traces (400 cells, 2 h of traces, 166,561 connections), the time required is 282 s. Likewise, the times to construct and (125 km, 1,222,787 tiles) are 50,444 and 57,743 s, respectively. To conclude, the time spent in positioning connections is 159.46 s.
5. Conclusions
Knowledge of the spatial distribution of user equipment in the scenario is key when performing management of cellular networks. In this work, the distribution of connections is achieved by means of an algorithm that, relying on user context information and knowledge of the agglomeration of social network posts, determines in which tiles of the scenario a connection is most likely to occur.
The results obtained indicate that the spatial distribution of social network posts provides highly relevant information of the user agglomerations, bringing a granularity to the connection positioning process that is not seen with a classic E-CID method. In addition, the context information of the users, although to a lesser extent, also increases the accuracy in the positioning, being able to segregate connections in buildings or open spaces. This makes the inclusion of both data sources interesting when it comes to understanding the distribution of users in the network.
The analysis of publications in the scenario reflects that, as expected, the spatial information provided by each social network is highly dependent on its popularity. In the case studied, the distribution of publications is almost entirely determined by Twitter. It remains to be tested whether, by adding social networks of similar popularity (e.g., Instagram or Facebook), granularity is improved.
The model presented in this work serves as a support in network management tasks where the position of users is a relevant factor, such as the planning of new cells or the management of areas with capacity problems. The construction of land use and publications maps are the most computationally intensive tasks, but, once performed, the results obtained can be stored for future applications. On the other hand, the low computational complexity of the method allows easy integration into radio planning tools. By combining different data sources, the method can take full advantage of the latest network management systems based on big data.
Author Contributions
Conceptualization, J.L.B.-L., M.T. and M.F.-N.; methodology, J.L.B.-L., M.T. and M.F.-N.; software, J.L.B.-L. and L.R.J.; validation, J.L.B.-L., M.T. and M.F.-N.; formal analysis, J.L.B.-L., M.T. and M.F.-N.; investigation, J.L.B.-L., M.T. and M.F.-N.; resources, J.L.B.-L., M.T. and S.L.-R.; data curation, J.L.B.-L.; writing—original draft preparation, J.L.B.-L.; writing—review and editing, M.T., M.F.-N., L.R.J. and S.L.-R.; visualization, J.L.B.-L.; supervision, M.T. and M.F.-N.; project administration, J.L.B.-L., M.T. and M.F.-N.; funding acquisition, M.T. and S.L.-R. All authors have read and agreed to the published version of the manuscript.
Funding
This work has been funded by the Spanish Ministry of Science, Innovation and Universities (RTI2018-099148-B-I00) and Junta de Andalucía (UMA18-FEDERJA-256).
Data Availability Statement
Codes for post collection can be found at: https://mobilenet.uma.es/index.php/resources/ (accessed on 26 July 2021).
Conflicts of Interest
The authors declare no conflict of interest.
References
- Ericsson. Ericsson Mobility Report June 2018. 2018, pp. 3–13. Available online: https://www.ericsson.com/491e17/assets/local/mobility-report/documents/2018/ericsson-mobility-report-june-2018.pdf (accessed on 24 May 2019).
- Malisuwan, S.; Milindavanij, D.; Kaewphanuekrungsi, W. Quality of Service (QoS) and Quality of Experience (QoE) of the 4G LTE perspective. Int. J. Future Comput. Commun. 2016, 5, 158. [Google Scholar] [CrossRef]
- Reades, J.; Calabrese, F.; Sevtsuk, A.; Ratti, C. Cellular census: Explorations in urban data collection. IEEE Pervasive Comput. 2007, 6, 30–38. [Google Scholar] [CrossRef] [Green Version]
- Keally, M.; Zhou, G.; Xing, G.; Wu, J.; Pyles, A. Pbn: Towards practical activity recognition using smartphone-based body sensor networks. In Proceedings of the 9th ACM Conference on Embedded Networked Sensor Systems, Seattle, WA, USA, 1–4 November 2021; pp. 246–259. [Google Scholar]
- Baldo, N.; Giupponi, L.; Mangues, J. Big Data Empowered Self Organized Networks. In Proceedings of the 20th European Wireless Conference, Barcelona, Spain, 14–16 May 2014. [Google Scholar]
- 5G-PPP. 5G Architecture. 5G-PPP White Papers. 2016. Available online: https://5g-ppp.eu/wp-content/uploads/2014/02/5G-PPP-5G-Architecture-WP-July-2016.pdf (accessed on 25 July 2021).
- Galindo-Serrano, A.; Sayrac, B.; Jemaa, S.B.; Riihijärvi, J.; Mähönen, P. Automated coverage hole detection for cellular networks using radio environment maps. In Proceedings of the 2013 11th International Symposium and Workshops on Modeling and Optimization in Mobile, Ad Hoc and Wireless Networks (WiOpt), Tsukuba, Japan, 13–17 May 2013; pp. 35–40. [Google Scholar]
- Malandrino, F.; Chiasserini, C.F.; Kirkpatrick, S. Cellular network traces towards 5 G: Usage, analysis and generation. IEEE Trans. Mob. Comput. 2017, 17, 529–542. [Google Scholar] [CrossRef]
- Liu, H.; Darabi, H.; Banerjee, P.; Liu, J. Survey of wireless indoor positioning techniques and systems. IEEE Trans. Syst. Man Cybern. Part C 2007, 37, 1067–1080. [Google Scholar] [CrossRef]
- Van Diggelen, F.S.T. A-Gps: Assisted Gps, Gnss, and Sbas; Artech House: London, UK, 2009. [Google Scholar]
- Frattasi, S.; Della Rosa, F. Mobile Positioning and Tracking: From Conventional to Cooperative Techniques; John Wiley & Sons: Hoboken, NJ, USA, 2017. [Google Scholar]
- Roxin, A.; Gaber, J.; Wack, M.; Nait-Sidi-Moh, A. Survey of wireless geolocation techniques. In Proceedings of the IEEE Globecom Workshops, Washington, DC, USA, 26–30 November 2007; pp. 1–9. [Google Scholar]
- Vo, Q.D.; De, P. A survey of fingerprint-based outdoor localization. IEEE Commun. Surv. Tutor. 2016, 18, 491–506. [Google Scholar] [CrossRef]
- Zhou, P.; Zheng, Y.; Li, Z.; Li, M.; Shen, G. Iodetector: A generic service for indoor outdoor detection. In Proceedings of the 10th ACM Conference on Embedded Network Sensor Systems, Toronto, ON, Canada, 6–9 November 2012; pp. 113–126. [Google Scholar]
- 3rd Generation Parthnership Project. In Stage 2 Functional Specification of UE Positioning in E-UTRAN, TS 36 305; Version 13.0.0; Release 13; 2016; Available online: https://www.etsi.org/deliver/etsi_ts/136300_136399/136305/13.00.00_60/ts_136305v130000p.pdf (accessed on 25 July 2021).
- Holm, S. Hybrid ultrasound-RFID indoor positioning: Combining the best of both worlds. In Proceedings of the 2009 IEEE International Conference on RFID, Orlando, FL, USA, 27–28 April 2009; pp. 155–162. [Google Scholar]
- Groves, P.D. Navigation using inertial sensors [Tutorial]. IEEE Aerosp. Electron. Syst. Mag. 2015, 30, 42–69. [Google Scholar] [CrossRef]
- Grewal, M.S.; Andrews, A.P. Kalman Filtering: Theory and Practice with Matlab; John Wiley & Sons: Hoboken, NJ, USA, 2014. [Google Scholar]
- Arulampalam, M.S.; Maskell, S.; Gordon, N.; Clapp, T. A tutorial on particle filters for online nonlinear/non-Gaussian Bayesian tracking. IEEE Trans. Signal Process. 2002, 50, 174–188. [Google Scholar] [CrossRef] [Green Version]
- Li, Z.; Xu, K.; Wang, H.; Zhao, Y.; Wang, X.; Shen, M. Machine-learning-based positioning: A survey and future directions. IEEE Netw. 2019, 33, 96–101. [Google Scholar] [CrossRef]
- Johansson, J.; Hapsari, W.A.; Kelley, S.; Bodog, G. Minimization of drive tests in 3GPP release 11. IEEE Commun. Mag. 2012, 50, 36–43. [Google Scholar] [CrossRef]
- Gill, B.; Khanifar, S.; Robinson, J.; Westwood, S. OpenSignal. 2010. Available online: https://www.opensignal.com/ (accessed on 20 June 2019).
- Vardi, Y.; Scherzer, T.; Kohavi, A.; Scherzer, S. WeFi. 2006. Available online: https://www.wefi.com/ (accessed on 10 January 2021).
- Kovács, Z.; Vida, G.; Elekes, A.; Kovalcsik, T. Combining Social Media and Mobile Positioning Data in the Analysis of Tourist Flows: A Case Study from Szeged, Hungary. Sustainability 2021, 13, 2926. [Google Scholar] [CrossRef]
- Osorio-Arjona, J.; García-Palomares, J.C. Social media and urban mobility: Using twitter to calculate home-work travel matrices. Cities 2019, 89, 268–280. [Google Scholar] [CrossRef]
- Zhang, C.; Ota, K.; Dong, M. Cooperative Positioning Optimization in Mobile Social Networks. In Proceedings of the 2016 IEEE 84th Vehicular Technology Conference (VTC-Fall), Montreal, QC, Canada, 18–21 September 2016; pp. 1–5. [Google Scholar] [CrossRef]
- Phithakkitnukoon, S.; Smoreda, Z.; Olivier, P. Socio-geography of human mobility: A study using longitudinal mobile phone data. PLoS ONE 2012, 7, e39253. [Google Scholar] [CrossRef] [PubMed] [Green Version]
- Hu, X.; Li, X.; Ngai, E.C.H.; Leung, V.C.; Kruchten, P. Multidimensional context-aware social network architecture for mobile crowdsensing. IEEE Commun. Mag. 2014, 52, 78–87. [Google Scholar] [CrossRef]
- Hu, X.; Leung, V.C. Towards Context-Aware Mobile Crowdsensing in Vehicular Social Networks. In Proceedings of the 2015 15th IEEE/ACM International Symposium on Cluster, Cloud and Grid Computing, Shenzhen, China, 4–7 May 2015; pp. 749–752. [Google Scholar] [CrossRef]
- Yang, B.; Guo, W.; Chen, B.; Yang, G.; Zhang, J. Estimating mobile traffic demand using Twitter. IEEE Wirel. Commun. Lett. 2016, 5, 380–383. [Google Scholar] [CrossRef]
- Klessig, H.; Kuntzschmann, H.; Scheuvens, L.; Almeroth, B.; Schulz, P.; Fettweis, G. Twitter as a Source for Spatial Traffic Information in Big Data-Enabled Self-Organizing Networks. In Proceedings of the 2017 IEEE Wireless Communications and Networking Conference (WCNC), San Francisco, CA, USA, 19–22 March 2017; pp. 1–5. [Google Scholar]
- Guo, W.; Zhang, J. Uncovering wireless blackspots using Twitter data. Electron. Lett. 2017, 53, 814–816. [Google Scholar] [CrossRef] [Green Version]
- Fortes, S.; Palacios, D.; Serrano, I.; Barco, R. Applying Social Event Data for the Management of Cellular Networks. IEEE Commun. Mag. 2018, 56, 36–43. [Google Scholar] [CrossRef]
- Trinh, H.D.; Giupponi, L.; Dini, P. Urban Anomaly Detection by processing Mobile Traffic Traces with LSTM Neural Networks. In Proceedings of the 2019 16th Annual IEEE International Conference on Sensing, Communication, and Networking (SECON), Boston, MA, USA, 10–13 June 2019; pp. 1–8. [Google Scholar] [CrossRef]
- Trinh, H.D.; Zeydan, E.; Giupponi, L.; Dini, P. Detecting Mobile Traffic Anomalies Through Physical Control Channel Fingerprinting: A Deep Semi-Supervised Approach. IEEE Access 2019, 7, 152187–152201. [Google Scholar] [CrossRef]
- Bejarano-Luque, J.L.; Toril, M.; Fernández-Navarro, M.; Gijón, C.; Luna-Ramírez, S. A Deep-Learning Model for Estimating the Impact of Social Events on Traffic Demand on a Cell Basis. IEEE Access 2021, 9, 71673–71686. [Google Scholar] [CrossRef]
- Bejarano-Luque, J.L.; Toril, M.; Fernández-Navarro, M.; Acedo-Hernández, R.; Luna-Ramírez, S. A Data-Driven Algorithm for Indoor/Outdoor Detection Based on Connection Traces in a LTE Network. IEEE Access 2019, 7, 65877–65888. [Google Scholar] [CrossRef]
- Zhong, X.; Kealy, A.; Duckham, M. Stream Kriging: Incremental and recursive ordinary Kriging over spatiotemporal data streams. Comput. Geosci. 2016, 90, 134–143. [Google Scholar] [CrossRef]
- Twitter API Documentation. 2006. Available online: https://dev.twitter.com/docs (accessed on 2 April 2019).
- Yamamoto, Y. Twitter4j Library. 2007. Available online: http://twitter4j.org/en/ (accessed on 2 April 2019).
- Flickr API Documentation. 2004. Available online: https://www.flickr.com/services/api/ (accessed on 2 April 2019).
Short Biography of Authors
 | Juan L. Bejarano-Luque received the B.S. degree in telecommunications engineering and the M.S. degree in acoustic engineering from the University of Málaga, Málaga, Spain, in 2015 and 2016, respectively. He is currently pursuing the Ph.D. degree in telecommunications engineering at the same university. His research interests include optimization of radio resource management for mobile networks, location-based services and management and data analytics. |
 | Matías Toril received his M.S. and Ph.D. degrees in Telecommunication Engineering from the University of Málaga, Spain, in 1995 and 2007, respectively. Since 1997, he is Lecturer in the Communications Engineering Department, University of Málaga, where he is currently Full Professor. He has co-authored more than 100 publications in leading conferences and journals and 3 patents owned by Nokia Corporation. His current research interests include self-organizing networks, radio resource management and data analytics. |
 | Mariano Fernández-Navarro received his M.S. in Telecommunication Engineering from the Polytechnic University of Madrid in 1988 and the Ph.D. degree from the University of Málaga, in 1999. He is on the staff of the Communications Engineering Department at the University of Málaga since 1992, after 3 years as design engineer at Fujitsu Spain S.A. His research interests include optimization of radio resource management for mobile networks and location-based services and management. |
 | Luis R. Jiménez received a M.Sc. degree in Electronics and Communications Engineering from Santo Domingo Institute of Technology (INTEC), Dominican Republic, in 2013 and a M.Sc. degree in Telematics and Telecommunication Networks from the University of Málaga (UMA), Spain, in 2015, where he is currently pursuing a Ph.D. degree. His current research interests include self-optimized networks, machine learning, and performance evaluation of multimedia services over mobile networks. Mr. Jiménez is the recipient of a Junta de Andalucía Scholarship (2017–2021) over methods planning and optimizing QoE in 4 G networks. |
 | Salvador Luna-Ramírez gained his M.S. in Telecommunication Engineering and Ph.D. degrees from the University of Málaga, Spain, in 2000 and 2010, respectively. He has been lecturer at the Communications Engineering Department of the same university since 2000, where he is currently Full Professor. His research interests are focused on the self-optimization of mobile radio access networks and management of radio resources, in addition to research and collaboration with companies in the field of acoustic engineering. |
Figure 1.
Flow diagram of the spatial distribution model.

Figure 2.
CDF of indoor connections probabilities, , in the scenario.

Figure 3.
CDF of geotagged posts in the scenario.

Figure 4.
Sections of in the scenario.

Figure 5.
Number of connections per tile by model.

Figure 6.
Results of MUE with the E-CID model in the sections presented in Figure 4.
Figure 6.
Results of MUE with the E-CID model in the sections presented in Figure 4.

Figure 7.
Results of MUE with the Context model in the sections presented in Figure 4.
Figure 7.
Results of MUE with the Context model in the sections presented in Figure 4.

Figure 8.
Results of MUE with the Social model in the sections presented in Figure 4.
Figure 8.
Results of MUE with the Social model in the sections presented in Figure 4.


Table 1.
Positioning techniques.
| Method | Advantage | Inconvenience |
|---|---|---|
| A-GPS | High accuracy in positioning. | Information usually not available for network operators. |
| Enhanced CID | Great simplicity, based on network measurements. | Low accuracy, decreasing with the distance to the node. |
| Lateration | Higher accuracy than E- CID. Based on network measurements. | Requires equipment features not typically available. Vulnerable to propagation conditions. |
| Fingerprinting | Localization with simpler measurements. | Great complexity when calibrating maps due to the issues in obtaining measurements. Vulnerable to propagation conditions variations. |
| Minimization Drive Test | Communicate GPS position to network operators. Enriched with network measurements to ease maps construction for fingerprinting techniques | High consumption of resources, such as terminals’ batteries. |
| Proposed model | Simplicity equivalent to enhanced CID method with much higher accuracy. Less complex map calibration comparing to fingerprinting, due to the access of external data. | Dependent on the availability of external data. |
Table 2.
Land use types in the scenario.
| Land Use | Description | Indoor/Outdoor | Share |
|---|---|---|---|
| Services | Areas for institutional, cultural, medical or academic use. | Indoors | 10% |
| Offices | Management, information or work offices. | Indoors | 3% |
| Mixed use | Areas with no defined primary land use. | Indoors | 11% |
| Residential | Homes, hotels and lodging. | Indoors | 15% |
| Entertainment | Retail and entertainment. | Indoors | 4% |
| Industrial | Industrial or manufacturing work areas. | Indoors | 3% |
| Open space | Fields, parks and green areas. | Outdoors | 22% |
| Roads | Roads, highways and footpaths. | Outdoors | 30% |
| Rivers/Lakes | Water areas on the ground. | Outdoors | 2% |
Table 3.
Statistics of the number of connections per tile with the compared models.
| Method | Minimum | 25th perc. | 50th perc. | 75th perc. | Maximum |
|---|---|---|---|---|---|
| E-CID model | 36.29 | ||||
| Context model | 45.99 | ||||
| Social model | 175.19 |
Publisher’s Note: MDPI stays neutral with regard to jurisdictional claims in published maps and institutional affiliations. |
© 2021 by the authors. Licensee MDPI, Basel, Switzerland. This article is an open access article distributed under the terms and conditions of the Creative Commons Attribution (CC BY) license (https://creativecommons.org/licenses/by/4.0/).
Share and Cite
MDPI and ACS Style
Bejarano-Luque, J.L.; Toril, M.; Fernández-Navarro, M.; Jiménez, L.R.; Luna-Ramírez, S. Statistical Model for Mobile User Positioning Based on Social Information. Electronics 2021, 10, 1782. https://doi.org/10.3390/electronics10151782
AMA Style
Bejarano-Luque JL, Toril M, Fernández-Navarro M, Jiménez LR, Luna-Ramírez S. Statistical Model for Mobile User Positioning Based on Social Information. Electronics. 2021; 10(15):1782. https://doi.org/10.3390/electronics10151782
Chicago/Turabian StyleBejarano-Luque, Juan Luis, Matías Toril, Mariano Fernández-Navarro, Luis Roberto Jiménez, and Salvador Luna-Ramírez. 2021. "Statistical Model for Mobile User Positioning Based on Social Information" Electronics 10, no. 15: 1782. https://doi.org/10.3390/electronics10151782
Note that from the first issue of 2016, this journal uses article numbers instead of page numbers. See further details here.