Testing Models and Measurement Invariance of the Learning Gains Scale


1
Department of Teacher Education and Curriculum Studies, Jimma University, Jimma 5110, Ethiopia
2
Faculty of Humanities and Social Sciences, School of Education, The University of Queensland, Brisbane 4072, Australia
3
Centre for Learning Futures, Griffith Institute for Educational Research, Griffith University, Brisbane 4122, Australia
*
Author to whom correspondence should be addressed.
Educ. Sci. 2018, 8(4), 192; https://doi.org/10.3390/educsci8040192
Submission received: 16 August 2018
/
Revised: 22 October 2018
/
Accepted: 23 October 2018
/
Published: 31 October 2018
Abstract
:This study tested the construct validity, factorial validity, and measurement invariance of the learning gains scale based on survey responses of a large sample (n = 536) of undergraduate students in two colleges at a university in Ethiopia. The analyses were performed through structural equation modeling technique using the stata 13 data analysis and statistical software package. The results demonstrate a 3-factor model representing the underlying construct satisfying the different model goodness-of-fit statistics and practical indexes. The observed factor loadings of variables within each factor and the correlations between the factors provide supporting evidence of construct validity. Measurement invariance tests were also confirmed acceptable levels of measurement equivalence between groups. Implications of the 3-factor model in higher education research are discussed.
1. Introduction
Extensive research in higher education consistently suggests that student engagement is strongly associated with desirable educational outcomes such as increased learning, persistence in college, and graduation [1,2]. A student’s knowledge, skills, and dispositions at the end of his or her undergraduate years undoubtedly have much to do with where he or she stands upon entering the world of work. Researchers argue that a university should be measured by how much students gain while enrolled, rather than what is measured on an absolute scale [3,4]. Some students grow more than others during their university years. At present perhaps the biggest challenge for several higher education institutions and quality assurance agencies is trying to develop and validate quality assessment instruments to determine a robust approach to measuring learning outcomes in ways that are valid across cultures and languages, and across the diversity of institutional settings.
Theories largely developed and largely supported by research conducted with students at institutions in a certain higher education context are likely to fit students at those institutions better than students at institutions in other higher education contexts [5]. Some levels of distinctiveness and modifications have been suggested by validation studies of student engagement surveys when used for two years and four year college students [6]. There is also evidence that suggests structural modification for the student engagement scale when used in a single institution study as opposed to large scale study [7,8,9]. Regardless of this, however, in higher education research, development and validation of student engagement and self-reported gains scales and cross-cultural comparisons have been rarely studied [10]. The lack of evidence supporting the cultural validity of constructs such as self-reported gain has implications for the wider utilization of those educational constructs across different higher education systems allowing customization to fit with different circumstances.
The development and validation of a self-reported Learning Gains Scale that is suitable for a particular higher education setting is valuable in examining the cultural relevance of an established construct while at the same time, creating local conditions and imprints to maximize the benefits [11]. A deeper analysis of the psychometric properties of a measuring instrument can be investigated through analysis of measurement invariance across groups at several levels. While this is most wanted and needed, the actual practice needs careful, step-by-step analysis [12].
Simply stated, Student Learning Gains is a concept that measures how improvements in knowledge, skills and personal development made by students during their time in higher education [13]. A Student Learning Gains Scale, which is part of the Australasian Survey of Student Engagement (AUSSE) is a widely used outcome survey to measure student learning and development in a range of dimensions [14]. This scale is about attitudes, values, and self-concept and is ‘more properly used and interpreted as evidence of students’ perceived learning and affective outcomes’ [15]. However, in effect, this scale is not a direct measure of students’ learning and development as in standardized tests; the self-reported gains questions have sufficient content validity or communality with the direct measures of cognitive tests [16].
The Student Learning Gains Scale has been predominantly found within the student engagement survey. Also, there are corresponding outcome scales such as the graduate and alumni survey tools as well as employability and satisfaction survey scales that involve similar features with the Student Learning Gains Scale [17]. Despite variations in foci, these different scales have things in common, that is, the responses are self-generated, personal in nature, and used to define affective learning outcomes [18].
The student engagement survey instrument has been used in Australian universities since 2007 [19]. This survey, like other student engagement surveys, utilizes an analytic rating system to gauge the nature and quality of education through five different benchmarks along with an overall quality of institution and satisfaction with the service rendered [14]. The AUSSE is often used to collect information on around 100 specific learning activities and conditions along with information on individual demographics and educational contexts. Part of this instrument contains items that map onto seven outcome measures. While cumulative grade point average (CGPA) is captured in a single item the other six are composite measures which reflect responses to several items including:
- Practical skills—participation in higher-order forms of thinking;
- General Learning Outcomes—development of general competencies;
- General Development Outcomes—general forms of individual and social development;
- Career Readiness—preparation for participation in the professional workforce;
- Average Overall Grade—average overall grade so far in courses;
- Departure Intention—non-graduating students’ intentions on not returning to study in the following year; and
- Overall Satisfaction—students’ overall satisfaction with their educational experience.
Historically, the Student Learning Gains Scale was represented by a 3-factor solution. This scale first originated in North America and has been widely used in the student engagement survey. The validity of this scale has been repeatedly tested in different countries [11,14,18,20].
The three latent factors used in the current study, were similar to the original version of the AUSSE, and included: general education; personal and social development; and practical skills. There were 15–16 measurement variables used as indicators of Student Learning Gains Scale in the AUSSE instrument, and another additional four outcome measures as stated in the above bullet points. However, the current study considered 13 indicators of the Student Learning Gains Scale measure. This study deliberately omitted the two outcome measures: career readiness and departure intentions from the outcome measures due to contextual differences in terms of the relevance of these issues. For example, academic failure is more pronounced in the Ethiopian higher education context rather than departure intention issues. Moreover, career intentions are more broad institutional issues that may preclude focusing on specific academic issues that need a more specific focus and intervention strategies.
The main purpose of the study was to develop and validate a 3-factor model of Student Learning Gains Scale as applied in the Ethiopia higher education context. The other important purpose was to help readers who may be new to the applications of structural equation modeling technique, to provide an example of how these procedures may be applied in testing for the psychometric properties of a measuring instrument. The study emphasized how this scale was contextualized and used in the Ethiopian higher education setting. In this study, confirmatory factor analysis using structural equation modeling was applied to test construct validity and factorial validity of a Student Learning Gains Scale, along with, analysis of measurement invariance across colleges and grade years. More specifically, the study answered the following major research questions.
- Does the variable in the Student Learning Gains Scale of the data collected from a university in Ethiopia represent construct validity (substantive or content validity)?
- Does a 3-factor Student Learning Gains Scale model fit to the data that were collected? If not, what factor structure can be suggested as fitting well with the data?
- Does the Student Learning Gains Scale factor predict important student behaviors and outcomes?
- Does the Student Learning Gains Scale, as applied in an Ethiopian higher education context, demonstrate measurement invariance across college type and class year?
2. Materials and Methods
2.1. Study Design
This study used a cross-sectional survey design comprising of a self-reported gains scale to collect data from large samples (n = 536) of undergraduate students at a university in Ethiopia.
2.2. Study Participants
Participants were volunteers recruited from the student population in the College of Natural Sciences and College of Social Sciences and Law at a large public university in Ethiopia. Both background characteristics and university experiences were considered in the selection of study participants. The survey was conducted in English to all study participants. Table 1 presents a summary of the participant characteristics as a percentage of the sample across colleges.
Five hundred and thirty-six (107 females & 429 males) undergraduate students participated in the study, of whom, 206 were in the college of Natural Sciences and 330 were in the College of Social Sciences and Law. The sample participants’ gender composition reflects that the proportion of males is far greater, accounting for over 80% of the samples across colleges. The mean ages of student samples in the two colleges were similar, but there was a significant mean difference in students’ CGPA indicating variation between the two colleges.
2.3. Measures
The Student Learning Gains Scale with college academic experience was assessed using sub-scales through which participants were asked to think about their experience during the undergraduate years while reading each statement and indicate how true each statement was for them in terms of what they have gained. Student Learning Gains Scale items began with, ‘To what extent has your experience at this college contributed to your knowledge, skills and attitudinal development in the following areas?’ and were scaled 1 (very little) to 4 (very much). A self-reported gain was measured using individual student scores on composite measures of the Student Learning Gains Scale: general education, personal development, and practical thinking skills outcomes. The general education measure includes an individual student score on composite measures of the three general education items. The personal and social development measure includes an individual student score on the composite measure of six items in the areas of professional and social skills and behaviours. Similarly, the practical skills measure includes an individual score on the composite measure of four items in higher-ordered thinking skills and behaviours including familiarity and use of ICT in education.
2.4. Data Analysis
Both qualitative and quantitative procedures were used to validate the scale before utilizing it in Ethiopia, however only the quantitative data has been used for this paper. The qualitative analyses were used to refine item wording, maintain standards, and assess the appropriateness of the scale. The quantitative analyses helped for testing internal consistency of the scale and ensure that the scale measured the intended target constructs with acceptable levels of bias and precision. Validations were conducted based on the multidimensional validation work built on the approach suggested by Griffin, Coates, McInnis and James (2003) and Coates (2006) including ‘experts’ review (both in Australia & Ethiopia), pilot testing and review, and reliability analyses,’ and Confirmatory Factor Analysis (CFA) and extended the validation works including measurement invariance and regression analysis [21,22]. With these later analyses of invariance and regression, additional supporting evidence of the criterion validity and discriminant validity were obtained. With the initial experts’ review, pilot testing, and reliability analysis (n = 74 students) this study was able to modify the wordings of a few items and drop some variables found below the acceptable threshold of 0.70 (Nunnally, 1978).
The central concern of measurement invariance is the testing of measurement equivalence across groups [23]. This test can be conducted at different levels and most common among them are first-order models and second-order models [24]. There are suggested procedures for the testing of measurement invariance across a hierarchical series of models, and their common purpose is maximizing interpretability of the results sought at each step of the hierarchy [25,26]. This study explored first-order models and second-order models just to provide adequate evidence to the invariance tests conducted in this study, however, it should be noted that the hierarchies have more advanced models [27].
2.5. Missing Values and Internal Consistency
Missing values were managed by excluding students’ responses from the analysis. Originally, a total of 596 responses was collected. However, 60 (10%) of the respondents were removed from the analysis due to excessive information loss or incompleteness of information and a few outliers in age category. Thus the final students involved in the analysis consisted of 536 students’ responses. Regardless of this, there were few random missing values across the scales. Evaluation of Cronbach’s alpha values showed that there was generally strong consistency with the underlying construct being measured within a factor, with moderately high alpha values greater or equal to 0.70. The reliability coefficient of the self-reported gains (α = 0.89) was high for sample-based research.
3. Results
3.1. Factor Structure and Reliability Analyses
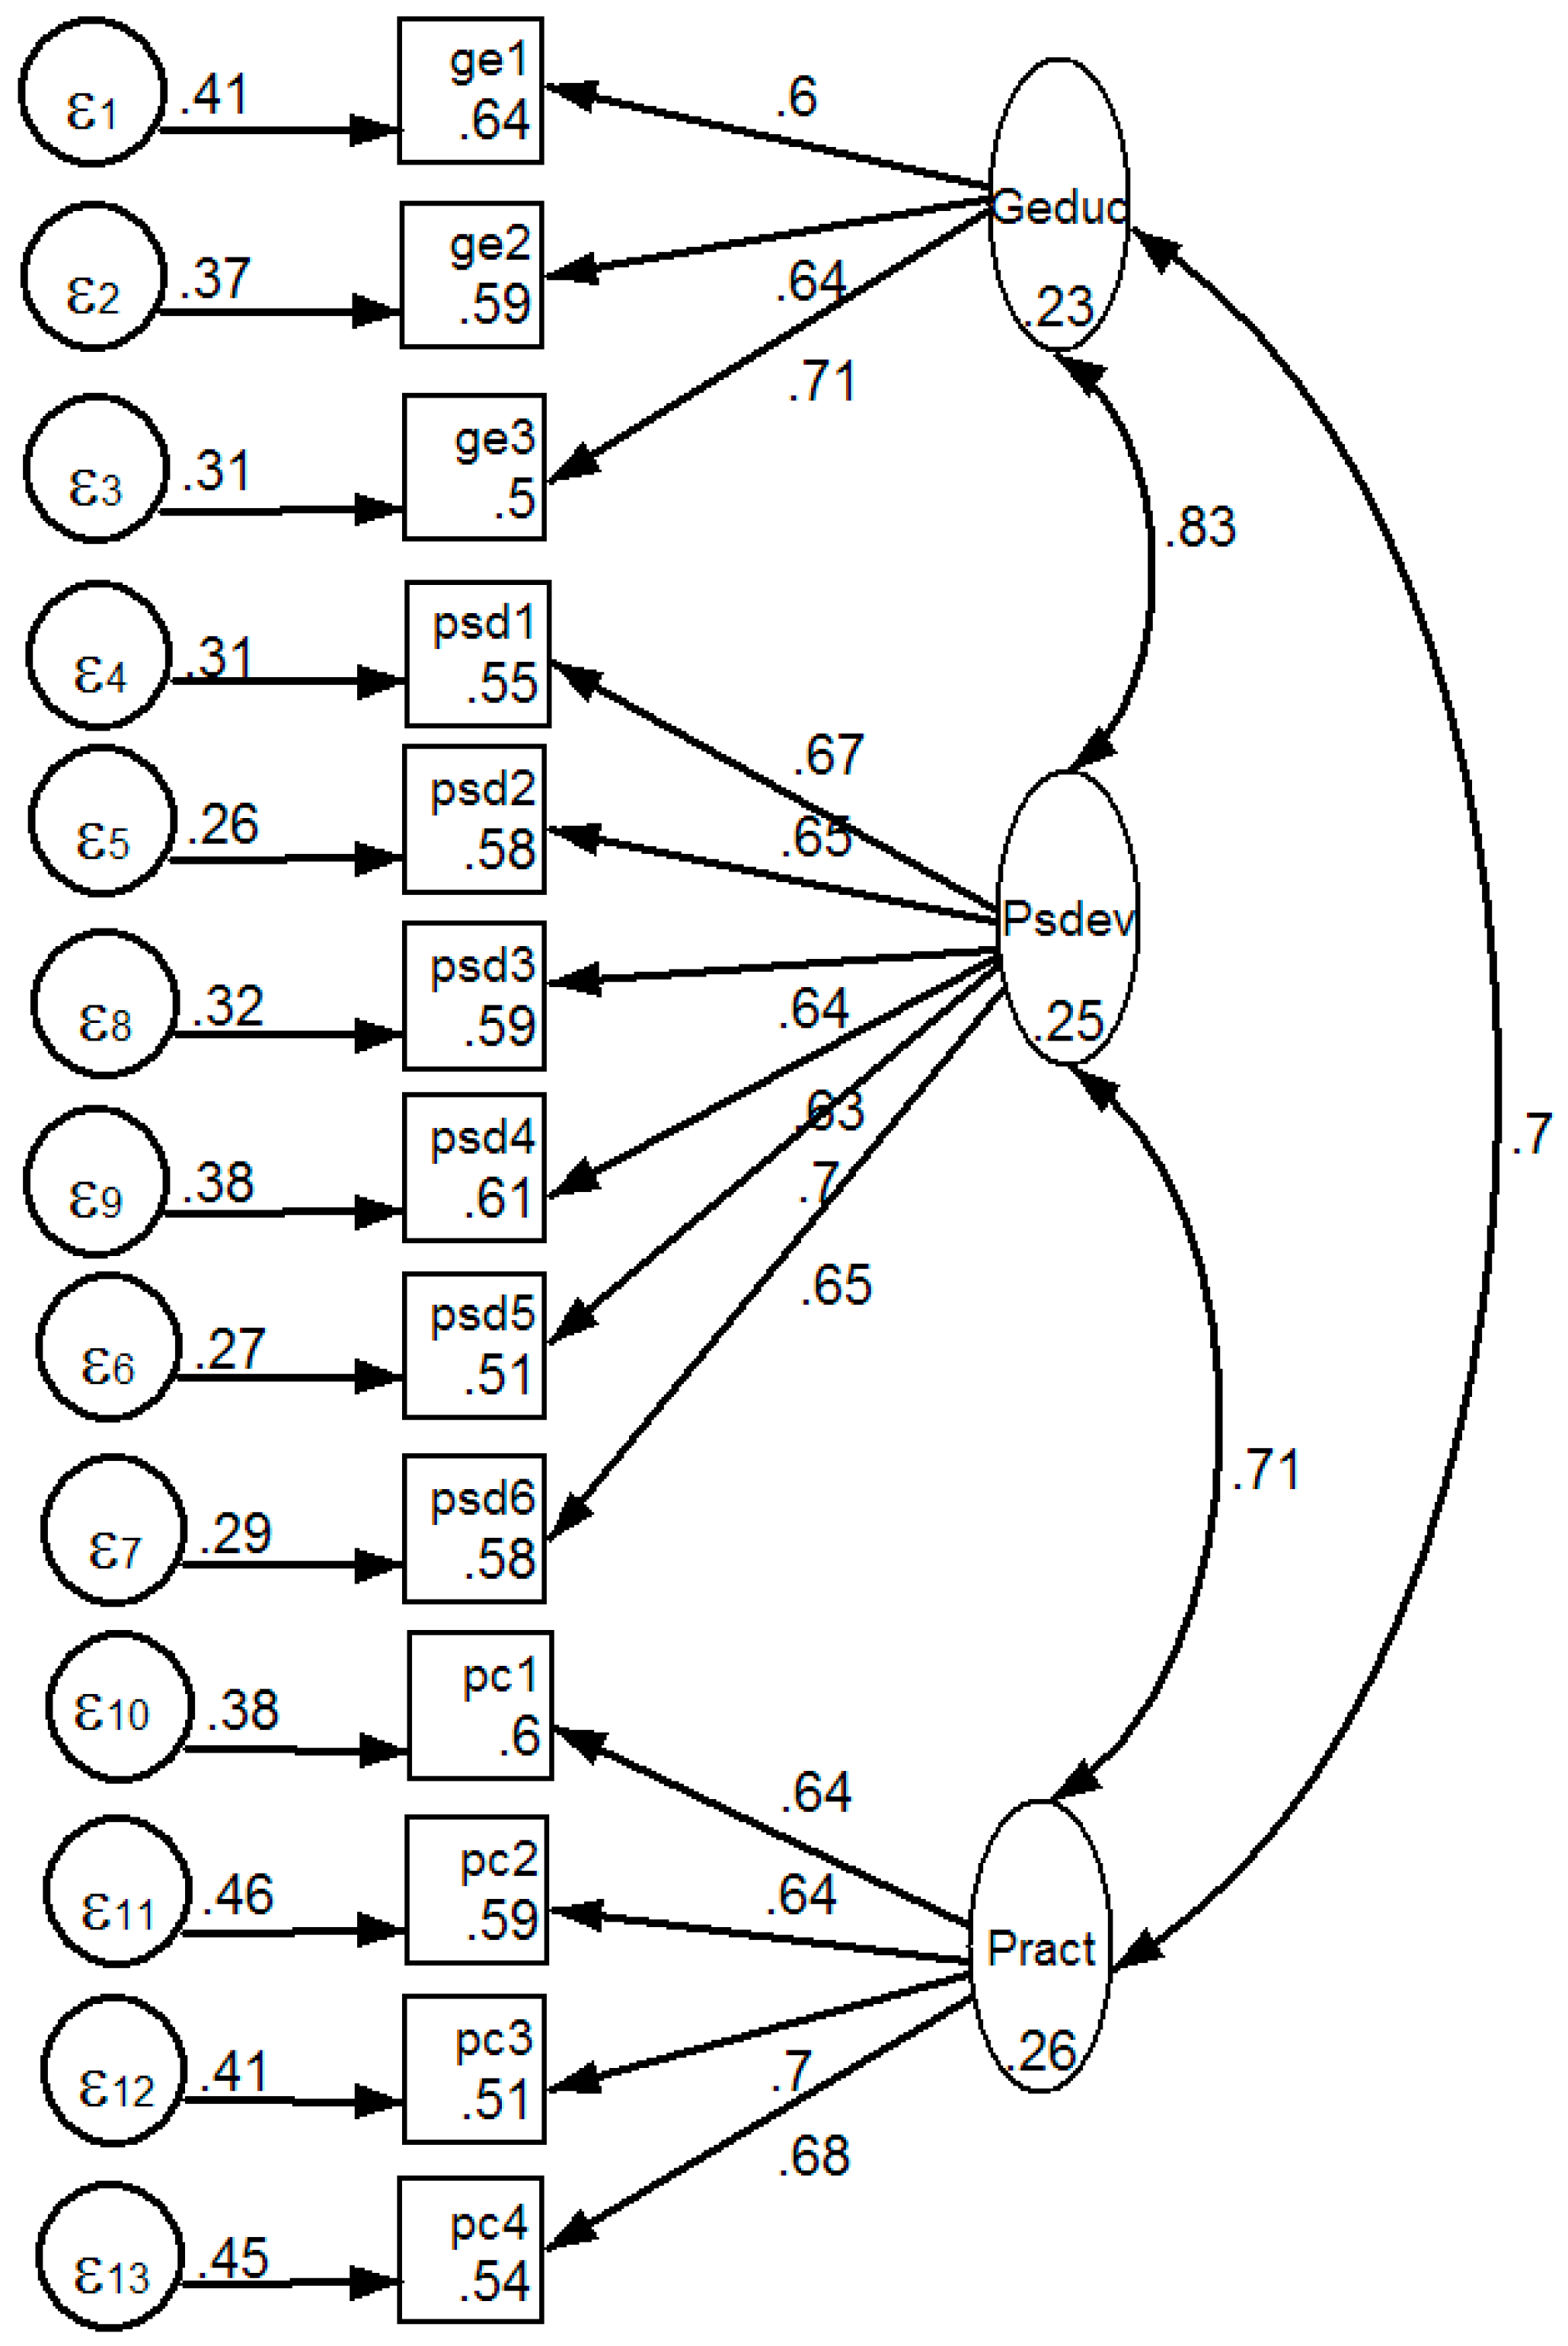
The CFA was used to specify the self-reported gain scale with three latent variables. All the CFA models were constructed using the stata 13 data analysis and statistical software application [28]. Maximum likelihood estimation with missing values was used for all analyses. For factor extraction, Kaiser criterion suggests that factors with eigenvalues equal or higher than 1 should be retained, however, for a factor to be retained in the model, it needs at least three items (measurement variables), regardless of its eigenvalue [29]. Thus, these fundamental rules apply in factor extraction. The scale was analyzed and three latent factors satisfied these rules (see Figure 1). These latent variables have thirteen measurement variables or observed variables used as indicators that directly affect the latent variables [30]. The connectors drawn from the latent variable to the observed variable with a single arrow head represents the path coefficient (factor loading). The connector drawn from one latent variable to another latent variable is represented by double arrow heads and it describes the covariance between the latent factors. The variances appear inside or beside the box or circle. The factor loadings appear next to the path connectors. The path diagram of the self-reported gain scale is presented in Figure 1.
As shown in Figure 1, the pictorial representation describes the error variance, the mean (actually, intercept) of the variables, and the factor loading of each measurement variable. For example, the measure variable General Education1 ‘ge1’ has an error variance of (0.41), a unique variance of (0.54), and a factor loading of (0.6). The factor loading 0.6, on top of the line connector between measurement variable (ge1) and the latent factor (Geduc) highlights the correlation coefficient. Such factor loadings are the basis for imputing a label to different latent factors, and are representing the percentage of variance in the variable, explained by a factor.
Each indicator variable in the 3-factor model had a factor loading well above the recommended level 0.40 [31]. One variable in each sub-component (ge3, psd5, pc3) had a factor loading of 0.70, which shows high factor loading and a couple of others also manifest close to this threshold (psd1 & pc4), meaning that about half of the variance (49%) for these variables was explained by the construct they are supposed to measure. What defined this scale the most was personal and social development, because all the variables representing this sub-scale had factor loadings between 0.63–0.70. The correlation between the factors is represented by a double head arrow, and the coefficients as shown in Figure 1, include values 0.70, 0.71, and 0.83. These coefficients provide evidence for discriminant validity as the different factors used in this scale are not excessively correlated with each other (e.g., >0.85) [32].
The factor structure matrix represents the correlations between the variables and the latent factors and is often called the factor loading matrix. By seeing the correlation matrix, it is possible to explore the common variance existed between the measures variables describing the construct validity of the items used in the scale. Table 2 presents the factor loadings (pattern matrix) for the student engagement construct and to make the values more clear other values kept to be zero.
Looking at the matrix from the data set presented in Table 2, it is clear that there is no single item that can be excluded because of low factor loadings as the factor loading for the different items is above the threshold level of 0.40 (Stevens, 2002). The factor loadings of the items range between 0.60–0.71.
For all the indicator variables, the variance was explained by the corresponding factors they were supposed to index. It is important to note that the reliability of the scale is very high (r = 0.89). Of the three sub-components under examination, personal and social development appeared to be the construct best measured. If treated as a scale, the reliability of this sub-component was relatively higher (r = 0.83). Each measured variable had loading with scores ranging from 0.63 to 0.70.
To evaluate the predictive validity of the Student Learning Gains Scale scores we examined correlations with scores derived from measures of hypothesized constructs of interest (i.e., learning self-efficacy, time and study management, overall satisfaction with university experience, and student future intention scores; see Table 3).
As hypothesized, moderate to high positive correlations were found between Student Learning Gains Scale scores and the validity variables (r = 0.41 to 0.52). Moderate to high positive relations were also found between the Student Learning Gains Scale factor scores and overall satisfaction and future intention (r = 0.31 to 0.53).
3.2. Evaluating Model Goodness-of-Fit
This study uses multiple goodness-of-fit (GFIs) statistical tests to evaluate and report overall model fit, including χ2 test of statistical significance [33] and other practical model goodness-of-fit indices. In this study, the chi-square test was used; however this test usually rejects models based on large samples. To redress this limitation, we used the χ2 to degrees of freedom ratio. In general, χ2/df ratios up to 5 have been used as general rules of thumb to establish reasonable fit [34]. The practical indices include: the comparative fit index (CFI), Tucker–Lewis Index (TLI), Normed Fit Index (NNFI), root mean squared error of approximation (RMSEA), and root mean square residual (RMSR). For the model fit indexes, the following criteria were used: a Comparative Fit Index (CFI) of ≥0.95, a Non-Normed Fit Index (NFI) or Tucker–Lewis Index (TLI) of ≥0.9, a root mean square error of approximation (RMSEA) of ≤0.6—with values as high as 0.8 indicating a reasonable fit, a standardized root mean square residual (SRMR) of <0.90, and the results of χ2/df being <3. Different tests were applied to assess the goodness-of-fit of the three factor model of the self-reported gain scale. The summary results of the different tests are presented in the Table 4.
As shown in Table 4, the χ2 test results are statistically significant only for the three-factor model, which has a χ2 to degree of freedom value of 2.766. Similarly, in terms of the Standardized root mean squared residual (SRMR), the score values of the three models are all within the acceptable threshold values. However, in terms of baseline comparative goodness-of-fit tests, the two indices (CFI & TLI) are within the range of acceptable standard scores only to the three factor model. The score values of the three factor model for the CFI and TLI are 0.92 and 0.91, respectively, and these values are within the standard threshold score values for these goodness-of-fit-tests. Similarly, the score values for the root mean squared error of approximation indicate the goodness-of-fit of the three-factor model than the other two comparison models. The factor structure was confirmed as having good model fit; the model RMSEA in the data set was 0.056 and the SRMR was 0.038.
The other fundamental differences between the three factor model and the other two comparison models are the baseline comparison indices (CFI & TLI) and Coefficient of Determination, in which case goodness-of-fit statistic results best describe the adequacy of the three factor model. Moreover, the three factor model is reasonable enough as described in the self-reported gains literature [14,15,35]. Thus, the three factor model is overall a better model describing goodness-of-fit statistic and practical indexes as well as standards of theoretical explanations in the literature in this field. This suggests that the three factor model structure is better in representing factorial validity of the self-reported scale as used in the student self-reported gain data set in higher education in Ethiopia.
As can be seen from Table 5, the mean score values of the different groups ranged from 2.72 to 3.37. Also, the reliability analyses across groups indicate comparable scores for most of the measured subscales except for one group score, which is pretty close to the minimum threshold, i.e., α = 0.70 [36]. These results indicated equivalent score reliability across colleges and class years.
3.3. Measurement Invariance
Establishing measurement invariance involves conducting a set of structural equation models, and testing whether differences between these models are significant [12]. In the current study, two multiple-group analyses were undertaken to examine measurement invariance across subgroups within the sample. A broad classification scheme for types of measurement invariance proposed by Little (1997) distinguishes between measurement invariance as the psychometric properties of scales and measurement invariance as between-group differences in latent means, variances, and covariance [24]. The purpose of the present study is to demonstrate psychometric measurement invariance. Thus, the study mainly focused on the testing of measurement invariance on the first-order models and second-order models, which consisted of the testing of parametric equivalence between groups in terms of four major elements: configural invariance, factor loading invariance, intercepts invariance, and residual invariance [37]. Models were compared using Cheung and Rensvold’s (2002) recommended metric invariance tests of between group differences [38].
In measuring invariance models in this study, factor loadings were constrained to be equal across all groups and structural parameters were freely estimated across groups [39]. A MGCFA was used to test the group invariance of the model. The invariance test was conducted at two stages. First, separate models were tested for each category in each group. This test helped to calculate the configural invariance across each category and then measurement invariance were calculated based on the group level data. Table 6 presents the summary results of the invariance tests across college and class year.
When tested in separate models, the hypothesized structure demonstrated reasonable fit in both groups (see Table 6). The second model constraining aspects to be equal across groups (Models 2) did significantly yielded a similar goodness of fit statistics and practical indices. Thus, the structure (Model 1) and factor loadings (Model 2) were found to be invariant across colleges and class years. These different invariant tests suggest that both groups associated the same subsets of items with the same constructs. It also confirms that the mean level of the latent construct is the same across groups, as well as the strength of the relationship between each item and its underlying construct.
4. Discussion
The findings of this study suggest that the self-reported gains scale is comprised of three interdependent factors: a general education factor, a personal and social development factor, and a higher-order thinking factor. These factors demonstrated reasonable construct validity as measured in terms of convergent validity and discriminant validity. The convergent correlation of all the items used in the scale (alpha = 0.89) is higher than the correlation between the factors (alpha 0.70–0.82) discriminant ones. When there is a relatively high correlation between the items used to measure a scale compared with the correlation between factors, there is evidence of both convergent validity and discriminant validity [40]. Moreover, the extent of correlations between the factors also provides supporting evidence for the discriminant validity of the scale as there is evidence that the different factors in the scale are not excessively correlated with each other (e.g., >0.85) [32].
In this study, there were moderate to high positive correlation between the validity variables and Student Learning Gains Scale, 0.31 < r > 0.53, p < 0.001. In terms of strength, there were high correlation between the Student Learning Gains Scale factors and student self-efficacy and overall satisfaction [41]. Relatively speaking, the three gains factors moderately correlate with the student future intention than others, r = 0.31 and 0.32.
The factorial validity, measurement invariance and criterion validity were tested using statistical tests and practical indices testifying evidence for the adequacy of the construct to measure Student Learning Gains Scale across samples of participants. Thus, there is supporting empirical evidence of the scale’s reasonable psychometric properties to be used in the Ethiopian higher education context as the primary means to share results and compare institutions. This is consistent with research conducted in different parts of the world providing supporting evidence to the usefulness and practicability of the gains scale [14,18,42].
Empirical evidence shows that students are credible sources of information on matters related to what they have experienced in universities and how much they have benefited from their learning experiences [43]. Students may be the best qualified to describe what they have gained from their experience in a university, particularly in some areas such as affective outcomes and practical skills [44]. However, for better results, items should be clearly worded and students have the information required to accurately answer the questions within the prevailing conditions [10]. Research shows that students respond more carefully and with much personal interest to the content of such questionnaires [43]. The present research provides initial evidence about the practicability of the self-reported gain scale for an institution study in the Ethiopian higher education context as the findings demonstrated sufficient psychometric properties. For example, the construct validity and factorial validity of the items used in this self-reported gains scale was adequate.
The current study relied exclusively on self-report measures of the Student Learning Gains for its data is a limitation of the study. Also, the inclusion of only students of two colleges in the sample of the current study limits the generalizability of the findings. These limitations must be considered in understanding the conclusions presented in this study.
5. Conclusions
The self-reported gain scale adapted from Australasian Survey of Student Engagement (AUSSE) demonstrated sufficient psychometric properties in a sample of 536 students of two colleges in a university in Ethiopia. The survey found to have adequate internal consistency (α = 0.89); and moderate to high correlations between the subscales (0.70–0.82). The CFA indicates moderately high scores of factor loadings for the measure variables and relatively smaller correlation coefficients across the latent factors proving the convergent validity and discriminant validity of the scale, respectively. Single group confirmatory factor analysis indicated support for a three factor solution as confirmed by various models of statistical fitness tests and practical indexes. The findings of the study demonstrated evidence of validity of the instrument to be used in the Ethiopian higher education context. As measured by the construct validity, discriminant validity, and factorial validity tests, the instrument has consistently shown strong validity. Goodness-of-fit tests for the single-group data have shown that the three factor structure is a valid measure of Student Learning Gains Scale.
A further analysis of the ‘multi-group Confirmatory Factor Analysis’ was performed for testing measurement invariance specifying a 3-factor model across two groups. Factorial invariance across student groups was demonstrated based on statistical group-level goodness-of-fit tests and practical fit indexes [45]. The findings support an equivalent 3-factor structure of the self-reported gains scale across the two colleges and grade years studied. Based on these data, it can be concluded that students across colleges and year groups interpreted items on the self-reported gain scale in a similar manner.
6. Implications to Research in the Quality of Higher Education
Seen from the perspective of quality assurance, one potential source of influence to promote quality improvement is the development and use of a psychometrically tested research-based quality instrument [2]. However, so far, in the literature in the higher education quality assurance domain, there is no single study conducted to measure the psychometric properties of quality measuring instruments. In higher education studies that explore the quality assurance practice of HEIs, the depth of analysis did not include issues of quality measuring instruments and their relevance in higher education.
This study investigated the reliability and validity of a self-reported gain instrument to assess its dimensions and usefulness to be used as learning outcome measure in the Ethiopian higher education context. This is apt for the higher education quality research as these measurement properties have been providing legitimacy of a more contextualized learning outcome measure. This is also instructive to intervention studies in the higher education as this is a more practical and relevant instrument for use in the higher education context. This is also a more suitable approach to the higher education quality study in Africa as minimal studies so far has been able to address issues of quality measuring instruments.
Authors Contributions
Investigation, T.T. and R.M.G.; Methodology, T.T. and R.M.G.; Project administration, C.C.; Supervision, R.M.G.; Writing—original draft, T.T. and C.C.; Writing—review & editing, T.T. and C.C.
Funding
This research was fully funded by [the University of Queensland, Australia] grant number [Ph.D. research].
Acknowledgments
We generated the primary data for this article from part of the Ph.D. research project of the corresponding author. We are grateful to UQ’s institutional support. Moreover, we are indebted to the study’s participants who took their time and energy to provide interviews and participate in focus group discussion.
Conflicts of Interest
The authors declare no conflicts of interest.
References
- Tadesse, T.; Gillies, R.M.; Campbell, C. Assessing the dimensionality and educational impacts of integrated ICT literacy in the higher education context. Aust. J. Educ. Technol. 2018, 34, 88–101. [Google Scholar] [CrossRef]
- Tadesse, T.; Manathunga, C.E.; Gillies, R.M. Making sense of quality teaching and learning in higher education in Ethiopia: Unfolding existing realities for future promises. J. Univ. Teach. Learn. Pract. 2018, 15, 4. [Google Scholar]
- Gordon, J.; Ludlum, J.; Hoey, J.J. Validating nsse against student outcomes: Are they related? Res. High. Educ. 2008, 49, 19–39. [Google Scholar] [CrossRef]
- Randles, R.; Cotgrave, A. Measuring student learning gain: A review of transatlantic measurements of assessments in higher education. Innov. Pract. 2017, 11, 50–59. [Google Scholar]
- Hagel, P.; Carr, R.; Devlin, M. Conceptualising and measuring student engagement through the australasian survey of student engagement (ausse): A critique. Assess. Eval. High. Educ. 2012, 37, 475–486. [Google Scholar] [CrossRef]
- Amaury, N.; Gloria, C.; Cissy, M. A reconceptualization of ccsse’s benchmarks of student engagement. Rev. High. Educ. 2011, 35, 105–130. [Google Scholar]
- Tendhar, C.; Culver, S.M.; Burge, P.L. Validating the national survey of student engagement (nsse) at a research-intensive university. J. Educ. Train. Stud. 2013, 1, 182–193. [Google Scholar] [CrossRef]
- Tadesse, T.; Manathunga, C.E.; Gillies, R.M. The development and validation of the student engagement scale in an Ethiopian university context. High. Educ. Res. Dev. 2018, 37, 188–205. [Google Scholar] [CrossRef]
- Tadesse, T.; Gillies, R.M. Testing robustness, model fit, and measurement invariance of the student engagement scale in an African university context. Aust. J. Career Dev. 2017, 26, 92–102. [Google Scholar] [CrossRef]
- Hernandez, E.; Mobley, M.; Coryell, G.; Yu, E.; Martinez, G. Examining the cultural validity of a college student engagement survey for latinos. J. Hisp. High. Educ. 2013, 12, 153–173. [Google Scholar] [CrossRef]
- LaNasa, S.M.; Cabrera, A.F.; Trangsrud, H. The construct validity of student engagement: A confirmatory factor analysis approach. Res. High. Educ. 2009, 50, 315–332. [Google Scholar] [CrossRef]
- Byrne, B. Testing for multigroup equivalence of a measuring instrument: A walk through the process. Psicothema 2008, 20, 872. [Google Scholar] [PubMed]
- McGrath, C.H.; Guerin, B.; Harte, E.; Frearson, M.; Manville, C. Learning Gain in Higher Education. Available online: https://www.rand.org/pubs/research_reports/RR996.html (accessed on 23 October 2018).
- Coates, H. Development of the Australasian survey of student engagement (ausse). High. Educ. 2010, 60, 1–17. [Google Scholar] [CrossRef]
- Gonyea, R.; Miller, A. Clearing the air about the use of self-reported gains in institutional research. New Dir. Inst. Res. 2011, 2011, 99–111. [Google Scholar] [CrossRef]
- Fukami, C.V.; Armstrong, S.J. Self-assessment of knowledge: A cognitive learning or affective measure? Perspectives from the management learning and education community. Acad. Manag. Learn. Educ. 2010, 9, 335–341. [Google Scholar]
- Yorke, M. Employability in the undergraduate curriculum: Some student perspectives. Eur. J. Educ. 2004, 39, 409–427. [Google Scholar] [CrossRef]
- Joseph, P.M. Validity of the student interest and engagement scales: Associations with student learning outcomes. Commun. Stud. 2013, 64, 125. [Google Scholar]
- Coates, H. Australasian Survey of Student Engagement: Institution Report. Available online: https://research.acer.edu.au/cgi/viewcontent.cgi?article=1016&context=ausse (accessed on 23 October 2018).
- Ahlfeldt, S.; Mehta, S.; Sellnow, T. Measurement and analysis of student engagement in university classes where varying levels of pbl methods of instruction are in use. High. Educ. Res. Dev. 2005, 24, 5–20. [Google Scholar] [CrossRef]
- Coates, H. Student Engagement in Campus-Based qnd Online Education: University Connections; Routledge: New York, NY, USA, 2006. [Google Scholar]
- Griffin, P.; Coates, H.; McInnis, C.; James, R. The development of an extended course experience questionnaire. Qual. High. Educ. 2003, 9, 259–266. [Google Scholar] [CrossRef]
- Byrne, B.; Shavelson, R.; Muthén, B. Testing for the equivalence of factor covariance and mean structures: The issue of partial measurement invariance. Psychol. Bull. 1989, 105, 456–466. [Google Scholar] [CrossRef]
- Little, T.D. Mean and covariance structures (macs) analyses of cross-cultural data: Practical and theoretical issues. Multivar. Behav. Res. 1997, 32, 53–76. [Google Scholar] [CrossRef] [PubMed]
- Meredith, W. Measurement invariance, factor analysis and factorial invariance. Psychometrika 1993, 58, 525–543. [Google Scholar] [CrossRef]
- Widaman, K.F. Common Factor Analysis Versus Principal Components Analysis: Differential Bias in Representing Model Parameters? Available online: https://www.ncbi.nlm.nih.gov/pubmed/26776890 (accessed on 23 October 2018).
- Schreiber, J.B.; Nora, A.; Stage, F.K.; Barlow, E.A.; King, J. Reporting structural equation modeling and confirmatory factor analysis results: A review. J. Educ. Res. 2006, 99, 323–337. [Google Scholar] [CrossRef]
- Cleves, M.A. An Introduction to Survival Analysis Using Stata; Stata Press: College Station, TX, USA, 2008. [Google Scholar]
- Joreskog, K.; Sorbom, D. Lisrel 8: User’s Reference Guide; Scientific Software: Chicago, IL, USA, 1993. [Google Scholar]
- Bollen, K.A. Latent variables in psychology and the social sciences. Annu. Rev. Psychol. 2002, 53, 605–634. [Google Scholar] [CrossRef] [PubMed]
- Stevens, J. Applied Multivariate Statistics for the Social Sciences; Lawrence Erlbaum Associates: Mahwah, NJ, USA, 2002. [Google Scholar]
- Kline, R. Principles and Practice of Structural Equation Modeling; Guilford Press: New York, NY, USA, 1998. [Google Scholar]
- Cochran, W.G. The χ2 test of goodness of fit. Ann. Math. Stat. 1952, 23, 315–345. [Google Scholar] [CrossRef]
- Marsh, H.W.; Hocevar, D. Application of confirmatory factor analysis to the study of self-concept: First-and higher order factor models and their invariance across groups. Psychol. Bull. 1985, 97, 562–582. [Google Scholar] [CrossRef]
- Kuh, G.; Kinzie, J.; Buckley, J.; Hayek, J. What Matters to Student Success: A Review of the Literature. Available online: https://nces.ed.gov/npec/pdf/kuh_team_report.pdf (accessed on 23 October 2018).
- Nunally, J.; Bernstein, I. Psychometric Theory, 3rd ed.; McGraw Hill: New York, NY, USA, 1994. [Google Scholar]
- Chen, F.F.; Sousa, K.H.; West, S.G. Teacher’s corner: Testing measurement invariance of second-order factor models. Struct. Equ. Model. 2005, 12, 471–492. [Google Scholar] [CrossRef]
- Cheung, G.W.; Rensvold, R.B. Evaluating goodness-of-fit indexes for testing measurement invariance. Struct. Equ. Model. 2002, 9, 233–255. [Google Scholar] [CrossRef]
- van de Schoot, R.; Lugtig, P.; Hox, J. A checklist for testing measurement invariance. Eur. J. Dev. Psychol. 2012, 9, 486–492. [Google Scholar] [CrossRef]
- Donnelly, J.P.; Trochim, W.M.K. Research Methods Knowledge Base. Available online: https://trove.nla.gov.au/work/17158592 (accessed on 29 October 2018).
- Cohen, L. Statistical Power Analysis for the Behavioral Sciences, 2nd ed.; Lawrence Erlbaum: Mahwah, NJ, USA, 1988. [Google Scholar]
- Carle, A.C.; Jaffee, D.; Vaughan, N.W.; Eder, D. Psychometric properties of three new national survey of student engagement based engagement scales: An item response theory analysis. Res. High. Educ. 2009, 50, 775–794. [Google Scholar] [CrossRef]
- Kuh, G. The national survey of student engagement: Conceptual and empirical foundations. New Dir. Inst. Res. 2009, 2009, 5–20. [Google Scholar] [CrossRef]
- Fredricks, J.A.; McColskey, W. The Measurement of Student Engagement: A Comparative Analysis of Various Methods and Student Self-Report Instruments; Springer: Boston, MA, USA, 2012; pp. 763–782. [Google Scholar]
- Hu, L.-T.; Bentler, P.M. Cutoff criteria for fit indexes in covariance structure analysis: Conventional criteria versus new alternatives. Struct. Equ. Model. Multidiscip. J. 1999, 6, 1–55. [Google Scholar] [CrossRef]
Figure 1.
The path diagram for the three factor self-reported gain scale.


Table 1.
Individual and entry characteristics of participants across colleges (n = 536).
| Characteristic | College | College |
|---|---|---|
| Natural Sciences | Social Sciences and Law | |
| 206 (38.4%) | 330 (61.6%) | |
| Gender | ||
| Women | 37 (18%) | 70 (21%) |
| Men | 165 (82%) | 260 (81%) |
| Classification | ||
| Year II | 111 (54%) | 115 (35%) |
| Year III | 95 (46%) | 176 (53%) |
| Year IV & V | 0 | 39 (12%) |
| Age | M = 21.33 (SD 1.35) | M = 21.51 (SD 1.35) |
| CGPA 1 | M = 2.90 (SD 0.46) | M = 3.05 (SD 0.47) |
Note: 1 Cumulative grade point average.
Table 2.
Covariance matrix of the latent factors of measurement variables (n = 536).
| Observed Variable | Latent Factors | ||
|---|---|---|---|
| General Education (α = 0.71) | Personal and Social Development (α = 0.83) | Practical Skill (α = 0.77) | |
| gen1 | 0.60 | 0 | 0 |
| gen2 | 0.64 | 0 | 0 |
| gen3 | 0.71 | 0 | 0 |
| psd1 | 0 | 0.67 | 0 |
| psd2 | 0 | 0.65 | 0 |
| psd3 | 0 | 0.64 | 0 |
| psd4 | 0 | 0.63 | 0 |
| psd5 | 0 | 0.70 | 0 |
| psd6 | 0 | 0.65 | 0 |
| pc1 | 0 | 0 | 0.64 |
| pc2 | 0 | 0 | 0.64 |
| pc3 | 0 | 0 | 0.70 |
| pc4 | 0 | 0 | 0.68 |
Table 3.
Correlations between student learning gains scale factors and validity variables.
| Validity Variable | General Education | Personal Development | Higher Order Thinking |
|---|---|---|---|
| Learning self-efficacy (0.82) | 0.52 | 0.51 | 0.48 |
| Time and study management (0.76) | 0.41 | 0.41 | 0.44 |
| Overall satisfaction | 0.53 | 0.51 | 0.46 |
| Future intention | 0.32 | 0.32 | 0.31 |
Note: Reliabilities (Cronbach’s alpha coefficients) are in parentheses; All correlations are significant (p < 0.001).
Table 4.
The values of fit statistic tests across different factor models for the self-reported gain scale (n = 536).
Table 4.
The values of fit statistic tests across different factor models for the self-reported gain scale (n = 536).
| Model | χ2 | df | χ2/df | TLI/NNFI | CFI | RMSEA | SRMR | CD | AIC | Δχ2 | Δdf |
|---|---|---|---|---|---|---|---|---|---|---|---|
| 1-factor model | 331.60 *** | 65 | 5.1 | 0.85 | 0.88 | 0.088 | 0.056 | 0.88 | 14264 | ||
| 2-factor model | 119.43 *** | 64 | 3.1 | 0.92 | 0.94 | 0.063 | 0.042 | 0.95 | 14134 | 212 | 1 |
| 3-factor model | 162.62 *** | 62 | 2.6 | 0.94 | 0.95 | 0.056 | 0.038 | 0.97 | 14101 | 43 | 2 |
N.B: The one factor model comprised of the 13 items used to measure self-reported gain scale
| |||||||||||
Table 5.
Descriptive statistics and reliability analysis for the three-factor student learning gains scale across colleges and class year.
Table 5.
Descriptive statistics and reliability analysis for the three-factor student learning gains scale across colleges and class year.
| Factor | Natural Science | Alpha (α) | Social Science | Alpha (α) | Year 2 | Alpha (α) | Year 3 | Alpha (α) | ||||
|---|---|---|---|---|---|---|---|---|---|---|---|---|
| n | Mean (SD) | n | Mean (SD) | n | Mean (SD) | n | Mean (SD) | |||||
| General education | 206 | 3.12 (0.61) | 0.69 | 330 | 3.07 (0.63) | 0.69 | 226 | 3.04 (0.67) | 0.74 | 310 | 3.12 (0.58) | 0.64 |
| Personal development | 205 | 3.37 (0.51) | 0.81 | 324 | 3.31 (0.55) | 0.83 | 225 | 3.29 (0.55) | 0.83 | 304 | 3.37 (0.52) | 0.81 |
| Higher-order thinking | 204 | 3.00 (0.63) | 0.77 | 329 | 2.72 (0.66) | 0.74 | 225 | 2.74 (0.69) | 0.79 | 308 | 2.89 (0.64) | 0.72 |
Note: Evaluation of the distribution of the three-factor model indicated that the level of excess kurtosis ranged from 0.000 to 0.936 and skewness ranged from 0.000 to 0.132, suggesting univariate normality for the whole sample. SD: standard deviation.
Table 6.
Scores of fit statistics and practical indices for invariance tests of student learning gains scale across college and class year.
Table 6.
Scores of fit statistics and practical indices for invariance tests of student learning gains scale across college and class year.
| Invariance Tests Based on College Attended | ||||||||||
| Model | χ2 (df) | χ2/df | ∆χ2 (∆df) | RMSEA | SRMR | CFI | TLI | CD | Comparison | Decision |
| Reference Model | 162.619 (62) *** | 2.623 | 0.056 | 0.38 | 0.95 | 0.94 | 0.97 | |||
| Model 1: Configural invariance | 115.163 (62) *** | 1.858 | −47.456 (0) | 0.052 | 0.044 | 0.96 | 0.95 | 0.96 | Reference model vs. Model 1 | Accept |
| Model 2: Metric invariance | 274.868 (144) *** | 1.909 | 159.705 (82) | 0.059 | 0.056 | 0.94 | 0.94 | 0.97 | Model 1 vs. Model 2 | Accept |
| Invariance Tests Based on Class Year | ||||||||||
| Model | χ2 (df) | χ2/df | ∆χ2 (∆df) | RMSEA | SRMR | CFI | TLI | CD | Comparison | Decision |
| Reference Model | 162.619 (62) *** | 2.623 | 0.056 | 00.38 | 0.95 | 0.94 | 0.97 | |||
| Model 1: Configural invariance | 120.970 (62) *** | 1.951 | −41.649 (0) | 0.061 | 0.047 | 0.95 | 0.93 | 0.97 | Reference model vs. Model 1 | Accept |
| Model 2: Metric invariance | 261.547 (144) *** | 1.816 | 140.577 (82) | 0.056 | 0.056 | 0.95 | 0.94 | 0.96 | Model 1 vs. Model 2 | Accept |
Note: SRMR = standardized root mean square residual (testing residual invariance), CD = coefficient of determination; *** p < 0.001.
© 2018 by the authors. Licensee MDPI, Basel, Switzerland. This article is an open access article distributed under the terms and conditions of the Creative Commons Attribution (CC BY) license (http://creativecommons.org/licenses/by/4.0/).
Share and Cite
MDPI and ACS Style
Tadesse, T.; Gillies, R.M.; Campbell, C. Testing Models and Measurement Invariance of the Learning Gains Scale. Educ. Sci. 2018, 8, 192. https://doi.org/10.3390/educsci8040192
AMA Style
Tadesse T, Gillies RM, Campbell C. Testing Models and Measurement Invariance of the Learning Gains Scale. Education Sciences. 2018; 8(4):192. https://doi.org/10.3390/educsci8040192
Chicago/Turabian StyleTadesse, Tefera, Robyn M. Gillies, and Chris Campbell. 2018. "Testing Models and Measurement Invariance of the Learning Gains Scale" Education Sciences 8, no. 4: 192. https://doi.org/10.3390/educsci8040192
Note that from the first issue of 2016, this journal uses article numbers instead of page numbers. See further details here.