
Earth’s Obliquity and Stellar Aberration Detected at the Clementine Gnomon (Rome, 1703) †

1
ICRA/Sapienza University of Rome, Piazzale Aldo Moro 5, 00185 Rome, Italy
2
Istituto Scienza e Fede, Ateneo Pontificio Regina Apostolorum, via degli Aldobrandeschi 190, 00163 Rome, Italy
3
ITIS Galileo Ferraris, via Fonteiana 111, 00152 Rome, Italy
†
Presented at the 1st Electronic Conference on Universe, 22–28 February 2021; Available online: https://ecu2021.sciforum.net/ .
Phys. Sci. Forum 2021, 2(1), 49; https://doi.org/10.3390/ECU2021-09323
Published: 22 February 2021
(This article belongs to the Proceedings of The 1st Electronic Conference on Universe)
Abstract
:The Clementine Gnomon was built in 1700–1702 by the astronomer Francesco Bianchini, upon the will of Pope Clement XI. This meridian line is located in the Basilica of santa Maria degli Angeli e dei Martiri in Rome, and it is visited by thousands of students and tourists per year. This 45-m meridian line was designed to measure the secular variation of the obliquity of the ecliptic ε and to verify the tropical years’ length used in the Gregorian Calendar. With a pencil and a meter, a synchronized watch and a videocamera, we can obtain an accuracy of up to one arcsecond in the position of the solar center. The observations from 21 November 2020 to 19 January 2021 are analyzed to recover the solstice’s instant in Capricorn, the ingresses into Sagittarius and Aquarius, and the corresponding observational uncertainties. Astrometric corrections to the total length of the meridian line and to the pinhole’s height are found. The 5′11″ Eastward deviation of the meridian line between the two solstices, found by comparing our observations and the ephemerides, and the aberration of Sirius’ light explain the timing of the solstices and equinoxes calculated by Bianchini for 1703. The aberration in declination of Sirius explains the variations of its meridian position observed in 1702-3.
1. Introduction: The Great Clementine Gnomon as in the Texts of Francesco Bianchini (1703)
The meridian line was completed in about two years—1701 to 1702—including all the images of the zodiacal signs and the stars over the floor. The stars are located along the projection of the celestial equator, and of the projected paths (hyperbolae) of Sirius, Arcturus and the Sun on the 20 August 1702 (visit of the Pope Clement XI). Another group of seven stars on a circular sector at 35 m 80 from the pinhole’s base approach Sirius’ hyperbola.
In 1703, Francesco Bianchini (1662–1729) published [1] the results of the measurements made at the meridian line in the book De Nummo et Gnomone Clementino, and the four instants of solstices and equinoxes (anni cardines) were written on a marble slab included in the wall of the presbyterium, at about five meters from the Capricorn sign.
Bianchini called the great meridian line Clementine Gnomon, because, with this instrument, dedicated to Clement XI, it was possible “to know” the position of the Sun. The word Gnomon includes the Greek root for knowledge, knowing.
2. Measurements and Comparison with Ephemerides
2.1. Ephemerides for 1703
IMCCE provides a service for computing the beginning of the seasons back to the year 4000 BC. I refer to these computations, which are not available on the NASA web interface Horizons (only back to 1800 AD).
The comparison between IMCCE UTC dates and Bianchini measurements, published in local time, also required to “translate” the local time of 1703 into UTC with a slightly different equation of time with respect to the present time, as well as a different position of the apsides of the Earth’s orbit.
2.2. Aberration in Stellar Coordinates
Bianchini measured the difference of time between the transits of the Sun and the transit of Sirius. He also measured this difference in daylight during the solstice of June, as reported in his book, so there is no doubt he also carried it out during Sirius’ night transit in December, and in twilight at both equinoxes. The Stars’ Catalogue, published in 1700 by Philippe de la Hire (Paris Royal Observatory), was used by Bianchini, and on the meridian line, the coordinates “precessed” for 1701 have been written [2,3].
While the stellar coordinates in the catalogue are measured at night with a “passages instrument”, i.e., a meridian instrument, the observation in daylight deals with the aberrated coordinates of the same star, and the noon transit of a star carries a difference of 41.2” with respect to the midnight transit’s coordinates.
The differences between IMCCE ephemerides and Bianchini’s calculated times reflects the influence of the aberration of Sirius’ stellar coordinates, namely its aberration in ecliptic longitude, not included in Bianchini’s computations, because it was discovered in Greenwich 24 years later by James Bradley.
2.3. Polaris’ Stellar Aberration
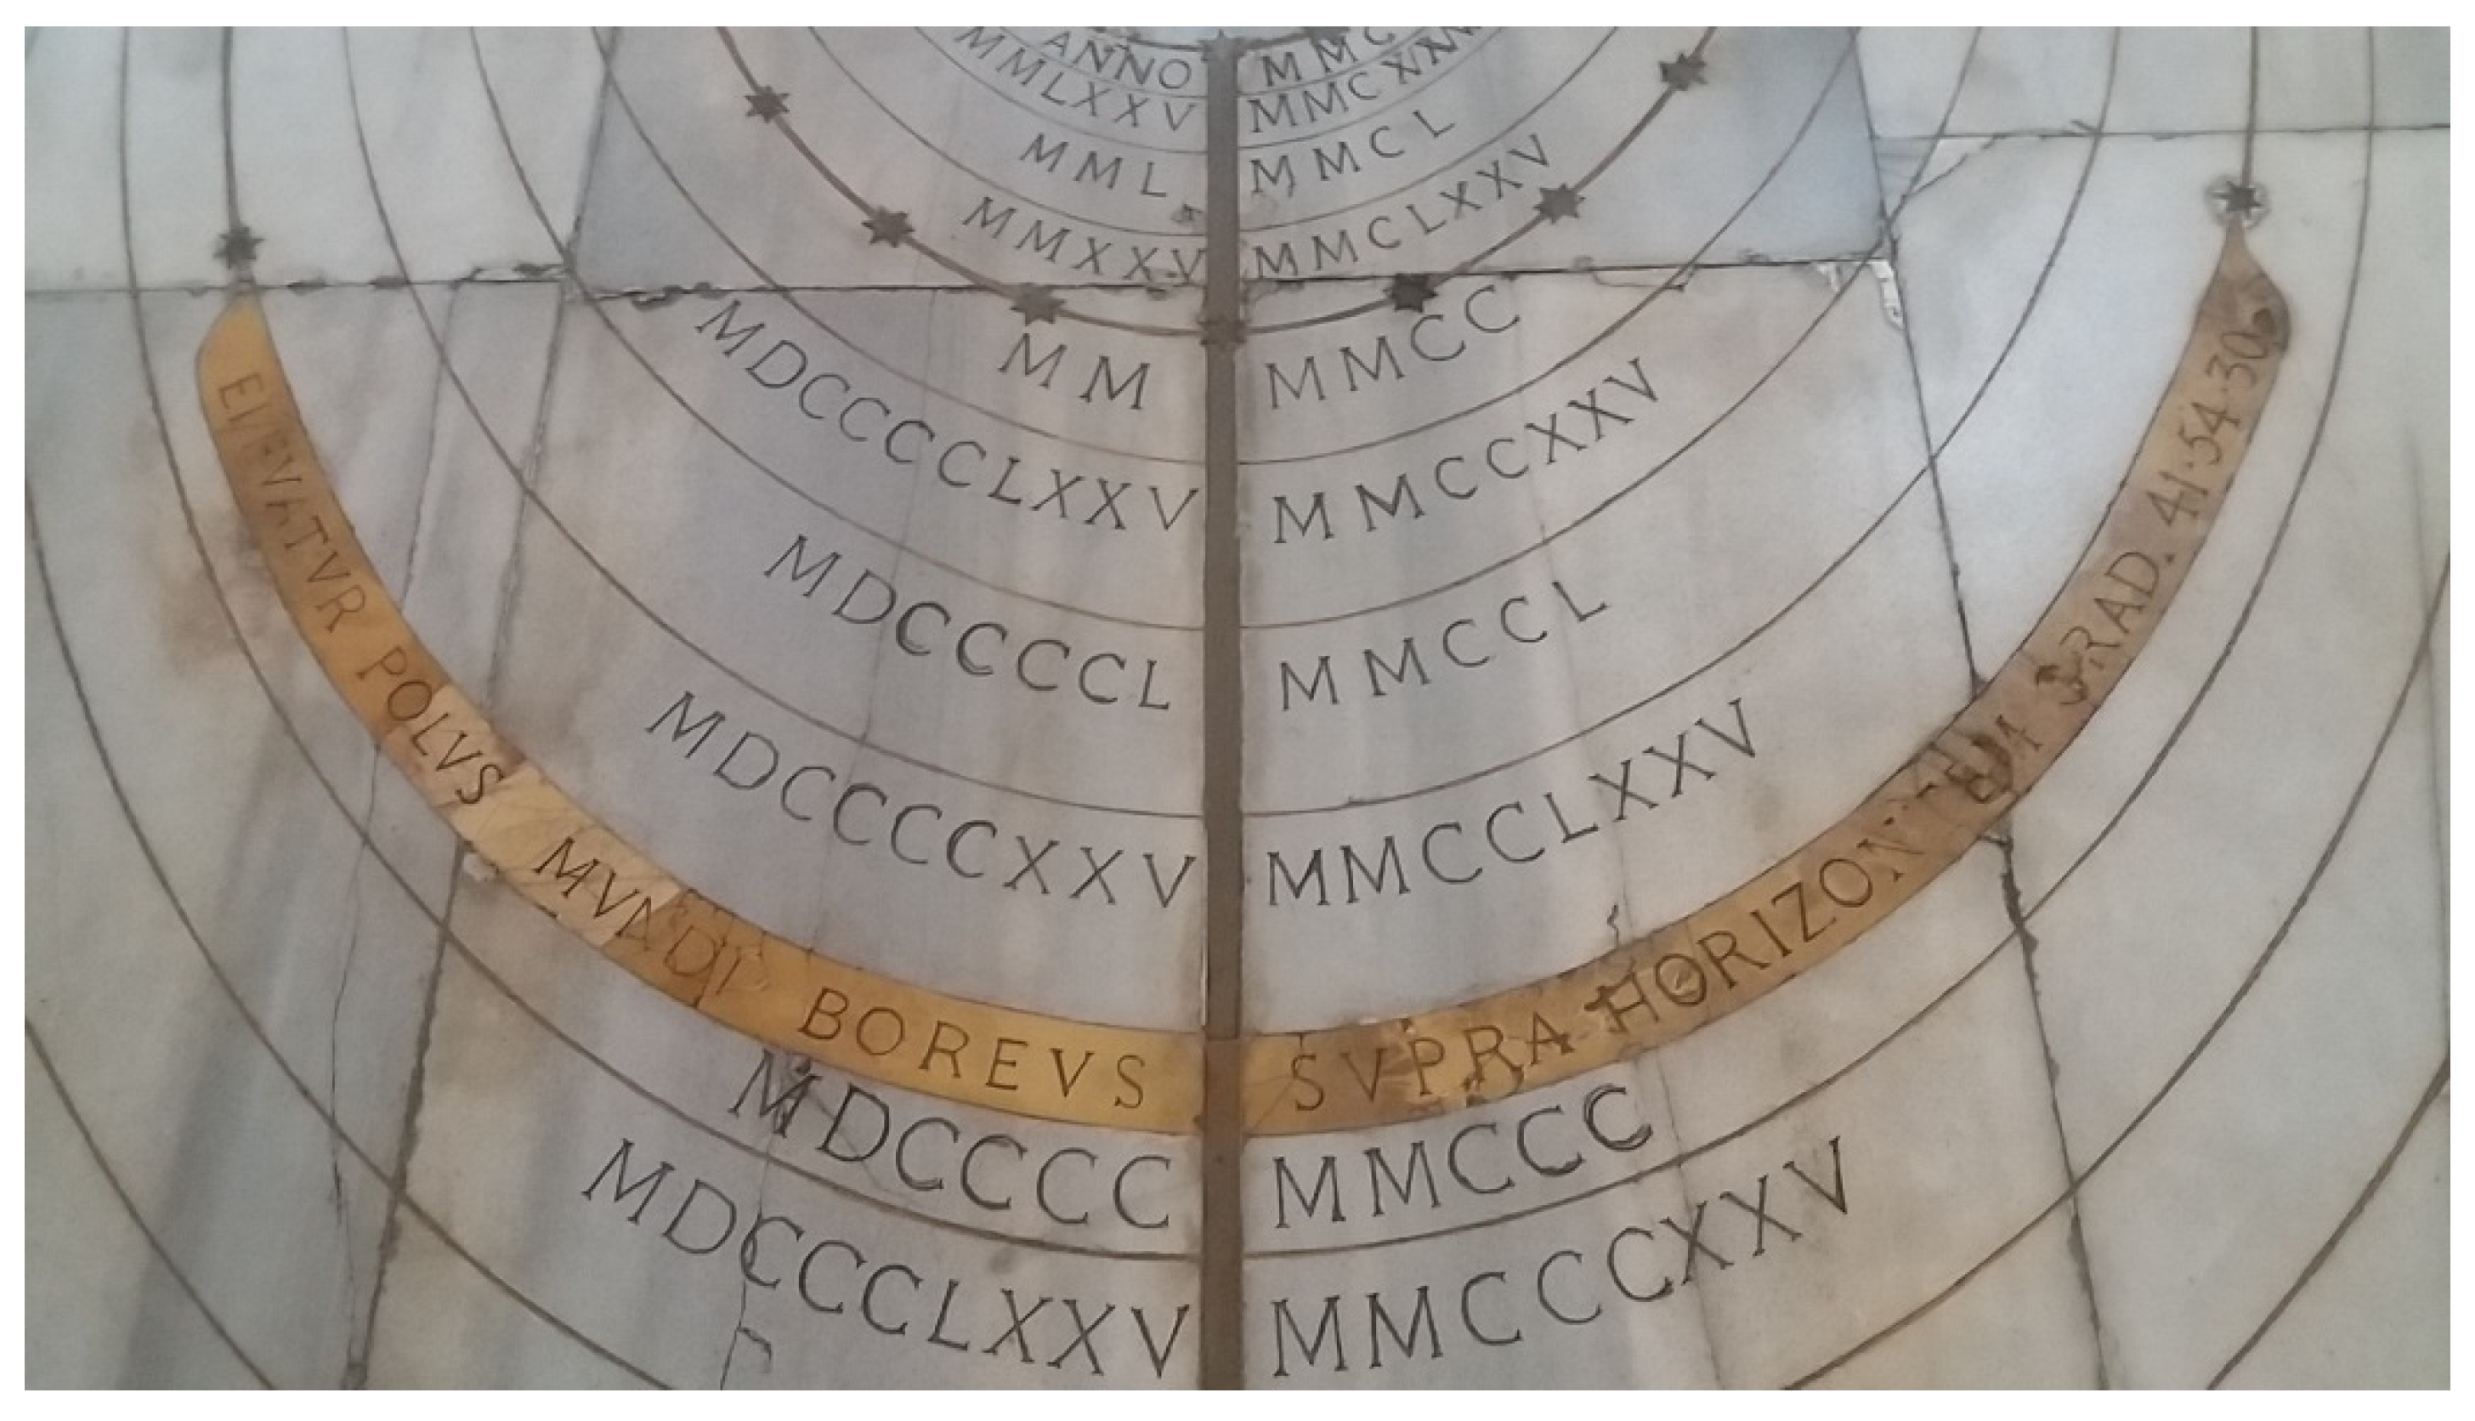
Bianchini in 1701 could not take into account the stellar aberration because it was discovered in 1727 by James Bradley, but he observed and measured its effects, as in the latitude that he measured during the nights from 1 to 8 January 1701 by averaging the extremes of the altitude of Polaris. He obtained 41°54′27″, while the correct value is 16″ less. This difference is due to the stellar aberration of the Polaris coordinates in these dates, and it is written on the marbles of the boreal gnomon (see Figure 1) as 41°54′30″ [3]. The stellar aberration is a special relativistic effect measurable with the Clementine Gnomon.
2.4. Aberration Effect on Sirius
Bianchini observed the change of the meridian coordinates of Sirius along the seasons with a telescope, whose axis was on the meridian line. Over the pinhole of Santa Maria degli Angeli, a window of 40 cm × 60 cm was opened to allow these observations. Nowadays (2021), this can no longer be carried out without taking the risk of breaking the coat of arms of Clement XI, in which the pinhole is located.
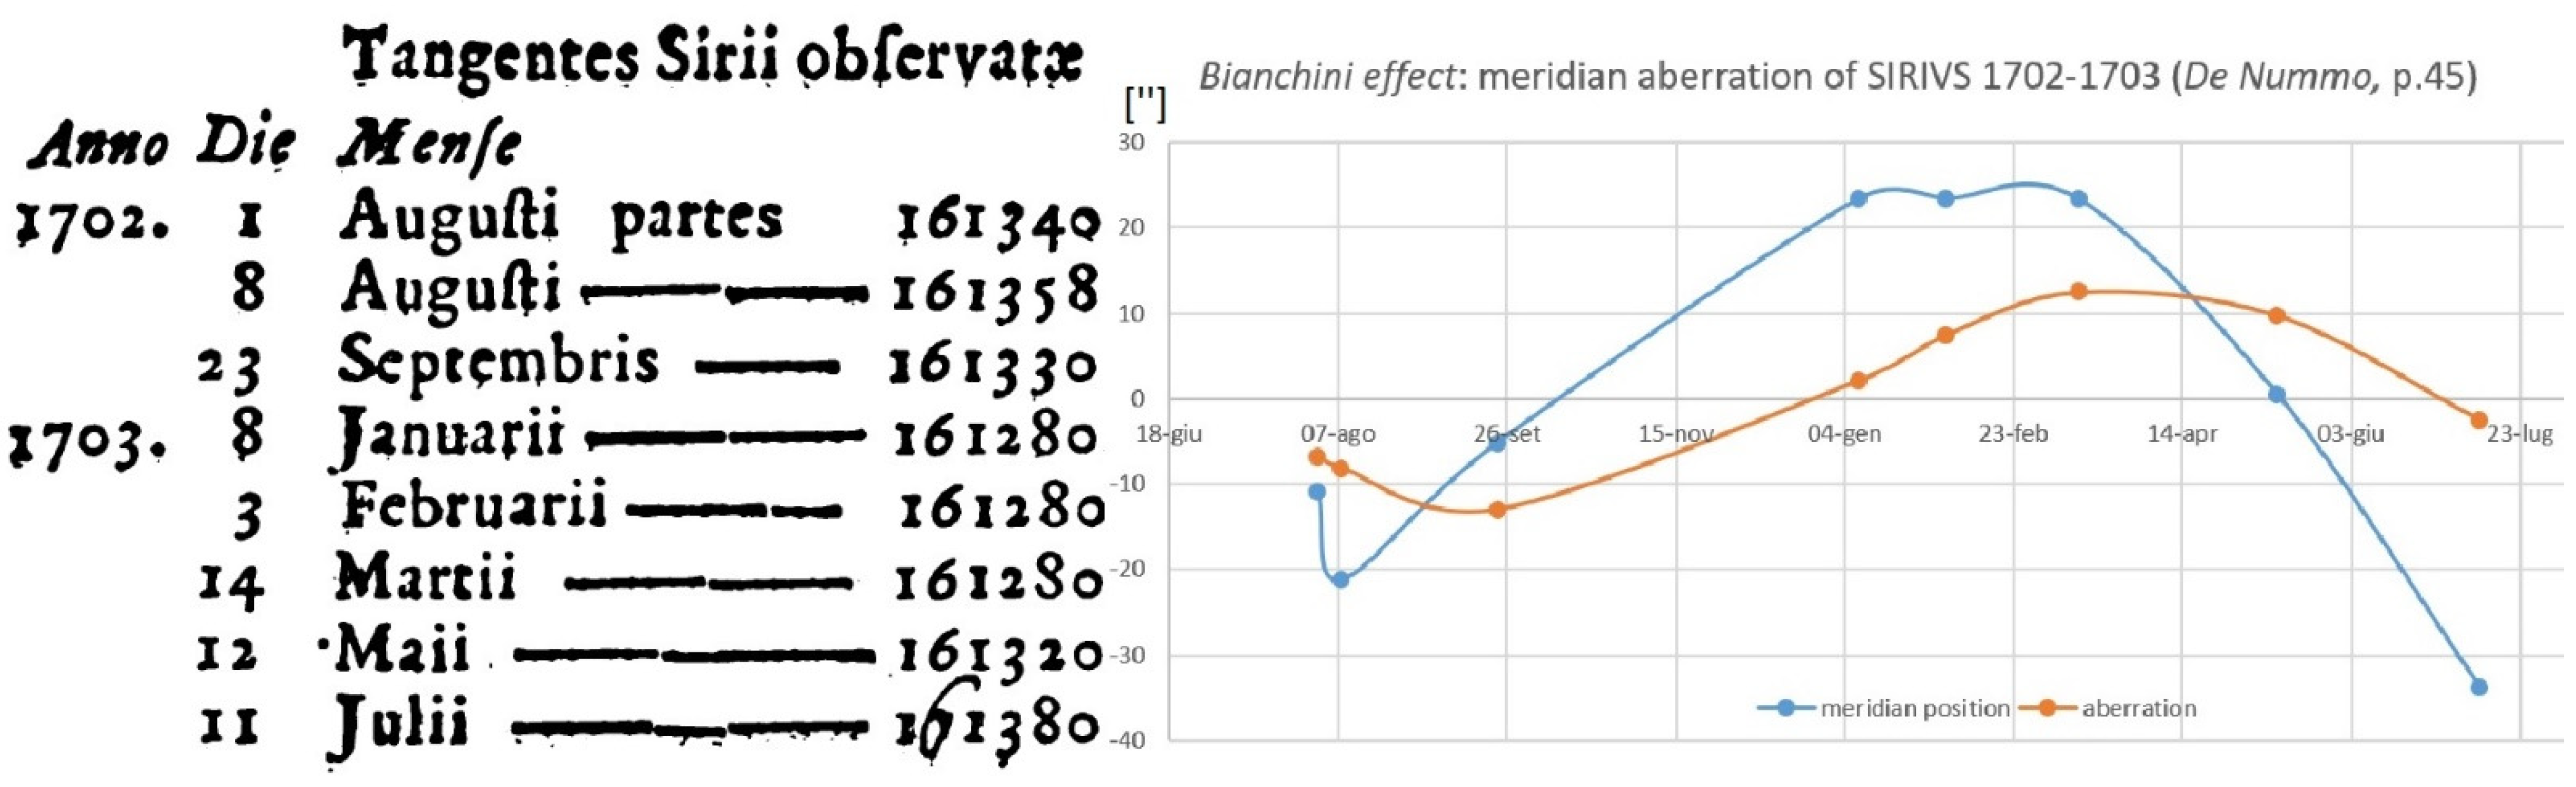
From 1702 to 1703, Bianchini measured a difference of 0.1 centesimal parts in the meridian coordinate of the projection of Sirius across the year: the tangent of its observed zenithal angle changed from 1.6138 to 1.6128 with a difference of nearly 1′ = 60″ from night (December) to day (June). For the first time in the literature, the seasonal refraction effects appear, but the contribution of stellar aberration –unknown at that time- is larger.
The present (2018–2021) observational campaign allowed to verify -in daytime with the Sun- along all seasons that the observations O do not differ by more than 10″ from the calculated positions C of the solar limbs.
The aberration ellipse for Sirius has semiaxis k and k·sin(β) with k = 20.6″ and β = −39.5°; the meridian maximum shifts are ±k·sin(β) = ±13″ near the equinoxes. Bianchini observed the maxima in July 1702 and the minima in January–March 1703. In the following Figure 2 (Bianchini, 1703 [1]), we have the dates and the tangents of the zenithal angle of Sirius, compared with its stellar aberration, in arcseconds.
2.5. The Winter Solstice of 2020, in Comparison with 1703
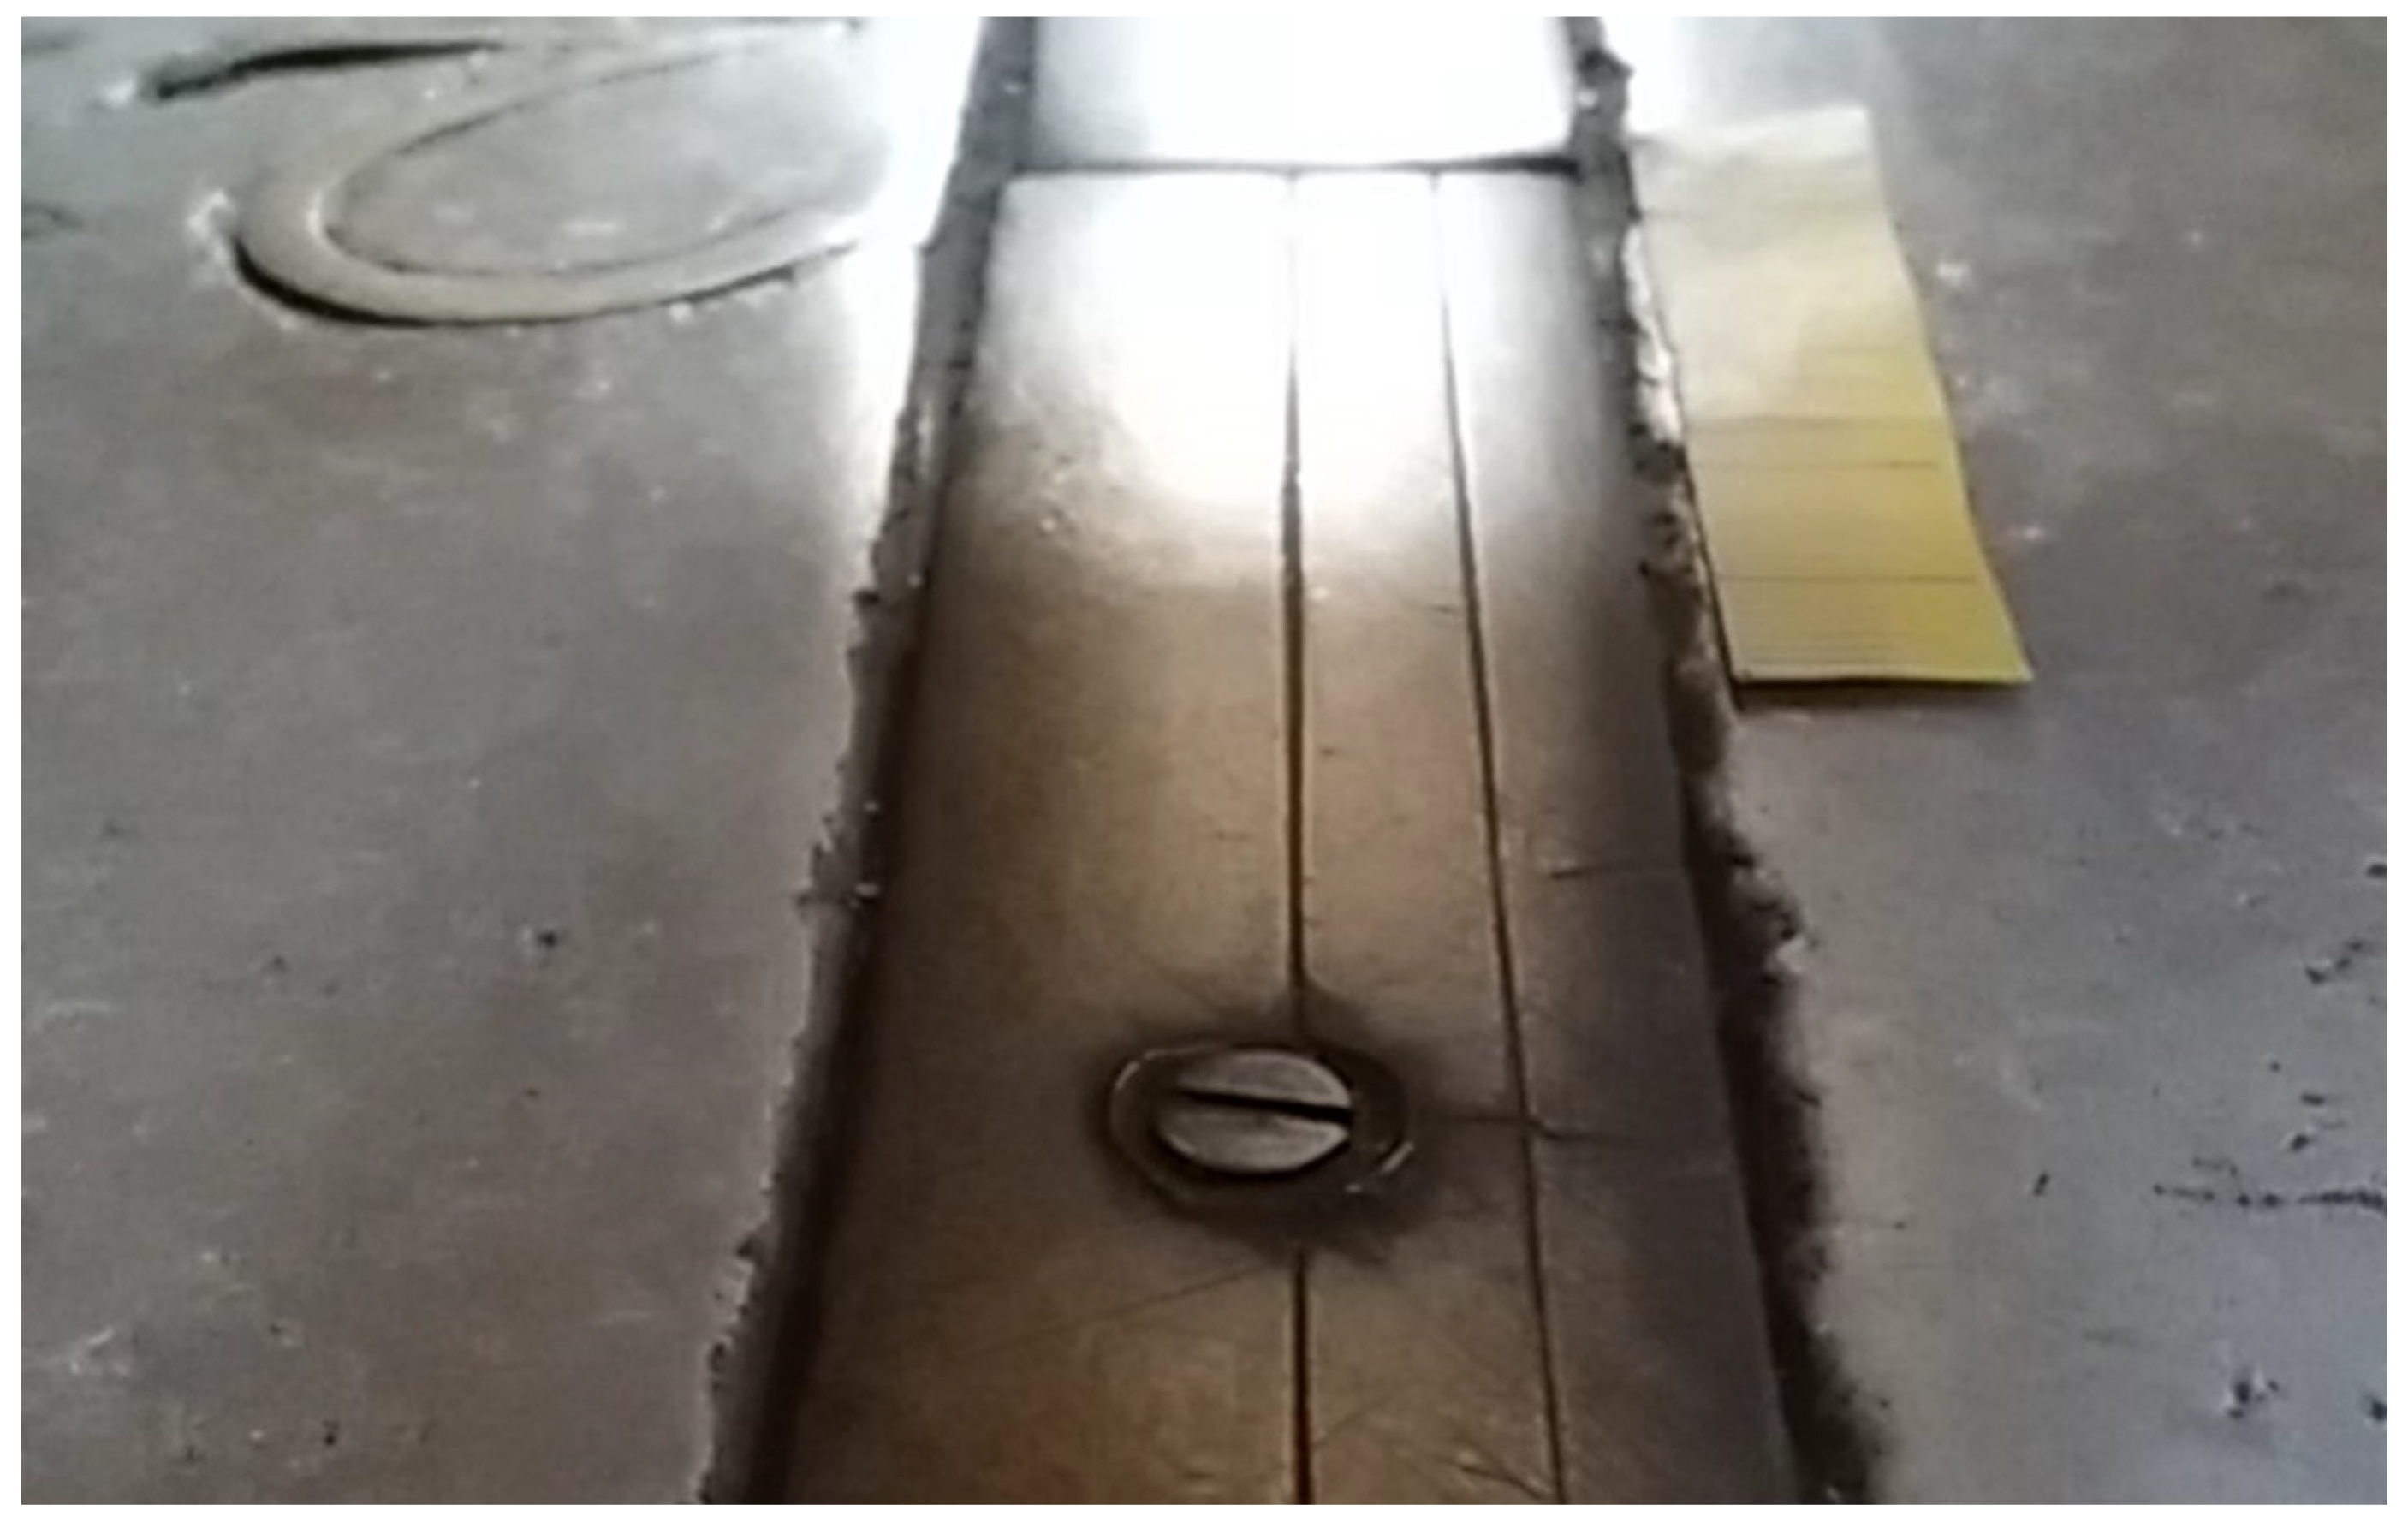
In 2020, the position of the Southern solar limb on the meridian line exceeded the number 220 only from 19 to 23 December, and it reached +45 mm on 21 December (including the penumbra, see Figure 3). During 1703, the solar limb touched the black line contour of the Capricorn (CAP) tile, at the end of the meridian line, +122 mm above the 220 mark (observation of 21 December 1703, Bianchini 1703 p. 74).
2.5.1. Solstices’ Parabola, Obliquity and Nutation
During the solstices, the solar declination reaches an extreme and inverts its growth through a stationary point. Around this stationary point, the meridian coordinates (the tangent of the observed zenithal angle either of the center of the Sun, either of both solar limbs) behave in time akin to a parabola, centered in the instant of the solstice. The fit of the parabola gives the minimum’s instant and its position (declination + refraction + nutation). The nutation is an oscillation of ±9″ in 18 years, which correspond to ±4.5 mm at the winter solstice on the Clementine Gnomon. The accuracy of a solar limb position is within ±1 mm, and the fit of a whole week of data reaches a better precision on the minimum of the parabola.
2.5.2. Winter Solstice 2020 Instant from the Position of the Limbs
The instant of the minimum, averaged from southern and northern limbs between 7 December and 4 January (see Table 1), is 21 December at 10:37 ± 4 min TMEC. The time of the solstice in IMCCE ephemerides is at 11:02 TMEC, 25 min later. The causes of this difference are not dependent on the calibration of the meridian line since the position of the limbs can be measured from each of the references on the line: the “tropic”, i.e., the inversion of the motion, is universal.
2.6. Perihelion Influence on the Solstice’s Data
The perihelion being in the first days of January (the 2 January in 2021), the angular velocity of the Sun with respect to the “fixed” stars reaches a maximum at that date. This shifts the meridian transit about 30 s ahead each day (true solar day of 24 h 30 s), but also the velocity of declination’s motions is asymmetric with respect to the solstice, being larger around the perihelion. A simple quadratic fit of all data in Table 1 shows a minimum before the actual solstice. The minimum of the data’s fit is 25 ± 4 min before the solstice. The value of the ephemerides is 6σ ahead. This asymmetry is due to the perihelion, which follows the solstice of 11 days, and it is not due to observational errors, since the same result appears by fitting the positions of the solar center he ephemerides.
2.7. Obliquity Measurement
The Sun limbs’ fitted position for the 2020 winter solstice are 9 and 4 mm Southwards than the observed positions. The difference between this observation and the parabolic fit can be due to local atmospheric refraction effects: more refraction implies a higher Sun, and a lower position of its image on the meridian line. This difference corresponds to 15″, and it can be considered as the upper limit for refraction effects, due to the meteorological conditions (clear sky) on the 21 December 2020.
We assume the length of the meridian line as 44916.9 mm and the height of the pinhole 20,353.44 mm. We assume the latitude of the pinhole as 41°54′11.2″. We adopt the corrections of Cassini 60″·tan(z) and the correction of Laplace 0.067″·tan3(z) to obtain the airless position of the Sun. The obliquity of the epoch (21 December 2020) is ε = 23°26′12.9″. We also adopt the cylindrical correction (see Section 3.1) originated by the shadowing of the Southern rim of the pinhole, 6.11 mm thick. To recover the correct value for ε by using the minimum value of the parabolic fit, it is necessary to change the length of +2.77 mm Southward, or the height +2.65 mm, while by using the single observation of 21 December the required changes are −0.87 mm (Northward) or +0.40 upward.
This second option is more reliable with respect to the typical errorbar of the total station used for the geometrical measurements inside the Basilica, which is ±1 mm: no significant changes in the parameters of the meridian line are required, and in any case they are smaller than their errorbars.
Moreover, this analysis of the lower meridian transit of the year, to this level of accuracy, shows the significance of the Laplace correction term, that here is of 0.66″.
The Laplace term is normally negligible for all higher meridian heights. Without including the Laplace term, which is due to the air refraction, it should be necessary to shift of further 0.4 mm the length of the meridian line, to obtain the real obliquity.
2.8. Nutation Measurement for 2020 Winter Solstice
The present value of the obliquity ε = 23°26′12.9″ on 21 December 2020, includes the actual nutation’s component, which oscillates of ±9″ in 18.6 years. The accuracy of these position’s measurements of ±1 mm implies a ±2″ resolution in the declination, so in the obliquity and consequently also in the nutation component.
The position of the present pinhole remained fixed during all the observational campaign, then the repetition of this procedure at different dates (we chose the ingresses in the zodiacal signs, compared with the ephemerides) allow the absolute calibration of the pinhole (see Section 3.2).
2.9. The Penumbra Effect and the Sharpeness of the Solar Image
The image of the Sun is generated by a pinhole. There is no lens to focus it. This is an advantage on large angular distances spanning over 47° of meridian altitudes, from winter (24.5°) to summer (71.5°) solstices. The absence of a lens eliminates all optical distortions. However, the image of the Sun is not with sharp edges, though there is a preferred distance at which the diffraction’s “pixel” F·λ/D = D equals the pinhole projection.
During two solar rotations (November and December 2020) we observed the Active Region AR2786, a large solar spot, with a good imaging precision.
This happened because the meridian projection of the pinhole (the effective pinhole, which is the “pixel”) was about 12-mm wide. A solar spot of this angular dimension (12 mm at 50,000 mm of distance from the pinhole, is 48″) could and has been seen. Similarly, the limb of the Sun was visible with the same resolution (see again Figure 2), and the penumbra effect was limited to this dimension.
Since the limb of the Sun is subjected to the limb darkening function, due to the solar atmosphere, it happens that both the penumbra and limb darkening act to reduce the perceived position of the limb of the Sun toward the center of the image. At the eye, the solar limb appeared redder, as reflected from the white marble “Imetto” [4] when the sky was completely clear.
Either in case of a hazy or clear sky, the penumbral effect has been evaluated by comparing the measured diameter, obtained by the time duration of the transit Δt·cos(δ)·15″/s and the solar diameter from the ephemerides.
The percentage of the pinhole diameter corresponding to the enlargement of the diameter due to the penumbra is between 30 and 50%, and even more. Bianchini chose 50%; Eustachio Manfredi in Bologna [5] was more oriented toward 100%, most probably because of a prevalence of hazy weather (for which we also measured larger values of penumbral effect in Rome).
The penumbral effect is symmetrical at the northern and southern limbs, so the center is rather unaffected by it. The estimate of the obliquity by using only one of the limb positions would include this random meteorological effect of the penumbra.
3. Ingresses of the Sun in the Sagittarius and the Aquarius Signs
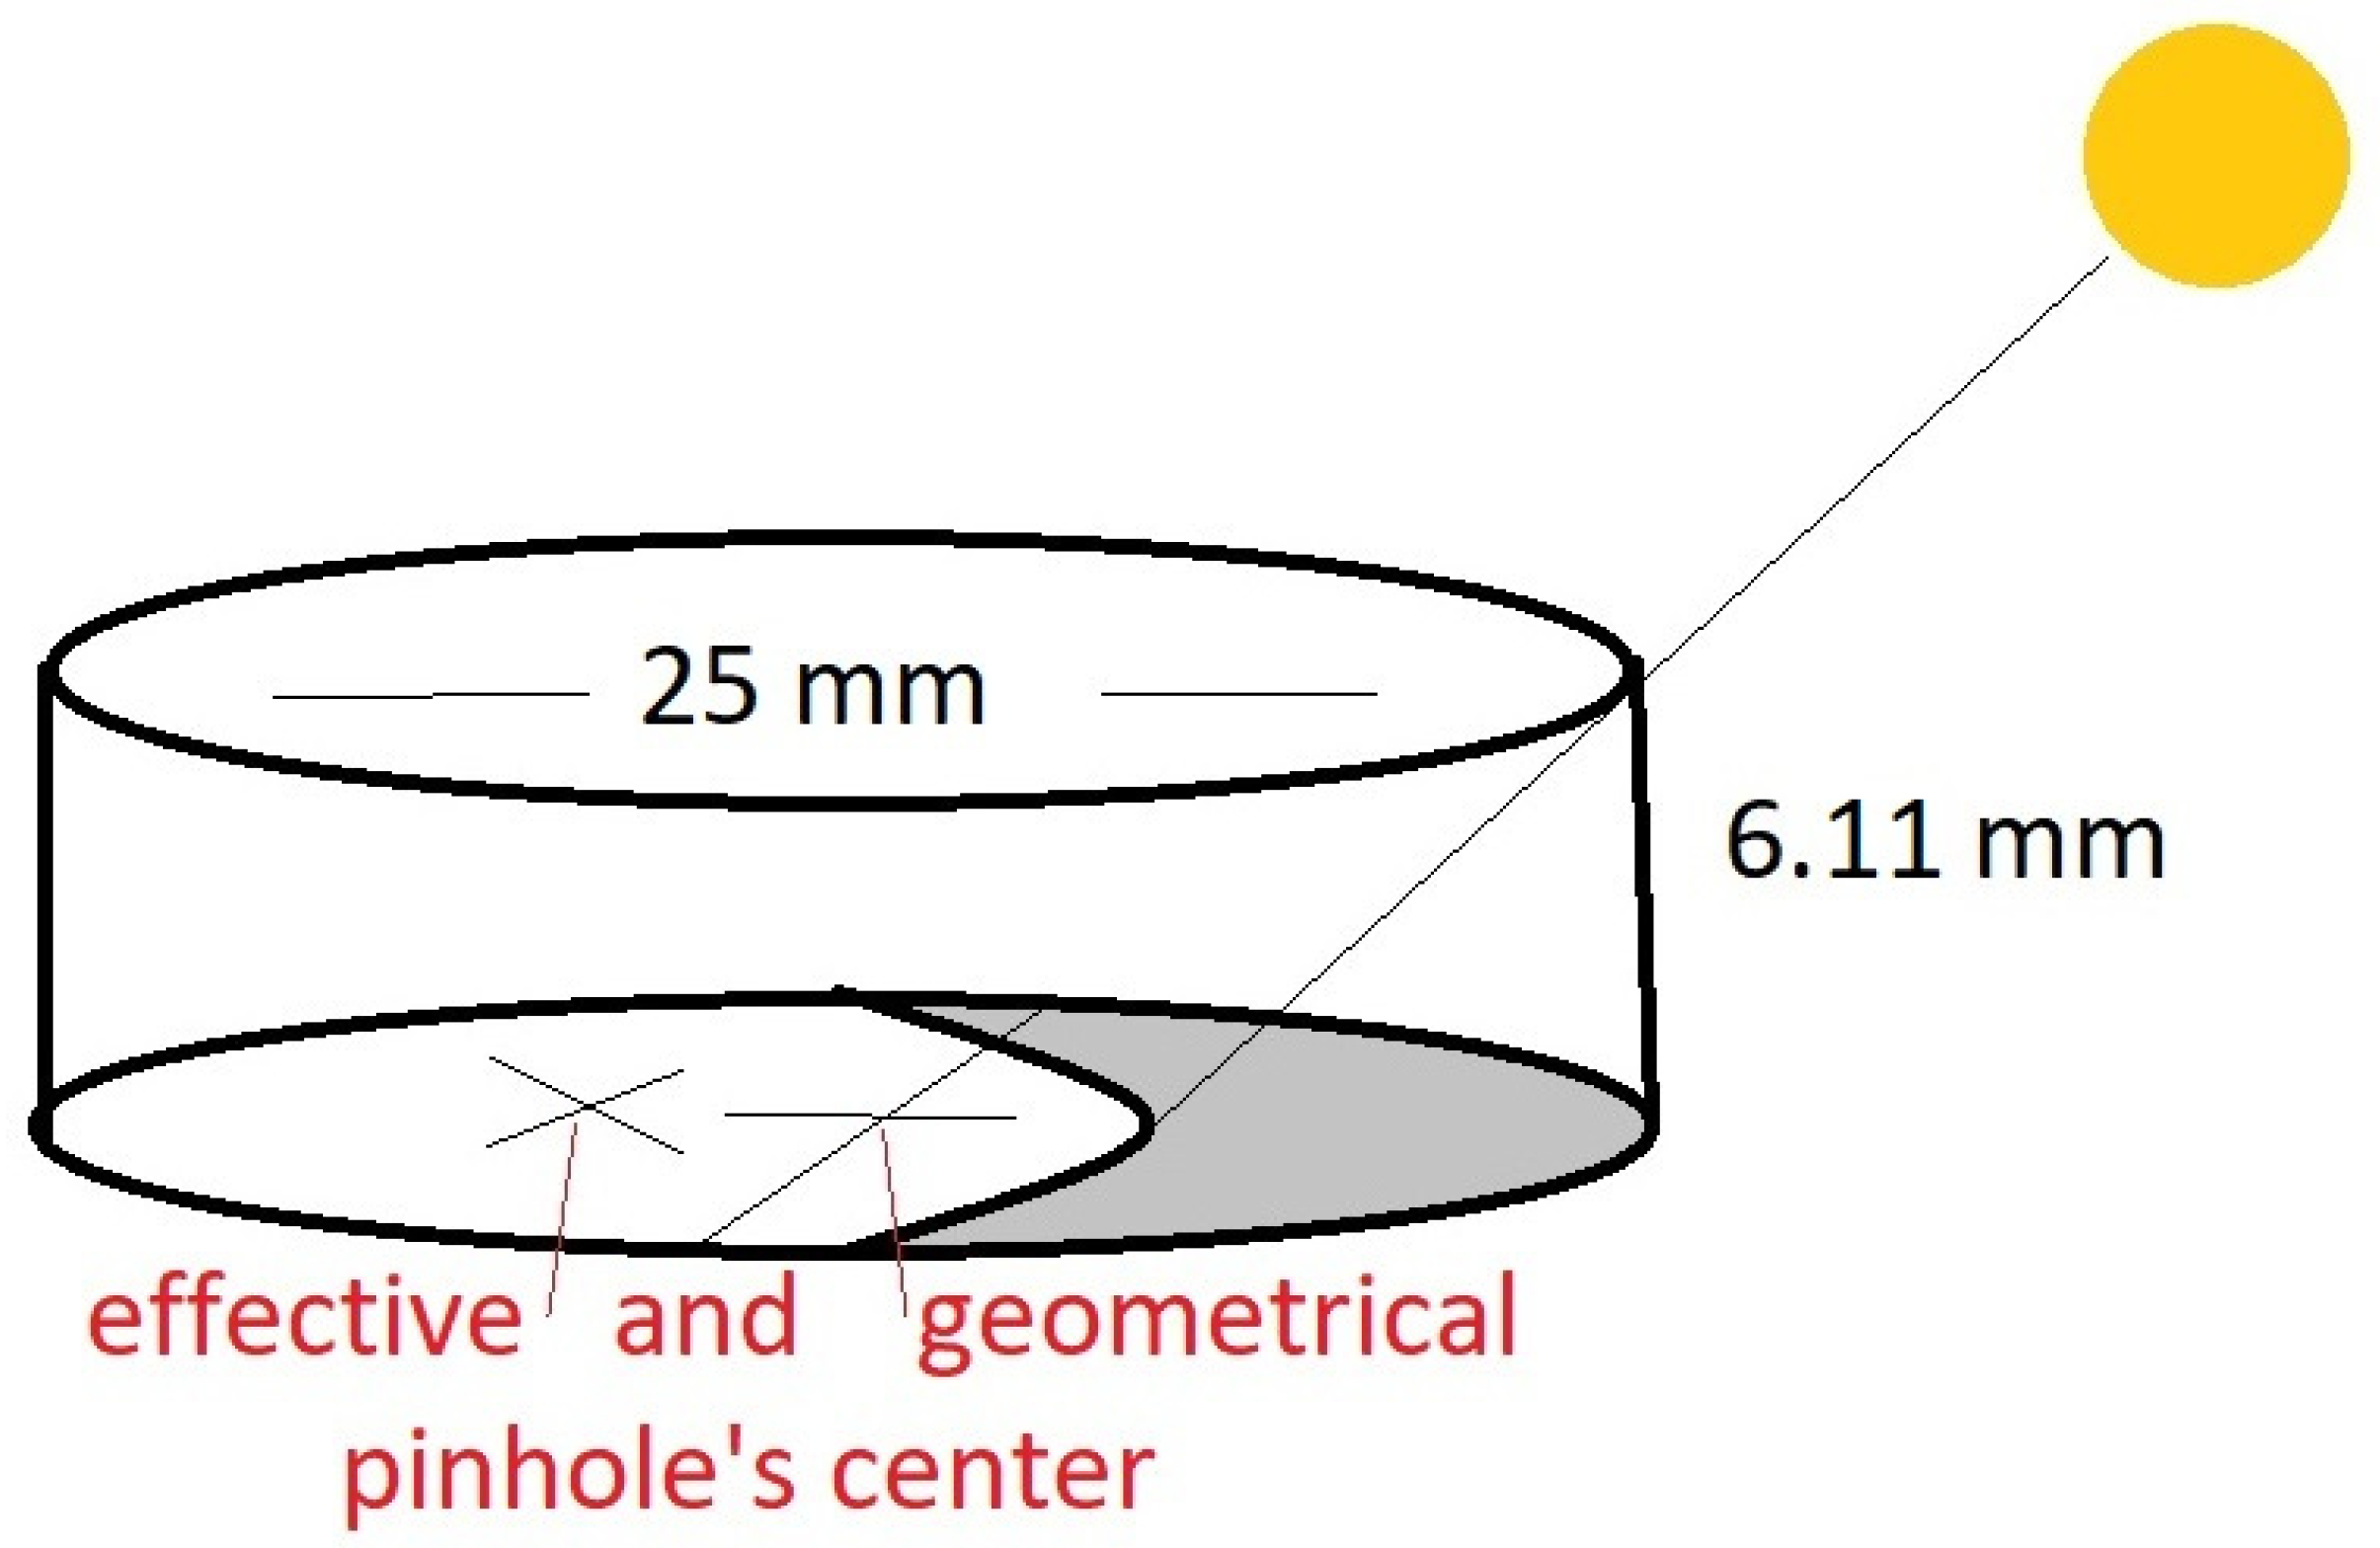
The pinhole’s form and position have been modified since the original one of Francesco Bianchini. As example, in the year 2000, we found an irregular pinhole of about 40 × 15 mm. Now, since 27 October 2018, a circular cylindrical pinhole of 25 mm diameter and 6.11-mm thick is in place (Section 3.1). The thickness determines a seasonal change of the effective aperture and of the effective center of the pinhole, with the meridian solar altitude’s change (Figure 4). The present diameter is slightly larger than the original one of Bianchini (20 mm) to give more light for the winter Sun, in a Basilica with wide windows, no longer obscured during the observations as in 1700s. The position of this pinhole’s center is not the same as in 1702, and it was calibrated with the winter solstice (Section 2.7).
3.1. The Effective Pinhole
The cylinder’s shadow of the pinhole shifts its effective center (of the illuminated part) 7.1 mm toward the north at the Aquarius/Sagittarius limit. The maximum effect occurs, obviously, at the winter solstice, and it is 8 mm. We already included this effect in the measurements of the true obliquity (Section 2.7), and now in the reduction of Aquarius/Sagittarius ingresses.
3.2. The Ingress in Sagittarius and Aquarius (SGR and AQR)
The ingress in Sagittarius and Aquarius (see Figure 5) has been used to check the displacement of the pinhole with respect to the meridian line’s reference marks. In this measurements the solar image is still 900 mm long, in the range of the meridian equivalence 2″ = 1 mm.
The Sagittarius/Aquarius at declination δ = −20.1494° enters in that meridian line at 188.24 centesimal parts, after the Cassini and Laplace refraction’s correction. These units are referred to the real height of the pinhole and the distance from its center’s vertical projection. The instants of these ingresses are extrapolated/interpolated from the observed meridian transits nearest to 188.24 centesimal parts: these transits are reported in Table 2.
The Sagittarius’ ingress was obtained on 21 November 2020 at 21:49, 9 min after the ephemerides; Aquarius’ ingress is found on 19 January 2021 at 21:57, 18 min after the ephemerides. The Sagittarius’ ingress was obtained by interpolation: an operation more accurate than the extrapolation used for Aquarius. These results show the interpolation’s errorbar of 9 min, comparable with the 10 min declared by Francesco Bianchini by using the stellar transits to measure directly the solar longitudes. 9 min of time, with an average angular velocity of 1°/day correspond to 22.5″ in solar longitude, and 2.2 mm for an image’s meridian motion of 350 mm/day. Such errorbar is compatible with the air turbulence. These two ingresses are obtained by two observations only for each one, then the turbulence is more influent.
3.3. The Duration of the Sagittarius and Capricorn Zodiacal Signs and the Perihelion
The duration between the SGR and AQR ingresses was almost exactly 59 days, from 21 November 2020 to 19 January 2021 at 21:40 TMEC for both dates. In the middle of both dates, exactly, we would expect the solstice, which is the ingress in CAP, but it happened at 11:02 TMEC instead of at 9:40 TMEC of 21 December, as it would be obtained by the average (and by the parabolic fit extended from November to January). This method was used by Nicolò Cusano (1401–1461) to measure the winter solstice. In reality, at the meridian line, we measured the durations of the signs as follows: SGR-CAP 29 days 13 h 20 min and CAP-AQR 29 days 10 h 40 min. The difference is due to the perihelion’s position which occurred in the CAP sign on 2 January 2021; the Capricorn is the “fastest” sign.
4. Time Measurements at the Meridian Line
The technique of the video with a synchronized watch at the meridian line has been improved in the last 20 years. The scope is to have single photograms with absolute accuracies of 1/30 s or 1/60 s, according to the video time acquisition. A single contact with the meridian line is affected by strong turbulence, enhanced by the opening of the pinhole, so the technique also includes parallel line measurements.
These lines were drawn on a paper sheet or, more recently, the marble lines 451 mm before and after the bronze line, which were built exactly symmetric have been used. The standard deviation of these time averages is as good as 0.4 s. There is a single exceptional case on 1 May 2019, where the standard deviation was 0.2 s because of very cold weather outside, and the Sun appeared just in the transit’s phase.
4.1. The Eastward Deviation between the Solstices
The global value of the deviation was estimated as 5′11″ eastward, by averaging about 70 measurements in 2018 and 2019. This deviation corresponds with 11 s and 23 s of delay of meridian passages in the summer and winter solstices, respectively. The deviation of the meridian line is larger than the deviation from the true north of the small “boreal line” used with the Polaris during the measurements of the latitude. Anders Celsius measured 2′ in 1734 and Rudjer Joseph Boscovich measured 4.5′ in 1750 (specifying that it was 5 s and 17 s of delay at solstices [5]).
4.2. The Boscovichian Sine
Boscovich also found a further deviation, up to 5 mm, from the ideal line between the solstices. Its form is a sine, possibly individuated around the number 165.
To evidence this sine, new ephemerides have been published this year (2021), which includes the global deviation of the meridian line between the solstices. The further deviation of 5 mm corresponds to maximum 2 s of difference from this ephemerides and the observed transits.
4.3. The Delay of Earth’s Rotation
The availability of the measurements from 2018, with exactly the same setup (the same pinhole, in the same position) allows us to make a comparison in the absolute transit times and the ephemerides (IMCCE, Calsky, Stellarium 0.20.2). Since the delay of the Earth’s rotation from October 2018 to February 2021 did not exceed 0.3 s, we do not see appreciable differences in the delay between ephemerides and observed transits. In 2009, after the introduction of a leap second at the end of the year, this time shift was correctly observed.
5. The Orbit of the Earth and the Meridian Line
The motion of the Earth acts on the positions of the Sun, which appears to circulate around the Earth, and it is natural to use a circular orbit to represent it. The constant angular velocity does not account for the variations of the equation of time, and since some centuries before Christ an eccentric orbit was used for the Sun. The orbit is traced at constant velocity, but the Earth is not at its center, and this produces, along with the obliquity, a varying equation of time. This was the solar theory of Ptolemy in the book 3 of the Almagest.
5.1. Zodiacal Signs
The zodiacal sign are 12 equal parts of this circular orbit, which happens to be encompassed in different time intervals: the Capricorn is the shorter one (see Section 3.3 for our 2020–2021 measurements) because there it includes the perihelion, and the Cancer is the longer one for containing the aphelion. Each sign is related to the true obliquity ε and to the ecliptic longitude by the same trigonometric formula senδ = senε·senλ with λ = 0°, ±30°, ±60°, ±90°; its position depends on the epoch of the observation. The value of the obliquity of 1701 is fixed on the meridian line to all signs but the equinoxes, which remain unperturbed by the obliquity.
The author of the zodiacal signs was Francesco Tedeschi, who replicated the maps of Johannes Bayer (1703) with marble tarsie and brass star dimensioned according to their magnitudes. The zodiacal signs’ locations (see Figure 5 for the Aquarius tile) are computed according to the true obliquity ε of 1701.
5.2. Earth’s Orbit Eccentricity and Consequences on the Earth’s Climate
The ellipticity of Earth’s orbit changes with the time because of the attraction of the other planets. This parameter can be monitored at the Clementine Gnomon by knowing the “anni cardines” timing.
The Ptolemaic eccentricity is the distance, normalized to 1, between Earth’s center and the solar circular orbit’s center. This value, by definition, is twice the eccentricity of the Keplerian ellipse of the Earth’s orbit.
This is why we had Earth’s eccentricity observed values already two millennia ago. This is important in celestial mechanics as well as in climate studies, because a change in eccentricity, in the apsis line, and the variations of the obliquity acts on Earth’s climate (Milankovitch theory). From relatively hot winters (at perihelion) for the northern hemisphere, the opposite situation is reached in about 5000 years with cold winters (in aphelion) delaying the melting of the snow and maintaining a high planetary albedo.
6. Conclusions
The study on the meridian line of s. Maria degli Angeli, the Clementine Gnomon, made by Francesco Bianchini in from 1701 to 1702 and dedicated to the pope Clement XI (1700–1721), is based upon real observations of the Sun.
The first geometrical results have been the inclination of the great line with respect to the true north between the solstices of 5′11″ eastward. The smaller “boreal” meridian is about 2′ eastwards, more precise than the larger one. This boreal line was traced at least three months before the Cardinal Gianfrancesco Albani was elected pope (23 November 1700), in order to have the north–south direction ready for 1–8 January 1701 when Bianchini measured the latitude by means of upper and lower transit of the Polaris.
Francesco Bianchini and the ancient astronomers (Celsius and Boscovich are documented) used the meridian line, combining the timing of the Sun those of the stars, both observed at the meridian line. Nowadays, we can observe only the Sun, and rely on the accurate calibration of the meridian line (exact altitude of the pinhole, exact distance from the pinhole vertical projection).
Moreover, a new pinhole was adapted to the meridian line on 27 October 2018, with a 25 mm diameter, and a thickness of 6.11 mm, which produces a meridian shadow variable with the season. The total length of the meridian line from the pinhole base to the end is 44,916.9 mm and the height is 20,353.44 mm, confirmed by the 16 data of the solstice in Capricorn of 2020 from 7 December to 4 January.
The positions of the markers on the meridian line from #37 to #220 have been measured with a total station in November 2018 within a millimeter of accuracy. These new measurements completed the calibration with astronomical observations, and the reference ephemerides were Ephemvga (1992), Calsky (a website working up to end 2020), and Stellarium 0.20.2 (from 2020 on). This project was named IGEA after Informatized Geometric Ephemerides for Astrometry. All observations around the winter solstice 2020 are within 10″ from the ephemerides, and the refraction’s effects are dominated by air turbulence.
With the data of the 2020 winter solstice, treated in a parabolic fit, the present value of the obliquity has been used to recover the fine adjustments to the pinhole’s position and complete the calibration. The accuracy to the nearest arcsecond for the obliquity ε has been possible because each meridian transit has been obtained as the result of an average, to limit the air turbulence effect, and this stated a precision of 1 mm for each transit, and the parabolic fit improved this accuracy to 1/√N, where N is the number of days of observations. With 15 days of observations, an accuracy of ¼ mm, or 0.5″ is possible, and this was effectively verified measuring the true obliquity of ε = 23°26′12.9″ on 21 December 2020.
The instant of the estimated solstice by a parabolic fit is affected by the asymmetry introduced by the perihelion, occurring 12 days after the winter solstice. This is why this instant has been estimated by 25 min of defect with the minimum of the parabola, despite of a statistic σ = 4 min.
The study on the ingress in Sagittarius/Aquarius, calculated by linear interpolation between the nearest meridian transits, confirmed the 10 min errorbar published by Bianchini (1703, [1]) for the time determinations of the Earth’s orbit cardines.
Bianchini affirmed to obtain in the timing of the “anni cardines” an accuracy within a few minutes with the Clementine Gnomon, fully working with Sun and fixed stars. We were able to obtain a similar accuracy using only the positions of the Sun, eliminating the problem of the meridian Eastward deviation. The systematic error obtained in November and January is of the same magnitude for the ingresses into Sagittarius and Aquarius.
The published measurements show how to obtain an angular accuracy of 1 arcsec over a range of 47° (difference in meridian altitude from winter to summer), which corresponds to a relative accuracy of 1 part over 170,000.
General Relativity was born from the side of positional astronomy (e.g., Mercury’s perihelion precession), we are using the instrument where positional astronomy reached the maximum accuracy for the “solar theory” after Giandomenico Cassini (1655) and before Urbain Joseph Leverrier (1875) and Simon Newcomb.
Stellar aberration (the first special relativistic effect) has affected the measures made by Francesco Bianchini (1662–1729) at this meridian line for the latitude (1701 Polaris’ aberration) and the seasonal meridian positions of Sirius (1702–3) and in the timings of “anni cardines”: the solstices and the equinoxes of 1703 (difference between Sirius’ and constant solar aberration). The times for the identification of the effect were about to come (1727, James Bradley): the great Gnomon was affected by systematic errors difficult to be “self” detected; our work has solved this problem.
Acknowledgments
The author thanks don Franco Cutrone, pastor of the Basilica of Santa Maria degli Angeli e dei Martiri in Rome, and Professors Paola Spera and Giuseppe Cultrera of the Institute Federico Caffè - Galileo Ferraris of Rome. The project IGEA is dedicated to Igea Contessa (27.X.1918-9.12.2008) in her centennial, 27.X.2018, starting date of this astrometric campaign at the Clementine Gnomon.
References
- Bianchini, F. De Nummo et Gnomone Clementino; Typis Aloysii et Francisci de Comitibus Impressorum Cameralium: Romae, Italy, 1703. [Google Scholar]
- Sigismondi, C. Lo Gnomone Clementino Astronomia Meridiana in Basilica. Gerbertus 2014, 7, 1–78. [Google Scholar]
- Sigismondi, C. Stellar and Solar Positions in 1701-1703 Observed by Francesco Bianchini at the Clementine Meridian Line in the Basilica of Santa Maria degli Angeli in Rome, and Its Calibration Curve. 2008. Available online: https://ui.adsabs.harvard.edu/abs/2008mgm..conf.2470S/abstract (accessed on 19 July 2021).
- Available online: https://www.isprambiente.gov.it/it/attivita/museo/collezioni-litomineralogiche/lito-reperti/marmo-imetto (accessed on 19 July 2021).
- Catamo, M.; Lucarini, C. Il Cielo in Basilica; Arpa Agami: Roma, Italy, 2012. [Google Scholar]
Figure 1.
The Celestial North Pole is elevated over the horizon of 41°54′30″, on the yellow marble tarsia. The vertical brass line is the boreal gnomon [1,2].

Figure 2.
Meridian observations of Sirius (in blue) by Francesco Bianchini at the Clementine Gnomon, also in daylight (from March to September) compared with the stellar aberration on declination calculated in the same dates (in red). The original table of observations published by Bianchini [1] (p. 45) is reproduced on the left side with the original typeset.

Figure 3.
The southern limb of the Sun over 220 mark of the meridian line on 21 December 2020. The reddish penumbra is 5-mm thick, and the limb is darkened. On the right side, a paper meter with cm and mm marks is visible.
Figure 3.
The southern limb of the Sun over 220 mark of the meridian line on 21 December 2020. The reddish penumbra is 5-mm thick, and the limb is darkened. On the right side, a paper meter with cm and mm marks is visible.

Figure 4.
Shifting of the effective pinhole along the meridian line (left North, right South), and the shadow’s effect of the cylinder.
Figure 4.
Shifting of the effective pinhole along the meridian line (left North, right South), and the shadow’s effect of the cylinder.

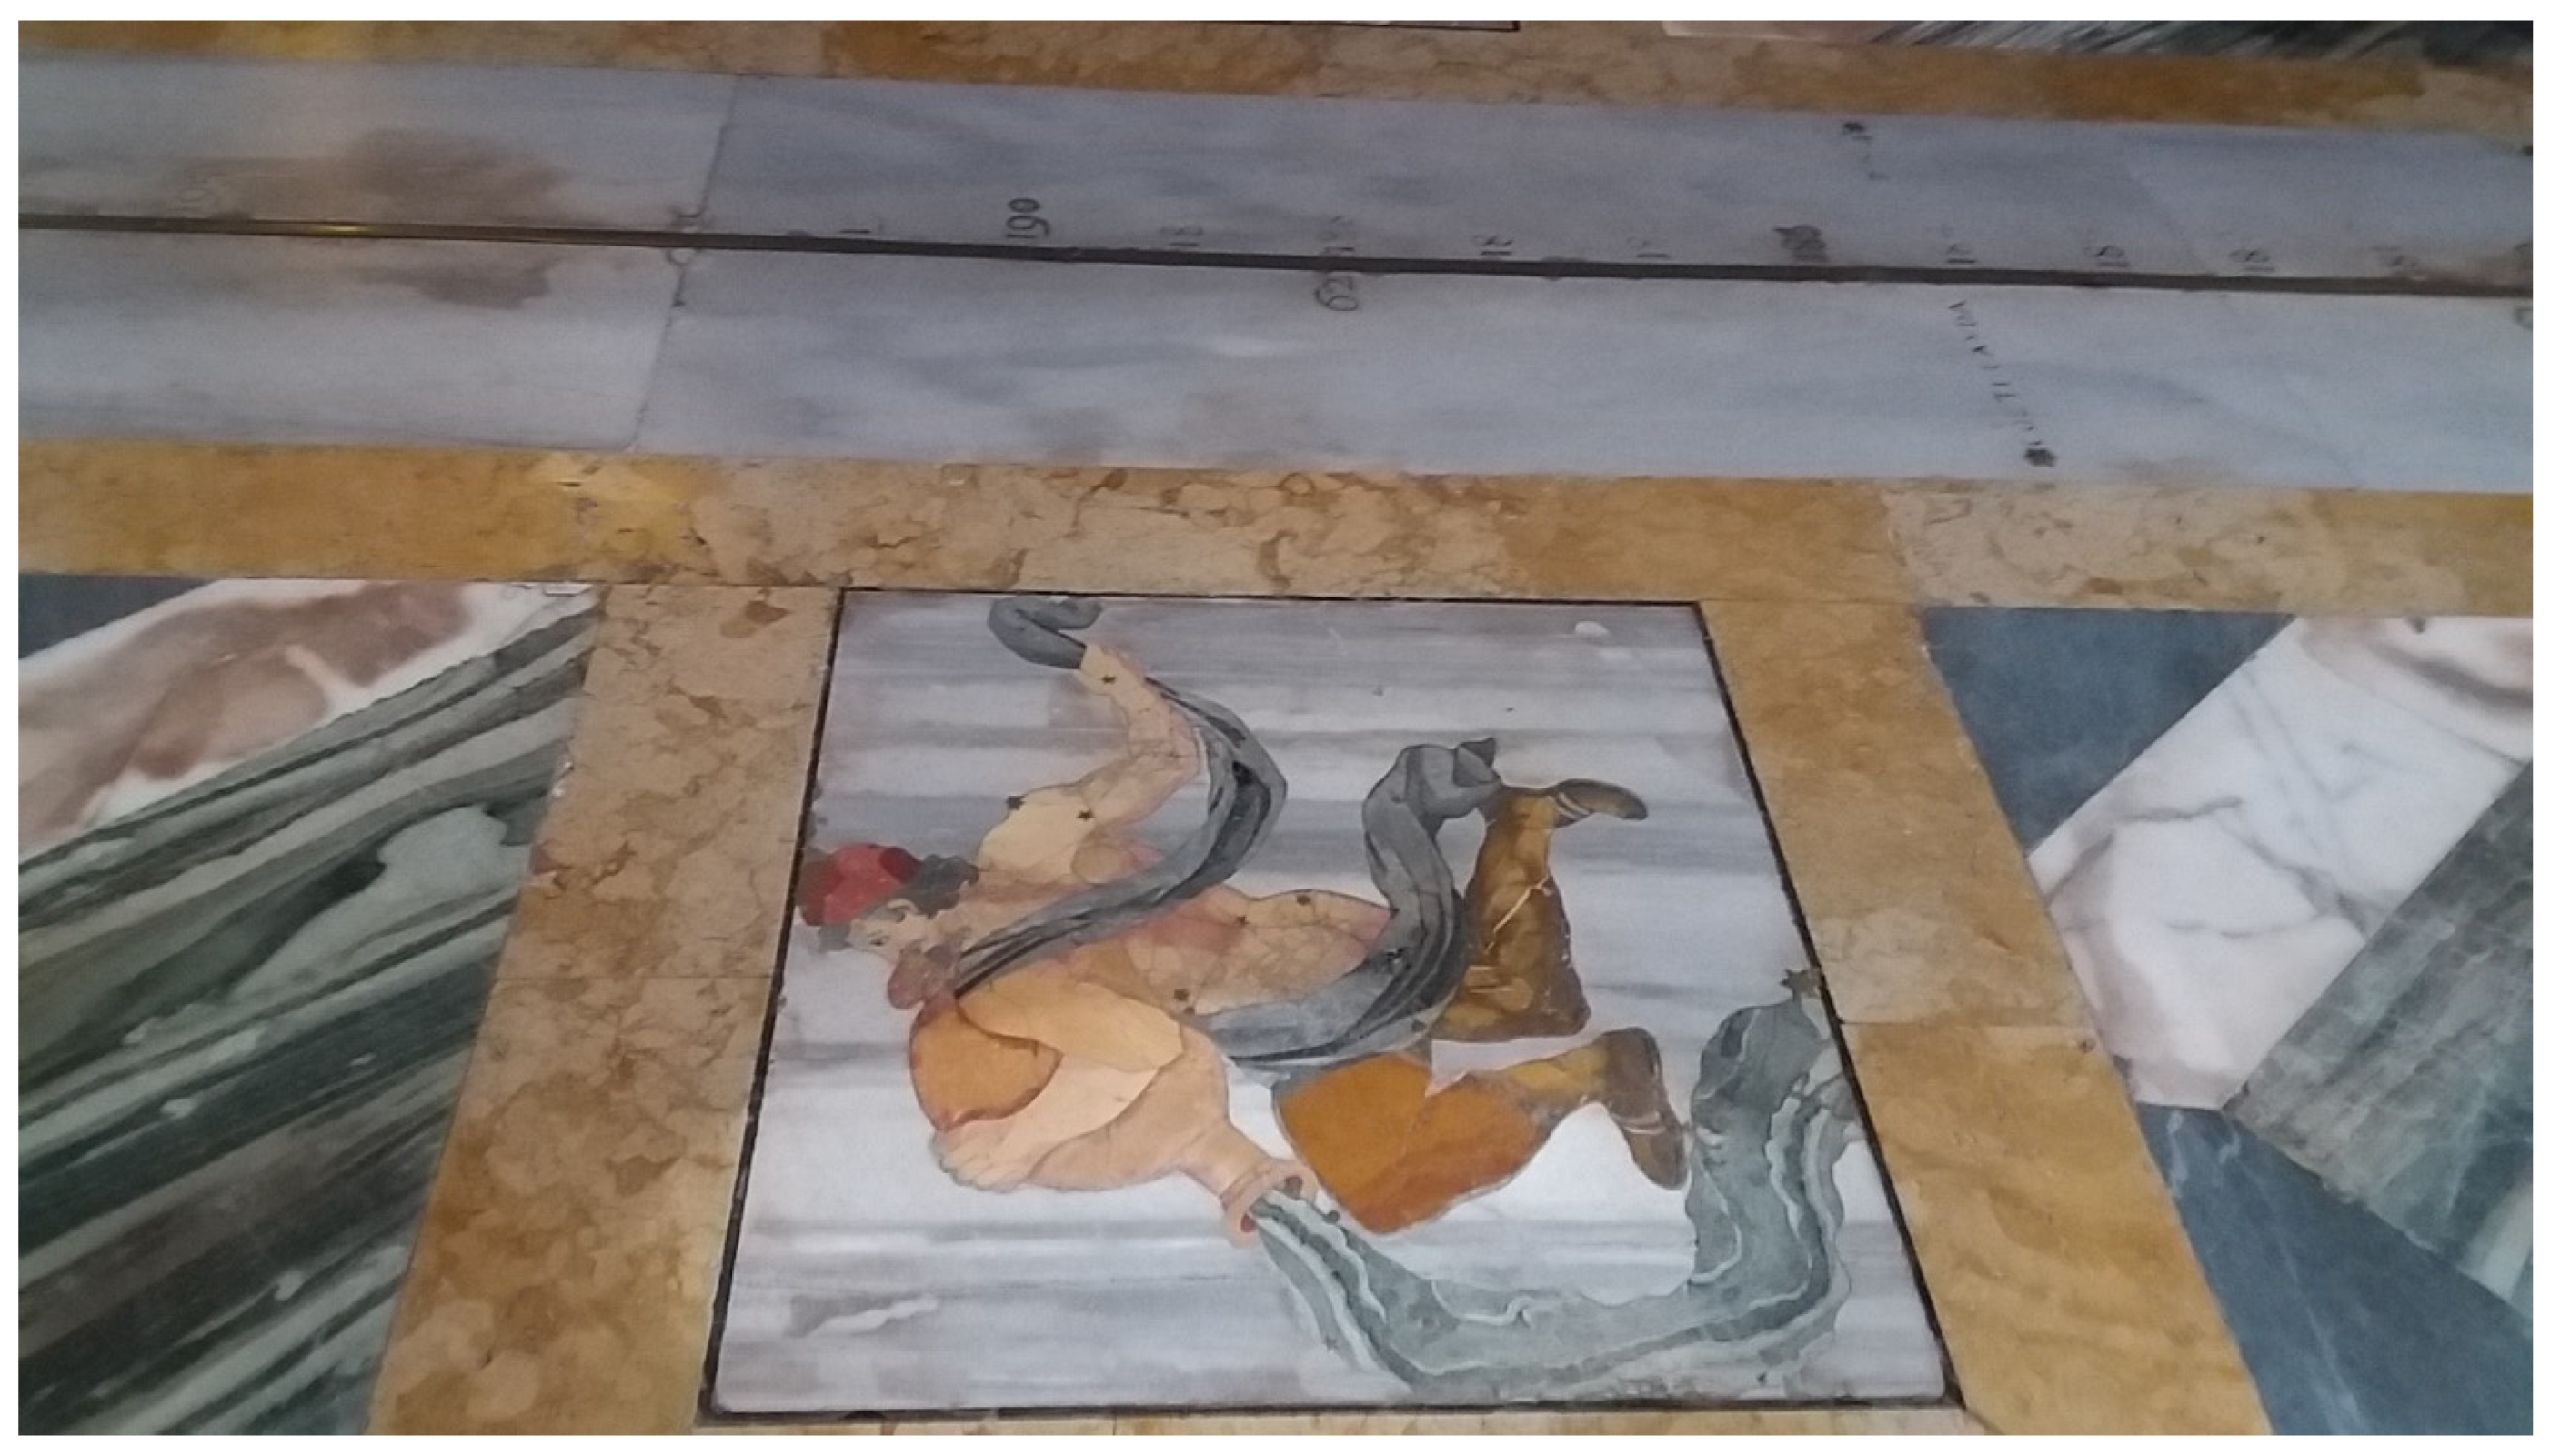
Figure 5.
The image of the Sun entering the Aquarius tile on 19 January 2021.


Table 1.
Southern and northern solar limb’s positions on the meridian line, measured from its end.
| Date (December 2020) | Southern Limb (mm) | Northern Limb (mm) |
|---|---|---|
| 7.50138 | 1618 | 2661 |
| 10.50232 | 1041 | 2111 |
| 11.50263 | 879.5 | 1953 |
| 13.50329 | 595 | 1687 |
| 14.50362 | 478 | 1570.5 |
| 17.50463 | 220 | 1318 |
| 18.50498 | 167 | 1265.5 |
| 19.50533 | 129 | 1228 |
| 20.50566 | 102 | 1208 |
| 21.50601 | 93 | 1199 |
| 24.50706 | 174.5 | 1268 |
| 27.50808 | 408 | 1483 |
| 29.50876 | 611 | 1701 |
| 31.50940 | 901 | 1973 |
| 35.51070 | 1640 | 2689.5 |
Table 2.
Symmetrical passages into Sagittarius and Aquarius: meridian positions of the solar limbs measured from the end of the line. The declination of the ingress in these zodiacal signs is in 2020/1 −20°08′57.8″ or h = 27°58′44.1″. The positions of the signs are computed for 20,353.44 mm of pinhole’s height and a meridian line of 44,916.9 mm of length.
| Date | Southern Limb [mm] | Northern Limb [mm] |
|---|---|---|
| 21 November 2020 11:56:17.0 | 6301 | 7172.5 |
| 22 November 2020 11:56:35.0 | 5949 | 6834 |
| Capricorn/Aquarius Scorpius/Sagittarius | 6619,53 | |
| 18 January 2021 12:20:49 1 | 5668 | 6576 |
| 19 January 2021 12:21:08 1 | 6018.5 | 6903.5 |
1 Solar limbs measured from a photo taken by Heike Baranowsky on the meridian line.
Publisher’s Note: MDPI stays neutral with regard to jurisdictional claims in published maps and institutional affiliations. |
© 2021 by the author. Licensee MDPI, Basel, Switzerland. This article is an open access article distributed under the terms and conditions of the Creative Commons Attribution (CC BY) license (https://creativecommons.org/licenses/by/4.0/).
Share and Cite
MDPI and ACS Style
Sigismondi, C. Earth’s Obliquity and Stellar Aberration Detected at the Clementine Gnomon (Rome, 1703). Phys. Sci. Forum 2021, 2, 49. https://doi.org/10.3390/ECU2021-09323
AMA Style
Sigismondi C. Earth’s Obliquity and Stellar Aberration Detected at the Clementine Gnomon (Rome, 1703). Physical Sciences Forum. 2021; 2(1):49. https://doi.org/10.3390/ECU2021-09323
Chicago/Turabian StyleSigismondi, Costantino. 2021. "Earth’s Obliquity and Stellar Aberration Detected at the Clementine Gnomon (Rome, 1703)" Physical Sciences Forum 2, no. 1: 49. https://doi.org/10.3390/ECU2021-09323