Breath Sounds as a Biomarker for Screening Infectious Lung Diseases †

Physical Science Research Area, TCS Research, 54B, Hadapsar Industrial Estate, Pune 411013, India
*
Author to whom correspondence should be addressed.
†
Presented at the 7th International Electronic Conference on Sensors and Applications, 15–30 November 2020; Available online: https://ecsa-7.sciforum.net/.
Eng. Proc. 2020, 2(1), 65; https://doi.org/10.3390/ecsa-7-08200
Published: 14 November 2020
(This article belongs to the Proceedings of 7th International Electronic Conference on Sensors and Applications)
Abstract
:Periodic monitoring of breath sounds is essential for early screening of obstructive upper respiratory tract infections, such as inflammation of the airway typically caused by viruses. As an immediate first step, there is a need to detect abnormalities in breath sounds. The adult average male lung capacity is approximately 6 liters and the manifestation of pulmonary diseases, unfortunately, remains undetected until their advanced stages when the disease manifests into severe conditions. Additionally, such rapidly progressing conditions, which arise due to viral infections that need to be detected via adventitious breath sounds to take immediate therapeutic action, demand frequent monitoring. These tests are usually conducted by a trained physician by means of a stethoscope, which requires an in-person visit to the hospital. During a pandemic situation such as COVID-19, it is difficult to provide periodic screening of large volumes of people with the existing medical infrastructure. Fortunately, smartphones are ubiquitous, and even developing countries with skewed doctor-to-patient ratios typically have a smartphone in every household. With this technology accessibility in mind, we present a smartphone-based solution that monitors breath sounds from the user via the in-built microphone of their smartphone and our Artificial Intelligence (AI) -based anomaly detection engine. The presented automated classifier for abnormal breathing sounds is able to detect abnormalities in the early stages of respiratory dysfunctions with respect to their individual normal baseline vesicular breath sounds, with an accuracy of 95%, and it can flag them, and thus enhances the possibility of early detection.
1. Introduction
In humans, the respiratory system consists of the respiratory muscles, the lungs, and the airways. Breath sounds are the sounds produced by the structures of the lungs during breathing. The exchange of air between the atmosphere and the lungs (inspiration) and vice-versa (expiration) generates these breathing sounds. Breathing sounds are broadly classified as normal and abnormal breathing sounds. Normal breathing sounds can be loud, high pitched sounds heard over the trachea, medium pitched bronchovesicular sounds heard over the mainstream bronchi and soft, low pitched vesicular sounds heard over the chest. The most common types of abnormal breathing sounds are crackles, wheezes, rhonchi, and stridor [1]. Each of these abnormal breathing sounds can be a symptom of some serious respiratory diseases. Therefore, listening to breath sounds is an important part of early diagnosis. In this paper, we present an automated detection of anomalies in breath sounds using a smartphone [2,3] with nearly 95% accuracy against the user’s normal baseline and it offers a personalized report and trend of the results. In [1], measuring lung function is achieved by calculating the exhaled flow rate from the smartphone microphone. In [4], sequence classification models such as Hidden Markov Model (HMM) and Long Short-Term Memory (LSTM) variations are used to identify breath cycles followed by feedback. In [5], respiratory sounds are classified using adaptive neuro-fuzzy inference systems and artificial neural networks using the power spectrum density PSD as a feature. In [6], automation of lung analysis is carried out using time and frequency domain features such as variance, sum of moving average, spectrum mean, etc. In [7], the features of the Mel Frequency Cepstral Coefficients (MFCC) are analyzed using one-way ANOVA and are fed to some classification algorithms. In [8], spectral and wavelet features are used with various classification algorithms. In [9], Mel frequency analysis of breathing sounds is achieved with pattern recognition techniques to separate the breathing phases, to estimate the lung volume, and detect the presence of COVID-19.
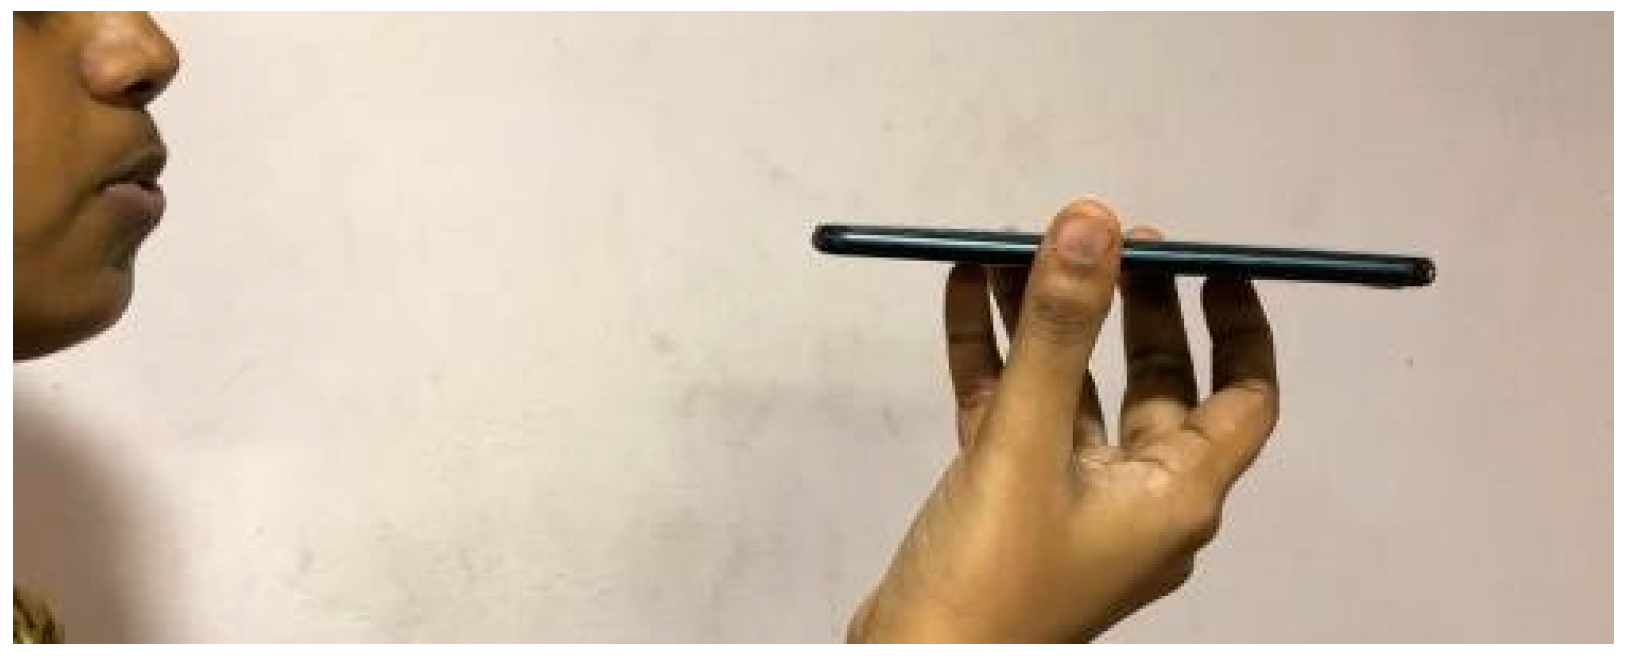
In this paper, we have made use of a sound sensor in a smartphone without requiring any external sensors as shown in Figure 1. The sounds acquired are analyzed using various machine learning as well as deep learning algorithms.
2. Methodology
The flowchart of the steps used in this paper is represented in Figure 2.
2.1. Breath Detector
The data used for the breath detector are collected from various sources, including the Environmental Sound Classification (ESC-50) dataset [10]. The ESC-50 dataset is a publicly available dataset that provides a huge collection of speech and environmental sounds. This collection of sounds is categorized into 50 classes, one of them being breath sounds. We have used 592 breath sounds and 592 other environmental sounds to train our breath detector. As a pre-processing step, normalization is performed on the signals to remove sharp or sudden changes. Further, to remove background noise, the signals were filtered using a band-pass filter with a frequency range of 100–2500 Hz. We calculated the Mel Frequency Cepstral Coefficients (MFCC) for audio samples. For the feature vector, we took the mean of the MFCC features corresponding to all the frames [6], the feature vector is fed as input to the breath detector, which uses 3 different machine learning algorithms, which are Random Forest (RF), Logistic Regression (LR) and K-Nearest Neighbors (KNN) for binary classification.
We selected the final class label by majority voting on the predictions of all the 3 models.
2.2. Anomaly Detection Engine
The diagnosis engine gives the final result to the users—whether they have normal or labored breathing. The data for normal and abnormal breathing sounds are collected from various data sources e.g., RALE database [11]. At the time of writing the paper, we had 295 normal and 295 abnormal sounds.
2.2.1. Machine Learning-Based Classifiers
The audio samples were pre-processed and by applying fast Fourier transform (FFT), we calculated the power spectrum density (PSD) of the data set. Since the PSD has excessive data points, we decided to divide the PSD of each signal into 32 segments for which the individual averaged PSD is calculated. These 32 averaged values along with MFCCs make up the feature vector [5]. The feature vector is fed to 5 different learning algorithms [12], which are Artificial Neural Networks (ANN), Support Vector Machines (SVM), Random Forest (RF), Logistic Regression (LR), and K- Nearest Neighbors (KNN) for classification into normal and labored breathing sounds [7]. The final class label is obtained by majority voting.
2.2.2. Convolutional Neural Network
The audio signals are pre-processed, and spectrogram images are generated using FFT ([8,12]). The images are resized into 28 × 28 grayscale images. The images are passed into the Convolutional Neural Network (CNN) for classification ([13,14]). The images are passed to two convolutional layers consisting of 32 filters and 3 × 3 kernel size with a 2 × 2 max-pooling layer in between to learn the complex features, which are then passed to another 2 × 2 max-pooling to represent the learned features in lower dimensions. The image is flattened to 1 dimension and then passed to a fully connected layer with 128 neurons. The final layer is the softmax classification layer with 2 neurons to distinguish between normal and labored sounds. Rectified Linear Unit (ReLU) activation function is used, and Adam is used as an optimizer.
2.2.3. Ensembled Convolutional Neural Network
We have used a form of ensembling that involves taking an average of the outputs of the models in the ensemble [15]. We have created two small CNNs and each model is trained separately on the training set of images and each is evaluated using the test set. The first CNN model is simple and similar to the one used in the above method. The second CNN model is a little more complex compared to the first. In this, we have used two sets of three convolution layers with 2 × 2 kernel size and filters of 32 and 64, respectively, which are followed by a max-pooling layer. Then, the images are passed to a convolution layer, which generates 2 feature maps followed by a global average pooling layer and a softmax classification. Further, we have put the two models in an ensemble for evaluation. The results depict that the ensemble performs better on a test set than a single model.
2.2.4. Gated Convolutional Recurrent Neural Network
The inspiration for this model comes from the work by [16]. The Gated Convolutional Recurrent Neural Network (Gated CRNN) model has two convolutional layers followed by a Gated Recurrent Unit (GRU). The models use a dropout of 0.1 and 0.3, respectively, and are finally followed by a sigmoid layer. This model requires lesser memory usage and is quite a lot faster than the other models since the GRU has relatively fewer parameters. Categorical cross-entropy is used as a loss function for this model.
3. Results
To evaluate the models, we have used the macro average of the performance metrics of accuracy, sensitivity/recall, precision, and F1-score on both the classes. These performance metrics are based on confusion matrices.
3.1. Breath Detector
The performance metrics of all the models we have used for breath detection are reported in Table 1.
3.2. Anomaly Detection Engine
The performance metrics for machine learning-based classifiers in the anomaly detection engine are reported in Table 2.
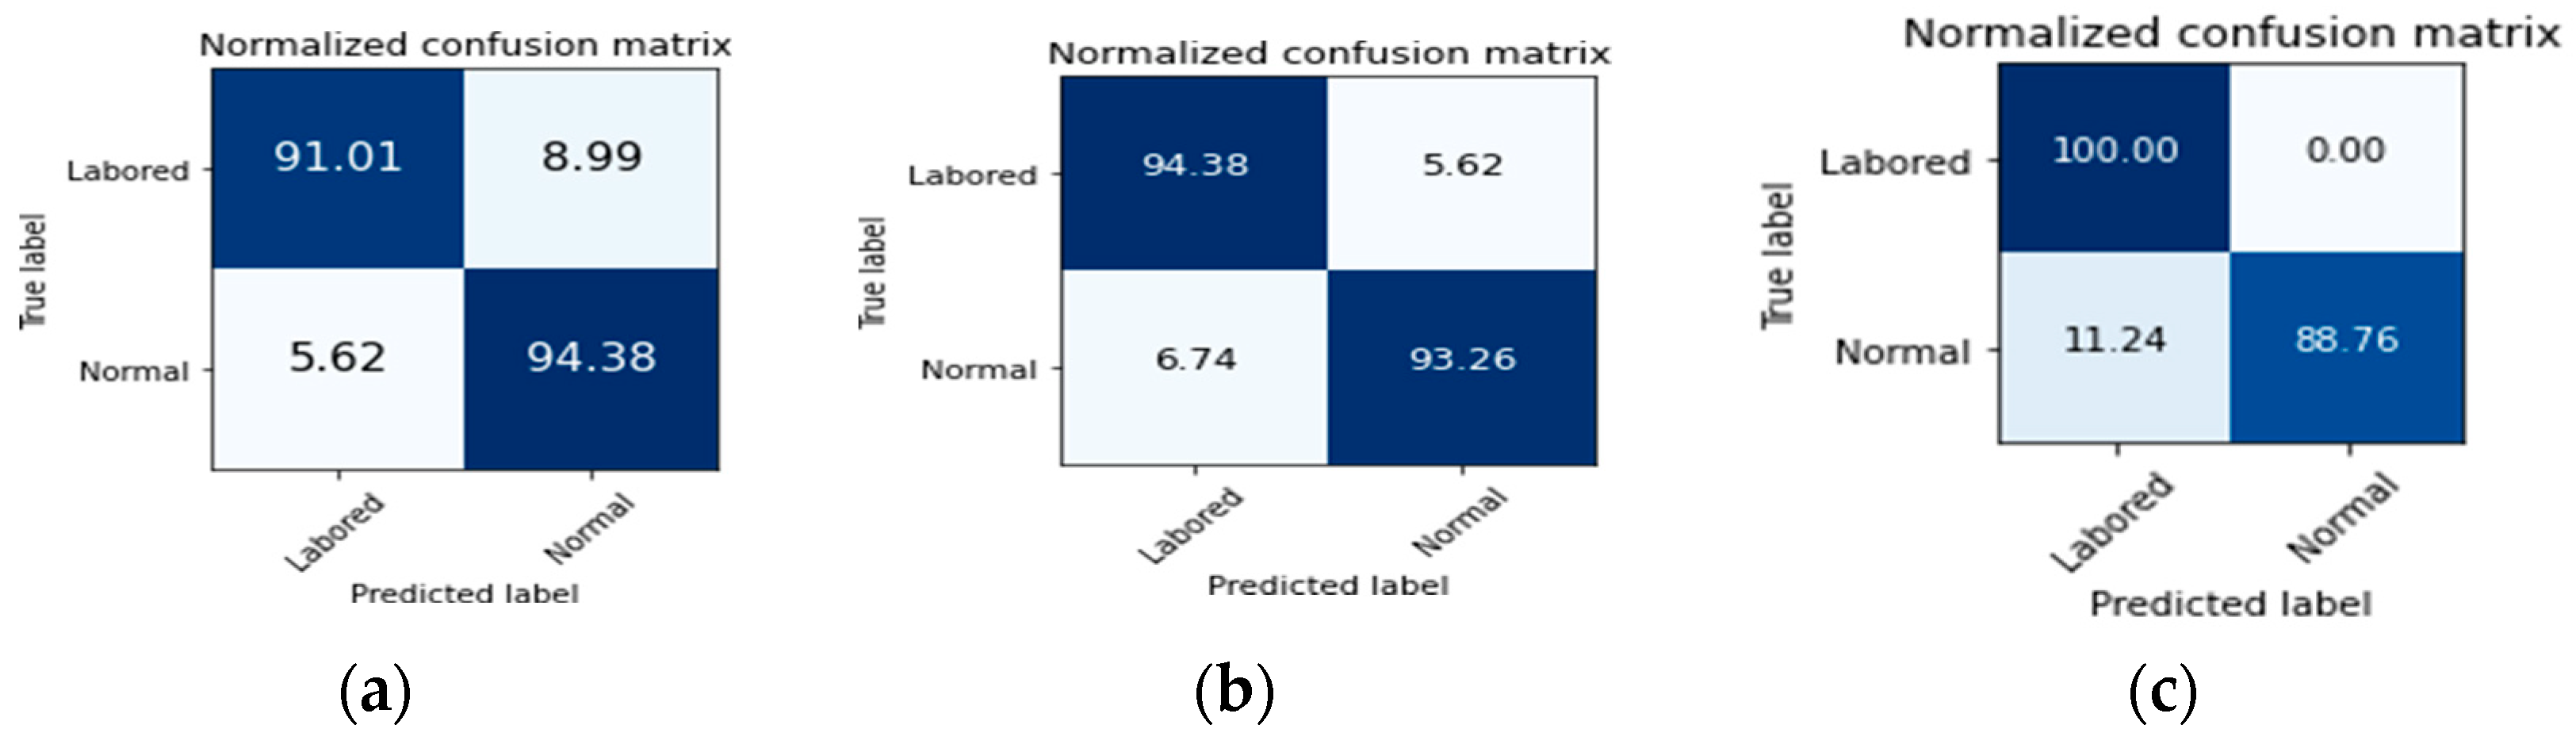
The confusion matrices for the CNN model, ensemble CNN model, and Gated CRNN model are reported in Figure 3. At the moment, with limited data available, the overall accuracy of the deep learning-based binary-class classifier is 94%. Future work will continue to improve this model as more training data become available.
4. Discussions
The presented solution can be further extended into a platform to aid the screening of various lung diseases based on breath sounds. A cloud-based implementation will allow the use of AI algorithms that necessitate greater computation. Additional patient data will further improve accuracy and specific detection.
5. Conclusions
In this paper, we present an AI-based tool for the detection of anomalies in breath sounds acquired via a smartphone with an accuracy of 95% via machine learning and deep learning techniques. This application can serve as an aid and an essential tool for early detection of anomalies in breath sounds ([17,18]), such as experienced in the recent pandemic situation caused by COVID-19.
Acknowledgments
This work was completed as part of an internship project at Tata Research and Development and Design Centre (TRDDC), Pune, India.
References
- Lung, J. Breath Sounds Study Guide: The Ultimate Guide to Lung Sounds and Auscultation, Self-published. 2020.
- Larson, E.C.; Goel, M.; Boriello, G.; Heltshe, S.; Rosenfeld, M.; Patel, S.N. SpiroSmart; Association for Computing Machinery (ACM): New York, NY, USA, 2012; Volume 280. [Google Scholar] [CrossRef]
- Cheng, Q.; Juen, J.; Bellam, S.; Fulara, N.; Close, D.; Silverstein, J.C.; Schatz, B. Predicting Pulmonary Function from Phone Sensors. Telemed. E-Health 2017, 23, 913–919. [Google Scholar] [CrossRef] [PubMed]
- Shih, C.-H.; Tomita, N.; Lukic, Y.; Reguera, Á.H.; Fleisch, E.; Kowatsch, T. Breeze: Smartphone-based Acoustic Real-time Detection of Breathing Phases for a Gamified Biofeedback Breathing Training. Proc. ACM Int. Mobile Wearable Ubiquitous Technol. 2019, 3, 1–30. [Google Scholar] [CrossRef]
- Oweis, R.J.; Abdulhay, E.W.; Khayal, A.; Awad, A. An alternative respiratory sounds classification system utilizing artificial neural networks. Biomed. J. 2015, 38, 153–161. [Google Scholar] [CrossRef] [PubMed]
- Morten, G. Automated Lung Sound Analysis. Arctic Univ. Norw. 2016, 16, 18. [Google Scholar]
- Palaniappan, R.; Sundaraj, K.; Ahamed, N.U. Machine learning in lung sound analysis: A systematic review. Biocybern. Biomed. Eng. 2013, 33, 129–135. [Google Scholar] [CrossRef]
- Datta, S.; Dutta Choudhury, A.; Deshpande, P.; Bhattacharya, S.; Pal, A. Automated lung sound analysis for detecting pulmonary abnormalities. Proc. Ann. Int. Conf. IEEE Eng. Med. Biol. Soc. EMBS 2017, 4594–4598. [Google Scholar] [CrossRef]
- Faezipour, M.; Abuzneid, A. Smartphone-Based Self-Testing of COVID-19 Using Breathing Sounds. Telemed. E-Health 2020. [Google Scholar] [CrossRef]
- Piczak, K.J. ESC: Dataset for environmental sound classification. In Proceedings of the 2015 ACM Multimedia Conference, Brisbane, Australia, 26–30 October 2015; pp. 1015–1018. [Google Scholar] [CrossRef]
- Dataset: RALE: A computer-assisted instructional package. Respir Care 1990, 35, 1006.
- Palaniappan, R.; Sundaraj, K.; Sundaraj, S. A comparative study of the svm and k-nn machine learning algorithms for the diagnosis of respiratory pathologies using pulmonary acoustic signals. BMC Bioinform. 2014, 15, 1–8. [Google Scholar] [CrossRef] [PubMed]
- Riella, R.J.; Nohama, P.; Maia, J.M. Departamento Method for automatic detection of wheezing in lung sounds. J. Med. Syst. 2012, 36, 1707–1717. [Google Scholar] [CrossRef]
- Aykanat, M.; Kılıç, Ö.; Kurt, B.; Saryal, S. Classification of lung sounds using convolutional neural networks. Eur. J. Image Video Proc. 2017, 2017. [Google Scholar] [CrossRef]
- Saraiva, A.A.; Santos, D.B.S.; Francisco, A.A.; Vigno, J.; Sousa, M. Classification of Respiratory Sounds with Convolutional Neural Network. In Proceedings of the 13th International Joint Conference on Biomedical Engineering Systems and Technologies, Valletta, Malta, 24–26 February 2020; Volume 3. [Google Scholar]
- Viswanath, V.; Garrison, J.; Patel, S. SpiroConfidence: Determining the Validity of Smartphone Based Spirometry Using Machine Learning. In Proceedings of the 2018 40th Annual International Conference of the IEEE Engineering in Medicine and Biology Society (EMBC), Honolulu, HI, USA, 17–21 July 2018; pp. 5499–5502. [Google Scholar] [CrossRef]
- Deshpande, P.; Vempada, R.; Dasgupta, R.; Pal, A.; Roy, D. Anomaly Detection System and Method. U.S. Patent 9,984,543, 29 May 2018. [Google Scholar]
- Detecting, M.F.O.R. Systems and Methods for Detecting Pulmonary Abnormalities Using Lung. U.S. Patent 20190008475, 10 January 2019. [Google Scholar]
Figure 1.
Shows a picture of a person recording her breath sounds by breathing into the smartphone’s microphone.
Figure 1.
Shows a picture of a person recording her breath sounds by breathing into the smartphone’s microphone.

Figure 2.
Flowchart of the steps used in this paper.

Figure 3.
Normalized confusion matrix for (a) CNN model; (b) ensemble CNN model; and (c) Gated CRNN model (in percentage).
Figure 3.
Normalized confusion matrix for (a) CNN model; (b) ensemble CNN model; and (c) Gated CRNN model (in percentage).


Table 1.
Performance metrics for breath detector.
| Model | Test Accuracy (%) | Precision (%) | Recall (%) |
|---|---|---|---|
| KNN | 99.39 | 98.00 | 99.00 |
| RF | 99.10 | 98.00 | 98.00 |
| LR | 98.79 | 98.00 | 98.00 |
Table 2.
Performance metrics for machine learning-based classifiers in the anomaly detection engine.
Table 2.
Performance metrics for machine learning-based classifiers in the anomaly detection engine.
| Model | Test Accuracy (%) | Precision (%) | Recall (%) |
|---|---|---|---|
| LR | 91.35 | 91.00 | 91.00 |
| SVM | 93.60 | 93.00 | 94.00 |
| ANN | 94.70 | 92.00 | 90.00 |
| RF | 91.01 | 92.00 | 90.00 |
| KNN | 91.50 | 92.00 | 90.00 |
Publisher’s Note: MDPI stays neutral with regard to jurisdictional claims in published maps and institutional affiliations. |
© 2020 by the authors. Licensee MDPI, Basel, Switzerland. This article is an open access article distributed under the terms and conditions of the Creative Commons Attribution (CC BY) license (https://creativecommons.org/licenses/by/4.0/).
Share and Cite
MDPI and ACS Style
Senthilnathan, H.; Deshpande, P.; Rai, B. Breath Sounds as a Biomarker for Screening Infectious Lung Diseases. Eng. Proc. 2020, 2, 65. https://doi.org/10.3390/ecsa-7-08200
AMA Style
Senthilnathan H, Deshpande P, Rai B. Breath Sounds as a Biomarker for Screening Infectious Lung Diseases. Engineering Proceedings. 2020; 2(1):65. https://doi.org/10.3390/ecsa-7-08200
Chicago/Turabian StyleSenthilnathan, Harini, Parijat Deshpande, and Beena Rai. 2020. "Breath Sounds as a Biomarker for Screening Infectious Lung Diseases" Engineering Proceedings 2, no. 1: 65. https://doi.org/10.3390/ecsa-7-08200