

Phytoplankton Diversity and Bioindication of the Lakes in the Burabay National Natural Park, Northern Kazakhstan


1
Institute of Evolution, University of Haifa, Mount Carmel, 199 Abba Khoushi Ave., Haifa 3498838, Israel
2
Institute of Zoology, Ministry of Science and Higher Education of the Republic of Kazakhstan, 93 Al Farabi Str., 050060 Almaty, Kazakhstan
3
Kazakh Agency of Applied Ecology, 42 Amangeldy Str., 050038 Almaty, Kazakhstan
*
Author to whom correspondence should be addressed.
Ecologies 2023, 4(2), 242-268; https://doi.org/10.3390/ecologies4020017
Submission received: 31 December 2022
/
Revised: 15 March 2023
/
Accepted: 21 March 2023
/
Published: 2 April 2023
(This article belongs to the Special Issue The Ecology of Rivers, Floodplains and Oxbow Lakes)
Abstract
:The problem of assessing the impact of pollution in protected areas prompted us to apply a combined method of bioindication and spatial mapping of phytoplankton data from six lakes in the Burabay National Nature Park in Northern Kazakhstan. The issue of monitoring planning was quite acute for this landscape-homogeneous area among the Kulunda steppes. Phytoplankton in each of the six lakes was collected in the summer season of 2019 at a total of 54 sampling stations. In total, 139 species of algae and cyanobacteria from seven taxonomic phyla were found in the phytoplankton of the Burabay Park during the study period. Three phyla were the richest in species: diatoms, green algae, and cyanobacteria. Based on species richness, abundance, and biomass, as well as bioindicators and calculated indices of organic pollution and toxic effects, the current ecological state of the lake was assessed as being under the influence of pollution, of the mesotrophic type and with a high capacity for self-purification. Statistical mapping, calculated by the correlation of the species composition and categories of indicators, revealed the zones of anthropogenic impact located on the shores of the lake, and the water of the lakes as weakly alkaline, quality classes 2–3. An increase in the number of cyanobacteria in coastal communities was revealed, which may be associated with an increase in the biogenic load on the lake ecosystems. The results of the analysis and mapping of indicators revealed that two major factors regulated phytoplankton: salinity and organic pollution. The sources of organic pollution are mostly associated with the intake of substances from the coastal zone, where resorts, roads, and settlements are located.
1. Introduction
The territory of Northern Kazakhstan is replete with small lakes. This region belongs to the forest-steppe climatic zone and is subject to the influence of both sharply continental climatic conditions and drying, which intensifies as forest lands are destroyed. The lakes in this part of Eurasia are important objects of nature protection, since they serve as sanctuaries for the protection of migratory birds. In addition, the lakes are used by the population of cities and towns for recreational purposes. The uniqueness of each of the lakes due to the wide salinity gradient is emphasized in several studies [1]. The use of lakes corresponds to their usefulness for the population, and recreational zones and balneological complexes are organized in the most accessible of them. Settlements are also concentrated close to the lakes. Thus, organic pollution and its impact on the ecosystems of these unique natural objects is an important object of monitoring and economic management [2].
To assess the trophic state and organic pollution by methods that use bioindicators, it is necessary to consider the complex nature of the variability of lake communities in the gradient of external factors. The easiest way to assess the impact of organic and toxic pollution on lakes, as such, and on the complex of lakes with their drainage basin is by using bioindication and statistics. To perform this, we took a complex of lakes in the Shchuchinsko-Borovsk Resort Zone [3]. This is a unique natural object; the complex consists of six lakes, equally subject to climatic influences, but with a gradient of organic pollution. The complex of lakes has landscape boundaries separating it from both settlements and other water bodies of the territory [4].
The Burabay National Natural Park unites on its territory six lakes located among the steppe landscape and Lake Borovoye, the most visited among them [5]. This lake system is combined into one large landscape homogeneous complex located among the steppes of Northern Kazakhstan. The species richness and diversity of algae in the six protected lakes of this complex has not yet been studied in sufficient detail and with the same methods. However, the study of phytoplankton can bring conclusions that can be used not only in the monitoring of each specific lake in the system, but also to show vulnerabilities that are subject to excessive recreational and other anthropogenic pressure [6]. The lakes of the Burabay National Park were studied more in terms of the chemical composition of the waters than phytoplankton [2]. Studies of phytoplankton in connection with the chemical parameters of water by bioindicator methods have been presented so far only for Lake Borovoye [7]. Information on algae from other lakes was limited and, if available, only related to species composition.
We hypothesize that the distribution of hydrobiological and environmental data within the landscape and hydrologically distinct territory of the Burabay National Park can be studied using statistical mapping for the purpose of ecological assessment of this isolated landscape unit.
Thus, we were faced with the task of simultaneously taking phytoplankton samples during the period of maximum development at stations evenly located on the surface of each lake, determining the main chemical parameters of water, and studying the distribution of biological and chemical indicators over the territory of each lake and within the entire Burabay park complex using species composition, bioindication of key environmental variables, statistics, and ecological mapping.
2. Materials and Methods
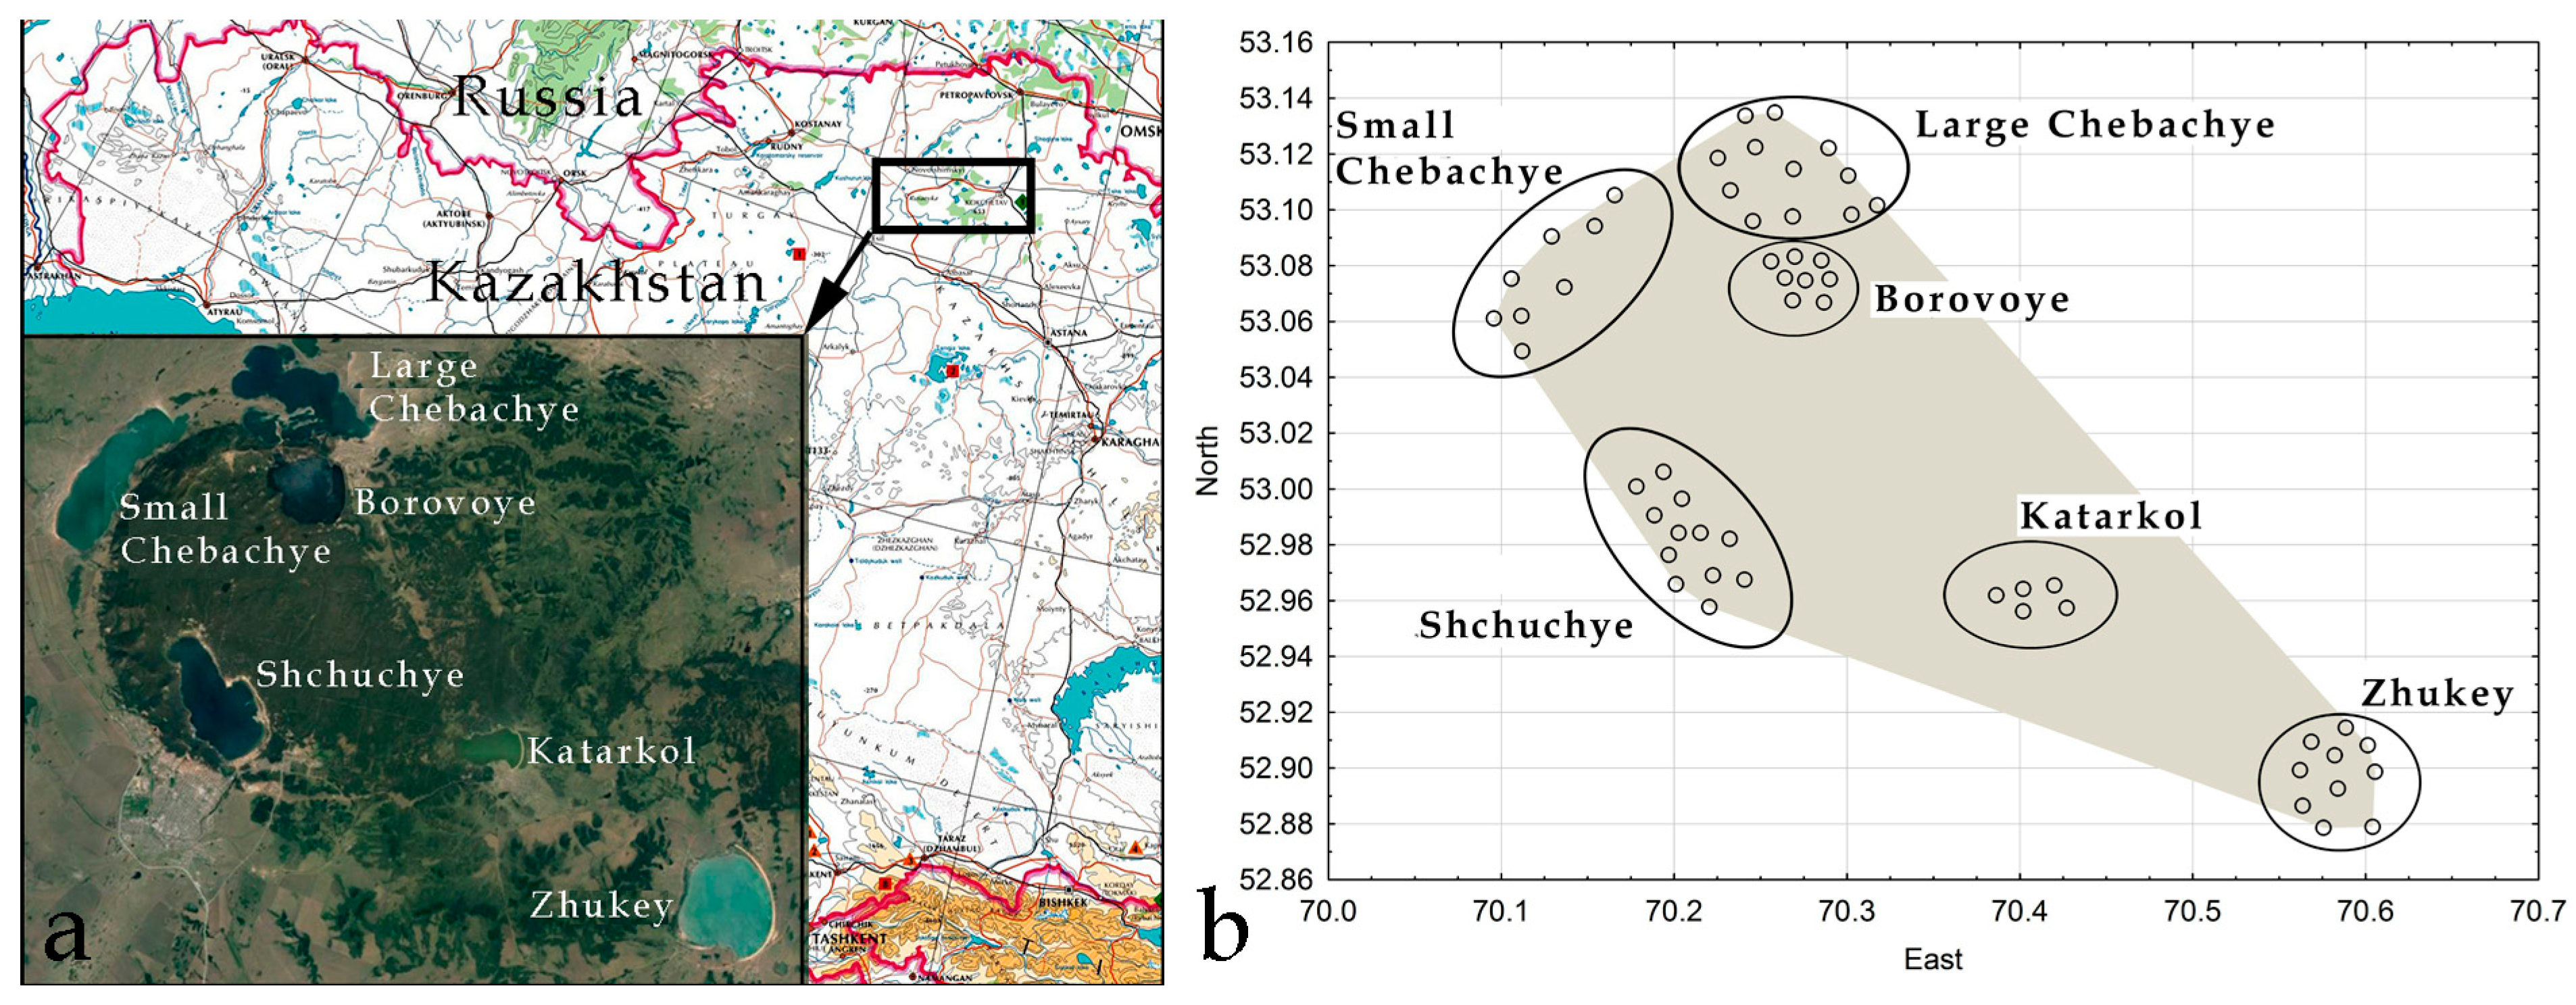
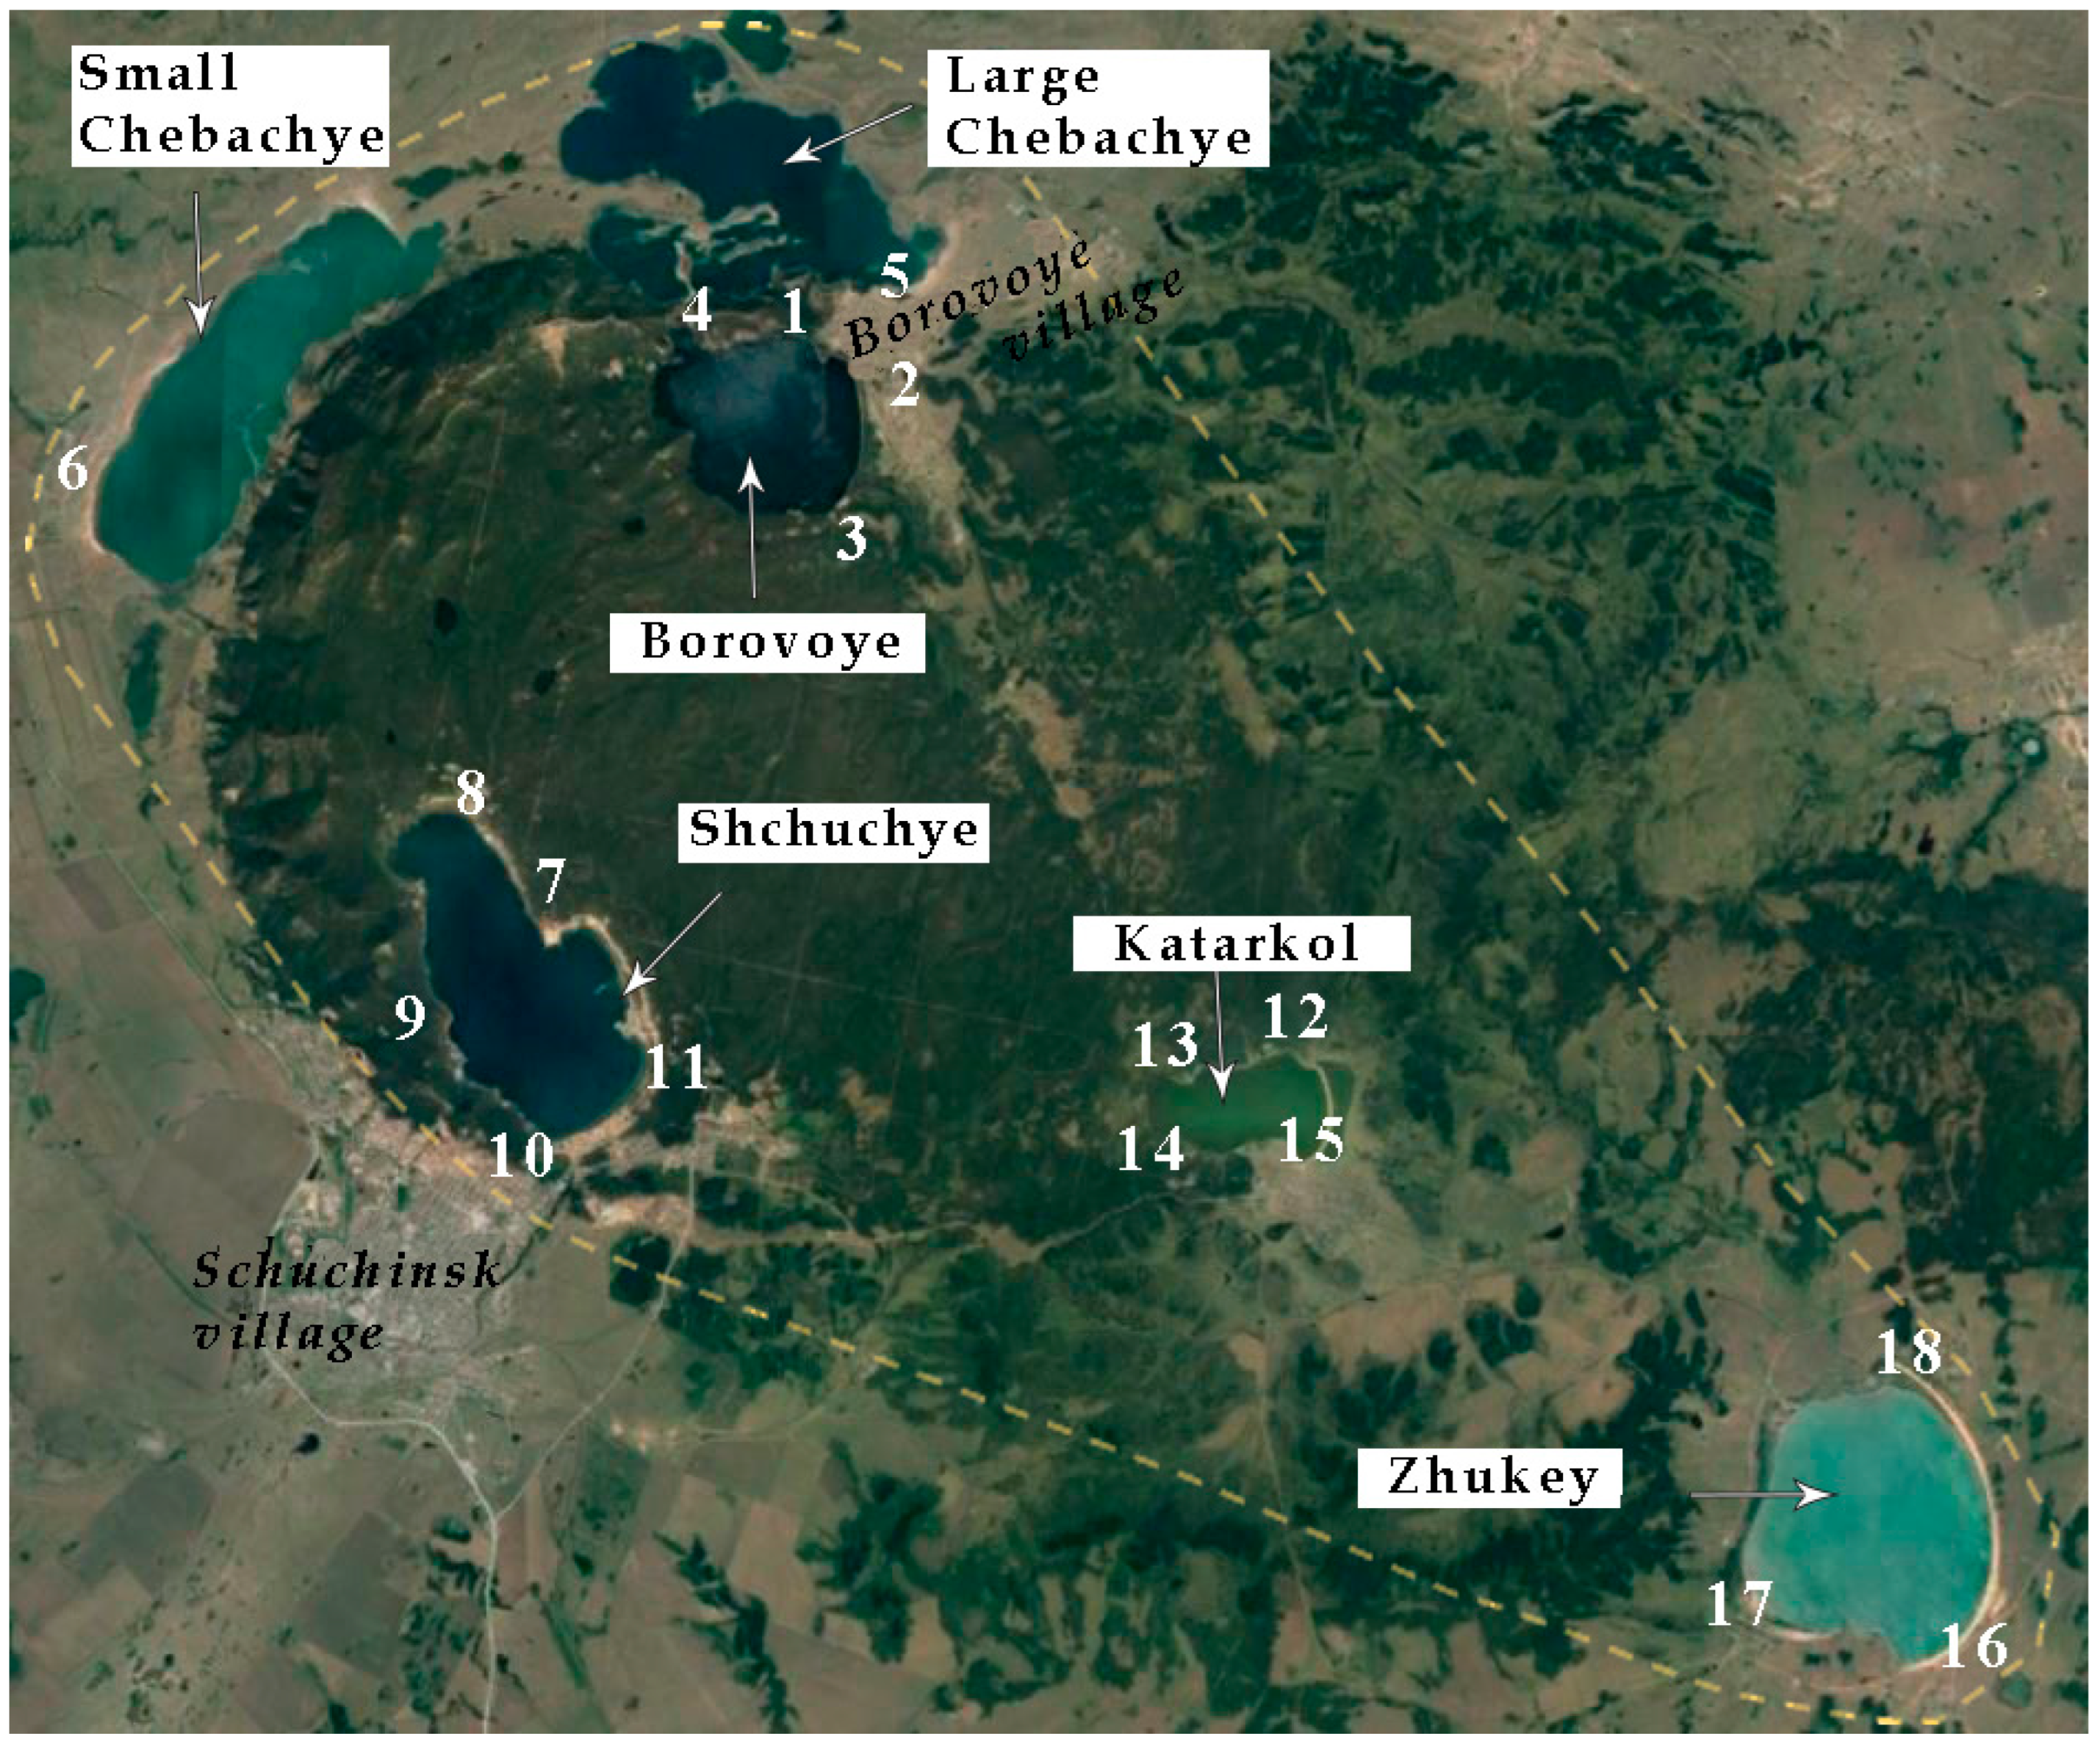
The lakes at the Burabay National Natural Park were examined in the summer season on 29 July 2019. Altogether, 54 sampling stations were defined for the monitoring of the lakes (Figure 1). Coordinate referencing of the stations was performed by a Garmin eTrex GPS navigator. Water 1-L samples of the surface layer in each station were taken for chemical analysis and transported to the lab in an icebox. The chemical analysis of carbonates, sulfates, chlorides, total hardness, total dissolved solids (TDS), easily oxidizable organic substances (PI), and nutrients was performed in the Kazakh Agency of Applied Ecology according to standard methods [8,9].
Phytoplankton samples were taken from the surface water layers into 1-L plastic containers, fixed in 3% neutral formaldehyde, and transported to the lab in an icebox. The sedimentary gravimetric method was used to process phytoplankton samples, with the final volume of the concentrated sample being 5–10 mL after 10–14 days of sedimentation [10,11]. Fixed phytoplankton samples were studied under light microscopes, Nikon Eclipse E200 (Nikon Instruments Inc., USA), with a magnification of ×100–×1000 in three repetitions from wet and permanent slides for diatoms [12]. Species identification was performed by using standard methods with relevant guides to the species identifications [13,14,15,16,17,18]. Modern taxonomy was adopted with algaebase.org [19]. Cell abundance was calculated as cell number of each species in 1 L of water in a Nageotte counting chamber (Hausser Scientific, Horsham, PA, USA) with 0.5 mm depth. Biomass was calculated from the volume of the cell shape for each species.
The Shannon diversity index [20] was calculated with the Primer 6 program using Equation (1):
where H is the Shannon index (bits/ind.), pi is the share of the i-th species in the total abundance, log2 is the logarithm to base 2, n is the number of species in the sample, and ∑ is the sum of values for the sample.
Index saprobity S was calculated for each algal community according to V. Sládeček [21] as a function of the number of saprobic species and their relative abundances and species-specific index saprobity using Equation (2):
where S is the index of saprobity for algal community (unitless), s is the species-specific saprobity index, and h is the cell density of each species in the phytoplankton sample.
Categorical groups according to Sládeček indicate the degree of self-purification of waters and correspond to species-specific indices of saprobity, which were used to calculate the number of species representing water quality classes and to conclude on self-purification of waters.
Bioindicator analysis was performed with species-specific ecological preferences of planktonic algae found at each sampling station for revealing influencing external factors, such as temperature, salinity, pH, oxygen conditions, organic pollution level, nutrition type, and trophic status of a water body [22,23] according bioindicator methods [24].
We calculated the WESI index [22,23,25] to assess the toxic pollution influence on the aquatic ecosystems using Equation (3):
WESI = Rank Index S/Rank N-NO3
The index values vary from 0 to 5. If the index values are less than 1, then the ecosystem is exposed to toxic pollution, which inhibits photosynthesis.
Statistical maps were built in the Statistica 12.0 software based on the GPS coordinates of sampling points for each biological and chemical variable. The calculation of similarity was performed as the network analyses in JASP on the bootnet package in R. The network graphs and Pearson correlation coefficients that JASP produces are based on the statistical software package R [26]. We used statistical mapping of the biological and hydrochemical indicators of lakes for the entire complex—an area landscape homogeneous and hydrologically separated from the surrounding steppes and representing a monolithic natural health object [6] that was successfully used for the spatial analysis of pollution sources [27,28]. As can be seen in Figure 1a, a zone of the lake complex and adjacent homogeneous landscape has been delineated. For this zone, maps of the distribution of biological and hydrochemical indicators were constructed. The application of species richness analysis, statistical methods, and a new approach to ecological mapping (Figure 1b) allows us to draw the following conclusions.
3. Results
3.1. Chemistry
Chemical analysis results (Table 1) show that the water quality in the lakes was sufficiently different. The first four lakes in the table formed a group of freshwater lakes, whereas Small Chebachye and Zhukey are sufficiently enriched by chlorides and sulfates with a maximal TDS of about 5 g L−1 and a total hardness of 30 mg-eq. L−1.
The content of dissolved substances in the studied lakes had a noticeable amplitude (Table 1), with a higher content of chlorides in the lakes Small Chebachye and Zhukey.
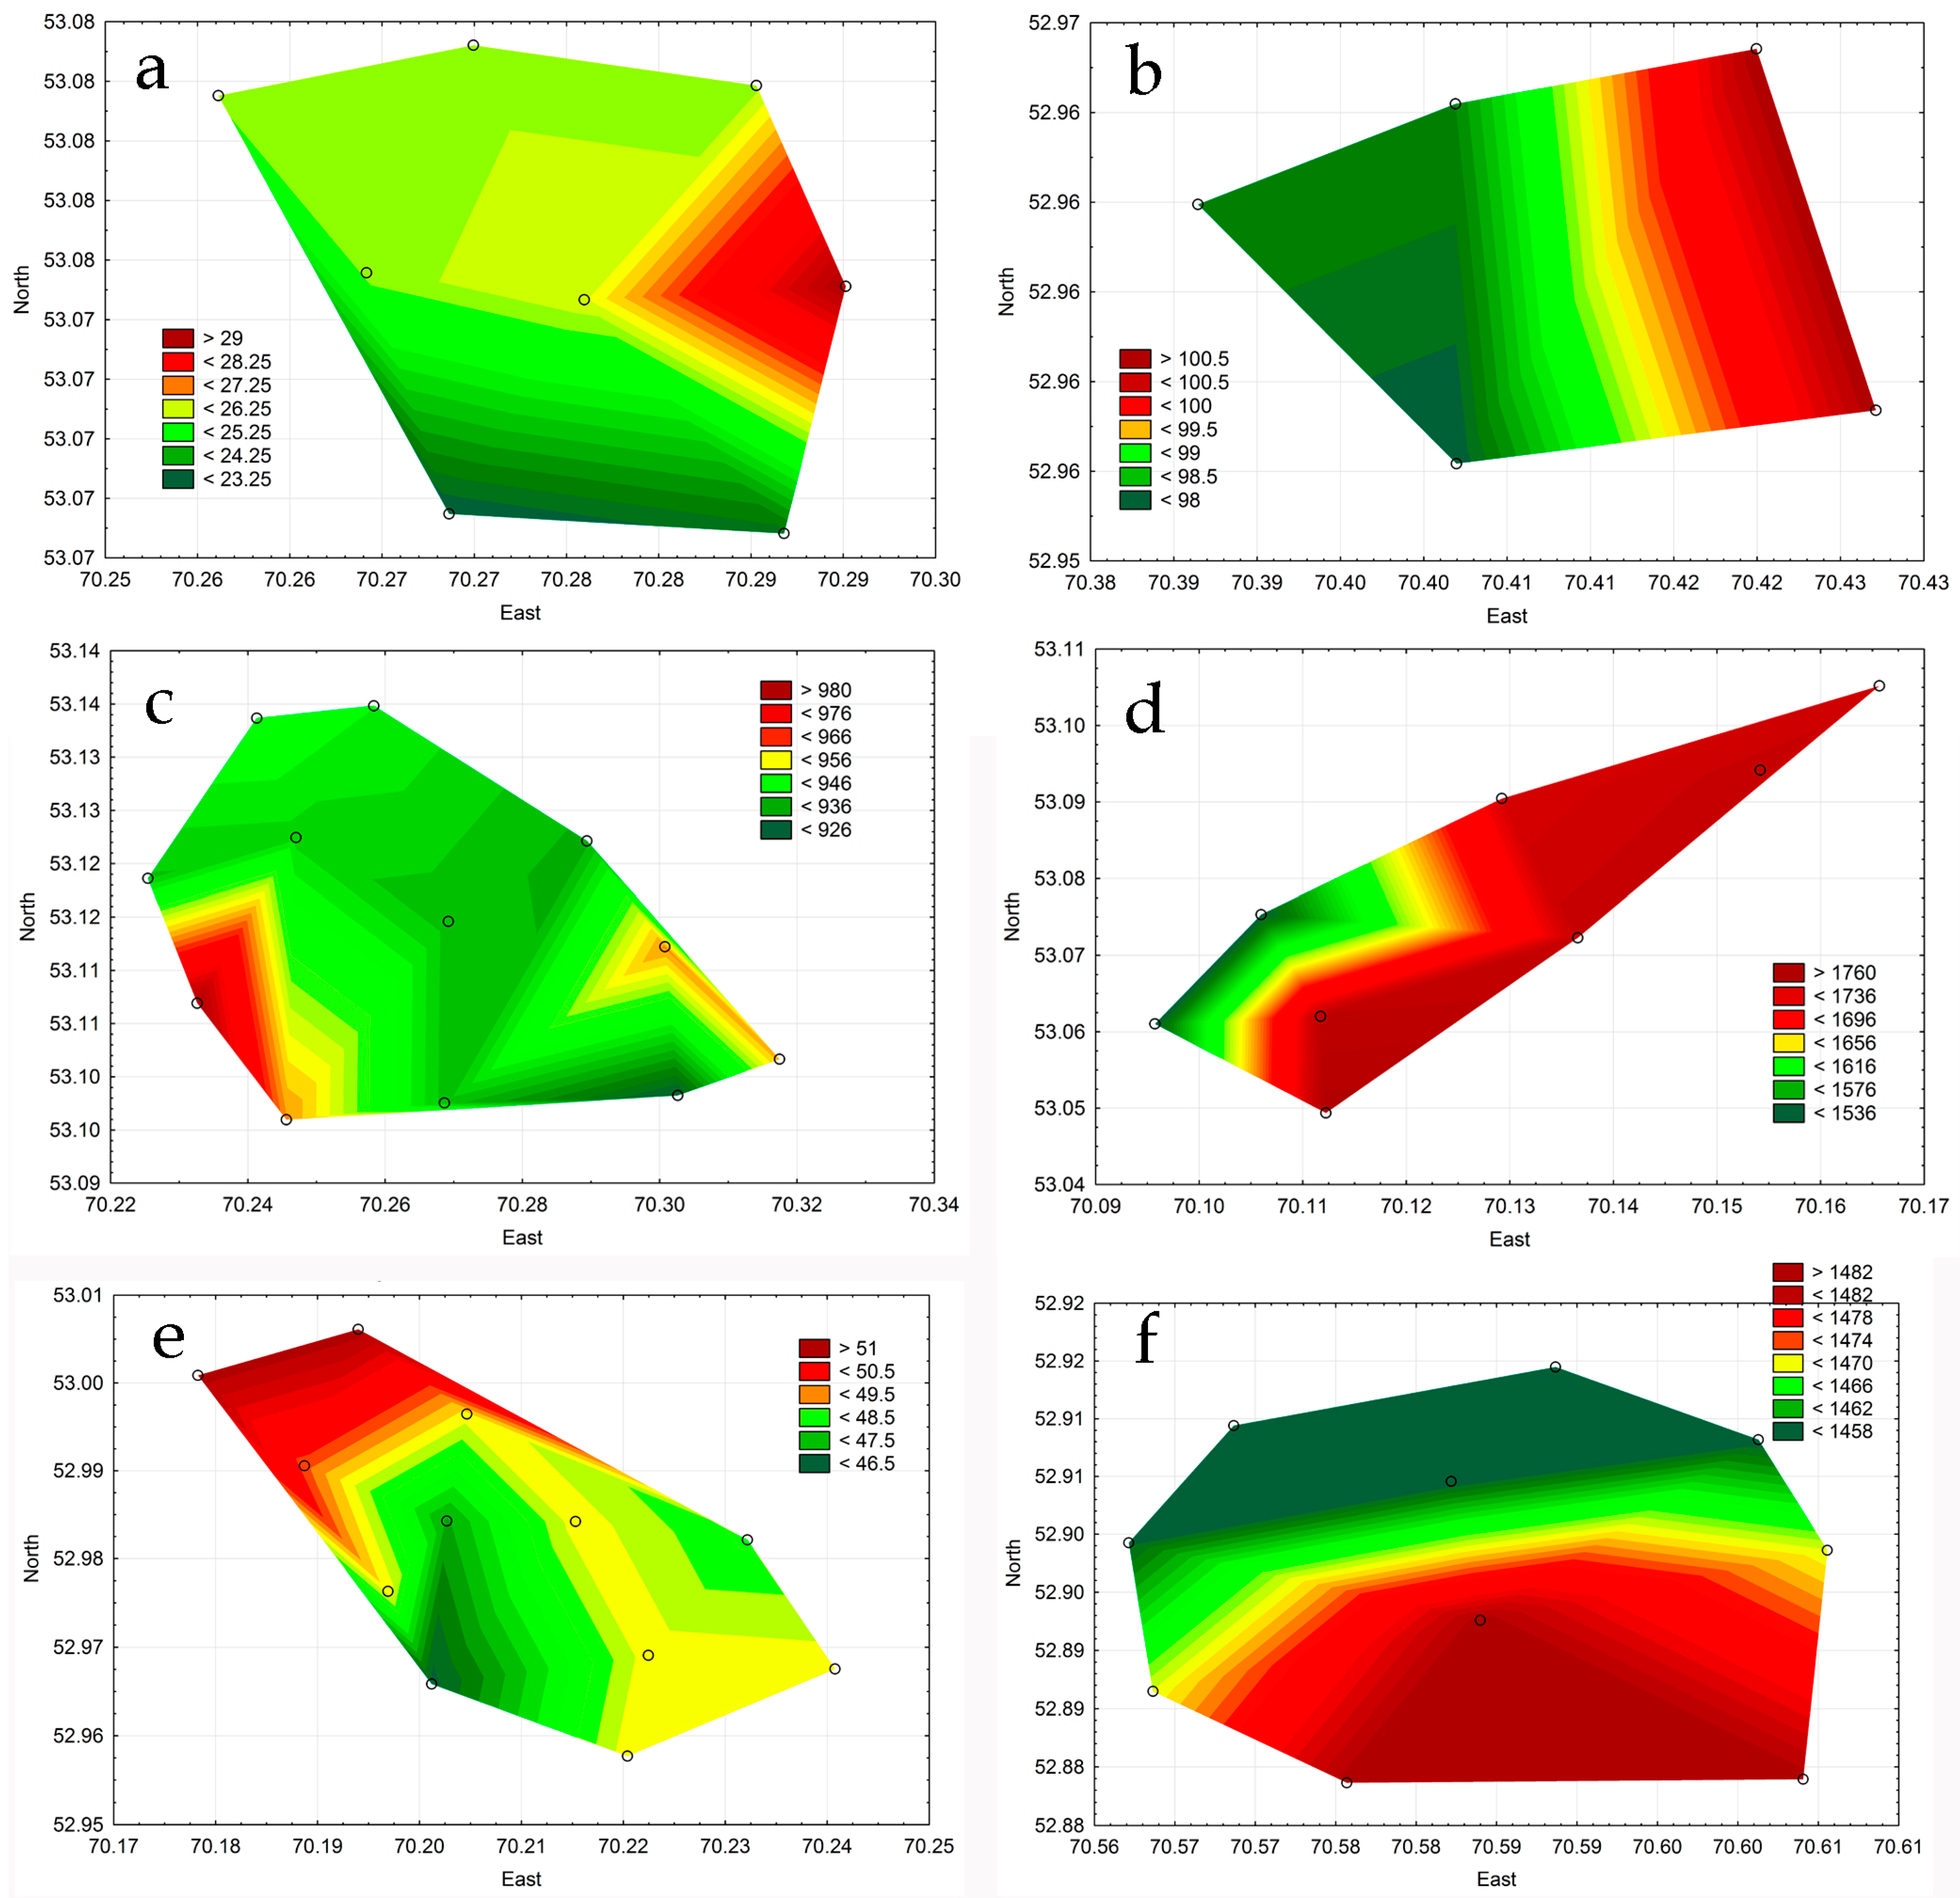
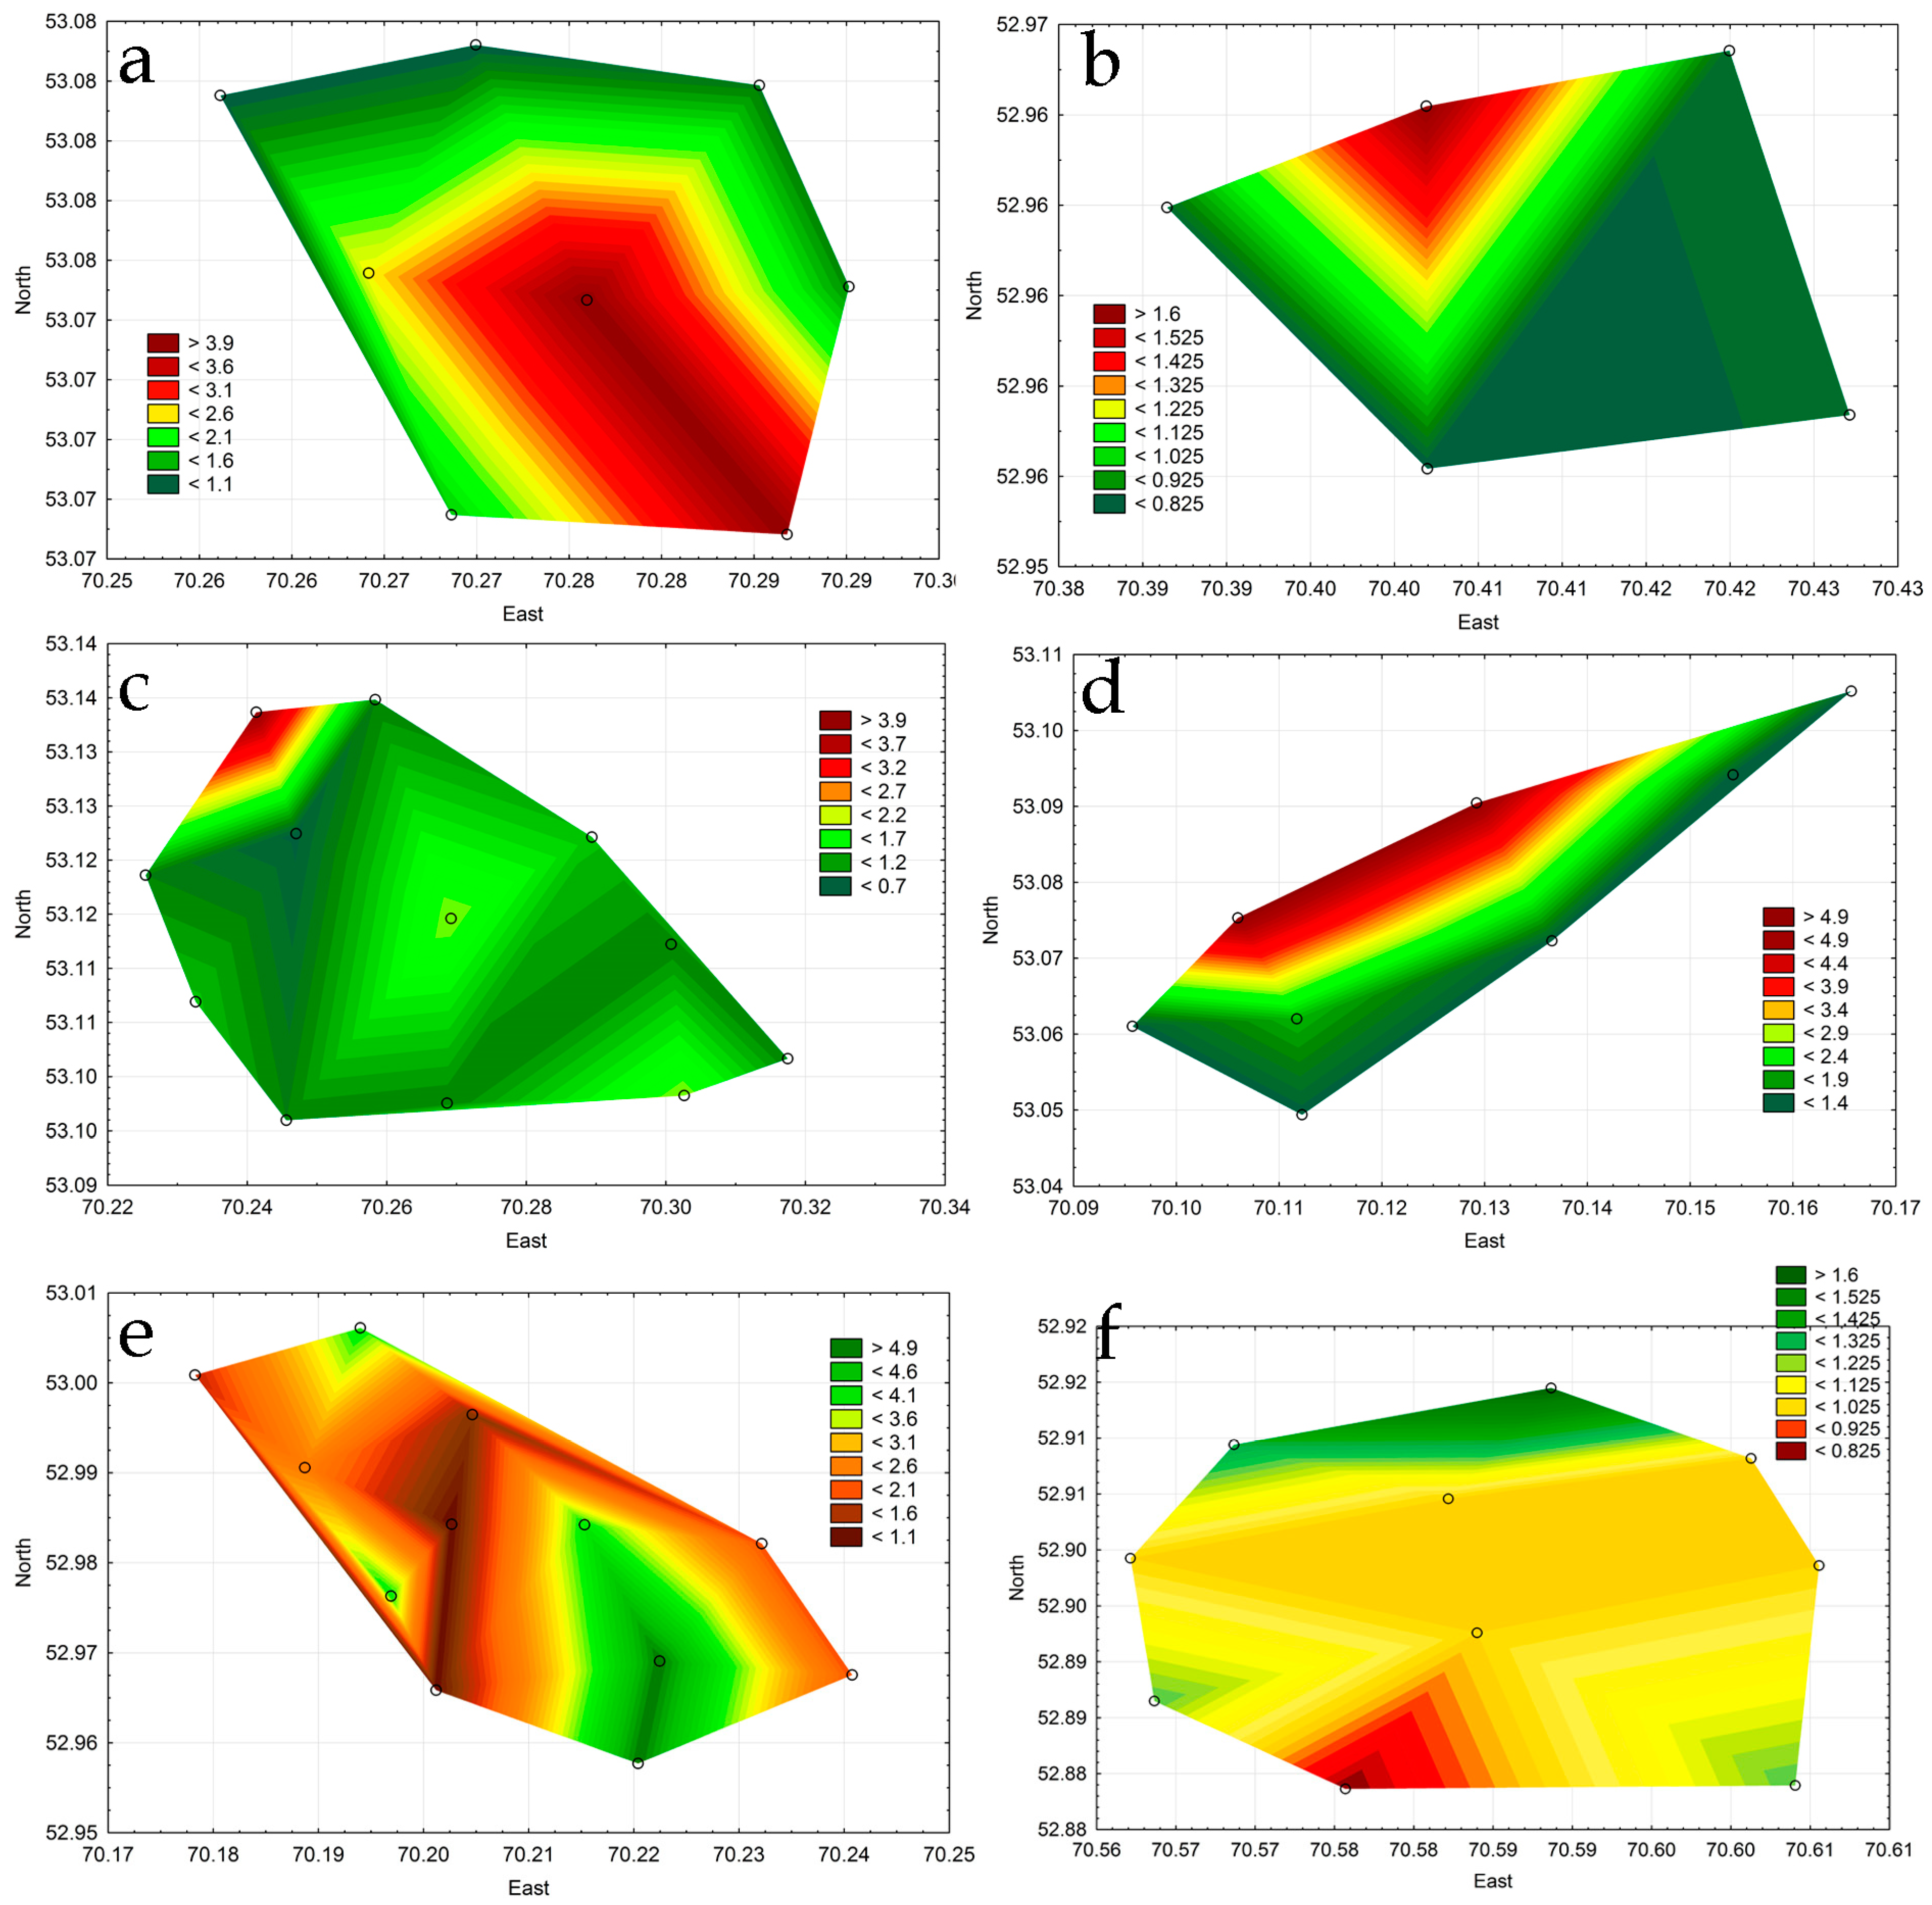
Maps were made for each of the lakes (Figure 2) to determine the places of chloride inflow. Despite the significant difference in the values associated with the natural composition of salts, the places of chloride inflow in each lake are positioned near settlements and access roads and point to the landscape corridor between the lakes Large Chebachye, Borovoye, and Small Chebachye (Figure 1).
The concentration of biogenic elements and easily oxidized organic substances in lake water varied significantly (Table 2).
According to the average values, the Katarkol lake was characterized as having the highest content of nitrate and ammonium nitrogen and easily oxidized organic matter. The highest concentrations of phosphates were found in the water of Small Chebachye, nitrite nitrogen in Borovoye.
3.2. Species Richness
A total of 139 species of algae were identified in phytoplankton during the research period, including cyanobacteria (Cyanobacteria)—30, diatoms (Bacillariophyta)—57, miozoa (Miozoa)—5, ochrophyta (Ochrophyta)—3, charophyta (Charophyta)—5, and greens (Chlorophyta)—33 (Appendix Table A1). Table 3 shows the largest species richness in phytoplankton of the lakes Borovoye and Large Chebachye with the prevailing of diatom species.
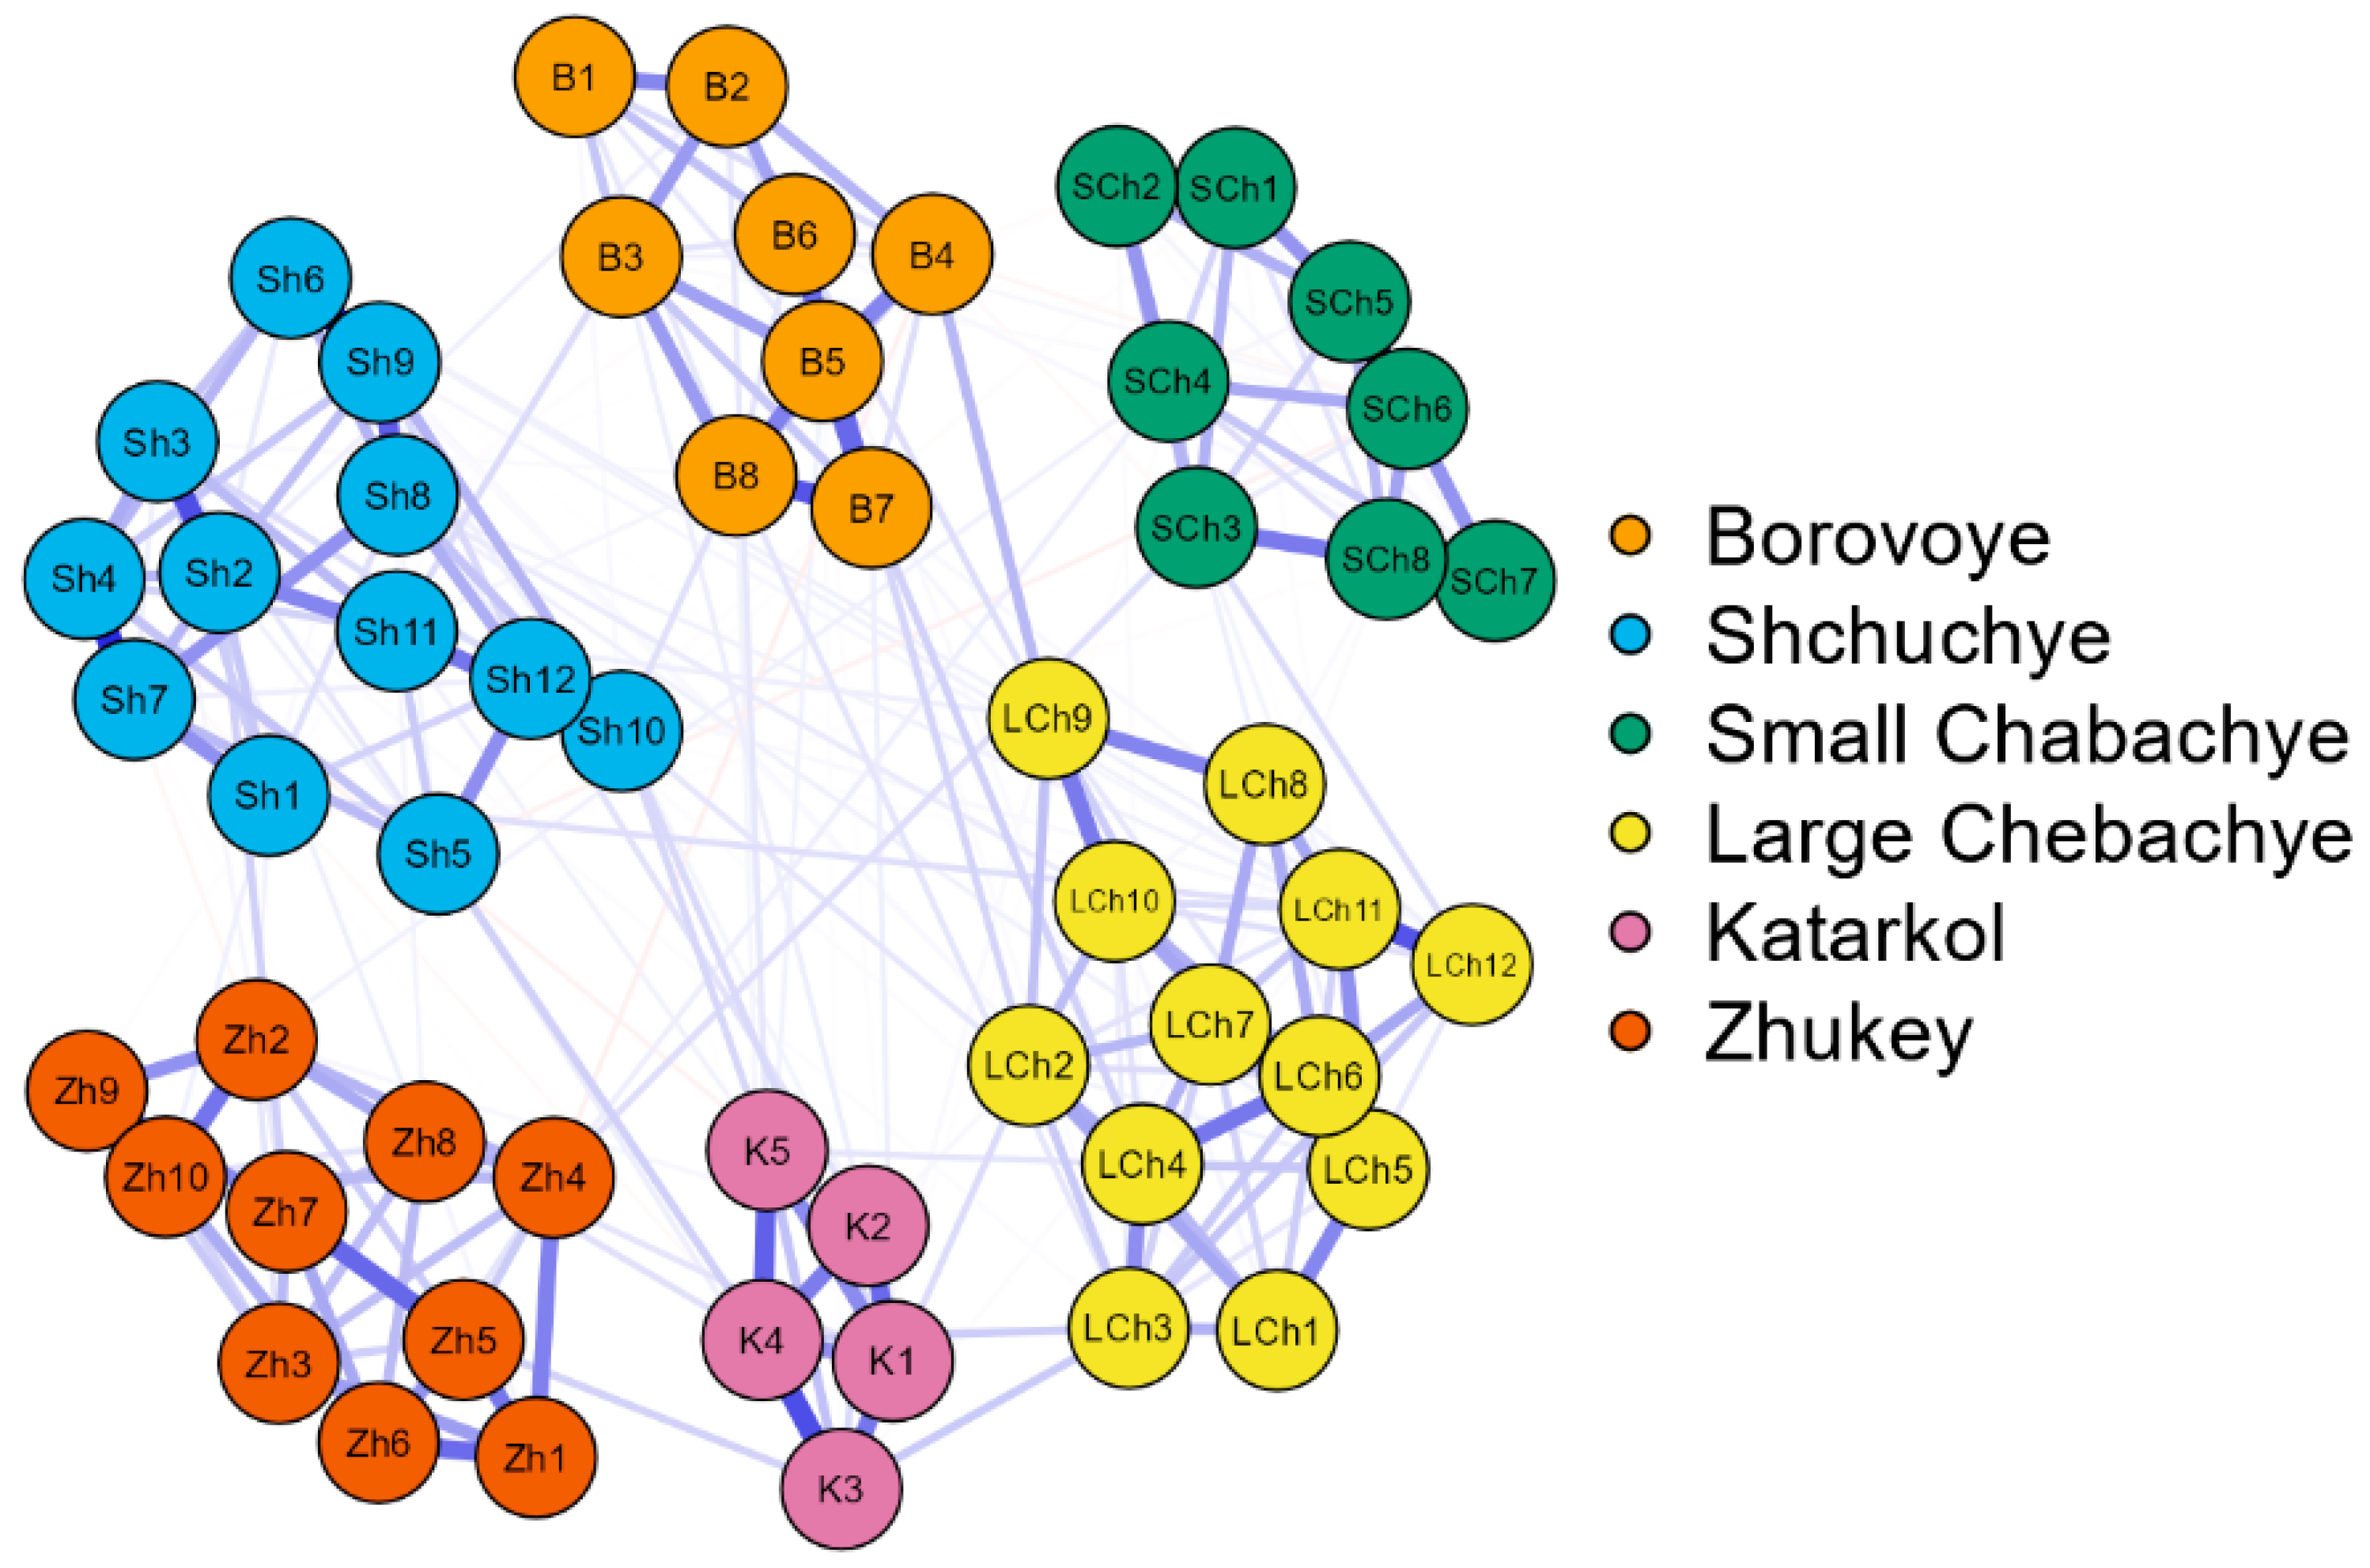
The following step in the analysis of the patterns of distribution of phytoplankton revealed the correlation between the revealed taxa and indicators (Figure 3) in the list of six studied lakes with the JASP network method. Biological neural networks give a mathematical representation of connections found in physiological, ecological, and evolutionary studies [29]. Between-species interaction networks’ calculations in biology are in the initial stage today but try to implement a new approach to species interactions, which is highly concerned with understanding what factors lead to network stability [30]. A correlation graph for species on the base of Appendix Table A1 demonstrates high individuality of species content and abundance in the studied lakes. At the same time, the list of algae species also differed in Shchuchye, Katarkol, and Large Chebachye, which may indirectly indicate the spatial heterogeneity of external conditions.
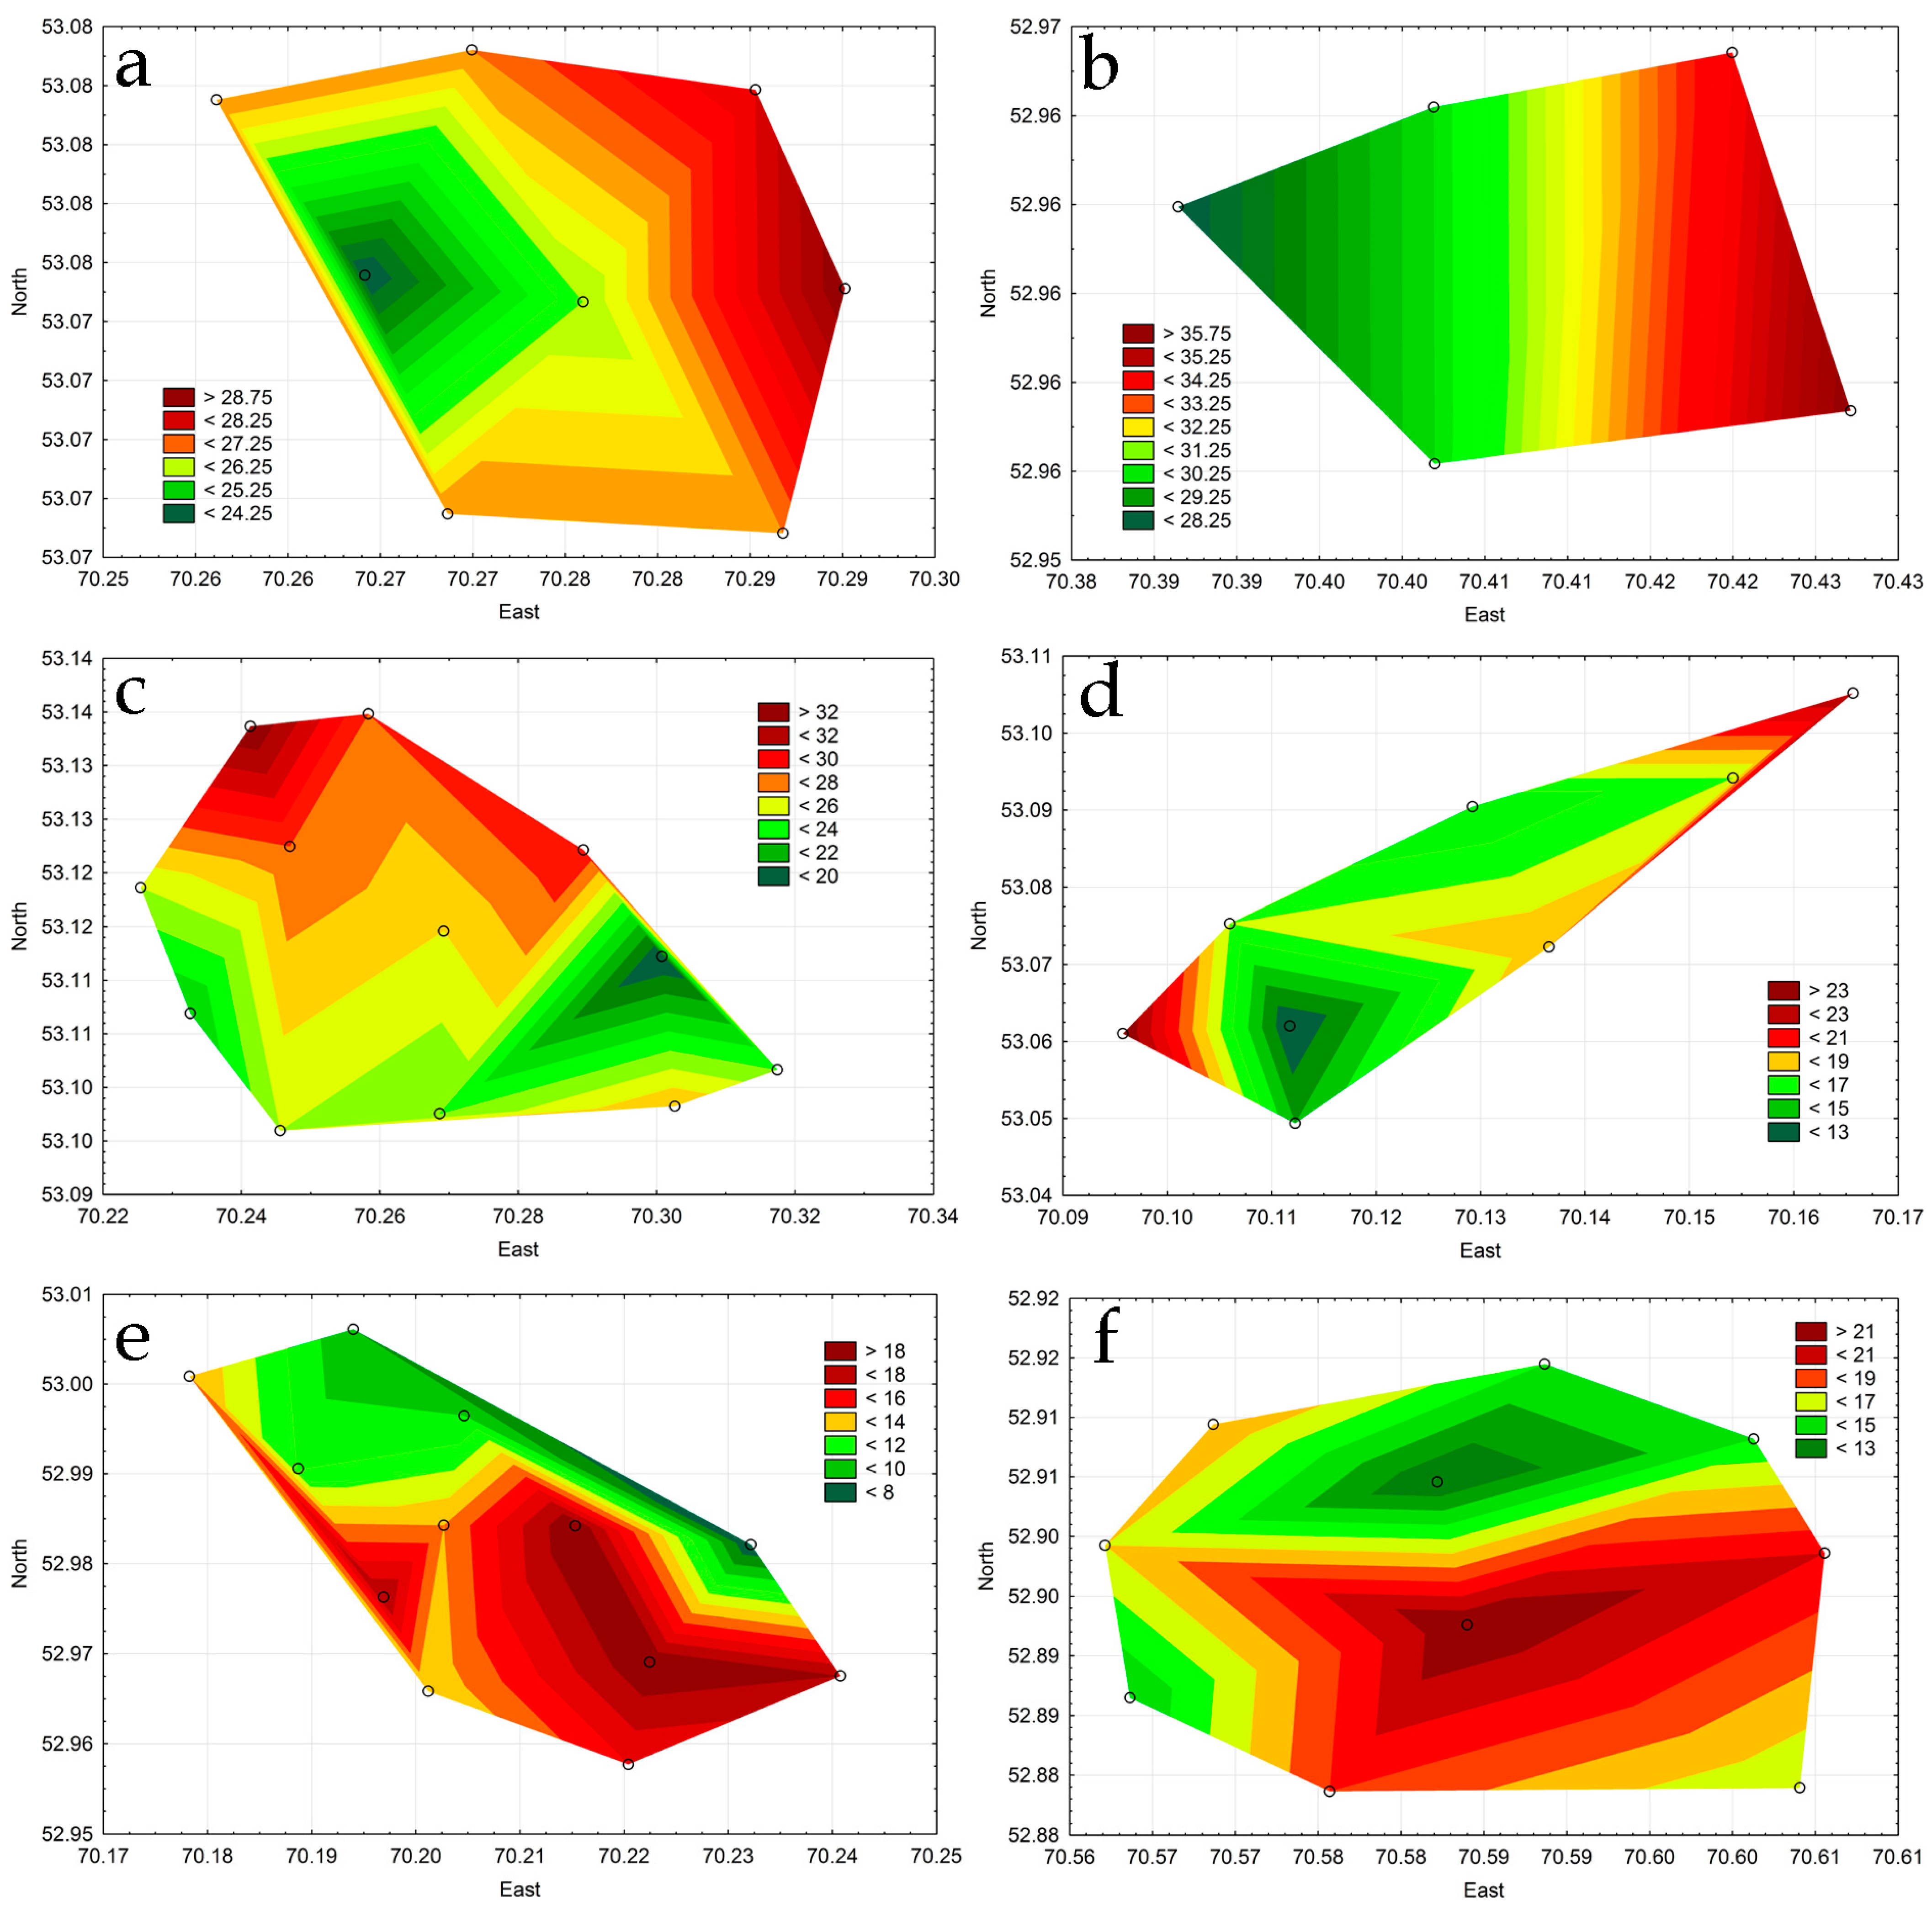
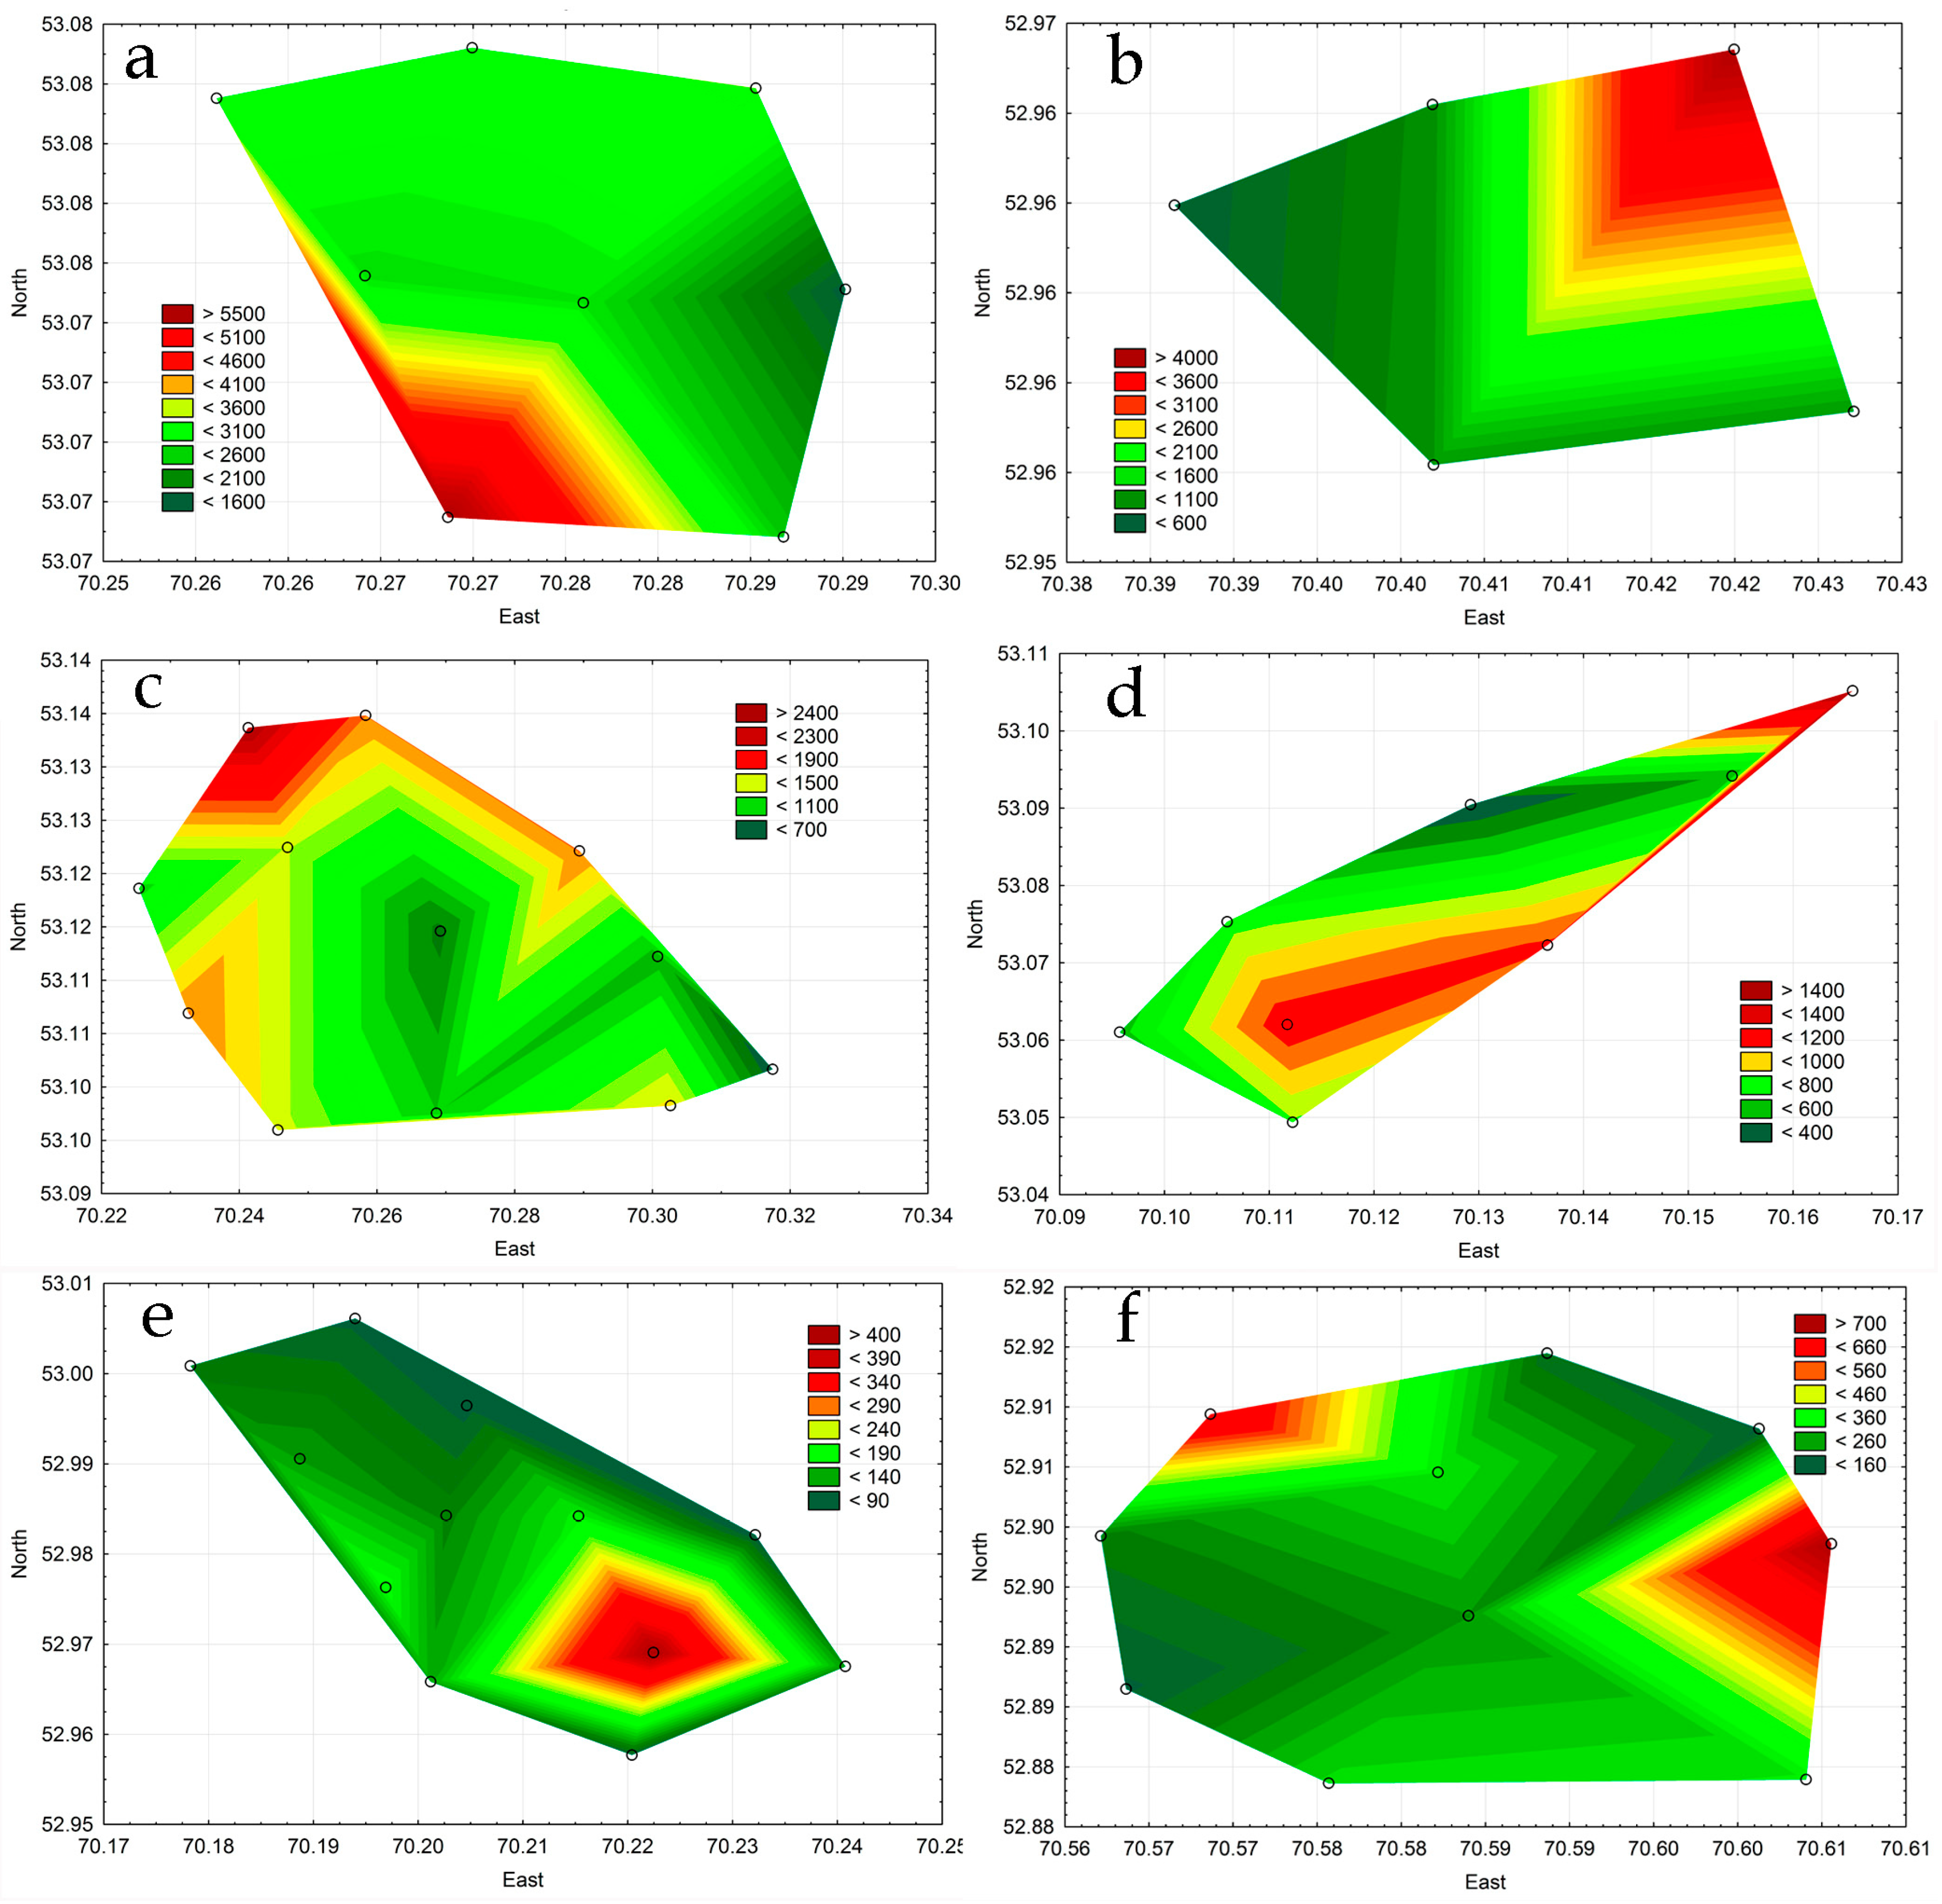
The increase in species richness in individual lakes was uneven (Figure 4). The largest number of species in phytoplankton was observed in those parts of the lakes where settlements were located, resorts, and access roads.
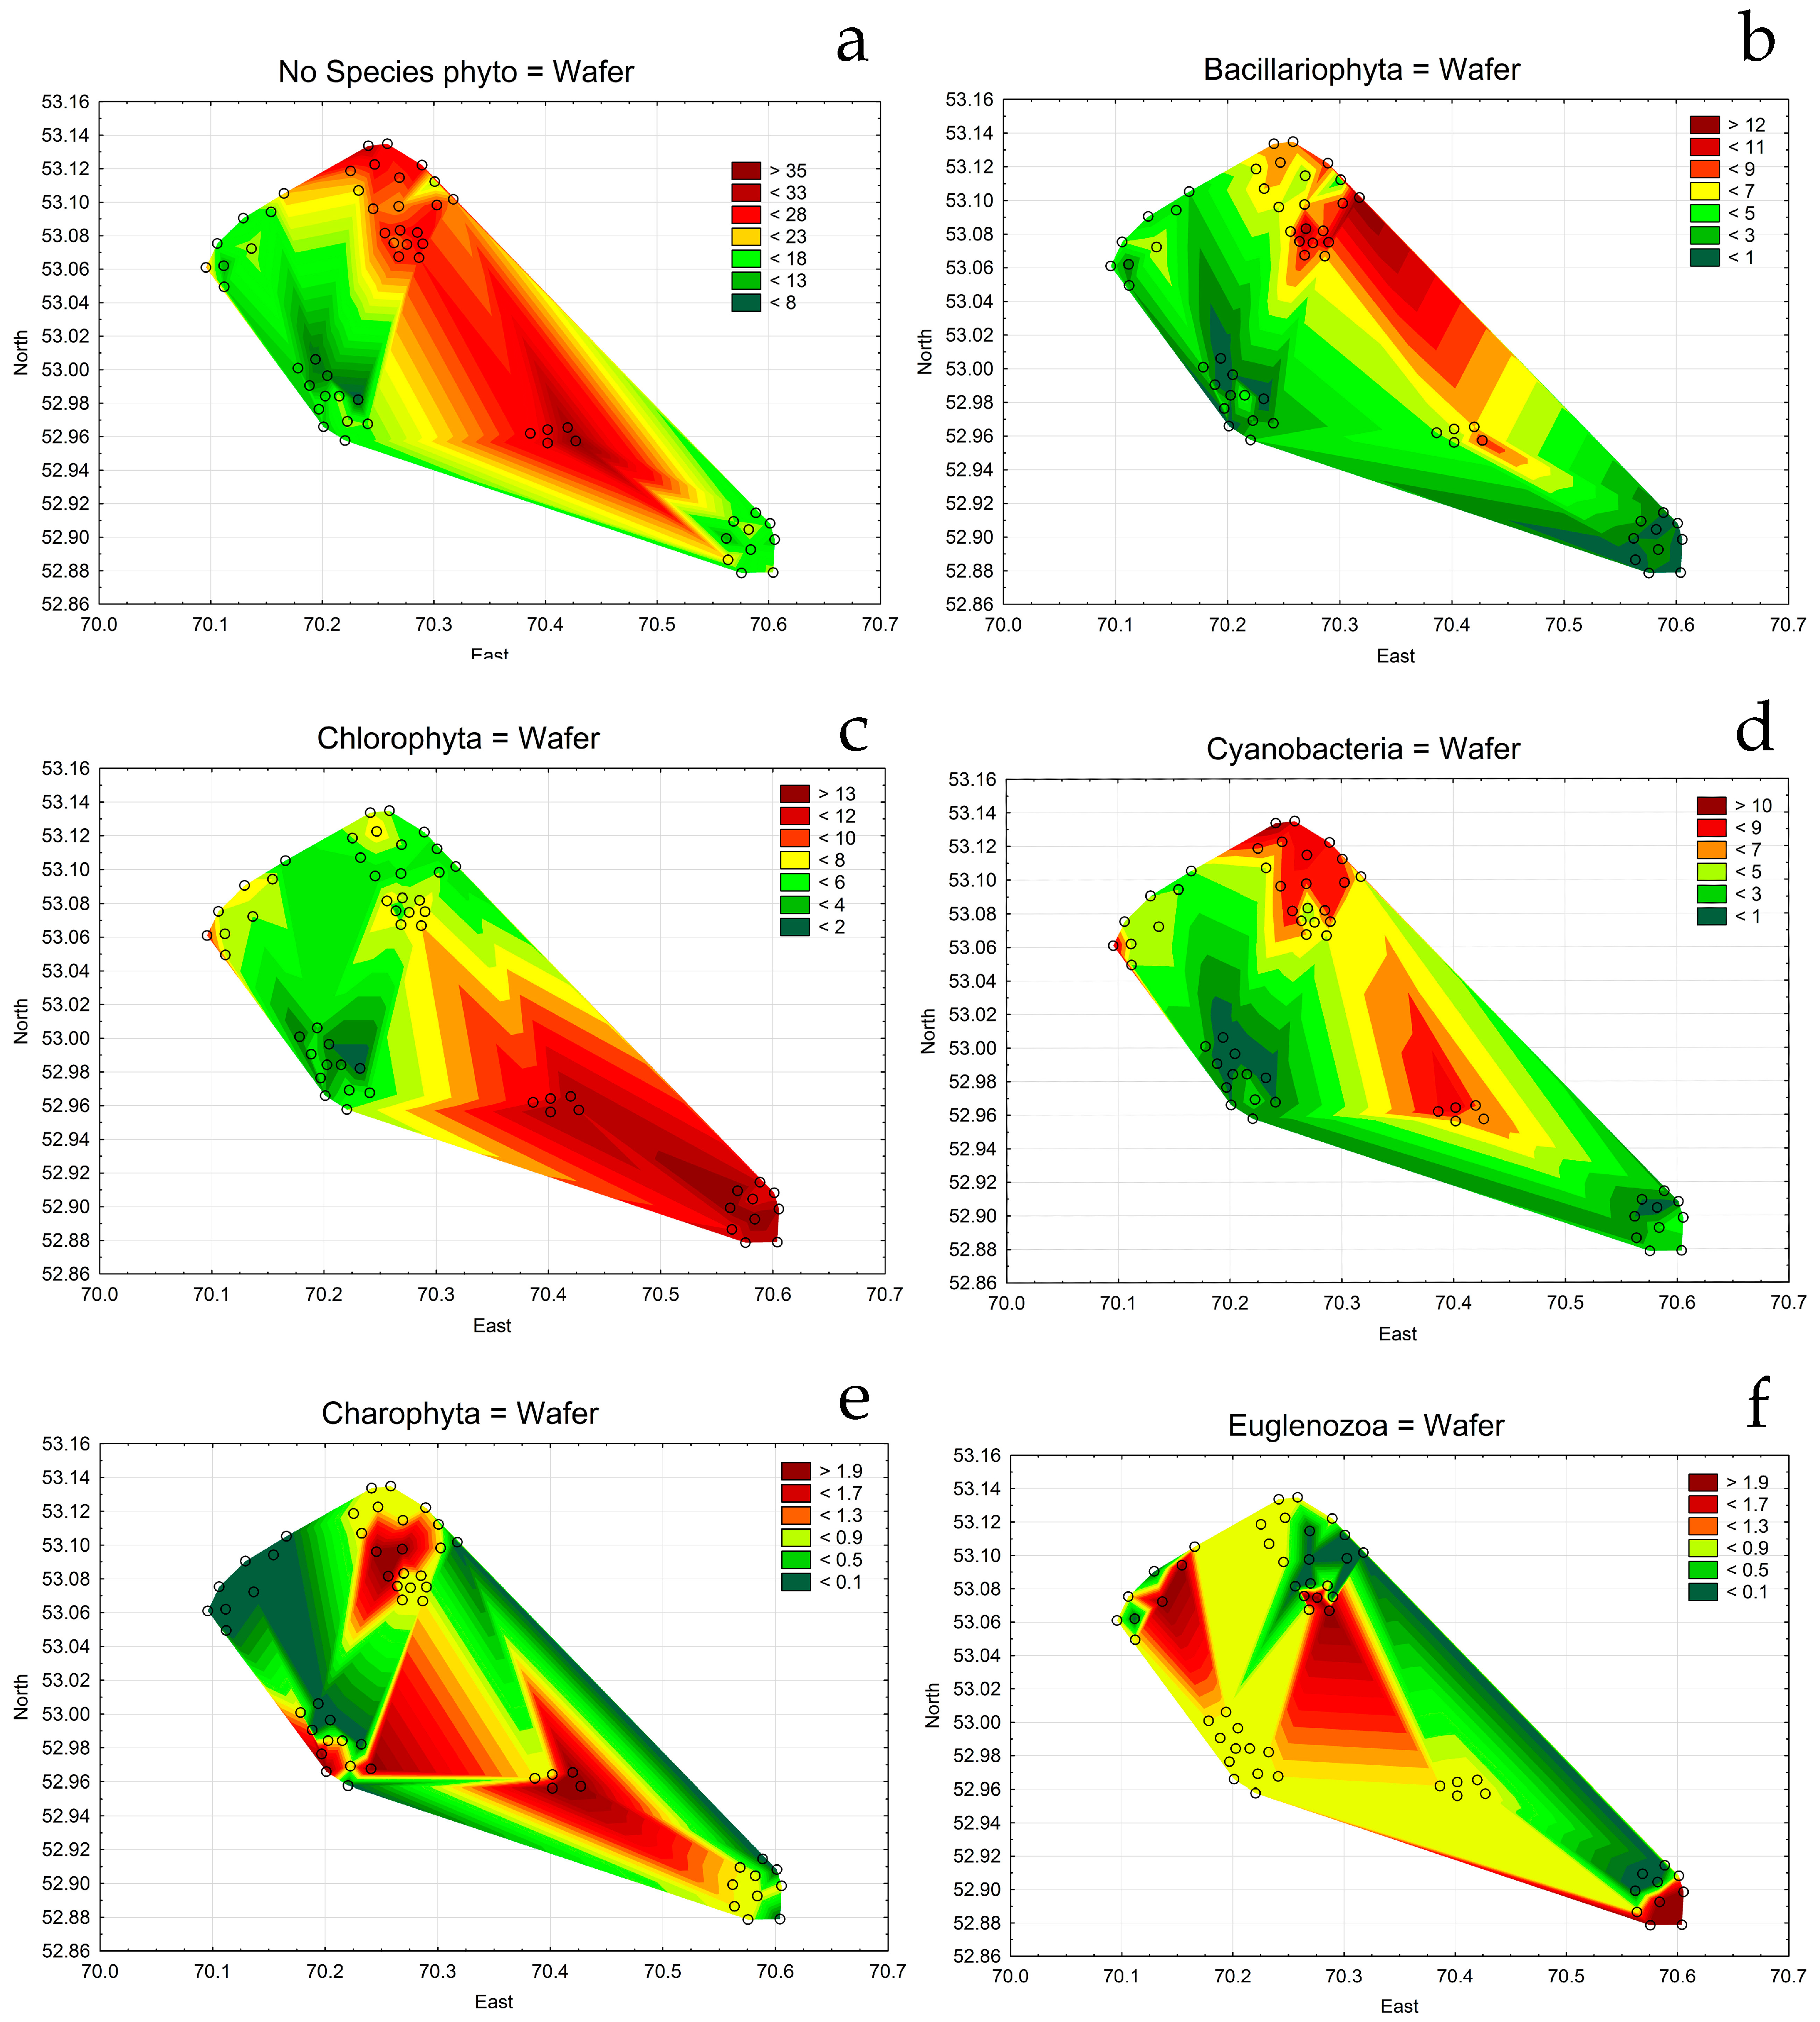
Maps of the species richness of the major phyla on the whole territory (Figure 5) show comparable distribution of each phyla member on the Burabay National Natural Park.
The total species richness in the park (Figure 5a) was defined mostly by diatoms (Figure 5b). Green algae dominated in the Zhukey area (Figure 5c), but cyanobacteria played a sufficient role also (Figure 5d). Only some parts of the lakes were comfortable for the growth of charophytes (Figure 5e) and euglenoids (Figure 5f) that can be assessed as indicators of clear (charophytes) or polluted (euglenoids) waters.
3.3. Abundance and Biomass
The quantitative parameters of phytoplankton communities varied to a large extent (Table 4 and Table 5). The highest abundance of microalgae was recorded in Borovoye, with almost a twofold lag in this indicator for the communities of Lake Katarkol. In Borovoye, Large Chebachye, Katarkol, and Small Chebachye, cyanobacteria formed the basis of phytoplankton abundance. In the first two lakes, the dominance of the species of this phylum was absolute. In fresh and brackish lakes, species of the Miozoa phylum occupied the dominant position in terms of biomass (in Borovoye together with Bacillariophyta).
The distribution of phytoplankton on the surface of the lakes was uneven (Figure 6). Algae developed most abundantly in places opposite to those visited, which may indicate that the water disturbance factor is negative for the abundant development of phytoplankton.
The role of the Microcystis aeruginosa (Kützing) Kützing from the phylum Cyanobacteria in the formation of phytoplankton abundance was most noticeable in Borovoye and Katarkol (Appendix Table A1). Anathece clathrata (West & G.S. West) Komárek, Kastovsky & Jezberová from the same phyla subdominated in abundance in the Borovoye and Large Chebachye phytoplankton. Aphanocapsa incerta (Lemmermann) G. Cronberg & Komárek was a member of the dominant assemblages of phytoplankton communities in the lakes Large Chebachye and Small Chebachye. The green alga Chlorella vulgaris Beijerinck dominated in abundance in the phytoplankton of Shchuchye and Zhukey. Peridiniopsis quadridens (F. Stein) Bourrelly, subdominant in terms of abundance and biomass in the phytoplankton of the lake Shchuchye, also played a significant role in the formation of the biomass of the Large Chebachye community. Ceratium hirundinella (O.F. Müller) Dujardin from the Miozoa phyla dominated in terms of biomass in the phytoplankton communities of Borovoye, Shchuchye, and Large Chebachye. Other phyla of microalgae were abundant only in some lakes.
3.4. Community Structure
Depending on the lake, the structural parameters of phytoplankton communities varied significantly. The average number of planktonic species per sample was maximum in Katarkol. Further, in descending order of the values of this variable, there were phytoplankton in the lakes Borovoye and Large Chebachye. According to the values of the Shannon index, the diversity of phytoplankton communities in all lakes was assessed to be high, especially in Katarkol, Large Chebachye, and Zhukey (Table 6). Except for the lake Shchuchye, phytoplankton communities of the other lakes were characterized by a small-sized species. Differences between the Shannon index in terms of abundance and biomass were noticeable for the phytoplankton of the lakes Borovoye, Katarkol, and Large Chebachye, where the Shannon biomass was higher and vice versa and lower in Shchuchye, Small Chebachye, and Zhukey (Table 6).
Therefore, in terms of phytoplankton biomass (Table 5), Borovoye and Katarkol can be characterized as more polluted from an ecological point of view with Class 3 of water quality than Large Chebachye, Shchuchye, Small Chebachye, and Zhukey, the phytoplankton biomass of which was lower, with Class 2 of water quality [25]. The studied lakes were moderately polluted and clean water bodies of Kazakhstan, according to 2019 data. High quantitative variables, the dominance of cyanobacteria, indicated that the phytoplankton communities of the lakes Borovoye, Katarkol, and Large Chebachye had undergone the greatest transformation during 2002–2019 [2,3,5].
3.5. Bioindicators
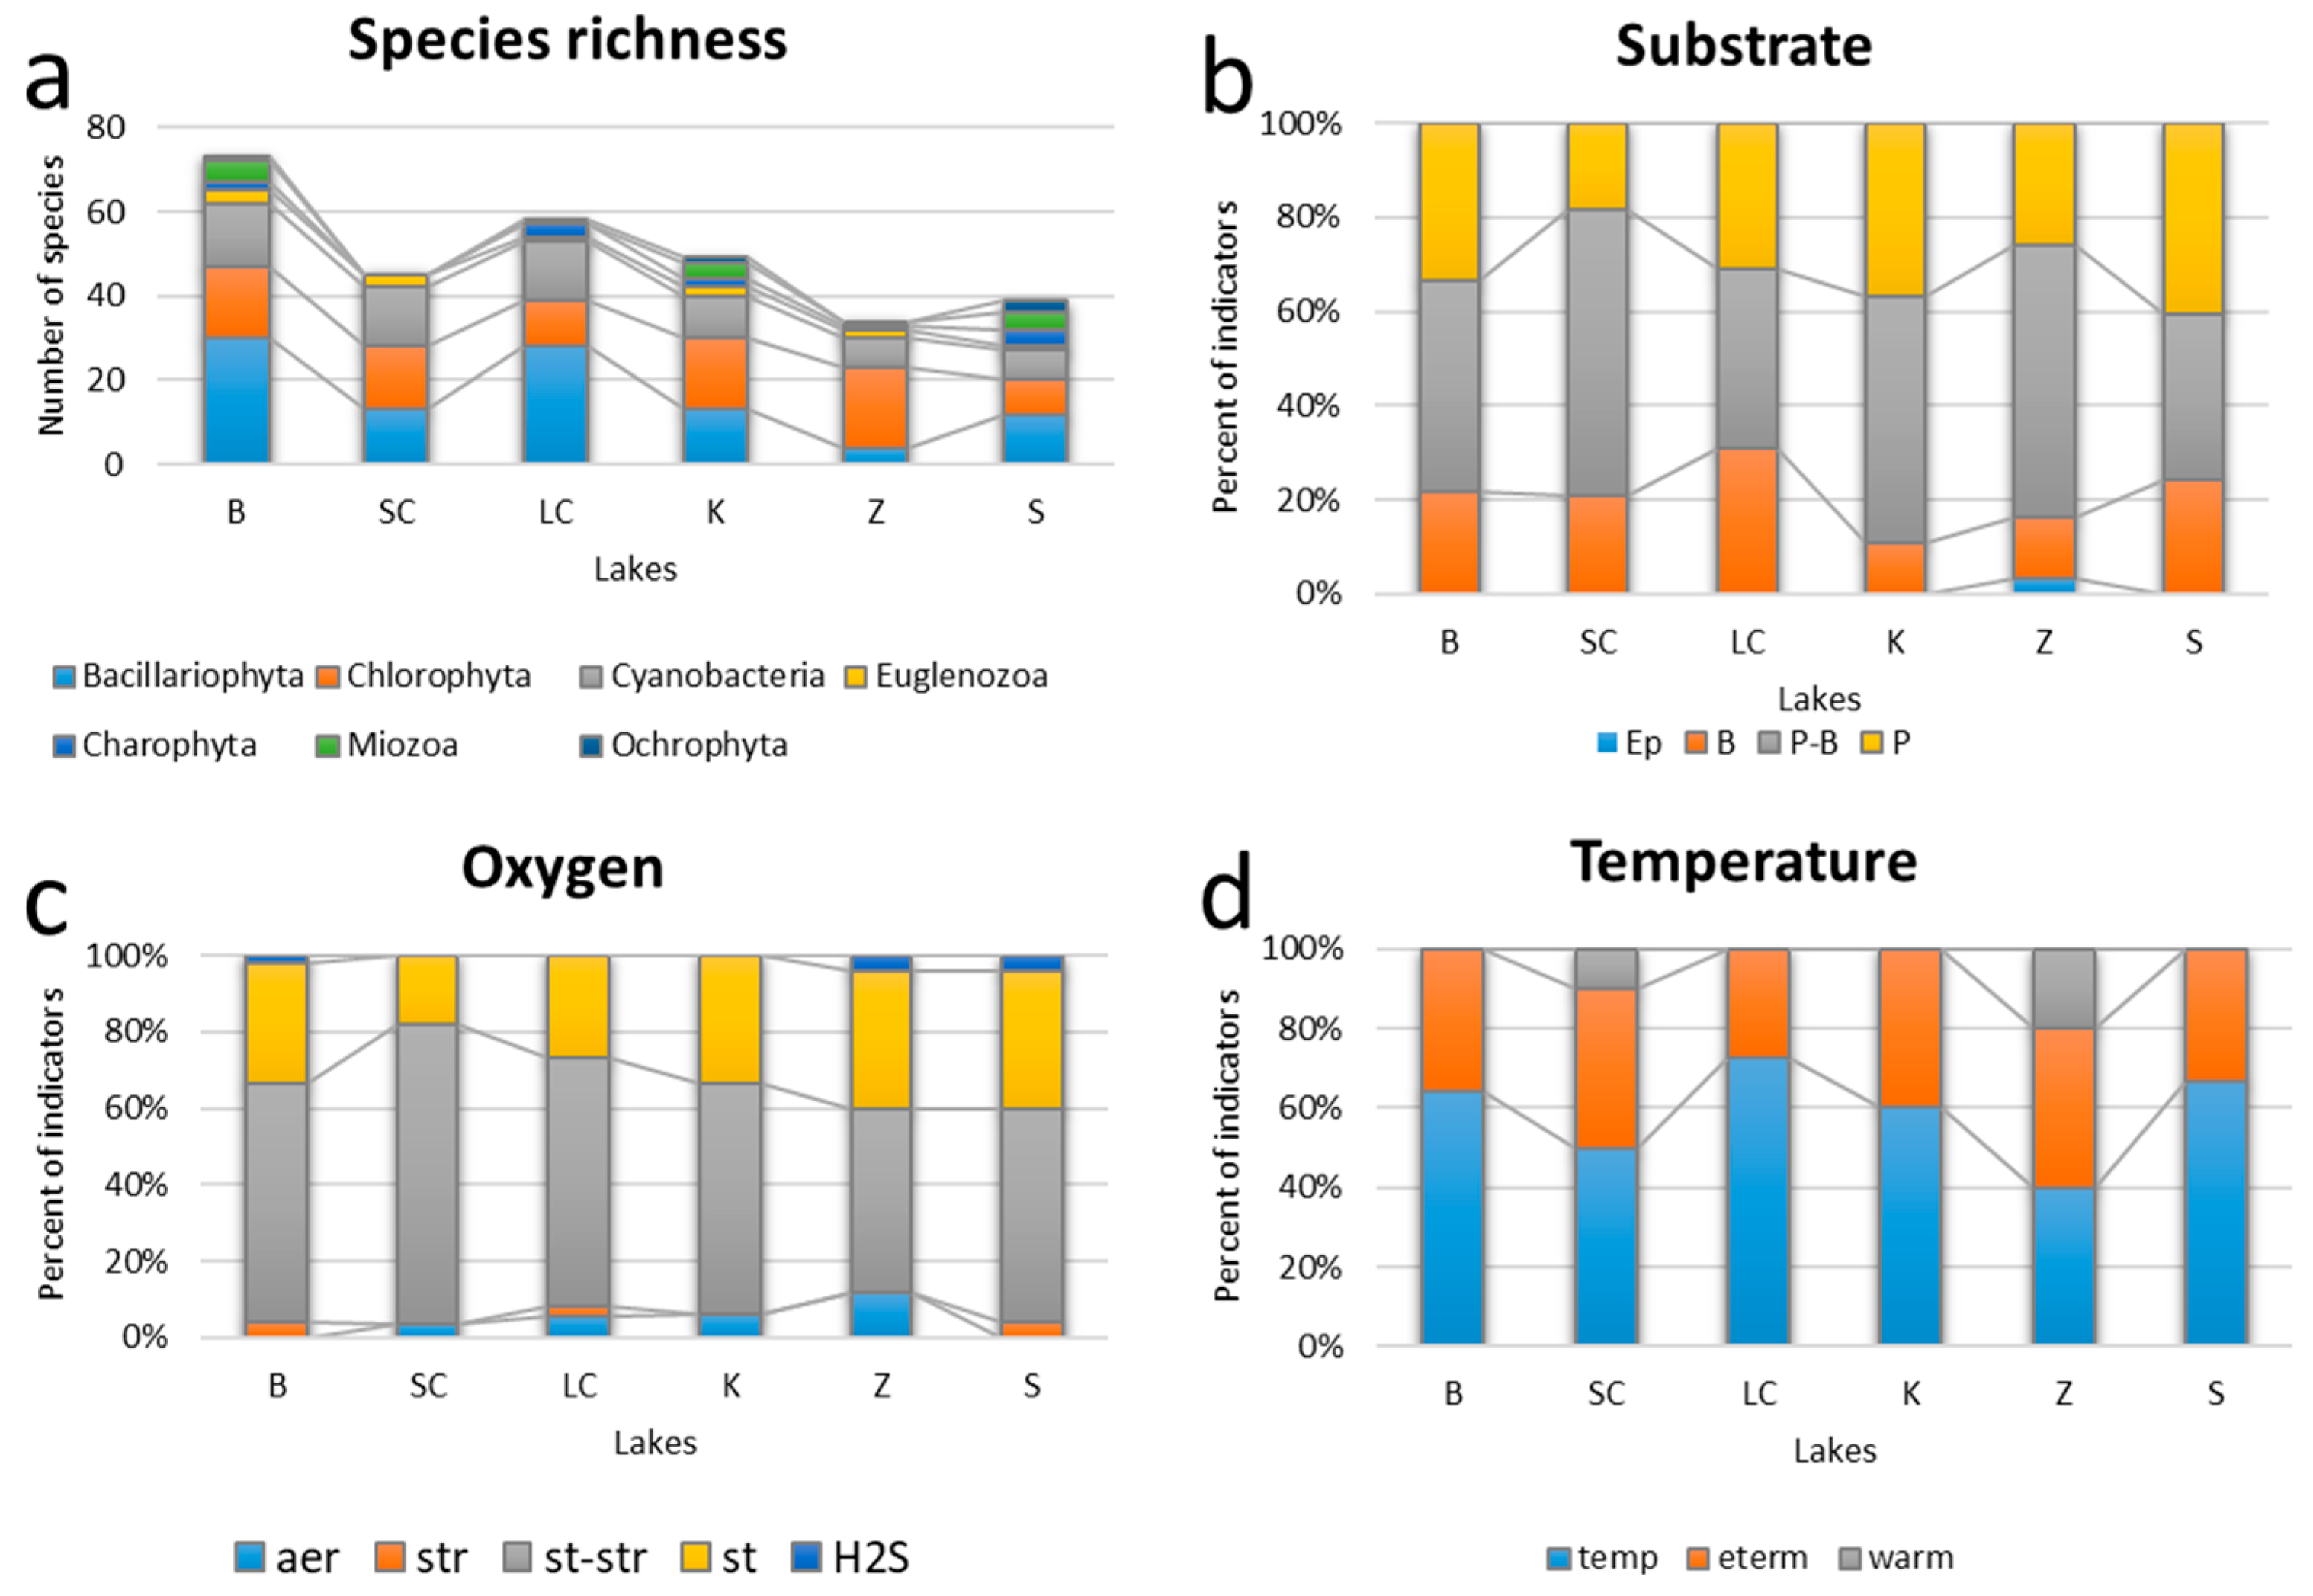
All phytoplankton taxa in the six studied lakes were indicators of the environment (Appendix Table A1). The indicator’s ‘face’ of each lake can be seen in Figure 7, Figure 8 and Figure 9. Borovoye lake phytoplankton had the highest number of recorded species and were dominated by diatoms (Figure 7a). In the preferences of occupied habitats, all lake communities were enriched by planktonic and planktobenthic inhabitants (Figure 7b). Lakes water was temperate temperature (Figure 7d), moderately enriched by oxygen but in some of which was found the indicators of anoxia (Figure 7c).
In all the studied lakes, more than half of the algae species were indicators of polluted waters, the third-quality class, with a secondary position of indicators of moderate pollution, the second-quality class (Appendix Table A1). Algae species were also found everywhere in small numbers—indicators of very dirty waters, of the fourth-quality class.
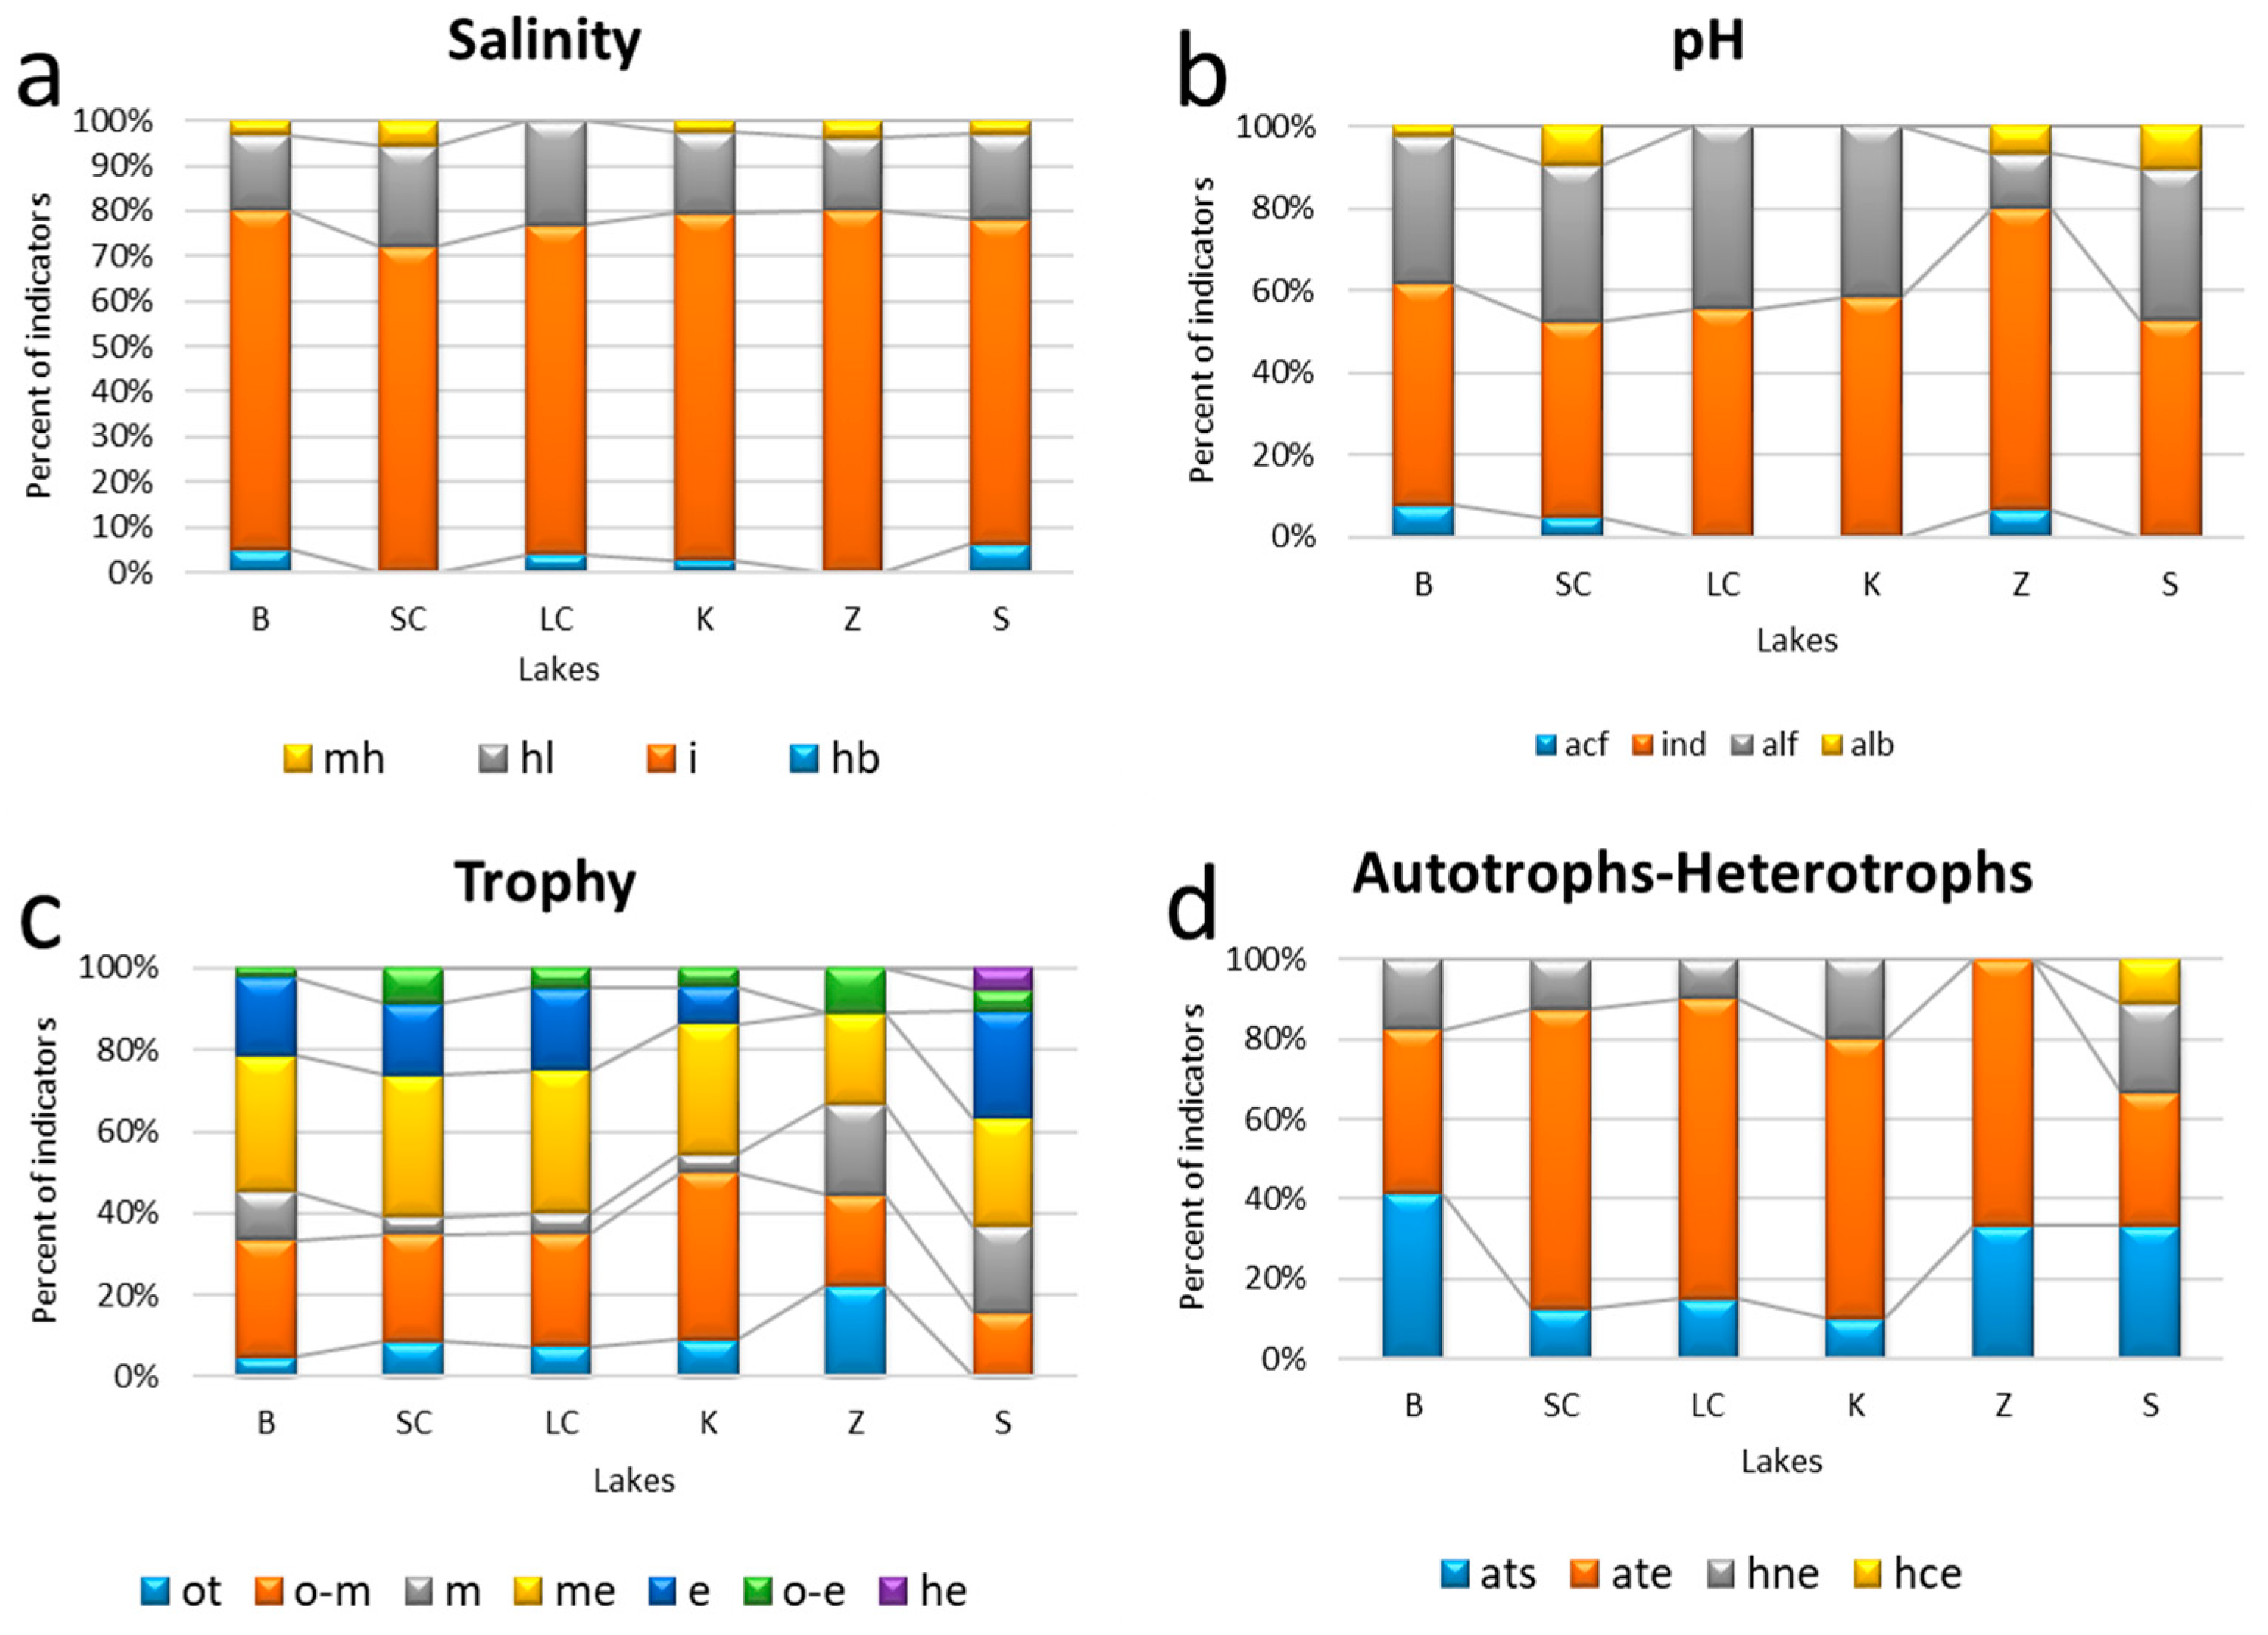
Salinity indicators revealed fresh waters (Figure 8a); nevertheless, Zhukey and Small Chebachye chemical analysis revealed high TDS, which partly was sulfate (Table 1). Indicators of water pH reflect low alkaline waters (Figure 8b). Trophic-level indicators were mostly affiliated to mesotrophic or eutrophic category (up to 20–40%) in all lakes except Zhukey where oligotrophic indicators were sufficient, and Katarkol, where oligo-mesotrophic indicators prevailed (Figure 8c). Preference of nutrition type for phytoplankton species can be seen in Figure 8d, where autotrophic photosynthetic organisms prevailed. Only species with heterotrophic capacity were found in the community of the lake Shchuchye, which were absent in Zhukey.
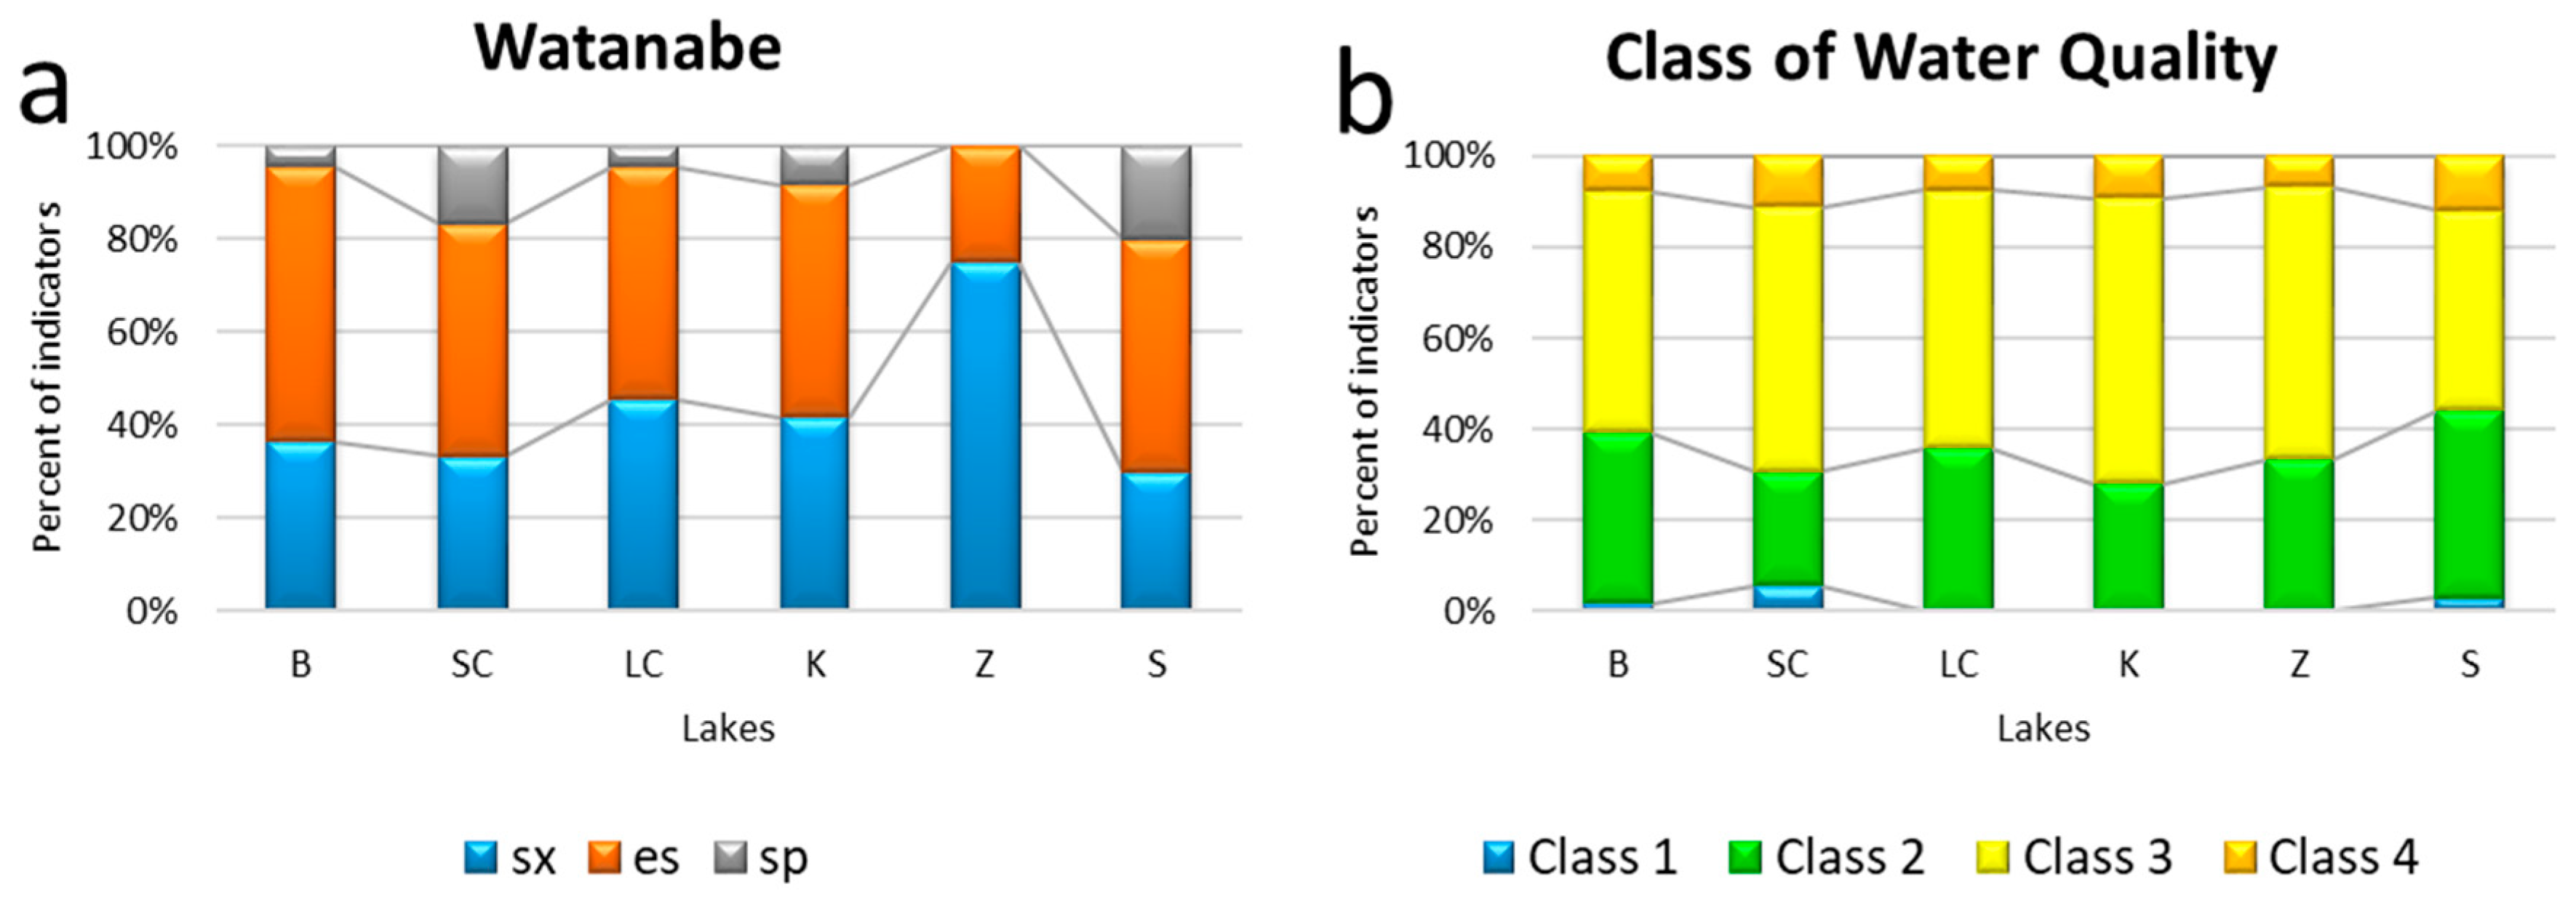
Diatoms’ organic pollution indicators prevailed from categories of saproxenes and eurysaprobes in all lakes excluding Zhukey, where clear water saproxenes dominated (Figure 9a). At the same time, all phytoplankton communities indicated the prevalence of species of the category Class 3 of water quality in all lakes based on species-specific index saprobity S [25] (Figure 9b).
The spatial distribution of indicator species of algae from different ecological groups in the park areas of the surveyed lakes was analyzed on constructed statistical maps, which make it possible to associate the value of the mapped indicator with the location of sources of organic pollution on the territory of the park. Figure 10 shows the distribution of opposite groups of indicators of alkaline and acidic waters. Waters with high pH were close to the most settled area (Figure 10a), whereas acidophiles concentrated in the outflowing river Kyrkyruek, where aquatic plants were abundant (Figure 10b).
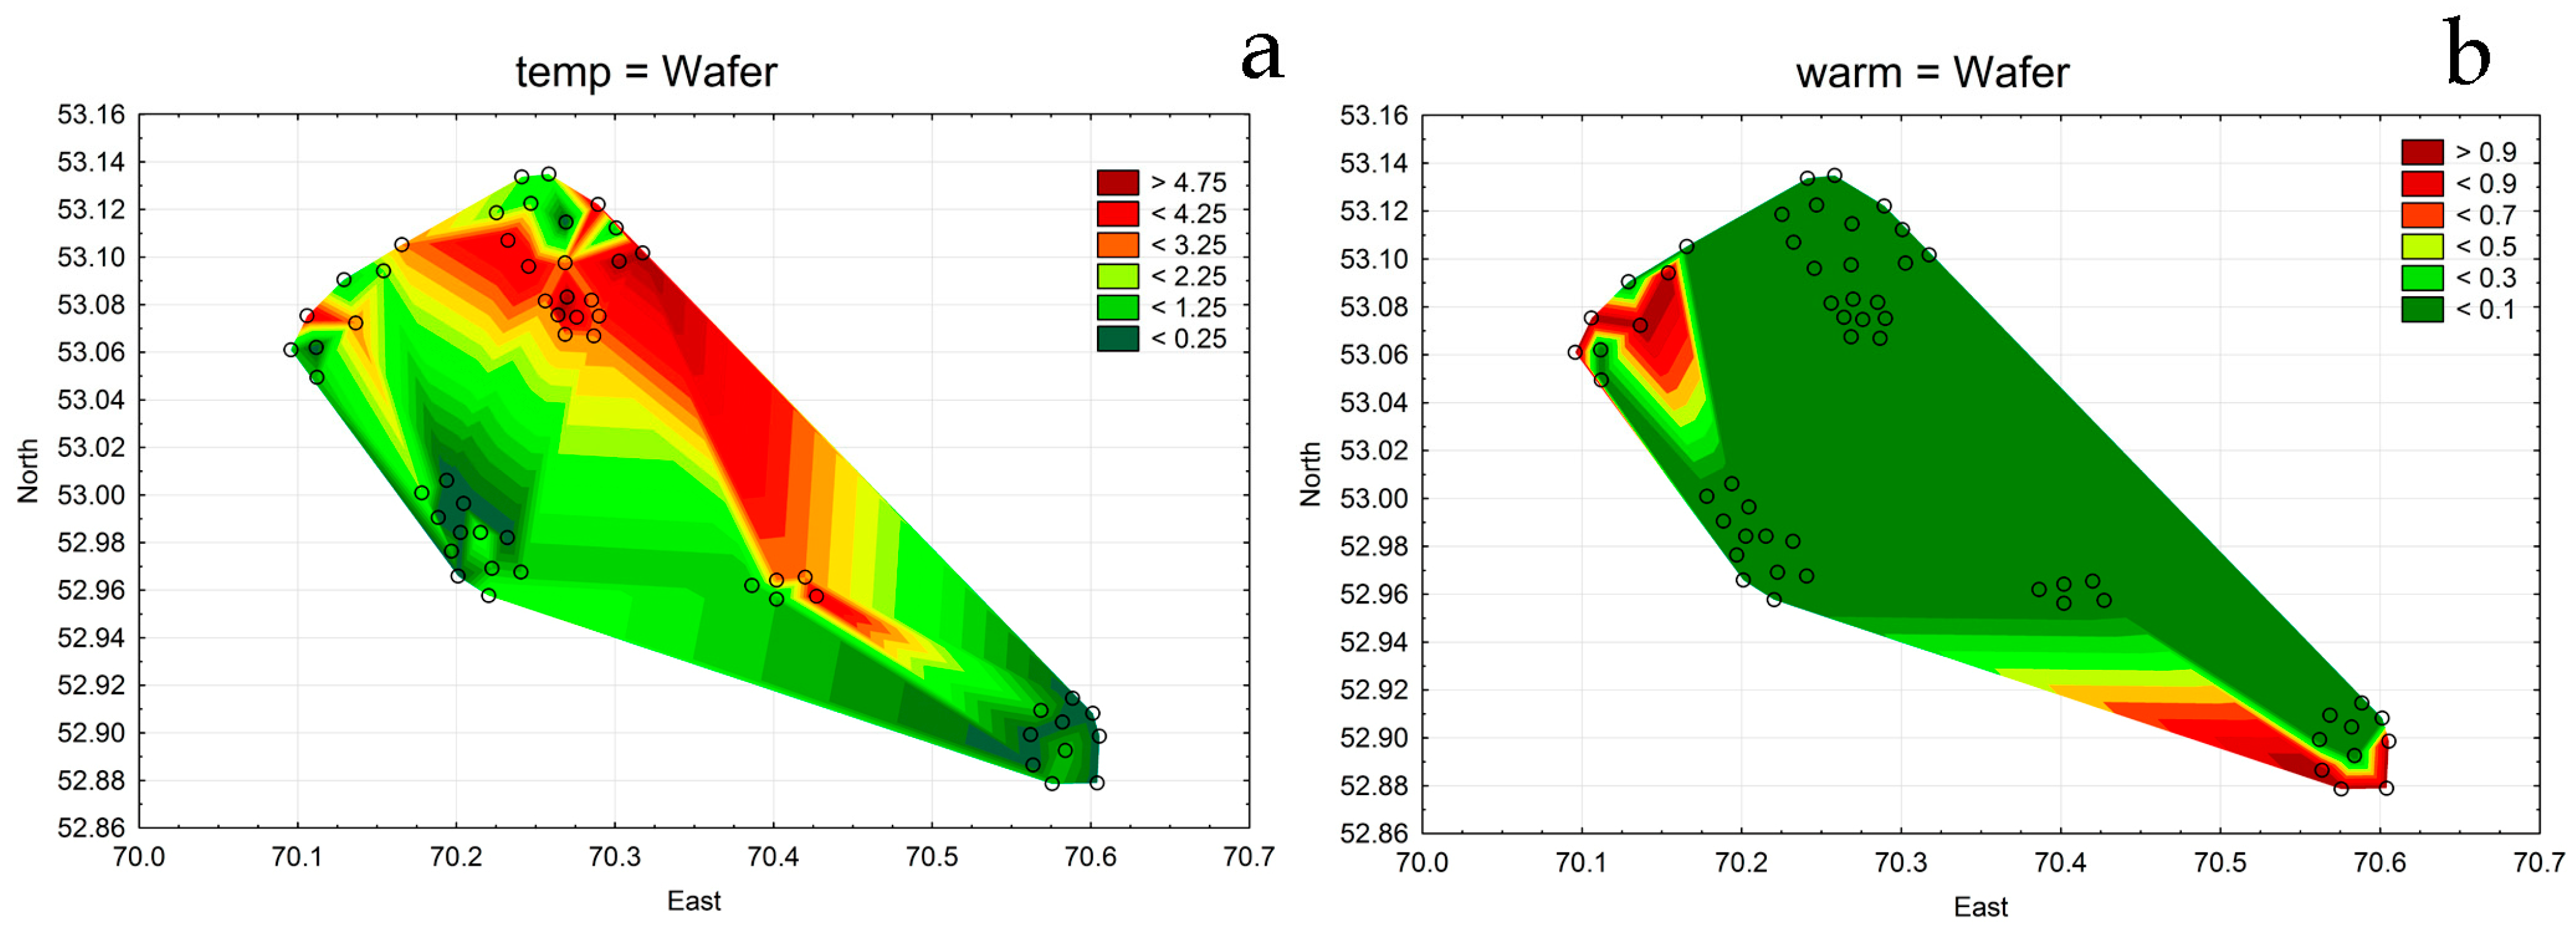
Water near the Borovoye settlement had temperate temperature (Figure 11a), but warmest water in the summer season was near Chebachye and Zhukey (Figure 11b).
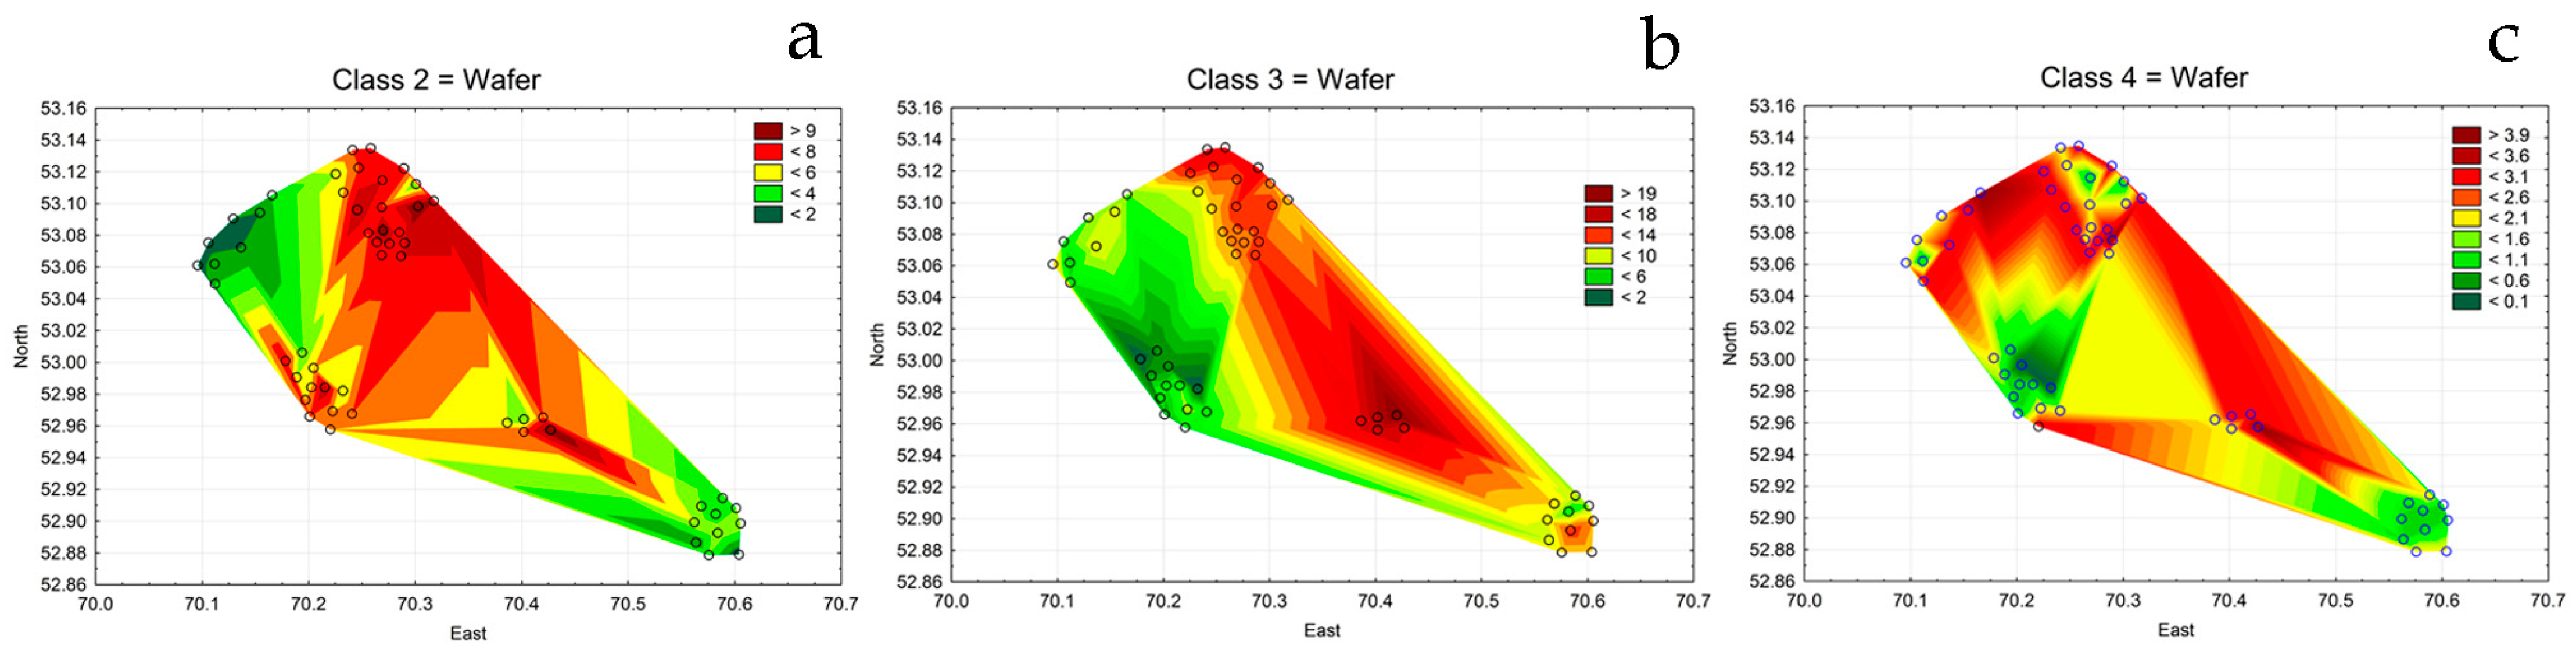
Organic pollution indicators with species-specific index saprobity S were affiliated with the water quality classes. The clear water (Class 2) indicators were mostly presented to south of Borovoye settlement area (Figure 12a), whereas indicators Class 3 of middle polluted waters were concentrated in the central part of mapped area (Figure 12b). However, most interesting for analysis was the distribution of indicators of organically polluted waters of Class 4. They mostly concentrated not at the lakes area itself but near the each lake at the shorelines (Figure 12c).
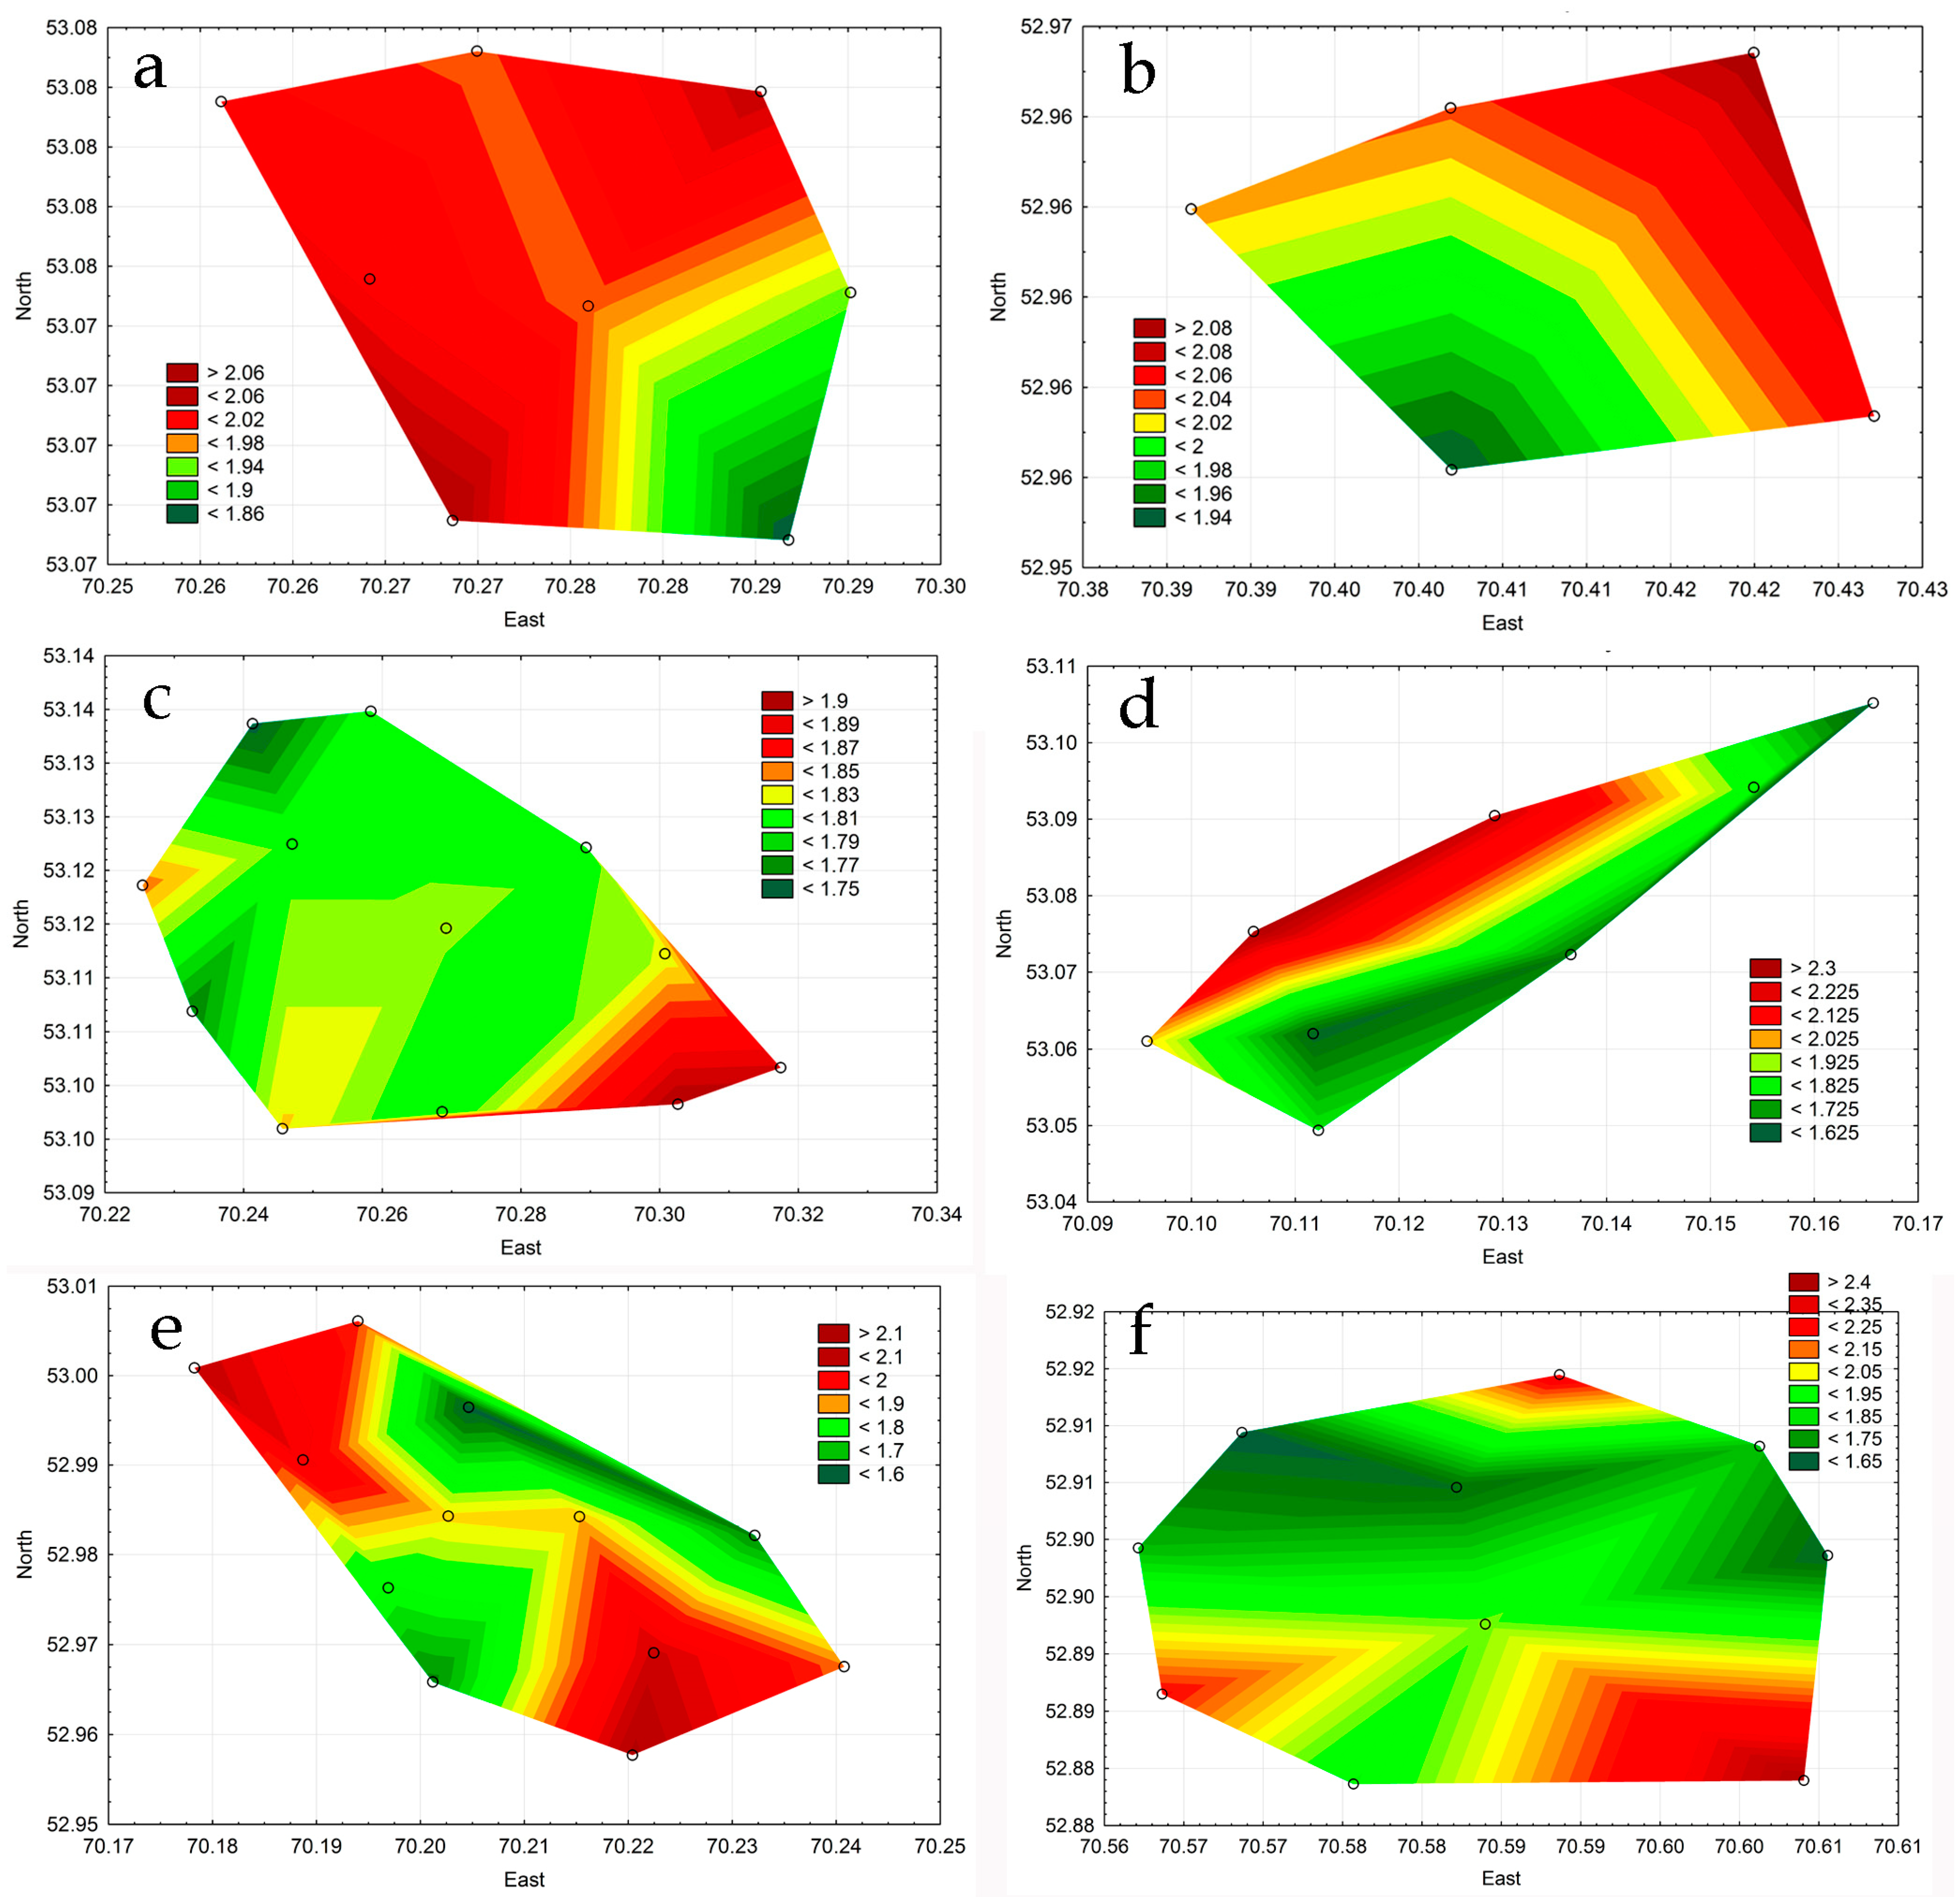
Nevertheless, the saprobity index varied within narrow limits, and its distribution over each lake surface can help to reveal the major pollution sources. The influx of organic pollution, which increased the value of index S, was not the same on the surface of each of the lakes (Figure 13) and was associated with visited lakeshores.
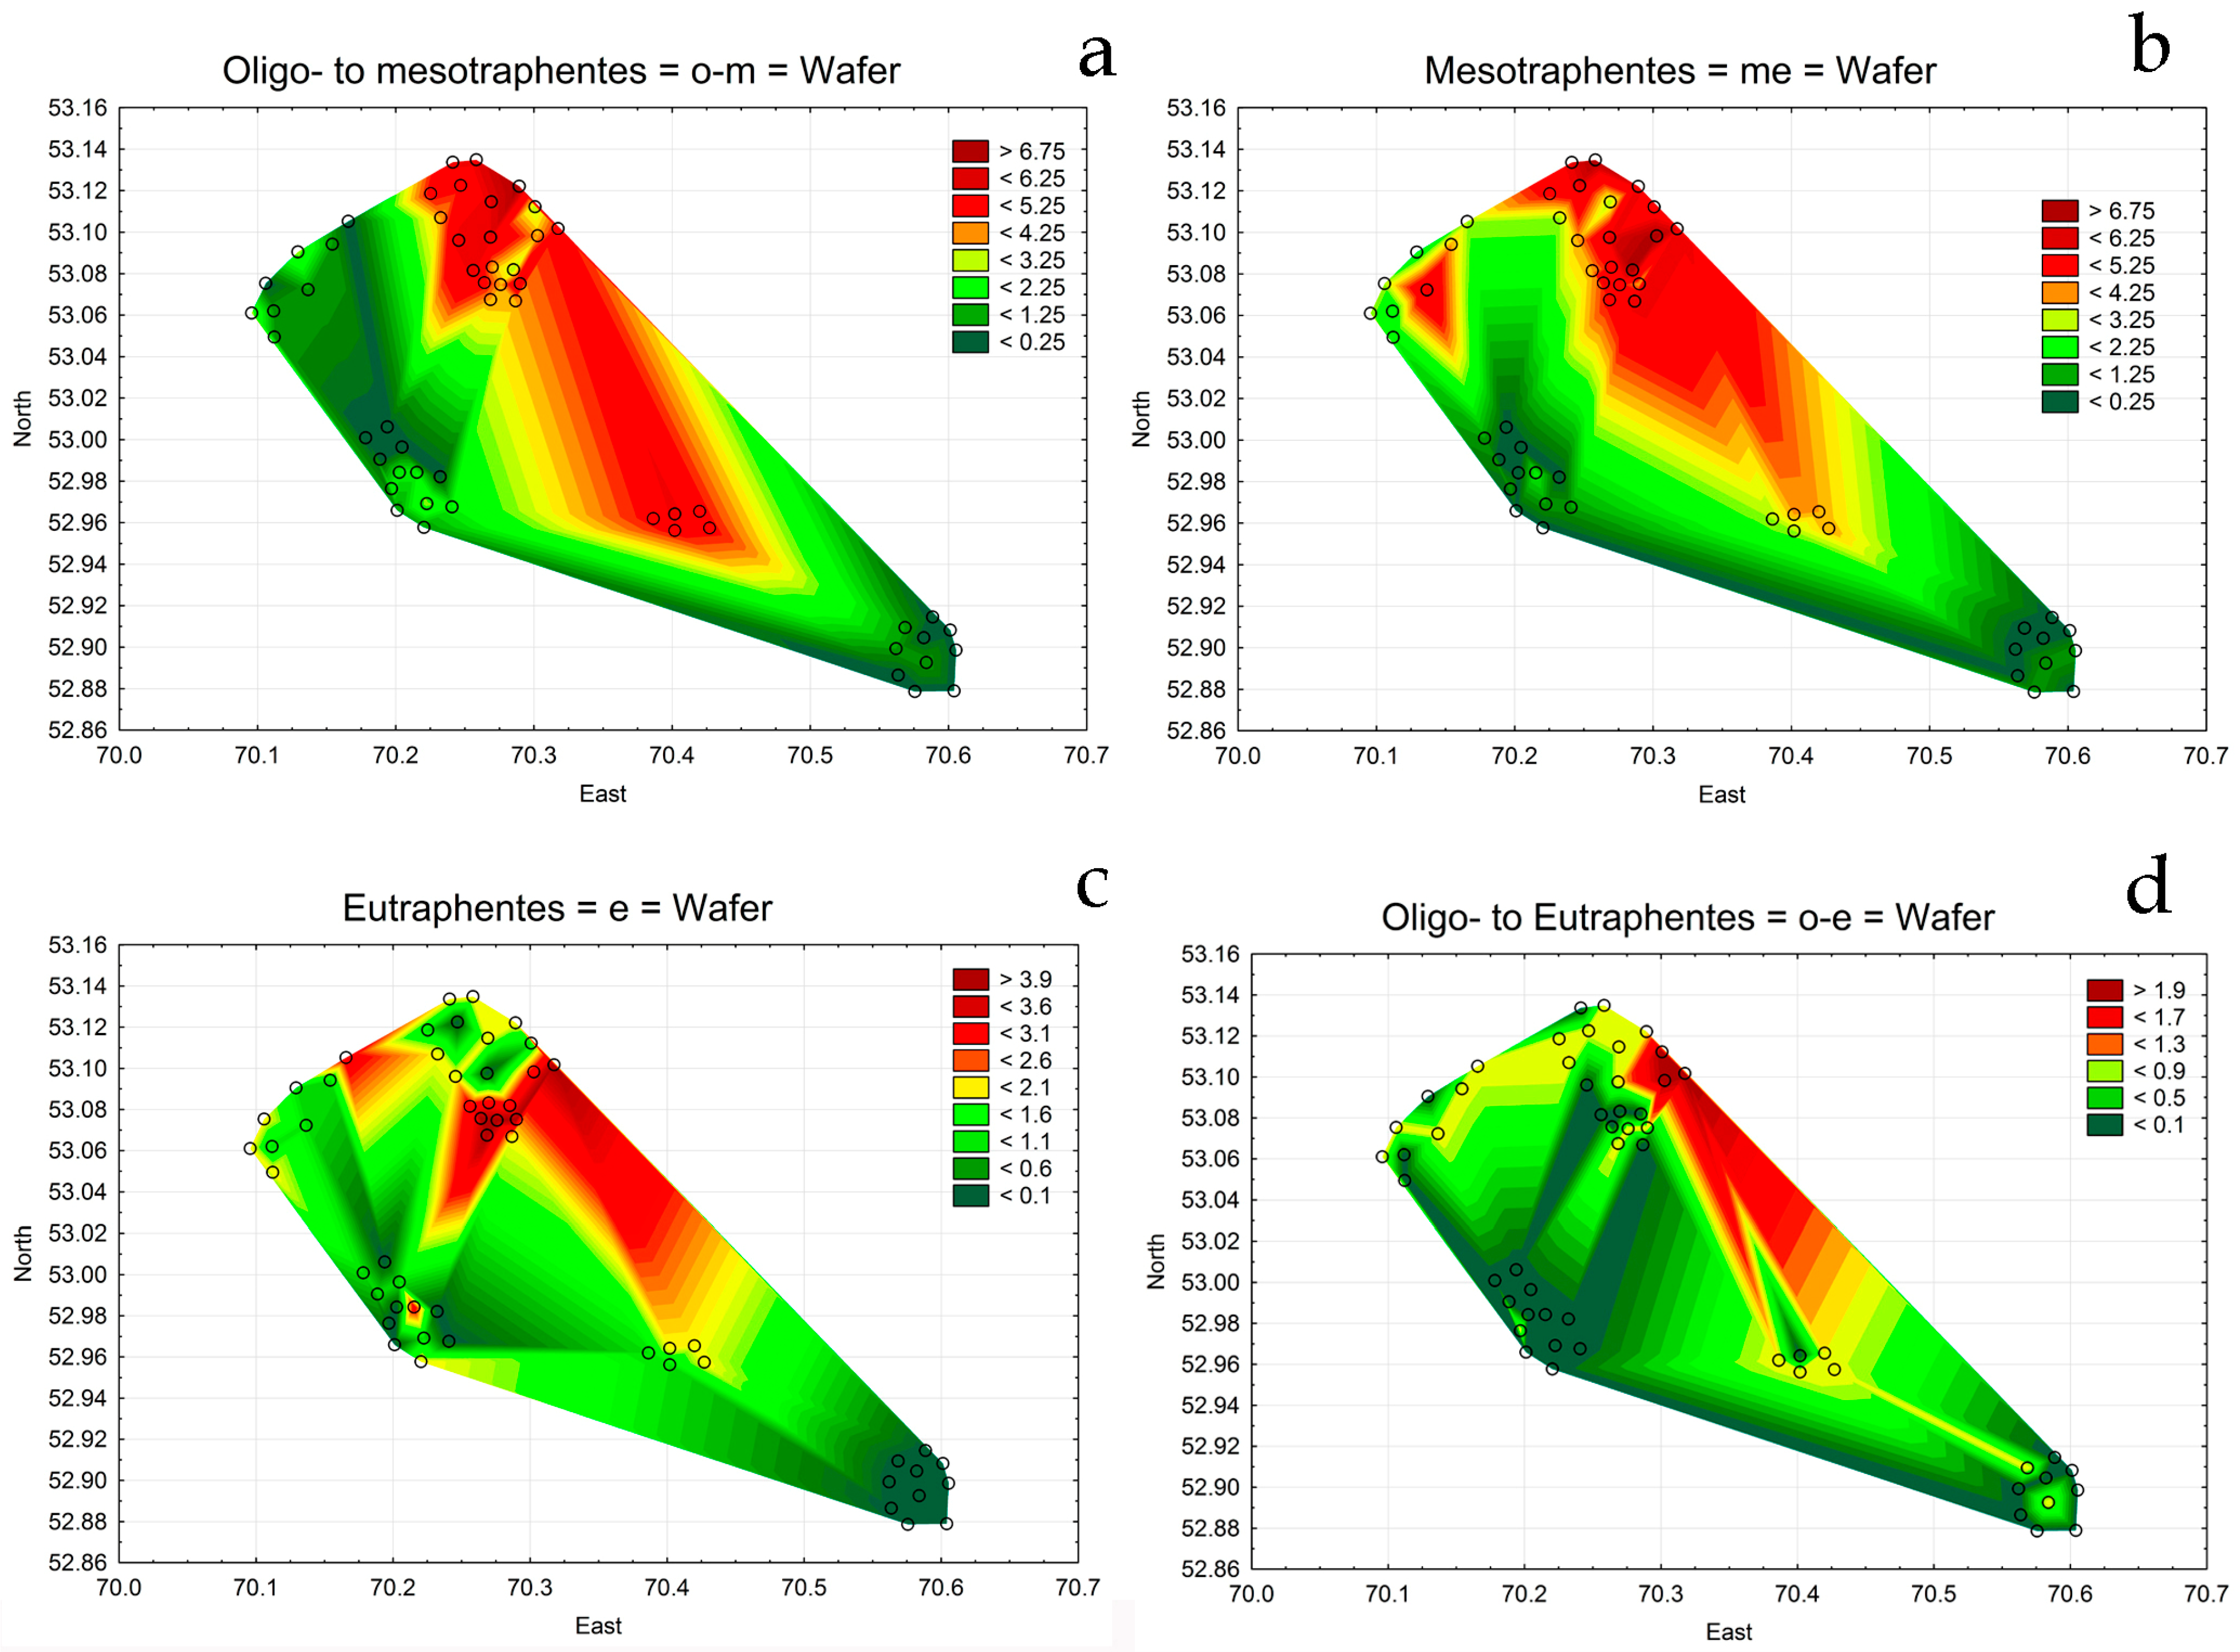
The predominance of nitrogen-autotrophic algae species in the phytoplankton communities that are usually also indicators of oligotrophic and mesotrophic waters was distributed mostly near settled areas (Figure 14a,b) and at the lake surface of Borovoye, both Chebachyes, and Katarkol. Eutrophic water indicators (Figure 14c,d) were concentrated not at the lake area but on the shorelines.
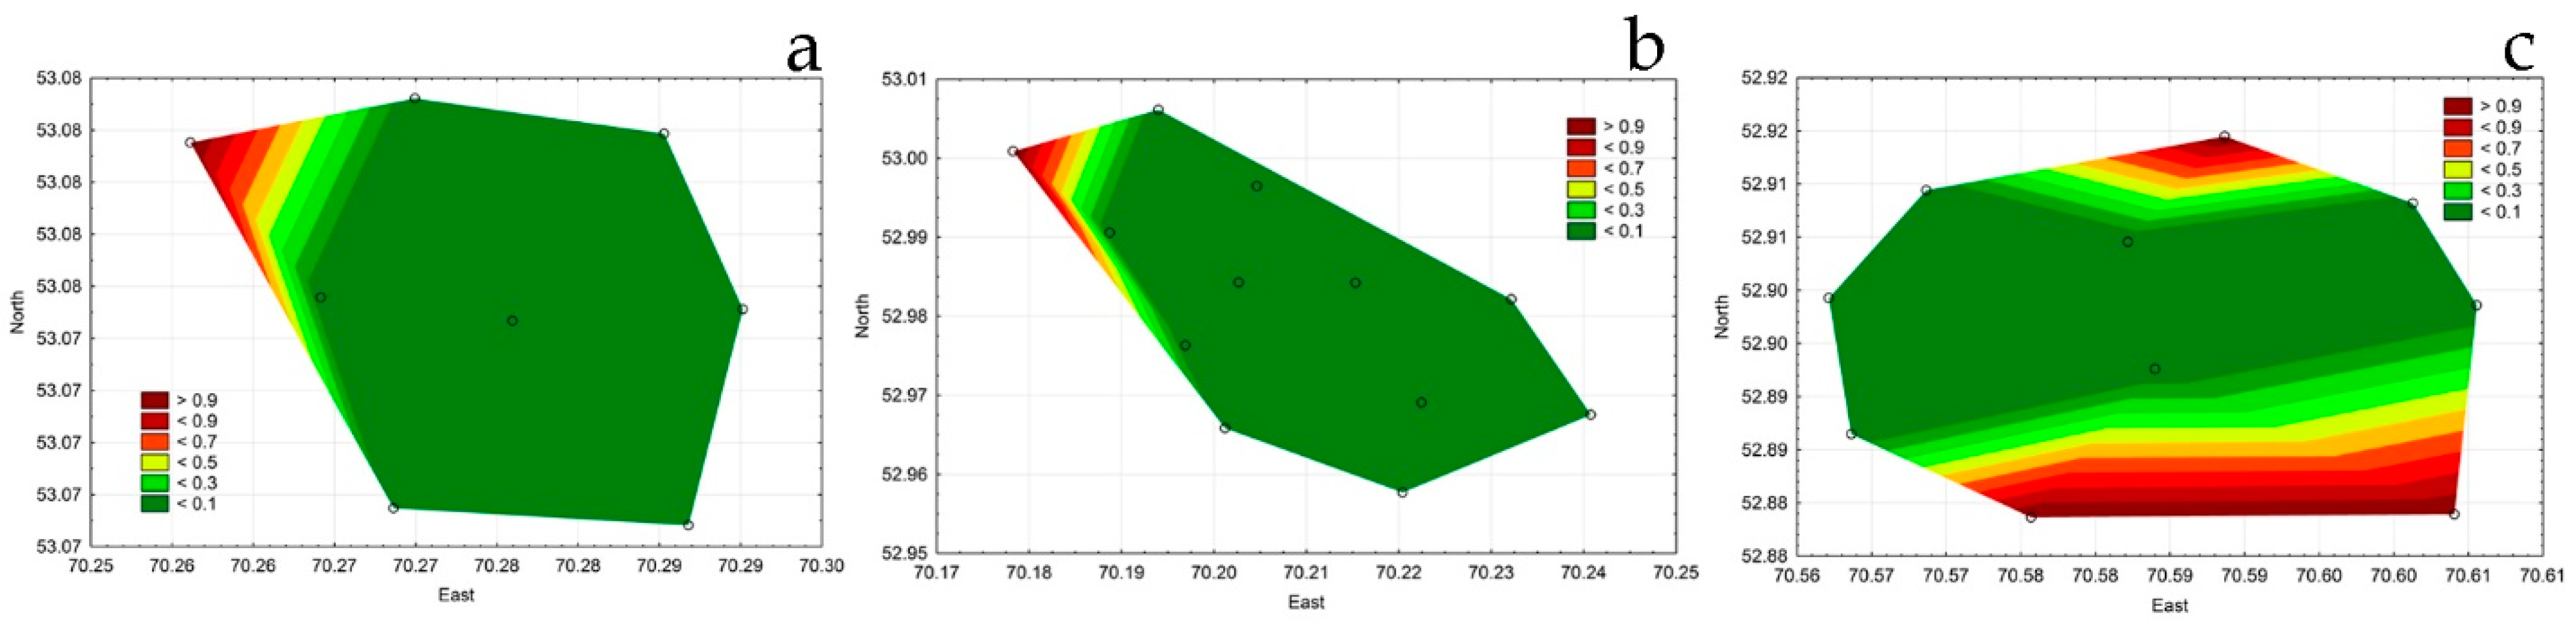
The lakes Shchuchye, Zhukey, and Small Chebachye were characterized by good water saturation with oxygen. Indicators of the presence of hydrogen sulfide in the water were part of the phytoplankton communities of the northwestern parts of the lakes Borovoye (Figure 15a) and Shchuchye (Figure 15b). In Zhukey, species of anoxia indicators were found in the northern and southern parts of the water area (Figure 15c), which are under the influence of the settlements of Zhukey, Karlovka, and Akylbay.
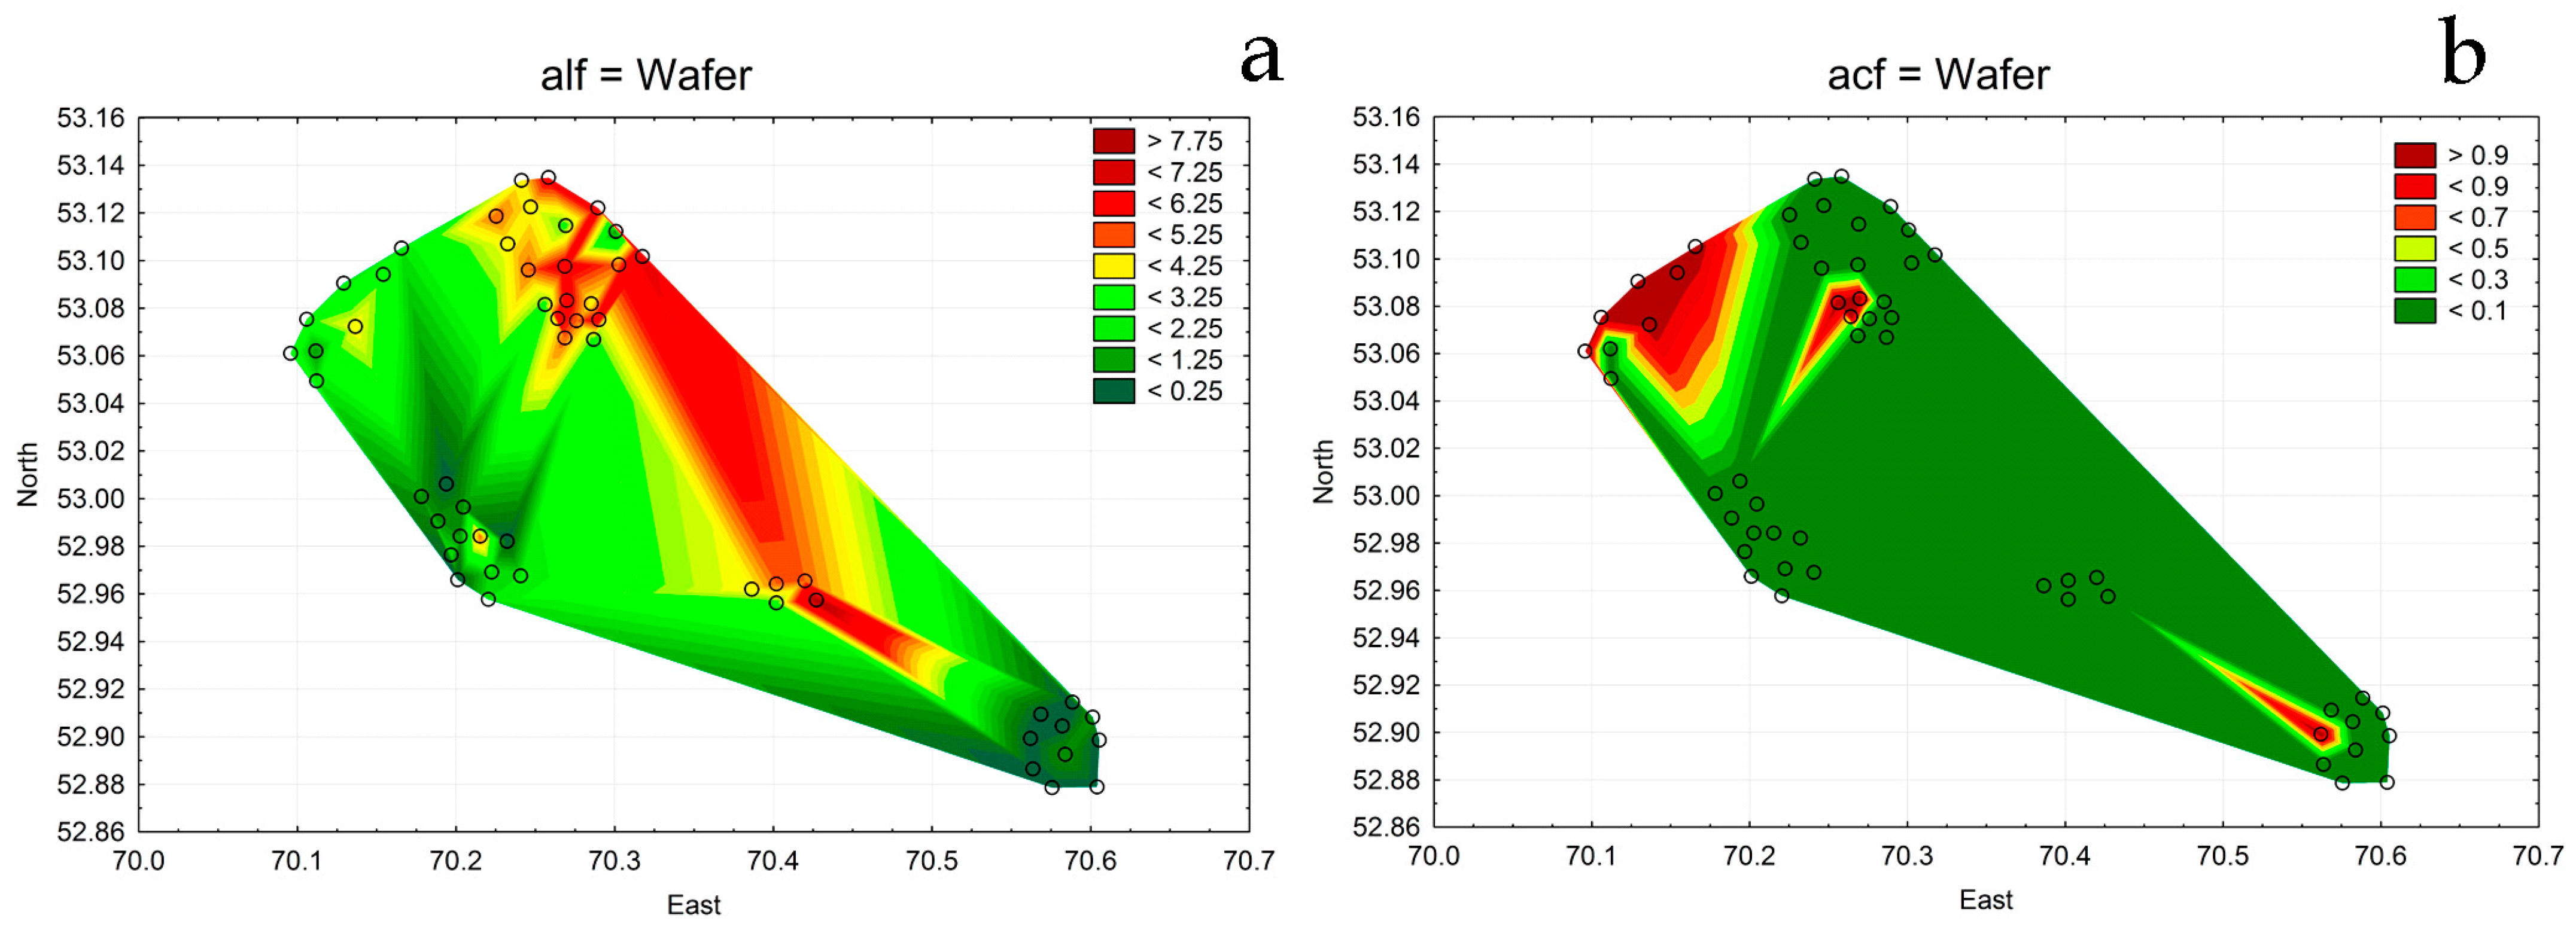
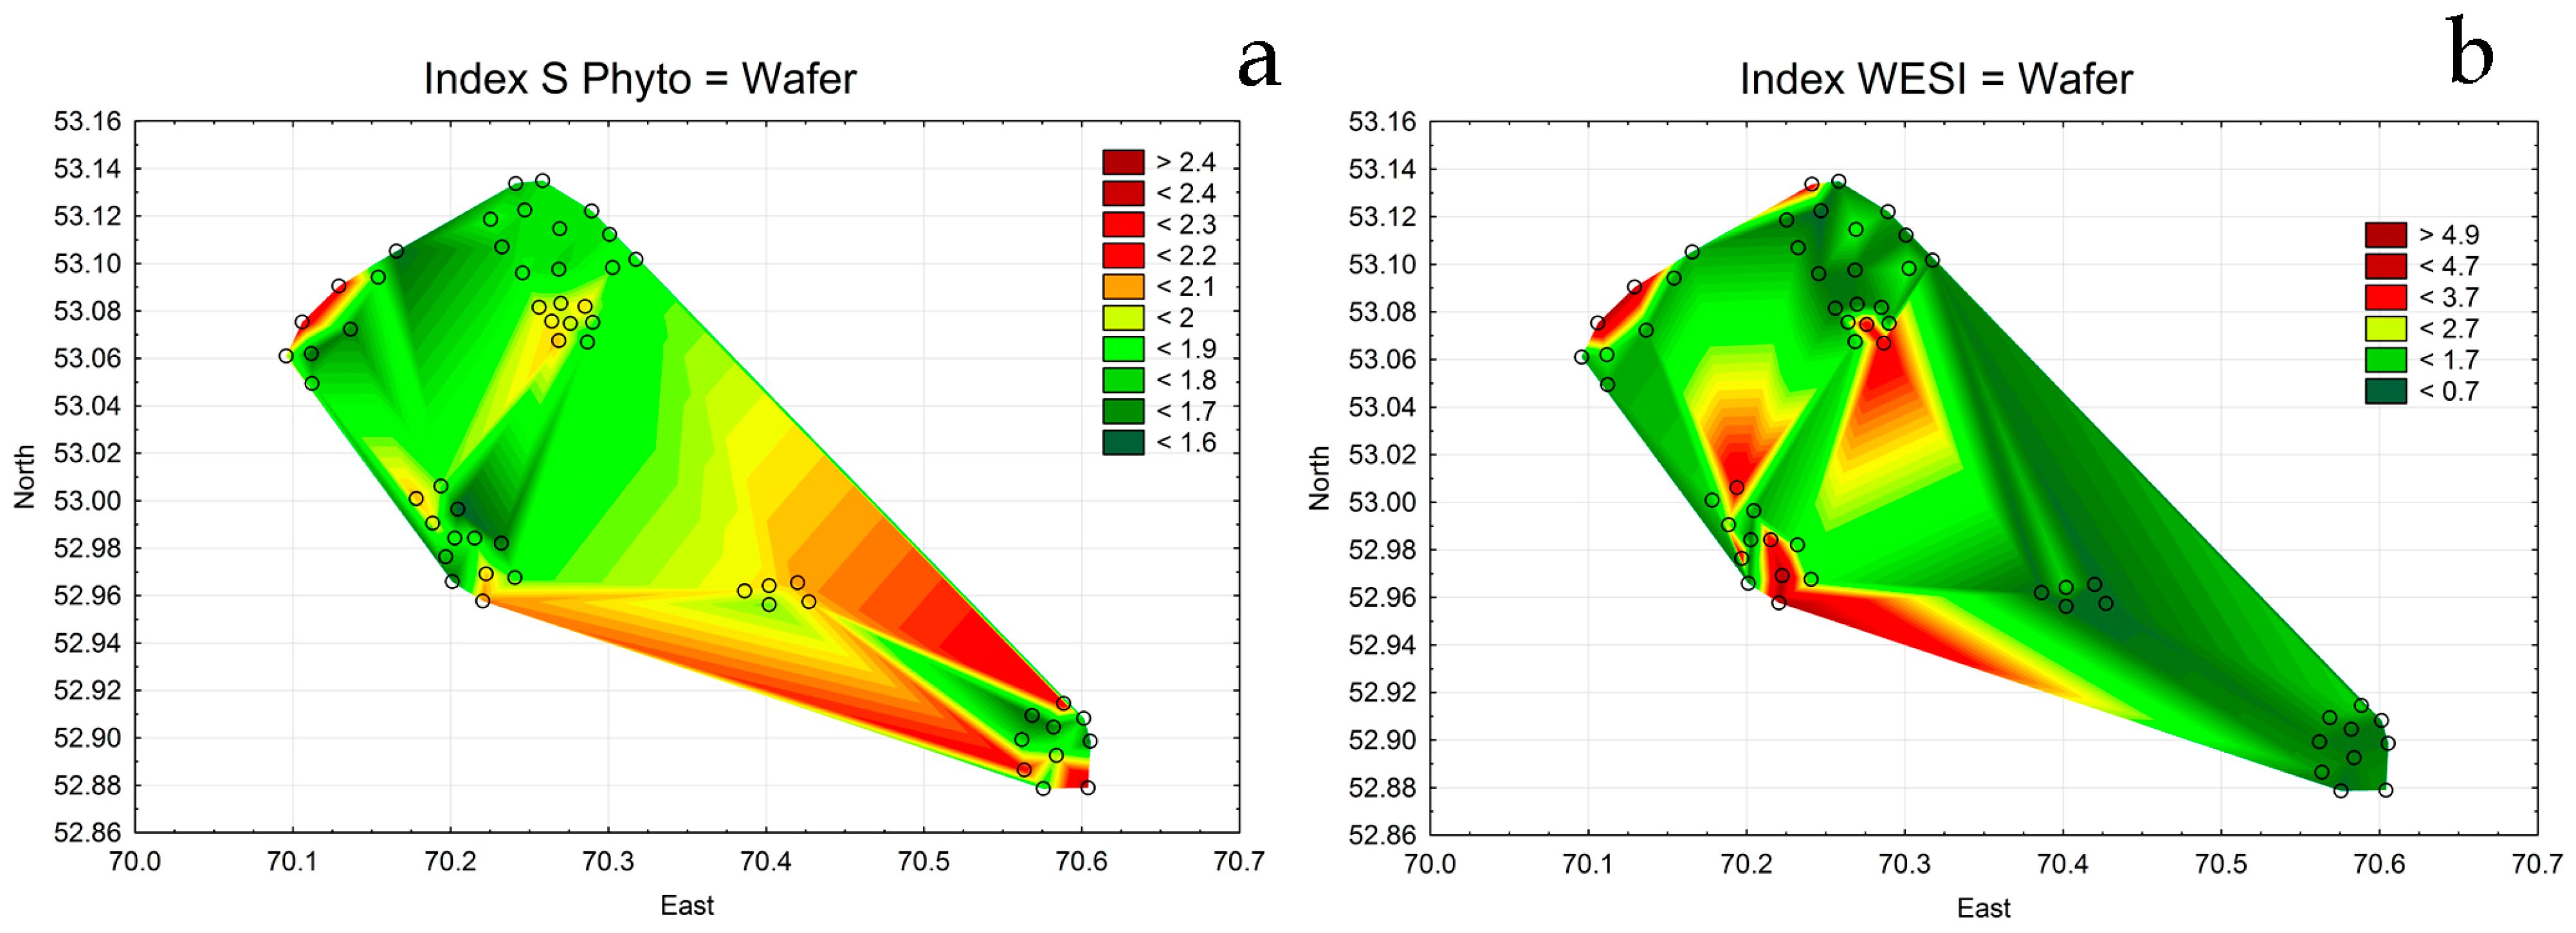
Despite the high nitrogen load, the organic pollution of the surveyed lakes, estimated from the ecological preferences of algae, did not exceed the alpha-mesosaprobic level. Within this gradation, the most polluted was the lake Katarkol, and the clearest were Shchuchye, Zhukey, and Small Chebachye (Figure 16a). The relatively low level of organic pollution of lakes, established by the indicator species of planktonic algae, may be associated with a deficiency of phosphates. The phosphates’ low content in the water of all lakes had a limiting effect on algae. This possibly led to an underestimation of the general level of organic pollution of their ecosystems, associated mainly with nitrogen load. According to the values of the WESI index, some inhibition of the photosynthetic activity of plant cells was observed in a significant part of the lake Katarkol locally and in Large Chebachye and Zhukey (Figure 16b).
WESI values below 1 indicate a potential negative impact on algae communities. The distribution of reduced values of WESI on the surface of each of the lakes (Figure 17) was associated with visited lakeshores and places of chloride inflow. A detailed examination of the maps shows that values of the WESI index of less than 1 were noted only in three lakes, Katarkol, Large Chebachye, and Zhukey. Consequently, the ecosystems of these three lakes are under the threat of significant anthropogenic impact.
Based on the above analysis of the distribution of indicator species, a map of the main sources of pollution located within the outlined zone of ecological mapping was compiled (Figure 18).
A short description of the potential pollution sources in the lakes in the Shchuchinsko-Borovsk Resort Zone is given below with a relevant number in Figure 18.
Lake Borovoye: (1) The village of Borovoye, including rest houses on the northern coast of the Borovoye lake (Baitas Hotel, Burabay sanatorium); (2) beach area along the eastern shore of the lake; (3) children’s sanatorium.
Lake Large Chebachye: (1) The village of Borovoye on the coast of the Large Chebachye and the river Kyrkyruek flowing from the lake Borovoye through the territory of the Terrace Park rest house; (4) beach area on the southern shore of the lake; (5) the village of Borovoye and river runoff from the northeastern shore.
Lake Small Chebachye: (6) Akylbay village.
Lake Shchuchye: (7) Construction site; (8) Shchuchinsky settlement and rest houses on the northeast coast; (9) children’s sanatorium Baldauren and guesthouses D&M, ArRay, Victoria, and Park Hotel Kokshetau; (10) Hotel Rixos; (11) City of Shchuchinsk.
Lake Katarkol: (12) Holiday homes Discovery Borovoye and Edelweiss Borovoye; (13) holiday homes in the northwest; (14) Children’s health center Star, sanatorium Saken Seyfulin, and guesthouse Uyut, and on the second line, the sanatoriums Lesnaya Skazka, Zhezkazganets, Priozerny, and Rufus Lodge boutique hotel; (15) Katarkol village.
Lake Zhukey: (16) Kyzyluyuk village; (17) Karlovka village; (18) Zhukey village.
4. Discussion
A comparison of chemical data in the lakes with literature data [31,32] showed that from 2006 to 2019, water TDS in Borovoye, Small Chebachye, Katarkol, and Zhukey on average slightly decreased. In the lakes Shchuchye and Large Chebachye, on the contrary, the value of TDS was increased. The content of biogenic elements and easily oxidized organic substances in the lakes Borovoye and Small Chebachye has significantly decreased [2,3]. The localization of elevated concentrations of ammonium nitrogen in the zone of influence of balneological facilities indicates the need to take urgent measures to reduce the existing level of organic pollution in the most affected lakes Borovoye and Katarkol and prevent the deterioration of the ecological situation in the remaining lakes of the system. The necessary measures for this are to check the availability and efficiency of the treatment facilities of all balneological and sanatorium–resort facilities located in the catchment area of the lakes. Particular attention should be paid to balneological, and sanatorium facilities located directly in the coastal zone of lakes, as they have the most pronounced impact on the water quality of adjacent water areas [7].
Thus, as a result of a spatial analysis of the distribution of water parameters and phytoplankton, the main sources of impact on lake ecosystems were identified. Both data on the chemical variability of chlorides (Table 1) and maps of the spatial distribution of species richness showed that two of the studied lakes significantly saturated with salts, Zhukey and Small Chebachye (Table 1), were different from the others. The coincidence of high salinity and low species richness shows an overall negative salinity impact on phytoplankton (Table 3; Figure 2, Figure 4b,c and Figure 5), suppressing the number of diatom species and stimulating the development of green algae (Figure 5c). Spatial maps of indicators of warm waters (Figure 7d and Figure 11b) also pay attention to the similarity of salinity and temperature indicators’ distribution, which makes it possible to presumably link the saturation of waters with chlorides with the cause of this, increased warming of the waters.
The impact of high salinity on the algae species richness was revealed for the 48 lakes in Northern Kazakhstan [33]. Statistically confirmed relationships of species richness and chloride concentration were revealed for geographically different but semiarid climatic regions of Kazakhstan and Israel. This lets us assume that chlorides can be a major factor impacting the phytoplankton community in the Burabay Park lakes.
The analysis of the input of organic pollution was based on the calculated indices of saprobity and the distribution of indicators of the trophic state and type of phytoplankton species nutrition. The distribution map of saprobity indices revealed point sources in the lakes Large Chebachye and Zhukey (Figure 13 and Figure 16a). However, the spatial distribution of eutrophic indicators made it possible to expand and clarify the places of impact of organic pollution. They turned out to be associated with the location of all settlements and some visited lakeshores. Thus, objects 1–6 (Figure 18) located on the coast of the lakes Borovoye, Large Chebachye, and Small Chebachye, which are settlements, had the strongest impact. On lake Zhukey, all three objects that had a negative impact on water quality were also settlements 16, 17, and 18 (Figure 18).
This indicates that the main sources of the impact of organic pollution on the trophic state of the lakes of the Burabay Park can be settlements and, to a lesser extent, visited lakeshores. A similar cause of impact has been found in other bodies of water in Kazakhstan near settlements or tourist routes [34]. At the same time, ecological mapping of lakes in Kazakhstan revealed a positive relationship between the number of species and saprobity indices and a negative relationship with salinity as in other European lakes [35,36].
A comprehensive assessment showed that the most severe negative impact on the ecosystems of the shallow lakes of Borovoye and Katarkol was caused by the recreational load of one million tourists per year. Their self-cleaning ability is at the ultimate level. The quality of the water in Large Chebachye is largely determined by the ecological situation in the overlying lake Borovoye due to the flow of water existing between them. Shchuchye is currently a clean water body, which is associated with its deep water and, possibly, with relatively good cleaning of domestic wastewater discharged into it. Nevertheless, indicators of phytoplankton communities indicated the process of eutrophication of its ecosystem. The coastal zone of the lakes Small Chebachye and Zhukey is not affected by tourism, which contributes to the preservation of their natural state.
Along with an increase in anthropogenic pressure, one of the reasons for the deterioration of the ecological state of all lakes may be climate change, resulting in a decrease in water level and an increase in temperature and TDS, which can be seen in the Burabay Park lakes. Therefore, the signs of eutrophication of aquatic ecosystems become more evident in low-water hydrological periods.
Because the lakes are unified to an area landscape and hydrologically separated from the surrounding steppes and representing a monolithic natural health object [6], the ecological mapping of bioindicator species distribution with the help of statistics was successfully used and outlined specific areas that can be assessed as pollution sources and must be given especial attention in monitoring. This method was previously successively used for the spatial analysis of pollution and salinity sources in a homogeneous landscape in the large river delta and a swampy area [27,28]. In the case of the Burabay National Natural Park, the method allows us also to reveal a pollution zone of influence and its specifics, which is difficult to recognize in a table data.
5. Conclusions
The development of new approaches to the analysis of the impact of organic pollution on the natural complexes of Northern Kazakhstan not only is an urgent task, but also makes it possible to formulate proposals for visualizing monitoring data on unique protected natural objects. Based on the results of field observations of phytoplankton in six lakes of the natural and health-improving Shchuchinsko-Borovsk complex in the summer of 2019, it was possible to establish the impact of organic pollution on the ecosystem of each lake, its intensity, and its potential of toxicity. New methods of statistical mapping both for each lake and for the entire natural landscape complex not only show the previously assumed impact of anthropogenic factors, but also highlight the impact of settlements on the deterioration of water quality, which was impossible to determine without using statistical maps of the entire park. In addition, maps of the park area made it possible to identify a potential climate warming factor, the impact of which is associated with an increase in salinity and, as a result, a decrease in the species richness of phytoplankton.
The foregoing indicates the need to take urgent measures to reduce the nutrient load on the ecosystems of all lakes. Particular attention should be paid to monitoring the operation of treatment facilities at resort facilities located directly in their coastal zone. Therefore, the method of ecological mapping can be recommended in the monitoring of the Burabay National Natural Park lakes because it is simple and useful for visualizing scientific results, and for the decision-making system.
Author Contributions
Conceptualization, S.B. and E.K.; methodology, S.B. and E.K.; software, S.B.; validation, S.B. and E.K.; formal analysis, S.B. and Y.K.; investigation, E.K. and Y.K.; resources, E.K.; data curation, S.B. and Y.K.; writing—original draft preparation, S.B. and E.K.; writing—review and editing, S.B. and E.K.; visualization, S.B.; supervision, E.K.; project administration, E.K.; funding acquisition, E.K. All authors have read and agreed to the published version of the manuscript.
Funding
This research was partly funded by the Ministry of Science and Higher Education of the Republic of Kazakhstan, the Scientific Program “Assessment of biological resources of the Kazakh part of the transboundary Irtysh basin in the context of climate change (BR18574062)” as well as partly supported by the Israeli Ministry of Aliyah and Integration.
Institutional Review Board Statement
Not applicable.
Informed Consent Statement
Not applicable.
Data Availability Statement
Conflicts of Interest
The authors declare no conflict of interest.
Appendix A

Table A1.
Species composition and ecological preferences of phytoplankton in the lakes of the Burabay Natural Park, summer 2019.
Table A1.
Species composition and ecological preferences of phytoplankton in the lakes of the Burabay Natural Park, summer 2019.
| Taxa | Hab | T | Oxy | pH | Sal | D | Sap | Tro | Aut–Het | Index S | B | SC | LC | K | Z | S |
|---|---|---|---|---|---|---|---|---|---|---|---|---|---|---|---|---|
| Cyanobacteria | ||||||||||||||||
| Anabaena contorta Bachmann | P | - | st-str | - | - | - | - | - | - | - | 1 | 1 | 0 | 0 | 0 | 0 |
| Anabaena cylindrica Lemmermann | P-B, S | - | aer | - | - | - | b-o | - | - | 1.70 | 0 | 0 | 1 | 0 | 1 | 0 |
| Anagnostidinema amphibium (C. Agardh ex Gomont) Strunecký, Bohunická, J.R. Johansen & J. Komárek | P-B, S | - | st-str, H2S | - | hl | - | a-o | m | - | 2.60 | 1 | 0 | 0 | 0 | 1 | 1 |
| Anathece clathrata (West & G.S. West) Komárek, Kastovsky & Jezberová | P | - | - | - | hl | - | o-a | me | - | 1.80 | 1 | 0 | 1 | 1 | 0 | 0 |
| Aphanocapsa delicatissima West & G.S. West | P-B | - | - | - | i | - | - | m | - | - | 0 | 1 | 0 | 0 | 0 | 0 |
| Aphanocapsa grevillei (Berkeley) Rabenhorst | P | - | - | - | hb | - | o-b | - | - | 1.40 | 0 | 0 | 0 | 0 | 0 | 0 |
| Aphanocapsa holsatica (Lemmermann) G. Cronberg & Komárek | P | - | - | - | i | - | o-b | me | - | 1.40 | 1 | 1 | 0 | 0 | 0 | 0 |
| Aphanocapsa incerta (Lemmermann) G. Cronberg & Komárek | P-B | - | - | - | i | - | b | me | - | 2.20 | 1 | 1 | 1 | 0 | 0 | 0 |
| Aphanocapsa planctonica (G.M. Smith) Komárek & Anagnostidis | P | - | - | - | i | - | - | ot | - | - | 1 | 0 | 0 | 0 | 0 | 0 |
| Chroococcus minimus (Keissler) Lemmermann | P-B | - | - | - | hl | - | - | o-m | - | - | 1 | 1 | 1 | 1 | 0 | 0 |
| Chroococcus minor (Kützing) Nägeli | B,S | - | - | - | - | - | o-b | ot | - | 1.40 | 0 | 1 | 0 | 0 | 1 | 0 |
| Chroococcus minutus (Kützing) Nägeli | P-B | - | - | ind | i | - | o-a | o-m | - | 1.80 | 1 | 1 | 1 | 1 | 0 | 0 |
| Chroococcus turgidus (Kützing) Nägeli | P-B, S | - | aer | alf | hl | - | x-b | - | - | 0.80 | 0 | 0 | 0 | 1 | 0 | 0 |
| Gomphosphaeria aponina Kützing | P-B | - | st-str | alf | hl | - | o | ot | - | 1.20 | 0 | 0 | 1 | 0 | 0 | 0 |
| Gomphosphaeria cordiformis (Wille) Hansgirg | P | - | st | - | - | - | - | - | - | - | 0 | 0 | 0 | 1 | 0 | 1 |
| Jaaginema geminatum (Schwabe ex Gomont) Anagnostidis & Komárek | P-B, Ep | warm | st | - | i | - | - | - | - | - | 0 | 0 | 0 | 0 | 1 | 0 |
| Limnococcus limneticus (Lemmermann) Komárková, Jezberová, O.Komárek & Zapomelová | P | - | - | - | i | - | b-o | o-m | - | 1.65 | 0 | 0 | 0 | 1 | 0 | 0 |
| Merismopedia glauca (Ehrenberg) Kützing | P-B | - | - | ind | i | - | b-o | o-m | - | 1.75 | 0 | 1 | 0 | 0 | 0 | 0 |
| Merismopedia minima G. Beck | B,S | - | aer | - | - | - | - | ot | - | - | 0 | 1 | 1 | 1 | 1 | 0 |
| Merismopedia tenuissima Lemmermann | P-B | - | - | - | hl | - | b-a | e | - | 2.40 | 1 | 1 | 0 | 0 | 0 | 0 |
| Merismopedia tranquilla (Ehrenberg) Trevisan | P-B | - | - | ind | i | - | o-a | me | - | 1.80 | 0 | 0 | 1 | 0 | 0 | 0 |
| Microcystis aeruginosa (Kützing) Kützing | P | - | - | - | hl | - | b | e | - | 2.10 | 1 | 0 | 1 | 1 | 0 | 1 |
| Oscillatoria planctonica Woloszynska | P | - | - | - | i | - | o-b | me | - | 1.50 | 0 | 0 | 0 | 0 | 1 | 0 |
| Phormidium chalybeum (Mertens ex Gomont) Anagnostidis & Komárek | P-B, S | - | st-str | - | - | - | a | e | - | 3.30 | 0 | 1 | 0 | 0 | 0 | 0 |
| Phormidium sp. | - | - | - | - | - | - | - | - | - | - | 0 | 1 | 1 | 0 | 0 | 0 |
| Planktolyngbya contorta (Lemmermann) Anagnostidis & Komárek | P | - | - | - | - | - | o-a | me | - | 1.80 | 1 | 1 | 0 | 0 | 0 | 0 |
| Planktolyngbya limnetica (Lemmermann) Komárková-Legnerová & Cronberg | P-B, S | - | st-str | - | hl | - | o-b | e | - | 1.50 | 1 | 1 | 1 | 0 | 0 | 1 |
| Radiocystis geminata Skuja | P | - | - | - | - | - | - | me | - | - | 1 | 0 | 1 | 1 | 0 | 1 |
| Rhabdoderma lineare Schmidle & Lauterborn | P | - | - | - | hb | - | o-a | o-m | - | 1.80 | 1 | 0 | 1 | 1 | 0 | 1 |
| Snowella lacustris (Chodat) Komárek & Hindák | P | - | - | - | i | - | b-o | me | - | 1.60 | 1 | 0 | 1 | 0 | 0 | 1 |
| Bacillariophyta | ||||||||||||||||
| Achnanthidium minutissimum (Kützing) Czarnecki | P-B | eterm | st-str | ind | i | es | x-b | o-e | ate | 0.95 | 1 | 0 | 1 | 1 | 0 | 1 |
| Amphora commutata Grunow | B | - | - | - | hl | - | - | e | - | - | 0 | 0 | 1 | 0 | 0 | 0 |
| Amphora ovalis (Kützing) Kützing | B | temp | st-str | alf | i | sx | o-b | me | ate | 1.50 | 1 | 0 | 1 | 0 | 0 | 0 |
| Aulacoseira granulata (Ehrenberg) Simonsen | P-B | temp | st-str | ind | i | es | b | me | ate | 2.00 | 1 | 0 | 1 | 1 | 0 | 0 |
| Caloneis bacillum (Grunow) Cleve | B | temp | st-str | ind | i | es | o | me | ats | 1.30 | 1 | 0 | 0 | 0 | 0 | 0 |
| Cocconeis placentula Ehrenberg | P-B | temp | st-str | alf | i | es | o | me | ate | 1.35 | 0 | 1 | 1 | 1 | 0 | 0 |
| Ctenophora pulchella (Ralfs ex Kützing) D.M. Williams & Round | P-B | - | st-str | alf | i | - | b | o-m | ate | 2.30 | 0 | 0 | 0 | 1 | 0 | 0 |
| Cyclotella choctawhatcheeana Prasad | P | - | - | - | hl | - | - | - | - | - | 0 | 1 | 1 | 0 | 0 | 0 |
| Cyclotella meneghiniana Kützing | P-B | temp | st | alf | hl | sp | a-o | e | hne | 2.80 | 1 | 1 | 1 | 1 | 0 | 0 |
| Cymbella affinis Kützing | B | temp | st-str | alf | i | sx | o | ot | ats | 1.10 | 0 | 0 | 1 | 1 | 0 | 0 |
| Cymbella cistula (Ehrenberg) O.Kirchner | B | - | st-str | alf | i | sx | o | e | ats | 1.20 | 1 | 0 | 0 | 0 | 0 | 0 |
| Cymbella helvetica Kützing | B | - | str | ind | i | - | o-x | o-m | - | 0.60 | 1 | 0 | 0 | 0 | 0 | 0 |
| Cymbella lanceolata (C. Agardh) C. Agardh | B | - | str | alf | i | sx | o-b | me | ats | 1.50 | 0 | 0 | 1 | 0 | 0 | 0 |
| Cymbella parva (W. Smith) Kirchner | B | - | - | ind | I | - | b | o-m | - | 2.00 | 0 | 0 | 1 | 0 | 0 | 0 |
| Cymbopleura naviculiformis (Auerswald ex Heiberg) Krammer | B | - | st-str | ind | i | es | o | o-m | ate | 1.20 | 0 | 0 | 1 | 0 | 0 | 0 |
| Diatoma vulgaris Bory | P-B | - | st-str | ind | i | sx | b | me | ate | 2.20 | 1 | 0 | 1 | 1 | 0 | 0 |
| Diploneis smithii (Brébisson) Cleve | B | - | - | alf | I | - | b | o-m | - | 2.00 | 1 | 0 | 0 | 0 | 0 | 0 |
| Discostella stelligera (Cleve & Grunow) Houk & Klee | P | - | - | ind | I | - | o-b | o-m | - | 1.40 | 1 | 0 | 0 | 0 | 0 | 0 |
| Encyonema elginense (Krammer) D.G. Mann | B | temp | st | acf | hb | sx | o-b | - | - | 1.50 | 1 | 0 | 0 | 0 | 0 | 0 |
| Encyonema lacustre (C. Agardh) Pantocsek | B | - | - | ind | hl | sx | b-a | me | - | 2.40 | 0 | 0 | 1 | 0 | 0 | 0 |
| Epithemia adnata (Kützing) Brébisson | B | temp | st | alb | i | sx | o | me | ats | 1.20 | 0 | 0 | 0 | 0 | 1 | 1 |
| Epithemia gibba (Ehrenberg) Kützing | B | temp | - | alb | i | es | x-o | - | - | 0.40 | 0 | 1 | 0 | 0 | 0 | 0 |
| Epithemia sorex Kützing | B | temp | st-str | alf | i | sx | o | me | ats | 1.10 | 0 | 0 | 0 | 0 | 0 | 1 |
| Eunotia arcus Ehrenberg | B | - | st-str | acf | i | - | x-o | ot | ats | 0.50 | 0 | 0 | 0 | 0 | 0 | 0 |
| Fragilaria capucina Desmazières | P-B | - | - | ind | i | es | b-o | m | - | 1.60 | 0 | 0 | 0 | 0 | 0 | 0 |
| Fragilaria radians (Kützing) D.M. Williams & Round | P-B | - | st-str | alf | I | sx | b-o | o-m | - | 1.70 | 1 | 0 | 1 | 1 | 0 | 0 |
| Gomphonella calcarea (Cleve) R. Jahn & N. Abarca | B | - | st-str | alf | i | - | b | o-m | ate | 2.30 | 0 | 0 | 1 | 0 | 0 | 0 |
| Gomphonella olivacea (Hornemann) Rabenhorst | B | - | st-str | alf | i | es | o-b | e | ate | 1.45 | 1 | 0 | 1 | 0 | 0 | 1 |
| Gomphonema acuminatum Ehrenberg | B | - | st | ind | i | es | o-b | o-m | ats | 1.40 | 1 | 0 | 0 | 0 | 0 | 0 |
| Gomphonema gracile Ehrenberg | B | temp | st | alf | i | es | x-b | m | ats | 0.80 | 1 | 0 | 0 | 0 | 0 | 0 |
| Gyrosigma strigilis (W.Smith) J.W. Griffin & Henfrey | B | - | - | - | mh | - | - | - | - | - | 1 | 0 | 0 | 0 | 0 | 0 |
| Halamphora veneta (Kützing) Levkov | B | - | st-str | alf | i | es | a-o | e | ate | 2.60 | 1 | 0 | 1 | 0 | 0 | 0 |
| Hantzschia amphioxys (Ehrenberg) Grunow | B | temp | st-str | ind | I | es | o-a | o-e | ate | 1.90 | 0 | 1 | 0 | 0 | 0 | 0 |
| Lemnicola exigua (Grunow) Kulikovskiy, Witkowski & Plinski | B | eterm | st-str | alf | i | sp | b | o-e | ate | 2.00 | 0 | 0 | 0 | 0 | 0 | 0 |
| Lindavia comta (Kützing) Nakov, Gullory, Julius, Theriot & Alverson | P | - | st | alf | i | sx | o | o-m | - | 1.20 | 1 | 1 | 1 | 1 | 1 | 0 |
| Mastogloia braunii Grunow | P-B | - | - | alf | mh | - | - | - | - | - | 0 | 0 | 0 | 0 | 0 | 1 |
| Mastogloia lacustris (Grunow) Grunow | B | - | str | alf | hl | - | o | e | ats | 1.30 | 0 | 0 | 0 | 0 | 0 | 1 |
| Mastogloia smithii Thwaites ex W. Smith | B | - | - | alf | mh | sx | o | me | - | 1.30 | 0 | 0 | 0 | 0 | 0 | 0 |
| Melosira varians C.Agardh | P-B | temp | st-str | ind | hl | es | b | me | hne | 2.10 | 1 | 0 | 0 | 0 | 0 | 0 |
| Navicula cincta (Ehrenberg) Ralfs | B | warm | st-str | alf | hl | es | x-o | me | ate | 0.50 | 0 | 1 | 0 | 0 | 0 | 0 |
| Navicula cryptocephala Kützing | P-B | temp | st-str | ind | i | es | b | o-e | ate | 2.10 | 0 | 0 | 1 | 0 | 1 | 0 |
| Navicula oblonga (Kützing) Kützing | - | - | - | - | - | - | - | - | - | - | 1 | 0 | 1 | 0 | 0 | 0 |
| Navicula radiosa Kützing | B | temp | st-str | ind | i | es | o | me | ate | 1.30 | 0 | 0 | 1 | 1 | 0 | 0 |
| Navicula rhynchocephala Kützing | B | - | - | alf | hl | - | o-a | o-m | ate | 1.95 | 0 | 0 | 1 | 0 | 0 | 0 |
| Navicula tripunctata (O.F. Müller) Bory | P-B | - | st-str | ind | i | es | b-o | e | ate | 1.70 | 0 | 0 | 1 | 0 | 0 | 0 |
| Nitzschia amphibia Grunow | P-B, S | temp | st-str | alf | i | sp | b | e | hne | 2.10 | 0 | 0 | 0 | 0 | 0 | 1 |
| Nitzschia dissipata (Kützing) Rabenhorst | B | - | st-str | alf | i | sx | b-o | me | ate | 1.70 | 0 | 0 | 1 | 0 | 0 | 0 |
| Nitzschia palea (Kützing) W. Smith | P-B | temp | - | ind | i | sp | a-o | he | hce | 2.80 | 0 | 0 | 0 | 0 | 0 | 1 |
| Rhoicosphenia abbreviata (C. Agardh) Lange-Bertalot | B | - | st-str | alf | i | es | o-a | me | ate | 1.90 | 0 | 1 | 0 | 0 | 0 | 0 |
| Sellaphora pupula (Kützing) Mereschkovsky | B | eterm | st | ind | hl | sx | o-a | me | ate | 1.90 | 1 | 0 | 0 | 1 | 0 | 1 |
| Stauroneis anceps Ehrenberg | P-B | - | st-str | ind | i | sx | o | o-m | ate | 1.30 | 0 | 1 | 0 | 0 | 1 | 0 |
| Staurosira leptostauron (Ehrenberg) Kulikovskiy & Genka | - | - | - | - | - | - | - | - | - | 1.10 | 1 | 0 | 0 | 0 | 0 | 0 |
| Stephanodiscus hantzschii Grunow | P | temp | st | alf | i | es | a-o | o-m | hne | 2.70 | 1 | 0 | 1 | 1 | 0 | 1 |
| Surirella elegans Ehrenberg | P-B | - | str | alf | i | - | o | me | - | 1.00 | 1 | 0 | 0 | 0 | 0 | 0 |
| Ulnaria acus (Kützing) Aboal | P-B | - | st-str | alf | i | es | o-a | o-m | - | 1.85 | 1 | 0 | 0 | 0 | 0 | 1 |
| Ulnaria amphirhynchus (Ehrenberg) Compère & Bukhtiyarova | P-B | - | - | alf | i | es | b | o-m | - | 2.00 | 1 | 1 | 1 | 0 | 0 | 0 |
| Ulnaria capitata (Ehrenberg) Compère | P-B | - | st-str | alf | i | es | o-b | e | ats | 1.50 | 1 | 0 | 0 | 0 | 0 | 0 |
| Miozoa | ||||||||||||||||
| Ceratium hirundinella (O.F. Müller) Dujardin | P | - | st-str | - | i | - | o | - | - | 1.30 | 1 | 0 | 1 | 1 | 0 | 1 |
| Naiadinium polonicum (Woloszynska) Carty | P | - | st | - | - | - | o | - | - | 1.30 | 1 | 0 | 1 | 1 | 1 | 1 |
| Peridiniopsis quadridens (F. Stein) Bourrelly | P | - | - | - | - | - | o-b | - | - | 1.40 | 1 | 0 | 1 | 1 | 0 | 1 |
| Peridinium bipes F.Stein | P | - | st-str | - | oh | - | o | - | - | 1.30 | 1 | 0 | 0 | 0 | 0 | 0 |
| Peridinium cinctum (O.F.Müller) Ehrenberg | P-B | - | st-str | - | i | - | b-o | - | - | 1.60 | 0 | 0 | 1 | 1 | 0 | 1 |
| Ochrophyta | ||||||||||||||||
| Dinobryon divergens O.E. Imhof | P | - | st-str | ind | i | - | o-b | - | - | 1.45 | 1 | 0 | 1 | 0 | 0 | 1 |
| Dinobryon sociale (Ehrenberg) Ehrenberg | P | - | - | - | i | - | o | - | - | 1.20 | 0 | 0 | 0 | 1 | 0 | 1 |
| Kephyrion inconstans (Gerlinde Schmid) Bourrelly | B | - | - | - | oh | - | o-b | - | - | 1.50 | 0 | 0 | 0 | 0 | 0 | 1 |
| Charophyta | ||||||||||||||||
| Cosmarium depressum (Nägeli) P. Lundell, nom. illeg. | B | - | st | ind | hb | - | o | m | - | 1.20 | 1 | 0 | 0 | 0 | 0 | 1 |
| Cosmarium granatum Brébisson ex Ralfs | B | - | st-str | ind | i | - | o | m | - | 1.20 | 0 | 0 | 1 | 1 | 1 | 1 |
| Cosmarium undulatum Corda ex Ralfs | P-B | - | - | acf | - | - | - | m | - | - | 1 | 0 | 0 | 0 | 0 | 0 |
| Elakatothrix lacustris Korshikov | P | - | - | - | oh | - | b | - | - | 2.00 | 0 | 0 | 1 | 1 | 0 | 1 |
| Euastrum lacustre (Messikommer) Coesel | - | - | - | ind | - | - | - | m | - | - | 0 | 0 | 0 | 0 | 0 | 1 |
| Chlorophyta | ||||||||||||||||
| Ankyra judayi (G.M. Smith) Fott | Ep | - | - | - | - | - | b | - | - | 2.10 | 0 | 0 | 0 | 0 | 1 | 0 |
| Binuclearia lauterbornii (Schmidle) Proschkina-Lavrenko | - | - | - | - | - | - | o-a | - | - | 1.80 | 1 | 0 | 1 | 1 | 1 | 1 |
| Botryococcus braunii Kützing | P-B | - | st | ind | i | - | o-b | - | - | 1.50 | 1 | 0 | 1 | 1 | 1 | 0 |
| Chlorella vulgaris Beyerinck [Beijerinck] | P-B, pb,S | - | - | - | hl | - | a | - | - | 3.10 | 1 | 1 | 1 | 1 | 1 | 1 |
| Coenochloris pyrenoidosa Korshikov | P | - | - | - | hl | - | - | - | - | - | 0 | 1 | 0 | 0 | 0 | 0 |
| Crucigenia quadrata Morren | P-B | - | st-str | acf | i | - | o-a | - | - | 1.90 | 0 | 1 | 0 | 0 | 1 | 0 |
| Desmodesmus brasiliensis (Bohlin) E. Hegewald | P-B | - | st-str | - | - | - | b | - | - | 2.00 | 1 | 0 | 1 | 1 | 1 | 1 |
| Desmodesmus granulatus (West & G.S. West) Tsarenko | P-B | - | st-str | - | - | - | b-a | - | - | 2.40 | 0 | 0 | 0 | 1 | 0 | 0 |
| Dictyosphaerium ehrenbergianum Nägeli | P-B | - | st-str | - | - | - | o-b | - | - | 1.50 | 0 | 1 | 0 | 0 | 0 | 0 |
| Franceia amphitricha (Lagerheim) Hegewald | - | - | - | - | - | - | - | - | - | - | 0 | 0 | 0 | 1 | 0 | 0 |
| Lagerheimia genevensis (Chodat) Chodat | P | - | - | - | i | - | b | - | - | 2.20 | 0 | 0 | 1 | 0 | 0 | 0 |
| Monoraphidium contortum (Thuret) Komárková-Legnerová | P-B | - | st-str | - | i | - | b | - | - | 2.20 | 1 | 1 | 0 | 0 | 0 | 0 |
| Monoraphidium convolutum (Corda) Komárková-Legnerová | P-B | - | st-str | - | - | - | b | - | - | 2.30 | 1 | 1 | 0 | 0 | 0 | 0 |
| Monoraphidium griffithii (Berkeley) Komárková-Legnerová | P-B | - | st-str | - | i | - | b | - | - | 2.20 | 0 | 1 | 0 | 0 | 0 | 0 |
| Monoraphidium minutum (Nägeli) Komárková-Legnerová | P-B | - | st-str | - | i | - | b-a | - | - | 2.50 | 1 | 1 | 0 | 1 | 1 | 0 |
| Mucidosphaerium pulchellum (H.C. Wood) C. Bock, Proschold & Krienitz | P-B | - | st-str | ind | i | - | b | - | - | 2.30 | 1 | 1 | 0 | 0 | 0 | 0 |
| Neglectella solitaria (Wittrock) Stenclová & Kastovsky | P | - | st | ind | i | - | b-o | - | - | 1.70 | 1 | 0 | 1 | 1 | 1 | 0 |
| Oocystis borgei J.W. Snow | P-B | - | st-str | ind | i | - | o-a | - | - | 1.90 | 1 | 1 | 0 | 0 | 0 | 0 |
| Oocystis lacustris Chodat | P-B | - | st-str | - | hl | - | b-o | - | - | 1.70 | 0 | 0 | 0 | 0 | 1 | 0 |
| Oocystis submarina Lagerheim | P-B | - | st | - | i | - | - | - | - | - | 1 | 1 | 1 | 1 | 1 | 1 |
| Planctococcus sphaerocystiformis Korshikov | P | - | st | - | - | - | - | - | - | - | 1 | 0 | 0 | 0 | 0 | 0 |
| Pediastrum duplex Meyen | P | - | st-str | ind | i | - | b | - | - | 2.10 | 0 | 0 | 0 | 1 | 0 | 0 |
| Pseudodidymocystis planctonica (Korshikov) E. Hegewald & Deason | - | - | - | - | - | - | o-a | - | - | 1.80 | 1 | 0 | 0 | 1 | 1 | 0 |
| Pseudopediastrum boryanum (Turpin) E. Hegewald | P-B | - | st-str | ind | i | - | b | - | - | 2.10 | 0 | 1 | 0 | 1 | 1 | 0 |
| Scenedesmus quadricauda (Turpin) Brébisson | P | - | - | ind | i | - | b | - | - | 2.10 | 1 | 0 | 1 | 1 | 1 | 1 |
| Schroederia setigera (Schröder) Lemmermann | P | - | st-str | - | i | - | b-o | - | - | 1.70 | 1 | 1 | 0 | 0 | 0 | 0 |
| Sphaerocystis schroeteri Chodat | P | - | - | ind | i | - | o-b | - | - | 1.50 | 0 | 0 | 0 | 0 | 1 | 0 |
| Tetradesmus obliquus (Turpin) M.J. Wynne | P-B, S | - | st | - | i | - | b-a | - | - | 2.40 | 0 | 0 | 0 | 1 | 1 | 0 |
| Tetraëdron caudatum (Corda) Hansgirg | P-B | - | st-str | ind | i | - | b | - | - | 2.00 | 0 | 0 | 0 | 1 | 0 | 0 |
| Tetraëdron minimum (A. Braun) Hansgirg | P-B | - | st-str | - | i | - | b | - | - | 2.10 | 1 | 1 | 1 | 1 | 1 | 1 |
| Tetraëdron minutissimum Korshikov | - | - | - | - | - | - | - | - | - | - | 0 | 1 | 1 | 0 | 1 | 0 |
| Tetraëdron triangulare Korshikov | P-B | - | st-str | - | i | - | b | - | - | 2.00 | 0 | 0 | 0 | 1 | 1 | 1 |
| Tetrastrum glabrum (Y.V. Roll) Ahlstrom & Tiffany | P | - | - | ind | i | - | o-a | - | - | 1.80 | 1 | 0 | 1 | 0 | 1 | 0 |
| Euglenozoa | ||||||||||||||||
| Euglena pisciformis Klebs | P-B | eterm | st-str | alf | mh | - | a | - | - | 3.00 | 0 | 0 | 0 | 1 | 0 | 0 |
| Euglenaformis proxima (P.A. Dangeard) M.S. Bennett & Triemer | P-B | eterm | st-str | ind | mh | - | p-a | - | - | 3.50 | 0 | 1 | 0 | 0 | 0 | 0 |
| Lepocinclis globulus Perty | P-B | eterm | st-str | ind | i | - | b-a | - | - | 2.40 | 0 | 1 | 0 | 0 | 0 | 0 |
| Lepocinclis ovum (Ehrenberg) Lemmermann | P | eterm | st | ind | i | - | b-a | - | - | 2.40 | 1 | 1 | 1 | 1 | 1 | 1 |
| Monomorphina pyrum (Ehrenberg) Mereschkowsky | P-B | eterm | st-str | ind | mh | - | b | - | - | 2.35 | 1 | 0 | 0 | 0 | 1 | 0 |
| Trachelomonas hispida (Perty) F. Stein | P-B | eterm | st-str | - | i | - | b | - | - | 2.20 | 1 | 0 | 0 | 0 | 0 | 0 |
Notes. Confinement to the substrate (Hab): Ep—epiphyte, B—benthic, P-B—planktonic-benthic, P—planktonic, S, inhabited also in wet soil. Temperature preferences (T): temp—prefers moderate temperatures, eterm—indifferent to temperature, warm—thermophilic. Rheophilicity (relation to oxygen) (Oxy): aer—aerophile; str—prefers highly flowing waters, significantly enriched with oxygen; st-str—prefers slow-flowing waters, moderately saturated with oxygen; st—prefers stagnant waters, slightly saturated with oxygen; H2S—survives in anoxic waters saturated with hydrogen sulfide. Water pH (pH): acf—acidophile, ind—pH indifferent, alf—alkaliphile, alb—alkalibiont. Salinity (Sal): hb is halophobe, i is indifferent to salinity, hl is halophile, mh is mesohalobe, oh is oligohalobes of a wide range, the optimum of which is associated with a group of indifferents. Saprobity according to Watanabe [37] (D): sx is saproxen, es is eurysaprobe, sp is saprophile. Saprobity according to Sládeček [21] (Sap): a—alpha-mesosaprobiont; a-o—alpha-oligosaprobiont; b—beta-mesosaprobiont; b-a—beta-alpha-mesosaprobiont; b-o—beta-oligosaprobiont; o, oligosaprobiont; o-a, oligo-alpha-mesosaprobiont; o-b—oligo-betamazosaprobiont; o-x—oligo-xenosaprobiont; p-a, poly-alpha-mesosaprobiont; x-b, xeno-beta-mesosaprobiont; x-o, xeno-oligosaprobiont. Trophic state of the reservoir according to Van Dam [38] (Tro): ot—oligotrafent, o-m—oligo-mesotrafent, m—mesotrafent, me—meso-eutrafent, e—eutrafent, o-e—from oligo- to eutrafent, he—hypereutrafent. Type of nutrition of algae and their relationship to nitrogen according to Van Dam [38] (Aut-Het): ats are nitrogen-autotrophic organisms living at low concentrations of organically bound nitrogen; ate are nitrogen-autotrophic organisms that can withstand high concentrations of organically bound nitrogen; hne are facultative nitrogen-heterotrophic organisms (mixotrophs) that periodically need increased concentrations of organically bound nitrogen; hce is a facultative heterotroph that prefers a significant nitrogen load. The lake names are abbreviated as: B, Borovoye; SC, Small Chebachye; LC, Large Chebachye; K, Katarkol; Z, Zhukey; S, Shchuchye. “1”, species present; “0”, species absent.
References
- Bragin, E.A.; Bragina, T.M. Wetlands in system of nature complexes of Northern Kazakhstan. General characteristic and nature conservation importance. In The Most Important Wetlands of Northern Kazakhstan (In Limits of Kostanay and West Part of North-Kazakhstan Regions); WWF Series, issue 5; Bragin, E.A., Bragina, T.M., Eds.; Russian University Press: Moscow, Russia, 2002; pp. 19–38. (In Russian) [Google Scholar]
- Goryunova, A.I.; Danko, E.K. (Eds.) Lake Fund of Kazakhstan. Section 1. Lakes of the Kokchetav Region (within the Borders of 1964–1999); Bastau Publishing LLP: Almaty. Kazakhstan, 2009; 70p. (In Russian) [Google Scholar]
- Kurmanbaeva, A.S.; Khusainov, A.T.; Zhumai, E. Ecological condition of the Burabay lake of the Burabay State National Natural Park. Sci. News Kazakhstan 2019, 3, 202–209. (In Russian) [Google Scholar]
- Krupa, E.G.; Barinova, S.S.; Romanova, S.M.; Khitrova, E.A. Hydrochemical and Hydrobiological Characteristics of the Lakes of the Shchuchinsko-Borovsk Resort Zone (Northern Kazakhstan) and the Main Methodological Approaches to Assessing the Ecological State of Small Water Bodies; Publishing House Etalon Print LLP: Almaty, Kazakhstan, 2021; 300p. (In Russian) [Google Scholar]
- Skakun, V.A.; Kiseleva, V.A.; Goryunova, A.I. The ecosystem of Lake Borovoy and the possibilities of its transformation. Selevinia 2002, 1–4, 249–264. (In Russian) [Google Scholar]
- Barinova, S.S.; Krupa, E.G. New Approaches to the Use of Algae Indicators of Organic Pollution on the Example of the Lakes of the Shchuchinsko-Borovsk Resort Zone (Northern Kazakhstan). In Biological Diversity of Asian Steppe, Proceedings of the III International Scientific Conference, Kostanay, Kazakhstan, 14 April 2022; Bragina, T.M., Isakaev, Y.M., Eds.; A. Baitursunov KRU: Kostanay, Kazakhstan, 2022; pp. 27–31. [Google Scholar]
- Barinova, S.; Krupa, E.; Khitrova, E. Spatial Distribution of the Taxonomic Diversity of Phytoplankton and Bioindication of the Shallow Protected Lake Borovoe in the Burabay National Natural Park, Northern Kazakhstan. Diversity 2022, 14, 1071. [Google Scholar] [CrossRef]
- Abakumov, V.A. (Ed.) Guidance on Methods of Hydrobiological Analysis of Surface Waters and Bottom Sediments; Gidrometeoizdat: Leningrad, Russia, 1983; 240p. (In Russian) [Google Scholar]
- Semenov, A.D. (Ed.) Guidance on the Chemical Analysis of Land Surface Water; Gidrometeoizdat: Leningrad, Russia, 1977; 541p. (In Russian) [Google Scholar]
- Kiselev, I.A. Plankton of the Seas and Continental Water Bodies; Nauka: Leningrad, Russia, 1969; 657p. (In Russian) [Google Scholar]
- Kiselev, I.A. Research methods of plankton. In Life of the Fresh Water of the USSR; Pavlovsky, E.N., Zhadin, V.I., Eds.; USSR Academy of Sciences: Moscow, Leningrad, Russia, 1956; pp. 188–253. (In Russian) [Google Scholar]
- Barinova, S. How to align and unify the cell counting of organisms for bioindication. Int. J. Environ. Sci. Nat. Resour. 2017, 2, 555585. [Google Scholar] [CrossRef] [Green Version]
- John, D.M.; Whitton, B.A.; Brook, A.J. (Eds.) The Freshwater Algal Flora of the British Isles: An Identification Guide to Freshwater and terrestrial Algae; Cambridge University Press: Cambridge, UK, 2011; 878p. [Google Scholar]
- Komárek, J.; Anagnostidis, K. Cyanoprokaryota. Teil 1: Chroococcales. In Süsswasser flora von Mitteleuropa 19/1; Ettl, H., Gärtner, G., Heynig, H., Mollenhauer, D., Eds.; Gustav Fisher: Jena/Stuttgart/Lübeck/Ulm, Germany, 1998. [Google Scholar]
- Komárek, J.; Anagnostidis, K. Cyanoprokaryota. Teil 2: Oscillatoriales. In Süsswasserflora von Mitteleuropa 19/2; Büdel, B., Gärtner, G., Krienitz, L., Schagerl, M., Eds.; Elsevier: München, Germany, 2005; 759p. [Google Scholar]
- Krammer, K.; Lange-Bertalot, H. Bacillariophyceae. 2. Bacillariaceae, Epithemiaceae, Surirellaceae. Süßwasserflora von Mitteleuropa, 2/2; G. Fischer: Jena/Stuttgart/Lübeck/Ulm, Germany, 1988; 596р. [Google Scholar]
- Krammer, K.; Lange-Bertalot, H. Bacillariophyceae. 3. Centrales, Fragilariaceae, Eunotiaceae. Süsswasserflora von Mitteleuropa 2/3; G. Fischer: Stuttgart/Jena, Germany, 1991; 576p. [Google Scholar]
- Krammer, K.; Lange-Bertalot, H. Bacillariophyceae. 4. Achnanthaceae, Kritische Ergänzungen zu Navicula (Lineolatae) und Gomphonema Gesamtliteraturverzeichnis. Teil 1–4. Süβwasserflora von Mitteleuropa 2/4; G. Fischer: Stuttgart/Jena, Germany, 1991; 437p. [Google Scholar]
- Guiry, M.D.; Guiry, G.M. AlgaeBase World-Wide Electronic Publication. National University of Ireland. Galway. Available online: http://www.algaebase.org (accessed on 20 September 2022).
- Magurran, A.E. Ecological Diversity and Its Measurements; Princeton University Press: Princeton, NJ, USA, 1988; 192p. [Google Scholar] [CrossRef]
- Sládeček, V. Diatoms as indicators of organic pollution. Acta Hydroch. Hydrobiol. 1986, 14, 555–566. [Google Scholar] [CrossRef]
- Barinova, S.S.; Medvedeva, L.A.; Anissimova, O.V. Diversity of Algal Indicators in Environmental Assessment; Pilies Studio: Tel Aviv, Israel, 2006; 495p, (In Russian). Available online: https://drive.google.com/drive/folders/1FNW2oIMkvujsouuL9GF4c478k99qMPho (accessed on 20 September 2022).
- Barinova, S.; Bilous, O.; Tsarenko, P.M. Algae Indication of Waterbodies in Ukraine: Methods and Perspectives; Haifa University Publishing House: Haifa, Israel, 2019; pp. 297–367, (In Russian). Available online: https://drive.google.com/drive/folders/1K3U-eEo0aYRu0s84C9XNtKePY9jK32yC (accessed on 20 September 2022).
- Barinova, S. Essential and practical bioindication methods and systems for the water quality assessment. Int. J. Environ. Sci. Nat. Resour. 2017, 2, 555588. [Google Scholar] [CrossRef]
- Barinova, S. On the classification of water quality from an ecological point of view. Int. J. Environ. Sci. Nat. Resour. 2017, 2, 1–8. [Google Scholar] [CrossRef] [Green Version]
- Love, J.; Selker, R.; Marsman, M.; Jamil, T.; Dropmann, D.; Verhagen, A.J.; Ly, A.; Gronau, Q.F.; Smira, M.; Epskamp, S.; et al. JASP: Graphical statistical software for common statistical designs. J. Stat. Softw. 2019, 88, 1–17. [Google Scholar] [CrossRef] [Green Version]
- Skorobogatova, O.; Yumagulova, E.; Storchak, T.; Barinova, S. Bioindication of the Influence of Oil Production on Sphagnum Bogs in the Khanty-Mansiysk Autonomous Okrug–Yugra, Russia. Diversity 2019, 11, 207. [Google Scholar] [CrossRef] [Green Version]
- Barinova, S.S.; Gabyshev, V.A.; Ivanova, A.P.; Gabysheva, O.I. Bioindication of the water salinity dynamics by the microalgae communities in the Lena River Delta, Laptev Sea, Russian Arctic. Mar. Biol. J. 2021, 6, 15–28. [Google Scholar] [CrossRef]
- Proulx, S.R.; Promislow, D.E.L.; Phillips, P.C. Network thinking in ecology and evolution. Trends Ecol. Evol. 2005, 20, 345–353. [Google Scholar] [CrossRef] [PubMed]
- Romanuk, T.N.; Vogt, R.J.; Young, A.; Tuck, C.; Carscallen, M.W. Maintenance of positive diversity-stability relations along a gradient of environmental stress. PLoS ONE 2010, 5, e10378. [Google Scholar] [CrossRef] [PubMed]
- Krupa, E.G. Zooplankton of the lakes of the Shchuchinsko-Borovskaya system (northern Kazakhstan) as an indicator of their trophic status. Terra 2007, 3, 60–66. [Google Scholar]
- Baimukanov, M.T. The State of Hydrobionts in Reservoirs of Specially Protected Natural Areas of Republican Significance in Northern and Central Kazakhstan (Information and Analytical Manual); Burabay State National Natural Park: Almaty, Kazakhstan, 2016; 156p. [Google Scholar]
- Barinova, S.S.; Bragina, T.M.; Nevo, E. Algal species diversity of arid region lakes in Kazakhstan and Israel. Community Ecol. 2009, 10, 7–16. [Google Scholar] [CrossRef]
- Krupa, E.G.; Barinova, S.S. Environmental Variables Regulating the Phytoplankton Structure in High Mountain Lakes. Res. J. Pharm. Biol. Chem. Sci. 2016, 7, 1251–1261. [Google Scholar]
- Barinova, S.; Krupa, E. Bioindication of Ecological State and Water Quality by Phytoplankton in the Shardara Reservoir, Kazakhstan. Environ. Ecol. Res. 2017, 5, 73–92. [Google Scholar] [CrossRef]
- Dembowska, E.A.; Mieszczankin, T.; Napiórkowski, P. Changes of the phytoplankton community as symptoms of deterioration of water quality in a shallow lake. Environ. Monit. Assess. 2018, 190, 95. [Google Scholar] [CrossRef] [Green Version]
- Watanabe, T.; Asai, K.; Houki, A. Numerical estimation of organic pollution of flowing water by using the epilithic diatom assemblage–Diatom Assemblage Index (DAIpo). Sci. Total Environ. 1986, 55, 209–218. [Google Scholar] [CrossRef]
- Van Dam, H.; Mertens, A.; Sinkeldam, J. A coded checklist and ecological indicator values of freshwater diatoms from the Netherlands. Neth. J. Aquat. Ecol. 1994, 28, 117–133. [Google Scholar] [CrossRef]
Figure 1.
Map of phytoplankton sampling stations in the Burabay National Natural Park, Northern Kazakhstan, in 2019. Position of the lakes in the Kazakhstan territory (a); position of sampling stations on the lake surface for statistical mapping (b). The dotted line in (a) and toned figure in (b) mark the area of integral statistical mapping.

Figure 2.
Maps of chlorides and TDS content (mg L−1) in sampling stations in the Burabay National Natural Park, Northern Kazakhstan in 2019. (a) Borovoye, (b) Katarkol, (c) Large Chebachye, (d) Small Chebachye (mapped TDS as absent of chlorides data), (e) Shchuchye; (f), Zhukey.
Figure 2.
Maps of chlorides and TDS content (mg L−1) in sampling stations in the Burabay National Natural Park, Northern Kazakhstan in 2019. (a) Borovoye, (b) Katarkol, (c) Large Chebachye, (d) Small Chebachye (mapped TDS as absent of chlorides data), (e) Shchuchye; (f), Zhukey.

Figure 3.
JASP correlation plot of the phytoplankton species richness in the lakes of the Burabay National Natural Park, 2019. Bold lines show largest similarity in type of analysis, “Huge” correlation >0.5.
Figure 3.
JASP correlation plot of the phytoplankton species richness in the lakes of the Burabay National Natural Park, 2019. Bold lines show largest similarity in type of analysis, “Huge” correlation >0.5.

Figure 4.
Maps of phytoplankton species richness in sampling stations of the lakes in the Burabay National Natural Park, Northern Kazakhstan, in 2019. (a) Borovoye, (b) Katarkol, (c) Large Chebachye, (d) Small Chebachye, (e) Shchuchye, (f) Zhukey.
Figure 4.
Maps of phytoplankton species richness in sampling stations of the lakes in the Burabay National Natural Park, Northern Kazakhstan, in 2019. (a) Borovoye, (b) Katarkol, (c) Large Chebachye, (d) Small Chebachye, (e) Shchuchye, (f) Zhukey.

Figure 5.
Map of phytoplankton species richness in the lakes of the Burabay National Natural Park, Northern Kazakhstan, in 2019. Total species richness (a), Bacillariophyta (b), Chlorophyta (c), Cyanobacteria (d), Charophyta (e), Euglenozoa (f).
Figure 5.
Map of phytoplankton species richness in the lakes of the Burabay National Natural Park, Northern Kazakhstan, in 2019. Total species richness (a), Bacillariophyta (b), Chlorophyta (c), Cyanobacteria (d), Charophyta (e), Euglenozoa (f).

Figure 6.
Maps of phytoplankton abundance (million cells m−3) in sampling stations of the lakes in the Burabay National Natural Park, Northern Kazakhstan, in 2019. (a) Borovoye, (b) Katarkol, (c) Large Chebachye, (d) Small Chebachye, (e) Shchuchye, (f) Zhukey.
Figure 6.
Maps of phytoplankton abundance (million cells m−3) in sampling stations of the lakes in the Burabay National Natural Park, Northern Kazakhstan, in 2019. (a) Borovoye, (b) Katarkol, (c) Large Chebachye, (d) Small Chebachye, (e) Shchuchye, (f) Zhukey.

Figure 7.
Distribution of species richness in taxonomic phyla (a), species indicators in ecological categories of substrate preferences (b), water oxygenation (c), and temperature (d) in the lakes of the Burabay National Natural Park, Northern Kazakhstan, in 2019. Abbreviations: Substrate: Ep—epiphyte, B—benthic, P-B—planktonic-benthic, P—planktonic. Relation to oxygen: aer—aerophile; str—prefers highly flowing waters, significantly enriched with oxygen; st-str—prefers slow-flowing waters, moderately saturated with oxygen; st—prefers stagnant waters, slightly saturated with oxygen; H2S—survives in anoxic waters saturated with hydrogen sulfide. Temperature preferences: temp—prefers moderate temperatures, eterm—indifferent to temperature, warm—thermophilic. The lake names abbreviated as: B, Borovoye; SC, Small Chebachye; LC, Large Chebachye; K, Katarkol; Z, Zhukey; S, Shchuchye.

Figure 8.
Distribution of species indicators in ecological categories of salinity (a), water pH (b), trophic state (c), and nutrition type from autotrophs to heterotrophs (d) in the lakes of the Burabay National Natural Park, Northern Kazakhstan, in 2019. Abbreviations: Salinity: hb is halophobe, i is indifferent to salinity, hl is halophile, mh is mesohalobe. Water pH: acf—acidophile, ind—pH indifferent, alf—alkaliphile, alb—alkalibiont. Trophic state of the lake: ot—oligotrafent, o-m—oligo-mesotrafent, m—mesotrafent, me—meso-eutrafent, e—eutrafent, o-e—from oligo- to eutrafent, he—hypereutrafent. Type of nutrition of algae and their relationship to nitrogen (Autotrophs-Heterotrophs): ats are nitrogen-autotrophic organisms living at low concentrations of organically bound nitrogen; ate are nitrogen-autotrophic organisms that can withstand high concentrations of organically bound nitrogen; hne are facultative nitrogen-heterotrophic organisms (mixotrophs) that periodically need increased concentrations of organically bound nitrogen; hce is a facultative heterotroph that prefers a significant nitrogen load. The lake names are abbreviated as: B, Borovoye; SC, Small Chebachye; LC, Large Chebachye; K, Katarkol; Z, Zhukey; S, Shchuchye.

Figure 9.
Distribution of species indicators of organic pollution in ecological categories according Watanabe (a) and on the basis of species-specific index saprobity S (b) in the lakes of the Burabay National Natural Park, Northern Kazakhstan, in 2019. Abbreviations: saprobity according to Watanabe: sx is saproxen, es is eurysaprobe, and sp is saprophile. The lakes’ names are abbreviated as: B, Borovoye; SC, Small Chebachye; LC, Large Chebachye; K, Katarkol; Z, Zhukey; S, Shchuchye.

Figure 10.
Map of phytoplankton species indicators’ distribution of the alkaliphile group (a) and acidophile group (b) in the lakes of the Burabay National Natural Park, Northern Kazakhstan, in 2019.
Figure 10.
Map of phytoplankton species indicators’ distribution of the alkaliphile group (a) and acidophile group (b) in the lakes of the Burabay National Natural Park, Northern Kazakhstan, in 2019.

Figure 11.
Map of phytoplankton species indicators’ distribution of the temperate-temperature group (a) and warm water group (b) in the lakes of the Burabay National Natural Park, Northern Kazakhstan, in 2019.
Figure 11.
Map of phytoplankton species indicators’ distribution of the temperate-temperature group (a) and warm water group (b) in the lakes of the Burabay National Natural Park, Northern Kazakhstan, in 2019.

Figure 12.
Map of phytoplankton species indicators’ distribution of the class of water quality: Class 2 (a), Class 3 (b), and Class 4 (c) in the lakes of the Burabay National Natural Park, Northern Kazakhstan, in 2019.
Figure 12.
Map of phytoplankton species indicators’ distribution of the class of water quality: Class 2 (a), Class 3 (b), and Class 4 (c) in the lakes of the Burabay National Natural Park, Northern Kazakhstan, in 2019.

Figure 13.
Maps of index saprobity S distribution in sampling stations of the lakes in the Burabay National Natural Park, Northern Kazakhstan in 2019. (a), Borovoye; (b), Katarkol; (c), Large Chebachye; (d), Small Chebachye; (e), Shchuchye; (f), Zhukey.
Figure 13.
Maps of index saprobity S distribution in sampling stations of the lakes in the Burabay National Natural Park, Northern Kazakhstan in 2019. (a), Borovoye; (b), Katarkol; (c), Large Chebachye; (d), Small Chebachye; (e), Shchuchye; (f), Zhukey.

Figure 14.
Map of phytoplankton species indicators’ distribution of the oligo-mesotraphentes group (a), mesotraphentes group (b), eutraphentes group (c), and oligo-to-eutraphentes group (d) in the lakes of the Burabay National Natural Park, Northern Kazakhstan, in 2019.
Figure 14.
Map of phytoplankton species indicators’ distribution of the oligo-mesotraphentes group (a), mesotraphentes group (b), eutraphentes group (c), and oligo-to-eutraphentes group (d) in the lakes of the Burabay National Natural Park, Northern Kazakhstan, in 2019.

Figure 15.
Maps of sulfide indicators in the phytoplankton of the lakes in the Burabay National Natural Park, Northern Kazakhstan, in 2019. Borovoye lake (a), Shchuchye lake (b), Zhukey lake (c).
Figure 15.
Maps of sulfide indicators in the phytoplankton of the lakes in the Burabay National Natural Park, Northern Kazakhstan, in 2019. Borovoye lake (a), Shchuchye lake (b), Zhukey lake (c).

Figure 16.
Maps of organic pollution indication according to index saprobity S (a) and toxicity according to the WESI toxicity index (b) in the lakes of the Burabay National Natural Park, Northern Kazakhstan, in 2019.
Figure 16.
Maps of organic pollution indication according to index saprobity S (a) and toxicity according to the WESI toxicity index (b) in the lakes of the Burabay National Natural Park, Northern Kazakhstan, in 2019.

Figure 17.
Maps of the WESI index distribution in sampling stations of the lakes in the Burabay National Natural Park, Northern Kazakhstan, in 2019. (a) Borovoye, (b) Katarkol, (c) Large Chebachye, (d) Small Chebachye, (e) Shchuchye, (f) Zhukey.
Figure 17.
Maps of the WESI index distribution in sampling stations of the lakes in the Burabay National Natural Park, Northern Kazakhstan, in 2019. (a) Borovoye, (b) Katarkol, (c) Large Chebachye, (d) Small Chebachye, (e) Shchuchye, (f) Zhukey.

Figure 18.
Map of the lakes in the Burabay National Natural Park, Northern Kazakhstan, in 2019 with the position of the main sources of pollution marked by the numbers 1–16. The dotted line marks the area of integral statistical mapping.
Figure 18.
Map of the lakes in the Burabay National Natural Park, Northern Kazakhstan, in 2019 with the position of the main sources of pollution marked by the numbers 1–16. The dotted line marks the area of integral statistical mapping.

Table 1.
Average values of chemical variables (mg L−1) and total hardness (mg-eq. L−1) of water in the lakes of the Burabay National Natural Park, 2019, with standard deviation.
Table 1.
Average values of chemical variables (mg L−1) and total hardness (mg-eq. L−1) of water in the lakes of the Burabay National Natural Park, 2019, with standard deviation.
| Lake | Ca2+ | Mg2+ | Na+ + K+ | HCO3− | CO32− | SO42− | Cl− | TDS | Total Hardness |
|---|---|---|---|---|---|---|---|---|---|
| Borovoye | 22.5 ± 1.07 | 12.7 ± 0.89 | 15.4 ± 3.45 | 90.3 ± 10.48 | 7.1 ± 2.07 | 17.9 ± 1.51 | 25.8 ± 2.06 | 191.5 ± 11.51 | 2.1 ± 0.02 |
| Shchuchye | 25.6 ± 0.95 | 22.2 ± 0.54 | 56.5 ± 5.99 | 154.1 ± 12.32 | 2.6 ± 2.29 | 65.5 ± 4.59 | 49.0 ± 1.43 | 375.4 ± 20.56 | 3.1 ± 0.04 |
| Katarkol | 35.7 ± 1.67 | 60.8 ± 0.73 | 144.6 ± 6.00 | 413.2 ± 3.20 | 25.0 ± 3.38 | 104.0 ± 7.70 | 99.1 ± 1.43 | 882.4 ± 13.96 | 6.7 ± 0.02 |
| Large Chebachye | 36.1 ± 0.00 | 73.5 ± 0.62 | 158.5 ± 5.21 | 283.3 ± 8.40 | 11.5 ± 0.74 | 226.6 ± 11.58 | 157.4 ± 0.00 | 947.0 ± 16.34 | 7.9 ± 0.05 |
| Small Chebachye | 57.6 ± 4.68 | 334.4 ± 9.22 | 1114.1 ± 59.85 | 468.1 ± 24.49 | 1.5 ± 0.00 | 929.5 ± 13.14 | 1697.3 ± 100.8 | 4602.6 ± 177.4 | 30.3 ± 0.37 |
| Zhukey | 33.6 ± 4.74 | 345.0 ± 3.20 | 1285.7 ± 16.05 | 671.8 ± 37.32 | 77.2 ± 4.98 | 1274.1 ± 9.85 | 1467.2 ± 11.69 | 5154.6 ± 54.46 | 30.2 ± 0.26 |
Table 2.
Average content of nutrients (mg L−1) and easily oxidizable organic substances (PI, mgO L−1) in the lakes of the Burabay National Natural Park, 2019, with standard deviation.
Table 2.
Average content of nutrients (mg L−1) and easily oxidizable organic substances (PI, mgO L−1) in the lakes of the Burabay National Natural Park, 2019, with standard deviation.
| Lake | N-NO2 | N-NO3 | N-NH4 | PO4 | PI |
|---|---|---|---|---|---|
| Borovoye | 0.030 ± 0.01 | 0.373 ± 0.32 | 0.321 ± 0.19 | 0.006 ± 0.001 | 5.71 ± 0.81 |
| Shchuchye | 0.004 ± 0.00 | 0.230 ± 0.30 | 0.099 ± 0.04 | 0.018 ± 0.00 | 2.10 ± 0.55 |
| Katarkol | 0.027 ± 0.00 | 1.472 ± 0.68 | 0.524 ± 0.07 | 0.032 ± 0.00 | 27.34 ± 2.61 |
| Large Chebachye | 0.004 ± 0.00 | 0.610 ± 0.18 | 0.171 ± 0.04 | 0.020 ± 0.00 | 10.14 ± 1.17 |
| Small Chebachye | 0.004 ± 0.00 | 0.224 ± 0.13 | 0.233 ± 0.06 | 0.041 ± 0.00 | 9.54 ± 0.79 |
| Zhukey | 0.012 ± 0.01 | 0.588 ± 0.18 | 0.030 ± 0.01 | 0.003 ± 0.00 | 14.23 ± 1.45 |
Table 3.
Phytoplankton species richness in the lakes of the Burabay National Natural Park, 2019.
| Lake | Cyanobacteria | Bacillariophyta | Miozoa | Ochrophyta | Charophyta | Chlorophyta | Euglenozoa | Total |
|---|---|---|---|---|---|---|---|---|
| Borovoye | 15 | 30 | 5 | 1 | 2 | 17 | 3 | 73 |
| Shchuchye | 7 | 12 | 4 | 3 | 4 | 8 | 1 | 39 |
| Katarkol | 10 | 13 | 4 | 1 | 2 | 17 | 2 | 49 |
| Large Chebachye | 14 | 28 | 4 | 1 | 3 | 11 | 1 | 62 |
| Small Chebachye | 14 | 13 | 0 | 0 | 0 | 15 | 3 | 45 |
| Zhukey | 7 | 4 | 1 | 0 | 1 | 19 | 2 | 34 |
Table 4.
Average abundance (million cells m−3) of phytoplankton phyla in the lakes of the Burabay National Natural Park, 2019, average values with standard deviation.
Table 4.
Average abundance (million cells m−3) of phytoplankton phyla in the lakes of the Burabay National Natural Park, 2019, average values with standard deviation.
| Lake | Cyanobacteria | Bacillariophyta | Miozoa | Ochrophyta | Charophyta | Chlorophyta | Euglenozoa | Total |
|---|---|---|---|---|---|---|---|---|
| Borovoye | 2606.5 ± 1207 | 261.7 ± 112 | 8.1 ± 1.56 | 57.5 ± 24.98 | 21.3 ± 13.56 | 124.2 ± 81.96 | 3.0 ± 1.28 | 3082.3 ± 1276 |
| Shchuchye | 45.5 ± 0.79 | 2.6 ± 0.61 | 18.6 ± 1.35 | 33.4 ± 14.75 | 1.3 ± 0.71 | 35.6 ± 15.47 | 7.6 ± 1.96 | 144.5 ± 92.03 |
| Katarkol | 1298.0 ± 15.07 | 25.1 ± 13.49 | 12.9 ± 1.09 | 0.7 ± 0.14 | 9.3 ± 4.50 | 287.4 ± 57.34 | 0.9 ± 0.07 | 1634.2 ± 152.54 |
| Large Chebachye | 1223.2 ± 467.9 | 16.8 ± 7.88 | 6.9 ± 1.89 | 9.8 ± 0.11 | 3.3 ± 2.01 | 97.4 ± 17.14 | 1.7 ± 0.98 | 1359.1 ± 504.58 |
| Small Chebachye | 712.8 ± 42.92 | 18.1 ± 2.46 | 0.00 ± 0.00 | 0.0 ± 0.00 | 0.0 ± 0.00 | 113.2 ± 39.23 | 1.7 ± 0.55 | 845.7 ± 401.08 |
| Zhukey | 60.5 ± 5.21 | 0.8 ± 0.13 | 0.2 ± 0.05 | 0.0 ± 0.00 | 1.4 ± 0.06 | 270.5 ± 93.62 | 2.6 ± 0.31 | 335.8 ± 218.67 |
Table 5.
Average biomass (g m−3) of phytoplankton phyla in the lakes of the Burabay National Natural Park, 2019, average values with standard deviation.
Table 5.
Average biomass (g m−3) of phytoplankton phyla in the lakes of the Burabay National Natural Park, 2019, average values with standard deviation.
| Lake | Cyanobacteria | Bacillariophyta | Miozoa | Ochrophyta | Charophyta | Chlorophyta | Euglenozoa | Total |
|---|---|---|---|---|---|---|---|---|
| Borovoye | 0.12 ± 0.09 | 0.81 ± 0.04 | 0.80 ± 0.01 | 0.08 ± 0.03 | 0.44 ± 0.02 | 0.05 ± 0.01 | 0.02 ± 0.00 | 2.32 ± 0.12 |
| Shchuchye | 0.00 ± 0.00 | 0.01 ± 0.00 | 0.70 ± 0.04 | 0.02 ± 0.00 | 0.01 ± 0.00 | 0.01 ± 0.00 | 0.02 ± 0.00 | 0.77 ± 0.04 |
| Katarkol | 0.13 ± 0.08 | 0.11 ± 0.00 | 0.60 ± 0.06 | 0.00 ± 0.00 | 0.02 ± 0.00 | 0.15 ± 0.03 | 0.00 ± 0.00 | 1.01 ± 0.07 |
| Large Chebachye | 0.05 ± 0.01 | 0.07 ± 0.01 | 0.27 ± 0.03 | 0.01 ± 0.00 | 0.01 ± 0.00 | 0.03 ± 0.01 | 0.00 ± 0.00 | 0.44 ± 0.02 |
| Small Chebachye | 0.11 ± 0.04 | 0.12 ± 0.01 | 0.00 ± 0.00 | 0.00 ± 0.00 | 0.00 ± 0.00 | 0.03 ± 0.01 | 0.01 ± 0.00 | 0.26 ± 0.12 |
| Zhukey | 0.00 ± 0.00 | 0.01 ± 0.00 | 0.01 ± 0.00 | 0.00 ± 0.00 | 0.01 ± 0.00 | 0.22 ± 0.01 | 0.01 ± 0.00 | 0.26 ± 0.14 |
Table 6.
Structural parameters of phytoplankton communities in the lakes of the Burabay National Natural Park, 2019, average values with standard deviation.
Table 6.
Structural parameters of phytoplankton communities in the lakes of the Burabay National Natural Park, 2019, average values with standard deviation.
| Lake | Average Species, Number | Average Cell Volume, mg 10−6 | Shannon Index, bit ind.−1 | Shannon Index, bit mg−1 |
|---|---|---|---|---|
| Borovoye | 26.9 ± 1.46 | 0.78 ± 0.38 | 2.26 ± 0.53 | 2.70 ± 0.23 |
| Shchuchye | 14.0 ± 4.11 | 6.12 ± 4.20 | 2.97 ± 0.32 | 2.13 ± 0.37 |
| Katarkol | 31.6 ± 3.29 | 0.69 ± 0.35 | 3.30 ± 1.03 | 3.39 ± 0.56 |
| Large Chebachye | 25.8 ± 3.59 | 0.33 ± 0.13 | 2.85 ± 0.23 | 2.98 ± 0.44 |
| Small Chebachye | 17.6 ± 4.21 | 0.35 ± 0.19 | 2.55 ± 0.62 | 2.34 ± 0.40 |
| Zhukey | 16.8 ± 3.01 | 0.96 ± 0.54 | 3.07 ± 0.56 | 2.98 ± 0.36 |
Disclaimer/Publisher’s Note: The statements, opinions and data contained in all publications are solely those of the individual author(s) and contributor(s) and not of MDPI and/or the editor(s). MDPI and/or the editor(s) disclaim responsibility for any injury to people or property resulting from any ideas, methods, instructions or products referred to in the content. |
© 2023 by the authors. Licensee MDPI, Basel, Switzerland. This article is an open access article distributed under the terms and conditions of the Creative Commons Attribution (CC BY) license (https://creativecommons.org/licenses/by/4.0/).
Share and Cite
MDPI and ACS Style
Barinova, S.; Krupa, E.; Khitrova, Y. Phytoplankton Diversity and Bioindication of the Lakes in the Burabay National Natural Park, Northern Kazakhstan. Ecologies 2023, 4, 242-268. https://doi.org/10.3390/ecologies4020017
AMA Style
Barinova S, Krupa E, Khitrova Y. Phytoplankton Diversity and Bioindication of the Lakes in the Burabay National Natural Park, Northern Kazakhstan. Ecologies. 2023; 4(2):242-268. https://doi.org/10.3390/ecologies4020017
Chicago/Turabian StyleBarinova, Sophia, Elena Krupa, and Yelena Khitrova. 2023. "Phytoplankton Diversity and Bioindication of the Lakes in the Burabay National Natural Park, Northern Kazakhstan" Ecologies 4, no. 2: 242-268. https://doi.org/10.3390/ecologies4020017