1. Introduction
International maritime sector is expected to expand rapidly, faster than other transportation modes, with an average annual growth rate of 3.5% over the 2019–2024 period [
1]. This could be particularly evident in some busy areas (i.e., Mediterranean Sea) [
2] and for some specific sub-sectors (i.e., cruising), thus leading to the formulation of more stringent regulations at global level. Annex VI “Regulations for the prevention of Air Pollution from Ships” of the International Maritime Organization (IMO) has imposed, since 2020, to reduce sulphur content in maritime fuels from 3.5% to 0.5% m/m on global basis (0.1% m/m since 2015 within Emission Control Areas), to curb ship emissions of sulphur oxides and particulate matter.
Although some studies reviewed maritime emissions and their potential impact on particulate matter and gaseous pollutants [
3,
4,
5], the local/urban influence of harbour activities (ship traffic and logistics) has received less attention, although some have focused on their environmental issues and health implications (such as respiratory and cardiovascular diseases) on the exposed coastal population [
6,
7,
8].
The objective of this paper is to give a comparable assessment of the impact of ship traffic to atmospheric particulate matter (PM2.5 and PM10) and particle number concentration (PNC) in two important port-cities of the Adriatic Sea area (Venice and Brindisi). Relative contribution for different particles’ sizes and temporal trend analysis were reported and discussed.
Discussed results of this work were developed within the framework of the projects: ECOMOBILITY (Interreg V Italy-Croatia CBC Programme); POSEIDON (MED 2007-2013); CESAPO (Interreg Greece-Italy 2007–2013).
2. Sampling Areas and Campaigns
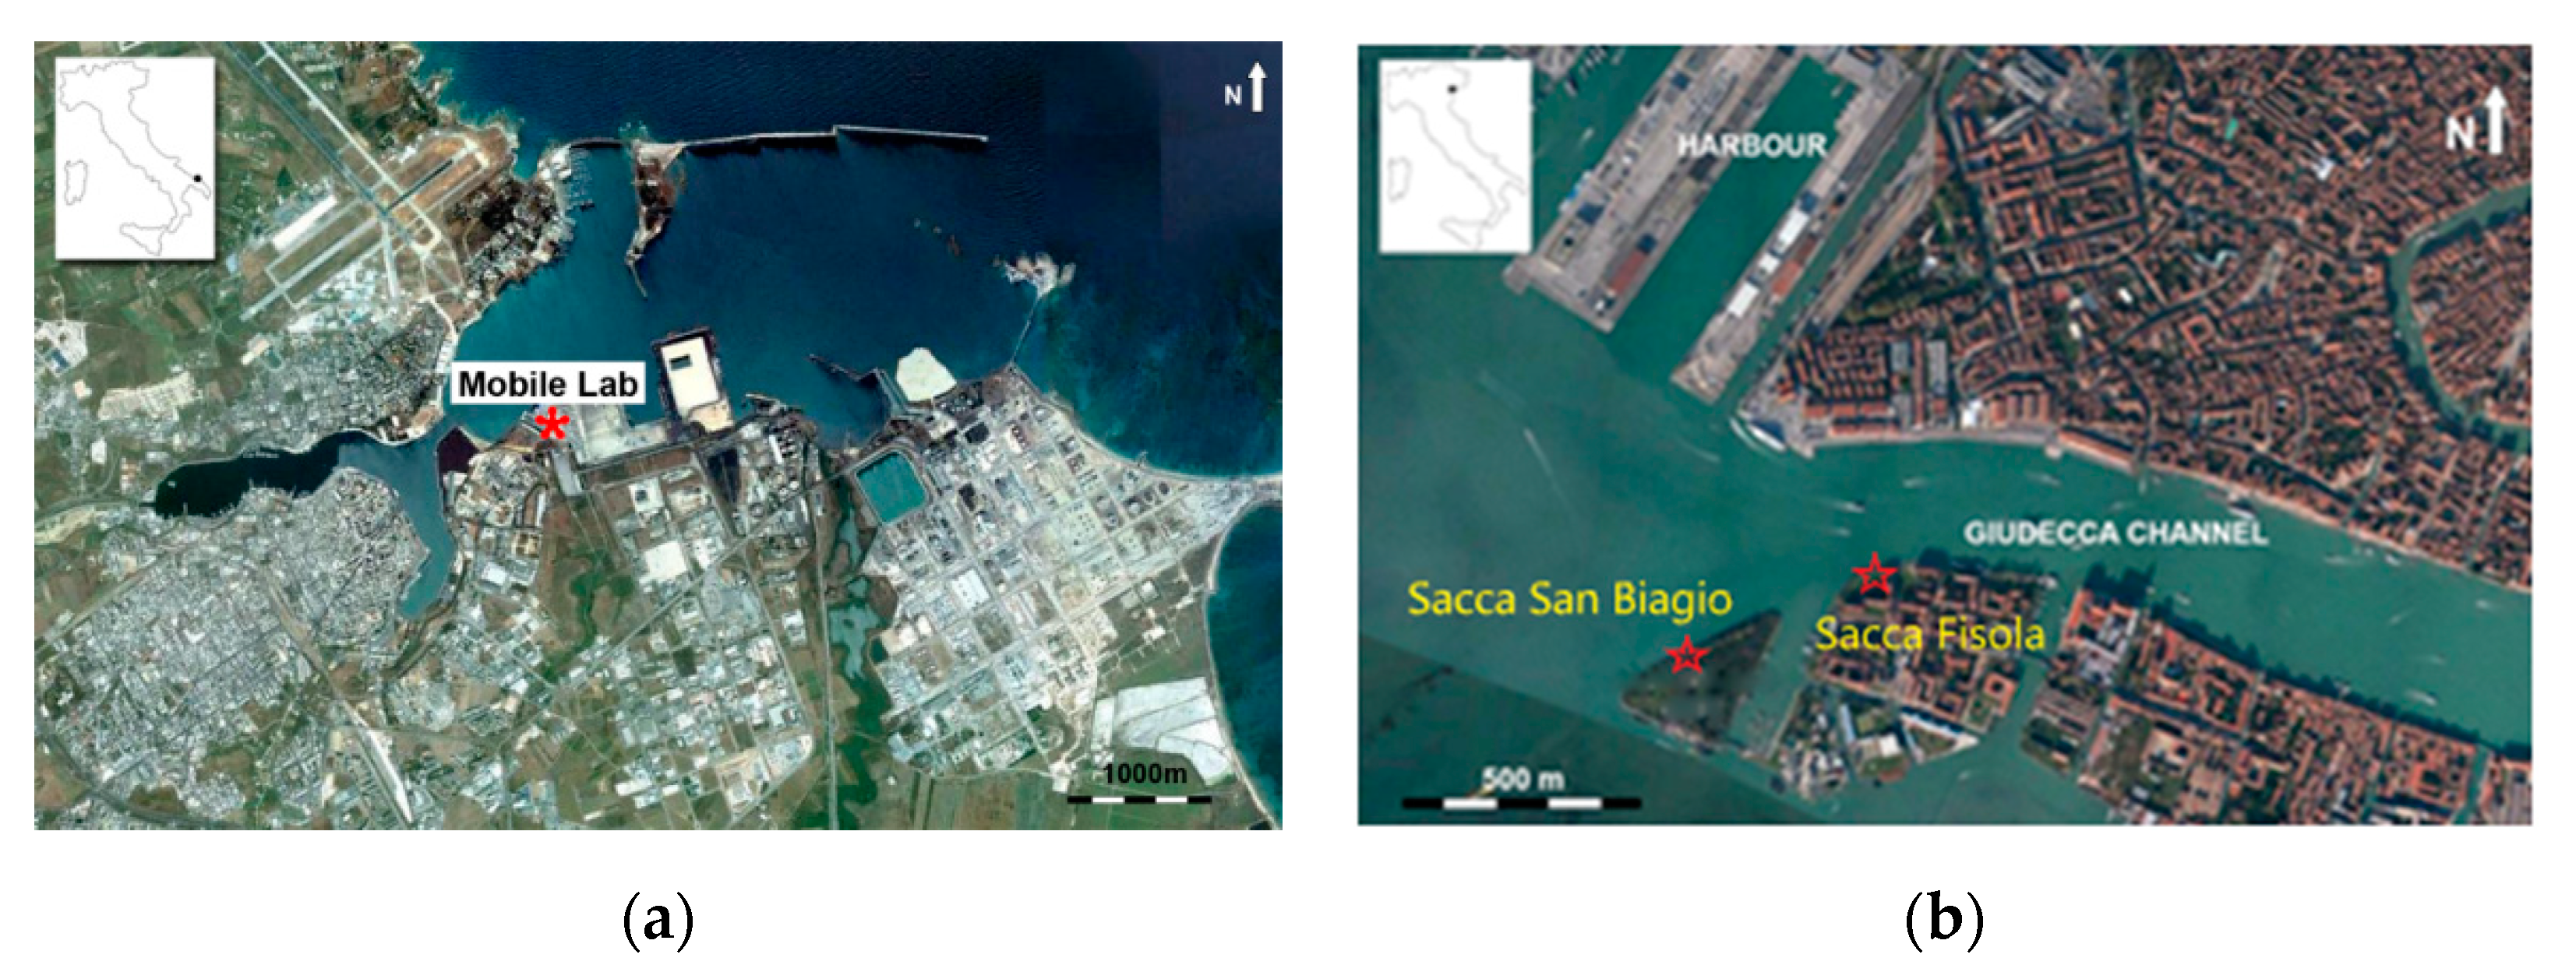
Different sampling campaigns were carried out in summertime, covering the period 2007–2018 in two Italian Adriatic port-cities (
Figure 1): Brindisi and Venice. The Brindisi harbour has a commercial and tourist vocation, recording a traffic volume of 7.9 Mtons of goods, 637,340 passengers (ferry + cruise), and 214,682 vehicles (private and Ro-Ro) in 2018 (
http://www.adspmam.it/, accessed on 12 June 2021). The measurement site was located in the intermediate zone of the harbour close to the Terminal Passenger building (about 35 m) and facing (at about 50 m) the water and ferryboat docks (40°38′43.32″ N–17°57′36.39″ E).
In Venice, the tourist harbour, namely Stazione Marittima, is separated from commercial piers, located at Porto Marghera within the large industrial area of Venice. The Venice Terminal Passenger, positioned at the corner of the Giudecca Canal, which is devoted to local ferries and catamarans, can host the largest cruise ships (with 5 km of quayside and 10 multifunctional passenger terminals). In 2018, 1.6 million cruise passengers transited there, designating Venice as one of the main Mediterranean homeports (
https://www.port.venice.it/, accessed on 12 June 2021). Here, the sampling site was on the Sacca San Biagio island (45°25′38.50″ N–12°18′33.86″ E, 1 km south of the passenger terminal) during the first campaigns (2007, 2009 and 2012), while it was on the neighbouring Sacca Fisola island (45°25′42″ N–12°18′46″ E, 500 m from the location of ships at berth) for the last 2018 campaign.
A similar instrumental setup was used at both sites, for collecting real-time measurements of main meteorological parameters and concentration of particles (in mass and number). In detail, for the last sampling campaigns, a micrometeorological station, based on a three-dimensional ultrasonic anemometer (R3 Gill Instruments Ltd., Lymington, UK) measured the main meteorological variables (i.e., wind speed, wind direction) at 1 min resolution. The total sub-micrometric particle number concentration was obtained by a Condensation Particle Counter (CPC, 1 min resolution). The cut-off diameter (50% efficiency) was 9 nm, thereby the system was measuring particles in the size range 0.009–1 µm (the latter is the upper limit of the CPC). An OPC provided particle number size distribution in the size range 0.25–31 µm in 31 size channels, operating at controlled flow of 1.2 L/min. In addition, the OPC internal software was also able to reconstruct mass size distributions as well as PM1, PM2.5, and PM10 mass concentration. Finally, a video camera operating at two frames per minute, was used to synchronise data of ship movements, provided by the Port Authorities, with concentrations and meteorological data.
The methodological approach for estimating primary ship contribution was originally introduced by Contini et al. [
9] for the Venice harbour, then applied to the Brindisi harbour [
10,
11] and to other sites [
12,
13]. Experimental data collected at the two sites were statistically treated and compared to estimate relative contribution of shipping to particle number concentration (PNC), PM
2.5 and PM
10. After selecting wind direction sectors favourable to measure ship plumes (measurement site downwind of the emissions) for each site, primary contribution from high temporal resolution measurements was calculated following Equation (1):
where (
CDP −
CDSP) = Δ
C is the difference between average concentration in periods potentially influenced and not influenced by ships, in downwind conditions;
CD is the average concentration in the downwind sector;
FP is the fraction of cases (i.e., 30 min averages) influenced by ships. Uncertainties have been evaluated looking at the variability of
ε calculated in elaborations done with and without wind calm (velocities <0.2 m/s) and with small changes by ±10° in definition of wind direction intervals.
3. Results and Discussion
3.1. Size-Segregated Shipping Contribution
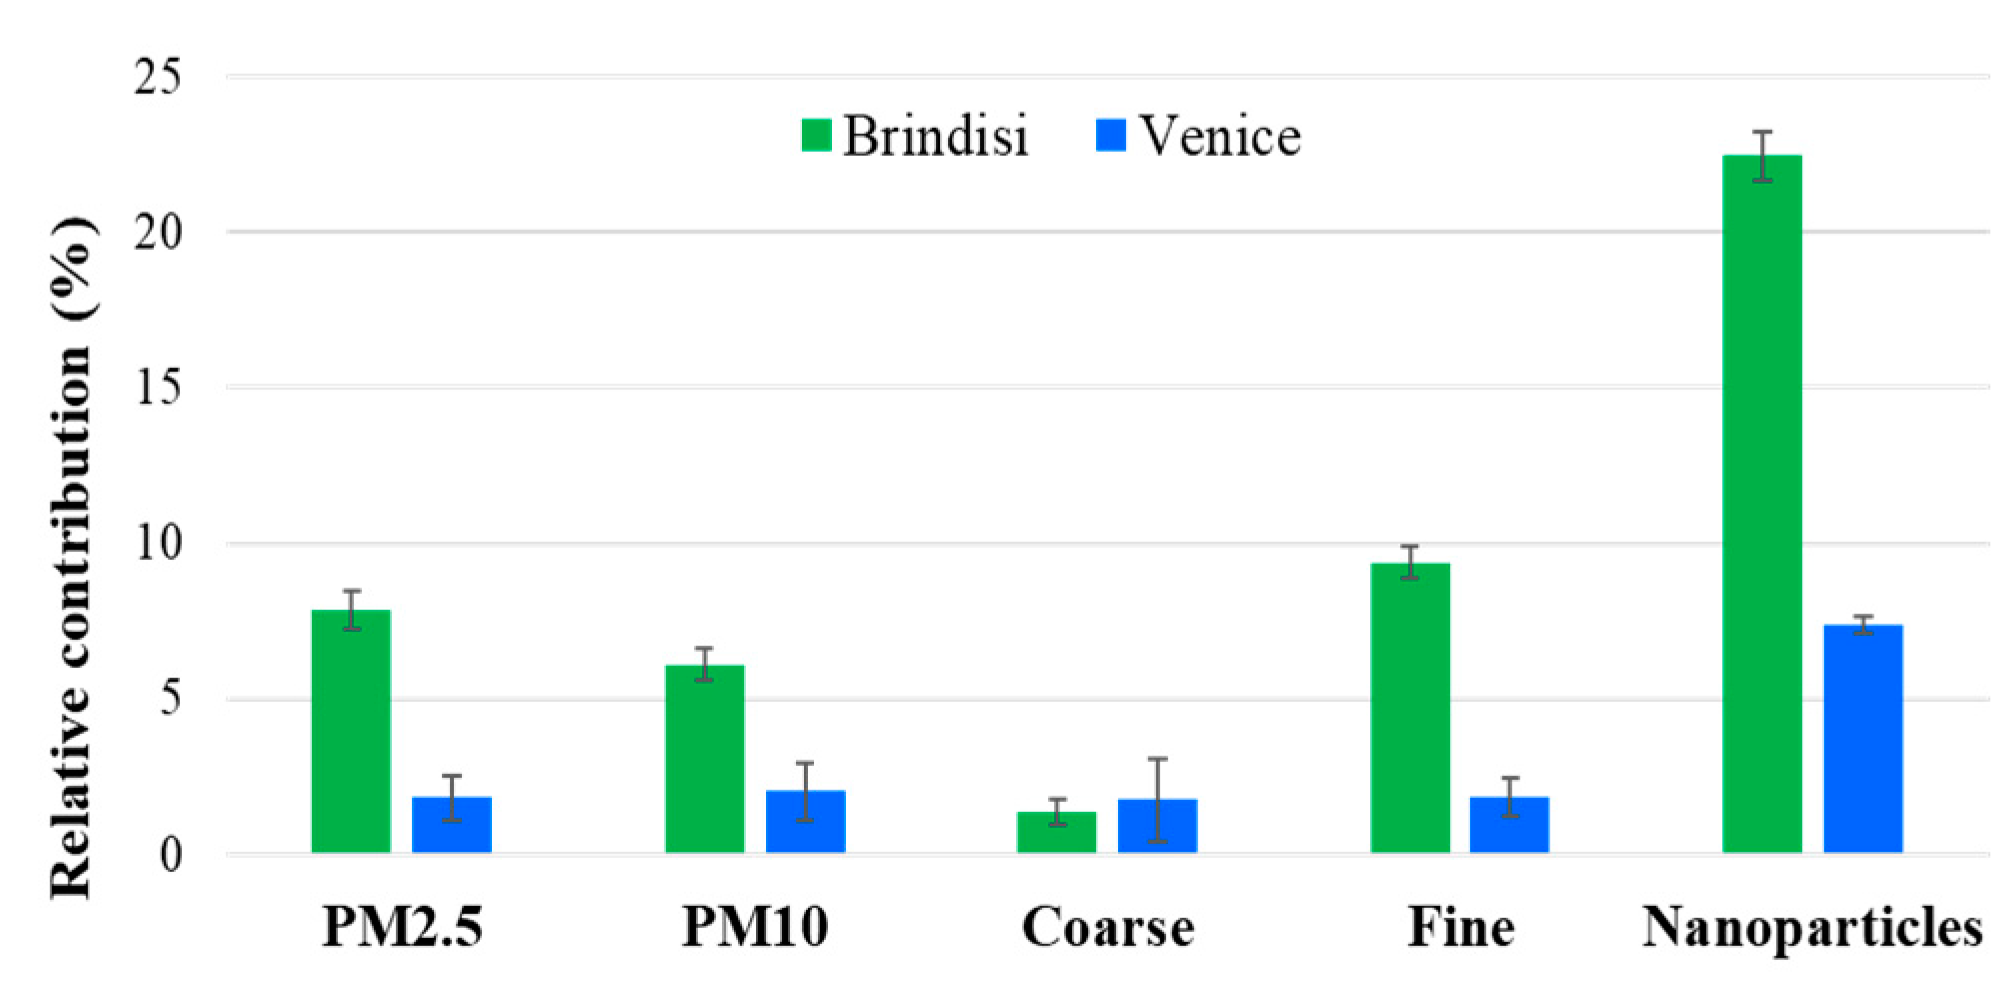
Measurements acquired with OPC and CPC in the last campaigns at the two locations allowed to investigate particle number and mass size distributions in a large size range (0.01–31 µm). Likewise, three size ranges were determined to analyse shipping impact to different particles’ sizes: nanoparticles (diameter D < 0.25 µm), fine particles (0.25 < D < 1 µm), and coarse particles (D > 1 µm).
The general trend of relative contribution was the same at both sites with larger values for nanoparticles, followed by fine and coarse particles’ ranges (
Figure 2). The relative shipping impact on nanoparticles was 7.4 ± 0.3% in Venice and 26 ± 1% in Brindisi; smaller contributions were found for number particle concentrations in the fine and coarse ranges (1.9% and 1.7% in Venice, and 9.4% and 1.4% in Brindisi, respectively). Results were larger in Brindisi for all size ranges, likely as a consequence of the distance from the docks (lower in Brindisi compared to Venice) and of the greater internal harbour vehicular traffic and the absence of local mitigation measures as in Venice. The smaller distance from the docks in Brindisi site is an important aspect because the contribution of shipping emissions to air quality quickly decreases with distance from the harbour [
14]. As reported, standard metrics for mass concentrations (i.e., PM
10 and PM
2.5) have comparable contributions. In fact, the impact to PM
2.5 represented about 84% and 81% of that to PM
10 in Brindisi and Venice, respectively [
11,
15]. This happens because ship exhaust emissions are in the ultrafine range, as observed in several studies [
11,
12,
16,
17,
18,
19,
20]. Definitively, this evidence supports the idea that particle number concentration, in nanoparticle or ultrafine size range, could be a better metric, compared to standard ones, to investigate the impact of shipping to local air quality.
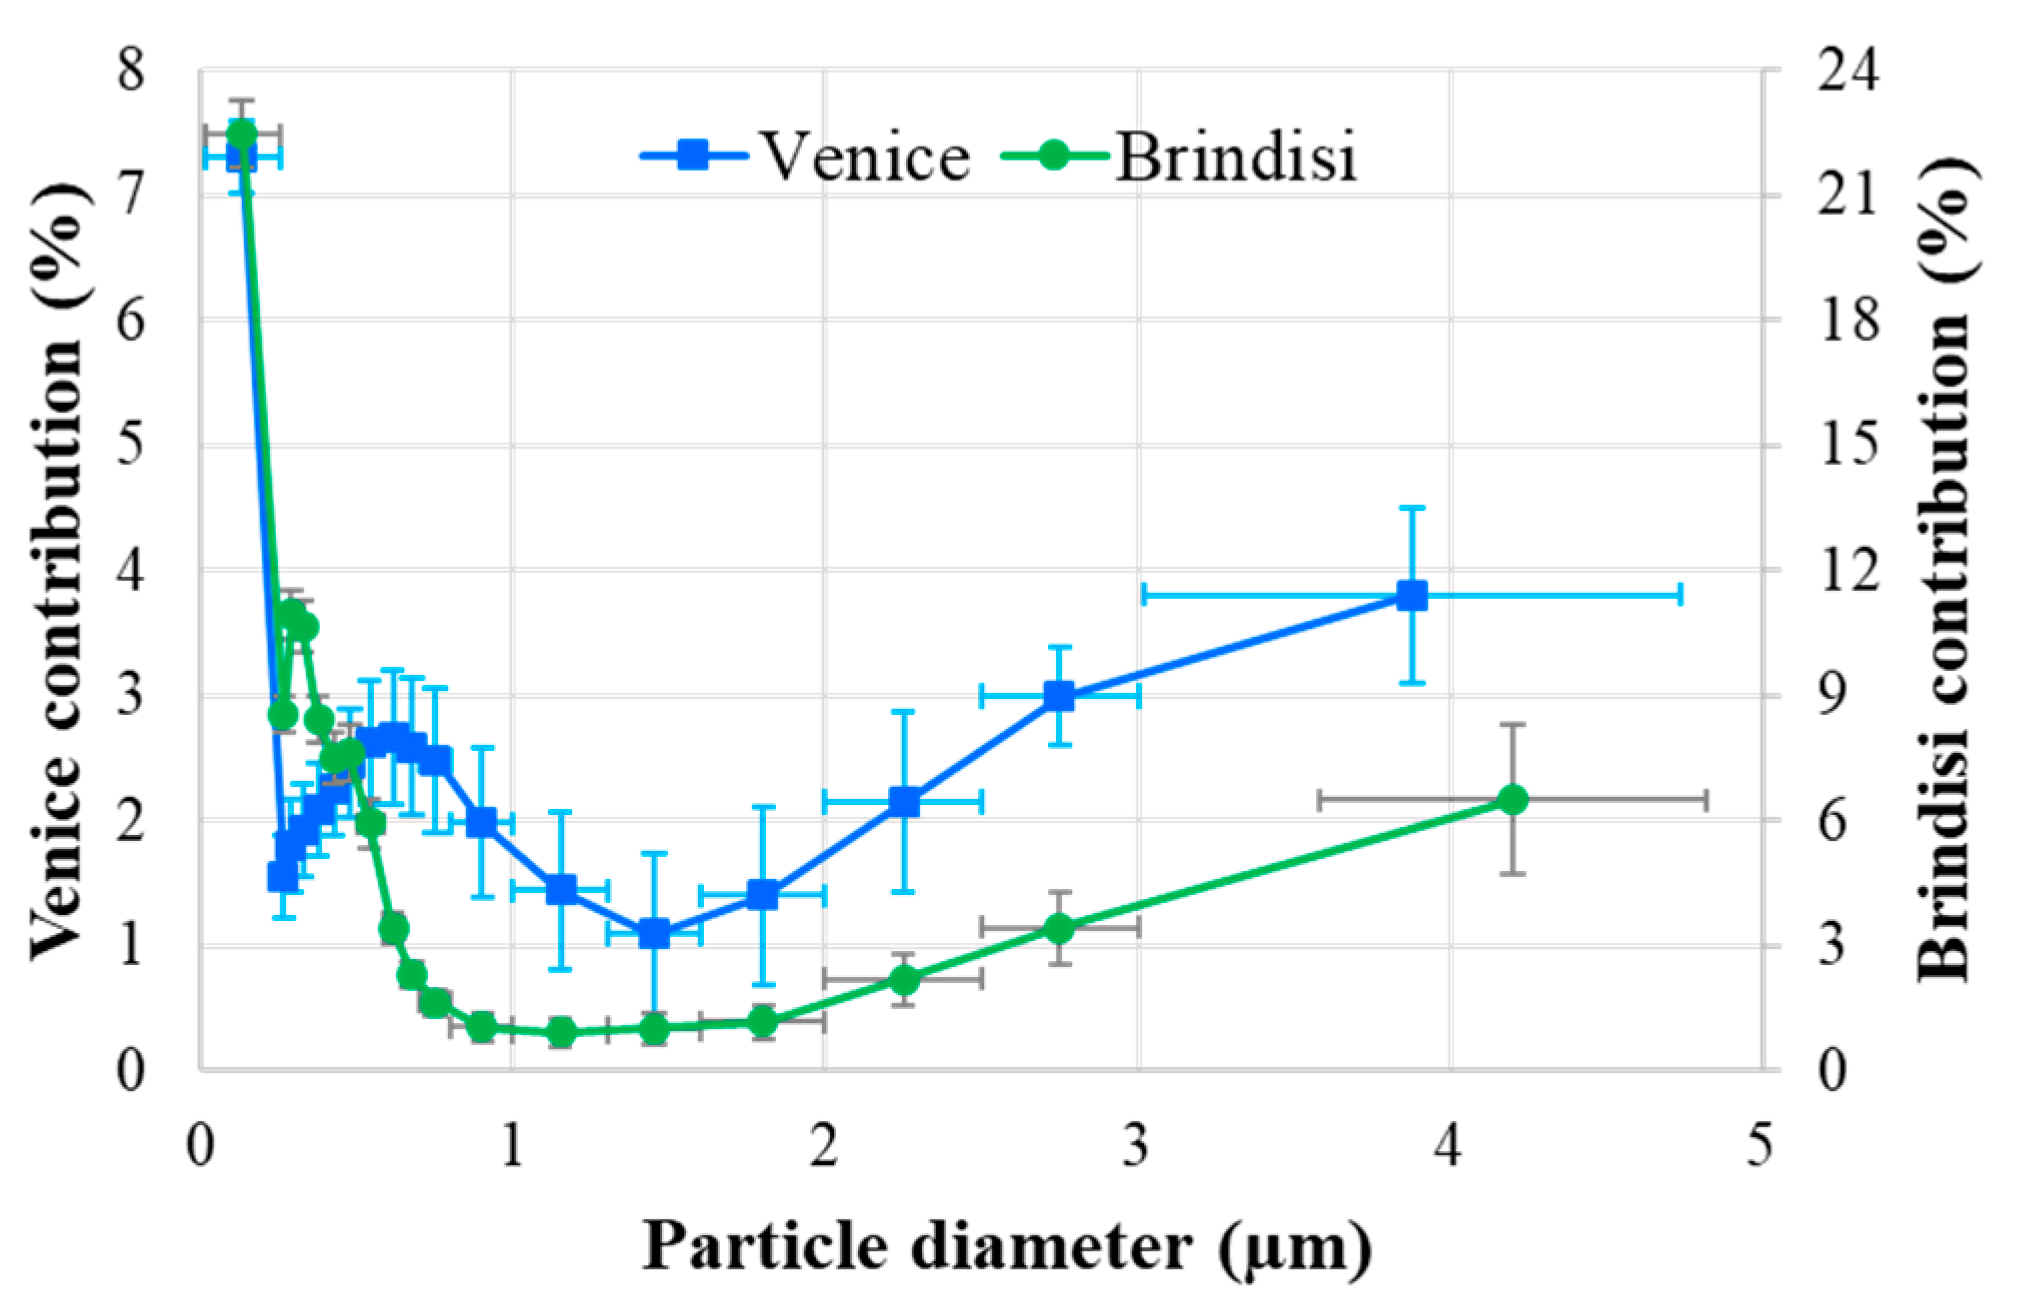
A characterisation and comparison of the size distribution of shipping impact is reported for both port-cities (
Figure 3). Results obtained showed general similarities and some different details between them. After a maximum for nanoparticles, a quick decrease and a secondary maximum in the fine range were recorded. The secondary maximum was in the range 0.3–0.45 µm in Brindisi and between 0.4 and 0.7 µm in Venice, being 2–3 times lower than the absolute maximum. For larger diameters, the relative contribution reached a minimum in the size range 1–1.5 µm, followed by a noticeable growth in the coarse size range for both sites.
Relatively fresh ship exhaust particle size distributions were found to have either unimodal or bimodal shape, however, a typical bimodal size distribution was observed with the modes centred at around 40–60 nm and 100–200 nm [
18,
19]. Additionally, a contribution of shipping in the nucleation range (at about 10 nm) was found at the banks of the Elbe in Northern Germany [
17].
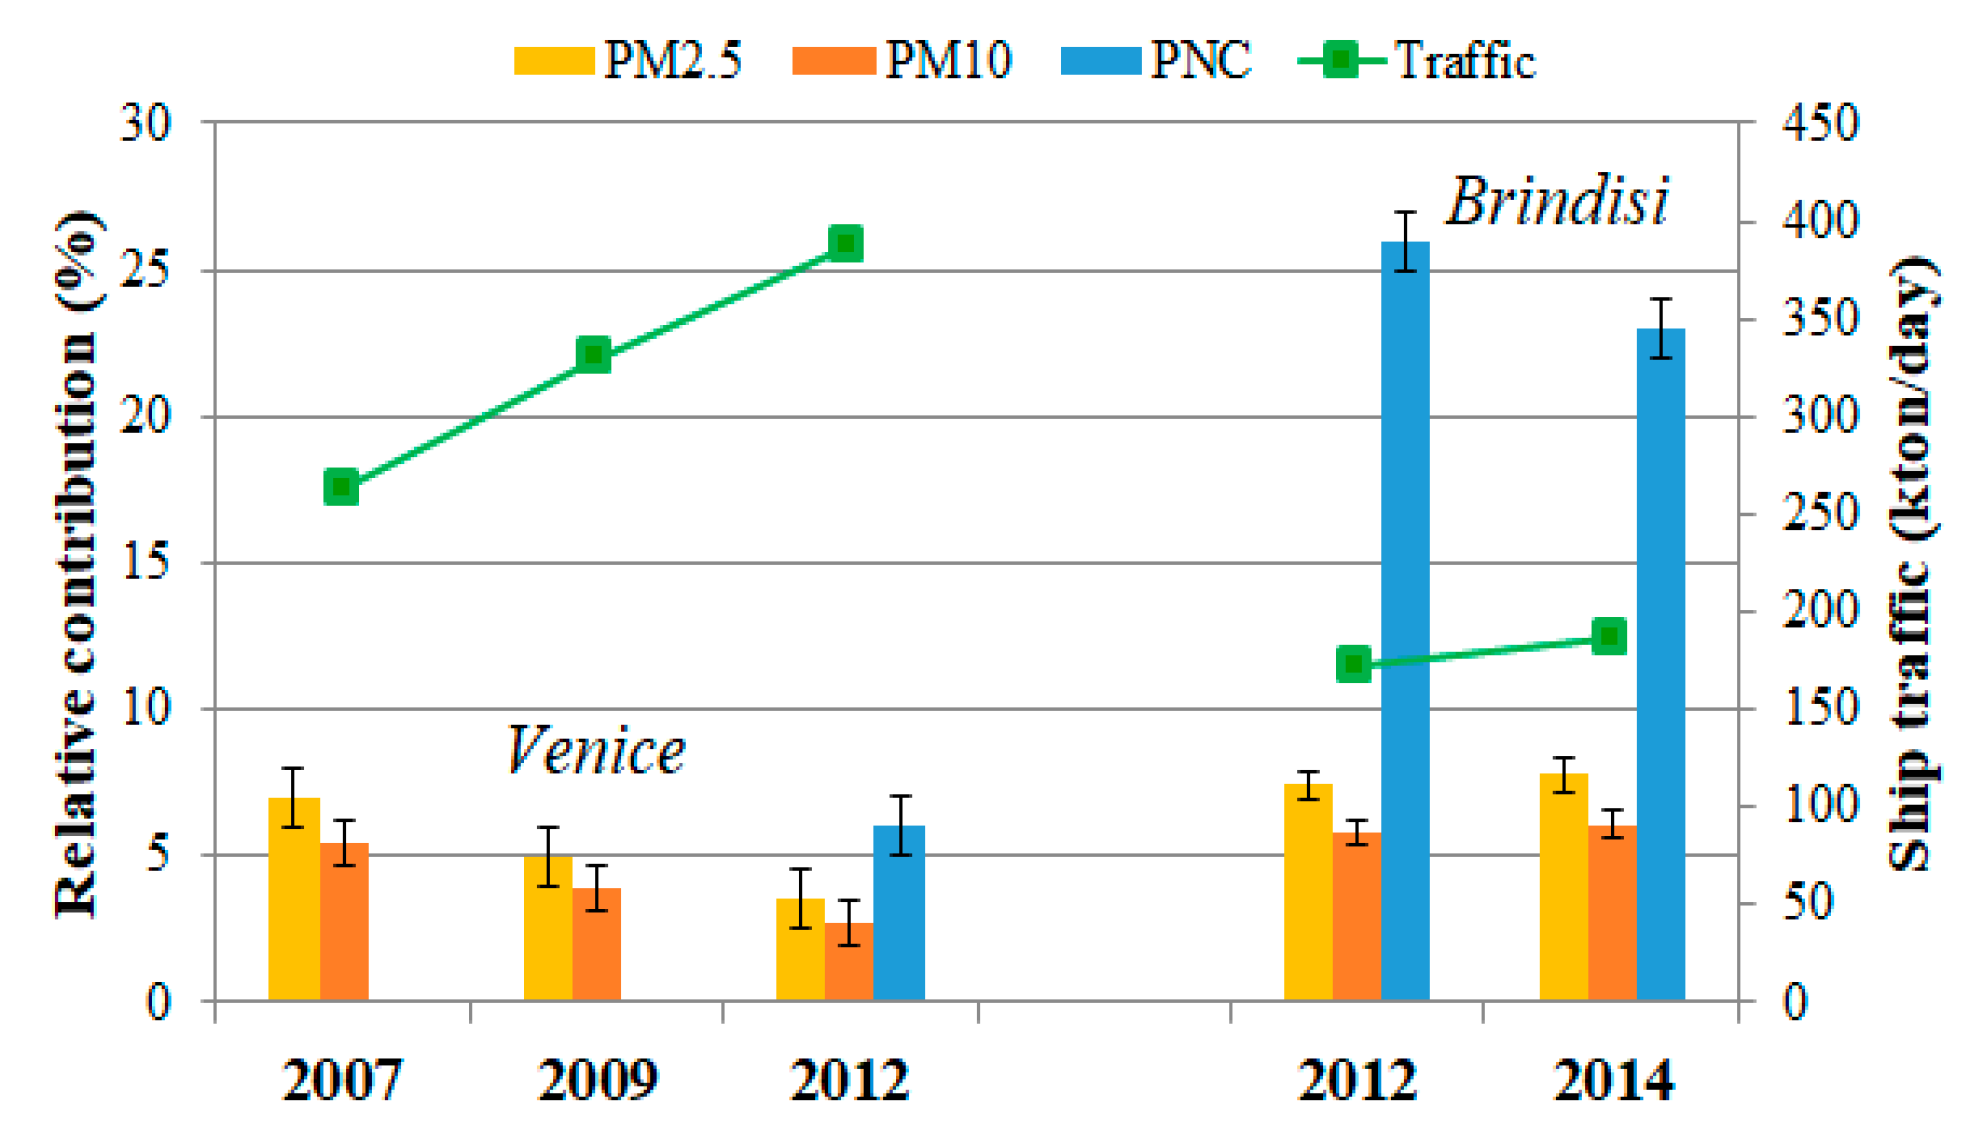
3.2. Temporal Trends
Estimates from previous studies performed in Venice [
21,
22] and Brindisi [
11] in the same period (summer months), with similar instrumental setup and methodological approach (even if in nearby different sites), were compared with the more recent results (
Figure 4).
Looking at contribution to mass concentration (PM2.5 and PM10) estimates in Venice showed a general decrease from 2007 to 2012, while in Brindisi, essentially comparable results were found between the two campaigns in 2012 and 2014. Despite an increasing ship traffic (as gross tonnage) of about 47%, the effect of the implementation (starting from 01/01/2010) of the 2005/33/EC Directive and to the local mitigation strategies (namely, “Venice Blue Flag”), signed in 2007 and 2008, was recorded. These agreements foresaw the use of cleaner fuels within the Lagoon, with maximum S content of 2.5% (±0.5%) since 2007 during manoeuvring and at berth, decreasing up to 2% (±0.5%) for manoeuvring and 1.5% (±0.25%) at berth since 2008. Contributions to PM in Brindisi were higher compared to Venice, however, a not significant change from 2012 to 2014 was observed, although a slight increase in ship traffic of about 8%. It should be noted that harbour logistics (i.e., loading/unloading of ships, vehicular traffic) could influence particle concentrations (both in number and mass) mainly in Brindisi site located near the docks, while this influence is more limited in the Venice site, located on an island directly facing the passenger terminal.
4. Conclusions
In this study, an estimate of the local impact of harbour activities on particulate matter concentration of different sizes in two Adriatic coastal cities was provided. Different campaigns, performed during the period 2012–2018 with the same instruments and applying the same statistical approach, allowed a direct comparison of results between sites and, in addition, a temporal analysis of estimated contributions.
The relative contribution to measured concentration of atmospheric particles (both in mass and number) was larger in Brindisi compared to Venice, as a consequence, mainly because of harbour logistics and because of the smallest distance of the measurement site from the docks, as well as the local mitigation strategies adopted within the Lagoon since previous years. At both sites, size distribution of relative impact showed a maximum for nanoparticles, a quick decrease, and a successive secondary maximum in the fine range. Trend analysis for the 2007–2012 period revealed that although there was an increase in ship traffic, there was a gradual decrease of ship contribution to PM in Venice, as an effect of local mitigation strategies and international legislation, while no significant changes for PM and PNC were observed in Brindisi between 2012 and 2014.
Although harbours are the pulsating economic heart of port-cities, as well as sources of development and innovation, the compelling need of further local reduction measures i.e., regulating emissions from specific type of vessels both in manoeuvring and berthing phases or of some climate change drivers (i.e., CO2, black carbon), should be addressed. In this way, a green port perspective could be achieved, with the objectives of health protection and sustainable development.
Author Contributions
Conceptualization, E.M. (Eva Merico), A.G. and D.C. (Daniele Contini); investigation, E.M. (Eva Merico), F.M.G., E.G., D.C. (Daniela Cesari), and M.C.; data curation, E.M. (Eva Merico), F.M.G., E.M. (Elisa Morabito), E.G. and M.C.; writing—original draft preparation, E.M. (Eva Merico); writing—review and editing, E.M. (Eva Merico) and D.C. (Daniele Contini). All authors have read and agreed to the published version of the manuscript.
Funding
The authors wish to gratefully acknowledge the contribution of the ECOMOBILITY project (“ECOlogical supporting for traffic Management in cOastal areas By using an InteLlIgenT sYstem”), co-funded by the European Regional Development Fund and Interreg Italy-Croatia CBC Programme, and national resources; of the POSEIDON project (“Pollution monitoring of ship emissions: an integrated approach for harbours of the Adriatic basin”,
www.medmaritimeprojects.eu/section/poseidon), with the financial support of the European Territorial Cooperation, MED 2007–2013; of the CESAPO project (“Contribution of Emission Sources on the Air Quality of the Port-cities in Greece and Italy”,
www.cesapo.upatras.gr), Interreg Greece-Italy 2007–2013.
Data Availability Statement
The data presented in this study are available on request from the corresponding author.
Conflicts of Interest
The authors declare no conflict of interest.
References
- UNCTAD. Review of Maritime Transport 2019; UN: New York, NY, USA, 2019; Available online: https://doi.org/10.18356/17932789-en (accessed on 31 May 2021). [CrossRef]
- Karl, M.; Jonson, J.E.; Uppstu, A.; Aulinger, A.; Prank, M.; Sofiev, M.; Jalkanen, J.-P.; Johansson, L.; Quante, M.; Matthias, V. Effects of ship emissions on air quality in the Baltic Sea region simulated with three different chemistry transport models. Atmos. Chem. Phys. 2019, 19, 7019–7053. [Google Scholar] [CrossRef] [Green Version]
- Viana, M.; Hammingh, P.; Colette, A.; Querol, X.; Degraeuwe, B.; Vlieger, I.; de van Aardenne, J. Impact of maritime transport emissions on coastal air quality in Europe. Atmos. Environ. 2014, 90, 96–105. [Google Scholar] [CrossRef]
- Sorte, S.; Rodrigues, V.; Borrego, C.; Monteiro, A. Impact of harbour activities on local air quality: A review. Environ. Pol. 2020, 257, 11354. [Google Scholar] [CrossRef] [PubMed]
- Contini, D.; Merico, E. Impact of shipping to atmospheric pollutants: State-of-the-art and perspectives. In International Encyclopedia of Transportation; Vickerman, R., Ed.; Elsevier Ltd.: London, UK, 2021; Volume 7, pp. 268–276. [Google Scholar]
- Sofiev, M.; Winebrake, J.J.; Johansson, L.; Carr, E.W.; Prank, M.; Soares, J.; Vira, J.; Kouznetsov, R.; Jalkanen, J.-P.; Corbett, J.J. Cleaner fuels for ships provide public health benefits with climate tradeoffs. Nat. Commun. 2018, 9, 406. [Google Scholar] [CrossRef] [Green Version]
- Viana, M.; Rizza, V.; Tobías, A.; Carr, E.; Corbett, J.; Sofiev, M.; Karanasiou, A.; Buonanno, G.; Fann, N. Estimated health impacts from maritime transport in the Mediterranean region and benefits from the use of cleaner fuels. Environ. Int. 2020, 138, 105670. [Google Scholar] [CrossRef]
- Contini, D.; Merico, E. Recent Advances in Studying Air Quality and Health Effects of Shipping Emissions. Atmosphere 2021, 12, 92. [Google Scholar] [CrossRef]
- Contini, D.; Gambaro, A.; Belosi, F.; De Pieri, S.; Cairns, W.R.L.; Donateo, A.; Zanotto, E.; Citron, M. The direct influence of ship traffic on atmospheric PM2.5, PM10 and PAH in Venice. J. Environ. Manag. 2011, 92, 2119–2129. [Google Scholar] [CrossRef]
- Donateo, A.; Gregoris, E.; Gambaro, A.; Merico, E.; Giua, R.; Nocioni, A.; Contini, D. Contribution of harbour activities and ship traffic to PM2.5, particle number concentrations and PAHs in a port city of the Mediterranean Sea (Italy). Environ. Sci. Pollut. Res. 2014, 21, 9415–9429. [Google Scholar] [CrossRef] [PubMed]
- Merico, E.; Donateo, A.; Gambaro, A.; Cesari, D.; Gregoris, E.; Barbaro, E.; Dinoi, A.; Giovanelli, G.; Masieri, S.; Contini, D. Influence of in-port ships emissions to gaseous atmospheric pollutants and to particulate matter of different sizes in a Mediterranean harbour in Italy. Atmos. Environ. 2016, 139, 1–10. [Google Scholar] [CrossRef]
- Ledoux, F.; Roche, C.; Cazier, F.; Beaugard, C.; Courcot, D. Influence of ship emissions on NOx, SO2, O3 and PM concentrations in a North-Sea harbour in France. J. Environ. Sci. 2018, 71, 56–66. [Google Scholar] [CrossRef] [PubMed]
- Wang, X.; Shen, Y.; Lin, Y.; Pan, J.; Zhang, Y.; Louie, K.K.P.; Li, M.; Fu, Q. Atmospheric pollution from ships and its impact on local air quality at a port site in Shanghai. Atmos. Chem. Phys. 2019, 19, 6315–6330. [Google Scholar] [CrossRef] [Green Version]
- Merico, E.; Dinoi, A.; Contini, D. Development of an integrated modelling-measurement system for near-real-time estimates of harbour activity impact to atmospheric pollution in coastal cities. Transp. Res. Part D 2019, 73, 108–119. [Google Scholar] [CrossRef]
- Merico, E.; Conte, M.; Grasso, F.M.; Cesari, D.; Gambaro, A.; Morabito, E.; Gregoris, E.; Orlando, S.; Alebić-Juretić, A.; Zubak, V.; et al. Comparison of the impact of ships to size-segregated particle concentrations in two harbour cities of northern Adriatic Sea. Environ. Poll. 2020, 266, 115175. [Google Scholar] [CrossRef] [PubMed]
- Kasper, A.; Aufdenblatten, S.; Forss, A.; Mohr, M.; Burtcher, H. Particulate emissions from a low-speed marine diesel engine. Aerosol Sci. Technol. 2007, 41, 24–32. [Google Scholar] [CrossRef] [Green Version]
- Diesch, J.M.; Drewnick, F.; Klimach, T.; Borrmann, S. Investigation of gaseous and particular emissions from various marine vessel types measured on the banks of the Elbe in Northern Germany. Atmos. Chem. Phys. 2013, 13, 3603–3618. [Google Scholar] [CrossRef] [Green Version]
- Kivekäs, N.; Massling, A.; Grythe, H.; Lange, R.; Rusnak, V.; Carreno, S.; Skov, H.; Swietlicki, E.; Nguyen, Q.T.; Glasius, M.; et al. Contribution of ship traffic to aerosol particle concentrations downwind of a major shipping lane. Atmos. Chem. Phys. 2014, 14, 8255–8267. [Google Scholar] [CrossRef] [Green Version]
- Pirjola, L.; Pajunoja, A.; Walden, J.; Jalkanen, J.-P.; Rönkkö, T.; Kousa, A.; Koskentalo, T. Mobile measurements of ship emissions in two harbour areas in Finland. Atmos. Meas. Tech. 2014, 7, 149–161. [Google Scholar] [CrossRef] [Green Version]
- Ausmeel, S.; Eriksson, A.; Ahlberg, E.; Kristensson, A. Methods for identifying aged ship plumes and estimating contribution to aerosol exposure downwind of shipping lanes. Atmos. Meas. Tech. Discuss. 2019, 12, 4479–4493. [Google Scholar] [CrossRef] [Green Version]
- Contini, D.; Gambaro, A.; Donateo, A.; Cescon, P.; Cesari, D.; Merico, E.; Belosi, F.; Citron, M. Inter annual trend of the primary contribution of ship emissions to PM2.5 concentrations in Venice (Italy): Efficiency of emissions mitigation strategies. Atmos. Environ. 2015, 102, 183–190. [Google Scholar] [CrossRef]
- Gregoris, E.; Barbaro, E.; Morabito, E.; Toscano, G.; Donateo, A.; Cesari, D.; Contini, D.; Gambaro, A. Impact of maritime traffic on polycyclic aromatic hydrocarbons, metals and particulate matter in Venice air. Environ. Sci. Pollut. Res. 2016, 23, 6951–6959. [Google Scholar] [CrossRef] [Green Version]
- Merico, E.; Gambaro, A.; Argiriou, A.; Alebic-Juretic, A.; Barbaro, E.; Cesari, D.; Chasapidis, L.; Dimopoulos, S.; Dinoi, A.; Donateo, A.; et al. Atmospheric impact of ship traffic in four Adriatic-Ionian port-cities: Comparison and harmonization of different approaches. Transp. Res. Part D Transp. Environ. 2017, 50, 431–445. [Google Scholar] [CrossRef]
| Publisher’s Note: MDPI stays neutral with regard to jurisdictional claims in published maps and institutional affiliations. |
© 2021 by the authors. Licensee MDPI, Basel, Switzerland. This article is an open access article distributed under the terms and conditions of the Creative Commons Attribution (CC BY) license (https://creativecommons.org/licenses/by/4.0/).


 ,
, 


