The African Easterly Waves over Northern South America †

Grupo de Ingeniería y Gestión Ambiental (GIGA), Escuela Ambiental, Facultad de Ingeniería, Universidad de Antioquia, Medellín 050002, Antioquia, Colombia
*
Author to whom correspondence should be addressed.
†
Presented at the 2nd International Electronic Conference on Atmospheric Sciences, 16–31 July 2017; Available online: http://sciforum.net/conference/ecas2017.
Proceedings 2017, 1(5), 165; https://doi.org/10.3390/ecas2017-04151
Published: 17 July 2017
(This article belongs to the Proceedings of Proceedings of the 2nd International Electronic Conference on Atmospheric Sciences)
Abstract
:Spatiotemporal conditions that rule hydro-climatology over northern South America and the Caribbean Sea are influenced by a large amount of phenomena taking place at different timescales. Characterizing the activity of the AEWs over northern South America and the Caribbean is an imperative work to do in order to improve our understanding of the tropical atmospheric dynamics involved in hydrology and climate features over the region. The latter regulates the availability of very important resources such as water. Furthermore, AEWs activity plays an important role on air quality characteristics as a consequence of its connections with dust transport. In order to approach an adequate characterization of the AEWs activity over the region, this work addresses the relationship between these atmospheric perturbations and the occurrence or inhibition of precipitation, as well as possible connections with dust transport, when the AEW’s oscillations take place over northern South America and the Caribbean region. In particular, relative vorticity and outgoing long-wave radiation are used to identify AEW’s activity during the 1983–2013 period, together with daily precipitation anomalies, surface divergence, vertical integrated moisture flux, and Aerosol Optical Depth, in order to understand how the passage of AEWs could influence meteorological interactions in the region.
1. Introduction
Due to its geographical location, the spatiotemporal conditions that shape the hydro-climatology over northern South America and the Caribbean Sea are influenced by a large amount of phenomena taking place at different timescales. Such location determines that the region receives a huge amount of solar radiation throughout the year. Such tropical location, as well as the local topography, explains why northern South America is a complex region in terms of climate dynamics [1].
The African Easterly Waves (AEWs) are among the intraseasonal features influencing the complex climate dynamics of northern South America [2]. AEWs consist on undulatory atmospheric perturbations with a quasi-periodic behavior. They occur within the trade winds regime in the Northern Hemisphere during boreal summer, and are related to cyclonic circulation and convergence of air masses in the lower levels [3,4]. AEWs propagate westward across the Atlantic Ocean with a velocity of 7–8 ms−1, and exhibit a latitudinal extension around 10–15 degrees [5].
The importance of studying the AEWs and their relationship with precipitation over northern South America is highlighted by previous studies stating that AEWs are frequent during the rainy season in northern Colombia [6]. Besides, a strong signal of AEWs-related spectral band is observed in the wavelet spectrum of precipitation records in Colombia [7]. Furthermore, it is known that AEWs enhance convective activity by inducing surface convergence processes to the east of the wave trough, allowing the occurrence of precipitation events [8].
On the other hand, mineral dust incursion into the Atlantic Ocean and the Caribbean is one of the major climatological features of the distribution of aerosols in this region [9]. Furthermore, such dust transport is considered as an important feature of the climate system [10], mainly because aerosols modulate radiation budget and hydrological cycle by direct and indirect processes, playing a potential role in regional weather and climate variability [11,12]. During the boreal summer, most of the mineral dust is transported to the Caribbean Sea and North America [13,14]. It has been pointed out that mineral dust incursion into the Caribbean Sea and North America during this season is modulated by the activity of AEWs [15]. The role of AEWs on mineral dust entrainment into the atmosphere, due to the strong winds during some phases of these waves life cycle, as well as the transport of the Saharan mineral dust across the Atlantic Ocean, have been discussed for years [12,15,16]. It is considered that between 10% and 20% of desert dust that is transported across the Atlantic Ocean during the boreal summer is related to AEW’s activity [9].
2. Data and Methods
Daily zonal and meridional components of wind from the ERA-Interim reanalysis with a spatial resolution of 1.5° × 1.5° [17] are used to calculate the relative vorticity, which is vertically averaged between the 850 hPa and 600 hPa levels and smoothed to a T42 resolution, using a bilinear interpolation technique. The T42 resolution (approximately 280 km grid space at the equator) is used in order to filter variability in a smaller spatial scale than the AEW’s typical wavelengths [18,19].
In order to complement the identification of AEW’s activity, OLR anomalies exceeding a threshold of 2Wm2, computed from daily values of the NOAA Interpolated OLR dataset, with a spatial resolution of 2.5° × 2.5°, are used [20]. The OLR daily anomalies are filtered within 2 to 8 days applying a digital Lanczos bandpass filter in order to keep the variability related to the convectively coupled AEWs [21]. Additionally, 0.25° × 0.25° daily PERSIANN-CDR precipitation anomalies [22] are used to study the relationship between AEW’s activity and the occurrence or inhibition of precipitation over northern South America. This work is focused on the June-to-September season (JJAS), the time of the year with the highest activity of these waves, during the period 1983–2013, which is the common period available for the different datasets mentioned above.
Combined land and ocean MODIS AOD is also used aiming to perform a daily trace of the mineral dust transport across the Atlantic Ocean, related to AEW’s activity. The MODIS aerosols retrieves are made at a spatial resolution of 10km X 10km using separate retrieval algorithms for ocean and land [23]. The AOD analysis is performed within the 2000–2013 period due to the availability of this dataset, allowing to find information not only about dust transport over the Atlantic Ocean related to the AEWs activity but also about the dry waves and their link with the inhibition of precipitation over northern South America.
3. Results and Discussion
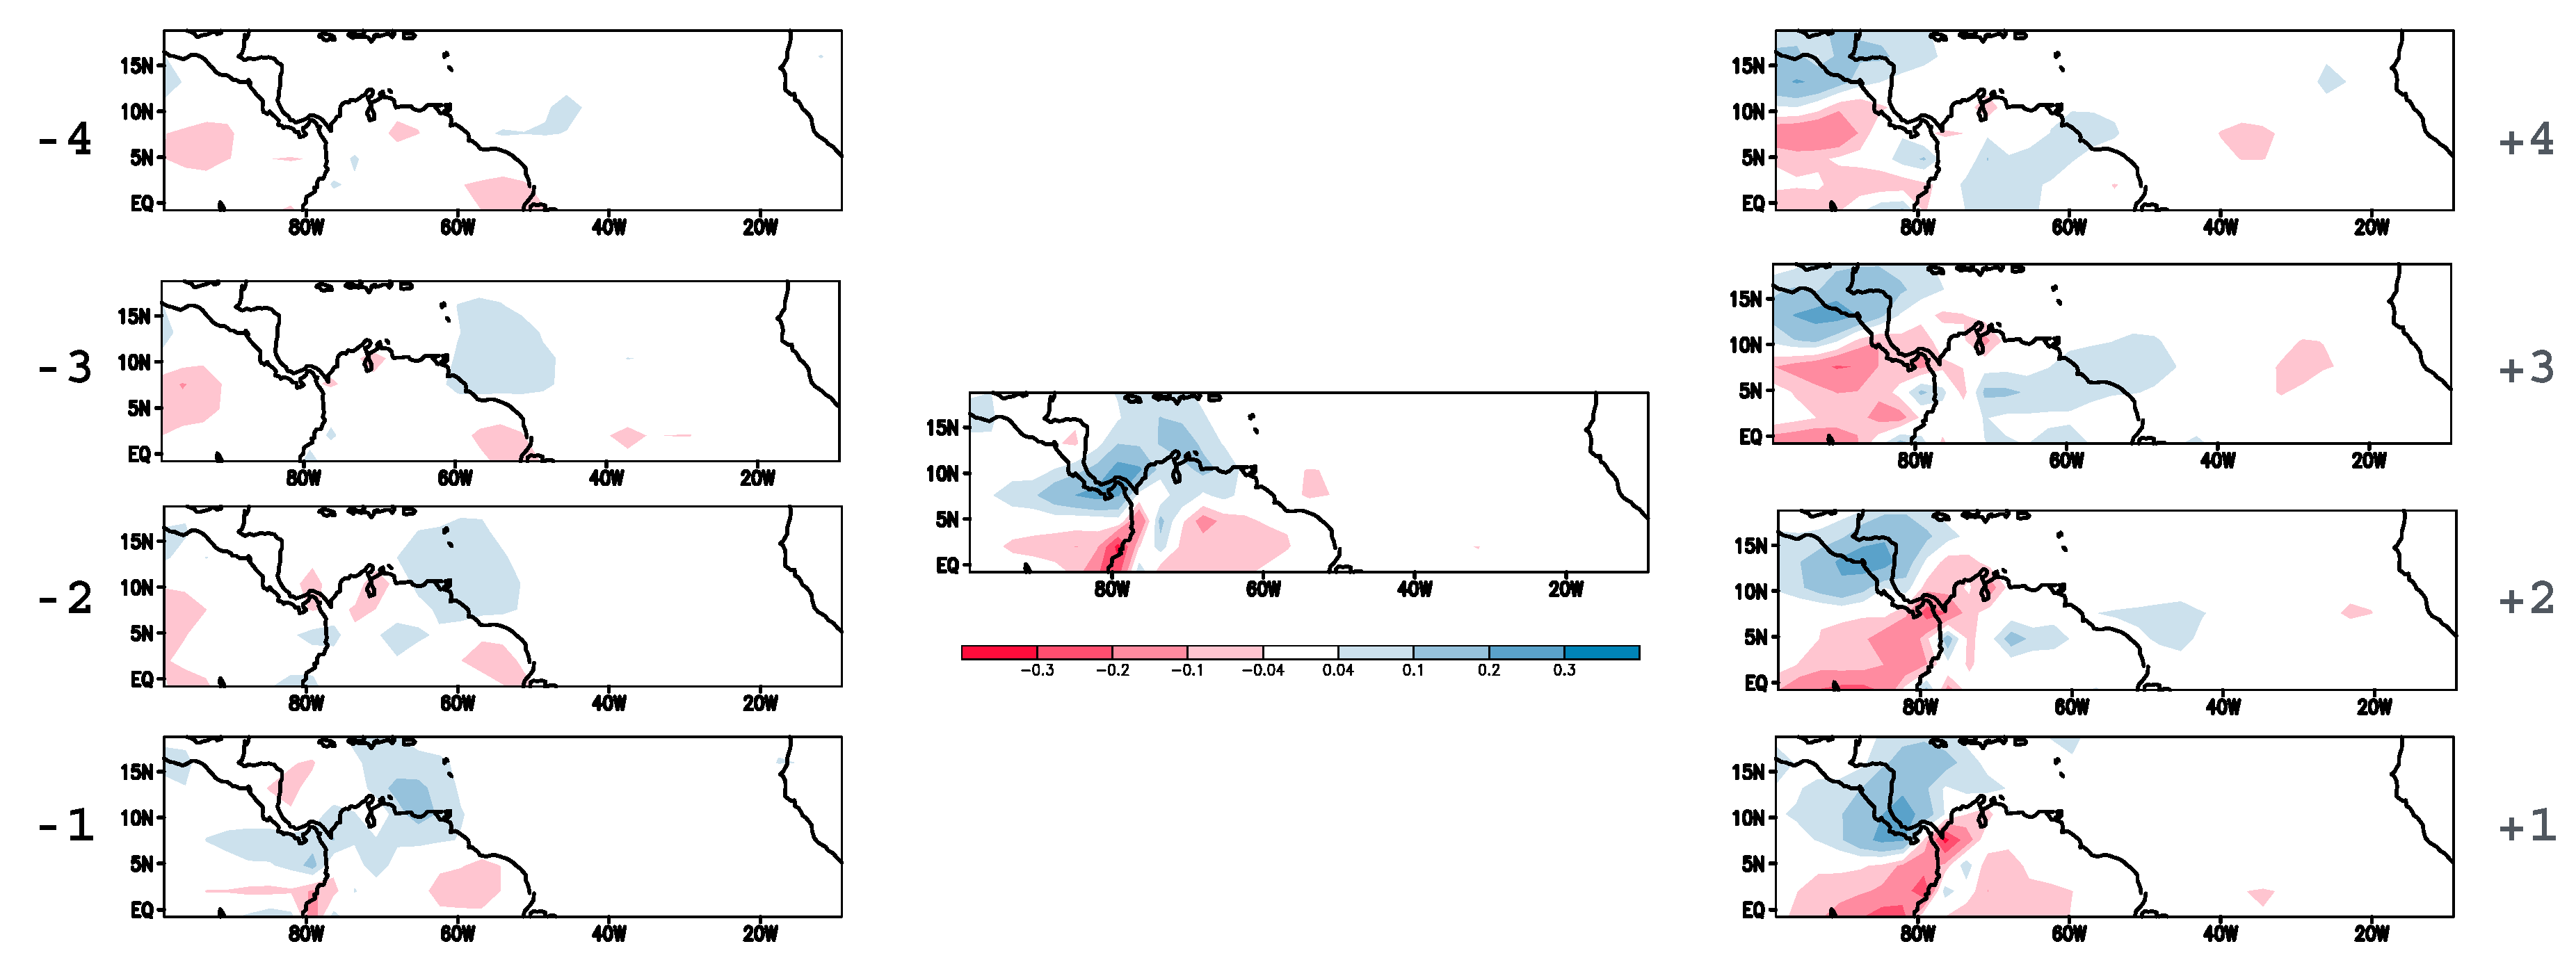
The link between AEWs and precipitation over northern South America was initially addressed aiming to identify the statistical relationship between AEW’s activity over the region and the 5° N–15° N, 80° W–70° W domain average for PERSIANN-CDR precipitation anomalies. Precipitation anomalies were considered in order to filter interannual variability, which is the first mode of variability for precipitation over northern South America [1,24]. Figure 1 shows the point-by-point daily-lagged significant cross-correlation between the JJAS season precipitation anomalies in northern South America and the relative vorticity anomalies during the 1983–2013 period.
The correlation pattern exhibits the westward propagation of the AEWs and the occurrence of precipitation due to the enhanced convection activity related to these disturbances. Furthermore, a region of influence of AEWs on precipitation over northern South America is clearly identified between 50° W–90° W and 0°–20° N, as suggested by precipitation anomalies—smoothed relative vorticity cross-correlation patterns for the daily lagged PERSIANN-CDR precipitation. In order to accomplish a better understanding of the existing relationship between the passage of AEWs over northern South America and the occurrence of precipitation, a daily composite analysis is performed after identifying the exact dates in which the AEWs cross over northern Colombia. The composite analysis is done using a lag of 4 days before to 4 days after the passage of an AEW over the domain 5° N–15° N, 80° W–70° W (Figure 1).
Table 1 shows the total of AEWs identified as well as their classification into convective and dry waves. This identification was compared to the passage of AEWs reported by the Costa Rican Meteorological Institute (IMN) and the Colombian Meteorological Institute (IDEAM), finding a consistent pattern on the dates of the AEW’s displacement over the region, as depicted by the smoothed relative vorticity and the reports issued by these two meteorological institutes. AEWs were classified into convective and dry waves, according to their effect on precipitation and OLR anomalies during day 0 (i.e., when the AEW is over the region 5° N–15° N, 80° W–70° W).
As shown in Table 1, from the total of AEWs identified crossing over Colombia during the 1983–2013 period, 85.7% are related to a positive precipitation anomaly over northern South America while the remaining 14.3% AEWs have an opposite effect on precipitation. Thus, our analysis is detached into convective and dry AEWs.
3.1. Convective AEWs
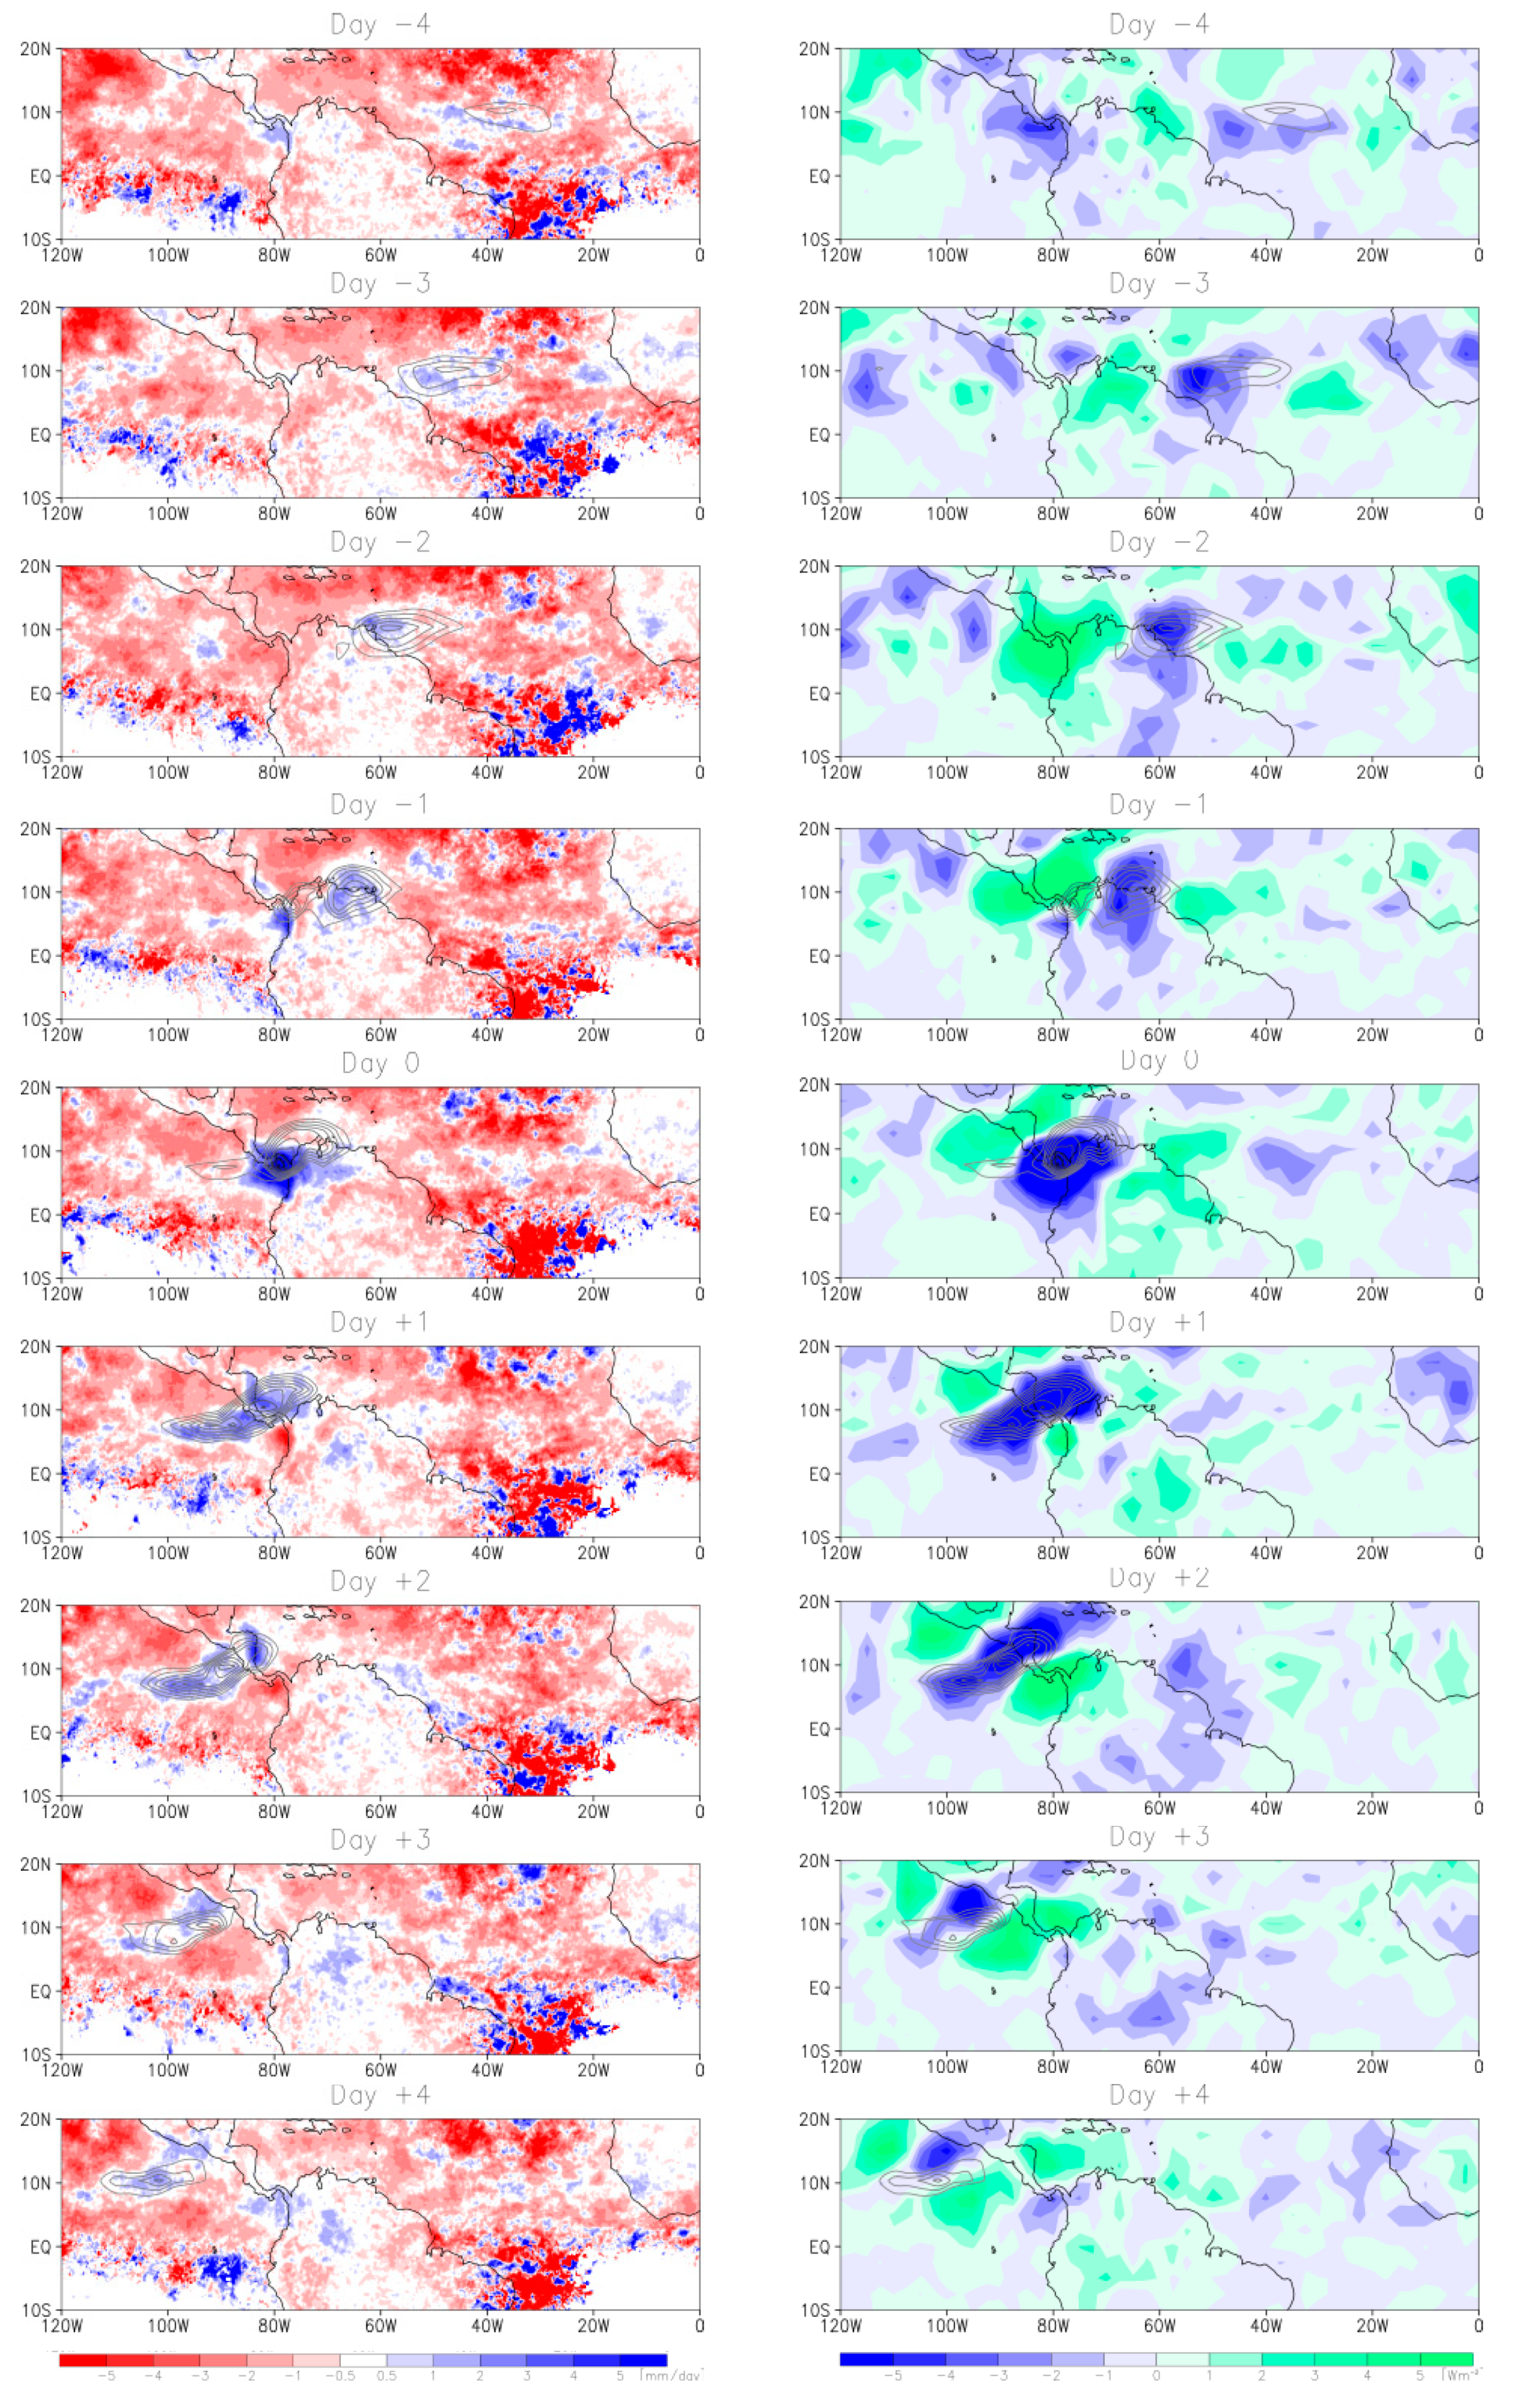
The convective AEWs (i.e., those favoring precipitation) represent more than 85% of the total AEWs crossing over Colombia during the period 1983–2013, where the occurrence of precipitation is one of the main meteorological responses to the passage of these disturbances over northern South America. Figure 2 (left) shows that convective AEWs influence precipitation in agreement with their physical characteristics. The AEWs, which are tracked using smoothed relative vorticity anomalies, displace together with a region of positive precipitation anomalies over the wave trough, due to near-surface local convergence, while to the west and east of the wave trough, negative precipitation anomalies appear. Both types of anomalies are thought to be related with the AEWs effect on the wind field and are explored below. In addition, the convective AEWs relationship with OLR is shown in Figure 2 (right).
OLR anomalies composite shows a more defined pattern than that related to precipitation. In particular, the relationship between AEWs displacement and precipitation appears to be noisy from 2 days before to 2 days after the passage of an AEW (Figure 2, left) while the influence of these disturbances on OLR anomalies is more consistent during the interval between 4 days before to 4 days after the wave passage (Figure 2, right). Negative values of OLR anomalies move simultaneously with the AEWs, as tracked from smoothed relative vorticity anomalies.
Thus, the occurrence of precipitation could be a secondary effect of the passage of an AEW, as the result of enhanced cloud cover induced by surface convergence due to the wave propagation. Besides, a precisely delimited region of positive OLR anomalies, related to an absence of cloudiness, is located to the west, as well as to the east of the wave trough. The latter is not only in agreement with previous studies [6] but also with the pattern exhibited by significant cross-correlation between smoothed relative vorticity anomalies and precipitation anomalies (Figure 1).
3.2. Dry AEWs
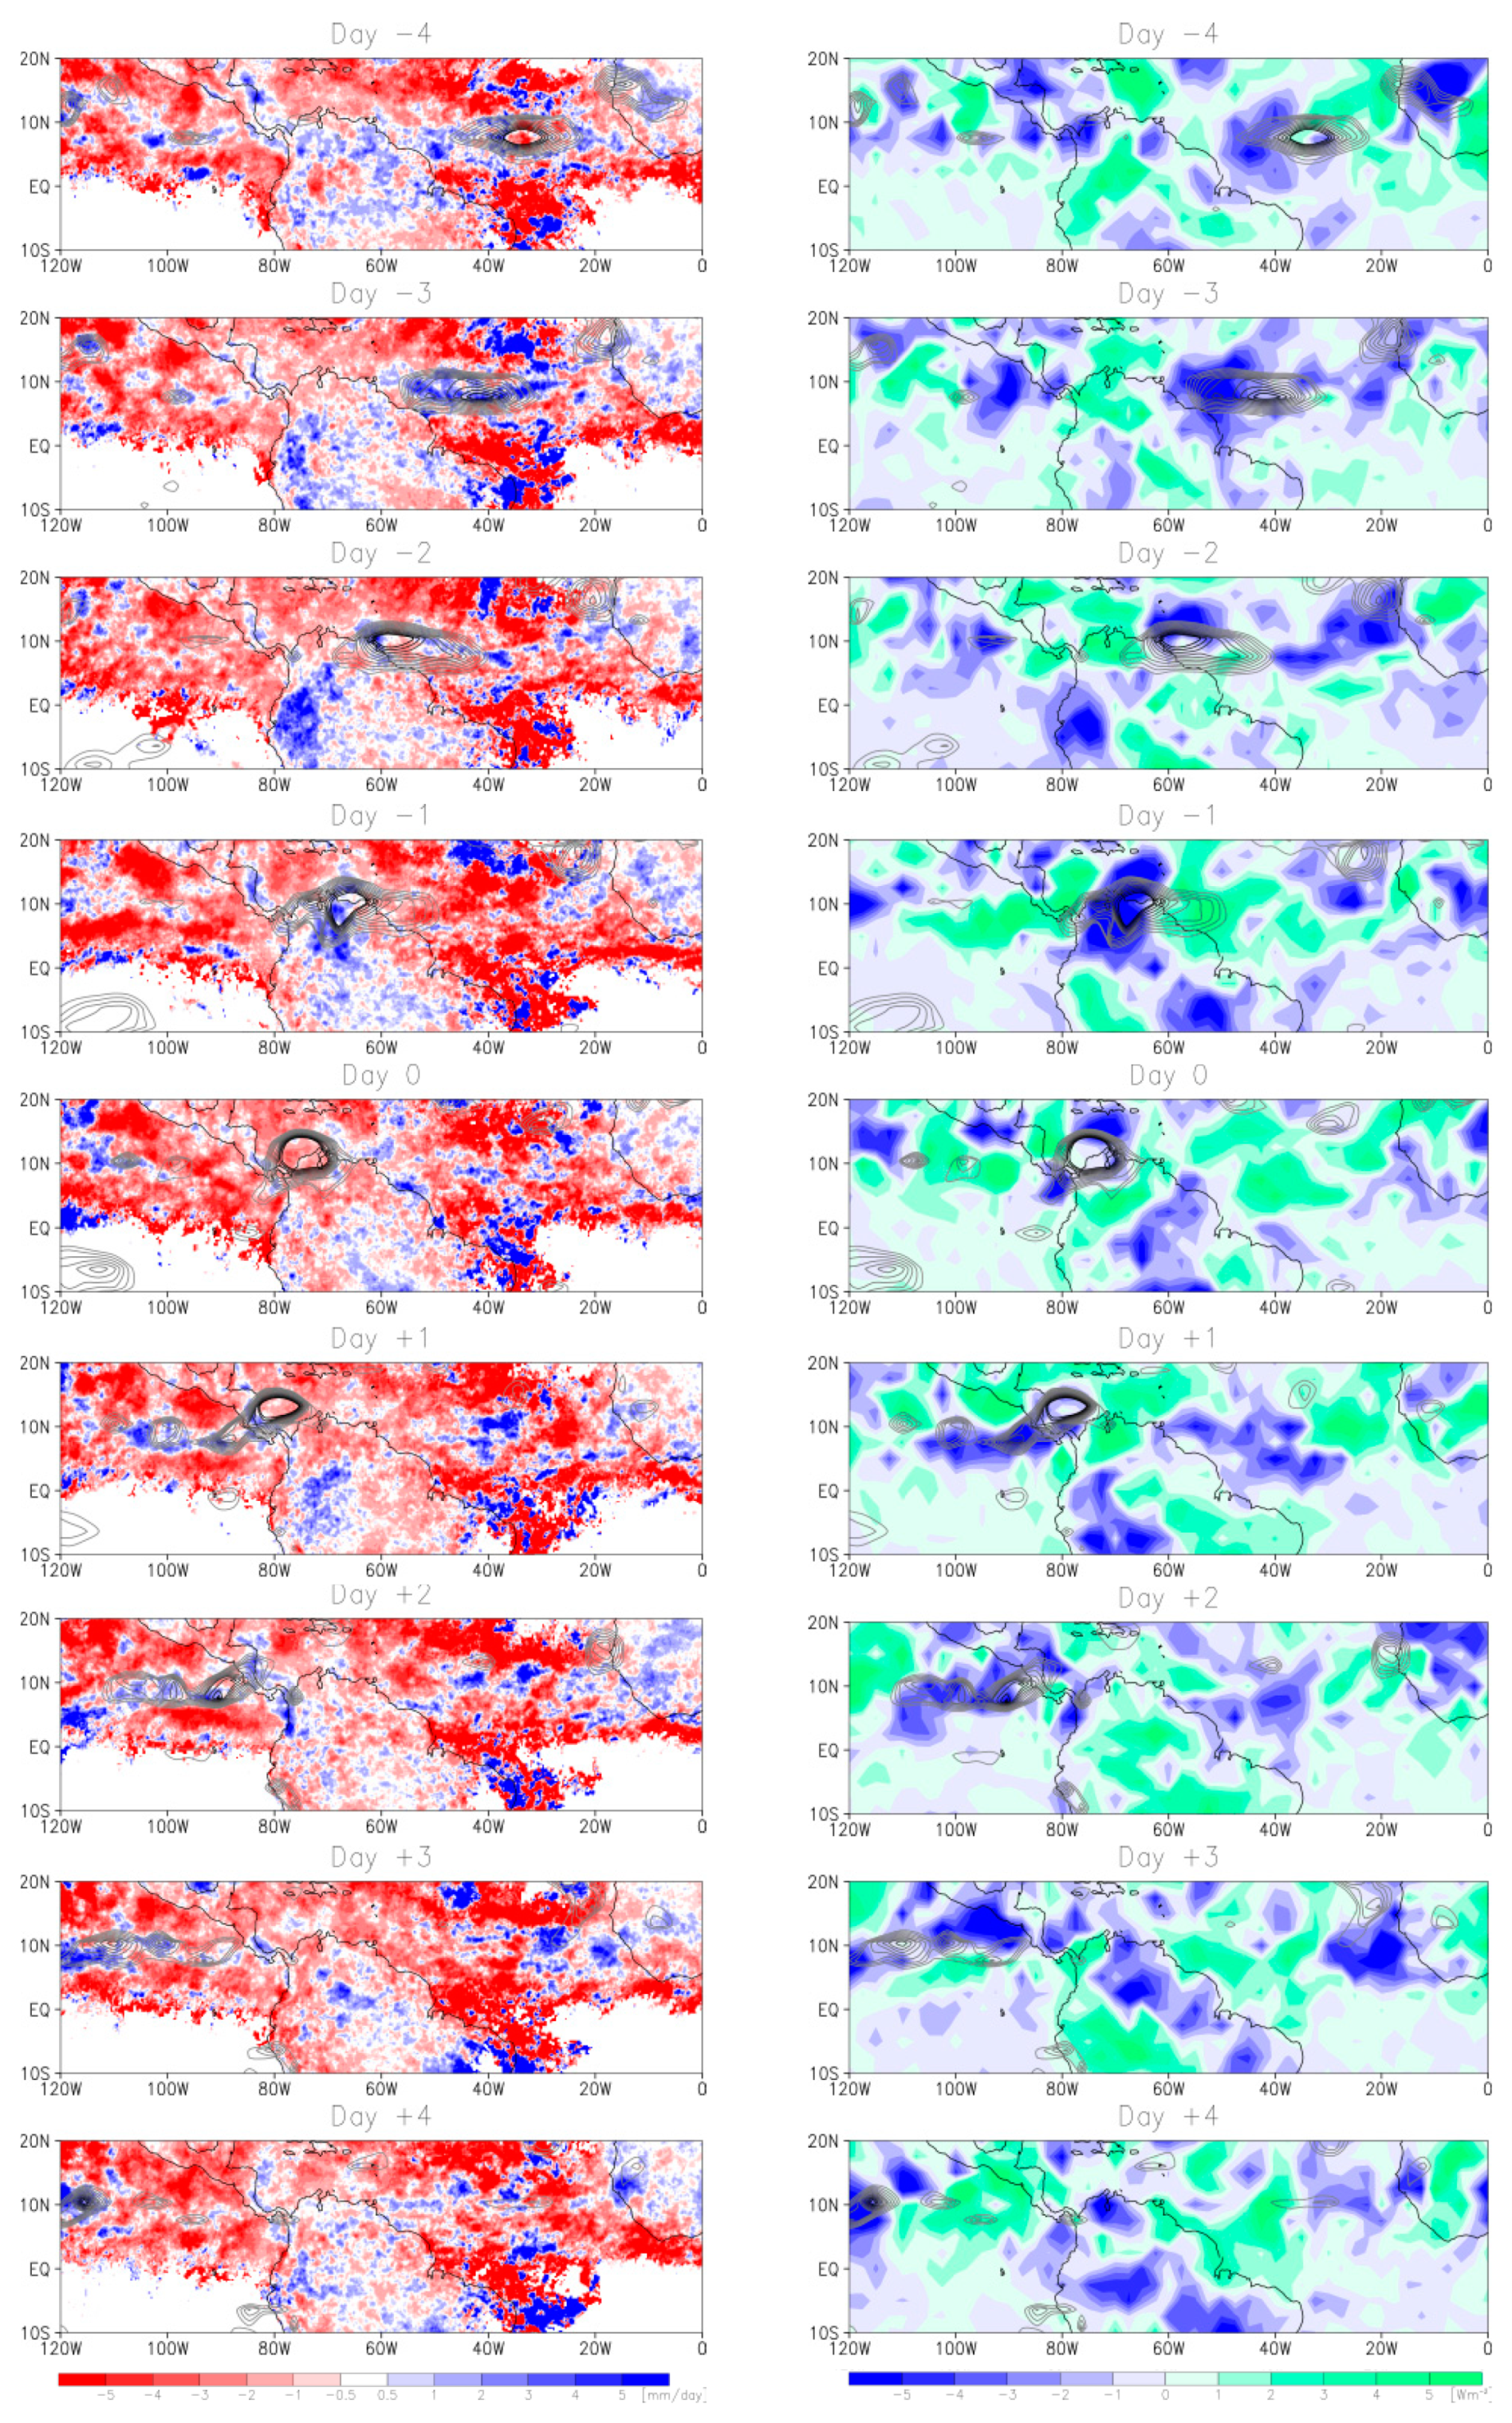
Whereas only 14% of the AEWs tracked during the 1983–2013 period were classified as dry waves, according to their link with precipitation anomalies over northern South America, it is still important to analyze their connection to local meteorological conditions. The latter is supported taking into account that previous studies highlighting the occurrence of precipitation as the main effect of AEWs displacement over northern South America, particularly Colombia. Figure 3 (left) indicates that negative precipitation anomalies related to the dry AEWs propagation are evident on Day 0; nevertheless, the pattern is not clear on the lagged composites during the period between 4 days before and 4 days after the passage of the AEWs, exhibiting a noisy structure.
Although the OLR anomalies composite pattern shown in Figure 3 (right) shows a less noisy pattern, the relationship between the propagation of dry AEWs and OLR anomalies is still not as clear as that for convective waves. In particular, a cloud propagation structure (negative OLR anomalies) can be seen over the Atlantic Ocean; however, this propagation is not unmistakable following the AEWs track, and more important, is not preserved once the dry AEWs approach South American landmass, in contrast to what is observed for convective waves (Figure 2).
3.3. AEWs and Dust Transport
Although the relationship between dry AEWs and wind fields in northern South America and the Atlantic Ocean is not clear, the inhibition of precipitation during the westward propagation of such dry perturbations might be interconnected to the role of these waves on mineral dust transport over the Atlantic Ocean. The link between aerosols and precipitation is complex, depending among others on the size of the cloud condensation nuclei (i.e., size of aerosols) and cloud microphysics; nevertheless, Saharan mineral dust has been identified to inhibit precipitation while being transported [25,26].
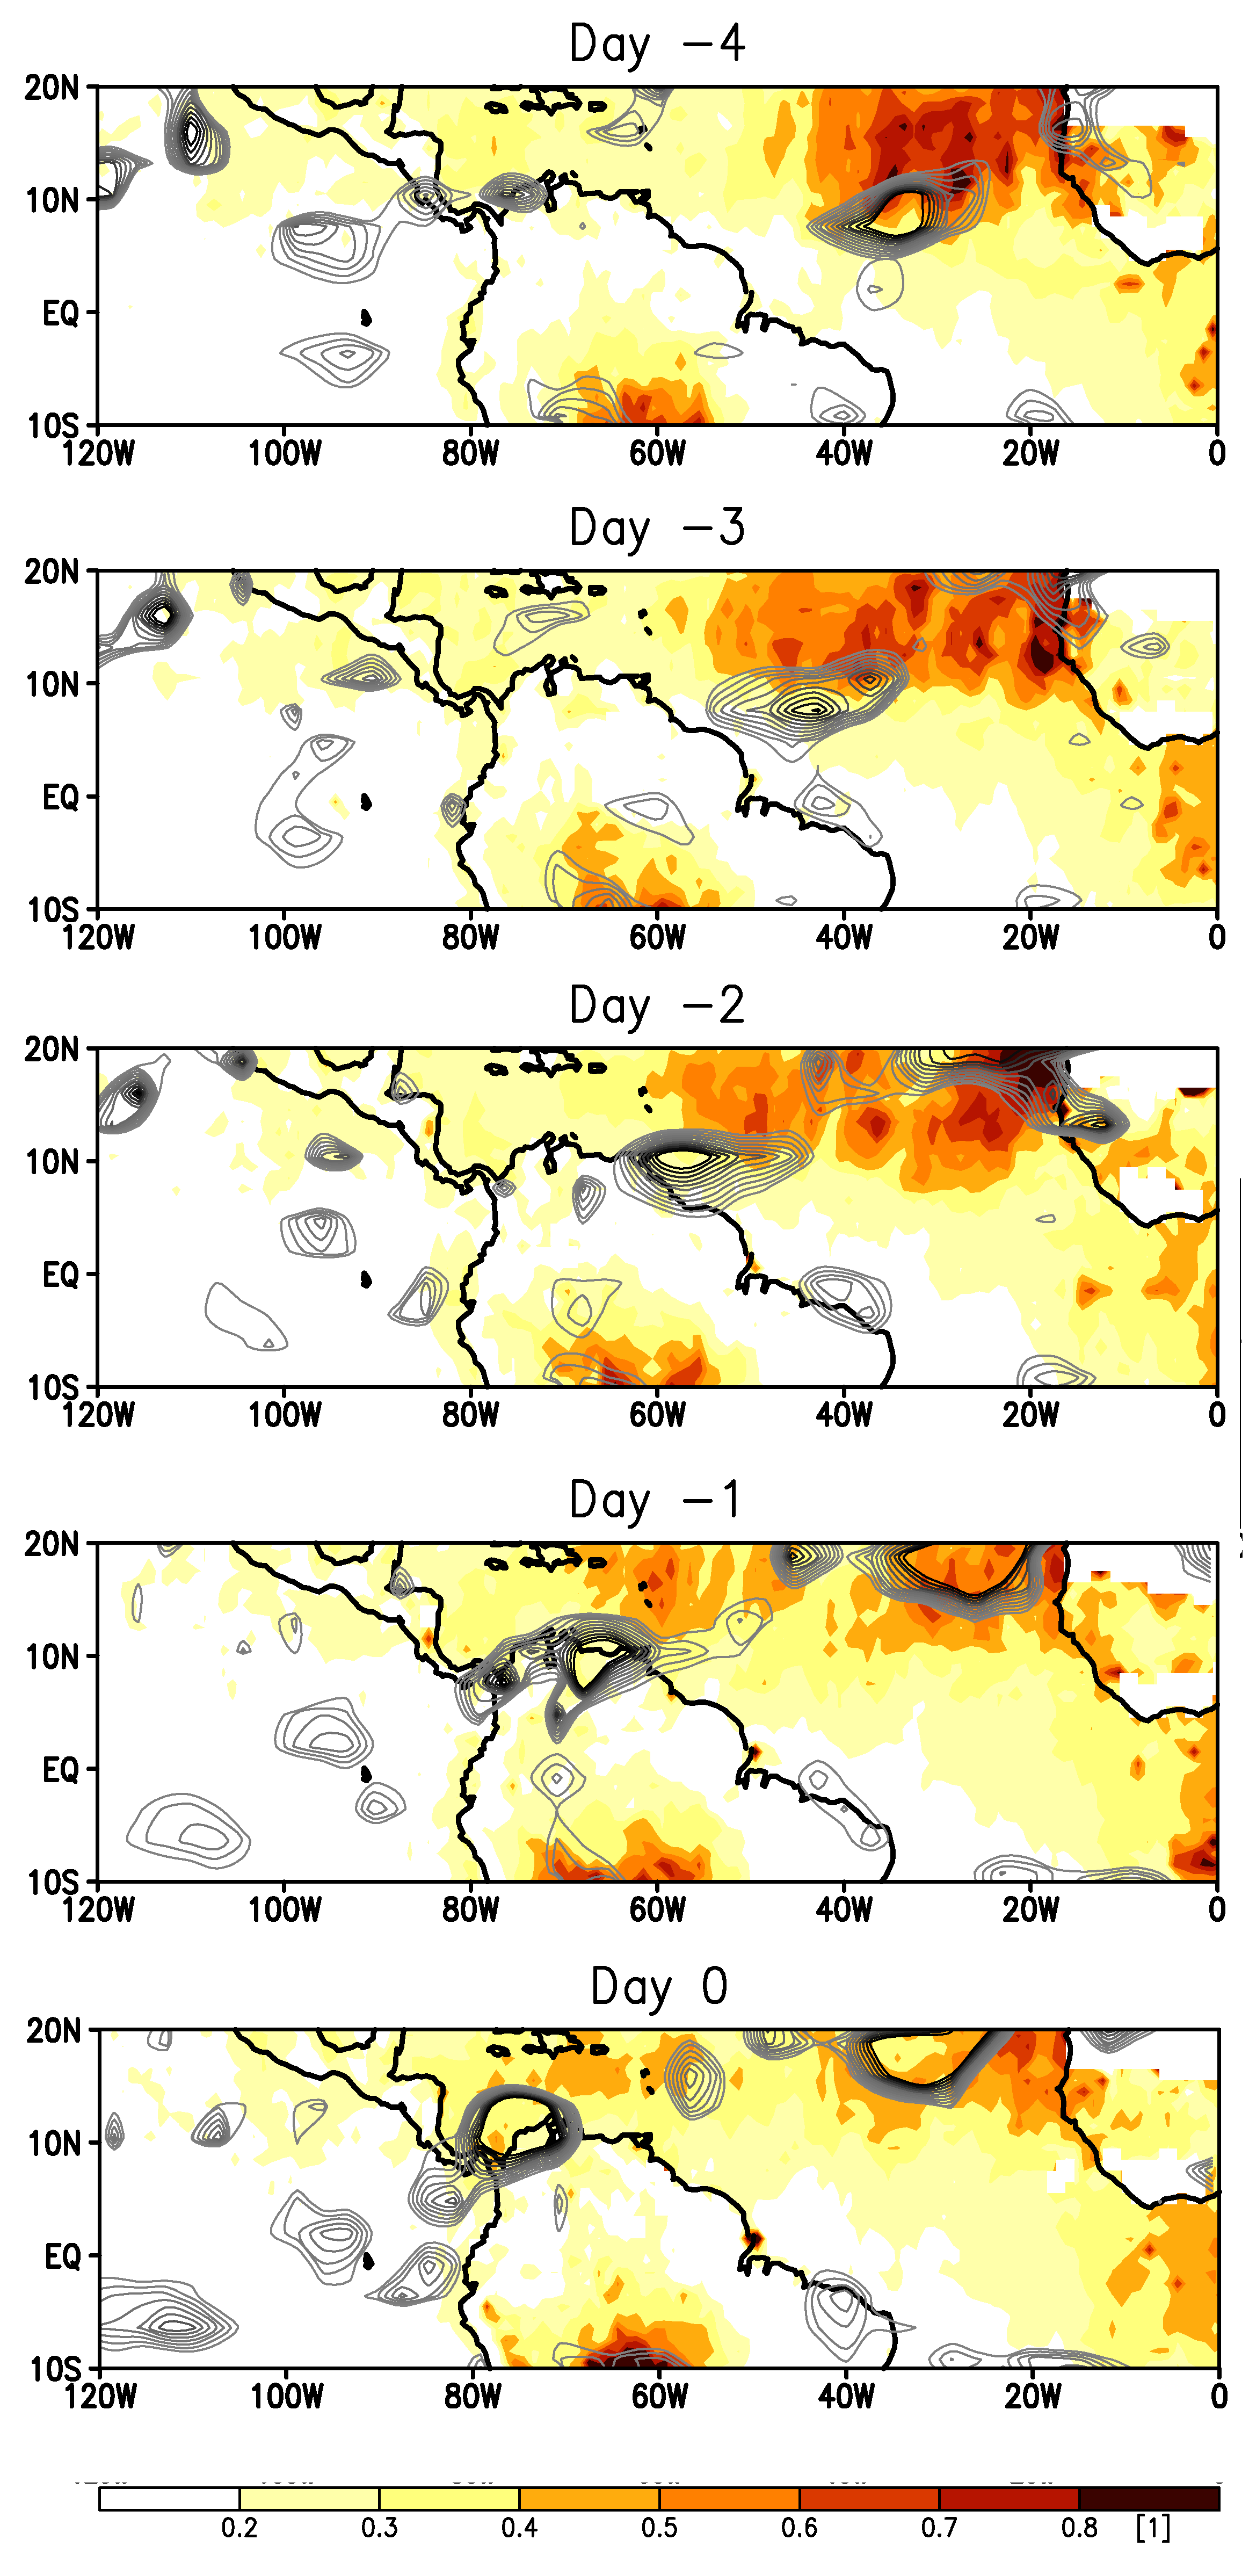
AEW’s role on mineral dust transport is a well-known feature of these tropical perturbations [10,12]. In fact, all of the 21 dry AEWs identified during the 2000–2013 period (21 perturbations in total) are related with dust transport. We consider this shorter period due to AOD data availability. Figure 4 suggests that dust is deposited throughout its transport across the Atlantic Ocean. Thus, aerosol concentration decreases as the dry wave propagates toward the west, being the dust plume more extensive across the Atlantic Ocean and the northeastern coast of South America, where AOD starts to decrease. The latter is in agreement with previous studies stating that large mineral dust particles are removed during atmospheric transport over the Atlantic Ocean, concluding into a redistribution of dust size [27].
4. Conclusions
Most of the AEWs passing over northern South America that are identified in this study (about 86%) appear to enhance convective activity, favoring the occurrence of precipitation over the region. The effect of these perturbations on precipitation over northern South America is evident, approximately around 4 days before an AEW reaches northern South American territory.
Convective AEWs enhance precipitation while the wave trough is above northern South America. However, few days before and after the passage of the AEWs over this region, they inhibit precipitation.
While the convective AEWs enhance convective activity, favoring precipitation over northern South America, the dry AEWs are more related to the transport of mineral dust from northern Africa towards the Atlantic Ocean and the Caribbean Sea. Therefore, dry AEWs, which account for only the 14.3% of the total AEWs crossing over northern South America identified in this study, influence local conditions not only by inhibiting precipitation over northern South America but also by transporting aerosols as they cross over the region.
Although the occurrence of precipitation as a result of the convective activity induced by the convective AEWs is well explained when analyzing composites of precipitation and OLR anomalies, the inhibition of precipitation related to dry AEWs follows a random and noisy pattern on these composites. Therefore, as all of the dry AEWs identified during the 2000–2013 period are related to mineral dust transport across the Atlantic Ocean, the inhibition of precipitation over northern South America during the passage of these dry waves might be related to the aerosols effects on precipitation. However, further analyses are necessary in order to explain such behavior.
Acknowledgments
This research has been supported by “Departamento Administrativo de Ciencia, Tecnología e Innovación de Colombia” (Colciencias) Program #5509-543-31966.
Conflicts of Interest
The founding sponsors had no role in the design of the study; in the collection, analyses, or interpretation of data; in the writing of the manuscript, and in the decision to publish the results.
Abbreviations
The following abbreviations are used in this manuscript:
| AEWs | African Easterly Waves |
| OLR | Outgoing Longwave Radiation |
| NOAA | National Oceanic and Atmopsheric Administration |
| PERSIANNCDR | Precipitation Estimation from Remotely Sensed Information Using Artificial Neural Networks—Climate Data Record |
| JJAS | June, July, August, September season |
| MODIS | Moderate Resolution Imaging Spectroradiometer |
| AOD | Aerosol Optical Depth |
References
- Poveda, G.; Waylen, P.; Pulwarty, R. Annual and inter-annual variability of the present climate in northern South America and southern Mesoamerica. Palaeogeogr. Palaeoclimatol. Palaeoecol. 2006, 234, 3–27. [Google Scholar] [CrossRef]
- Poveda, G.; Mesa, O.; Agudelo, P.; Álvarez, J.; Arias, P.; Moreno, H.; Salazar, L.; Toro, V.; Vieira, S. Influencia de ENSO, oscilación Madden-Julian, ondas del Este, huracanes y fases de la Luna en el ciclo diurno de la precipitación en los Andes Tropicales de Colombia. Meteorol. Colomb. 2002, 5, 3–12. [Google Scholar]
- Burpee, R. Characteristics of North African Easterly Waves during the Summers of 1968 and 1969. J. Atmos. Sci. 1974, 31, 1556–1570. [Google Scholar] [CrossRef]
- Reed, R.; Klinker, E.; Hollingsworth, A. The structure and characteristics of African easterly wave disturbances as determined from the ECMWF operational analysis/forecast system. Meteorol. Atmos. Phys. 1988, 38, 22–33. [Google Scholar] [CrossRef]
- Pytharoulis, I.; Thorncroft, C. The Low-Level Structure of African Easterly Waves in 1995. Mon. Weather Rev. 1999, 127, 2266–2280. [Google Scholar] [CrossRef]
- Leon, G.; Zea, J.; Eslava, J. Ondas del este en Colombia y algunos aspectos relevantes de los ciclones tropicales. Meteorol. Colomb. 2001, 3, 127–141. [Google Scholar]
- Salas, H.; Carmona, M.; Poveda, G. Variabilidad interdiaria de la precipitación en Medellín (Colombia) asociada con las ondas tropicales del este y su comportamiento durante las fases del ENSO. Proceedings of XXV Congreso Latinoamericano de Hidraulica, San José, Costa Rica, 9–12 September 2012. [Google Scholar]
- Burpee, R. Some Features of Global-Scale 4–5 Day Waves. J. Atmos. Sci. 1976, 33, 2292–2299. [Google Scholar] [CrossRef]
- Jones, C.; Mahowald, N.; Luo, C. The Role of Easterly Waves on African Desert Dust Transport. J. Clim. 2003, 16, 3617–3628. [Google Scholar] [CrossRef]
- Knippertz, P.; Todd, M. The central west Saharan dust hot spot and its relation to African easterly waves and extratropical disturbances. J. Geophys. Res. 2010, 115. [Google Scholar] [CrossRef]
- Ramanathan, V.; Crutzen, P.; Lelieveld, J.; Mitra, A.; Althausen, D.; Anderson, J.; Andreae, M.; Cantrell, W.; Cass, G.; Chung, C.; et al. Indian Ocean Experiment: An integrated analysis of the climate forcing and effects of the great Indo-Asian haze. J. Geophys. Res. Atmos. 2001, 106, 28371–28398. [Google Scholar] [CrossRef]
- Zuluaga, M.; Webster, P.; Hoyos, C. Variability of aerosols in the tropical Atlantic Ocean relative to African Easterly Waves and their relationship with atmospheric and oceanic environments. J. Geophys. Res. Atmos. 2012, 117. [Google Scholar] [CrossRef]
- Prospero, J.; Collard, F.; Molinié, J.; Jeannot, A. Characterizing the annual cycle of African dust transport to the Caribbean Basin and South America and its impact on the environment and air quality. Glob. Biogeochem. Cycles 2014, 28, 757–773. [Google Scholar] [CrossRef]
- Yu, H.; Chin, M.; Yuan, T.; Bian, H.; Remer, L.; Prospero, J.; Omar, A.; Winker, D.; Yang, Y.; Zhang, Y.; et al. The fertilizing role of African dust in the Amazon rainforest: A first multiyear assessment based on data from Cloud-Aerosol Lidar and Infrared Pathfinder Satellite Observations. Geophys. Res. Lett. 2015, 42, 1984–1991. [Google Scholar] [CrossRef]
- Burpee, R. The Origin and Structure of Easterly Waves in the Lower Troposphere of North Africa. J. Atmos. Sci. 1972, 29, 77–90. [Google Scholar] [CrossRef]
- Westphal, D.; Toon, O.; Carlson, T. A two-dimensional numerical investigation of the dynamics and microphysics of Saharan dust storms. J. Geophys. Res. 1987, 92, 3027. [Google Scholar] [CrossRef]
- Uppala, S.; KÅllberg, P.; Simmons, A.; Andrae, U.; Bechtold, V.; Fiorino, M.; Gibson, J.; Haseler, J.; Hernandez, A.; Kelly, G.; et al. The ERA-40 re-analysis. Q. J. R. Meteorol. Soc. 2005, 131, 2961–3012. [Google Scholar] [CrossRef]
- Hodges, K. Feature Tracking on the Unit Sphere. Mon. Weather Rev. 1995, 123, 3458–3465. [Google Scholar] [CrossRef]
- Serra, Y.; Kiladis, G.; Hodges, K. Tracking and Mean Structure of Easterly Waves over the Intra-Americas Sea. J. Clim. 2010, 23, 4823–4840. [Google Scholar] [CrossRef]
- Liebmann, B. Description of a complete (interpolated) outgoing longwave radiation dataset. Bull. Am. Meteorol. Soc. 1996, 77, 1275–1277. [Google Scholar]
- Agudelo, P.; Hoyos, C.; Curry, J.; Webster, P. Probabilistic discrimination between large-scale environments of intensifying and decaying African Easterly Waves. Clim. Dyn. 2010, 36, 1379–1401. [Google Scholar] [CrossRef]
- Ashouri, H.; Hsu, K.; Sorooshian, S.; Braithwaite, D.; Knapp, K.; Cecil, L.; Nelson, B.; Prat, O. PERSIANN-CDR: Daily Precipitation Climate Data Record from Multisatellite Observations for Hydrological and Climate Studies. Bull. Am. Meteorol. Soc. 2015, 96, 69–83. [Google Scholar] [CrossRef]
- Nowottnick, E.; Colarco, P.; da Silva, A.; Hlavka, D.; McGill, M. The fate of Saharan dust across the Atlantic and implications for a Central American dust barrier. Atmos. Chem. Phys. Discuss. 2011, 11, 8337–8384. [Google Scholar] [CrossRef]
- Eslava, J. Algunas particularidades de la región del Pacífico colombiano. Atmósfera 1993, 17, 45–63. [Google Scholar]
- DeMott, P.; Sassen, K.; Poellot, M.; Baumgardner, D.; Rogers, D.; Brooks, S.; Prenni, A.; Kreidenweis, S. African dust aerosols as atmospheric ice nuclei. Geophys. Res. Lett. 2003, 30. [Google Scholar] [CrossRef]
- Prospero, J.; Lamb, P. African Droughts and Dust Transport to the Caribbean: Climate Change Implications. Science 2003, 302, 1024–1027. [Google Scholar] [CrossRef] [PubMed]
- Maring, H.; Savoie, D.; Izaguirre, M.; Custals, L.; Reid, J. Mineral dust aerosol size distribution change during atmospheric transport. J. Geophys. Res. 2003, 108. [Google Scholar] [CrossRef]
- Swap, R.; Garstang, M.; Greco, S.; Talbot, R.; Kallberg, P. Saharan dust in the Amazon Basin. Tellus B 1992, 44, 133–149. [Google Scholar] [CrossRef]
- Yu, H.; Chin, M.; Bian, H.; Yuan, T.; Prospero, J.; Omar, A.; Remer, L.; Winker, D.; Yang, Y.; Zhang, Y.; et al. Quantification of trans-Atlantic dust transport from seven-year (2007–2013) record of CALIPSO lidar measurements. Remote Sens. Environ. 2015, 159, 232–249. [Google Scholar] [CrossRef]
Figure 1.
Significant lagged cross-correlation between precipitation anomalies in northern South America and smoothed relative vorticity anomalies for the JJAS season. The box in the middle panel shows the region where precipitation anomalies were computed.
Figure 1.
Significant lagged cross-correlation between precipitation anomalies in northern South America and smoothed relative vorticity anomalies for the JJAS season. The box in the middle panel shows the region where precipitation anomalies were computed.

Figure 2.
(Left) composites of smoothed relative vorticity anomalies [s−1] (black contour) and precipitation anomalies [mm/day] (shades); (Right) composites of smoothed relative vorticity anomalies [s−1] (black contour) and filtered OLR anomalies [W·m−2] (shades). Composites are shown from 4 days before (Day −4) to 4 days after (Day +4) the passage of a convective AEW over northern South America.

Figure 3.
Same as Figure 2 but for dry AEWs.
Figure 3.
Same as Figure 2 but for dry AEWs.

Figure 4.
Composites of smoothed relative vorticity anomalies [s−1] (black contour) and MODIS AOD [1] (shaded) from 4 days before (Day −4) of the passage of a dry AEW over northern South America.
Figure 4.
Composites of smoothed relative vorticity anomalies [s−1] (black contour) and MODIS AOD [1] (shaded) from 4 days before (Day −4) of the passage of a dry AEW over northern South America.


Table 1.
Amount of AEWs crossing over the 5° N–15° N, 80° W–70° W region during the 1983–2013 period and their classification into convective and dry waves.
Table 1.
Amount of AEWs crossing over the 5° N–15° N, 80° W–70° W region during the 1983–2013 period and their classification into convective and dry waves.
| AEWs | ||
|---|---|---|
| Total | 364 | 100% |
| Convective AEWs | 312 | 85.7% |
| Dry AEWs | 52 | 14.3% |
Publisher’s Note: MDPI stays neutral with regard to jurisdictional claims in published maps and institutional affiliations. |
© 2017 by the authors. Licensee MDPI, Basel, Switzerland. This article is an open access article distributed under the terms and conditions of the Creative Commons Attribution (CC BY) license (https://creativecommons.org/licenses/by/4.0/).
Share and Cite
MDPI and ACS Style
Cárdenas, S.G.; Arias, P.A.; Vieira, S.C. The African Easterly Waves over Northern South America. Proceedings 2017, 1, 165. https://doi.org/10.3390/ecas2017-04151
AMA Style
Cárdenas SG, Arias PA, Vieira SC. The African Easterly Waves over Northern South America. Proceedings. 2017; 1(5):165. https://doi.org/10.3390/ecas2017-04151
Chicago/Turabian StyleCárdenas, Santiago Giraldo, Paola A. Arias, and Sara C. Vieira. 2017. "The African Easterly Waves over Northern South America" Proceedings 1, no. 5: 165. https://doi.org/10.3390/ecas2017-04151