

Impact of Lockdown on Column and Surface Aerosol Content over Ahmedabad and a Comparison with the Indo-Gangetic Plain


1
Department of Physics, Gujarat University, Ahmedabad 380009, India
2
Department of Physics, Hemvati Nandan Bahuguna Garhwal University, Srinagar 246174, India
3
Department of Civil Engineering, Karunya Institute of Technology and Sciences, Coimbatore 641114, India
4
Water Institute, A Centre of Excellence, Karunya Institute of Technology and Sciences, Coimbatore 641114, India
*
Author to whom correspondence should be addressed.
Earth 2023, 4(2), 278-295; https://doi.org/10.3390/earth4020015
Submission received: 9 February 2023
/
Revised: 28 March 2023
/
Accepted: 8 April 2023
/
Published: 12 April 2023
Abstract
:Changes in vertical column concentration, size distribution, and surface concentration of aerosol associated with the lockdown imposed by the COVID-19 pandemic in 2020 over the Ahmedabad region in Gujarat State, India, were analyzed. The results are compared with changes over selected Indo-Gangetic Plain (IGP) regions. On 25 March 2020, the prime minister of India declared a complete lockdown throughout the country and later lifted restrictions in a phased manner. Aerosol optical depth (AOD) over the Ahmedabad region on 29 March dropped to as low as 0.11, and in the first two weeks of lockdown, the weekly average AOD was only 0.18. On almost all days of the lockdown period, AOD over the Ahmedabad region was lower than the decadal mean. It was found that the Ahmedabad region responded differently to lockdown conditions compared to the IGP regions. During the first lockdown phase, AOD decreased by about 29% compared to the pre-lockdown period over the Ahmedabad region. However, the average reduction over the IGP was much more, about 50%. The average Angstrom exponent (AE) of 0.96 during the pre-lockdown period over the Ahmedabad region increased phase-wise to 1.36 during the L3 lockdown phase, indicating dominance of fine-mode particles during the lockdown period. It suggests a reduction in anthropogenically produced coarse-mode particles, typically dust produced by vehicular movement, construction, and industrial activities. However, on the other hand, over the IGP region, the high dominance of fine-mode particles during the pre-lockdown period had changed to a high dominance of coarse-mode particles, especially over the Delhi region. This indicates a reduction in anthropogenically produced fine-mode particles, which are mainly generated by fossil and biofuels/biomass combustion, over the IGP region by lockdown conditions. Within a few days of lockdown, PM2.5 was reduced by 64% and 76% over the Ahmedabad and Delhi regions, respectively. The lockdown imposed by the pandemic provided an excellent opportunity to ascertain background aerosol conditions in the atmosphere.
1. Introduction
Atmospheric aerosols vary in size ranging from 0.001 to about 100 µm, with a broader classification of fine- and coarse-mode aerosols. The size of aerosols depends on their production mechanism [1]. Anthropogenic activities such as incomplete combustion of biofuels, biomass, and fossil fuels are the significant source of fine-mode aerosols, and naturally produced aerosols by a mechanical process, such as wind lifting of dust, wave-breaking, etc., are significant sources of coarse-mode particles [2,3,4]. Atmospheric aerosols exhibit high temporal and spatial variability, and their distribution is controlled mainly by sources and sinks, and existing meteorological conditions often influence it [5,6,7]. Apart from reducing visibility and health effects, aerosols play an important role in controlling the radiation budget of the Earth–atmosphere system.
Aerosol optical depth (AOD) estimates aerosol content in a vertical column of air. The atmosphere with AOD less than 0.1 is considered clean and greater than or equal to 1.0 indicates a hazy condition. Angstrom exponent (AE) is an indicative measure of the size distribution of aerosols in the atmosphere; it is inversely related to average aerosol size. Higher values of AE (>1) suggest the dominance of fine-mode particles over coarse-mode particles and vice versa. Microscopic matter suspended in air is generally called particulate matter (PM). The PM10 (particles with a diameter < 10 µm) and PM2.5 (particles with a diameter < 2.5 µm) are the commonly used measures of aerosol content at the surface.
Correlation between satellite-based AOD and PM values is influenced by several factors, such as variations in local meteorological conditions, occurrence of multiple aerosol layers, variations in aerosol chemical composition, and mismatch in spatial–temporal resolutions [8,9]. Xu and Zhang [10] reported that boundary layer height and relative humidity are the two significant factors affecting the relationship between ground-level PM2.5 concentrations and AOD. Few studies report a strong positive relationship between AOD with PM2.5 and PM10 [11,12,13]. Kim et al. [14] reported that the correlation between AOD and PM2.5 varied considerably with location, which is stronger in summer and fall than in winter and spring.
The impact of anthropogenic activities such as fossil fuel and biofuel combustion, forest fires, stubble burning, etc., on aerosols has been studied by several researchers [15,16,17,18,19,20]. Enhancements of particulate matter in the atmosphere during festivals have been reported in different parts of the globe and in India [18,20]. Many researchers [21,22,23,24] have shown an increase in AOD associated with fireworks of Diwali celebrations in different parts of India. Forced lockdown to mitigate the COVID-19 crisis provided an opportunity to understand the impact of the reduction in anthropogenic activities on the environment.
The first novel SARS-CoV-2 coronavirus (COVID-19) case was found in China on 31 December 2019 [25,26,27]. Because of its fast and worldwide spread, the World Health Organization (WHO, [28]) declared it as a pandemic. The first confirmed case of coronavirus infection in India was reported in Kerala on 30 January 2020 [20] and then there was an exponential increase in active cases in the country. To contain the spread of coronavirus, the Government of India enforced a voluntary public curfew on 22 March 2020, followed by a lockdown in some cities where COVID-19 cases were detected. Prime Minister of India imposed a complete nationwide lockdown for three weeks from 25 March to 14 April 2020 (phase I). Later, it extended up to 3 May (phase II) with limited conditional relaxations in areas where very few cases were reported. Since the number of COVID cases was increasing, the lockdown was extended to 17 May (phase III), and then up to 31 May (phase IV). During the first phase of lockdown, all public places such as schools, colleges, malls, cinema halls, etc., closed; almost all industrial and construction activities stopped, all modes of transportation canceled, and business was limited to only essential commodities. During the second phase, regions were classified as red, orange, and green zones based on the severity of the infection, and partial relaxations were given based on zones. Agricultural activities and movement of cargo vehicles started from 20 April and retail shops with half-staff were functional from 25 April onward. During the third phase, more relaxations were given except in red zones. From 4 May onward, private vehicles were allowed in orange zones and buses with 50% capacity were allowed in green zones. Trains operated to ferry migrant workers, and international and national flights were allowed to evacuate stranded people. From 18 May onward, lockdown conditions were withdrawn except in containment zones.
The impact of lockdown on AOD and the size distribution of aerosols were studied using ground-based instruments such as sun photometers and LiDAR, and retrieved data from satellites such as MODIS, CALIPSO. Using satellite data, Kanniah et al. [29] observed a reduction in AOD in Malaysia during March–April 2020 as compared to the same period in 2019 and 2018. Based on LiDAR data, Chen et al. [30] reported that the average AOD of all types of aerosols at 0–4 km decreased by 55.48% in 2020 compared with 2018, while the AOD of dust aerosols decreased by 43.59% in East China. Using LiDAR data, Nicolae et al. [31] reported that the proportion of small particles of the total particles had increased in the upper troposphere but remained almost constant in the low troposphere over Romania. Using MODIS and Cloud–Aerosol LiDAR and Infrared Pathfinder Satellite (CALIPSO) data, Jin et al. [32] observed a reduction in AOD and near-surface aerosol extinction coefficient (<2 km) in most areas of China during lockdown period compared to pre-lockdown period.
The MODIS observations showed ∼40% reduction in aerosols over North India [33]. Based on different satellite data, Mehta et al. [34] reported an overall reduction in AOD over different regions of India, especially over the Indo-Gangetic Plain (IGP) during the lockdown. Using MODIS data, Ranjan et al. [35] (2020) reported a large reduction in AOD (~45%) over Indian Territory during the lockdown period (25 March to 15 May 2020) as compared to decadal AOD. They also reported ”no significant reduction” in aerosol content during lockdown over coal mine regions. In situ observations at the Aerosol Robotic Network (AERONET) station over Kanpur (India), showed a reduction of 20–30% AOD during the lockdown period compared to 2017–2019 [36]. Using a Microtop sun photometer, Shaikh et al. [37] reported a decrease in the fine-mode aerosols and the dominance of naturally derived coarse-mode aerosols during lockdown period over Goa. Resmi et al. [38] reported a 30–40% decrease in AOD over North India and ∼12% enhancement over Central India (78° E–85° E, 18° N–25° N). CALIPSO measurements showed that this increase was due to transported aerosols derived from biomass burning. Using ground-based and satellite observations, Panday and Vinoj [39] observed that aerosol loading during lockdown was reduced by up to 40% over the most populated region of India. However, the central part of India showed an unexpected increase (~+20%) in AOD. They hypothesized that this increase in AOD over central India was due to increased atmospheric moisture coupled with a stagnant circulation condition. Based on MODIS data, Ratnam et al. [40] reported a reduction in AOD over the Indo-Gangetic Plains (IGP) and a drastic increase over central India, which were reported during the phase I of lockdown, which were mainly due to the absence of anthropogenic activity and dominance of natural sources, respectively. Using ground- and satellite-based observations, Kalluri et al. [41] observed an increase in AOD during phase II of lockdown due to long-range transport of mineral dust and smoke from the west Asian region and central India..
Significant reduction in air pollution and substantial enhancement in air quality during lockdown was reported for China by several studies [10,42]. A similar reduction in air pollution was reported in various parts of the world, such as Spain [43], Italy [44], Brazil [45,46], Kazakhstan [47], Malaysia [48], Morocco [49], and Pakistan [50].
Remarkable improvements in air quality were reported over many parts of India during the lockdown period [51,52]. Longer visibility and clearer blue skies were obvious testimonies of improvements in air quality. People in Punjab State of India reported seeing the Himalayas, about 200 km away, for the first time. Several studies were carried out to understand changes in air quality during the lockdown period over India with help of ground-based measurements [53,54] or using satellite data [54,55], or with both ground-based measurements and satellite data [40,53]. Rajesh and Ramachandran [55] found that during the lockdown, BC mass concentration over Ahmedabad decreased by 35%, and surface and atmosphere forcing were reduced by 20% and 25%, respectively, compared to 2017–2019. Resmi et al. [38] observed a significant decline in the concentration of PM10 and PM2.5 by 61% and 53%, respectively, during the lockdown period over Kannur town in Kerala State (India), which was one of the initial hotspots of COVID-19. Researchers observed significant reductions in pollutant concentration over different cities of the country [56,57,58].
In this context, an attempt has been made to investigate the impact of the imposed lockdown during 2020 on vertical and surface aerosol characteristics over the Ahmedabad region and compare that with changes that occurred over the IGP. The major objectives of the present study are (i) to obtain the effect of lockdown on AOD over the Ahmedabad region in comparison with that for the previous five years, individually and also with the decadal mean (2010–2019); (ii) to compare the impact of lockdown on AOD, AE, PM2.5, and PM10 over the Ahmedabad region with that over the IGP; and (iii) to understand the effect of lockdown on the size distribution of aerosols at Ahmedabad and over the IGP.
2. Study Area and Data Utilized
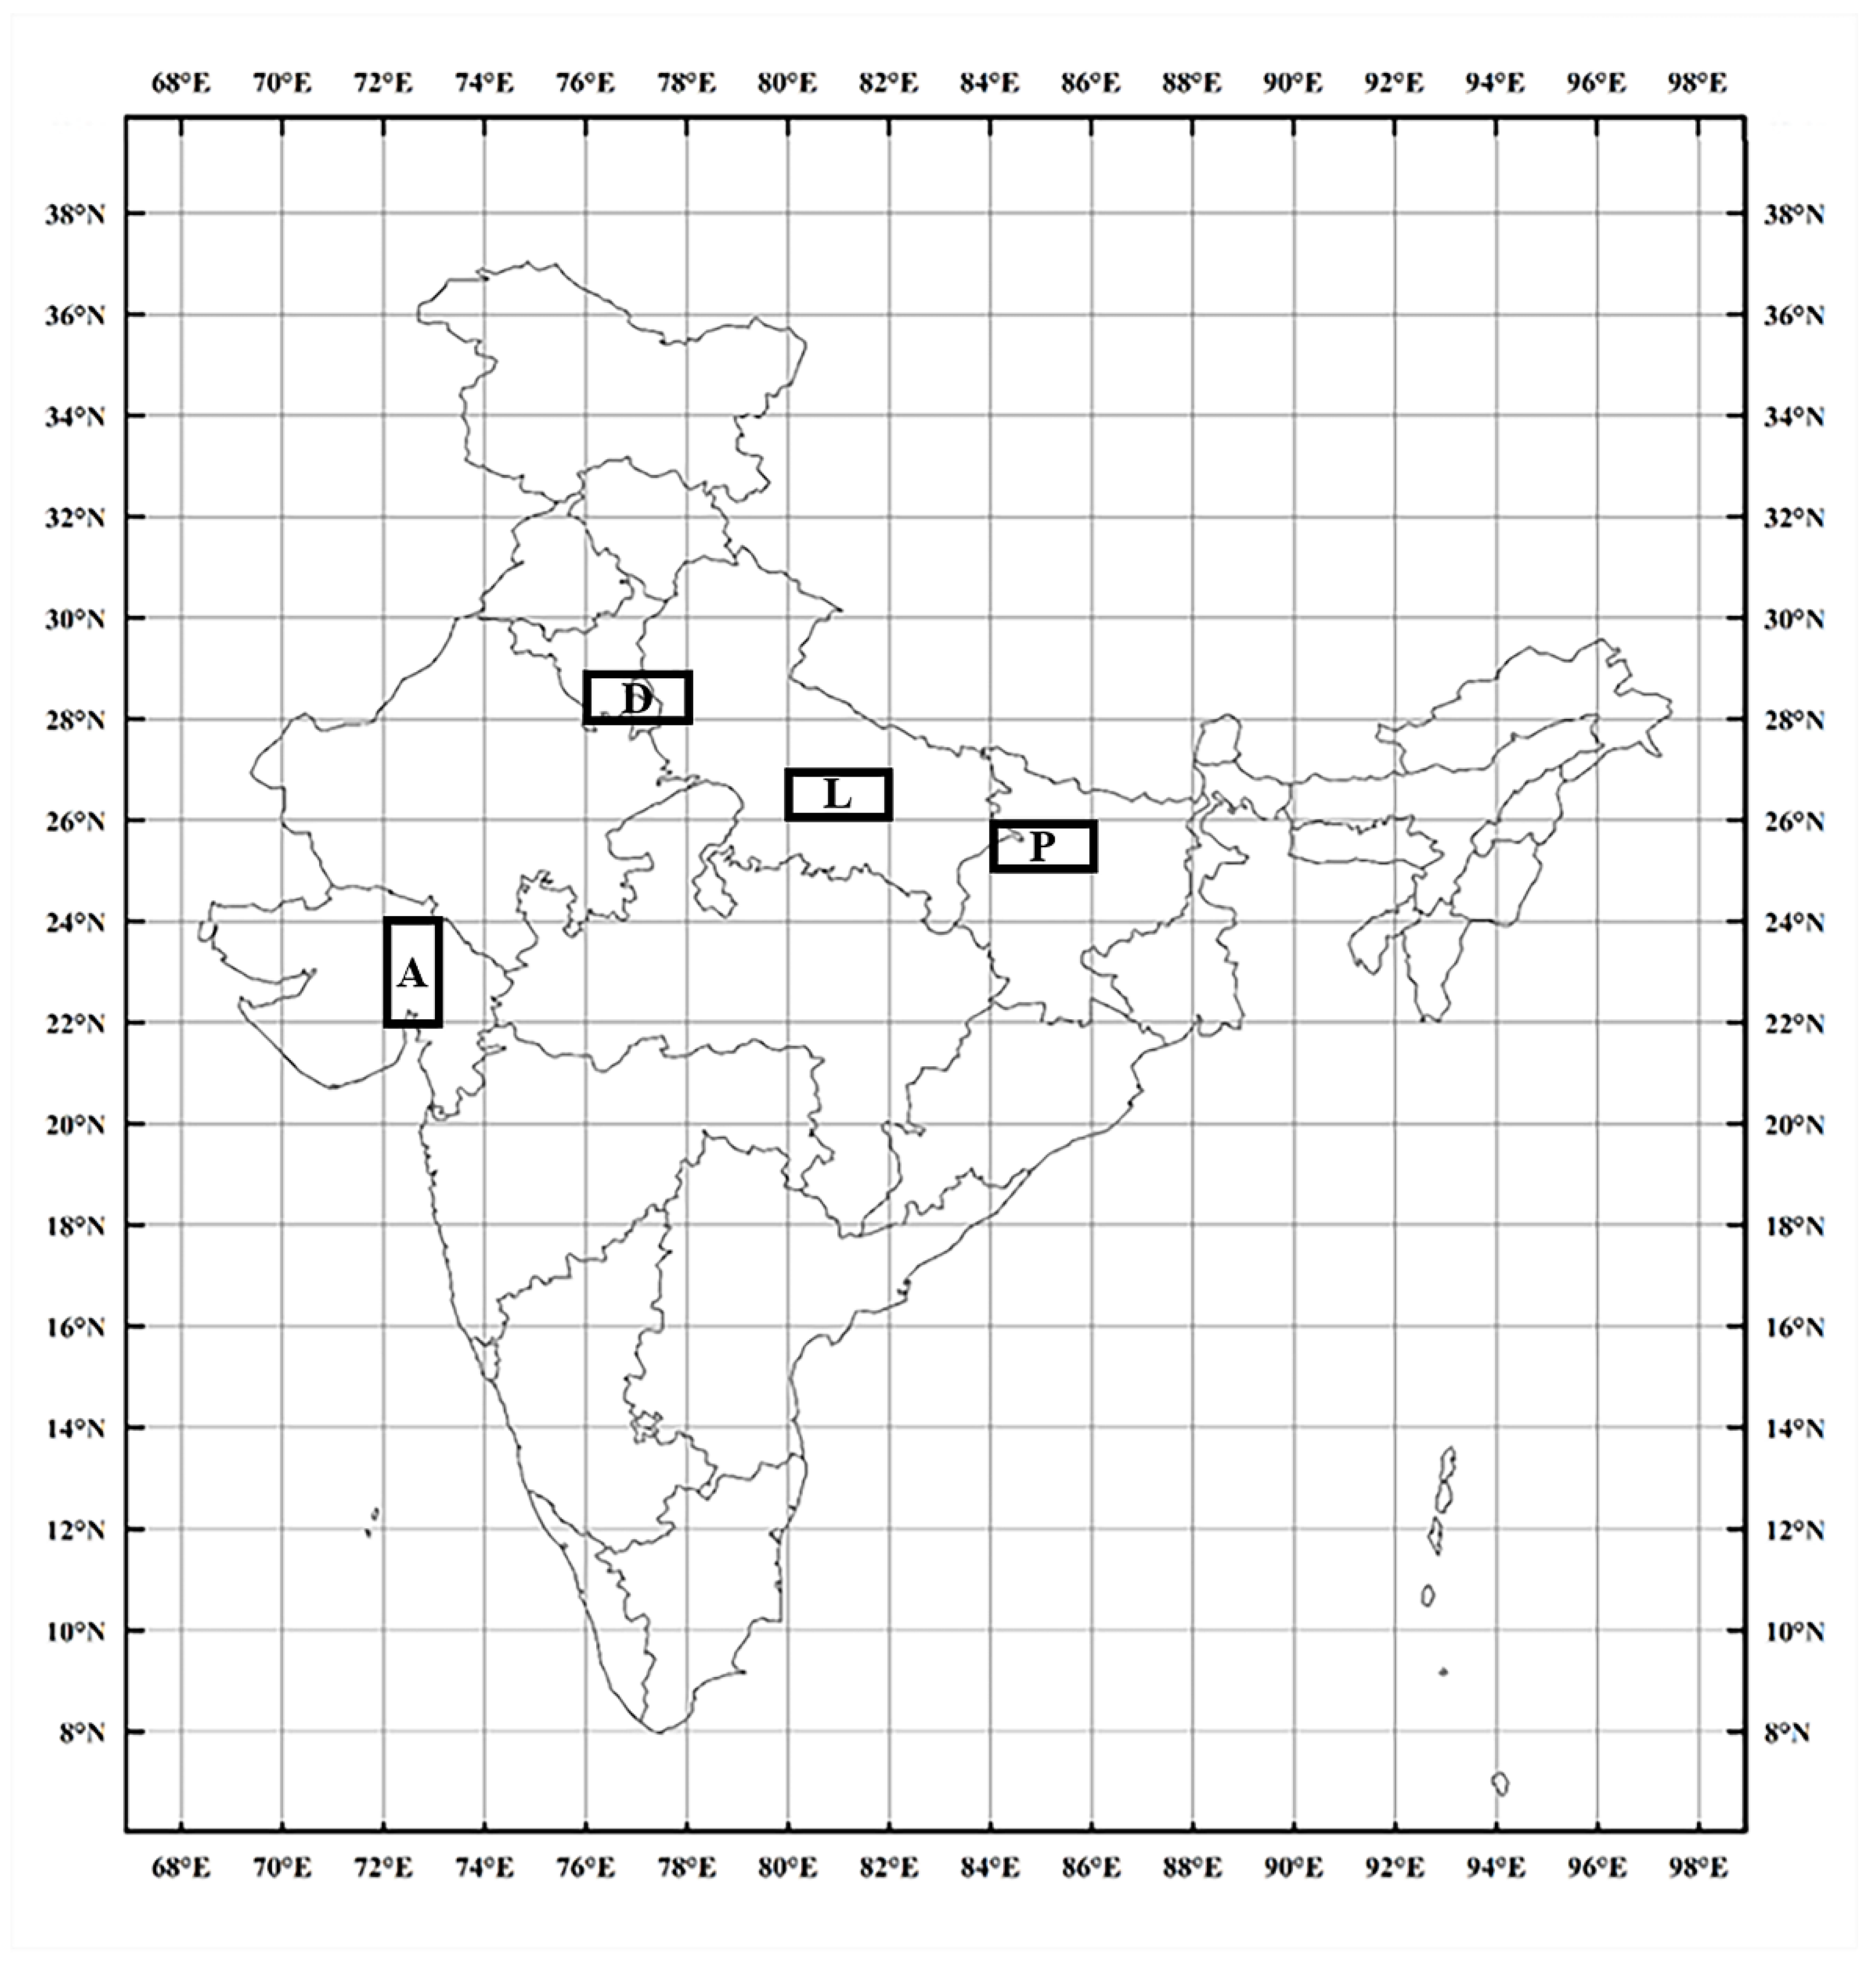
Ahmedabad (AHM) is a densely populated, rapidly developing urban city in Gujarat State (India). It is the largest city in the state, with heavy traffic and many industries and thermal power plants in its suburban areas. Gujarat State is bounded by the desert of Rajasthan in the north and the Arabian Sea on the west and southwest. The IGP, which covers most parts of northern India, is landlocked and bounded by the Himalayas in the north and the Thar Desert in the west. Jethva et al. [58] reported that the IGP has the highest aerosol loading in the Indian subcontinent. For comparison of the impact on aerosol characteristics over the Ahmedabad region with that over the IGP, three regions, around Delhi (DLH), Lucknow (LKN), and Patna (PTN), were selected. These regions are nearly equally separated over the IGP and have at least two observatories recording PM values. Locations of study regions are shown on the map of India (Figure 1), and the latitude and longitude of these regions are given in Table 1.
Aerosol content over the Ahmedabad region is highly influenced by the influx of dust from Arabian countries during the pre-monsoon period; moisture and marine aerosols from the Arabian Sea during the monsoon period; and to a certain extent by aerosols produced by stubble burning over Punjab, Haryana, and neighboring states during post-monsoon and winter periods. Anthropogenic emission of aerosols from power plants, vehicles, and biomass combustion occurs throughout the year over the IGP. In addition, natural mineral dust is transported yearly during the pre-monsoon period from western arid regions [59]. The towering Himalayas block the passage of this dust, accumulating dust over the Himalayas’ foothills. The IGP becomes more polluted, especially during winter, owing to increased biomass-burning emissions, local sources, festivals, and favorable prevailing meteorological conditions [60,61]. Over the IGP, aerosol content is generally augmented by forest fires and stubble burning. Kaskaoutis et al. [62] reported that anthropogenic emissions increased over the IGP, mainly due to biomass and fossil fuel combustion.
Two aerosol parameters, AOD and AE, relevant to vertical column loading, and two parameters concerning surface aerosol content, PM2.5 and PM10, for 1 March 2020 to 31 May 2020, were utilized for the present analysis. Area-averaged AOD (550 nm, dark target) and AE (0.412–0.47 µm) derived from the Moderate Resolution Imaging Spectroradiometer (MODIS) instrument onboard Terra and Aqua were downloaded from the NASA website [https://giovanni.gsfc.nasa.gov/Giovanni (accessed on 15 June 2020)] for all five regions specified above. The MODIS sensor measures radiances at 36 bands, ranging from visible to infrared and varying spatial resolutions. MODIS Level 3 AOD data (collection 6.1) are globally gridded with 1 deg × 1 deg spatial resolution and are checked for quality [63]. The average of Aqua (MYD08_M3_v6) and Terra (MOD08_M3_v6) values of AOD and AE for each day were used for the present analysis. Since the first two days of lockdown (25 and 26 March 2020), the sky over Ahmedabad was partly cloudy. Data from these two days were avoided for analysis. The decadal mean (2010–2019) of daily AOD for the Ahmedabad region was computed for 1 March–31 May. The 24 h average PM2.5 and PM10 values were downloaded from the website of the Central Pollution Control Board [https://app.cpcbccr.com/ccr/#/caaqm-dashboard-all/caaqm-landing/data) (accessed on 10 June 2020)] for the period 1 March 2020 to 31 May 2020. These daily average PM values are generated from continuous ambient air quality monitoring stations (CAAQMS) maintained by the respective state pollution control boards. Measurement errors in data obtained from the CPCB monitoring stations are reported to be less than 5% [64]. The average of available PM measurements over each region was considered for analysis. Air mass back-trajectories were obtained with the help of HYSPLIT software using GDAS meteorological data. The study period 1 March to 31 May 2020 was divided into five spans: pre-lockdown period (PL) from 1 March to 24 March (24 days); lockdown-1 (L1) from 25 March to 14 April (21 days); lockdown-2 (L2) from 15 April to 3 May (19 days); lockdown-3 (L3) from 4 May to 31 May (28 days); and full lockdown period (FL) from 25 March to 31 May.
3. Results and Discussion
3.1. Variation in AOD over Ahmedabad
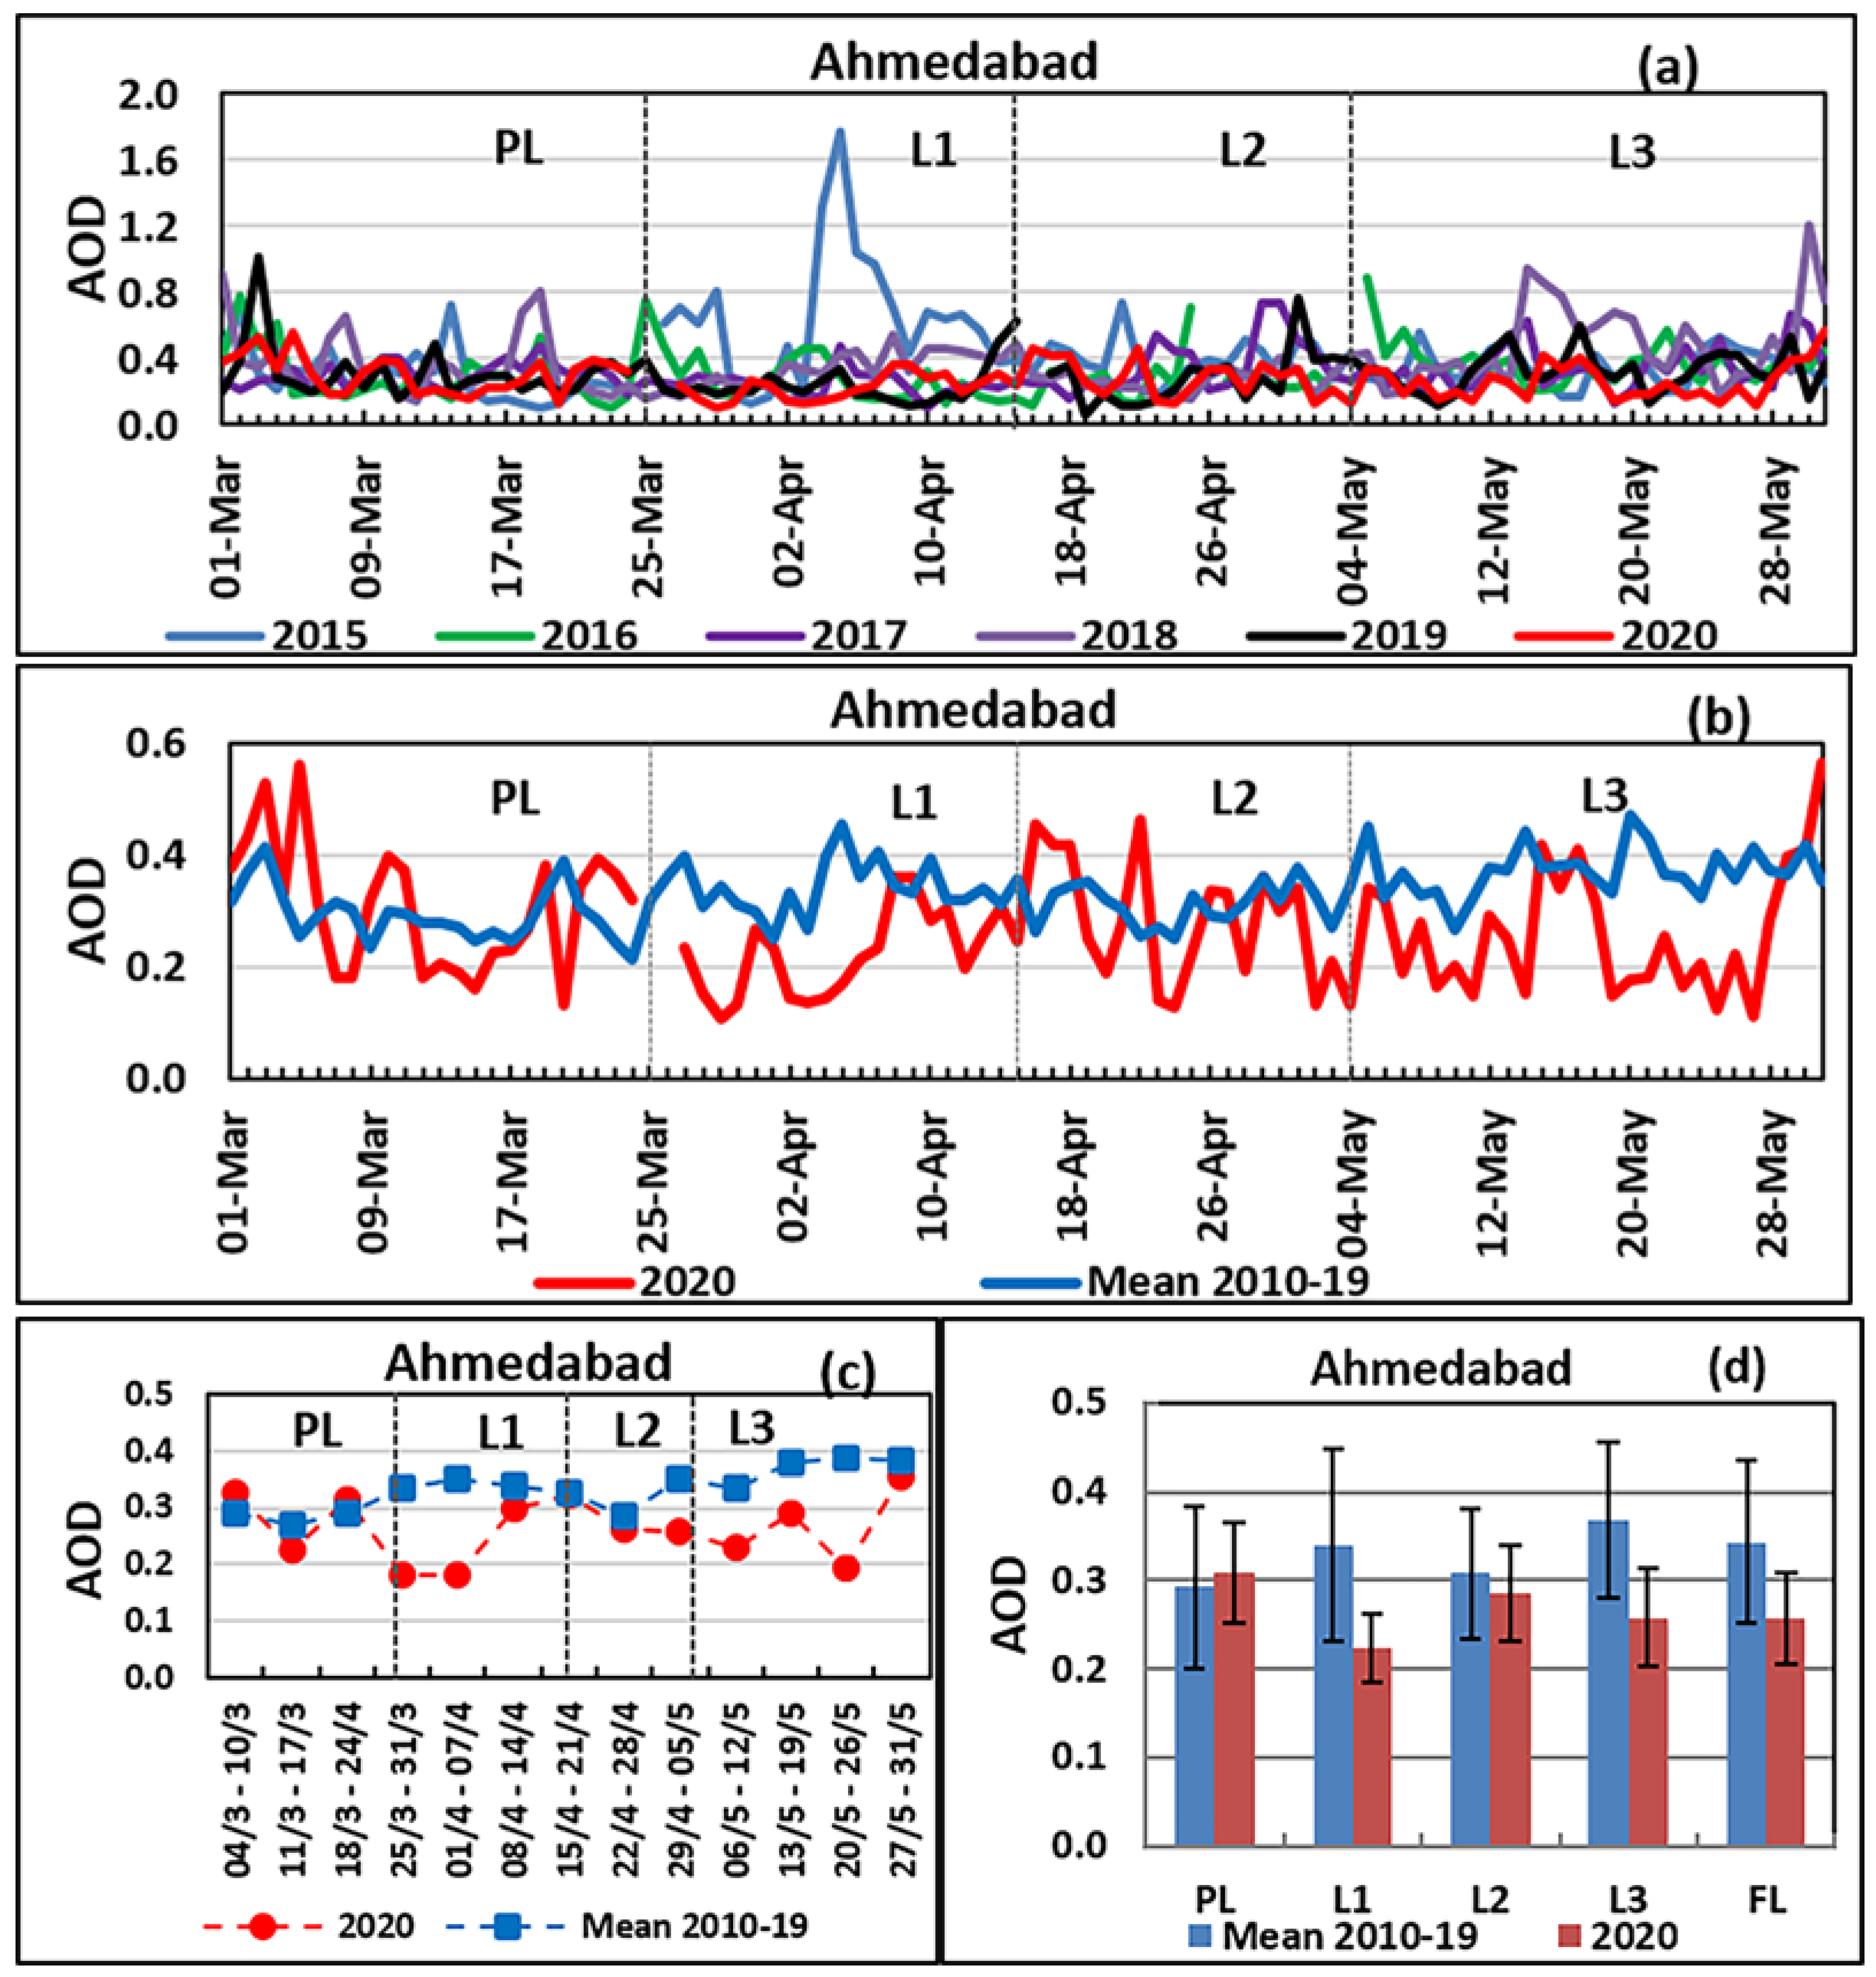
The time series of daily area averaged AOD over the Ahmedabad region from 1 March to 31 May 2020 and the previous five years (2015–2019) are shown in Figure 2a. Over the Ahmedabad region, AOD on the day before lockdown (24 March) was 0.32. It decreased to 0.11 on 29 March, a reduction of about 66%. Daily AOD over the Ahmedabad region was lowest during the study period on 29 March. AOD during many days of the lockdown period was lowest compared to corresponding days of the previous five years, and variability appeared to be much less in lockdown period compared to previous years. During the continuous four days, 2–5 April 2020, AOD was lower than that for the previous ten years.
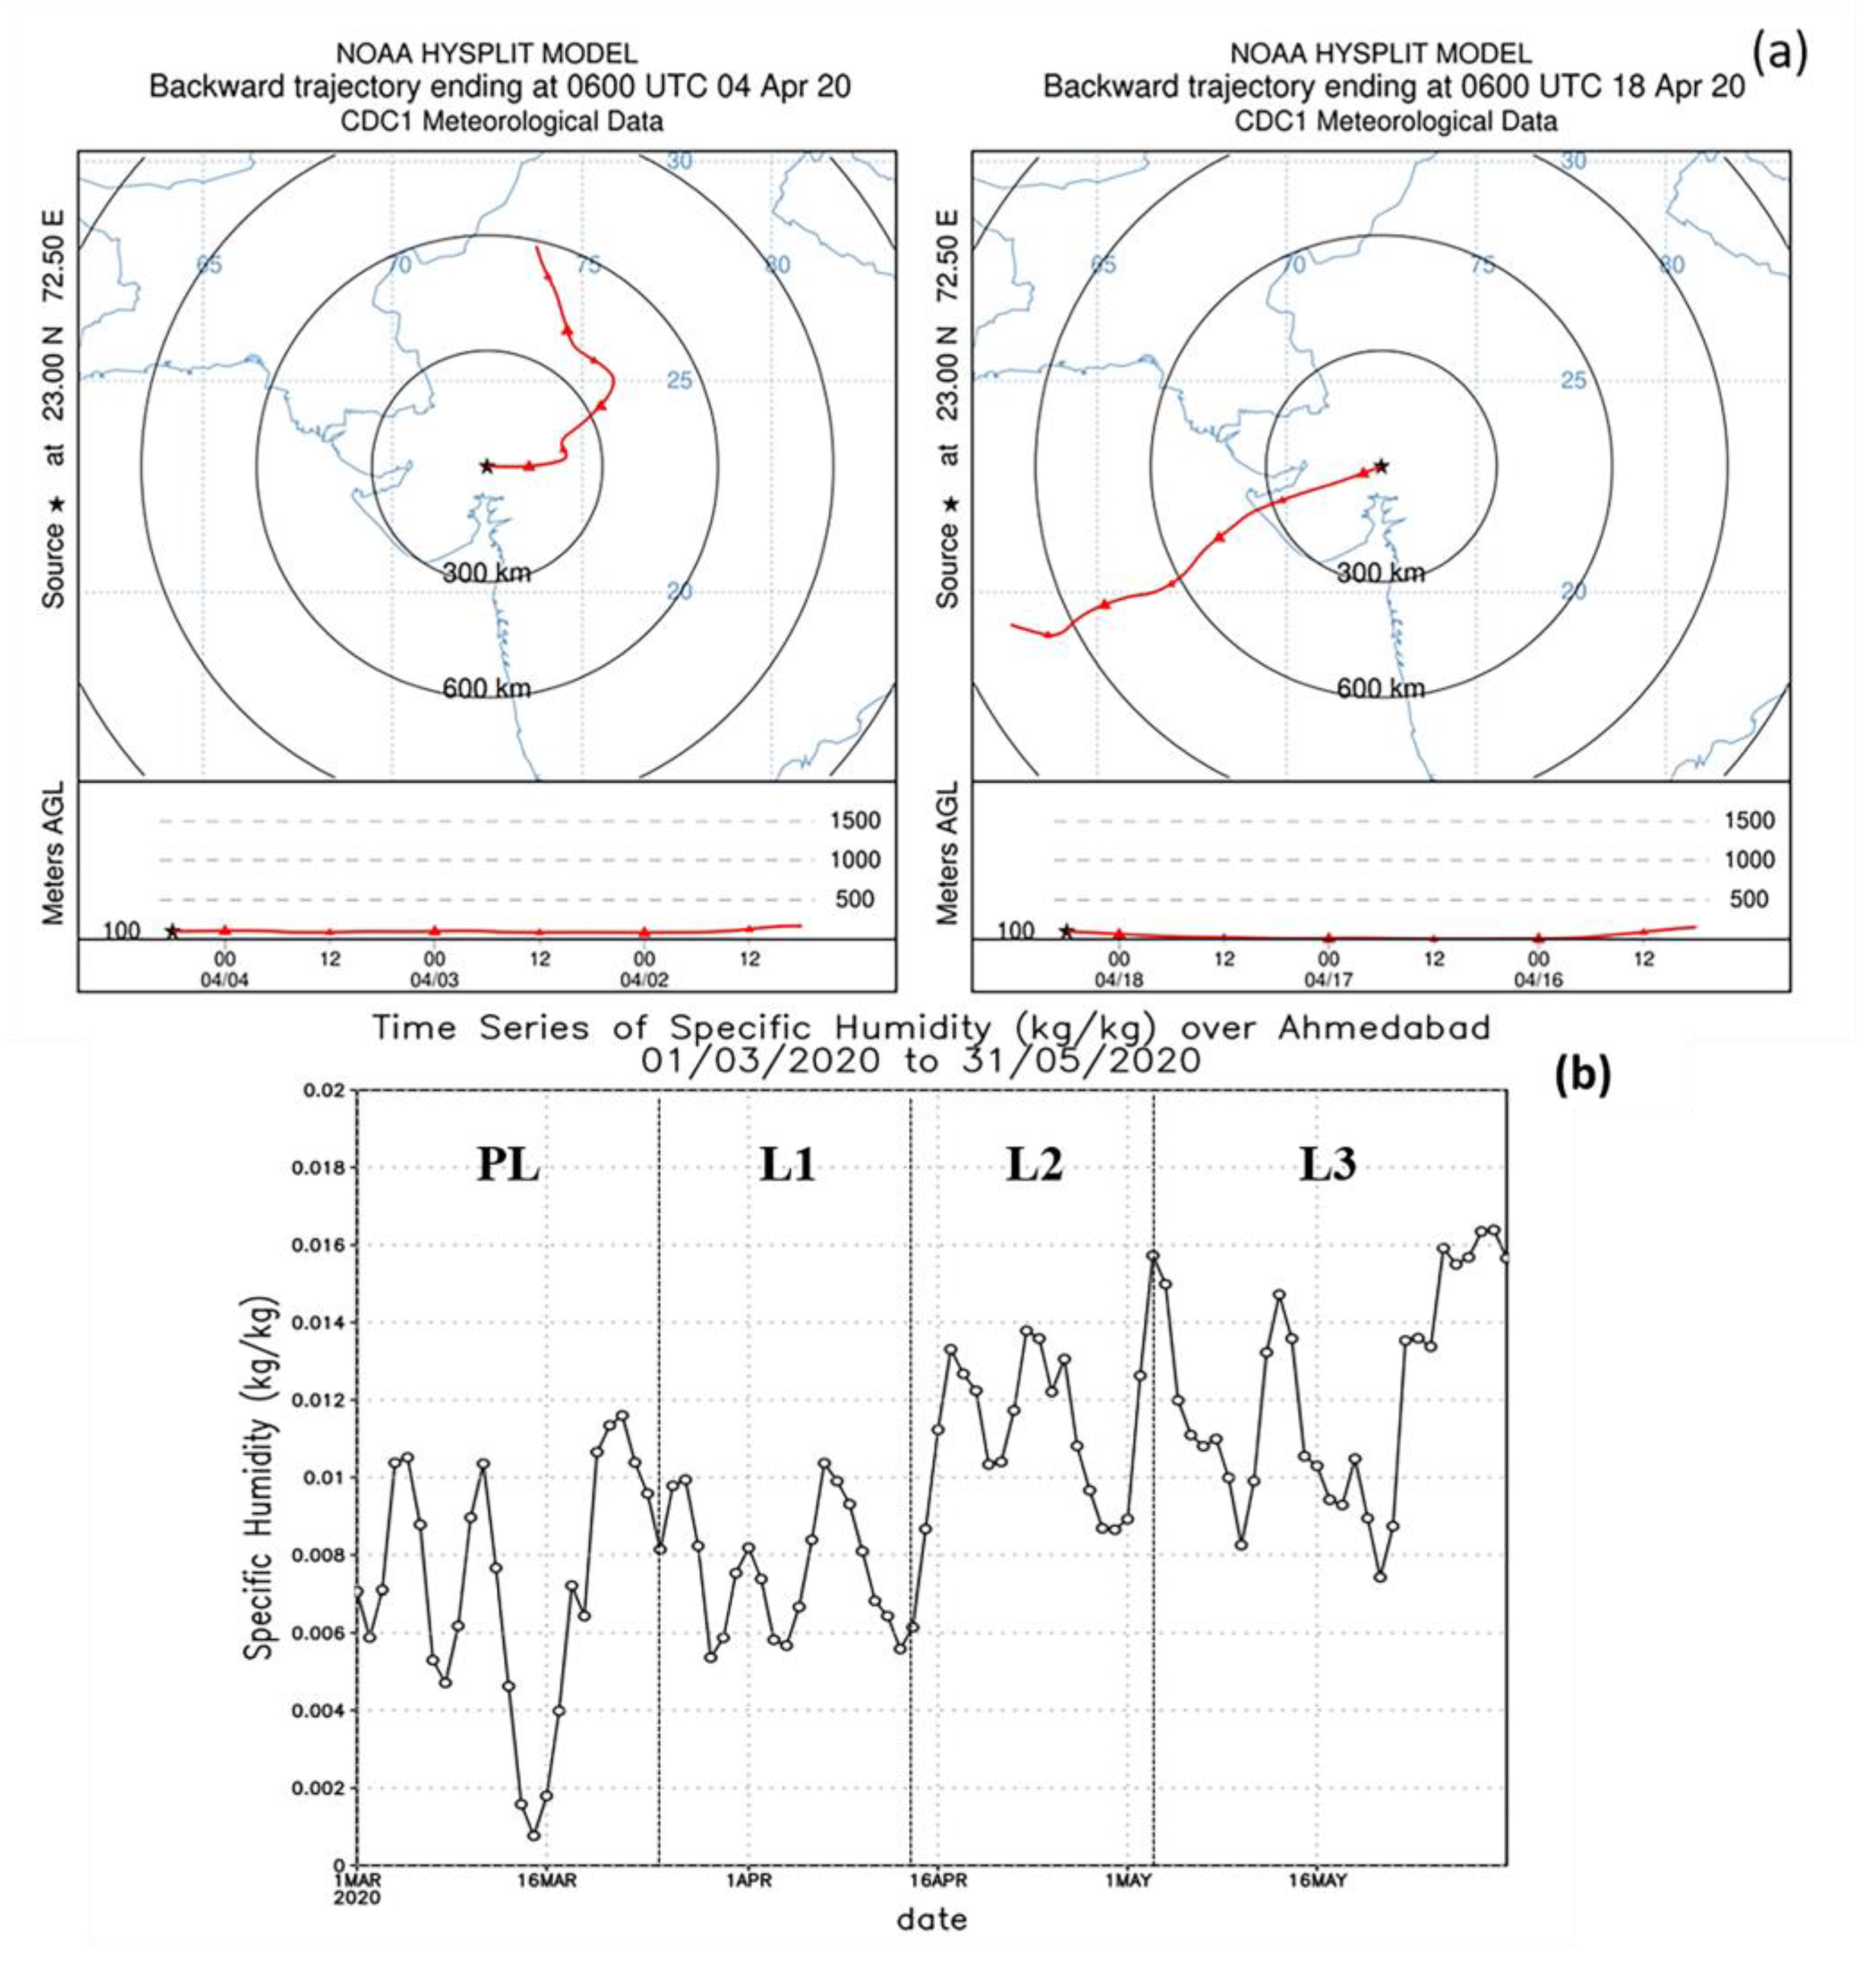
A comparison of the daily average AOD during the study period with the decadal mean (2010–2019) of daily average AOD over the Ahmedabad region presented in Figure 2b clearly shows that AOD for most days during the lockdown period was lower than that of the decadal mean. The weekly average AOD during the lockdown period and that of the decadal mean presented in Figure 2c shows that during all weeks of lockdown, AOD was lower than that of the decadal mean. During the first two weeks of lockdown, AOD decreased to about 0.18, about 47%. The average AOD for the five lockdown stages and that of the decadal mean for the same period, along with their standard deviations, are shown in Figure 2d. It indicates that the average AOD of the PL period was about 0.3, which is close to the decadal mean for that period. However, the average AOD during the L1 and L3 stages are much lower than the decadal mean, with a reduction of 35% during the L1 phase. The standard deviation values suggest that variability during the lockdown period is less compared to that in the same period of previous years. All of the figures above show comparatively high values of AOD from the third week of lockdown corresponding to the L2 phase. The Hysplit trajectories on two representative days during the L1 and L2 periods and the time series of specific humidity over Ahmedabad are shown in Figure 3. These figures suggest a clear change in wind trajectory and the associated influx of humid marine air over the Ahmedabad region during these periods, which caused the high AOD during the L2 phase.
Considering the whole lockdown period, the mean AOD was reduced by about 26% compared to the decadal mean for the same period. Kant et al. [65] reported a 21–37% reduction in aerosol loading over India during lockdown compared to the same period of 2017-19 and specifically a reduction of 46% over North India and 42% in the eastern IGP. Ranjan et al. [35] observed 37% reduction in AOD concerning climatic mean over Delhi during the lockdown period.
3.2. Comparison between AOD over Ahmedabad and the Indo-Gangetic Plain
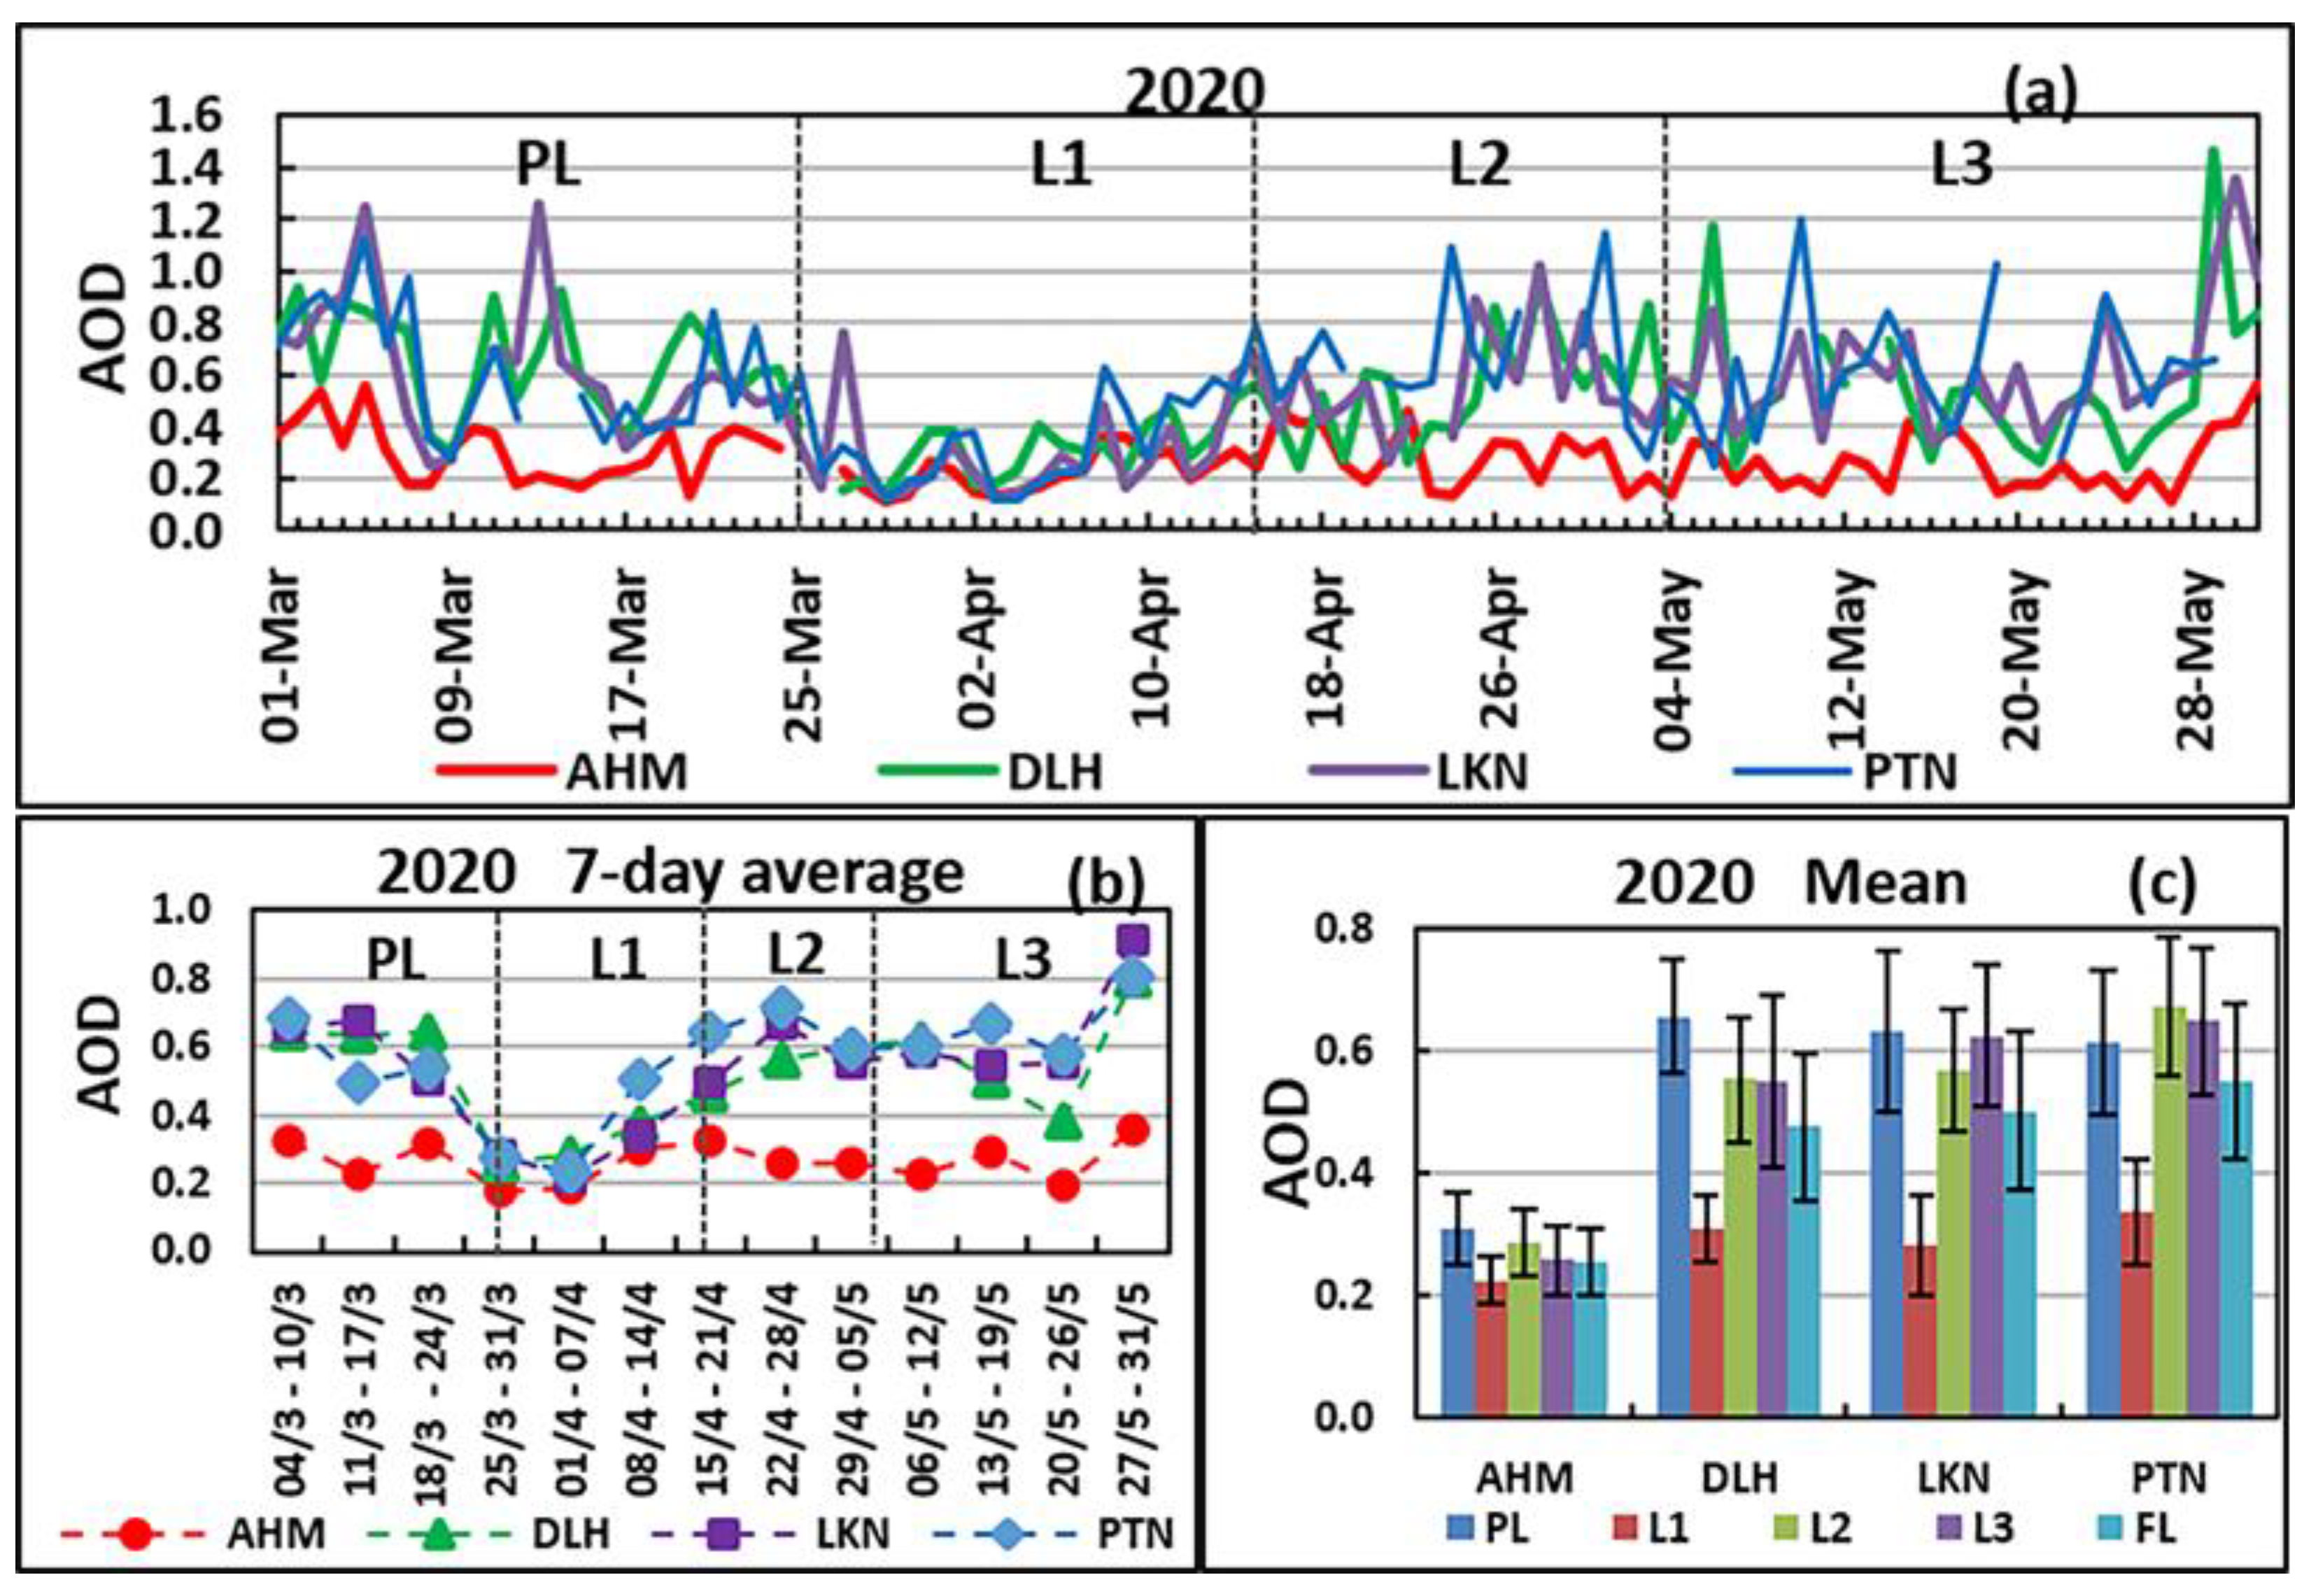
The time series of daily and area averaged AOD in the Ahmedabad region compared to the other regions considered in the IGP, namely Delhi, Lucknow, and Patna, presented in Figure 4a, clearly shows that daily AOD over the Ahmedabad region was much lower than that over the IGP during the PL period. All three regions of the IGP show an immediate significant reduction in AOD with the lockdown. On 24 March, AOD at Ahmedabad, and the Delhi, Lucknow, and Patna regions were 0.32, 0.62, 0.52, and 0.54, respectively. These values were reduced to 0.11, 0.14, 0.13, and 0.12 on 29 March. Reduction in AOD on 29 March compared to the previous day of lockdown in the Ahmedabad region is much less compared to that over the IGP, but in terms of percentage of reduction in AOD are 66%, 77%, 75%, and 73%, respectively, in the Ahmedabad, Delhi, Lucknow, and Patna regions. From 3 April onward, daily AOD over the IGP increased gradually and reached more than 0.8 by the end of April. However, over the Ahmedabad region, daily AOD was between about 0.15 and 0.4 almost throughout the lockdown period.
Weekly variation in AOD in all four regions shown in Figure 4b indicates an immediate reduction in AOD with lockdown in all four regions. Weekly AOD over the Ahmedabad region clearly shows a distinct pattern compared to that over the IGP. Over the Ahmedabad region, weekly AOD was comparatively low before the lockdown, ≈0.32 during the week ending 24 March. It decreased by about 0.18 during the first two weeks of lockdown, a reduction of about 44%. By the third week of lockdown, AOD over the Ahmedabad region returned to the PL condition. After that, a gradual decrease is noticed; the average AOD remained between 0.2 and 0.3 during most weeks of lockdown. Over the IGP, during the week just before lockdown, AOD was above 0.5, dropping to below 0.3 during the first two weeks of lockdown, with a drop of 60%, 57%, and 56% in the Delhi, Lucknow, and Patna regions, respectively. Afterward, AOD increased weekly and reached almost PL conditions by the week ending 28 April. Kant et al. [65] reported that during the third week of April 2020, AOD slightly increased over the IGP due to local stubble-burning activities and clouds on certain days.
The average AOD during the five stages of lockdown in all four regions, along with their standard deviations, is shown in Figure 4c. During PL, AOD in the IGP was more than double that in the Ahmedabad region. The average AOD in the Ahmedabad region shows little change with the lockdown. AOD decreased from 0.31 in PL to 0.22 during the L1 stage and 0.26 in the FL period. On the other hand, in all three regions over the IGP, pre-lockdown AOD was more than 0.61, and significant reductions in AOD during L1; reductions of about 53%, 56%, and 45%, respectively, over the Delhi, Lucknow, and Patna regions. The lowest AOD in all four regions was observed during L1, ranging from 0.22 at Ahmedabad to 0.34 at Patna. Considering the FL, the reduction in AOD concerning PL are 17%, 27%, 21%, and 10%, respectively, over the Ahmedabad, Delhi, Lucknow, and Patna regions. During the L2 stage, AOD over the IGP reached close to that during the PL period, mainly because of high humidity and cloudy conditions. AOD remained high during L3, possibly partially due to the relaxation allowed in lockdown conditions. Variability was lowest during the L1 period at all the stations.
3.3. Variation in the Angstrom Exponent
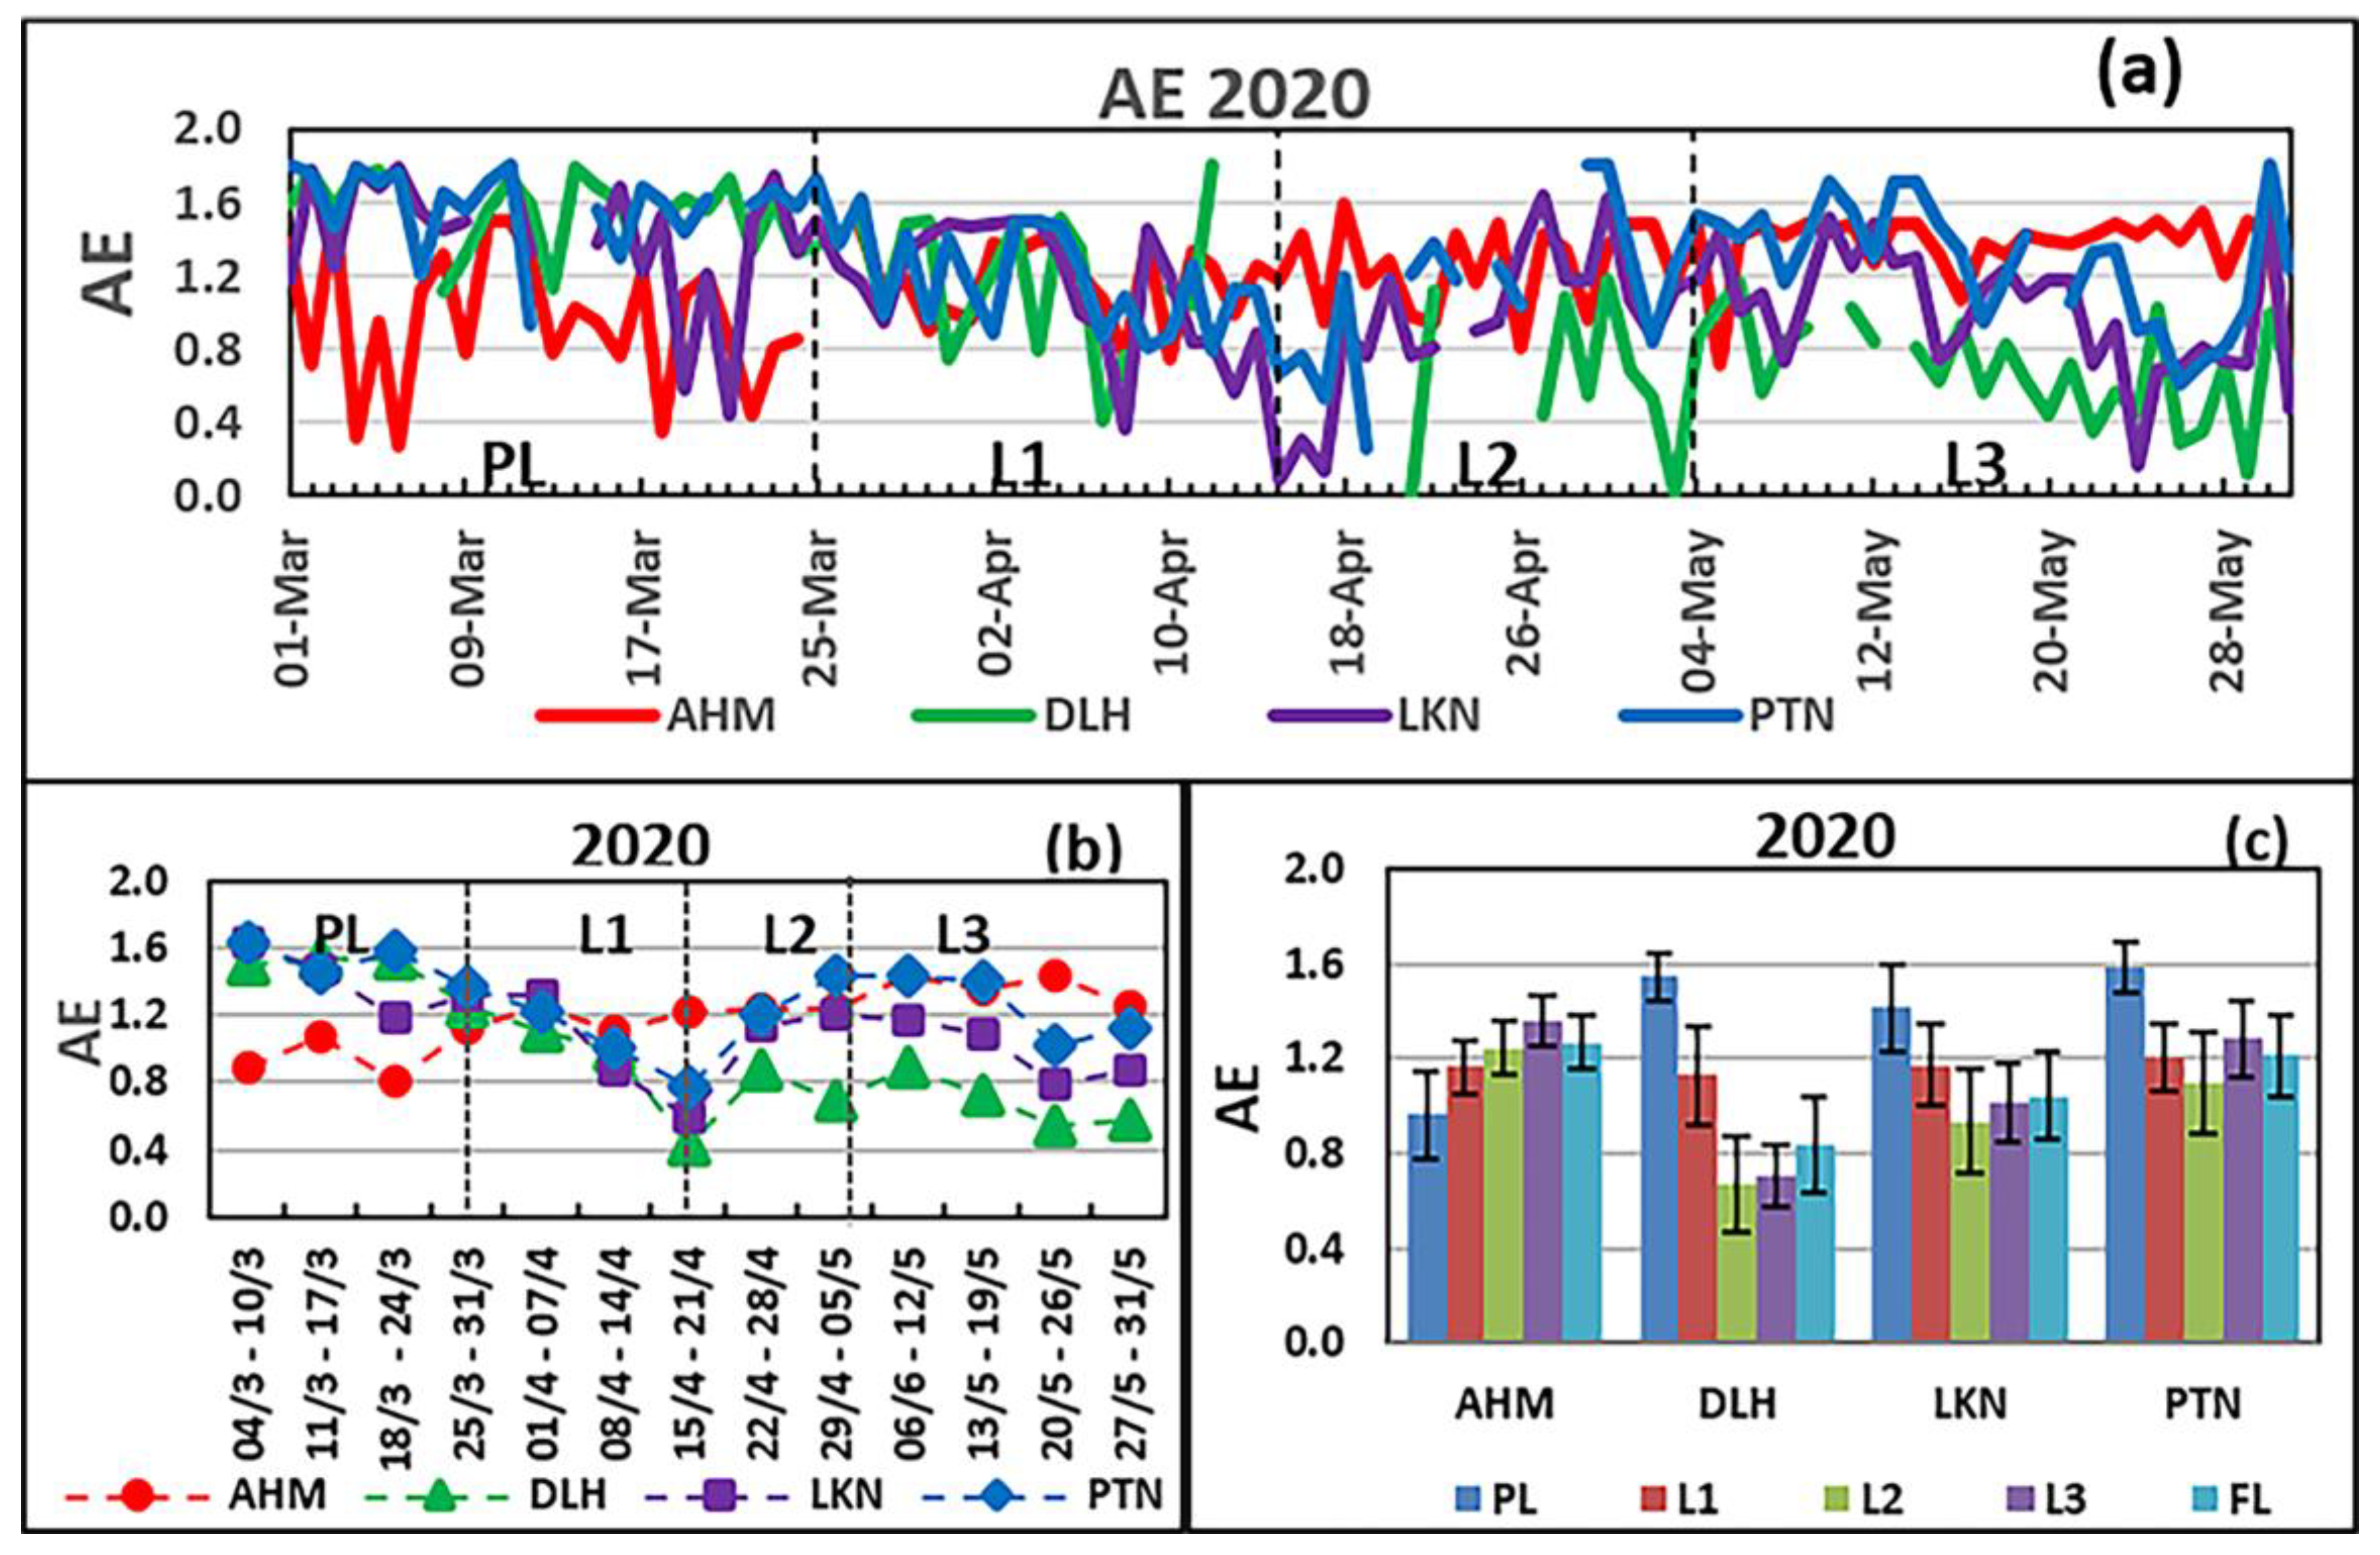
The time series of daily values of AE over the Ahmedabad region and the three regions in the IGP are shown in Figure 5a. AEs over the Ahmedabad region during PL were highly variable. During the last three days before lockdown, the daily AEs over Ahmedabad were less than 0.8, suggesting the dominance of coarse-mode particles over fine-mode particles. However, with the lockdown, the AE over the Ahmedabad region had increased; on 27 March, the AE was comparatively high, about 1.46, suggesting the dominance of fine-mode particles. During the lockdown, daily AE over the Ahmedabad region on almost all days was between 1.0 and 1.5.
Daily AE over Ahmedabad showed a slightly increasing trend during the lockdown period, suggesting an increasing dominance of fine-mode particles. This indicates a progressive reduction in coarse-mode particles in the atmosphere, mainly dust, during the lockdown. All three regions over the IGP showed a different daily AE variation pattern compared to the Ahmedabad region. Over the IGP, daily AE varied around 1.4 during the pre-lockdown period but decreased immediately with the lockdown. Over the Delhi region, a decreasing trend in AE was observed until the end of the lockdown period.
The weekly average AE over the four regions is shown in Figure 5b. Weekly AE over the Ahmedabad region during the PL period was less than 1, but with the lockdown, it increased systematically and reached about 1.43 by the end of May. Over the Delhi region, weekly AE during the PL period was about 1.5, which decreased systematically with the lockdown and reached below 0.6. This indicates that over the Delhi region, the dominance of fine-mode particles before the lockdown had changed progressively to the increasing dominance of coarse-mode particles during the lockdown. The AE over Patna also decreased systematically with the lockdown to the week ending 21 April. Over the Lucknow region, the impact is seen only after two weeks of lockdown. This increasing trend in the dominance of coarse-mode particles during lockdown over the IGP can be interpreted as a decrease in fine-mode particles, which are normally produced by anthropogenic activities such as fossil and biofuel/biomass burning. During the week ending 21 April, the AE was comparatively less over the IGP, suggesting high dominance of coarse-mode particles, most probably due to high humidity and cloud droplets.
Average AEs during the five stages of lockdown over all four regions, along with standard deviations, are shown in Figure 5c. A clear, distinct impact of lockdown on AE over the Ahmedabad region compared to that over the IGP is visible in the figure. The average AE during the PL period over the Ahmedabad region was 0.96 and increased systematically to 1.36 during the L3 stage, with an average AE of 1.27 for the FL period. With the lockdown, this indicates a decrease in coarse-mode particles over the Ahmedabad region. It continued to decrease with later stages of lockdown, suggesting a reduction in dust particles in the atmosphere due to curtailment of construction activities, road traffic, etc.
The average AE during PL over the IGP was between 1.4 and 1.6, indicating high dominance of anthropogenic fine-mode particles. With the lockdown, the dominance of fine-mode particles was reduced in all three regions. The average AE during PL period over the Delhi region was high (1.54); it decreased to 0.65 during the L2 phase of lockdown, a 46% reduction. This indicates an increased dominance of coarse-mode particles over the Delhi region during the lockdown. Reduction in AE during the L2 period may be partially contributed by the presence of cloud droplets apart from reduction in anthropogenic fine-mode aerosols. A similar trend was observed in the other two regions in the IGP. It may be noted that the AE increased during L3 in the IGP due to relaxation in lockdown conditions. These results suggest that anthropogenically produced fine-mode particles, derived mainly from burning fossil fuels and biofuels/biomass, decreased the aerosol content over the IGP during the lockdown. Shukla et al. [38] reported a reduction in the AE during lockdown compared to pre-lockdown at Kanpur, a region in the IGP.
3.4. Variation in PM
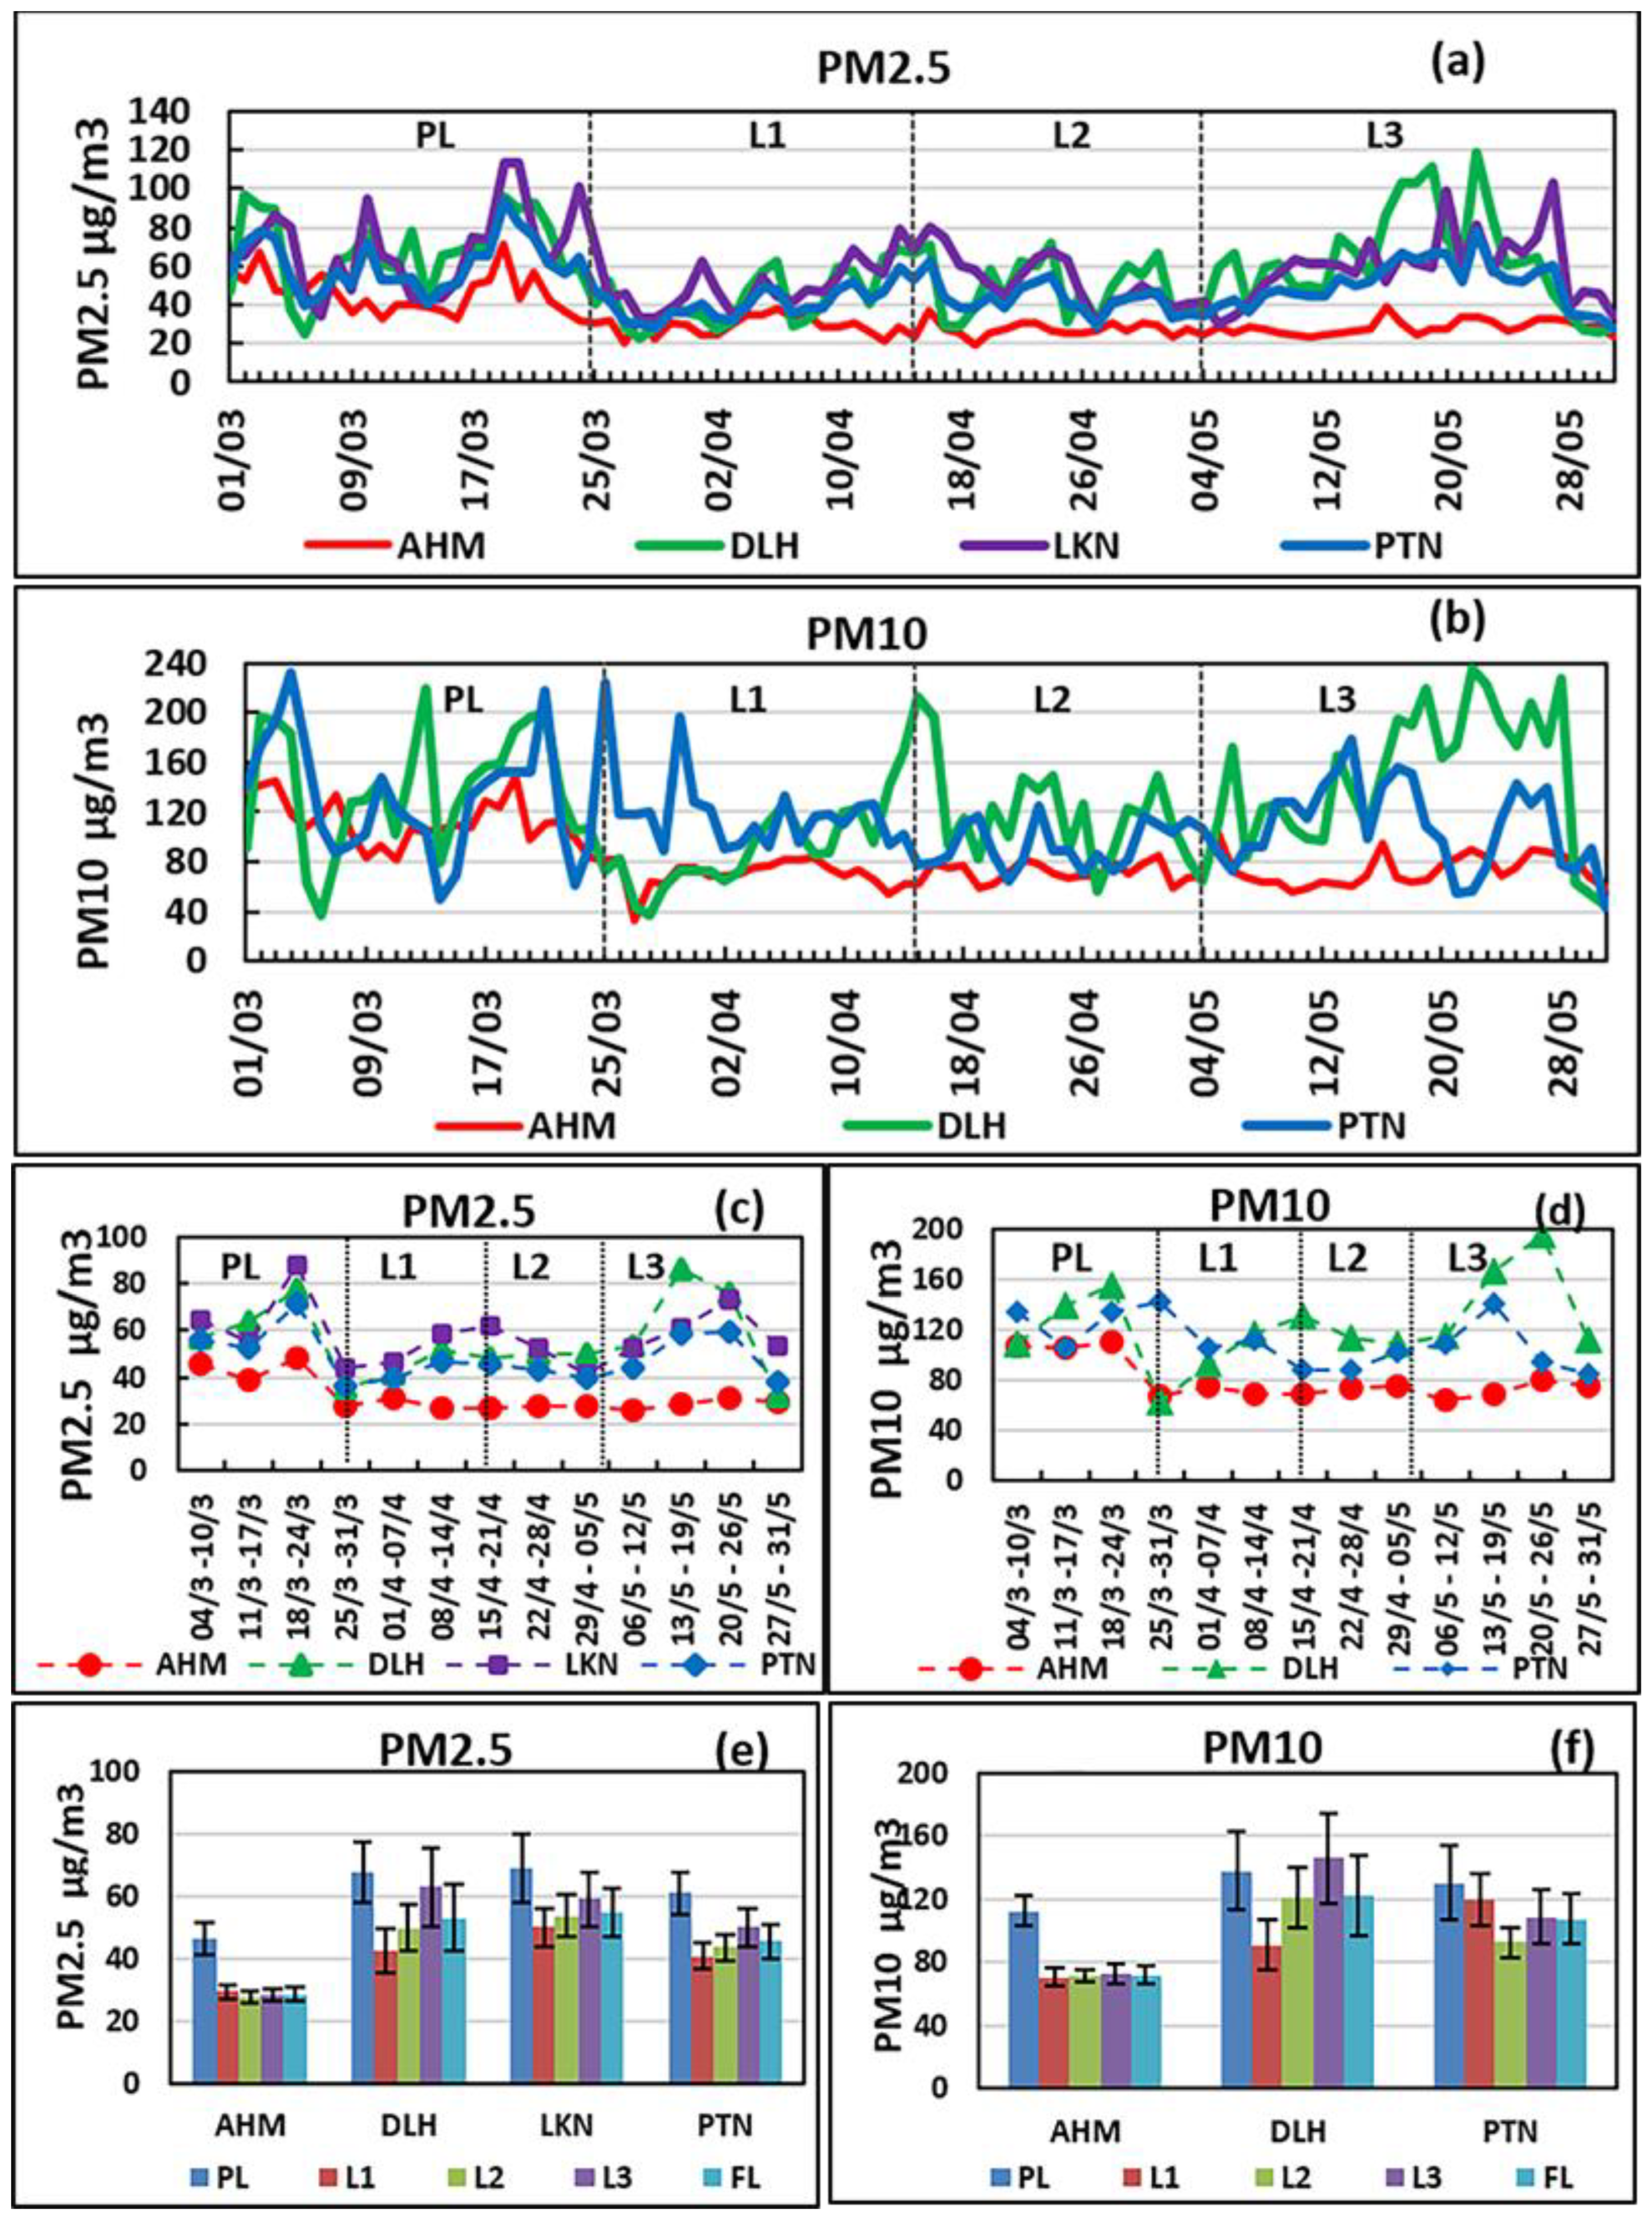
Day-to-day variations in PM2.5 and PM10 over Ahmedabad and the IGP during the study period are shown in Figure 6a,b. These figures reveal that Ahmedabad was much cleaner than the IGP before and during the lockdown. The lowest values of PM2.5 and PM10 on almost all days were observed at Ahmedabad; their variabilities were much less over Ahmedabad than that over the IGP. Apparent reductions in both PM2.5 and PM10 with lockdown are seen at Ahmedabad. During most of the days of the PL period, PM2.5 at Ahmedabad varied between 40 and 60 µg m−3, but during the lockdown, it varied between only 20 and 40 µg m−3. At Ahmedabad and Delhi, the reduction in PM2.5 started with a public curfew on 22 March. On 21 March, PM2.5 at Ahmedabad was 56.8 µg m−3, gradually decreasing to 20.4 µg m−3 on 27 March, a reduction of 64%. Similarly, at Delhi, PM2.5 was 92.9 µg m−3 on 21 March, gradually decreased to 22.4 µg m−3 on 28 March, a reduction of 76%. At Lucknow, however, the reduction in PM2.5 started on 25 March, and the minimum was reached on 29 March. As far as PM10 is concerned, variations similar to PM2.5 are seen at Ahmedabad and Delhi, and PM10 was reduced by 70% and 81% at Ahmedabad and Delhi, respectively. After 15 May, there were considerable increases in PM values over the IGP.
Weekly averaged PM (Figure 6c,d) suddenly dropped with the lockdown at all four locations. Weekly averaged PM2.5 and PM10 at Ahmedabad show a different trend than the IGP. Weekly averaged PM2.5 at Ahmedabad just before the lockdown was about 47.9 µg m−3, and it decreased to about 27.4 µg m−3 with lockdown, a reduction of about 43%. In the IGP, PM2.5 was reduced by about 50% with the lockdown. After the sudden drop during the lockdown, PM2.5 remained low throughout the lockdown period at Ahmedabad, but it gradually increased up to the middle of April in the IGP. Like PM2.5, weekly PM10 at Ahmedabad decreased by 39% with the lockdown and remained low throughout the lockdown. At Delhi, the immediate effect of the lockdown was significant, weekly average PM10 of 155.3 µg m−3 during the week ending on 24 March had decreased to 62.7 µg m−3 by lockdown, a reduction of 60%. However, at Patna, the impact of lockdown on weekly PM10 is seen after a week of lockdown.
Average values of PM2.5 and PM10 during the five stages of lockdown are presented in Figure 6e,f. At Ahmedabad and Delhi, the average PM2.5 and PM10 decreased by about 36% from PL to L1. The reduction in PM2.5 during L1 at Lucknow was the lowest, only 28%. At Ahmedabad, both PM2.5 and PM10 values remained nearly the same during all three stages of lockdown, about 29 and 71 µg m−3, respectively, but in the IGP, PM2.5 gradually increased during L2 and L3. This indicates that partial relaxations offered during L2 and L3 did not affect aerosol content at Ahmedabad but resulted in more anthropogenic aerosol loading over the IGP. Like PM2.5, PM10 at Delhi also increased during L2 and L3, and during L3 the PM10 reached more than that in the PL condition. At Ahmedabad, the percentage reduction in PM10 and PM2.5 during the FL period compared to the PL period is nearly the same (≈37%). Nevertheless, at Delhi and Patna, the percentage reduction in PM2.5 during the FL period is more than that of PM10, suggesting more reduction in fine particles.
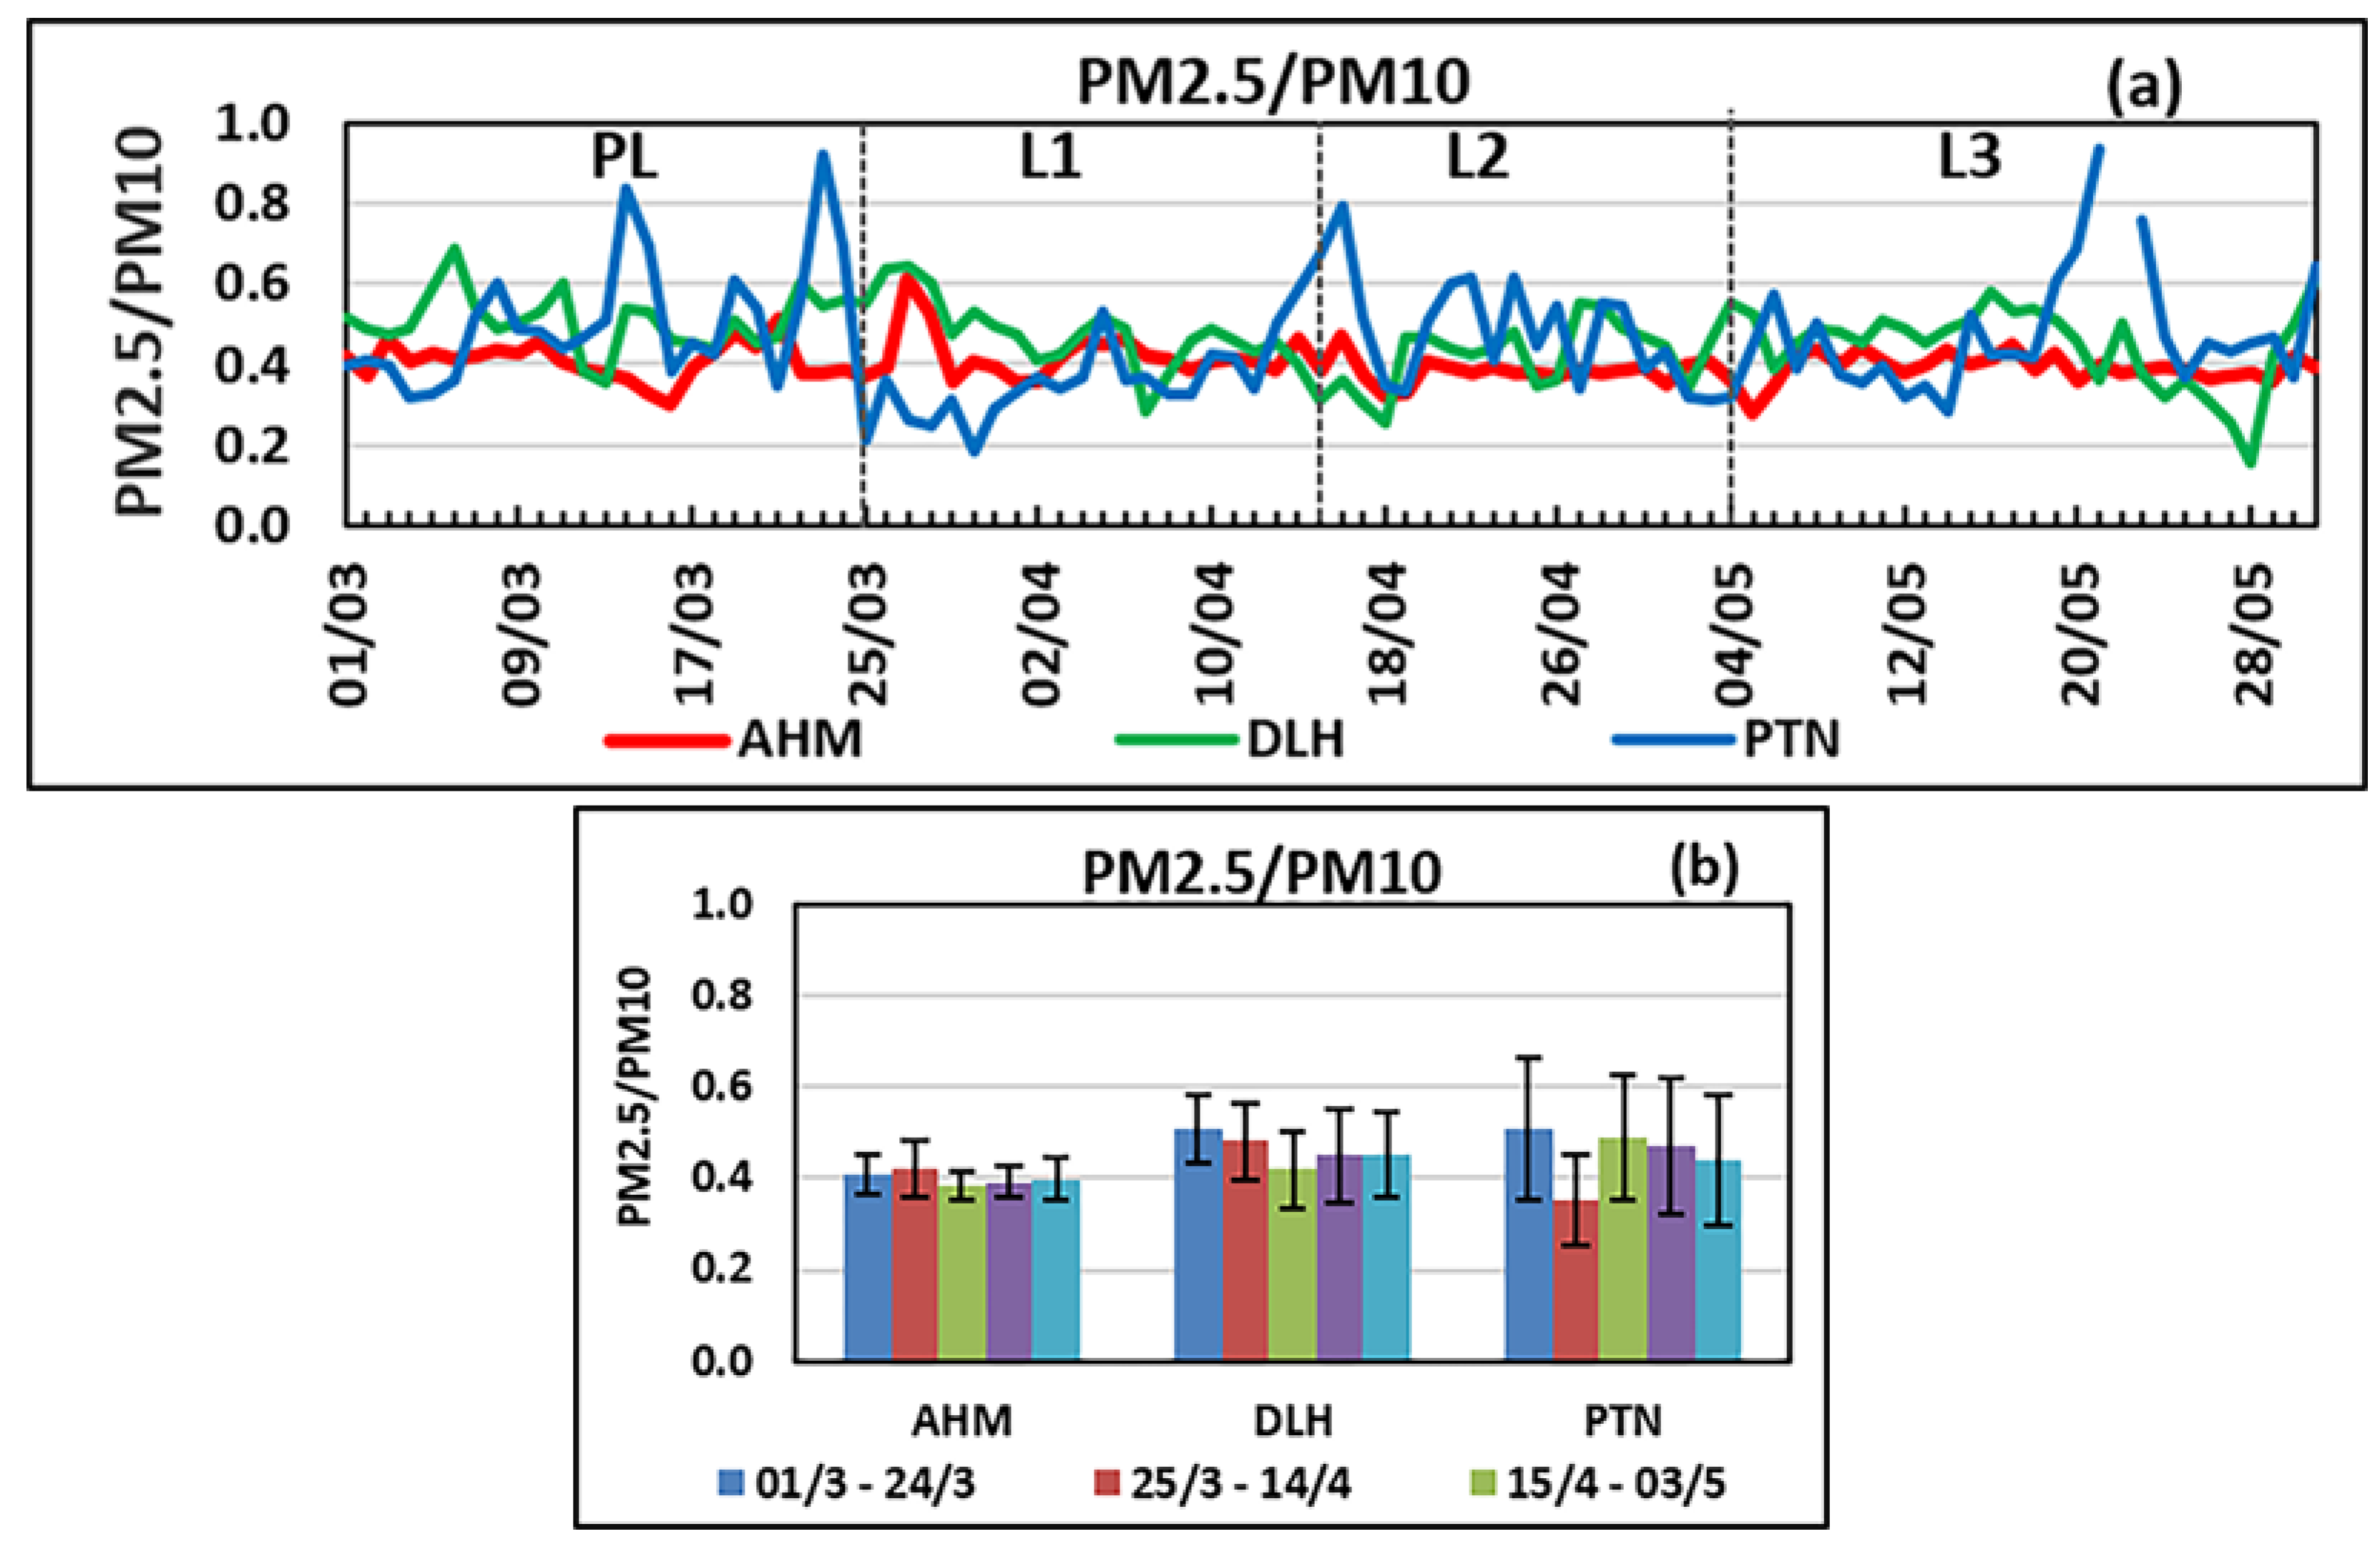
The time series of the PM2.5/PM10 ratio over the three locations during the study period and changes in this ratio during different stages of lockdown are presented in Figure 7a,b. Both figures clearly show that over Ahmedabad, there was no change in the ratio with the lockdown. It remained at about 0.4 throughout the study period. However, both stations in the IGP showed a slight decrease in the ratio during the lockdown. At Delhi, this reduction also continued in L2. The reduction in this ratio during L1 at Patna is very significant, but after that, it increased (Table 2). This suggests a relative reduction in fine-mode particles compared to coarse-mode particles with lockdown over the IGP. The AE values also revealed reduced fine-mode particles with lockdown over the IGP.
4. Conclusions
This study attempts to understand the impact of lockdown on column and surface concentration of aerosols in the Ahmedabad region and to examine how it compares with changes that occurred over the IGP. Four parameters, namely AOD, AE, PM2.5, and PM10, were analyzed for the period 1 March to 31 May 2020.
AOD in the Ahmedabad region during many days and all weeks of the lockdown period was lower than that of the decadal mean. During the first two weeks of lockdown, AOD values decreased to 0.18 in the Ahmedabad region, a reduction of about 47% compared to decadal mean. Daily AOD over the Ahmedabad region decreased to as low as 0.11 on 29 March, a reduction of about 65% with reference to days before lockdown. This reduction in AOD on 29 March was much less compared to the reduction over the IGP (about 0.43), but in terms of percentage change, the reduction in AOD was similar to that over the IGP. Weekly AOD values showed an immediate reduction with lockdown in all four regions, reduced by about 44% and 54% (on average), respectively, over Ahmedabad and the IGP, respectively, during the first two weeks of lockdown. However, changes in weekly AOD values over the Ahmedabad region showed a distinct pattern compared to that in regions over the IGP. During PL, AOD in the Ahmedabad region was almost half of that in the IGP. During L1, AOD decreased by about 29% at Ahmedabad, but reduction over the IGP was much more, on average, about 50%.
During the three days just before the lockdown, daily AE values over Ahmedabad were less than 0.8, but with lockdown it had increased to about 1.46 on 27 March. Average AE during the pre-lockdown period over the Ahmedabad region was 0.96, which increased phase by phase to 1.36 during the L3 phase of lockdown. The AE changes indicate changes in aerosol size distribution over Ahmedabad with the lockdown. This change in dominance of fine-mode particle to coarse-mode particle over Ahmedabad suggests a reduction in dust particles in the atmosphere due to curtailment of construction and industrial activities, road traffic, etc.
All three regions within the IGP showed a different pattern in AE variation compared to that in the Ahmedabad region. Over the IGP, daily AE values were comparatively higher during the pre-lockdown period. Over the Delhi region, during the lockdown period, a significant decreasing trend in daily AE values is observed. The weekly AE value during the PL phase was about 1.5, which decreased systematically with lockdown and reached to below 0.6 by the end of the lockdown period. Average AE for the pre-lockdown period over all three regions in the IGP were between 1.4 and 1.6, indicating high predominance of fine-mode particles. This dominance of fine-mode particles during the pre-lockdown period had decreased in all three regions with lockdown, especially over the Delhi region, which clearly suggests that the anthropogenically generated fine-mode particles produced mainly by fossil and biofuel burning had been reduced over the IGP during the lockdown period.
Ahmedabad city was much cleaner than cities in the IGP before and during the lockdown period. Apparent reductions in PM2.5 and PM10 are seen at Ahmedabad with lockdown. On 21 March, PM2.5 at Ahmedabad was 57 µg m−3; it gradually decreased to 20 µg m−3 on 27 March, a reduction of 64%. Similarly, at Delhi, PM2.5 was 93 µg m−3 on 21 March, but gradually decreased to 22 µg m−3 on 28 March, a reduction of 76%. At both places, surface aerosol content began to decrease from the day of the Janatha curfew. Weekly averaged PM values suddenly dropped with lockdown at all four locations. At Ahmedabad, weekly averaged PM2.5 and PM10 showed a different trend than that at the IGP cities. At Ahmedabad, after the sudden drop with lockdown, both PM2.5 and PM10 values remained nearly same during all three phases of lockdown, about 29 and 72 µg m−3, respectively, but at locations in the IGP, the PM2.5 gradually increased during the second and third phases of lockdown. This indicates that partial relaxations offered in the second and third phases of lockdown did not affect much the aerosol content at Ahmedabad, but resulted in more anthropogenic aerosol loading in the atmosphere over the IGP. Both Delhi and Patna, cities in the IGP, showed a slight decrease in the PM2.5/PM10 ratio during the L1 phase of lockdown, especially at Patna. At Delhi, this reduction also continued in the L2 phase. These changes in the PM2.5/PM10 ratio also indicate a relative reduction in anthropogenic fine-mode particles with lockdown over the IGP.
The lockdown enforced by the COVID-19 pandemic was an incidental global-level experiment to understand the impact of anthropogenic activities on the environment. The lockdown provided an opportunity to experience blue skies for several days, witness objects at a far distance, and ascertain background aerosol conditions at different places. The event demonstrated that partial lockdown events can be crucial in containing air pollution, at least in hotspot regions. Policymakers, environmentalists, and atmospheric physicists should formulate suitable ways of imposing lockdowns with minimal economic impact.
Author Contributions
Conceptualization, N.V. and J.M.; Methodology, N.V. and J.M.; Data curation, N.V. and J.M.; Formal analysis, N.V., J.M. and S.G.; Investigation, J.M. and A.S.G.; Resources, A.S.G.; Writing—original draft, N.V. and J.M.; Writing—review & editing, S.G. All authors have read and agreed to the published version of the manuscript.
Funding
This research received no external funding.
Institutional Review Board Statement
Not applicable.
Informed Consent Statement
Not applicable.
Data Availability Statement
Not applicable.
Acknowledgments
The authors would like to thank S. Ramachandran, Ahmedabad, India, for reviewing the manuscript meticulously and suggesting suitable modifications. The authors acknowledge Giovanni for AOD and AE MODIS data, and CPCB for PM data. The authors acknowledge UGC and DST for financial support extended to the Physics Department, Gujarat University, through the SAP and FIST programs.
Conflicts of Interest
The authors declare no conflict of interest.
References
- Kumar, R.P.; Samuel, C.; Rekha, S.R.; Gautam, S. Air pollution in five Indian megacities during the Christmas and New Year celebration amidst COVID-19 pandemic. Stoch. Environ. Res. Risk Assess. 2022, 36, 3653–3683. [Google Scholar] [CrossRef]
- Kumar, R.P.; Perumpully, S.J.; Samuel, C.; Gautam, S. Exposure and health: A progress update by evaluation and scientometric analysis. Stoch. Environ. Res. Risk Assess. 2022, 37, 453–465. [Google Scholar] [CrossRef] [PubMed]
- Mirza, S.; Niwalkar, A.; Gupta, A.; Gautam, S.; Anshul, A.; Bherwani, H.; Biniwale, R.; Kumar, R. Is safe distance enough to prevent COVID-19? Dispersion and tracking of aerosols in various artificial ventilation conditions using OpenFOAM. Gondwana Res. 2022, 114, 40–54. [Google Scholar] [CrossRef] [PubMed]
- Naqvi, H.R.; Mutreja, G.; Shakeel, A.; Singh, K.; Abbas, K.; Fatma, D.; Chaudhary, A.A.; Siddiqui, M.A.; Gautam, A.S.; Gautam, S.; et al. Wildfire-induced pollution and its short-term impact on COVID-19 cases and mortality in California. Gondwana Res. 2022, 114, 30–39. [Google Scholar] [CrossRef] [PubMed]
- Gautam, S.; Gollakota, A.R.K. Introduction to the special issue “Environmental impacts of COVID-19 pandemic”. Gondwana Res. 2022, 114, 1–3. [Google Scholar] [CrossRef]
- Chelani, A.; Gautam, S. Lockdown during COVID-19 pandemic: A case study from Indian cities shows insignificant effects on urban air quality. Geosci. Front. 2022, 13, 101284. [Google Scholar] [CrossRef]
- Chelani, A.; Gautam, S. The influence of meteorological variables and lockdowns on COVID-19 cases in urban agglomerations of Indian cities. Stoch. Environ. Res. Risk Assess. 2022, 36, 2949–2960. [Google Scholar] [CrossRef]
- Gautam, S.; Sammuel, C.; Gautam, A.S.; Kumar, S. Strong link between coronavirus count and bad air: A case study of India. Environ. Dev. Sustain. 2021, 23, 16632–16645. [Google Scholar] [CrossRef]
- Bherwani, H.; Gautam, S.; Gupta, A. Qualitative and Quantitative Analysis of Impact of COVID-19 on Sustainable Development Goals (SDGs) in Indian Subcontinent with a Focus on Air Quality. Int. J. Environ. Sci. Technol. 2021, 18, 1019–1028. [Google Scholar] [CrossRef]
- Xu, X.; Zhang, C. Estimation of ground-level PM2.5 concentration using MODIS AOD and corrected regression model over Beijing, China. PLoS ONE 2020, 15, e0240430. [Google Scholar] [CrossRef]
- Chu, D.A.; Kaufman, Y.J.; Ichoku, C.; Remer, L.A.; Tanre, D.; Holben, B.N. Validation of MODIS aerosol optical depth retrieval over land. Geophys. Res. Lett. 2002, 29, MOD2-1. [Google Scholar] [CrossRef] [Green Version]
- Gupta, P.; Christopher, S.A.; Wang, J.; Gehrig, R.; Lee, Y.C.; Kumar, N. Satellite remote sensing of particulate matter and air quality assessment over global cities. Atmos. Environ. 2006, 40, 5880–5892. [Google Scholar] [CrossRef]
- Kumar, N.; Chu, A.; Foster, A. An empirical relationship between PM2.5 and aerosol optical depth in Delhi Metropolitan. Atmos. Environ. 2007, 41, 4492–4503. [Google Scholar] [CrossRef] [PubMed] [Green Version]
- Kim, M.; Zhang, X.; Holt, J.B.; Liu, Y. Spatio-Temporal variations in the associations between hourly PM2.5 and AOD from MODIS Sensors on Terra and Aqua. Health 2013, 5, 8–13. [Google Scholar] [CrossRef]
- Bherwani, H.; Kumar, S.; Musugu, K.; Nair, M.; Gautam, S.; Gupta, A.; Ho, C.H.; Anshul, A.; Kumar, R. Assessment and valuation of health impacts of fine particulate matter during COVID-19 lockdown: A comprehensive study of tropical and subtropical countries. Environ. Sci. Pollut. Res. 2022, 28, 44522–44537. [Google Scholar] [CrossRef]
- Thapliyal, J.; Bhattacharyya, M.; Prakash, S.; Patni, B.; Gautam, S.; Gautam, A.S. Addressing the relevance of COVID–19 pandemic in nature and human socio-economic fate. Stoch. Environ. Res. Risk Assess. 2022, 36, 3239–3253. [Google Scholar] [CrossRef]
- Gautam, S.; Blessy, A.; Kumar, R.P. A methodological approach to identify communities at risk: Trajectory dispersion models to trace air pollutants during colour festival. Hyg. Environ. Health Adv. 2022, 4, 100027. [Google Scholar] [CrossRef]
- Ambade, B.; Sankar, T.K.; Kumar, A.; Gautam, A.S.; Gautam, S. COVID-19 lockdowns reduce the Black carbon and polycyclic aromatic hydrocarbons of the Asian atmosphere: Source apportionment and health hazard evaluation. Environ. Dev. Sustain. 2021, 23, 12252–12271. [Google Scholar] [CrossRef]
- Gautam, S.; Hens, L. SARS-CoV-2 pandemic in India: What might we expect? Environ. Dev. Sustain. 2020, 22, 3867–3869. [Google Scholar] [CrossRef] [Green Version]
- Kurwadkar, S.; Sankar, T.K.; Kumar, A.; Ambade, B.; Gautam, S.; Gautam, A.S.; Biswas, J.K.; Salam, M.A. Emissions of black carbon and polycyclic aromatic hydrocarbons: Potential implications of cultural practices during the COVID-19 pandemic. Gondwana Res. 2022, 114, 4–14. [Google Scholar] [CrossRef]
- Singh, B.P.; Srivastava, A.K.; Tiwari, S.; Singh, S.; Singh, R.K.; Bisht, D.S.; Lal, D.M.; Singh, A.K.; Mall, R.K.; Srivastava, M.K. Radiative impact of fireworks at a tropical Indian location: A case study. Adv. Meteorol. 2014, 2014, 197072. [Google Scholar] [CrossRef] [Green Version]
- Singh, R.P.; Sagnik, D.; Holben, B. Aerosol behavior in Kanpur during Diwali festival. Curr. Sci. 2003, 84, 1302–1304. [Google Scholar]
- Vaghmaria, N.; Mevada, N.; Maliakal, J. Impact of Diwali festival on aerosol optical properties over an urban city, Ahmedabad (India). Aerosol Air Qual. Res. 2018, 18, 522–532. [Google Scholar] [CrossRef] [Green Version]
- Vyas, B.M.; Saraswat, V. Studies of atmospheric aerosol’s parameters during pre-Diwali to post–Diwali festival period over Indian Semi-arid station i.e., Udaipur. Appl. Phys. Res. 2012, 4, 40–55. [Google Scholar] [CrossRef]
- Ashok, G.; John, I.B.P.; Mary, T.; Packiavathy, S.V.; Gautam, S. Internet of Things (IoT) based automated sanitizer dispenser and COVID-19 statistics reporter in a post-pandemic world. Health Technol. 2023, 13, 327–341. [Google Scholar] [CrossRef]
- Selvadass, S.; Paul, J.J.; Marry, T.B.; Packiavathy, I.S.V.; Gautam, S. IoT-Enabled smart mask to detect COVID-19 outbreak. Health Technol. 2022, 12, 1025–1036. [Google Scholar] [CrossRef]
- Shi, H.; Han, X.; Jiang, N.; Cao, Y.; Alwalid, O.; Gu, J.; Fan, Y.; Zheng, C. Radiological findings from 81 patients with COVID-19 pneumonia in Wuhan, China: A descriptive study. Lancet Infect. Dis. 2020, 20, 425–434. [Google Scholar] [CrossRef] [PubMed]
- WHO. Coronavirus Disease (COVID-19) Dashboard. 2020. Available online: https://covid19.who.int/ (accessed on 10 May 2021).
- Kanniah, K.D.; Zaman Kamarul, N.A.F.; Kaskaoutis, G.D.; Latif, M.T. COVID-19’s impact on the atmospheric environment in the Southeast Asia region. Sci. Total Environ. 2020, 736, 139658. [Google Scholar] [CrossRef]
- Chen, B.; Huang, Y.; Huang, J.; Dong, L.; Guan, X.; Ge, J.; Hu, Z. Using Lidar and Historical Similar Meteorological Fields to Evaluate the Impact of Anthropogenic Control on Dust Weather During COVID-19. Front. Environ. Sci. 2021, 9. [Google Scholar] [CrossRef]
- Nicolae, V.; Stefan, S.; Nemuc, A. Changes in the aerosol properties during pandemic restrictions in Romania. Rom. J. Phys. 2022, 67, 809. [Google Scholar]
- Jin, Y.; Ma, Y.; Zhang, M.; Liu, Y.; Lu, X.; Liu, B.; Jin, S.; Shen, A.; Zhang, J.; Fan, Q. Aerosol Characteristics during the COVID-19 Lockdown in China: Optical Properties, Vertical Distribution, and Potential Source. Remote Sens. 2022, 14, 3336. [Google Scholar] [CrossRef]
- Fadnavis, S.; Sabin, T.P.; Rap, A.; Müller, R.; Kubin, A.; Heinold, B. The Impact of COVID-19 Lockdown Measures on the Indian Summer Monsoon. Environ. Res. Lett. 2021, 16, 074054. [Google Scholar] [CrossRef]
- Mehta, M.; Hooda, W.; Chauhan, P. A satellite view of the changes in summer-time aerosol vertical distribution before and during COVID-19 lockdown conditions in India. Curr. Sci. 2021, 120, 1818–1819. [Google Scholar]
- Ranjan, A.K.; Patra, A.K.; Gorai, A.K. Effect of lockdown due to SARS COVID-19 on AOD over urban and mining regions in India. Sci. Total Environ. 2020, 745, 141024. [Google Scholar] [CrossRef] [PubMed]
- Shukla, N.; Sharma, G.; Baruah, P.; Shukla, V.K.; Gargava, P. Impact of shutdown due to COVID-19 pandemic on aerosol characteristics in Kanpur, India. J. Health Pollut. 2020, 10, 201201. [Google Scholar] [CrossRef]
- Shaikh, A.A.; Sen, A.; Menon, H.B. Effect of SARS-CoV-2 pandemic induced lockdown on the aerosol loading over the coastal state. Goa. Curr. Sci. 2021, 120, 360–367. [Google Scholar] [CrossRef]
- Resmi, C.T.; Nishanth, T.; Satheesh Kumar, M.K.; Manoj, M.G.; Balachandramohan, M.; Valsaraj, K.T. Air quality improvement during triple-lockdown in the coastal city of Kannur, Kerala to combat COVID-19 transmission. PeerJ 2020, 8, e9642. [Google Scholar] [CrossRef]
- Pandey, S.K.; Vinoj, V. Surprising Changes in Aerosol Loading over India amid COVID-19 Lockdown. Aerosol Air Qual. Res. 2021, 21, 200466. [Google Scholar] [CrossRef]
- Ratnam, V.; Prasad, P.; Raj, S.A.; Ibrahim, H. Effect of Lockdown due to COVID-19 on the Aerosol and Trace Gases Spatial Distribution over India and Adjoining Regions. Aerosol Air Qual. Res. 2021, 21, 200397. [Google Scholar] [CrossRef]
- Kalluri, R.O.R.; Gugamsetty, B.; Tandule, C.R.; Kotalo, R.G.; Thotli, L.R.; Rajuru, R.R.; Palle, S.N.R. Impact of aerosols on surface ozone during COVID-19 pandemic in southern India: A multi-instrumental approach from ground and satellite observations, and model simulations. J. Atmos. Sol. Terr. Phys. 2021, 212, 105491. [Google Scholar] [CrossRef]
- Li, C.; Shang, H.; Cui, Z.; Dai, Z.; Ma, Z. COVID-19 as a Factor Influencing Air Quality? A City Study in China. Aerosol Air Qual. Res. 2021, 21, 210080. [Google Scholar] [CrossRef]
- Tobías, A.; Carnerero, C.; Reche, C.; Massagué, J.; Via, M.; Minguillón, M.C.; Alastuey, A.; Querol, X. Changes in air quality during the lockdown in Barcelona (Spain) one month into the SARS-CoV-2 epidemic. Sci. Total Environ. 2020, 726, 138540. [Google Scholar] [CrossRef] [PubMed]
- Cristina, M.; Abbà, A.; Bertanza, G.; Pedrazzani, R.; Ricciardi, P.; Carnevale, M. Lockdown for COVID-19 in Milan: What are the effects on air quality? Sci. Total Environ. 2020, 732, 139280. [Google Scholar]
- Dantas, G.; Siciliano, B.; França, B.B.; da Silva, C.M.; Arbilla, G. The impact of COVID-19 partial lockdown on the air quality of the city of Rio de Janeiro, Brazil. Sci. Total Environ. 2020, 729, 139085. [Google Scholar] [CrossRef]
- Siciliano, B.; Carvalho, G.; da Silva, C.M.; Arbilla, G. The impact of COVID-19 partial lockdown on primary pollutant concentrations in the atmosphere of Rio de Janeiro and São Paulo megacities (Brazil). Bull. Environ. Contam. Toxicol. 2020, 105, 2–8. [Google Scholar] [CrossRef] [PubMed]
- Kerimray, A.; Baimatova, N.; Ibragimova, O.P.; Bukenov, B.; Kenessov, B.; Plotitsyn, P.; Karaca, F. Assessing air quality changes in large cities during COVID-19 lockdowns: The impacts of traffic-free urban conditions in Almaty, Kazakhstan. Sci. Total Environ. 2020, 730, 139179. [Google Scholar] [CrossRef]
- Otmani, A.; Benchrif, A.; Tahri, M.; Bounakhla, M.; Chakir, E.M.; El Bouch, M.; Krombi, M. Impact of COVID-19 lockdown on PM10, SO2 and NO2 concentrations in Salé City (Morocco). Sci. Total Environ. 2020, 735, 139541. [Google Scholar] [CrossRef]
- Khan, R.; Kumar, K.R.; Zhao, T. The Impact of Lockdown on Air Quality in Pakistan during the COVID-19 Pandemic Inferred from the Multi-sensor Remote Sensed Data. Aerosol Air Qual. Res. 2021, 21, 200597. [Google Scholar] [CrossRef]
- Gupta, A.; Bherwani, H.; Gautam, S.; Anjum, S.; Musugu, K.; Kumar, N.; Anshul, A.; Kumar, R. Air pollution aggravating COVID-19 lethality? Exploration in Asian cities using statistical models. Environ. Dev. Sustain. 2020, 23, 6408–6417. [Google Scholar] [CrossRef]
- Bherwani, H.; Nair, M.; Musugu, K.; Gautam, S.; Gupta, A.; Kapley, A.; Kumar, R. Valuation of air pollution externalities: Comparative assessment of economic damage and emission reduction under COVID-19 lockdown. Air Qual. Atmos. Health 2020, 13, 683–694. [Google Scholar] [CrossRef]
- Mor, S.; Kumar, S.; Singh, T.; Dogra, S.; Pandey, V.; Ravindra, K. Impact of COVID-19 lockdown on air quality in Chandigarh, India: Understanding the emission sources during controlled anthropogenic activities. Chemosphere 2020, 263, 127978. [Google Scholar] [CrossRef]
- Biswal, A.; Singh, T.; Singh, V.; Ravindra, K.; Mor, S. COVID-19 lockdown and its impact on tropospheric NO2 concentrations over India using satellite-based data. Heliyon 2020, 6, e04764. [Google Scholar] [CrossRef]
- Xu, K.; Cui, K.; Young, L.; Hsieh, Y.; Wang, Y.; Zhang, J.; Wan, S. Impact of the COVID-19 event on air quality in Central China. Aerosol Air Qual. Res. 2020, 20, 915–929. [Google Scholar] [CrossRef] [Green Version]
- Rajesh, T.A.; Ramachandran, S. Assessment of the coronavirus disease 2019 (COVID-19) pandemic imposed lockdown and unlock effects on black carbon aerosol, its source apportionment, and aerosol radiative forcing over an urban city in India. Atmos. Res. 2021, 267, 105924. [Google Scholar] [CrossRef] [PubMed]
- Gautam, S. The influence of COVID-19 on air quality in India: A boon or inutile. Bull. Environ. Contam. Toxicol. 2020, 104, 724–726. [Google Scholar] [CrossRef] [PubMed]
- Gautam, S. COVID-19: Air pollution remains low as people stay at home. Air Qual. Atmos. Health 2020, 13, 853–857. [Google Scholar] [CrossRef] [PubMed]
- Jethva, H.; Satheesh, S.K.; Srinivasan, J. Seasonal variability of aerosols over the Indo-Gangetic basin. J. Geophys. Res. 2005, 110, 1–15. [Google Scholar] [CrossRef]
- Dey, S.; Tripathi, S.N.; Singh, R.P.; Holben, B.N. Influence of dust storms on the aerosol optical properties over the Indo-Gangetic plains. J. Geophys. Res. 2004, 109, D20211. [Google Scholar] [CrossRef] [Green Version]
- Ambade, B.; Sankar, T.K.; Gupta, M.; Sahu, L.K.; Gautam, S. A comparative study in black carbon concentration and its emission sources in tribal area. Water Air Soil Pollut. 2023, 234, 173. [Google Scholar] [CrossRef]
- Srivastava, A.K.; Dey, S.; Tripathi, S.N. Aerosol characteristics over the Indo-Gangetic Basin: Implications to regional climate. In Atmospheric Aerosols-Regional Characteristics-Chemistry and Physics; Abdul-Razzak, H., Ed.; Texas A&M University: Kingsville, TX, USA, 2012. [Google Scholar] [CrossRef] [Green Version]
- Kaskaoutis, D.G.; Singh, R.P.; Gautam, R.; Sharma, M.; Kosmopoulos, P.G.; Tripathi, S.N. Variability and trends of aerosol properties over Kanpur, northern India using AERONET data. Environ. Res. Lett. 2012, 7, 024003. [Google Scholar] [CrossRef] [Green Version]
- Levy, R.C.; Remer, L.A.; Tanré, D.; Mattoo, S.; Kaufman, Y.J. Algorithm for remote sensing of tropospheric aerosol over dark targets from MODIS: Collection 005 and 051: Revision 2. In MODIS Algorithm Theoretical Basis Document; GSFC/NASA: Greenbelt, MD, USA, 2009; Volume 20771, p. 96. [Google Scholar]
- Hama, S.M.L.; Kumar, P.; Harrison, R.M.; Bloss, W.J.; Khare, M.; Mishra, S.; Sharma, C. Four-year assessment of ambient particulate matter and trace gases in the Delhi-NCR region of India. Sustain. Cities Soc. 2020, 54, 102003. [Google Scholar] [CrossRef]
- Kant, Y.; Mitra, D.; Chauhan, P. Space-based observations on the impact of COVID-19-induced lockdown on aerosols over India. Curr. Sci. 2020, 119, 539–544. [Google Scholar] [CrossRef]
Figure 1.
Selected study regions indicated on a map of India: A—Ahmedabad; D—Delhi; L—Lucknow; P—Patna.
Figure 1.
Selected study regions indicated on a map of India: A—Ahmedabad; D—Delhi; L—Lucknow; P—Patna.

Figure 2.
AOD over the Ahmedabad region: (a) AOD daily average values during 2015–2020; (b) AOD daily averages during the study period compared to the 2010–2019 period; (c) AOD weekly average compared to the 2010–2019 period; (d) AOD average and standard deviation during the different stages of lockdown.

Figure 3.
(a) Hysplit trajectories on representative days during the L1 and L2 periods. (b) Daily averages of specific humidity at Ahmedabad during 1 March 2020 to 31 May 2022.
Figure 3.
(a) Hysplit trajectories on representative days during the L1 and L2 periods. (b) Daily averages of specific humidity at Ahmedabad during 1 March 2020 to 31 May 2022.

Figure 4.
AOD in the Ahmedabad region and over the IGP regions: (a) daily variation; (b) weekly changes; (c) during different phases of lockdown.
Figure 4.
AOD in the Ahmedabad region and over the IGP regions: (a) daily variation; (b) weekly changes; (c) during different phases of lockdown.

Figure 5.
Area-averaged AE over the Ahmedabad region and IGP regions: (a) daily variation; (b) weekly variation; (c) during different phases of lockdown.
Figure 5.
Area-averaged AE over the Ahmedabad region and IGP regions: (a) daily variation; (b) weekly variation; (c) during different phases of lockdown.

Figure 6.
PM2.5 and PM10 at Ahmedabad and over the IGP: (a,b) daily variation; (c,d) weekly variation; (e,f) during different phases of lockdown.
Figure 6.
PM2.5 and PM10 at Ahmedabad and over the IGP: (a,b) daily variation; (c,d) weekly variation; (e,f) during different phases of lockdown.

Figure 7.
(a) Time series for the PM2.5/PM10 ratio during lockdown; (b) the PM2.5/PM10 ratio during different stages of lockdown.
Figure 7.
(a) Time series for the PM2.5/PM10 ratio during lockdown; (b) the PM2.5/PM10 ratio during different stages of lockdown.


Table 1.
Location of study region and data utilized.
| Regions | AOD Data | PM Data | |
|---|---|---|---|
| Latitude | Longitude | ||
| Ahmedabad | 22–24° N | 72–73° E | Maninagar, Gandhinagar, Vatva. |
| Delhi | 28–29° N | 76–78° E | Ashok Vihar, CRRI Mathura Road, Aya Nagar, Bawana, Alipur |
| Lucknow | 26–27° N | 80–82° E | Gomti Nagar, Central School; Lalbaugh, Talkatora |
| Patna | 25–26° N | 84–86° E | Muradpur, Rajhansi Nagar |
Table 2.
Changes in different parameters during L1 and FL with reference to PL (percentage changes are mentioned in parenthesis).
Table 2.
Changes in different parameters during L1 and FL with reference to PL (percentage changes are mentioned in parenthesis).
| AOD | AE | PM2.5 | PM10 | |||||||||
|---|---|---|---|---|---|---|---|---|---|---|---|---|
| Region | PL | L1 | FL | PL | L1 | FL | PL | L1 | FL | PL | L1 | FL |
| Ahmedabad | 0.31 | 0.22 (−29) | 0.26 (−16) | 0.96 | 1.16 (21) | 1.27 (32) | 46.1 | 29.3 (−36) | 28.4 (−38) | 112.5 | 70.4 (−37) | 71.8 (−36) |
| Delhi | 0.66 | 0.31 (−53) | 0.48 (−27) | 1.54 | 1.13 (−27) | 0.83 (−46) | 67.5 | 42.6 (−37) | 52.9 (−22) | 138.1 | 91.1 (−34) | 122.2 (−12) |
| Lucknow | 0.63 | 0.28 (−56) | 0.50 (−21) | 1.41 | 1.17 (−17) | 1.04 (−26) | 68.9 | 49.9 (−28) | 54.6 (−21) | |||
| Patna | 0.61 | 0.34 (−44) | 0.55 (−10) | 1.58 | 1.20 (−24) | 1.21 (−23) | 60.8 | 40.7 (−33) | 45.3 (−26) | 130.4 | 120.2 (−8) | 107.7 (−17) |
Disclaimer/Publisher’s Note: The statements, opinions and data contained in all publications are solely those of the individual author(s) and contributor(s) and not of MDPI and/or the editor(s). MDPI and/or the editor(s) disclaim responsibility for any injury to people or property resulting from any ideas, methods, instructions or products referred to in the content. |
© 2023 by the authors. Licensee MDPI, Basel, Switzerland. This article is an open access article distributed under the terms and conditions of the Creative Commons Attribution (CC BY) license (https://creativecommons.org/licenses/by/4.0/).
Share and Cite
MDPI and ACS Style
Vaghmaria, N.; ME, J.; Gautam, A.S.; Gautam, S. Impact of Lockdown on Column and Surface Aerosol Content over Ahmedabad and a Comparison with the Indo-Gangetic Plain. Earth 2023, 4, 278-295. https://doi.org/10.3390/earth4020015
AMA Style
Vaghmaria N, ME J, Gautam AS, Gautam S. Impact of Lockdown on Column and Surface Aerosol Content over Ahmedabad and a Comparison with the Indo-Gangetic Plain. Earth. 2023; 4(2):278-295. https://doi.org/10.3390/earth4020015
Chicago/Turabian StyleVaghmaria, Nisha, James ME, Alok Sagar Gautam, and Sneha Gautam. 2023. "Impact of Lockdown on Column and Surface Aerosol Content over Ahmedabad and a Comparison with the Indo-Gangetic Plain" Earth 4, no. 2: 278-295. https://doi.org/10.3390/earth4020015