
Using Wearable Accelerometers in a Community Service Context to Categorize Falling Behavior


Abstract
:
1. Introduction
2. Materials and Methods
2.1. General Approach
2.2. Study Population
2.3. Clinical Test
- Short Form Berg Balance Scale (SFBBS) is used to assess balance. It is a simplified version of the Berg Balance Scale (BBS) [36] and contains seven activities: (a) getting in and out of a chair, sitting unsupported, and transferring from a bed to a chair; (b) continuous standing with feet together, feet apart, and with eyes closed; (c) turning to each side and turning 360 degrees; (d) reaching forward; (e) picking up an object from the floor; (f) tandem and unilateral stance; and (g) dynamic weight shifting. Compared to BBS, only half the time (about 10 min) was required to complete all activities. This scale scored individuals based on their performance in each activity: inability to perform the activity scored 0 points, inability to complete 50% of the activity scored 2 points, and ability to complete the activity scored 4 points, with a total score of 28 points.
- Timed Up and Go test (TUG) is used to evaluate gait ability. The TUG test is a well-known clinical test of mobility and fall risk [17]. It is a commonly used screening tool for falls risk in the inpatient and community setting [37]. The Up and Go test, a predecessor of the TUG was introduced by Mathias et al. [38], where multiple components of the test are scored by an observer. Podsiadlo and Richardson [10] introduced the timed version of the test; for the assessment, chair legs are aligned with the reference line starting point and a triangular pyramid is placed 3 m in front of the reference line. The subjects are asked to sit on the chair with knees naturally bent and are not allowed to place the feet on or outside the reference line. The subjects are then asked to stand up in a comfortable way, walk straight ahead for 3 meters, then return to the original place and sit down. In this study, we used the timed version to enhance the objectivity of the test.
- The Short Portable Mental Status Questionnaire (SPMSQ) focuses on cognitive functions. This scale has 10 questions from six dimensions to evaluate consciousness, memory, orientation, attention, thinking process, and general knowledge, to obtain a preliminary understanding of the state of mental health of the elderly individual. Simple mental status questionnaires are conducted and the measuring method is simple. The elderly individual can either complete the questionnaires on their own or ask for help from their family members to perform a preliminary screen for dementia. A clinical diagnosis of dementia risk is when an individual has incorrectly answered three or more questions. Fischer et al. [39] used SPMSQ and found that declining cognition is associated with the performance of mobility activities in an unsafe manner, thereby increasing the risk of falling. Lin et al. [40] also used SPMSQ for falls among community-dwelling elderly assessed in annual geriatric health examinations.
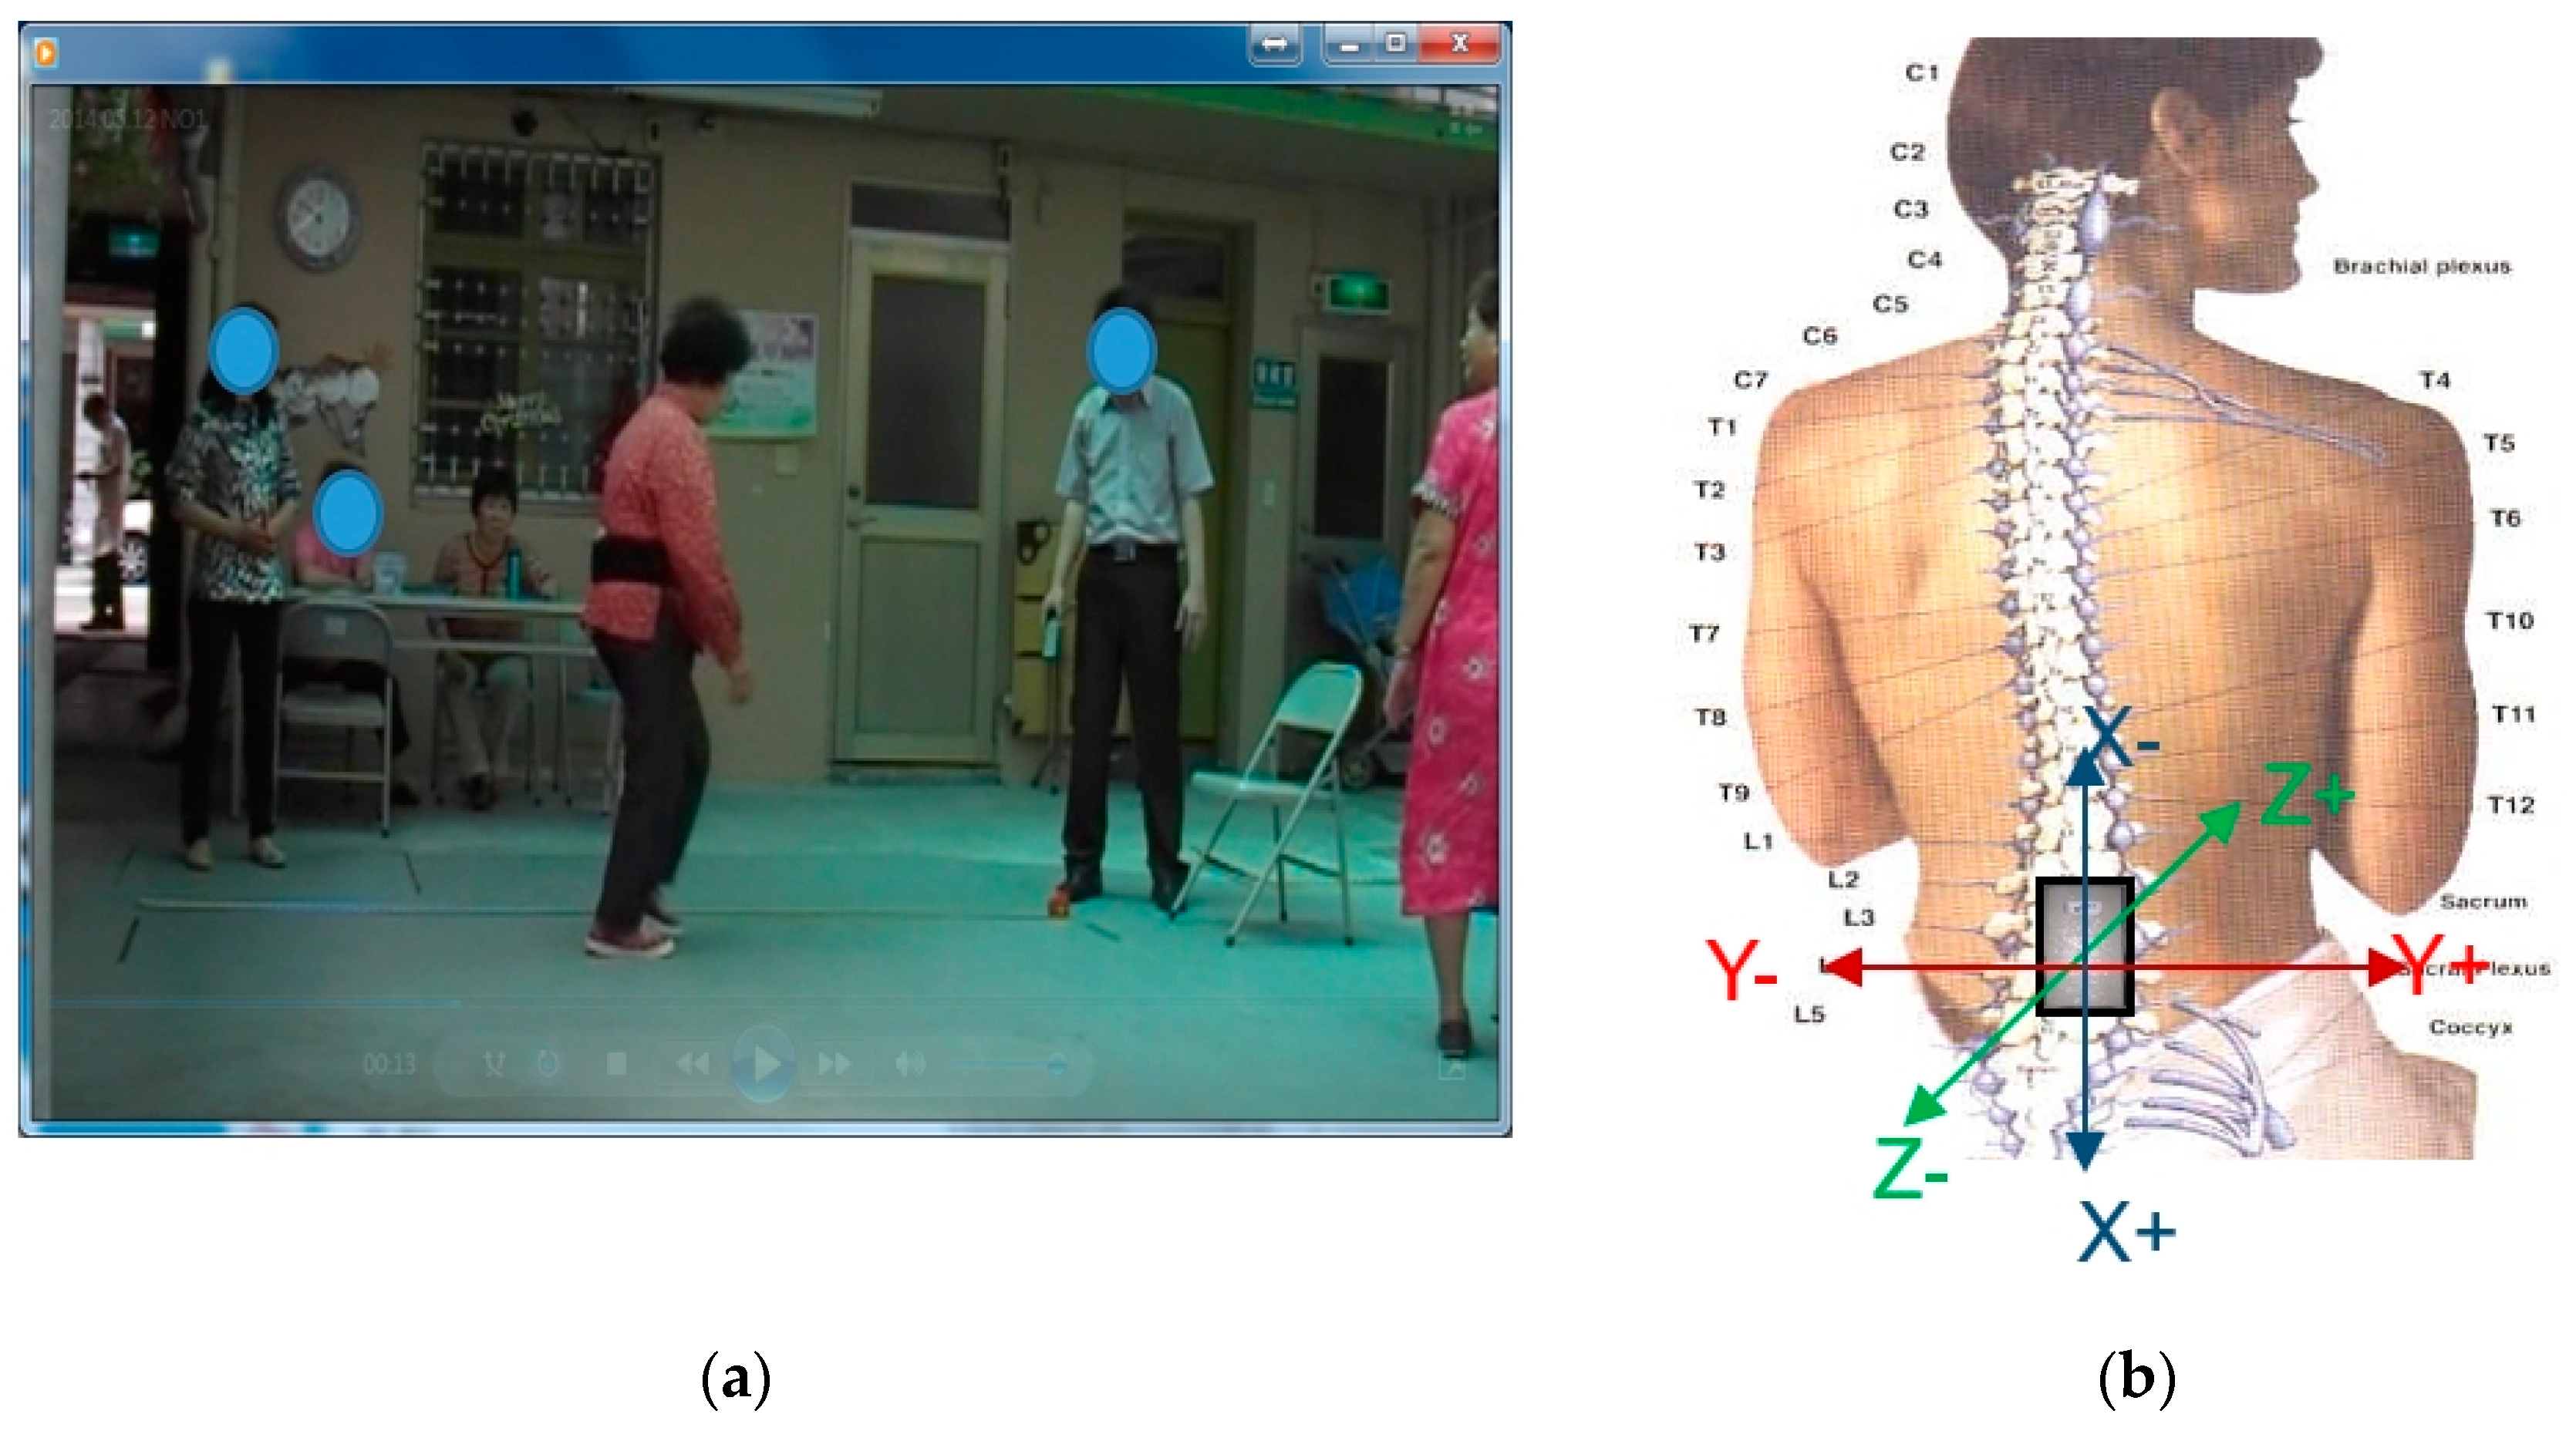
2.4. Wearable Accelerometer
2.5. Features Extracted from Accelerometers
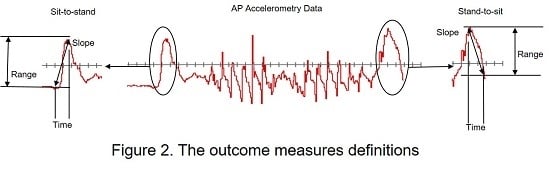
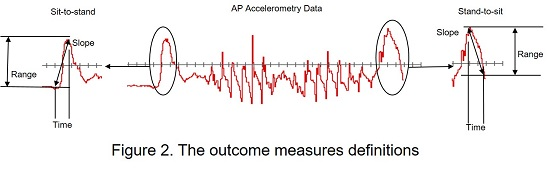
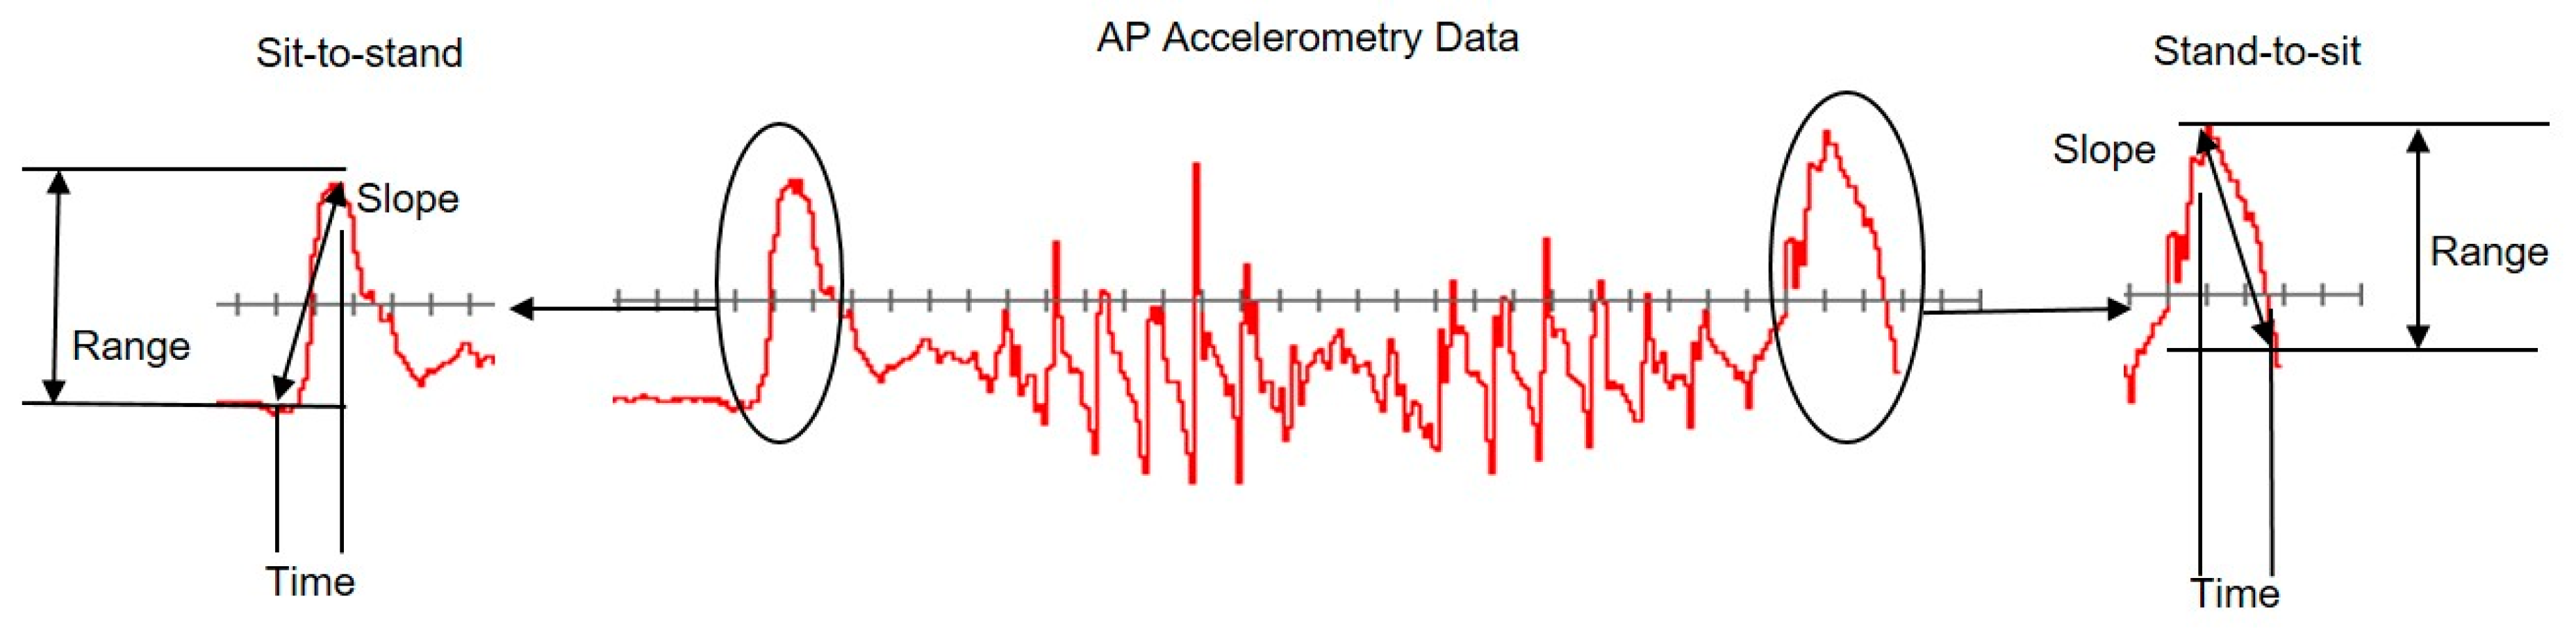
- Slope (Jerk): Linear fit of the acceleration data in the Sit-to-Stand and Stand-to-Sit stages of the TUG and represents the rate of change in acceleration.
- Range: Difference between the maximum and minimum acceleration values in the Sit-to-Stand or the Stand-to-Sit aspect of the TUG.
- Time: Sit-to-Stand and Stand-to-Sit accelerometer derived duration.
- Statistics: Sit-to-Stand and Stand-to-Sit mean, median, and standard deviation (SD).
- No. of steps and average step length: Gait regularity variables can discriminate between faller and non-faller populations. The analysis of gait regularity is pertinent in early detection of gait degradation.
- Statistics: Mean (Mean AP), SD (standard deviation AP) calculated from points 1–6.
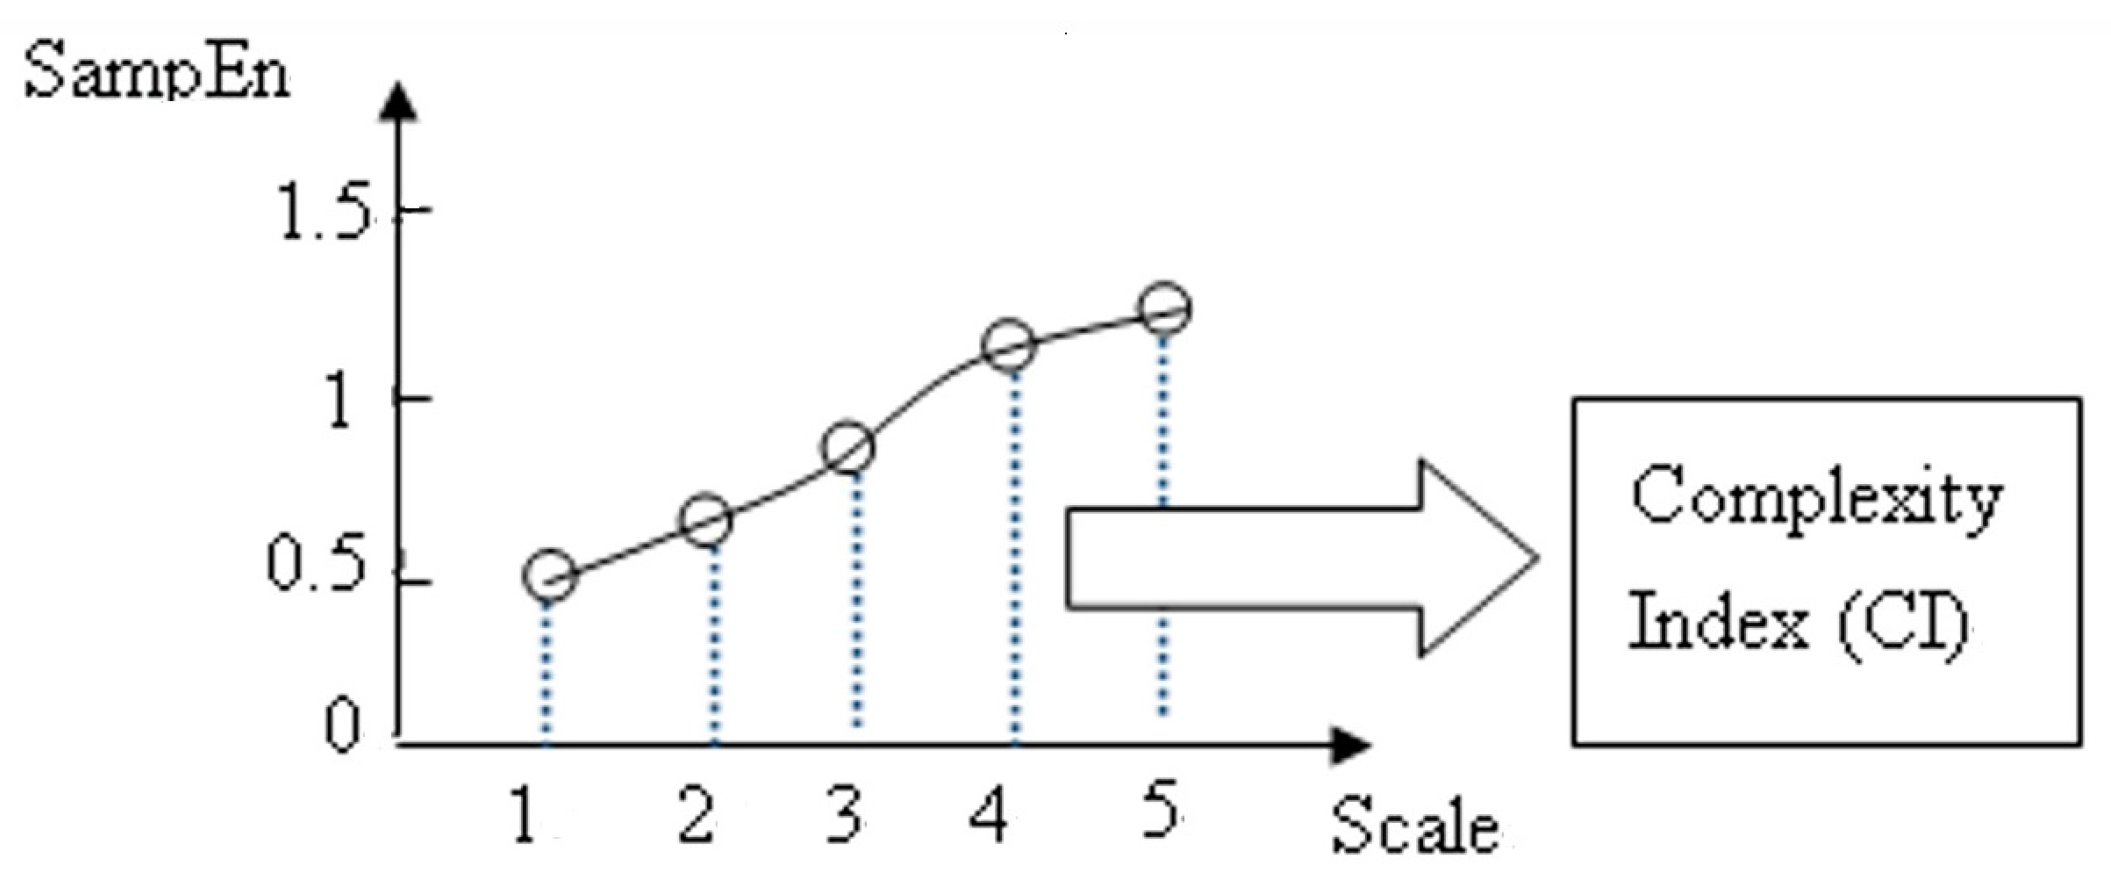
2.6. Multiscale Entropy (MSE)
- Coarse-graining process: the coarse-graining process is intended to divide time series into different time scales to calculate entropy for different time and space scales. Figure 4 shows the process of coarse-graining. xi is the original time series data point; Scale 1 is the original time series; Scale 2 is the average of two points on the original time series, which becomes the time series of Scale 2, and so on. The calculation formula of each scale is shown as formula (1), with y being the data point, τ being the scale of segmentation, and N being the size of the original dataset.
- Sample Entropy: After using of Coarse-graining process to obtain time series for different time scales, you can calculate the time series individually for sample entropy. The sample entropy calculation process is as follows:Step 1: Set the data comparison number m and threshold value r. m is usually set to 2 or 3, while r is usually set at 0.25.Step 2: Take m X data points in the time series data as the comparison benchmark. For example, for time series X = (x1, …, x7) , when data comparison number m = 2, the comparison unit group is . For the first time compare (x1, x2) with the other five unit groups. For the second time point, compare (x2, x3) with the other four unit groups.Step 3: When forming comparisons, calculate the maximum difference in the comparison group. The calculation method follows formula (2):Step 4: Compare the calculated with r × S. where S is the standard difference of original time series data point. If is smaller than r × S, then the two comparison groups are similar. In addition, add 1 to the accumulated similar number ni(m), and calculate the occurrence probability of similar number Ci(m) after all comparison processes are completed. The calculation method follows formula (3).Step 5: Return to step 1 and change the original comparison number m to m+1, repeat step 2 to step 3 and obtain the accumulated similar number ni(m) and the occurrence probability of the similar number Ci(m+1). The calculation method follows formula (4):Step 6: Take the average of all occurrence probabilities of the similar number Ci(m) with the comparison number m as the denominator, take the average of the occurrence probability of the similar number Ci(m+1) with the comparison number m + 1 as the numerator, and take the natural logarithm and negative value as the sample entropy. The calculation formula follows (5):
- Complexity Index (CI): We can plot SampEn as a function of the scale factor to calculate the area under the CI, as shown in Figure 5. The grey area under the black curve represents the complexity Index (CI). The calculation method follows formula (6):
3. Results and Discussion
4. Conclusions
Acknowledgments
Author Contributions
Conflicts of Interest
References
- Lin, Y. Relative Contribution of Mobility and Cognition to Falls and Fear of Falling in Cognitive Impaired Older Adults. Master’s Thesis, National Taiwan University, Taipei, Taiwan, 2014. [Google Scholar]
- Tinetti, M.E.; Speechley, M.; Ginter, S.F. Risk factors for falls among elderly persons living in the community. N. Engl. J. Med. 1988, 319, 1701–1707. [Google Scholar] [CrossRef] [PubMed]
- Cheng, I.C. Biomechanical Comparisons of Lower Limb Muscle Power among Healthy Elderly, Falling Elderly and Young Adults during Performing Sit-to-Stand and Squatting Movement. Master’s Thesis, National Yang-Ming University, Taipei, Taiwan, 2008. [Google Scholar]
- Sattin, R.W.; Lambert Huber, D.A.; Devito, C.A.; Rodriguez, J.G.; Ros, A.; Bacchelli, S.; Stevens, J.A.; Waxweiler, R.J. The incidence of fall injury events among the elderly in a defined population. Am. J. Epidemiol. 1990, 131, 1028–1037. [Google Scholar] [PubMed]
- Luo, Z.Q. Design and Development of a Portable Fall Risk Assessment System. Master’s Thesis, Southern Taiwan University, Tainan, Taiwan, 2012. [Google Scholar]
- Graafmans, W.C.; Ooms, M.E.; Hofstee, H.M.A.; Bezemer, P.D.; Bouter, L.M.; Lips, P. Falls in the elderly: A prospective study of risk factors and risk profiles. Am. J. Epidemiol. 1996, 143, 1129–1136. [Google Scholar] [CrossRef] [PubMed]
- Kiely, D.K.; Kiel, D.P.; Burrows, A.B.; Lipsitz, L.A. Identifying nursing home residents at risk for falling. J. Am. Geriatr. Soc. 1998, 46, 551–555. [Google Scholar] [CrossRef] [PubMed]
- Rubenstein, A.J.; Langlois, J.H.; Roggman, L.A. What Makes a Face Attractive and Why: The Role of Averageness in Defining Facial Beauty. In Facial Attractiveness, Advances in Visual Cognition; Rhodes, G., Zebrowitz, L., Eds.; Ablex: New York, NY, USA, 2002; Volume 1, pp. 1–33. [Google Scholar]
- Li, Z.Y.; Lu, F.P.; Chan, D.C. Risk Factors, Evaluation and Prevention of Falls in Older Adults. Taiwan Soc. Intern. Med. 2014, 25, 137–142. [Google Scholar]
- Podsiadlo, D.; Richardson, S. The Timed “Up & Go”: A Test of Basic Functional Mobility for Frail Elderly Persons. J. Am. Geriatr. Soc. 1991, 39, 142–148. [Google Scholar] [PubMed]
- Chou, C.Y.; Chien, C.W.; Hsueh, I.P.; Sheu, C.F.; Wang, C.H.; Hsieh, C.L. Developing a short form of the Berg Balance Scale for people with stroke. Phys. Ther. 2006, 86, 195–204. [Google Scholar] [PubMed]
- Howcroft, J.; Kofman, J.; Lemaire, E.D. Review of fall risk assessment in geriatric populations using inertial sensors. J. Neuroeng. Rehabil. 2013, 10. [Google Scholar] [CrossRef] [PubMed]
- Tamura, T. Wearable accelerometer in clinical use. In Proceedings of 27th Annual International Conference of the IEEE Engineering in Medicine and Biology Society, Shanghai, China, 1–4 September 2005.
- Kulkarni, S.; Basu, M.A. Review on Wearable Tri-Axial Accelerometer Based Fall Detectors. J. Biomed. Eng. Technol. 2013, 1, 36–39. [Google Scholar]
- Marschollek, M.; Rehwald, A.; Wolf, K.H.; Gietzelt, M.; Nemitz, G.; Meyer, Z.; Schwabedissen, H.; Haux, R. Sensor-based fall risk assessment-an expert ‘to go’. Methods Inf. Med. 2011, 50, 420–426. [Google Scholar] [CrossRef] [PubMed]
- Lee, Y.C. The Study of Physical Activity Evaluation for Elderly People. Master’s Thesis, National Yang-Ming University, Taipei, Taiwan, 2010. [Google Scholar]
- Weiss, A.; Herman, T.; Plotnik, M.; Brozgol, M.; Maidan, I.; Giladi, N.; Gurevich, T.; Hausdorff, J.M. Can an accelerometer enhance the utility of the Timed Up & Go Test when evaluating patients with Parkinson’s disease? Med. Eng. Phys. 2010, 32, 119–125. [Google Scholar] [PubMed]
- Najafi, B.; Aminian, K.; Loew, F.; Blanc, Y.; Robert, P.A. Measurement of stand-sit and sit-stand transitions using a miniature gyroscope and its application in fall risk evaluation in the elderly. IEEE Trans. Biomed. Eng. 2002, 49, 843–851. [Google Scholar] [CrossRef] [PubMed]
- Godfrey, A.; Conway, R.; Meagher, D.; Ólaighin, G. Direct measurement of human movement by accelerometry. Med. Eng. Phys. 2008, 30, 1364–1386. [Google Scholar] [CrossRef] [PubMed]
- Culhane, K.M.; O’Connor, M.; Lyons, D.; Lyons, G.M. Accelerometers in rehabilitation medicine for older adults. Age Ageing 2005, 34, 556–560. [Google Scholar] [CrossRef] [PubMed]
- Bourke, R.; Holden, B.; Curzon, J. Using Evidence to Challenge Practice: A Discussion Paper; Ministry of Education: Wellington, New Zealand, 2005.
- Mathie, M.J.; Coster, A.C.; Lovell, N.H.; Celler, B.G. Accelerometry: Providing an integrated, practical method for long-term, ambulatory monitoring of human movement. Physiol. Meas. 2004, 25, R1–R20. [Google Scholar] [CrossRef] [PubMed]
- Welk, G.J.; Schaben, J.A.; Morrow, J.R. Reliability of accelerometry-based activity monitors: A generalizability study. Med. Sci. Sports Exerc. 2004, 36, 1637–1645. [Google Scholar] [PubMed]
- Horak, F.B.; Mancini, M. Objective biomarkers of balance and gait for Parkinson's disease using body-worn sensors. Mov. Disord. 2013, 28, 1544–1551. [Google Scholar] [CrossRef] [PubMed]
- Bautmans, I.; Jansen, B.; van Keymolen, B.; Mets, T. Reliability and clinical correlates of 3D-accelerometry based gait analysis outcomes according to age and fall-risk. Gait Posture 2011, 33, 366–372. [Google Scholar] [CrossRef] [PubMed]
- Caby, B.; Kieffer, S.; Hubert, M.S.; Cremer, G.; Macq, B. Feature extraction and selection for objective gait analysis and fall risk assessment by accelerometry. Biomed. Eng. Online 2011, 10. [Google Scholar] [CrossRef] [PubMed]
- Ishigaki, N.; Kimura, T.; Usui, Y.; Aoki, K.; Narita, N.; Shimizu, M.; Hara, K.; Ogihara, N.; Nakamura, K.; Kato, H.; et al. Analysis of pelvic movement in the elderly during walking using a posture monitoring system equipped with a triaxial accelerometer and a gyroscope. J. Biomech. 2011, 44, 1788–1792. [Google Scholar] [CrossRef] [PubMed]
- Pincus, S.M. Approximate entropy as a measure of system complexity. Proc. Natl. Acad. Sci. USA 1991, 88, 2297–2301. [Google Scholar] [CrossRef] [PubMed]
- Pincus, S.M.; Goldberger, A.L. Physiological time-series analysis: What does regularity quantify? Am. J. Physiol. 1994, 266, H1643–H1656. [Google Scholar] [PubMed]
- Costa, M.; Goldberger, A.L.; Peng, C.K. Multiscale Entropy Analysis of Complex Physiologic Time Series. Phys. Rev. Lett. 2002, 89, 068102. [Google Scholar] [CrossRef] [PubMed]
- Costa, M.; Goldberger, A.L.; Peng, C.K. Multiscale entropy analysis of biological signals. Phys. Rev. E 2005, 71, 021906. [Google Scholar] [CrossRef] [PubMed]
- Tsai, S.C. Analysis of Postural Sway Dynamics Using Multi Scale Entropy and Iterative Gaussian Filter. Master’s Thesis, National Taiwan Normal University, Taipei, Taiwan, 2010. [Google Scholar]
- Rosso, O.A.; Martin, M.T.; Plastino, A. Brain electrical activity analysis using wavelet-based informational tools (II): Tsallis non-extensivity and complexity measures. Phys. A 2003, 320, 497–511. [Google Scholar] [CrossRef]
- Escudero, J.; Abasolo, D.; Hornero, R.; Espino, P.; Lopez, M. Analysis of electroencephalograms in Alzheimer’s disease patients with multiscale entropy. Physiol. Meas. 2006, 27, 1091–1106. [Google Scholar] [CrossRef] [PubMed]
- Pfeiffer, E.A. Short portable mental status questionnaire for the assessment of organic brain deficit in elderly patients. J. Am. Geriatr. Soc. 1975, 23, 433–441. [Google Scholar] [CrossRef]
- Berg, K.; Wood-Dauphinee, S.; Williams, J.I. The Balance Scale: reliability assessment with elderly residents and patients with an acute stroke. Scand. J. Rehabil. Med. 1995, 27, 27–36. [Google Scholar] [PubMed]
- Barry, E.; Galvin, R.; Keogh, C.; Horgan, F.; Fahey, T. Is the Timed Up and Go test a useful predictor of risk of falls in community dwelling older adults: A systematic review and meta-analysis. BMC geriatr. 2014, 14. [Google Scholar] [CrossRef] [PubMed]
- Mathias, S.; Nayak, U.S.; Isaacs, B. Balance in elderly patients: The “get-up and go” test. Arch. Phys. Med. Rehabil. 1986, 67, 387–389. [Google Scholar] [PubMed]
- Fischer, B.L.; Gleason, C.E.; Gangnon, R.E.; Janczewski, J.; Shea, T.; Mahoney, J.E. Declining cognition and falls: role of risky performance of everyday mobility activities. Phys. Ther. 2014, 94, 355–362. [Google Scholar] [CrossRef] [PubMed]
- Lin, C.H.; Liao, K.C.; Pu, S.J.; Chen, Y.C.; Liu, M.S. Associated factors for falls among the community-dwelling older people assessed by annual geriatric health examinations. PLoS ONE 2011, 6, e18976. [Google Scholar] [CrossRef] [PubMed]
- Moe-Nilssen, R. A new method for evaluating motor control in gait under real life environmental conditions. Part 1: The instrument. Clin. Biomech. 1998, 13, 320–327. [Google Scholar] [CrossRef]
- Karthikeyan, G.; Sheikh, S.G.; Chippala, P. Test-Retest Reliability of Short Form of Berg Balance Scale in Elderly People. Glob. Adv. Res. J. 2012, 1, 139–144. [Google Scholar]
- Kim, S.G.; Kim, M.K. The intra- and inter-rater reliabilities of the Short Form Berg Balance Scale in institutionalized elderly people. J. Phys. Ther. Sci. 2015, 27, 2733–2734. [Google Scholar] [CrossRef] [PubMed]
- İlçin, N.; Gürpınar, B.; Bayraktar, D.; Savcı, S.; Çetin, P.; Sarı, İ.; Akkoç, N. Cross-cultural adaptation and validation of the Turkish version of the pain catastrophizing scale among patients with ankylosing spondylitis. J. Phys. Ther. Sci. 2016, 28, 298–303. [Google Scholar] [CrossRef] [PubMed]
- Li, Z.; Liang, Y.Y.; Wang, L.; Sheng, J.; Ma, S.J. Reliability and validity of center of pressure measures for balance assessment in older adults. J. Phys. Ther. Sci. 2016, 28, 1364–1367. [Google Scholar] [CrossRef] [PubMed]
- Shumway-Cook, A.; Brauer, S.; Woollacott, M. Predicting the probability for falls in community dwelling older adults using the Timed Up and Go test. Phys. Ther. 2000, 80, 896–903. [Google Scholar] [PubMed]
- Lindsay, R.; James, E.L.; Kippen, S. The Timed Up and Go Test: Unable to predict falls on the acute medical ward. Aust. J. Physiother. 2004, 50, 249–251. [Google Scholar] [CrossRef]
- Kwoka, B.C.; Clarkb, R.A.; Pua, Y.H. Novel use of the Wii Balance Board to prospectively predict falls in community-dwelling older adults. Clin. Biomech. 2015, 30, 481–484. [Google Scholar] [CrossRef] [PubMed]
- Tiedemann, A.; Shimada, H.; Sherrington, C.; Murray, S.; Lord, S. The comparative ability of eight functional mobility tests for predicting falls in community-dwelling older people. Age Ageing 2008, 37, 430–435. [Google Scholar] [CrossRef] [PubMed]
- Manckoundia, P.; Mourey, F.; Pfitzenmeyer, P.; Papaxanthis, C. Comparison of motor strategies in sit-to-stand and back-to-sit motions between healthy and Alzheimer’s disease elderly subjects. Neuroscience 2006, 137, 385–392. [Google Scholar] [CrossRef] [PubMed]
- Hong, C.H.; Jiang, B.C. Multi-scale entropy approach to physiological fatigue during long-term Web browsing. Hum. Factor Ergon. Manuf. Serv. Ind. 2009, 19, 478–493. [Google Scholar] [CrossRef]
- Lee, C.H.; Sun, T.L. Multi-Scale Entropy Analysis of Body Sway for Investigating Balance Ability during Exergame Play under Different Parameter Settings. Entropy 2015, 17, 7608–7627. [Google Scholar] [CrossRef]
- Gao, J.B.; Hu, J.; Tung, W.W. Complexity measures of brain wave dynamics. Cogn. Neurodyn. 2011, 5, 171–182. [Google Scholar] [CrossRef] [PubMed]
- Jiang, B.C.; Yang, W.H.; Shieh, J.S.; Fan, J.S.Z.; Peng, C.K. Entropy-Based Method for COP Data Analysis. Theor. Issues Ergon. Sci. 2013, 14, 227–246. [Google Scholar] [CrossRef]
- Emery, C.A.; Cassidy, J.D.; Klassen, T.P.; Rosychuk, R.J.; Rowe, B.B. Development of a clinical static and dynamic standing balance measurement tool appropriate for use in adolescents. Phys. Ther. 2005, 85, 502–514. [Google Scholar] [PubMed]
- Manor, B.; Costa, M.D.; Hu, K.; Newton, E.; Starobinets, O.; Kang, H.G.; Peng, C.K.; Novak, V.; Lipsitz, L.A. Physiological complexity and system adaptability: Evidence from postural control dynamics of older adults. J. Appl. Phys. 2010, 109, 1786–1791. [Google Scholar] [CrossRef] [PubMed]
- Gruber, A.H.; Busa, M.A.; Gorton, G.E., III; van Emmerik, R.E.A.; Masso, P.D.; Hamill, J. Time-to-contact and multiscale entropy identify differences in postural control in adolescent idiopathic scoliosis. Gait Posture 2011, 34, 13–18. [Google Scholar] [CrossRef] [PubMed]
- Busa, M.A.; Gruber, A.H.; Gorton, G.E., III; Masso, P.D.; Hamill, J.; van Emmerik, R.E.A. Multiscale Entropy Identifies Complexity Changes in Postural Control of Adolescent Idopathic Scoliosis. In Proceedings of the 34th Annual International Conference of the American Society of Biomechanics, Providence, RI, USA, 18–21 August 2010.
- Duarte, M.; Sternad, D. Complexity of human postural control in young and older adults during prolonged standing. Exp. Brain Res. 2008, 191, 265–276. [Google Scholar] [CrossRef] [PubMed]


| Number | Average ± SD | ||
|---|---|---|---|
| Gender | Female | 49 | 77 ± 6.60 |
| Male | 16 | 73 ± 6.00 | |
| Age | 65–70 | 12 | 69 ± 1.72 |
| 71–75 | 25 | 73 ± 1.53 | |
| 76–80 | 12 | 78 ± 1.48 | |
| 80+ | 16 | 85 ± 4.60 | |
| Point | Description |
|---|---|
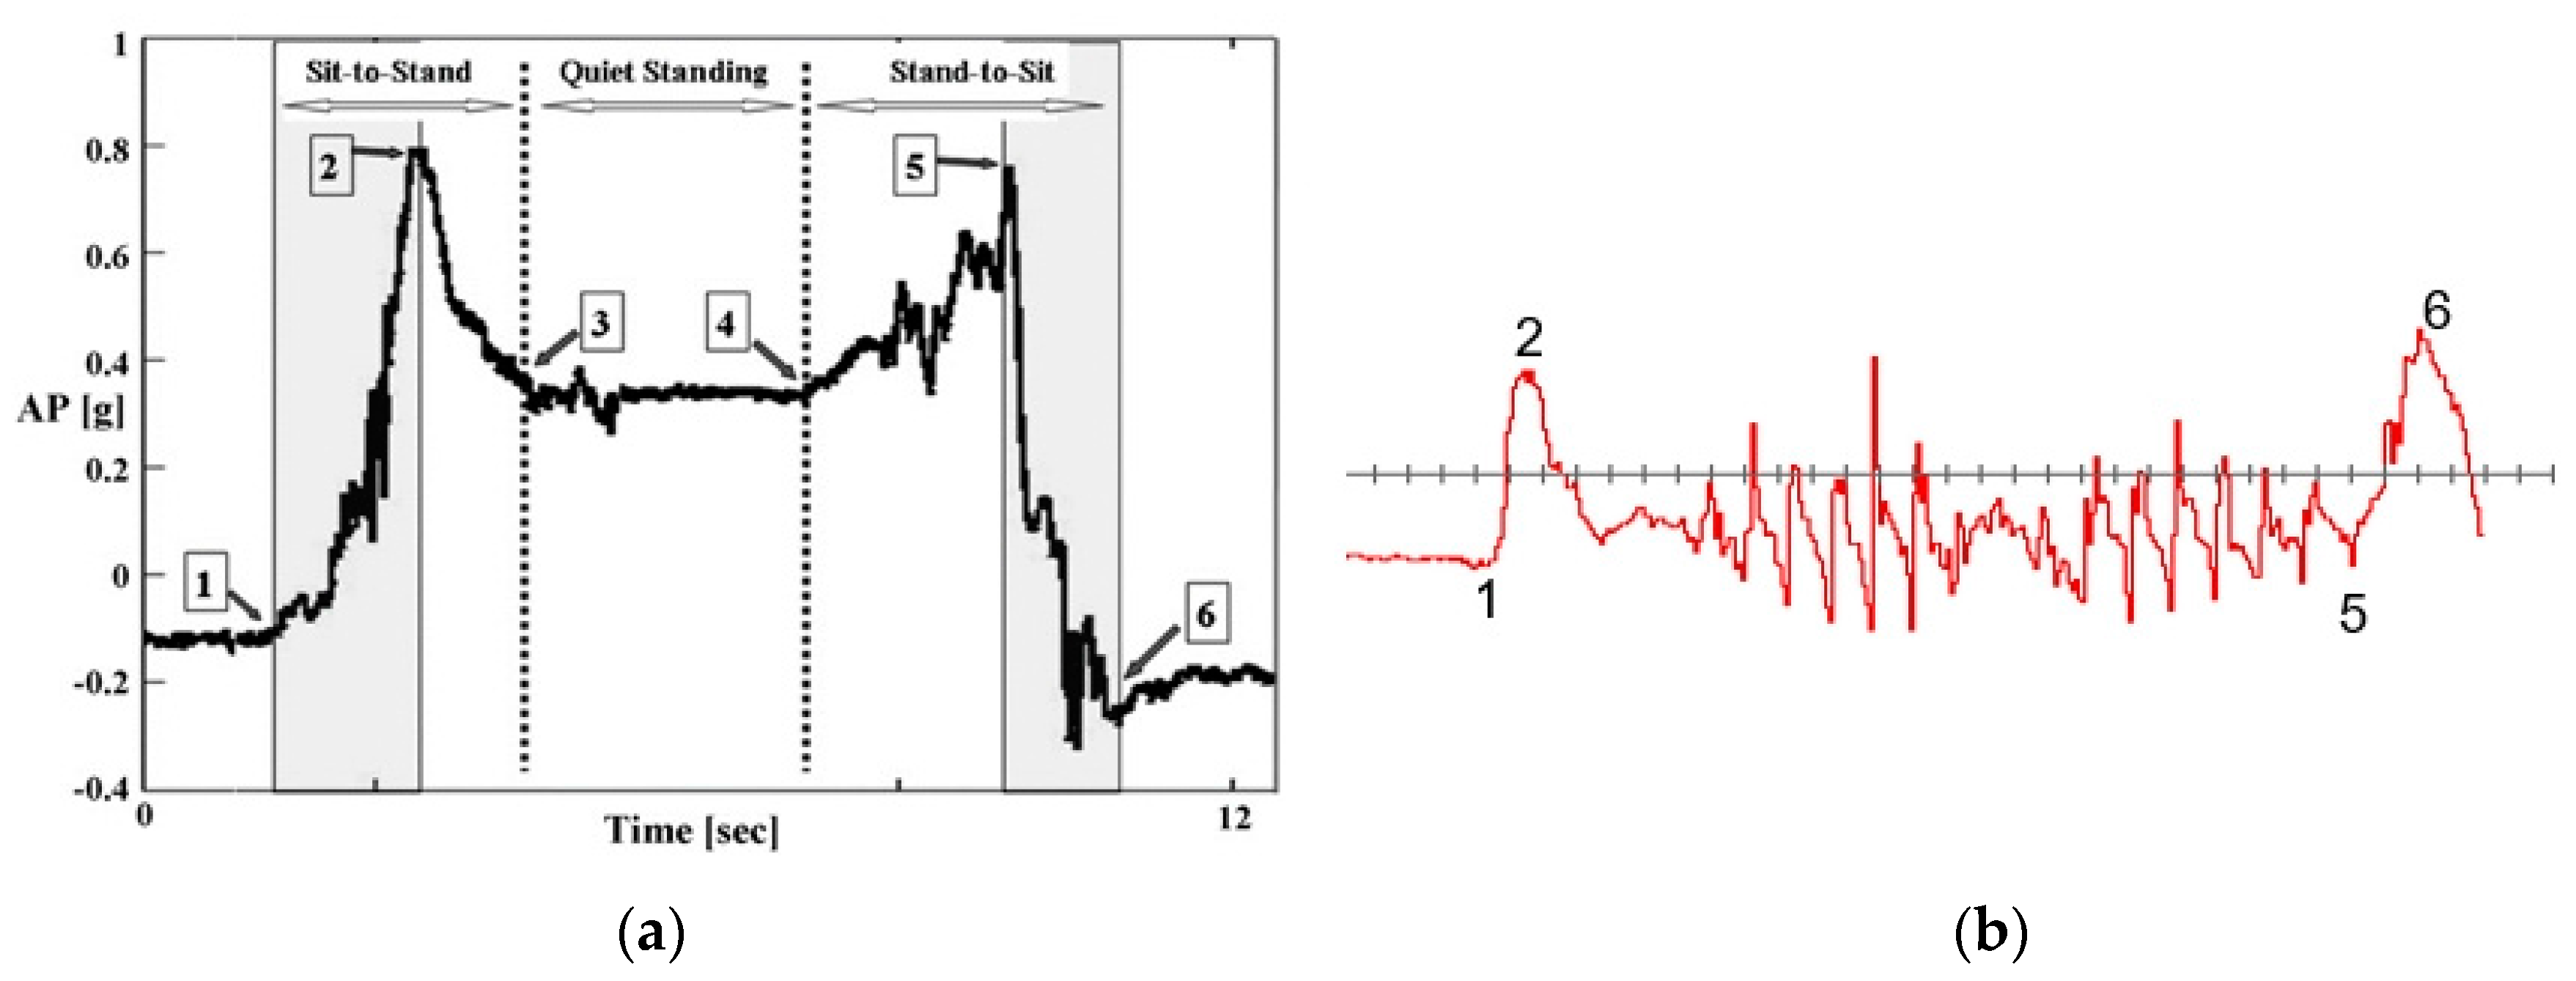
| 1 | The min. AP acceleration peak just before the signal starts to rise from steady state |
| 2 | First “M-like” AP acceleration maximum peak |
| 3 | Difficult to reliably detect (first step) because it is inconsistent among patients |
| 4 | Same as No. 3 (last turn) |
| 5 | The second “M-like” AP acceleration maximum peak |
| 6 | The minimum acceleration peak right when the acceleration reaches steady state |
| Clinical Test | Faller No. |
|---|---|
| TUG | 19, 23, 25, 26, 32, 35, 36, 37, 38, 39, 40, 46 |
| BBS | 4, 19, 22, 25, 32, 35, 36, 39, 40, 46, 67, 70 |
| SPMSQ | 19, 36, 39, 51, 61, 67 |
| TUG and BBS | 19, 25, 32, 35, 36, 39, 40, 46 |
| TUG and SPMSQ | 19, 36, 39 |
| BBS and SPMSQ | 19, 36, 39, 67 |
| Accelerometer Features | Clinical Test | ||||||
|---|---|---|---|---|---|---|---|
| TUG | BBS | TUG and BBS | SPMSQ | TUG and SPMSQ | BBS and SPMSQ | ||
| Overall | Steps | 0.044 * | 0.088 | 0.118 | 0.399 | 0.196 | 0.147 |
| Average steps length | 0.003 * | 0.307 | 0.129 | 0.362 | 0.127 | 0.094 | |
| Test time | 0.000 * | 0.004 * | 0.001 * | 0.263 | 0.019 * | 0.177 | |
| Mean AP | 0.057 | 0.121 | 0.082 | 0.483 | 0.148 | 0.135 | |
| standard deviation AP | 0.101 | 0.113 | 0.238 | 0.405 | 0.437 | 0.100 | |
| Sit(A)-to-Stand(B) | Slope(A) | 0.012 * | 0.011 * | 0.044 * | 0.107 | 0.130 | 0.085 |
| Range(A) | 0.117 | 0.168 | 0.374 | 0.255 | 0.395 | 0.150 | |
| Time(A) | 0.022 * | 0.018 * | 0.055 | 0.219 | 0.182 | 0.195 | |
| Slope(B) | 0.001 * | 0.006 * | 0.007 * | 0.118 | 0.011 * | 0.250 | |
| Range(B) | 0.067 | 0.226 | 0.361 | 0.188 | 0.430 | 0.375 | |
| Time(B) | 0.100 | 0.153 | 0.125 | 0.216 | 0.362 | 0.276 | |
| Mean | 0.273 | 0.320 | 0.241 | 0.358 | 0.199 | 0.382 | |
| Median | 0.291 | 0.163 | 0.288 | 0.261 | 0.051 | 0.382 | |
| standard deviation | 0.233 | 0.368 | 0.402 | 0.345 | 0.394 | 0.387 | |
| Stand(B)-to-Sit(A) | Slope(A) | 0.190 | 0.226 | 0.450 | 0.177 | 0.443 | 0.484 |
| Range(A) | 0.006 * | 0.0137 * | 0.006 * | 0.180 | 0.086 | 0.168 | |
| Time(A) | 0.073 | 0.155 | 0.231 | 0.294 | 0.355 | 0.311 | |
| Slope(B) | 0.002 * | 0.0229 * | 0.033 * | 0.014* | 0.022* | 0.043* | |
| Range(B) | 0.313 | 0.313 | 0.500 | 0.096 | 0.253 | 0.235 | |
| Time(B) | 0.014 * | 0.052 | 0.060 | 0.310 | 0.216 | 0.261 | |
| Mean | 0.267 | 0.192 | 0.293 | 0.313 | 0.161 | 0.097 | |
| Median | 0.401 | 0.209 | 0.421 | 0.269 | 0.185 | 0.077 | |
| standard deviation | 0.319 | 0.184 | 0.391 | 0.101 | 0.222 | 0.202 | |
| Clinical Test | ||||||
|---|---|---|---|---|---|---|
| TUG | BBS | BBS and TUG | SPMSQ | TUG and SPMSQ | BBS and SPMSQ | |
| MSE-X | 0.002 * | 0.014 * | 0.006 * | 0.031 * | 0.106 | 0.133 |
| MSE-Y | 0.006 * | 0.020 * | 0.012 * | 0.442 | 0.011 * | 0.184 |
| MSE-Z | 0.013 * | 0.048 * | 0.036* | 0.072 | 0.033 * | 0.299 |
© 2016 by the authors; licensee MDPI, Basel, Switzerland. This article is an open access article distributed under the terms and conditions of the Creative Commons Attribution (CC-BY) license (http://creativecommons.org/licenses/by/4.0/).
Share and Cite
Lee, C.-H.; Sun, T.-L.; Jiang, B.C.; Choi, V.H. Using Wearable Accelerometers in a Community Service Context to Categorize Falling Behavior. Entropy 2016, 18, 257. https://doi.org/10.3390/e18070257
Lee C-H, Sun T-L, Jiang BC, Choi VH. Using Wearable Accelerometers in a Community Service Context to Categorize Falling Behavior. Entropy. 2016; 18(7):257. https://doi.org/10.3390/e18070257
Chicago/Turabian StyleLee, Chia-Hsuan, Tien-Lung Sun, Bernard C. Jiang, and Victor Ham Choi. 2016. "Using Wearable Accelerometers in a Community Service Context to Categorize Falling Behavior" Entropy 18, no. 7: 257. https://doi.org/10.3390/e18070257