


Assuring Safe and Efficient Operation of UAV Using Explainable Machine Learning

School of Aerospace, Transport and Manufacturing, Cranfield University, Bedford MK43 0AL, UK
*
Author to whom correspondence should be addressed.
Drones 2023, 7(5), 327; https://doi.org/10.3390/drones7050327
Submission received: 16 March 2023
/
Revised: 4 May 2023
/
Accepted: 11 May 2023
/
Published: 19 May 2023
(This article belongs to the Special Issue AAM Integration: Strategic Insights and Goals)
Abstract
:The accurate estimation of airspace capacity in unmanned traffic management (UTM) operations is critical for a safe, efficient, and equitable allocation of airspace system resources. While conventional approaches for assessing airspace complexity certainly exist, these methods fail to capture true airspace capacity, since they fail to address several important variables (such as weather). Meanwhile, existing AI-based decision-support systems evince opacity and inexplicability, and this restricts their practical application. With these challenges in mind, the authors propose a tailored solution to the needs of demand and capacity management (DCM) services. This solution, by deploying a synthesized fuzzy rule-based model and deep learning will address the trade-off between explicability and performance. In doing so, it will generate an intelligent system that will be explicable and reasonably comprehensible. The results show that this advisory system will be able to indicate the most appropriate regions for unmanned aerial vehicle (UAVs) operation, and it will also increase UTM airspace availability by more than 23%. Moreover, the proposed system demonstrates a maximum capacity gain of 65% and a minimum safety gain of 35%, while possessing an explainability attribute of 70%. This will assist UTM authorities through more effective airspace capacity estimation and the formulation of new operational regulations and performance requirements.
1. Introduction
Despite the increased popularity of Unmanned Aircraft Systems (UAS) in recent years, the relevant infrastructure remains immature. Nor is any managerial model available to permit the safe and efficient operation of UAS within low-altitude airspace [1]. This has generated a clear demand in terms of a viable operational framework, in response to which European authorities and NASA have, respectively, proposed plans for “U-Space” and USA Traffic Management (UTM) [2]. UTM, nonetheless, must still conform to the rules and regulations associated with Air Traffic Management (ATM), and this requires a flexible approach toward airspace regulations. Since airspace will continue to require human supervision, ATM and UTM must be mutually coordinated; neither one can function entirely separately from the other [3]. There are at least two prerequisites if one aspires to a seamless ATM/UTM model, namely, the interoperability of management techniques and information exchange (as used by various services and processes), and the interoperability of components [4]. Not only is the conventional paradigm of air-traffic control unsuited to increasingly high volumes of traffic, but it also places an unreasonable burden on air-traffic controllers (ATCos) themselves. Thus, UAS must be integrated, safely, into airspace that is both controlled and non-controlled. The management of diversified, high-density flight equipment in a single region of airspace cannot be achieved via extant ATM systems [5].
High volumes of UAV operations, in a given airspace, entail numerous hazards. Indeed, failure events often afflict UAVs at certain altitudes, due both to the limited flying resources of the vehicles themselves, and the uncertainties that airspace presents [6]. Two principal sources may be identified for this overall risk. First, air risk comprises the hazard posed by one drone to other aerial vehicles (including other drones) during flight. Second, ground risk references the potential dangers presented by drones to phenomena on the ground, including human beings. It is challenging to calculate ground risk for urban drone activity, since human activity, infrastructure, and many other variables must be accounted for [7]. Conversely, since air risk considers how drones may fly without colliding with obstacles or other vehicles, it is somewhat simpler to evaluate [8]. For the most part, urban drone operations will comprise short to medium-length flights of 1–25 km. Ground-based and onboard technologies for monitoring, navigation, sensing, and computation will ensure safe aviation over densely populated urban areas. In the present study, we aim to address air risks by proposing a demand and capacity management service to determine available urban airspace for UAM operations based on explainable machine learning. The assessment and estimation of ground risks are a significant challenge and represent a burgeoning area of research, and will be considered in the future to address these challenges.
Within the service structure of ATM [9], the key mission of Demand and Capacity Management (DCM) in airspace (for the sake of safe, efficient air traffic) is undertaken by Air Traffic-Flow Management (ATFM) [10]. Airspace-management systems and ATFM itself (based on Artificial Intelligence (AI) algorithms) have proven highly successful in reducing both delays and congestion [4,11,12]. Conversely, high-density traffic in low-altitude environments cannot be accommodated by current ATFM, in terms of either timeframe or intensity. Thus, to address the specific demands of dense, low-altitude, urban airspace, and dynamically respond (in real-time) to both UAS states and airspace changes per se, it is essential to develop an intelligent UTM system that incorporates appropriate DCM technologies and processes.
The integration of any UAS into extant and future ATM environments is challenging [4] because, to reiterate, anticipated rises in air-traffic density are beyond the capacity of current ATM systems. This is especially true for urban and low-altitude environments. As compared with traditional ATM, the volume of information that must be exchanged, processed and tracked by UTM, within the same unit of considered airspace volume, is far greater. Unless these issues are addressed, any interruption to nominal flight plans will begin to compromise the safety of airspace operations [13]. Airspace integration, contingency and traffic-flow management, separation, capacity, and scheduling comprise the principal challenges in managing air traffic [14]. In fact, the latter may be addressed in at least two ways. NASA and the FAA have pioneered one approach [1,2], which is based on the assumption that a system for managing air traffic should be both centralized and capable of directing vehicles of every performance level. Industry, meanwhile, has promoted a second paradigm [15], whereby aircraft deploy sense-and-avoid technology, and other onboard mechanisms, to maintain safety while selecting their own optimal routes. A corollary of this proposition is that airspace would be closed to vehicles lacking such technology. A key project developed by NASA, designated Air Traffic Management-eXploration (ATM-X), has applied focused research to the resolution of these issues [16]. The USM subproject, in particular, seeks to promote the widespread deployment of UAM by advancing the airspace-management architectures and technologies that will render this possible. Research objectives are diverse, but they include separation assurance, management of congestion, interoperability vis-à-vis other forms of air traffic, safety in mission planning and operation, and dynamic scheduling [17]. Congestion management, and especially the need to minimize cancellations and delays while accommodating the expected demands of high-density regions, is a notable area of interest. Meanwhile, for each of the three dimensions of the CNS system, i.e., communication, navigation and surveillance, major technological advances are required. In order to support communication between traffic control and aerial vehicles, it will be necessary to draw upon technologies not currently deployed in standard aviation: these include cellular devices (5G and further) and LTE, as well as satellite linkage [18].
Hence, to cope with the higher constraints, heightened objectives, and greater volumes of exchanged and processed data that will characterize future UTM/ATM models, algorithms must be optimized in a computationally efficient manner. While much research has been carried out in terms of AI for the ATM field, little or none of this work has brought tangible advantages to end users or, indeed, has been fully translated into real-world operations. This slow progress reflects the fact that safety must be prioritized in fields such as ATM, where human lives are potentially at risk [19].
Thus, AI will be a key component of decision-support systems for future ATM and UTM. This will provide a degree of liberation from the limited flexibility of the algorithmic logic that one usually finds in declarative automation [4]. Ongoing research into human-machine interaction (HMI) is being driven by increases in both processed-information volumes and automation complexity, and this should enhance human-machine coordination [20]. In order to improve the assistance rendered to the decision-making process of the ATM operator, meanwhile, ATM DSS have progressively evolved [21,22]. Conversely, important concerns regarding ethics, privacy and law have arisen, due to an absence of “explainable features” and knowledge representation; such absences undermine the human ability to monitor, or even comprehend, proposed solutions. Since safety-critical systems need to be traceable, this is unacceptable [23]. Consequently, there is a trend away from Black-Box responses to operational challenges in the military, business, or even personal life. Such concerns have, in turn, driven an appetite for systems that provide transparent, comprehensible attributes for their machines. Ideally, such systems permit human users to understand (i) the AI algorithm itself (global interpretability and explanation), and/or (ii) the solutions it generates (local explanation and justification). The methods of Explainable Artificial Intelligence (XAI) are closely linked to the systems that the latter seeks to explain; indeed, the approach is already in its third generation [24]. The XAI paradigm seeks to generate a suite of machine-learning methodologies that will sustain high prediction accuracy (learning performance) in tandem with greater explicability.
The principal objective of air traffic-flow and capacity management (ATFCM) is the reconciliation of airspace capacity with traffic requirements so that the former can accommodate the latter. Moreover, once capacity opportunities have been exhausted, AT-FCM must optimize traffic flows in line with the capacity that exists. Consequently, accurate prediction of future demand is a key enabling instrument of ATFCM [25]. Today, in many areas, there is increasing potential for the use of low-flying UAVs, and this includes urban airspaces. Therefore, the delivery of DCM services in diverse airspace sectors will require new tools and services. This will enhance safety and efficiency while reducing both time-criticality and UTM-operator workloads. Motivated by the considerations above, this paper proposes an explainable AI DCM model, designed to improve the safety and capacity of UAV traffic management in low-altitude airspace operations. The overall contributions of this paper can be summarized below:
- This paper proposes a hybrid explainable machine-learning model, in order to support UTM demand and capacity-management services. Within this model, a set of functions are enabled, encompassing trajectory allocation, flight planning, and capacity optimization. This integrated approach produces an optimal solution, which minimizes operational costs while maintaining traffic density under urban-airspace thresholds. The suggested model has been validated using simulated scenarios of UTM operations (e.g., drone delivery applications). These simulations consider uncertainties arising from weather conditions, static and dynamic obstacles, and emergency operations, especially in urban environments.
- This paper proposes, in addition, a data-analytics framework to characterize traffic flow patterns for UTM airspace evaluated on the example of analysis of simulated historical data. The methodology focuses on two main components that intervene in a DCM process, namely, the prediction of congestion figures for each trajectory, and the accurate estimation of airspace capacity. Specifically, we identified five congestion levels, and a clustering algorithm-based mechanism was developed to determine available urban airspace for Urban Air Mobility (UAM) operations, based on the UTM traffic-flow analysis.
- In terms of the explainability of the decision-support system, this study proposes a transparency-based methodology with a fusion of both Black-Box and explainable White-Box models for our UTM recommendation systems. The Black-Box models are not transparent, due to a lack of clarity associated with their internal configuration. By contrast, White-Box models manifest observable and understandable behaviors. We have introduced metrics-based scoring to illustrate the overall explainability of our hybrid model, based on the transparency of the individual components. In light of these metrics, we have confirmed that our proposed advisory system is approximately 70% explainable.
Figure 1 illustrates the structure of this paper, while Section 2 presents a review of Explainable Artificial Intelligence (XAI), analyzing where and why XAI is needed, how it is currently provided, and its limitations. Section 3 describes the proposed methodology of this project. Section 4 presents the explainable demand capacity-management system and its results. Finally, Section 5 provides our conclusions, together with some guidelines for future work.
2. Literature Review and Background
Traditional air traffic-management approaches have been challenged by the developing interest in unrestricted UTM and UAM. ATM systems, if they are to overcome extant and emerging problems, must increase both capacity and efficiency: this, in turn, means high levels of intelligence and automation. Our review [26,27,28,29,30,31,32,33,34,35,36,37,38,39,40,41,42], demonstrates that the topic of AI in ATM, and the ongoing evolution of this relationship, are of growing importance. For instance, the volume of publications pertinent to this subject has increased by 100% in the last four years alone. As AI-ATM technologies mature, furthermore, the need for explicability increases proportionately. If end-users (ATM operators) cannot understand a given system, after all, they are less likely to accept it. The review also demonstrates that data analytics have been applied to virtually all of the more difficult stages of the ATM domain. Despite this, scholarly coverage in the context of UTM has been meager.
In seeking to achieve quasi-human, or even superhuman, performance vis-à-vis the automation of certain tasks, machine learning (ML) has become the most favored tool. In terms of unmanned aircraft, the usage potential of ML is especially high. Emerging concepts of Urban Air Mobility envisage the removal of the onboard pilot, while a remote pilot (perhaps supervising a fleet of vehicles) will be supported by ML [43]. In fact, UTM operations comprise a vital component of ATM. This is true, in particular, for those beyond visual line of sight (BVLOS), whereby operators may be unable to distinguish between manned and unmanned vehicles and high volumes of decision-making are needed. This reflects the need for a range of services, including remote identification transmission, alerts for in-flight conflicts, weather forecasting, location of nearby UAS operators for data exchange, strategic deconfliction via negotiation and/or flight-intention sharing, and deconfliction maneuvers [44]. In this respect, ML instruments and techniques are a promising solution, since they can deploy predictions as a route towards superior decision-support systems. Today, indeed, ML-based decision-support systems can already identify patterns of interaction between variables, thereby resolving problems of complex mass-data analysis [45].
The principal problem associated with machine-learning models, nonetheless, is the perception that they are Black-Box solutions. In other words, there is an absence of lucid declarative knowledge representation, even if one broadly understands the mathematical principles that underpin them [46]. With the majority of ML models, furthermore, neither the output results nor the algorithm in question are explainable: consequently, operators who cannot understand solutions may be reluctant to accept them [47]. Problems concerning certification for ML-based, safety-critical systems will be addressed in the following sections, which will also consider the various solutions that the literature comprises.
2.1. The Challenges of Certifying AI
Software applications, reliant on ML, are deployed in many important areas of contemporary life, from finance to health, from energy to logistics. Given its increasing real-world significance, the safety aspects of machine learning have become the focus of increasing attention [43,48,49]. Indeed, especially in the case of safety-critical applications, the incorporation of ML is not without risk. In such circumstances, any serious breakdown can have disastrous consequences, up to and including the loss of human life. In the automotive and avionic sectors, additional damage may be sustained by the environment, or by expensive equipment.
In the context of ML systems, failures are interpreted as harmful or unintended behavior, and this may arise if ML is poorly incorporated into the system in question [50]. ML algorithms are probabilistic in character, but this may not sit well with safety cultures that exist, or emerge when safety-critical systems are developed [51]. In contrast to conventional software, the nature of such algorithms is not widely understood. ML algorithms may evince a comparatively clean and static structure, but in order to function, they require numerical parameters extracted from various datasets [52]. Unlike traditional software, there is a lack of explicit programming oriented toward particular tasks [53]. Before any ML-based components can be utilized within a safety-critical system, these components must be properly certified.
One extant study [54] defines certification as a “procedure by which a third-party gives written assurance that a product, process, or service conforms to specified requirements.”. In avionic or automotive contexts, where safety is a critical issue, certification is obviously important. A range of standards have thus been developed to address this requirement. For example, IEC 615803 provides an international standard for the certification of safety-related electrical, electronic, or programmable electronic items. The same standard, enhanced for purposes of road-vehicle safety, is represented by ISO 262264. Meanwhile, DO-178C5 [55] has been developed to address the certification of airborne equipment and systems. This standard, for example, introduces the requirement for modified conditions/decision coverage (MC/DC) criteria, the objective being to interrogate all the potential conditions that might give rise to a particular decision. These standards and others like them, in sum, are specifically designed to accommodate functional considerations of safety within safety-critical systems.
Mounting interest in the development of AI-based systems has prompted numerous responses from the aviation community. An initial, usable guide to ML application has been developed by the European Union Aviation Safety Agency (EASA) [56]. This guide provides one of the foundations for the further certification process concerning AI-oriented systems, and it develops the process to incorporate certain areas pertinent to explainability, learning assurance, and trustworthiness.
Notably, committees and working groups are being formed, in order to develop guidelines, establish standards, and generate regulatory frameworks. Prominent among these bodies are, for example, the SAE G-34/EUROCAE 114 Artificial Intelligence in Aviation Working Group, the SAE S-18A Autonomy Working Group, and the ASTM Autonomy Working Group. The year 2019 saw the establishment of the first of these (SAE G-34/EUROCAE 114), with the goal of developing methodologies for the certification of systems based on AI. A further objective was to deploy new standards for such systems as a complement to ARP4754A/B and DO-178C. An internal perspective on this particular Working Group is provided by [57]. Essentially a joint technical committee was formed to develop consensual standards for the industry, thereby promoting the effective and safe integration of AI technologies within aeronautical systems. The group is currently assessing AI-usage applications for deployment in such systems, with an emphasis placed on AI utilized in ground equipment or integrated within aerial vehicles. A key objective is to develop standards to facilitate safe systemic development, in line with the demands of regulation.
The EASA CODANN II report, published in 2021, adds new information to that provided by its predecessor [58]. The learning-assurance concept was further interrogated in this second document, with a notable emphasis on inference environments and model implementation. Typically, inference environments, as embedded in particular systems (i.e., environments of intended use for a given function), are significantly different from the learning environments where training is conducted. For verification purposes, this is highly important. In order to interrogate the certification and safety characteristics of ML technologies, within safety-critical and certifiable aerospace systems, a working group was established by the Aerospace Vehicle Systems Institute (AVSI). This led to the final report, AFE 87 Machine Learning [59]. The latter is intended as a further catalyst for emerging consensus standards, and it comprises guidance material for the introduction of ML technologies.
The introduction of ML components within software systems, however, represents a paradigm shift. Few dispute the usefulness of ML as a means of duplicating human knowledge, allied to the computational power of machines. At the same time, ML requires radical re-evaluations of certification practices, and it entails major changes in the way software is developed. Software systems are conventionally constructed in a deductive manner, and this involves writing the rules (as program code) that dictate system behavior. Conversely, with ML approaches, such rules are learned from training data, i.e., they are generated inductively. This, to reiterate, is a paradigm shift, and it means that specification can no longer be restricted merely to code per se. Rather, it must now include both learning processes and data, so that previously formulated standards are largely redundant in terms of emerging ML software structures.
Since ML safety has become an object of keen interest, it has generated collaboration between researchers from at least two fields, namely, ML specialists and safety engineers [48]. Both low-level and high-level approaches to system certification and assurance may be found within the reviewed literature [60,61,62]. Advances have been made, but nonetheless, the relevant communities continue to debate which norms and standards should be deployed for ML-system certification purposes. The significance of the topic is reflected in the recent emergence of several certification initiatives, such as the French Dependable and Explainable Learning (DEEL) Certification Workgroup, as well as working groups on standardization, such as EUROCAE WG-114 and SAE G-34 [61].
A large number of surveys reflect the burgeoning body of research dealing with ML. The great majority of these, however, do not explicitly consider assurance but rather focus on specific types of ML. One finds, for instance, surveys about deep learning [36,63], reinforcement learning [64,65], transfer learning [66,67], and ensemble learning [68,69]. Certainly, in terms of the forms of ML that they address, these surveys offer valuable insights into the efficacy, trade-offs and applicability of the available data-management and model-learning methods. These surveys do not consider assurance-related techniques for the data-management and model-learning phases of the ML lifecycle, however, and (to repeat) they prioritize specific types of ML and specific classes of verification techniques. Moreover, the safety aspects of ML-component integration within autonomous systems are addressed briefly, if at all.
Techniques, whereby systems are exhaustively interrogated, are termed “Formal Verification.”. Robustness and reachability are properties deployed in the comprehensive analysis of deep neural networks (DNNs). Robustness holds, informally, that only small changes in output should arise from small changes to input. Reachability maintains, also informally, that certain outputs must be attained when certain inputs are present. Since tools are currently restricted to certain networks, however, and since they are often afflicted by scalability problems, the development of techniques of this kind remains a work in progress. Still, Marabou provides an example of a verification tool that is both familiar and relatively mature [70]. Drawing heavily on the principles of satisfiability modulo theories (SMT), it provides a powerful instrument for DNN verification. Within Marabou, queries regarding DNN properties are translated into problems of constraint satisfiability. Various forms of activity function may be accommodated by the system, such as Sign, Absolute Value, Max, Leaky ReLU, and ReLU. For safety-critical, ML-based applications of the future, in any case, formally proven guarantees will be particularly beneficial.
Still, a few recently published surveys do provide comprehensive information regarding state-of-the-art ML assurance, namely, the evidence generated to identify whether ML is safe enough for its envisaged purpose. Such surveys [49,61,62,71] consider the various ways in which this evidence may be created at particular points during the ML lifecycle. The latter is an iterative, complex process that begins with the harvesting of data to be used to train an ML component of a given system and finishes with the real-world deployment of that component. The studies cited above initially provide a systematic description of the various stages of the ML lifecycle. Then, for each stage, they specify the relevant assurance desiderata.
Assurance is reinforced by ML interpretability [62], as the latter offers evidence for the following: (1) justifying results (that is, explaining decisions for particular outcomes, especially in the context of unexpected decisions, as well as justifications required for legislative compliance); (2) malfunction prevention, and the identification and correction of errors (i.e., an understanding of system behavior affords better visibility regarding unknown shortcomings and weaknesses); (3) assistance of model improvement (that is, the more easily a model can be explained and understood, the more easily it can be enhanced) and (4) support for understanding the operational domain (i.e., a helpful tool is provided for learning, information harvesting, and—thus-knowledge acquisition) [72]. One may find millions, or billions, of parameters in ML and DL models, with the most successful structures being highly complex and challenging to explain [73]. Interpretability does not guarantee safety in itself, but it can at least shed light on how, and why, models may fail.
2.2. Methods of Interpretability
The autonomous operation of UAS involves safety-critical issues, and one must know how and why decisions are arrived at. Thus, much research has been conducted on ML architectures, with a view to making ML systems more transparent. EASA, indeed, regards “explainability” as one of the cornerstones of trustworthy AI [56]. The following provides a summary of explainable-AI terms and concepts. Subsequently, examples from the literature will support a more detailed discussion of topics such as post-hoc explainability, explainability metrics, and transparent models.
2.2.1. Explainable AI
AI stakeholders are demanding greater transparency as Black-Box machine-learning (ML) models have become increasingly common in the context of key predictions for critical contexts [74]. Decisions that appear illegitimate or unjustifiable, or simply defy attempts to explain underlying behavior, are problematic in numerous ways [75]. In areas such as precision medicine, where models must supply experts with far more than simple binary predictions, model outputs must be supported by intelligible explanations [76]. Similar areas, in this regard, are security, finance, and the use of autonomous vehicles. There is a natural human reluctance to rely on methods that are not traceable or readily interpretable, particularly in safety-critical applications where reproducing scenarios of incidents, are fundamental to the investigation at hand [77]. There tends to be a trade-off between model performance and transparency, which has fueled assumptions that prioritization of performance generates opacity [78].
Arrieta et al. [79] define explainable AI as follows: “Given an audience, an explainable AI is one that produces details or reasons to make its functioning clear or easy to understand.”. EASA, meanwhile, defines explainability as, “Capability to provide the human with understandable and relevant information on how an AI/ML application is coming to its results” [56]. The definitions are similar, but that of [79] is more exact since it reminds us that explainability also depends on the relevant target audience. The key characteristics of an explainable model have been outlined as follows [79]:
- Trustworthiness: An ML model cannot realistically be deployed without a basis of trust. Otherwise, users may simply ignore model output. As noted above, EASA thus regards explicability as central to trustworthiness, and the latter is one of the key objectives of their AI roadmap [56].
- Causality: An additional objective of “explainability” is to facilitate the finding of causation between data variables. For models that assess UAS systemic health, for instance, explainability may reveal that a given component tends to fail after a certain load time.
- Transferability: Explainability can also help to clarify model constraints and limitations. Models learn to solve particular problems during training, but an understanding of boundaries is required to ascertain how, or if, the model may be applied to other problems. If a model has been trained to detect obstacles in daylight, for instance, it should not be used at night, at least without suitable modification.
- Accessibility: Explainable models will reassure non-expert users, who may feel intimidated by algorithms that, at first glance, appear inexplicable.
In order to furnish future developers with design options to address the performance/explicability trade-off, as cited earlier, various techniques have been considered. Recent progress toward the construction of viable XAI systems has been encouraging. As shown in Figure 2, the literature has identified at least two key elements of explainability. The first pertains to ML systems that have been specifically designed with human interpretability in mind: these are so-called “transparent ML models.”. The second pertains to the explanation of models that are actually shallow; this is termed “post-hoc explainability.”. Based on the above characteristics of an explainable model, the following sections consider both these aspects in greater detail.
2.2.2. Transparent Models
Models are considered transparent if they are intrinsically and independently understandable. They are unlike Black-Box systems since their architecture affords numerous insights regarding their internal relations [43]. Still, transparent models can afford varying degrees of explainability, and to distinguish between these, three categories have been postulated. These are (1) simulatable, (2) decomposable, and (3) algorithmically transparent models [80]. Simulatability represents the highest degree of transparency. The next degree is that of decomposability, followed finally by algorithmic transparency.
More specifically, simulatability references system interpretability, whereby human beings can simultaneously understand and simulate algorithmic behavior. Conversely, highly complex systems, incorporating numerous features are challenging for humans to grasp, and perhaps even impossible; this remains true even with the deployment of inherently transparent algorithms [81]. Nonetheless, a system is not rendered interpretable merely by virtue of possessing certain variables. An important role is also played by the expressiveness of systemic features. When the latter is not intrinsically interpretable, i.e., the feature unit itself is not understandable, this violates the concept of interpretability, which is central to decomposability [80]. Decomposability per se indicates that parameters, input, and calculation—in fact, each part of a given model—should accommodate an intuitive interpretation [79]. At the level of algorithmic transparency and the learning algorithm itself, a final notion of transparency might be applied. In other words, the method of model training would itself be understandable [47].
Logistic regression (LR) is a form of classification model. More precisely, it is used to predict dichotomous (binary) dependent variables (categories). Nonetheless, in the case of a continuous dependent variable, the relevant homonym would be linear regression. This model assumes linear dependence between predicted variables and predictors. The “stiffness” of the model is the particular factor that allows it to be deemed a transparent method [79].
Additionally, decision trees easily satisfy the criteria for transparency. Used to support regression and classification challenges, they are essentially hierarchical decision-making structures [47]. In their simplest form, decision trees are also simulatable models. Depending on their properties they can also be algorithmically transparent or decomposable. Because of their ease of use and transparency, decision trees have long been favored as a means of supporting decisions. These models are by no means confined to AI, computation or IT, and experts from other disciplines are often comfortable in interpreting their outputs [47].
When a model generates rules to characterize the data it will learn from it is termed “rule-based learning”. Rules may take a simple form, such as if/when conditions or knowledge may be formed from more complex combinations of rules. Fuzzy rule-based systems belong to the same general family, but these may be applied to broader spheres of action since they accommodate the formulation of verbal rules for imprecise domains. In terms of the present paper, fuzzy systems improve two main axes of relevance. First, since they function linguistically, they empower models that are relatively understandable. Second, in contexts with certain levels of uncertainty, their performance exceeds that of classic rule systems. Rule-based learners, indeed, are clearly transparent models; since they generate rules to explain their predictions, they are often deployed to explain complex models [47,80].
One issue with transparent models, however, is the generally assumed trade-off between explicability and performance, i.e., compared with more complex models, explainable or transparent counterparts are thought to be less accurate [75,79]. There is no hard scientific evidence to support this belief, except for some applications in which transparent models might, for instance, be outperformed by opaque DNNs [82]. In [82], furthermore, one finds cases in which the performance of a transparent model is equal, or even superior, to that of a less transparent structure. Neural circuit policies (NCPs) are an instance of model architecture that performs better than comparable, less transparent models [83]. The model described in [83] performs as well as a long short-term memory (LSTM) RNN, with identical convolutional layers. This is true, despite the model having less than one-twentieth of the trainable RNN parameters, and only 19 RNN neurons.
2.2.3. Post-Hoc Explainability
The following approaches to post-hoc explainability are cited in [79]: local explanations, feature relevance, explanations by example, visualization, model simplification, and text explanations.
Local interpretable model-agnostic techniques (LIMEs) are, as the name suggests, examples of model-agnostic techniques [84]. These provide local explanations, or more exactly, explanations for single outputs and their local environments, and LIMEs generate linear models to approximate the original models for those environments. These linear models can then be deployed as explanations for the output. Thus, at least for the local environment, the linear model is a simplified version of the original, and LIME may thus also be regarded as a case of explanation by model simplification. Shapley additive explanations (SHAPs) are further examples of model-agnostic techniques [85]. SHAP offers an alternative explanatory method for local ML. Based on the game-theory principle, it evaluates the significance of additive features for each particular prediction [86]. Not unlike explanations based on feature correlation, this approach describes opaque-model functionalities by assessing prediction-output features in terms of importance, impact and relevance. A tree explainer based on SHAP has been developed by Lundberg et al. [87], thus providing a visual method of local explanation. The local explanation is extended, while feature values and weights are assigned, in order directly to capture the interaction of features. The global structure is comprehended via a large number of local explanations.
For computer-vision-related tasks, Convolutional Neural Networks (CNN) are highly favored. As with other opaque DNNs, however, their predictions are extremely challenging to explain. Consequently, numerous post-hoc techniques have evolved, specifically to clarify CNNs [75,79]. The majority of these approaches employ saliency maps, the latter comprising a mixture of feature-relevance explanation and visualization, whereby the impact of each pixel on the prediction is computed and visualized. In addition to the methods referenced above, it is also possible to use text explanations to render model behavior more comprehensible. A Deep Neural Network (DNN) for natural language processing (NLP) is employed, in [88], to predict beer-review ratings, and to retrieve questions from a web-based forum. The DNN emphasizes short, coherent elements of the text that are sufficient to explain the prediction. Yet another means of explaining the decisions of models is provided by “meaningful examples” also known as “explanations by example”. The method of testing with concept-activation vectors (TCAV) is presented in [89]. This approach permits the learning of various high-level concepts, such as “horse,” “stripe” or “desert”. The relevance of such concepts is computed when classification tasks are required, such as “detecting zebras”. The decisions and predictions generated by machines must be explainable, or their reliability will be questioned. A model of breast-cancer diagnosis, via XAI visualization methods, for example, was presented by Lamy et al. [90]. In parallel, clinicians were provided with a graphical user interface, both for the sake of usability and to reinforce “acceptability.”. Medical staff benefited from these provisions, since they needed, not merely to be aware of recommendations, but to be confident in their suitability and efficacy.
Widely recognized metrics are necessary if one needs to assess, or compare, different approaches to explainability. Some metrics-based studies have considered the problem of measuring the ML-model explicability, or post-hoc methods [91,92]. Most metrics of this kind (utility, goodness, trust, satisfaction, etc.) are difficult to quantify. In most cases, a human evaluation of explainability is required, as the authors of [93] point out. Metrics, either singly or in groups, should facilitate a meaningful appraisal of how closely models conform to the definition of explicability. Classic metrics (F1, accuracy, sensitivity, etc.) illustrate the efficacy of model performance in terms of a particular aspect of explainability. Recent attempts have been made to improve the measurement of XAI, as detailed in [91,92]. Generally, measurements of XAI should assess the impact of model explanations regarding the usefulness, “goodness”, satisfaction, and “improvement of the audience’s mental model.”. They should also evaluate the effect of explanations on model performance and on the audience’s reliance and trust vis-à-vis the model.
3. Proposed Advisory System Framework
3.1. Overall Framework
The establishment of a UTM system is necessary, given the increasing quantity of UAVs. A key challenge here is capacity estimation. In other words, within a particular airspace, how much traffic can be safely and effectively managed? There are various perspectives through which this question can be approached. One must also take into account a number of factors that limit capacity, such as excessive noise (better technology may be required to improve public perception of the drone industry); the emergence of hard-to-resolve conflicts (measures for capacity management must be deployed if their likelihood becomes too high) and jamming of the communication spectrum (since stronger encryption protocols demand greater bandwidth, this might include cybersecurity factors), etc. In sum, given a set of operational requirements, safety, stability and noise conditions, protocols and technological capabilities, how many aircraft can the airspace in question accommodate?
In fact, UTM inherits the issue of capacity estimation from the ATM domain, where it has long been the focus of scholarly interest [94,95,96]. ATM primarily deals with pre-planned, airport-to-airport flights, however, UTM implicates numerous users with unpredictable demands, differing levels of experience, and the option of starting and finishing journeys almost anywhere. In other words, the non-deterministic component of small, unmanned aerial system (sUAS) traffic is a key difference between UTM and ATM. Because increased aircraft numbers and customer demand have made air-traffic management more complex, a smoother, more resilient mechanism is now needed to avoid overload. For decisions around flight dispatching and route design, airspace capacity estimation is indispensable. Conversely, conventional models of airspace capacity depend on either (1) handoff workload and fixed procedural limitations, deploying queueing formats such as monitor alert parameter (MAP) [97] or (2) weighted combinations of task-based controller workload and air-traffic density, such as dynamic density (DD) [98]. Nonetheless, given the limitations of mathematical models, or rather, their underlying assumptions [99], and the limited number of available parameters, such approaches cannot fully capture real-world situations. First, as the industry becomes increasingly automated, the manual-controller workload is becoming less relevant. Moreover, there is no agreed model for defining dynamic density in the literature, since this varies in accordance with the factors included, and the respective weights attached to them [100,101]. Thus, estimations of capacity that rely on such measures will be even less relevant. Second, unmanned traffic management is a necessity for unmanned aviation. Suitable definitions of capacity, therefore, go beyond questions of mere manual or automated control. Moreover, the airspace inhabited by future UAVs may or may not be structured. Consequently, assumptions of structure cannot be allowed to constrain considerations of airspace capacity.
The present paper describes a decentralized model in the form of a demand-and-capacity framework: the latter is designed to improve capacity for allocating airspace-system resources efficiently, safely and equitably. More specifically, operational support for path planning, registration, separation, etc., is managed—within the proposed model—via a decentralized architecture, and not through a centralized, unitary framework. In the context addressed here, decentralized strategies are both beneficial and necessary: notably, they permit UASSPs to deconflict their own operations in accordance with their own cost considerations. Simultaneously, UASSPs may safeguard private data that define their positions regarding operational replanning costs [102].
Reinforcement learning (RL) is a data-driven decision-making framework that has shown promise in solving complex real-world problems and control operations [103]. Unlike other types of learning, RL involves an agent continuously interacting with an environment to maximize long-term rewards. However, one major challenge with RL, as with many machine learning algorithms, is the lack of explainability. This is due in part to the recent achievement of human-level performance by deep RL algorithms, which are highly complex and parameterized with thousands if not millions, of parameters [104]. This lack of explainability can be a significant obstacle for many RL applications, such as those in defense, finance, and medicine, where a model’s ability to explain its decisions and actions to human users is critical for societal acceptance [75].
This study aimed to improve the accuracy of complexity prediction in congested airspace based on learned spatial and temporal correlations. For this purpose, we have identified from our state-of-the-art review that an encoder-decoder architecture that relies on LSTM layers and a one-dimensional (1D) convolutional layer to extract complex patterns from time series data is the most promising in contrast to RL. On the other hand, LSTM encoder-decoder models can be more interpretable than RL models because they involve a more straightforward mapping between inputs and outputs, and it is often possible to examine the attention weights or other mechanisms used to generate the output sequence.
Methodologically, in order to address the performance/explainability trade-off, the present paper deploys a hybrid model with a combination of Deep Learning (for accurate prediction of congestion), iterative DBSCAN (to identify physically congested sub-regions), and rule-based decision logic (for better explainability of UTM management decisions). This gives rise to an intelligent system that will be reasonably comprehensive and explainable. The overall architecture of the proposed model is presented in Figure 3. The detailed steps of the proposed methodology, meanwhile, are provided below:
- UAV trajectory-data generation is undertaken using Particle Swarm Optimization (PSO) simulation, for different environmental scenarios, on an hourly basis. This provides optimal paths from a UAV service start point to the relevant delivery point [105]. For this study, we acquired data for three hours (9:00 am to 12:00 pm). Moreoverconditionsc and dynamic structural changes of the airspace, and adverse, extreme weather conditions, are also considered in this research (see Section 3.2, below).
- The pre-processing of acquired data is expanded by up-sampling, in order to increase the resolution of UAV trajectories. This generates better air traffic flow and congestion analysis.
- An LSTM-based congestion-prediction model has been utilized to obtain predicted congested values for each trajectory. A detailed explanation of the congestion-prediction model is furnished in Section 3.3, below. The predicted congestion values are normalized between 0–100%, in order to threshold the congestion levels.
- In Table 1 we defined five congestion levels, both for better explainability to UTM authorities and to assist further analysis:
- Since the congested levels are distributed over the entire Bedfordshire UTM airspace (64 km × 64 km), we have identified the congested zones or sub-regions for each of the five congestion levels. This can be conducted by running and tuning the DBSCAN clustering algorithm, iteratively, for each congestion level. The optimal tuning is conducted by adjusting the parameters “eps” and minimum points (“minPts”) for DBSCAN. The parameter tuning is required for better trajectory cluster-grouping formation; moreover, it also helps in defining better congestion-area polygons.
- The area polygons are created around these congested clusters or groups, both to estimate the covered area per cluster and to locate the centroid position (x, y) around which a cluster is formed. The covered area around these clusters is built by forming an irregular polygon (using the boundary points), and by measuring the area using the MATLAB poly-shape function. The count of UAV trajectory points for these congested zones is also measured.
- The traffic flow for each congestion cluster is calculated using the ratio between UAV trajectory counts and the area encapsulated by that cluster.
- The capacity of each congested cluster is then measured by defining a safe traffic-flow threshold. This is derived from the notion of safe separation distance. In our work, a safe lateral separation distance of 100 m is applied, while the vertical distance is not considered in this study. This, in turn, indicates 10 UAVs per km, which implies about 100 UAVs per km2 within each cluster. The available capacity for each cluster is calculated by taking the difference between the current traffic flow and traffic-flow threshold (100 UAV trajectories/km2).
- The rule-based decision tree is then designed and implemented for each of the five congestion levels (lowest-highest) using three inputs: (1) available airspace capacity (capacity per cluster), which is computed via our congestion analysis; (2) the number of new incoming UAV trajectory points that happen to traverse the congested regions (lowest to highest) and finally, (3) the mission priorities of incoming UAVs, which are required for optimal recommendations. The output of the advisory system is the updated capacity, either allowing the UAV mission within a particular congestion cluster, or disallowing (for safety reasons) the usage of a particular congested airspace. This is followed by a recommendation to use specific, available airspace.
3.2. Description of Data
The lack of a common, shared database, comprising data for real-time UAV flight activity, presents a significant obstacle to effective data analysis in UTM [106]. The use of simulation data offers one potential avenue for development. Consequently, the development of scenario-driven planning methodologies (which would facilitate the choice of routes to follow, who to serve and volumes of delivery, while generally optimizing UAV plans) is a matter of high priority [107]. A Monte Carlo simulation was carried out in the airspace over Bedfordshire in the UK, with a view to evaluating and validating the methods proposed by the present research. The data generated using the Monte-Carlo simulations are an important tool for evaluating aviation safety systems and assessing the risk of collisions or other hazards. By simulating the interactions between aircraft and other objects in the airspace, encounter models can help to identify potential safety issues and assess the effectiveness of mitigation measures. The simulation identified areas of possible flight restriction, such as airfields, specific recreational facilities, and prisons. Indeed, four recreational zones were contained within the designated area (namely, Cardington, Graveley, Dunstable and Sandy), together with Milton Keynes Prison, and four airfields (Cranfield, Luton, Halton and Old Warren).
A drone delivery system, comprising multiple missions, was used to evaluate the proposed model, and this involved emergency fire-surveillance operations, the dispatch of COVID-19 testing materials, parcel delivery, and the UAV inspection of railway infrastructure. The research model further interrogated the possible effects of random, recreational drone use, coinciding with the missions cited above. Each flight was allocated a service-priority level, ranging from Level 1 (the highest) to Level 5 (the lowest). Further research was conducted to interrogate the impact of other significant variables. The latter included airfields with varied UAV accessibility, recreational zones, weather patterns (and other environmental factors), emergency UTM activity, and structural configurations of airspace (e.g., static no-fly zones, or NFZs). It was assumed, for study purposes, that UAVs would maintain a constant speed of 90 km/hr. Each UAV was assigned a specific route, with the depot serving as both the start-point and endpoint. A mission was regarded as complete if a vehicle followed its full designated route and returned intact to the depot. Three distinct scenarios for the Bedfordshire region, between 9:00 am and 12:00 pm, were simulated by the study, in order to assess results for more complex, dynamic airspace.
The first simulation took place from 9 am to 10 am. In this case, there were no weather constraints or dynamic obstacles, and each of the nine NFZs were static. Consequently, for this hour, no UAVs could fly above the latter. This simulation also incorporated 100 UAV trajectories, although it did not include the UAV railway-infrastructure inspection. The second simulation followed immediately, taking place between 10:00 am and 11:00 am. This incorporated various elements that made it more complex than its predecessor. Notably, the number of UAV trajectories was increased to 150, railway-monitoring operations were now added, and the impact of adverse wind and rain conditions was considered. Finally, the third simulation took place between 11:00 am and 12:00 pm. In this case, the prison remained an NFZ area, as did each of the four recreational areas; the airfields, conversely, were dynamic. Nonetheless, the airfields of Cranfield and Luton were deemed available (unlike the other two), and consequently, UAV hobbyists could use this airspace at various points. Once again, severe weather conditions were incorporated in the third scenario, as was the UAV railway-track inspection. Figure 4, for the sake of simplicity, represents one of the scenarios above.
3.3. Congestion-Prediction Model
The study deployed a dataset of simulated historical trajectories, generated in the preceding section, to predict air-traffic complexity. For our purposes, a “trajectory” comprises a sequence of states for a given aircraft. Each state, meanwhile, incorporated five variables for a particular UAV, namely: longitude (), latitude (), timestamps (), velocity () and heading direction (). Subsequently, to predict the flow of UAV traffic through the airspace, datasets were trained via these UAV states. The lateral and longitudinal coordinates of a UAV at each time step were used to determine that vehicle’s velocity and heading angle at a given timestamp.
An intrinsic metric for air-traffic complexity, based on the Linear Dynamical System (LDS), was deployed in this study to organize air traffic-flow structure within urban airspace, and to mitigate congestion in the latter. The proposed, adapted complexity metric accommodates a lack of operational requirements and suitable UAS procedures. It also makes due allowance for the significant discrepancies between UAS and ATM operations. These differences are manifest, for example, in fields such as operational density, the structure of the dynamic flow, and the standards and requirements around separation. A linear dynamic-system model, previously published, provides the basis for the inherent complexity model used in the present study [108]. A complexity parameter in the UAV vicinity is, for a specified time, identified by this metric. A filter, meanwhile, accommodates those flights that will likely engage with the reference flight. For instance, a drone would not influence the latter if it remained at a distance of 50m, and it would thus not be included in metric computation [109]. In fact, the dynamic behavior of nearby drones is captured, within a reference window of airspace, by the suggested complexity metric, which was specifically designed for this task. A further objective was to build deep-learning models, capable of evaluating complex and/or hidden data-stack patterns, both massive and diverse (and this would include time-series data). With this in mind, we employed LSTM, in conjunction with a one-dimensional convolution layer (1D convolutional). Indeed, the inherent advantages of both techniques were utilized to improve the accuracy of airspace-congestion predictions. Details regarding the implementation of the congestion-prediction model, in the context of the UTM application, are contained in our recent work [110], and this reflects the ongoing focus of our research. The present study, meanwhile, seeks to construct strategies whereby decision support-system resolutions are rendered genuinely explainable, while also being transparent, trustworthy, and reasonably easy to grasp. This in turn, for UTM applications, underpins optimal demand-capacity solutions.
3.4. Demand and Capacity Management
Air traffic-flow and capacity management, or ATFCM, has become increasingly important as demand for conventional air transportation has risen. Alongside airspace management and air-traffic services, ATFCM is, in fact, one of the acknowledged “three pillars” of ATM. The primary goal of ATFCM is to facilitate an early-stage safety net to prevent the overloading of air-traffic control (ATC), and it pursues this aim by balancing airspace capacity and traffic demand. Moreover, airspace thresholds will soon be reached due to the rapid increase in UAS demand, and this may require the development of similar ATFCM initiatives [111]. A Dynamic Capacity Management (DCM) service should be achieved at the U3 stage, according to the U-space roadmap. Given a higher degree of autonomy, stage three could include capacity-management support for conflict detection, as well as more complex operations in areas of high density. In due course, interactions between manned aircraft and ATM/ATC will be a matter of routine [112]. Indeed, given the steadily rising number of drone operations, most proposed operational UTM concepts, even internationally, acknowledge the difficulty of realizing a continuous DCM process to support such operations. Meanwhile, as compared with the DCM of extant ATM systems, any new process will evince significant differences. This is due, among other factors, to the nature of the drone market, with its greater divergence of aircraft types, business models, and anticipated technologies for Communication, Navigation and Surveillance (CNS) [113].
This study [114] describes, at a high level, NASA’s development of both early expanded and emergent operational paradigms for urban air mobility. It also addresses issues such as navigation, communication, and surveillance requirements. Meanwhile, within the context of wider research that identified eight potential operational constraints upon UAM service, ref. [115] listed the three most powerful constraints as community resistance to aircraft noise, availability of vertiports, and scalability of air-traffic control.
UAS/UAM operators, compared with traditional airlines, will present a more heterogeneous array of preferences, driven by the capabilities of their vehicles and the nature of their missions [116]. In terms of delay costs, for example, there may be a wide discrepancy between an aerial platform for monitoring pollution, and a package-delivery assignment. Speed restrictions holds, and airborne delays may exert a greater impact on fixed-wing drones, or vehicles of limited endurance and range, than on, e.g., rotary-wing drones. Moreover, it will be difficult to anticipate the use of vertiport resources and airspace in the context of UTM demand, since the latter is likely to be highly dynamic. Such problems are compounded by the fact that UAS operators may submit flight plans with varying, or little, advance notice. On-demand mobility applications of this kind must be supported by future UTM systems. Finally, there will be a pressing need for UTM-mediated congestion management, given the very large scale of expected UAS/UAM operations. The complexity of operations will also exaggerate the effect of any unfair allocations, which may affect thousands of flights per hour.
In this study, a rule-based decision tree has been formulated using the available capacity of congested zones, new incoming UAVs trajectories, and mission-priority information. Hierarchical in nature, decision trees are structures used to address problems of classification and regression and the decisions that such areas involve [117]. They have long been a feature of various categories of transparent models, and their understandability and complexity have always been viewed as important variables, given that they have been associated with so many decision-making contexts. In fact, off-the-shelf transparency is regarded as a key advantage of these structures. Their heterogeneous applicability means that experts from one field are frequently content to accept the results of decision trees formulated by specialists in another, such as IT, AI or computation [118].
4. Results and Discussion
This section outlines the results and corresponding discussion for the proposed model, which has been presented in the methodology section. As noted earlier, the proposed work is twofold in nature: first, it addresses a data-analytical framework for the prediction of airspace congestion, and for the estimation of airspace capacity; second, it incorporates an explainable system for DCM services. The results for these components are presented in the next sections.
4.1. UTM Congested Subzones: Identification and Area Distribution
As a novel, and highly promising means of transportation, urban air mobility seeks to provide secure, rapid travel via the use of airspace at low altitudes. This goal requires effective, safe flight management, via adjustments to route or time, so that large volumes of UAVs can be allocated flight paths without risk of collision. In turn, this demands the implementation of route-planning operations at a strategic level. Clearly, both efficiency and safety place constraints on the number of flights that the airspace can tolerate simultaneously. Efficiency, and even airspace stability, may be compromised if excessive numbers of confliction-resolution maneuvers are required to prevent incursions into UAVs’ protected zones. The optimal use of airspace demands a more robust and smoother management process, so that, e.g., more UAV operations can be conducted simultaneously.
In this section, we present our proposed data-analytics framework for characterizing traffic-flow patterns of (UTM) airspace, via analysis of simulated historical data. The pertinent data analysis supports the risk analysis, and it also improves trajectory planning in different airspace regions. In doing so, it considers all dynamic parameters, such as extreme weather, emergency services, and dynamic airspace structures. Later, we utilized this analysis to propose a tailored XAI solution, addressing the needs of demand and capacity management services for UTM airspace.
4.1.1. Congestion-Level Identification Using DBSCAN
This section presents the congestion sub-graphs, together with a discussion of the spatial distribution of the congestion hot spots for five threshold levels of congestion (lowest, lower, medium, higher, and highest). The clusters detected per congestion level, as described in this section, help measure the congested areas and their distribution for the entire airspace (as discussed in Section 3.1). The DBSCAN clustering was applied to detect subregions within each level of congestion, throughout the Bedfordshire airspace, utilizing a 64 × 64 km2 Area. DBSCAN clustering depends upon the input parameters epsilon and minPts [119], and we selected these parameters using a rule of thumb [120] that, in turn, depends on the number of dimensions (D) in the data set, normally the minPts ≥ D + 1. For larger datasets, with considerable noise, we suggest utilizing minPts = 2 × D. Since our data set is 2D, we designated it 2D + 1 = 5. The parameter epsilon (ε) was selected to accommodate both the domain knowledge and the current purpose: this purpose was to detect a cluster, in order to encapsulate an area polygon for traffic-flow measurement. Since the lowest-order and lower-order congestion regions were well scattered, we expected more clusters and area polygons here, as compared to the higher- and highest-order congested zones, where fewer clusters were expected, alongside more densely populated trajectory points. Thus, epsilon was tuned heuristically, taking the above goal into account. Further details regarding the flight-trajectory data-analytic framework, using DBSCAN, can be found in our previous work [121]. For the sake of clarity, the parameters used to tune the DBSCAN clustering for Scenario 3, and the results for this scenario, are shown below, in Table 2.
The area encapsulated within each cluster is calculated by forming an irregular polygon around the boundary of the congestion clusters, and by measuring the polygon area using the algorithm outlined in Figure 3. The congestion clusters, along with area polygons for the congestion levels of Scenario 3, are shown in Figure 5. The red dots in Figure 5 represent actual trajectory points in each congested cluster region. The yellow dots, conversely, show the centroid locations for each congested cluster region. The black lines represent the boundary around each congestion cluster, used for measuring effective polygon area. The circles or ellipses encapsulating the congestion cluster, present the maximum radius circle, with centroids as centers.
It may be observed, from the percentage cluster-count analysis (Table 2), that almost 62% of the clusters are formed in congested zones with less than 60% congestion levels, while 27% of the clusters belong to regions with congestion levels between 60% and 70%, and the remaining 11% are subject to higher- or highest-level congestion, between 70% and 100%. It can thus be inferred that congestion clusters are widely spread across the airspace for lowest- and lower-level congested areas, with much larger cluster counts. The medium-level clusters appear denser and less widely spread, as compared to those of the lowest- and lower-level congested regions. The sub-regions with higher and highest levels of congestion evince denser grouping, and more centralized regions when compared to previous congestion-level groups. This observation remains true for each scenario, 1–3. Nonetheless, the spatial locations of the cluster regions continually change, due to the opening or closing of dynamic airfields, adverse rain and wind, and extreme weather fronts.
4.1.2. Airspace-Congestion Distribution
This section explores the distribution of the airspace area utilized by UAV trajectories in different congested levels, as well as area distribution within each of the congested-level sub-regions in our three scenarios. This area is calculated using the area polygons identified in the previous section for each cluster and within different levels. We further present the statistical analysis of the area distribution, as well as the calculated cumulative area distribution per congestion level. The data trends clearly demonstrate a more widely spread, and larger, number of clusters for lower congestion regions, as compared to higher- and highest-congestion regions. We provide the congestion-distribution analysis for Scenario 3 only, but we will also discuss the tabular results for Scenarios 1 and 2. The distribution of congested areas per cluster and the cumulative area withheld by each congestion level under extreme weather conditions (Scenario 3) are shown in Figure 6 and Figure 7, respectively.
The results in Figure 6 indicate that the sub-regions with the lowest and lower levels of congestion evince the highest area usage by UAV trajectory. This utilization of area decreases in the case of medium-congested regions, and it is lowest for highly congested blocks. The cumulative area coverage for each congested level, from lowest to highest, is shown in Figure 7. It may be seen from this figure that lower- and higher-congested regions encompass almost comparable areas in the airspace. The statistical figures for congested-area utilization in each scenario, 1–3, are shown in Table 3.
It is evident from Table 3 that the maximum-area peaks lie in the lower and lowest congested regions, and these become smaller as the congestion rises, with the smallest peak lying in the higher and highest congested regions in all scenarios. Furthermore, the standard deviations in the case of no weather constraints (Scenario 1) are relatively consistent for other congestion regions, except for the highest congestion area, which experiences smaller congestion clusters. In the case of adverse wind and rain (Scenario 2), the standard deviation is the largest for lower-congestion regions. The highest congestion area exhibits a much bigger deviation from the mean due to a large and much denser cluster of congestion. Nevertheless, under extreme weather fronts (Scenario 3) the standard deviation is greatest in the lowest-congestion regions. The maximum-area peaks decrease in magnitude as the congestion rises. The mean-area values are small and consistent. The largest maximum-area peak lies in the higher congested regions.
Figure 8 presents the overall percentage distribution of the area being utilized by the UTM airspace environment, the latter including static NFZ, dynamic recreational areas and airfields, weather fronts due to rain, wind and extreme weather conditions, UAV trajectory-congestion clusters, and free airspace. It may be inferred from Figure 8 that UTM-free airspace declines from 42% to 30% in the second hour, and further falls to 23% in the third hour: this provides a clear indication of the impact of adverse weather conditions such as wind, rain and extreme weather fronts. It can also be seen that there is an increase in the percentage of UTM-congested airspace, due to UAV trajectories, from 34% to 42% in the second hour (10:00 am to 11:00 am). This further increases to 49% in the third hour (11:00 am to 12:00 pm). The cumulative areas for the lowest and highest congested clusters, for all three scenarios, are depicted in Table 4 and this supports the argument above. The congestion-area calculations cited previously were used to compute the traffic-flow capacity in all three scenarios as discussed in the next section.
4.1.3. Traffic-Flow Distribution and Airspace-Capacity Identification
This section addresses the traffic-flow distribution and capacity management for each of the three scenarios. More specifically, the traffic-flow distribution per cluster and per congestion level is presented below. Assuming a safe separation distance of 100 m, which equates to 100 UAV trajectories per km2, the available capacity is presented in Figure 9, Figure 10 and Figure 11. In these 3D plots, the Cx, Cy represent the locations of congestion cluster centroids in the airspace, as shown along the x-axis and the y-axis, whereas the z-axis represents the traffic-flow capacity. The blue bar graphs represent the predicted traffic flow for each cluster region, per level. The magenta-colored plane represents safe traffic flow for 100 UAV trajectories per km2 (traffic-flow threshold). The green plane is actually the zero-values reference plane, plotted for better visualization. The peach bar lines indicate the available capacity, which is the difference between the predicted traffic flow and the traffic-flow threshold. A positive peach-bar height represents the available capacity of those UAV trajectories that can be accommodated in a 1 km2 area. Negative peach bars, conversely, reflect the non-availability of airspace in the relevant clusters.
It is evident from the three figures that, in the lowest-congestion zones, positive capacity bars outnumber their negative equivalents. The lower-level zone evinces a mixture of both positive and negative traffic-flow capacity, while the medium-level congestion zones present more negative traffic-flow capacity. The higher and highest levels have either little or no positive capacity, and this reflects limited or zero availability of airspace for UAV operations. In order to review the traffic flow distribution in the temporal domain, the ratio between the number of positive to negative capacity bars is presented as a capacity ratio (see Table 5). This will highlight the efficiency of capacity in the three different scenarios that prevail from 9:00 am to 12:00 pm.
Table 5 indicates that the capacity ratio was higher in the lowest-congestion regions during adverse and extreme weather conditions (Scenario 2), rather than with static obstacles only (Scenario 1). This reveals that there were more opportunities to accommodate UAV trajectories during Scenarios 2 and 3 than during Scenario 1. The lower- and medium-congestion regions demonstrate that Scenarios 2 and 3 provide some capacity to accommodate UAV trajectories, although there is less scope for accommodation in Scenario 3. It was also noted that the regions with the higher and highest levels of congestion had very limited or zero opportunities to accommodate UAV trajectories across all three scenarios. It may thus be inferred that Scenario 3 resulted in more severe congestion, and this was consequently the most hazardous time zone in which to operate UAV missions.
The sections above demonstrate the traffic-flow distribution in different congestion subzones of the Bedfordshire airspace, followed by the provision of available capacity in these subzones. The preceding air traffic-flow analysis, in indicating the most appropriate regions for UAM operation (and non-available urban airspace) will clarify actual availability situations regarding UTM airspace. Moreover, this analysis enables the UTM operator to regulate and reconfigure UAV paths, based on graphs that, in turn, represent air-traffic hotspots. The analysis can also be used to mitigate congestion in predicted UAV-traffic hotspots while suggesting appropriate congestion-free trajectories based on the UAV mission priority. The analytical model, indeed, seeks to reduce the workload of the air-traffic controller by predicting congested areas in advance, and by facilitating appropriate action to prevent their formation.
The next section will utilize capacity distribution and available capacity, along with priority, to suggest a rule-based recommendation system (Demand and Capacity Management) for UTM authorities, as discussed in the Methodology section.
4.2. Analysis and Design of Explainability for the DCM Advisory System
The present section introduces the UTM advisory-system framework. A transparency hybrid AI algorithm provides the foundation for the latter, and this algorithm facilitates a DCM framework, for process and solution, which is both flexible and resilient. The stringent operational demands associated with low-altitude airspace, especially in urban environs, are thus satisfied. A training data-generation element is included within the hybrid AI algorithm, whereby the decision-making model is both trained and optimized. Hence, systemic decision-making performance is improved. The capacity of the system to produce multiple, practicable solutions to problems of airspace congestion is indicated via a preliminary case study, described below. In order to allow end-users to understand the causes of particular behaviors, and to render the trained model itself more transparent, various readily interpretable visual and textual explanations are generated. Some explanations by example are provided which illustrate the logic behind the decisions the UTM operator makes when indicating both the most appropriate regions for UAM operation and available urban airspace.
Depending on the criteria of explainability and accuracy, ML models may be placed in one of three principal categories, namely, Black Box, White Box, or Gray Box. White-Box models are those in which internal workings, logic and programming remain transparent. Consequently, the decisions they generate are readily interpretable. The most obvious example of the White-Box paradigm is a simple decision tree, but further instances are provided by Bayesian networks, linear-regression models, and Fuzzy Cognitive Maps [122]. The simplest models to explain are, generally, those that are monotonic and linear. Since certain fields, such as finance and medicine, evince a particular need for transparency, they are often associated with White-Box solutions [122,123]. Conversely, while Black-Box ML models are frequently more accurate, their internal processes are opaque and difficult to interpret. Hence, software testers, or stakeholders, may understand little more than the anticipated inputs and associated outputs of the model. The most widespread instances of such models are neural networks, either shallow or deep [123].
A Gray Box, as the name implies, combines characteristics of both Black and White [124]. As a compromise between the latter two, a Gray-Box solution seeks to reflect the main advantages of both, ultimately comprising a more effective, global composite model. Broadly speaking, the term Gray Box can be applied to any ML-learning algorithmic ensemble that presents both White and Black characteristics, and some forms of linear regression or neural networks fit this category. Fairly recently, Grau et al. [122] constructed a transparent, accurate and interpretable predictive model, via a self-labeled methodology, that combined elements of Black- and White-Box models.
Our recommendation-system methodology is a hybrid approach, in which we use less-explainable (Black-Box) deep learning LSTM for predicting congestion. This is followed by DBSCAN unsupervised learning, which is an explainable classifier, and finally, by a rule-based decision tree (White-Box) approach to make a final recommendation. We have used metrics to indicate the overall explainability of our hybrid model, based on the transparency of the individual components. The Black-Box models are not transparent, due to a lack of clarity regarding their inner workings. By contrast, White-Box models evince observable and understandable behaviors. We thus assign scores to our hybrid model components, as shown in Table 6.
We propose using a fusion of White-Box (explainable) and Black-Box models for our UTM recommendation system. The overall advisory-system methodology is divided into five components. Table 7 tabulates the UTM advisory system-component methodology, transparency type, and relevant scoring with reference to Table 6 Based on these metrics, we have also stated the overall explainability percentage measures of our hybrid advisory system, with a view to safety and capacity improvement in the UTM domain. It has thus been calculated that our proposed advisory system is around 70% explainable.
The proposed advisory system is a rule-based decision tree. It takes into account the information outlined above regarding each congestion level, and it checks whether capacity is available in the demanded cluster. Moreover, it also checks new incoming UAV mission priorities. If capacity is available, then decisions regarding accommodation are made according to priority, as explained in the Methodology section. If there is no capacity, the advisory system will suggest alternative available airspace for the UAV mission.
4.2.1. Rule-Based Explanation for DCM Decisions
Any model that generates rules to characterize the data from which it is expected to learn is an example of “rule-based learning.”. As a means of constructing knowledge, rules may comprise complex combinations of simple rules, or they may take the form of straightforward if/then conditional propositions. Fuzzy rule-based systems are also related to this model family, being designed for broader fields of action, and facilitating the construction of verbally defined rules for relatively imprecise domains. Since they can generate rules to clarify the basis of predictions, and since they are highly transparent, rule-based learners have often been deployed to explain more complex models [125]. They have also been widely used to represent knowledge within expert systems [79]. The rule-based methodology, as employed in the present study, unambiguously presents the decision boundary that obtains between advice provided and contrasting advice: this takes the form of if/else statements. A pair comprises the local explanation and this in turn contains (i) a logical rule, reflecting the decision-tree path that explains why a given decision output is classified as positive, and (ii) a counterfactual rule set, explaining why conditions should be modified, and an alternative decision should be registered. For example, we may have the following explanation for our recommendation system, for an event in a lowest-congestion zone: the rule (0% ≤ Congestion ≤ 20%, Available_Capacity > 0) Allow current airspace and the counterfactuals {Available_Capacity < 0}→Recommend free Airspace. We derived the local explanation from our suggested decision tree. The rule-based explanations for different cases are, meanwhile, presented in Figure 12. To enhance the readability, a flowchart of the proposed algorithm is presented in Figure 13. Flowchart of the proposed algorithm.
4.2.2. Post-Hoc Local Explanation: Visual Explanation
The goal of visual-explanation techniques, in the context of posthoc explainability, is to present model behavior in a visually comprehensible manner. Understanding may be further enhanced when these techniques are supplemented by other methods. Still, visualization is generally regarded as the best means for introducing complex interactions between model variables, especially for users unfamiliar with ML modeling. Visualizations are popular because of their natural, intuitive nature [126]. Much scholarly analysis has been devoted to determining which forms of visualization are best suited to particular types of practice or application. A notable example is that of the heatmap: the latter uses colors to identify certain words in a text, or areas of an image, that are central to the inferential process of a model [84,127]. The inner functions of a model can also be visually displayed via the use of graphical tools. Examples of this approach are the graphs presented in [128]: here, a network layer is represented by each node, while the edges serve as the inter-layer connectors.
To validate the results of our proposed decision-tree methodology, a constant number of incoming UAV trajectories (15 trajectories) has been assumed for the simulation in question. The priority level of the incoming UAV trajectory is treated as random, between priority levels 1–5. The results of the decision tree for all three scenarios are explained visually, and they are presented below in Figure 14, Figure 15 and Figure 16. In these 3D plots, the Cx and Cy are the locations of congestion-cluster centroids in the airspace, as indicated along the x-axis and y-axis, whereas the z-axis is the decision variable. The blue bar graphs, meanwhile, represent the updated capacity for each cluster region, per level. The magenta-colored bars represent the number of incoming UAV trajectories, while the yellow bars indicate the priority levels of incoming UAVs. The green plane, finally, is the zero-values reference plane, plotted for better visualization.
In the figures above, it may be observed that, if the updated capacity (blue bar) is positive, the UTM authority is advised to accommodate incoming UAV trajectories in that congestion region. This is in line with the priority-decision rule. If the updated capacity is negative, that particular cluster will be indicated as having no capacity; specifically, a zero value will be shown against that blue bar. Moreover, Figure 14, Figure 15 and Figure 16 show the advisory-system advice, in which the largest number of UAV missions with any priority should be planned for the lowest-congestion zones.
This advisory for the lowest-level congestion zone (Scenario 3) is illustrated with the help of one example (Figure 16). An emergency mission related to COVID-19 test-sample delivery (Priority 2) is planned in the vicinity of the lowest congestion-zone centroid (Cx = 6.86, Cy = 48.64) under extreme weather conditions. It is assumed that the planned mission has 15 UAV trajectory points, passing through this lowest congested zone. The updated capacity, as estimated for this sub-region by our recommendation system, is 35, and this is shown visually (blue bar) in Figure 16. The advisory system allows the fulfillment of this demand, bearing in mind the available capacity for this zone. A further example is provided here, whereby an emergency fire-surveillance mission (Priority 2) is planned in the area close to the highest congested-zone centroid (Cx = 24.33, Cy = 33.68): this references Scenario 3, under extreme weather conditions. It is also assumed that the mission has 15 UAV trajectory points planned for this region. The updated capacity, as estimated for this sub-region by our recommendation system, is a negative number marked as zero (capacity overloaded), with no blue magnitude bar. The advisory system will advise the UTM operator to divert low-priority flights in this area to other areas while creating airspace availability for current emergency operations.
The proposed advisory system thus helps support better airspace design, by providing a clearer picture of airspace congestion. This is supported by a characterization of airspace via five, lower to higher congestion levels. This will help UTM authorities achieve better flight management, based on historical or simulation-based data. Moreover, the advisory system suggests that missions planned through clusters with zero capacity should relocate, in order to use the freely available airspace and, thus, improve safety.
4.2.3. Post-Hoc Local Explanation: Explanation by Example
In the case of explanations by example, the focus is on the extraction of data examples, with the latter pertaining to the results generated by a particular model. In turn, this supports a more lucid understanding of the model per se. Much like human behavior (when people strive to explain a certain process), explanations by example focus on extracting typical, or representative, instances. These, in turn, help users grasp the correlations of the model under analysis, along with its internal relationships [79].
We may present two examples that indicate the simulatability and explainability of the proposed model for a decision-support system. One example references the lowest-congestion zone, and for completeness—the other concerns higher-congestion zones. In tandem with Figure 14 (Scenario 1) and considering the lowest-level congested zones (congestion < 20%), we can explain the inputs and the output decision taken by our advisory system, in order to allow access to new, incoming UAVs heading toward the zone or subregion in Cluster 5. For the sake of simplicity, we assumed 15 new UAV trajectory points in Scenario 1. The incoming UAV is of priority level 2. The updated capacity is 56: since that is a positive number, we can still accommodate more UAVs in this region before reaching the safe threshold of 100 UAV trajectories/km2. According to the rules set for the lowest-congested region, UAVs with any priority can use this airspace. Consequently, the advisory system allows the UAV to utilize the airspace encompassed in Cluster 5. Capacity is thus enhanced without any compromise in terms of safety. This example is illustrated in, where x signifies the inputs to the model , and y is the output decision suggested by the advisory model. The exact input values (x1,x2,x3,x4) that resulted in output (y) are also presented in the callout diagram (Figure 17).
The second example simulates the decision taken in Scenario 1 for the highest-congested zone (80 < congestion < 100%), implicating Clusters 1, 2 and 3 (Figure 18). Fifteen UAV trajectory points were planned for these regions, with all these UAVs engaged in priority level-1 missions. The updated capacity is a negative number, which indicates that the capacity threshold of 100 UAV trajectories /km2 is being violated. As per the rules defined by the advisory model, UAVs are advised to avoid these highly congested regions by using alternate free airspace. The safety of the airspace is thus improved.
4.3. Advisory-System Efficiencies for Capacity and Safety
This section introduces two metrics, namely, capacity gain and safety gain, which underpin the proposed decision-support system while reinforcing its efficiencies for all three scenarios. The proposed advisory system “efficiency” is twofold in nature. First, it effectively utilizes the available capacity in congested cluster zones of UTM airspace, thereby maximizing capacity. Second, the advisory system pre-empts safety hazards by using updated traffic flow and capacity models, thereby excluding planned missions from some medium-, higher- and highest-level congestion clusters. Table 8 presents the advisory system efficiency in terms of capacity and safety gains. If a congested cluster is utilized, this means that one capacity gain is achieved. If entry to a congested cluster is prohibited, conversely, this means no capacity is gained, but rather, one safety gain is acquired. The following equations are used to define the efficiencies of the advisory system in terms of capacity gain (CG) and percentage safety gain (SG):
The advisory system efficiencies for capacity and safety are explained in Figure 19, below:
The proposed advisory system presents more capacity-efficiency gains in the lowest- and lower-congested zones, and maximum safety gains in the higher- and highest-congested regions for all three scenarios. The static-obstacles scenario (Scenario 1) and the adverse wind and rain scenario (Scenario 2) present similar efficiency trends in low- and medium-congested levels, but they evince dissimilarity for higher-order congestion levels. It may further be deduced that the advisory system exhibits maximum safety efficiency, and minimum capacity efficiency, for medium-, higher- and highest-congestion zones when extreme weather conditions are experienced (Scenario 3).
4.4. Comparison of the Proposed Model with Other Approaches
As we noted earlier, the aims of the study were twofold: First, suitable approaches were identified to implement demand-and-capacity-management (DCM) services in the UTM system. Such a system should have a range of incorporated functions (e.g., trajectory allocation, flight planning, and the optimization of airspace capacity). Secondly, regarding the explainability of the decision-support system, this work provides different types of post-hoc explainability techniques presented in the literature [79].
This study compares the proposed model with two recent works in the field of demand and capacity management (DCM). Existing research [111] proposes an integrated strategy for shaping the service of dynamic capacity management (DCM) for future U-space operations. This integrated approach produces an optimal solution that minimizes operational costs while maintaining airspace thresholds for traffic density. To accomplish the DCB mission in dense urban airspace, a novel framework [129] is presented, namely a hybrid AI algorithm architecture based on Deep Q Learning (DQN) + GA. To ensure optimal performance of strategic decision-making components, the hybrid AI architecture utilizes current state data for various factors, including UAV operating states, airspace states, flow management states, and low-altitude airspace environmental changes. Although the above studies showed promising results by providing effective DCB solutions to the UTM system, these proposed approaches did not provide more details on how it enhances the efficiency of UTM airspace by balancing capacity and safety. Additionally, the main limitation is the lack of explainability and transparency of their prediction results, which restricts their practical application. In contrast to the above studies, this work developed an explainable advisory system to support UTM demand and capacity-management services by quantifying airspace availability and highlighting the most suitable regions for UAM operations. Moreover, this work addresses balancing capacity and safety in UTM airspace by utilizing congested cluster zones to increase efficiency while maintaining safety. The proposed approach involves continuous traffic monitoring and provides recommendations for the maximum number of vehicles that a congested cluster zone can accommodate. These recommendations are based on updated traffic flow and capacity models, as well as the assigned priority of UAVs. Specifically, this study introduces two metrics, capacity gain, and safety gain, which underpin the proposed decision-support system while reinforcing its efficiencies.
Moreover, to thoroughly analyze and compare these three approaches, we introduced metrics for factor comparison that represent the key methodology considerations provided in the above studies. If a factor is addressed in a methodology, we assign it a unity count; otherwise, we assign it a null or zero weight. We also included a maximum capacity efficiency figure of merit based on individual scheme data. Table 9 below shows the remarks and weights assigned to various factors for the three methodologies presented in [111,129], and this XAI DCM. It can be observed from the comparison table that the proposed XAI DCM surpasses the [111,129] methodologies based on more realistic airspace considerations and thus present an overall weight factor of 81% as compared to the above methodologies with 55% and 40%, respectively.
5. Conclusions and Future Work
Compared with the traditional ATM environment, the difficulties associated with traffic-flow management in low-altitude airspace are markedly greater. For example, UAS operations involve traffic that is both heterogeneous and high in density; conventional, strategic planning methods for Air Traffic Flow Management cannot be adapted to such conditions. To complicate matters further, complex environmental variables are implicated in low-altitude urban airspace. These include physical obstacles, both static and dynamic, and the possibility of adverse weather. A wide range of AI/ML algorithms are characterized by non-transparent, Black-Box modeling paradigms, but this is unacceptable in the present case. Rather, decision support-system resolutions must be transparent, explainable, trustworthy, and readily understandable, and strategies must be developed to ensure this outcome.
The present paper has proposed a decision-making system for UTM based on Explainable AI, and in particular, a Deep Learning Network (LSTM) combined with a rule-based decision tree, to determine optimal Demand Capacity-Balancing solutions. Within this project, we demonstrated an integrated approach aimed at shaping the service of DCM in UTM/UAM operations. Our study has thus proposed, and implemented, an explainable recommendation system for capacity and safety management. This involves a hybrid approach using (i) Deep Learning for the precise prediction of congestion, (ii) DBSCAN data analytics for detecting physically congested sub-region cluster patterns, and (iii) rule-based decision logic for understandable UTM decision-making. This hybrid approach results in an intelligent, comprehensive and understandable decision support-system model. The approach also combines the modules of flight planning, airspace configuration and demand capacity-balancing optimization. Due to the insufficient availability of UAS traffic data, the proposed model has been validated using a drone delivery system for essential delivery missions, with different levels of priority assigned to each mission.
The congested-clusters pattern analysis for all three scenarios (including static NFZ, as well as adverse wind, rain and severe weather conditions) reveals that congested-cluster areas are broadly spread across the entire Bedfordshire UTM airspace, as regards lower- and lowest-level choked areas. The medium-level congested areas appear slightly denser and less widely spread, compared to those of the lower- and lowest-level congested regions. The sub-regions with higher and highest levels of congestion show more intense grouping, and more centralized regional locations, as compared with other congestion-level groups. As we pursued more detailed knowledge, we noted that UTM free-airspace availability declines from 42% to 23% from the first hour of UAV operations to the third, due to the impact of adverse weather conditions (wind, rain, and extreme weather fronts). The overall UTM congested airspace in these regions also increases during these hours of operation, from 34% to 49%, respectively.
The study of traffic-flow capacity reveals that, under a safe separation distance of 100m, the lower- and lowest-congestion zones in the Bedfordshire area present ample capacity for future airspace operations. Indeed, the medium-congested zones also offer some available capacity. The higher- and highest-congestion zones present no capacity, and thus no airspace availability for UAV operations. The capacity-ratio analysis further reveals that, for lower-congestion zones, adverse wind, rain and extreme weather conditions still allow additional capacity for airspace operations. Under scenarios of extreme weather conditions, by contrast, the higher- and highest-congested zones do not present any airspace to accommodate UAV missions. Such times, in fact, are the least propitious for operations in these zones.
One may conclude, from the proposed visually explainable advisory system, that more UAV missions (of any priority) may be planned for the lowest-congestion zones for the three hours in question (9:00 am–12:00 pm), within Bedfordshire airspace. Moreover, the advisory system shows capacity-efficiency variation from 25% to 35% in the lowest-congested zones, while this falls to almost zero for higher-order congested regions during the three hours of UAV operation. The safety efficiency varies between 75% and 65% in the lowest-congested areas, but this reaches almost 100% in their highest-congested counterparts. It may further be deduced that the proposed advisory system demonstrates greater safety efficiency, but less capacity efficiency, for medium-, higher- and highest-congestion zones under extreme weather conditions. The proposed model permits the UTM operator to regulate and reconfigure UAV paths, based on complexity predictions representing air-traffic hotspots. The model can also be used to mitigate congestion in predicted UAV traffic hotspots while suggesting appropriate conflict-free trajectories. The advisory recommendations system would help UTM systems to off-burden the manual decision-making process via visual data analytics and via suggestions made by our proposed model for safe and optimal-capacity airspace environments. The proposed advisory system is also verifiable through explanation by example, and this should increase the confidence of UTM authorities in adopting our proposed hybrid methodology. Indeed, the scoring-based metrics evaluate the explainability percentage for the proposed system at about 70%.
We intend, in our future work, to extend the usage of the proposed interpretative framework to other areas. Alternatively, we may seek to enhance mutual trust between intelligent systems and human beings by deploying other varieties of AI, such as SHAP, LIME, and global and/or local explanatory methodologies. Moreover, we are considering the application of the work described above (regarding UTM congestion, traffic flow and capacity measurement) to certain other regions of UK airspace, which evince a more diverse set of airspace configurations and anticipate a much denser flow of UTM traffic in future.
In our future studies, we will also take various types of UAVs into account since they have distinct requirements for safe separation distance due to their diverse flight characteristics, such as speed, endurance, altitude capabilities, and weather resistance. This can affect the areas where UAVs are permitted to fly and how they interact with other airspace users, which could potentially impact the estimation of airspace capacity.
Author Contributions
Conceptualization, A.A., I.P. and D.P.; methodology and validation, A.A.; writing, A.A.; review, editing and supervision, I.P. and D.P. All authors have read and agreed to the published version of the manuscript.
Funding
This research received no external funding.
Institutional Review Board Statement
Not applicable.
Informed Consent Statement
Not applicable.
Data Availability Statement
Not applicable.
Conflicts of Interest
The authors declare no conflict of interest.
References
- Kim, Y.; Jo, J.; Shaw, M. A Lightweight Communication Architecture for Small UAS Traffic Management (sUTM). In Proceedings of the 2015 Integrated Communication, Navigation and Surveillance Conference (ICNS), Herdon, VA, USA, 21–23 April 2015. [Google Scholar] [CrossRef]
- Kopardekar, P.; Rios, J.; Prevot, T.; Johnson, M.; Jung, J.; Robinson, J.E. Unmanned Aircraft System Traffic Management (UTM) Concept of Operations. In Proceedings of the AIAA Aviation and Aeronautics Forum (Aviation 2016), 2016 (ARC-E-DAA-TN32838), Washington, DC, USA, 13–17 June 2016; pp. 1–16. [Google Scholar]
- Mueller, E.; Kopardekar, P.; Goodrich, K. Enabling Airspace Integration for High-Density On-Demand Mobility Operations. In Proceedings of the 17th AIAA Aviation Technology, Integration, and Operations Conference, Denver, CO, USA, 5–9 June 2017; pp. 1–24. [Google Scholar] [CrossRef]
- Kistan, T.; Gardi, A.; Sabatini, R.; Ramasamy, S.; Batuwangala, E. An evolutionary outlook of air traffic flow management techniques. Prog. Aerosp. Sci. 2017, 88, 15–42. [Google Scholar] [CrossRef]
- Ali, B.S. Management for Drones Flying in the City. In Proceedings of the 22nd Air Transport Research Society (Atrs) World Conference Atcoex, Seoul, Republic of Korea, 2–5 July 2018; Available online: http://eprints.um.edu.my/18968/1/Traffic_Management_for_Drones_Flying_in_the_City.pdf (accessed on 4 March 2023).
- Liu, Y.; Zhang, X.; Wang, Z.; Gao, Z.; Liu, C. Ground Risk Assessment of UAV Operations Based on Horizontal Distance Estimation under Uncertain Conditions. Math. Probl. Eng. 2021, 2021, 3384870. [Google Scholar] [CrossRef]
- Primatesta, S.; Rizzo, A.; la Cour-Harbo, A. Ground Risk Map for Unmanned Aircraft in Urban Environments. J. Intell. Robot. Syst. Theory Appl. 2020, 97, 489–509. [Google Scholar] [CrossRef]
- McCarthy, T.; Pforte, L.; Burke, R. Fundamental elements of an urban UTM. Aerospace 2020, 7, 85. [Google Scholar] [CrossRef]
- International Civil Aviation Organization. Doc. 4444—Procedures for Air Navigation Services—Air Traffic Management; International Civil Aviation Organization (ICAO): Montreal, QC, Canada, 2016; ISBN 978-92-9258-081-0. [Google Scholar]
- Bertsimas, D.; Patterson, S.S. The air traffic flow management problem with enroute capacities. Oper. Res. 1998, 46, 406–422. [Google Scholar] [CrossRef]
- Crespo, A.M.F.; Weigang, L.; de Barros, A.G. Reinforcement learning agents to tactical air traffic flow management. Int. J. Aviat. Manag. 2012, 1, 145. [Google Scholar] [CrossRef]
- Gardi, A.; Sabatini, R.; Ramasamy, S. Multi-objective optimisation of aircraft flight trajectories in the ATM and avionics context. Prog. Aerosp. Sci. 2016, 83, 1–36. [Google Scholar] [CrossRef]
- Pongsakornsathien, N.; Bijjahalli, S.; Gardi, A.; Symons, A.; Xi, Y.; Sabatini, R.; Kistan, T. A performance-based airspace model for unmanned aircraft systems traffic management. Aerospace 2020, 7, 154. [Google Scholar] [CrossRef]
- Bauranov, A.; Rakas, J. Designing airspace for urban air mobility: A review of concepts and approaches. Prog. Aerosp. Sci. 2021, 125, 100726. [Google Scholar] [CrossRef]
- Balakrishnan, K.; Polastre, J.; Mooberry, J.; Golding, R.; Sachs, P. Blueprint for the Sky: The Roadmap for the Safe Integration of Autonomous Aircraft; Airbus_UTM_Blueprint; Airbus UTM: San Francisco, CA, USA, 2018. [Google Scholar]
- Chan, W.N.; Barmore, B.E.; Kibler, J.; Lee, P.; Connor, N.O.; Palopo, K.; Thipphavong, D.; Zelinski, S. Overview of NASA’s Air Traffic Management—Exploration (ATM-X) Project. In Proceedings of the AIAA Aviation Forum 2018, No. ARC-E-DAA-TN57276. Atlanta, GA, USA, 25–29 June 2018. [Google Scholar]
- Engineer, P. ATM-X UAM Subproject. 2020. Available online: https://ntrs.nasa.gov/citations/20210000102 (accessed on 3 April 2023).
- Nawaz, H.; Ali, H.M.; Laghari, A.A. UAV Communication Networks Issues: A Review. Arch. Comput. Methods Eng. 2021, 28, 1349–1369. [Google Scholar] [CrossRef]
- Degas, A.; Islam, M.R.; Hurter, C.; Barua, S.; Rahman, H.; Poudel, M.; Ruscio, D.; Ahmed, M.U.; Begum, S.; Rahman, M.A.; et al. A Survey on Artificial Intelligence (AI) and eXplainable AI in Air Traffic Management: Current Trends and Development with Future Research Trajectory. Appl. Sci. 2022, 12, 1295. [Google Scholar] [CrossRef]
- Kistan, T.; Gardi, A.; Sabatini, R. Machine learning and cognitive ergonomics in air traffic management: Recent developments and considerations for certification. Aerospace 2018, 5, 103. [Google Scholar] [CrossRef]
- Borst, C.; Bijsterbosch, V.A.; van Paassen, M.M.; Mulder, M. Ecological interface design: Supporting fault diagnosis of automated advice in a supervisory air traffic control task. Cogn. Technol. Work 2017, 19, 545–560. [Google Scholar] [CrossRef]
- Borghini, G.; Aricò, P.; DI Flumeri, G.; Cartocci, G.; Colosimo, A.; Bonelli, S.; Golfetti, A.; Imbert, J.P.; Granger, G.; Benhacene, R.; et al. EEG-Based Cognitive Control Behaviour Assessment: An Ecological study with Professional Air Traffic Controllers. Sci. Rep. 2017, 7, 547. [Google Scholar] [CrossRef] [PubMed]
- Sheh, R.; Monteath, I. Defining Explainable AI for Requirements Analysis. KI-Kunstl. Intelligenz 2018, 32, 261–266. [Google Scholar] [CrossRef]
- Mueller, S.T.; Hoffman, R.R.; Clancey, W.; Emrey, A.; Klein, G. Explanation in Human-AI Systems: A Literature Meta-Review. synopsis of key ideas and publications, and bibliography for explainable AI. arXiv 2019, arXiv:1902.01876. [Google Scholar]
- Marcos, R.; García-cantú, O.; Herranz, R. A Machine Learning Approach to Air Traffic Route Choice Modelling. arXiv 2018, arXiv:1802.06588. [Google Scholar]
- Choi, S.; Kim, Y.J.; Briceno, S.; Mavris, D. Prediction of Weather-Induced Airline Delays Based on Machine Learning Algorithms. In Proceedings of the 2016 IEEE/AIAA 35th Digital Avionics Systems Conference (DASC), Sacramento, CA, USA, 25–29 September 2016. [Google Scholar]
- Carvalho, L.; Sternberg, A.; Maia Gonçalves, L.; Beatriz Cruz, A.; Soares, J.A.; Brandão, D.; Carvalho, D.; Ogasawara, E. On the relevance of data science for flight delay research: A systematic review. Transp. Rev. 2021, 41, 499–528. [Google Scholar] [CrossRef]
- Lee, H. Taxi-out Time Prediction for Departures at Charlotte Airport. In Proceedings of the 16th AIAA Aviation Technology, Integration, and Operations Conference, Washington, DC, USA, 13–17 June 2016. [Google Scholar]
- Ayhan, S.; Samet, H. Aircraft Trajectory Prediction Made Easy with Predictive Analytics. In Proceedings of the 22nd ACM SIGKDD International Conference on Knowledge Discovery and Data Mining, San Francisco, CA, USA, 13–17 August 2016; pp. 21–30. [Google Scholar] [CrossRef]
- Oehling, J.; Barry, D.J. Using machine learning methods in airline flight data monitoring to generate new operational safety knowledge from existing data. Saf. Sci. 2019, 114, 89–104. [Google Scholar] [CrossRef]
- Büsing, C.; Kadatz, D.; Cleophas, C. Capacity uncertainty in airline revenue management: Models, algorithms, and computations. Transp. Sci. 2019, 53, 383–400. [Google Scholar] [CrossRef]
- Chung, S.H.; Ma, H.L.; Chan, H.K. Cascading Delay Risk of Airline Workforce Deployments with Crew Pairing and Schedule Optimization. Risk Anal. 2017, 37, 1443–1458. [Google Scholar] [CrossRef] [PubMed]
- Liu, Y.; Liu, Y.; Hansen, M.; Pozdnukhov, A.; Zhang, D. Using machine learning to analyze air traffic management actions: Ground delay program case study. Transp. Res. Part E Logist. Transp. Rev. 2019, 131, 80–95. [Google Scholar] [CrossRef]
- Yanying, Y.; Mo, H.; Haifeng, L. Classification Prediction Analysis of Flight Cancellation Based on Spark. Procedia Comput. Sci. 2020, 162, 480–486. [Google Scholar] [CrossRef]
- Tian, Y.; Ye, B.; Wan, L.; Yang, M.; Xing, D. Restricted airspace unit identification using density-based spatial clustering of applications with noise. Sustainability 2019, 11, 5962. [Google Scholar] [CrossRef]
- Pouyanfar, S.; Sadiq, S.; Yan, Y.; Tian, H.; Tao, Y.; Reyes, M.P.; Iyengar, S.S. A survey on deep learning: Algorithms, techniques, and applications. ACM Comput. Surv. 2018, 51, 1–36. [Google Scholar] [CrossRef]
- Sternberg, A.; Carvalho, D.; Murta, L.; Soares, J.; Ogasawara, E. An analysis of Brazilian flight delays based on frequent patterns. Transp. Res. Part E Logist. Transp. Rev. 2016, 95, 282–298. [Google Scholar] [CrossRef]
- Cheng, J.; Rong, C.; Ye, H.; Zheng, X. Risk Management Using Big real Time Data. In Proceedings of the 2015 IEEE 7th International Conference on Cloud Computing Technology and Science (CloudCom), Vancouver, BC, Canada, 30 November–3 December 2015; 2016; pp. 542–547. [Google Scholar] [CrossRef]
- Arnaldo Scarpel, R.; Pelicioni, L.C. A data analytics approach for anticipating congested days at the São Paulo International Airport. J. Air Transp. Manag. 2018, 72, 1–10. [Google Scholar] [CrossRef]
- Cheng, J. Estimation of Flight Delay Using Weighted Spline Combined with ARIMA Model. proceedings of the 7th IEEE/International Conference on Advanced Infocomm Technology, Fuzhou, China, 14–16 November 2014; 2015; pp. 8–20. [Google Scholar] [CrossRef]
- Alligier, R.; Gianazza, D.; Durand, N. Machine Learning and Mass Estimation Methods for Ground-Based Aircraft Climb Prediction. IEEE Trans. Intell. Transp. Syst. 2015, 16, 3138–3149. [Google Scholar] [CrossRef]
- Takeichi, N.; Kaida, R.; Shimomura, A.; Yamauchi, T. Prediction of delay due to air traffic control by machine learning. AIAA Model. Simul. Technol. Conf. 2017, 8. [Google Scholar] [CrossRef]
- Torens, C.; Jünger, F.; Schirmer, S.; Schopferer, S.; Maienschein, T.; Dauer, J.C. Machine Learning Verification and Safety for Unmanned Aircraft—A Literature Study. In Proceedings of the AIAA Scitech 2022 Forum, San Diego, CA, USA, 3–7 January 2022. [Google Scholar] [CrossRef]
- FAA Concept of Operations v2.0. Enabling Civ. Low-altitude Airsp. Unmanned Aircr. Syst. Oper. 2020. Available online: https://utm.arc.nasa.gov/index.shtml (accessed on 5 March 2023).
- Krittanawong, C.; Zhang, H.J.; Wang, Z.; Aydar, M.; Kitai, T. Artificial Intelligence in Precision Cardiovascular Medicine. J. Am. Coll. Cardiol. 2017, 69, 2657–2664. [Google Scholar] [CrossRef]
- Keneni, B.M.; Kaur, D.; Al Bataineh, A.; Devabhaktuni, V.K.; Javaid, A.Y.; Zaientz, J.D.; Marinier, R.P. Evolving Rule-Based Explainable Artificial Intelligence for Unmanned Aerial Vehicles. IEEE Access 2019, 7, 17001–17016. [Google Scholar] [CrossRef]
- Xie, Y.; Pongsakornsathien, N.; Gardi, A.; Sabatini, R. Explanation of Machine-Learning Solutions in Air-Traffic Management. Aerospace 2021, 8, 224. [Google Scholar] [CrossRef]
- Faria, J.M. Machine learning safety: An overview. In Proceedings of the 26th Safety-Critical Systems Symposium, York, UK, 6–8 February 2018; pp. 6–8. [Google Scholar]
- Tambon, F.; Laberge, G.; An, L.; Nikanjam, A.; Mindom, P.S.N.; Pequignot, Y.; Khomh, F.; Antoniol, G.; Merlo, E.; Laviolette, F. How to certify machine learning based safety-critical systems? A systematic literature review. Autom. Softw. Eng. 2022, 29, 38. [Google Scholar] [CrossRef]
- Amodei, D.; Olah, C.; Steinhardt, J.; Christiano, P.; Schulman, J.; Mané, D. Concrete Problems in AI Safety. arXiv 2016, arXiv:1606.06565. [Google Scholar]
- Serban, A.C. Designing Safety Critical Software Systems to Manage Inherent Uncertainty. In Proceedings of the 2019 IEEE International Conference on Software Architecture Companion (ICSA-C), Hamburg, Germany, 25–26 March 2019; pp. 246–249. [Google Scholar] [CrossRef]
- Hains, G.; Jakobsson, A.; Khmelevsky, Y. Towards Formal Methods and Software Engineering for Deep Learning: Security, Safety and Productivity for dl Systems Development. In Proceedings of the 2018 Annual IEEE International Systems Conference (SysCon), Vancouver, BC, Canada, 23–26 April 2018; pp. 1–5. [Google Scholar] [CrossRef]
- Bharadwaj; Prakash, K.B.; Kanagachidambaresan, G.R. Pattern Recognition and Machine Learning; Springer: New York, NY, USA, 2021; ISBN 9780387310732. [Google Scholar]
- Rodríguez-Dapena, P. Software safety certification: A multidomain problem. IEEE Softw. 1999, 16, 31–38. [Google Scholar] [CrossRef]
- Youn, W.K.; Hong, S.B.; Oh, K.R.; Ahn, O.S. Software certification of safety-critical avionic systems: DO-178C and its impacts. IEEE Aerosp. Electron. Syst. Mag. 2015, 30, 4–13. [Google Scholar] [CrossRef]
- Artificial, E.; Roadmap, I.; Artificial, E.; Roadmap, I. A Human-Centric Approach to AI in Aviation; European Aviation Safety Agency: Cologne, Germany, 2020; Volume 1. [Google Scholar]
- Gabreau, C.; Pesquet-Popescu, B.; Kaakai, F.; Lefevre, B. AI for Future Skies: On-going standardization activities to build the next certification/approval framework for airborne and ground aeronautical products. CEUR Workshop Proc. 2021, 2916. [Google Scholar]
- Jean-Marc, C.; Xavier, C.; Henriquel; Soudain, S.G.; Vaubourg, S.; van der Brugge, H.; van Dijk, L.; Perret-Gentil, J.M.K.C.; Whittington, P.I. Concepts of Design Assurance for Neural Networks (CoDANN) II Public Extract. 2021. Available online: https://avsi.aero/wp-content/uploads/2020/06/AFE-87-Final-Report.pdf (accessed on 8 April 2023).
- Aerospace Vehicle Systems Institut. AVSI Final Report AFE 87—Machine Learning. Document ID: 87-REP-01. Available online: https://avsi.aero/projects/current-projects/cert-of-ml-systems/afe-87-machine-learning/ (accessed on 8 April 2023).
- Kumeno, F. Sofware engneering challenges for machine learning applications: A literature review. Intell. Decis. Technol. 2020, 13, 463–476. [Google Scholar] [CrossRef]
- Pereira, A.; Thomas, C. Challenges of Machine Learning Applied to Safety-Critical Cyber-Physical Systems. Mach. Learn. Knowl. Extr. 2020, 2, 31. [Google Scholar] [CrossRef]
- Ashmore, R.; Calinescu, R.; Paterson, C. Assuring the Machine Learning Lifecycle: Desiderata, Methods, and Challenges. ACM Comput. Surv. 2021, 54, 1–39. [Google Scholar] [CrossRef]
- Liu, W.; Wang, Z.; Liu, X.; Zeng, N.; Liu, Y.; Alsaadi, F.E. A Survey of Deep Neural Network Architectures and Their Applications. Neurocomputing 2017, 234, 11–26. Available online: https://wwwsciencedirectcom/science/article/pii/S0925231216315533 (accessed on 8 April 2023). [CrossRef]
- Padakandla, S. A Survey of Reinforcement Learning Algorithms for Dynamically Varying Environments. ACM Comput. Surv. 2021, 54, 1–25. [Google Scholar] [CrossRef]
- Arulkumaran, K.; Deisenroth, M.P.; Brundage, M.; Bharath, A.A. Deep reinforcement learning: A brief survey. IEEE Signal Process. Mag. 2017, 34, 26–38. [Google Scholar] [CrossRef]
- Lu, J.; Behbood, V.; Hao, P.; Zuo, H.; Xue, S.; Zhang, G. Transfer learning using computational intelligence: A survey. Knowledge-Based Syst. 2015, 80, 14–23. [Google Scholar] [CrossRef]
- Weiss, K.; Khoshgoftaar, T.M.; Wang, D.D. A Survey of Transfer Learning; Springer International Publishing: Cham, Switzerland, 2016; Volume 3, ISBN 4053701600. [Google Scholar]
- Gomes, H.M.; Barddal, J.P.; Enembreck, A.F.; Bifet, A. A survey on ensemble learning for data stream classification. ACM Comput. Surv. 2017, 50, 1–23. [Google Scholar] [CrossRef]
- Krawczyk, B.; Minku, L.L.; Gama, J.; Stefanowski, J.; Woźniak, M. Ensemble learning for data stream analysis: A survey. Inf. Fusion 2017, 37, 132–156. [Google Scholar] [CrossRef]
- Katz, G.; Huang, D.A.; Ibeling, D.; Julian, K.; Lazarus, C.; Lim, R.; Shah, P.; Thakoor, S.; Wu, H.; Zeljić, A.; et al. The Marabou Framework for Verification and Analysis of Deep Neural Networks. In Computer Aided Verification: 31st International Conference, CAV 2019, New York City, NY, USA, 15–18 July 2019; Springer International Publishing: Cham, Switzerland, 2019; pp. 443–452. [Google Scholar] [CrossRef]
- Hawkins, R.; Paterson, C.; Picardi, C.; Jia, Y.; Calinescu, R.; Habli, I. Guidance on the Assurance of Machine Learning in Autonomous Systems (AMLAS). arXiv 2021, arXiv:2102.01564. [Google Scholar]
- Molnar, C. Interpretable Machine Learning A Guide for Making Black Box Models Explainable. Available online: https://christophm.github.io/interpretable-ml-book/ (accessed on 22 March 2023).
- Marcus, G. Deep Learning: A Critical Appraisal. arXiv 2018, arXiv:1801.00631. [Google Scholar]
- Preece, A.; Harborne, D.; Braines, D.; Tomsett, R.; Chakraborty, S. Stakeholders in Explainable AI. arXiv 2018, arXiv:1810.00184. [Google Scholar]
- Gunning, D. DARPA’s Explainable Artificial Intelligence Program. AI Mag. 2019, 40, 44–58. [Google Scholar] [CrossRef]
- Tjoa, E.; Guan, C. A Survey on Explainable Artificial Intelligence (XAI): Toward Medical XAI. IEEE Trans. Neural Networks Learn. Syst. 2021, 32, 4793–4813. [Google Scholar] [CrossRef]
- Zhu, J.; Liapis, A.; Risi, S.; Bidarra, R.; Youngblood, G.M. Explainable AI for Designers: A Human-Centered Perspective on Mixed-Initiative Co-Creation. In Proceedings of the 2018 IEEE Conference on Computational Intelligence and Games (CIG), Maastricht, the Netherlands, 14–17 August 2018; pp. 1–8. [Google Scholar] [CrossRef]
- Dosilovic, F.K.; Brcic, M.; Hlupic, N. Explainable Artificial Intelligence: A Survey. In Proceedings of the 2018 41st International Convention on Information and Communication Technology, Electronics and Microelectronics, Opatija, Croatia, 21–25 May 2018; pp. 210–215. [Google Scholar]
- Barredo Arrieta, A.; Díaz-Rodríguez, N.; Del Ser, J.; Bennetot, A.; Tabik, S.; Barbado, A.; Garcia, S.; Gil-Lopez, S.; Molina, D.; Benjamins, R.; et al. Explainable Artificial Intelligence (XAI): Concepts, taxonomies, opportunities and challenges toward responsible AI. Inf. Fusion 2020, 58, 82–115. [Google Scholar] [CrossRef]
- Lipton, Z.C. The Mythos of Model Interpretability: In Machine Learning, the Concept of Interpretability Is Both Important and Slippery. Queue 2018, 16, 31–57. [Google Scholar] [CrossRef]
- Kucklick, J.-P. Towards a Model- and Data-Focused Taxonomy of XAI Systems. In Wirtschaftsinformatik 2022 Proceedings. 2022. Available online: https://aisel.aisnet.org/wi2022/business_analytics/business_analytics/2 (accessed on 5 March 2023).
- Rudin, C. Stop explaining black box machine learning models for high stakes decisions and use interpretable models instead. Nat. Mach. Intell. 2019, 1, 206–215. [Google Scholar] [CrossRef] [PubMed]
- Lechner, M.; Hasani, R.; Amini, A.; Henzinger, T.A.; Rus, D.; Grosu, R. Neural circuit policies enabling auditable autonomy. Nat. Mach. Intell. 2020, 2, 642–652. [Google Scholar] [CrossRef]
- Ribeiro, M.T.; Singh, S.; Guestrin, C. “Why Should I Trust You?” Explaining the Predictions of Any Classifier. In Proceedings of the 22nd ACM SIGKDD International Conference on Knowledge Discovery and Data Mining, San Francisco, CA, USA, 13–17 August 2016; 2016; pp. 97–101. [Google Scholar] [CrossRef]
- Lundberg, S.M.; Lee, S.-I. A Unified Approach to Interpreting Model Predictions. Adv. Neural Inf. Process. Syst. 2017, 30. [Google Scholar]
- Strumbelj, E.; Kononenko, I. An Efficient Explanation of Individual Classifications using Game Theory. J. Mach. Learn. Res. 2010, 11, 1–18. [Google Scholar]
- Lundberg, S.M.; Erion, G.; Chen, H.; Degrave, A.; Prutkin, J.M.; Nair, B.; Katz, R.; Himmelfarb, J.; Bansal, N.; Lee, S. From local explanations to global understanding with explainable AI for trees. Nat. Mach. Intell. 2020, 2, 56–67. [Google Scholar] [CrossRef]
- Lei, T.; Barzilay, R.; Jaakkola, T. Rationalizing neural predictions. arXiv 2016, arXiv:1606.04155. [Google Scholar]
- Kim, B.; Wattenberg, M.; Gilmer, J.; Cai, C.; Wexler, J.; Viegas, F.; Sayres, R. Interpretability Beyond Feature Attribution: Quantitative Testing with Concept Activation Vectors (TCAV). In Proceedings of the 35th International Conference on Machine Learning, Stockholm, Sweden, 10–15 July 2018; Volume 6, pp. 4186–4195. [Google Scholar]
- Lamy, J.B.; Sekar, B.; Guezennec, G.; Bouaud, J.; Séroussi, B. Explainable artificial intelligence for breast cancer: A visual case-based reasoning approach. Artif. Intell. Med. 2019, 94, 42–53. [Google Scholar] [CrossRef]
- Hoffman, R.R.; Mueller, S.T.; Klein, G.; Litman, J. Metrics for Explainable AI: Challenges and Prospects. arXiv 2018, arXiv:1812.04608. [Google Scholar]
- Mohseni, S.; Zarei, N.; Ragan, E.D. A Multidisciplinary Survey and Framework for Design and Evaluation of Explainable AI Systems. ACM Trans. Interact. Intell. Syst. 2021, 11, 1–45. [Google Scholar] [CrossRef]
- Doshi-Velez, F.; Kim, B. Towards A Rigorous Science of Interpretable Machine Learning. arXiv 2017, arXiv:1702.08608. [Google Scholar]
- Majumdar, A.; Ochieng, W.Y.; Bentham, J.; Richards, M. En-route sector capacity estimation methodologies: An international survey. J. Air Transp. Manag. 2005, 11, 375–387. [Google Scholar] [CrossRef]
- Klein, A.; Cook, L.; Wood, B.; Simenauer, D. Airspace Capacity Estimation Using Flows and Weather-Impacted Traffic Index the Task of Translating Weather Information into TFM Constraints Scope of Current Research. In Proceedings of the 2008 Integrated Communications, Navigation and Surveillance Conference, Bethesda, MD, USA, 5–7 May 2008. [Google Scholar]
- Sunil, E.; Hoekstra, J.; Ellerbroek, J.; Bussink, F.; Delahaye, D.; Nieuwenhuisen, D.; Sunil, E.; Hoekstra, J.; Ellerbroek, J.; Bussink, F.; et al. How Do Layered Airspace Design Parameters Affect Airspace Capacity and Safety? In Proceedings of the 7th International Conference on Research in Air Transportation, Philadelphia, PA, USA, 20–24 June 2016; ICRAT: Philadelphia, PA, USA, 2016; pp. 1–8. [Google Scholar]
- Welch, J.D. En Route Sector Capacity Model Final Report. 2015. Available online: https://archive.ll.mit.edu/mission/aviation/publications/publication-files/atc-reports/Welch_2015_ATC-426(accessed on 8 April 2023).
- Prandini, M.; Piroddi, L.; Puechmorel, S.; Brazdilova, S.L. Toward Air Traffic Complexity Assessment in New Generation Air Traffic Management Systems. IEEE Trans. Intell. Transp. Syst. 2011, 12, 809–818. [Google Scholar] [CrossRef]
- Banerjee, S. Mathematical Modeling Models, Analysis and Applications, 2nd ed.; Chapman and Hall/CRC: New York, NY, USA, 2021. [Google Scholar]
- Kopardekar, P.H.; Schwartz, A.; Magyarits, S.; Rhodes, J. Airspace complexity measurement: An air traffic control simulation analysis. Int. J. Ind. Eng. 2009, 16, 61–70. [Google Scholar]
- Kopardekar, P. Dynamic Density—A Review of Proposed Variables. In Overall Conclusions and Recommendations; FAA WJHTC Internal Document; Federal Aviation Administration: Washington, DC, USA, 2000; pp. 1–13. Available online: http://tinyurl.com/ahbgfrr (accessed on 18 February 2023).
- Ho, F.; Geraldes, R.; Gonçalves, A.; Rigault, B.; Sportich, B.; Kubo, D.; Cavazza, M.; Prendinger, H. Decentralized Multi-Agent Path Finding for UAV Traffic Management. IEEE Trans. Intell. Transp. Syst. 2020, 23, 997–1008. [Google Scholar] [CrossRef]
- Wang, Z.; Pan, W.; Li, H.; Wang, X.; Zuo, Q. Review of Deep Reinforcement Learning Approaches for Conflict Resolution in Air Traffic Control. Aerospace 2022, 9, 294. [Google Scholar] [CrossRef]
- Brown, T.B.; Mann, B.; Ryder, N.; Subbiah, M.; Kaplan, J.; Dhariwal, P.; Neelakantan, A.; Shyam, P.; Sastry, G.; Askell, A.; et al. Language Models are Few-Shot Learners. CoRR 2020, 33, 1877–1901. Available online: https://arxivorg/abs/200514165 (accessed on 18 February 2023).
- Wang, D.; Tan, D.; Liu, L. Particle swarm optimization algorithm: An overview. Soft Comput. 2018, 22, 387–408. [Google Scholar] [CrossRef]
- Bijjahalli, S.; Sabatini, R.; Gardi, A. Advances in intelligent and autonomous navigation systems for small UAS. Prog. Aerosp. Sci. 2020, 115, 100617. [Google Scholar] [CrossRef]
- Radzki, G.; Golinska-Dawson, P.; Bocewicz, G.; Banaszak, Z. Modelling Robust Delivery Scenarios for a Fleet of Unmanned Aerial Vehicles in Disaster Relief Missions. J. Intell. Robot. Syst. Theory Appl. 2021, 103, 63. [Google Scholar] [CrossRef]
- García, A.; Delahaye, D.; Soler, M. Air Traffic Complexity Map based on Linear Dynamical Systems. 2020. Available online: https://hal-enac.archives-ouvertes.fr/hal-02512103 (accessed on 2 March 2023).
- Ribeiro, M.; Ellerbroek, J.; Hoekstra, J. Analysis of conflict resolution methods for manned and unmanned aviation using fast-time simulations. 9th SESAR Innov. Days 2019. Available online: https://www.sesarju.eu/sites/default/files/documents/sid/2019/papers/SIDs_2019_paper_69.pdf (accessed on 2 March 2023).
- Alharbi, A.; Petrunin, I.; Panagiotakopoulos, D. Deep Learning Architecture for UAV Traffic-Density Prediction. Drones 2023, 7, 78. [Google Scholar] [CrossRef]
- Tang, Y.; Xu, Y.; Inalhan, G. An Integrated Approach for On-Demand Dynamic Capacity Management Service in U-Space. IEEE Trans. Aerosp. Electron. Syst. 2022, 58, 4180–4195. [Google Scholar] [CrossRef]
- Capitán, C.; Pérez-León, H.; Capitán, J.; Castaño, Á.; Ollero, A. Unmanned Aerial Traffic Management System Architecture for U-Space In-Flight Services. Appl. Sci. 2021, 11, 3995. [Google Scholar] [CrossRef]
- Escalonilla, P.S.; Janisch, D.; Forster, C.; Büddefeld, M.; Teomitzi, H.E. Towards a continuous Demand and Capacity. Balancing Process for U-Space.
- Thipphavong, D.P.; Apaza, R.D.; Barmore, B.E.; Battiste, V.; Belcastro, C.M.; Burian, B.K.; Dao, Q.V.; Feary, M.S.; Go, S.; Goodrich, K.H.; et al. Urban Air Mobility Airspace Integration Concepts and Considerations. In Proceedings of the 2018 Aviation Technology, Integration, and Operations Conference, Atlanta, Georgia, 25–29 June 2018; p. 3676. [Google Scholar] [CrossRef]
- Vascik, P.; Hansman, R.; Dunn, N. Analysis of Urban Air Mobility Operational Constraints. J. Air Transp. 2018, 26, 1–14. [Google Scholar] [CrossRef]
- Chin, C.; Gopalakrishnan, K.; Balakrishnan, H.; Egorov, M.; Evans, A. Tradeoffs between Efficiency and Fairness in Unmanned Aircraft Systems Traffic Management. In Proceedings of the 9th International Conference on Research in Air Transportation, Virtual Event, 15 September 2020; The European Organisation for the Safety of Air Navigation (EUROCONTROL): Brussels, Belgium, 2020; pp. 1–8. [Google Scholar]
- Quinlan, J.R. Simplifying decision trees. Int. J. Hum. Comput. Stud. 1999, 51, 497–510. [Google Scholar] [CrossRef]
- Gokceoglu, C.; Nefeslioglu, H.A.; Sezer, E.; Bozkir, A.S.; Duman, T.Y. Assessment of landslide susceptibility by decision trees in the metropolitan area of Istanbul, Turkey. Math. Probl. Eng. 2010, 2010, 901095. [Google Scholar] [CrossRef]
- Schubert, E.; Sander, J.; Ester, M.; Kriegel, H.P.; Xu, X. DBSCAN revisited, revisited: Why and how you should (still) use DBSCAN. ACM Trans. Database Syst. 2017, 42, 1–21. [Google Scholar] [CrossRef]
- Allen, J.C. Sample size calculation for two independent groups: A useful rule of thumb. Proc. Singapore Healthc. 2011, 20, 138–140. [Google Scholar] [CrossRef]
- Alharbi, A.; Petrunin, I.; Panagiotakopoulos, D. Modeling and Characterization of Traffic Flow Patterns and Identification of Airspace Density for UTM application. IEEE Access 2022, 10, 130110–130134. [Google Scholar] [CrossRef]
- Grau, I.; Sengupta, D.; Matilde, M.; Lorenzo, G.; Nowe, A. Grey-Box Model: An Ensemble Approach for Addressing Semi-Supervised Classification Problems. In Proceedings of the 25th Belgian-Dutch Conference on Machine Learning, Kortrijk, Belgium, 12–13 September 2016; pp. 1–3. [Google Scholar]
- Robnik-Šikonja, M.; Kononenko, I. Explaining classifications for individual instances. IEEE Trans. Knowl. Data Eng. 2008, 20, 589–600. [Google Scholar] [CrossRef]
- Pintelas, E.; Livieris, I.E.; Pintelas, P. A Grey-Box ensemble model exploiting Black-Box accuracy and White-Box intrinsic interpretability. Algorithms 2020, 13, 17. [Google Scholar] [CrossRef]
- Wang, Q.; Shen, Y.P.; Chen, Y.W. Rule extraction from support vector machines. J. Natl. Univ. Def. Technol. 2006, 28, 106–110. [Google Scholar] [CrossRef]
- Vilone, G.; Longo, L. Classification of Explainable Artificial Intelligence Methods through Their Output Formats. Mach. Learn. Knowl. Extr. 2021, 3, 32. [Google Scholar] [CrossRef]
- Strobelt, H.; Gehrmann, S.; Pfister, H.; Rush, A.M. LSTMVis: A Tool for Visual Analysis of Hidden State Dynamics in Recurrent Neural Networks. IEEE Trans. Vis. Comput. Graph. 2018, 24, 667–676. [Google Scholar] [CrossRef] [PubMed]
- Wongsuphasawat, K.; Smilkov, D.; Wexler, J.; Wilson, J.; Mané, D.; Fritz, D.; Krishnan, D.; Viégas, F.B.; Wattenberg, M. Visualizing Dataflow Graphs of Deep Learning Models in TensorFlow. IEEE Trans. Vis. Comput. Graph. 2018, 24, 1–12. [Google Scholar] [CrossRef]
- Xie, Y.; Gardi, A.; Sabatini, R. Hybrid AI-Based Demand-Capacity Balancing for UAS Traffic Management and Urban Air Mobility. In Proceedings of the AIAA Aviation 2021 Forum, Virtual Event, 2–6 August 2021; pp. 8–10. [Google Scholar] [CrossRef]
Figure 1.
Structure of this study.

Figure 2.
Classification of explainable AI methods (Adapted from the work of (Xie, et al. [47]).
Figure 2.
Classification of explainable AI methods (Adapted from the work of (Xie, et al. [47]).

Figure 3.
The explainable machine-learning model for the safe and efficient operation of UAVs.

Figure 4.
Scenario 3, 200 UAVs with extreme weather effects.

Figure 5.
Congestion-cluster levels for Scenario 3: (a) Lowest level; (b) Lower level; (c) Medium level; (d) Higher level and (e) Highest level.
Figure 5.
Congestion-cluster levels for Scenario 3: (a) Lowest level; (b) Lower level; (c) Medium level; (d) Higher level and (e) Highest level.

Figure 6.
Area distribution per level, per cluster: Scenario 3.

Figure 7.
Cumulative area distribution per level: Scenario 3.

Figure 8.
Percentage congestion distribution for all three scenarios: (a) first; (b) second and (c) third scenario.
Figure 8.
Percentage congestion distribution for all three scenarios: (a) first; (b) second and (c) third scenario.

Figure 9.
Traffic flow distribution and airspace capacity: Scenario 1.

Figure 10.
Traffic-flow distribution and airspace capacity: Scenario 2.

Figure 11.
Traffic-flow distribution and airspace capacity: Scenario 3.

Figure 12.
Rule-based decision tree for DCM services.

Figure 13.
Flowchart of the proposed algorithm.

Figure 14.
Decision-support results: Scenario 1.

Figure 15.
Decision-support results: Scenario 2.

Figure 16.
Decision-support results: Scenario 3.

Figure 17.
Explanation by example for Scenario 1, lowest congestion level.

Figure 18.
Explanation by example for Scenario 1, highest congestion level.

Figure 19.
Capacity gain (CG) and safety gain (SG) for all three scenarios.


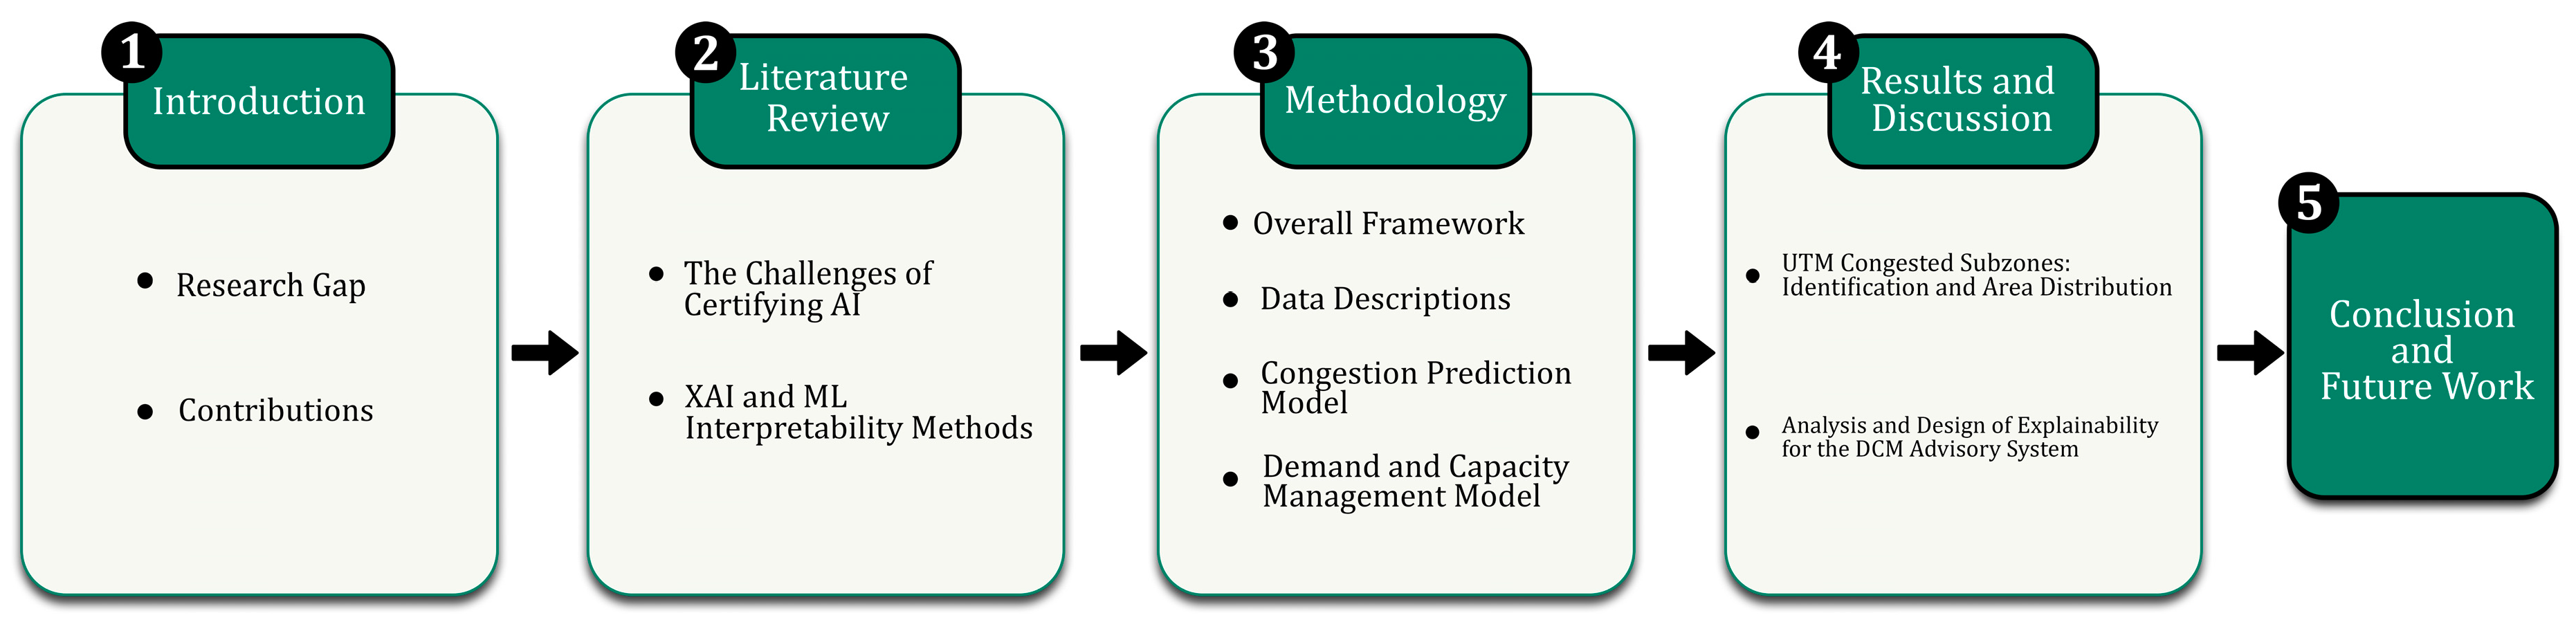
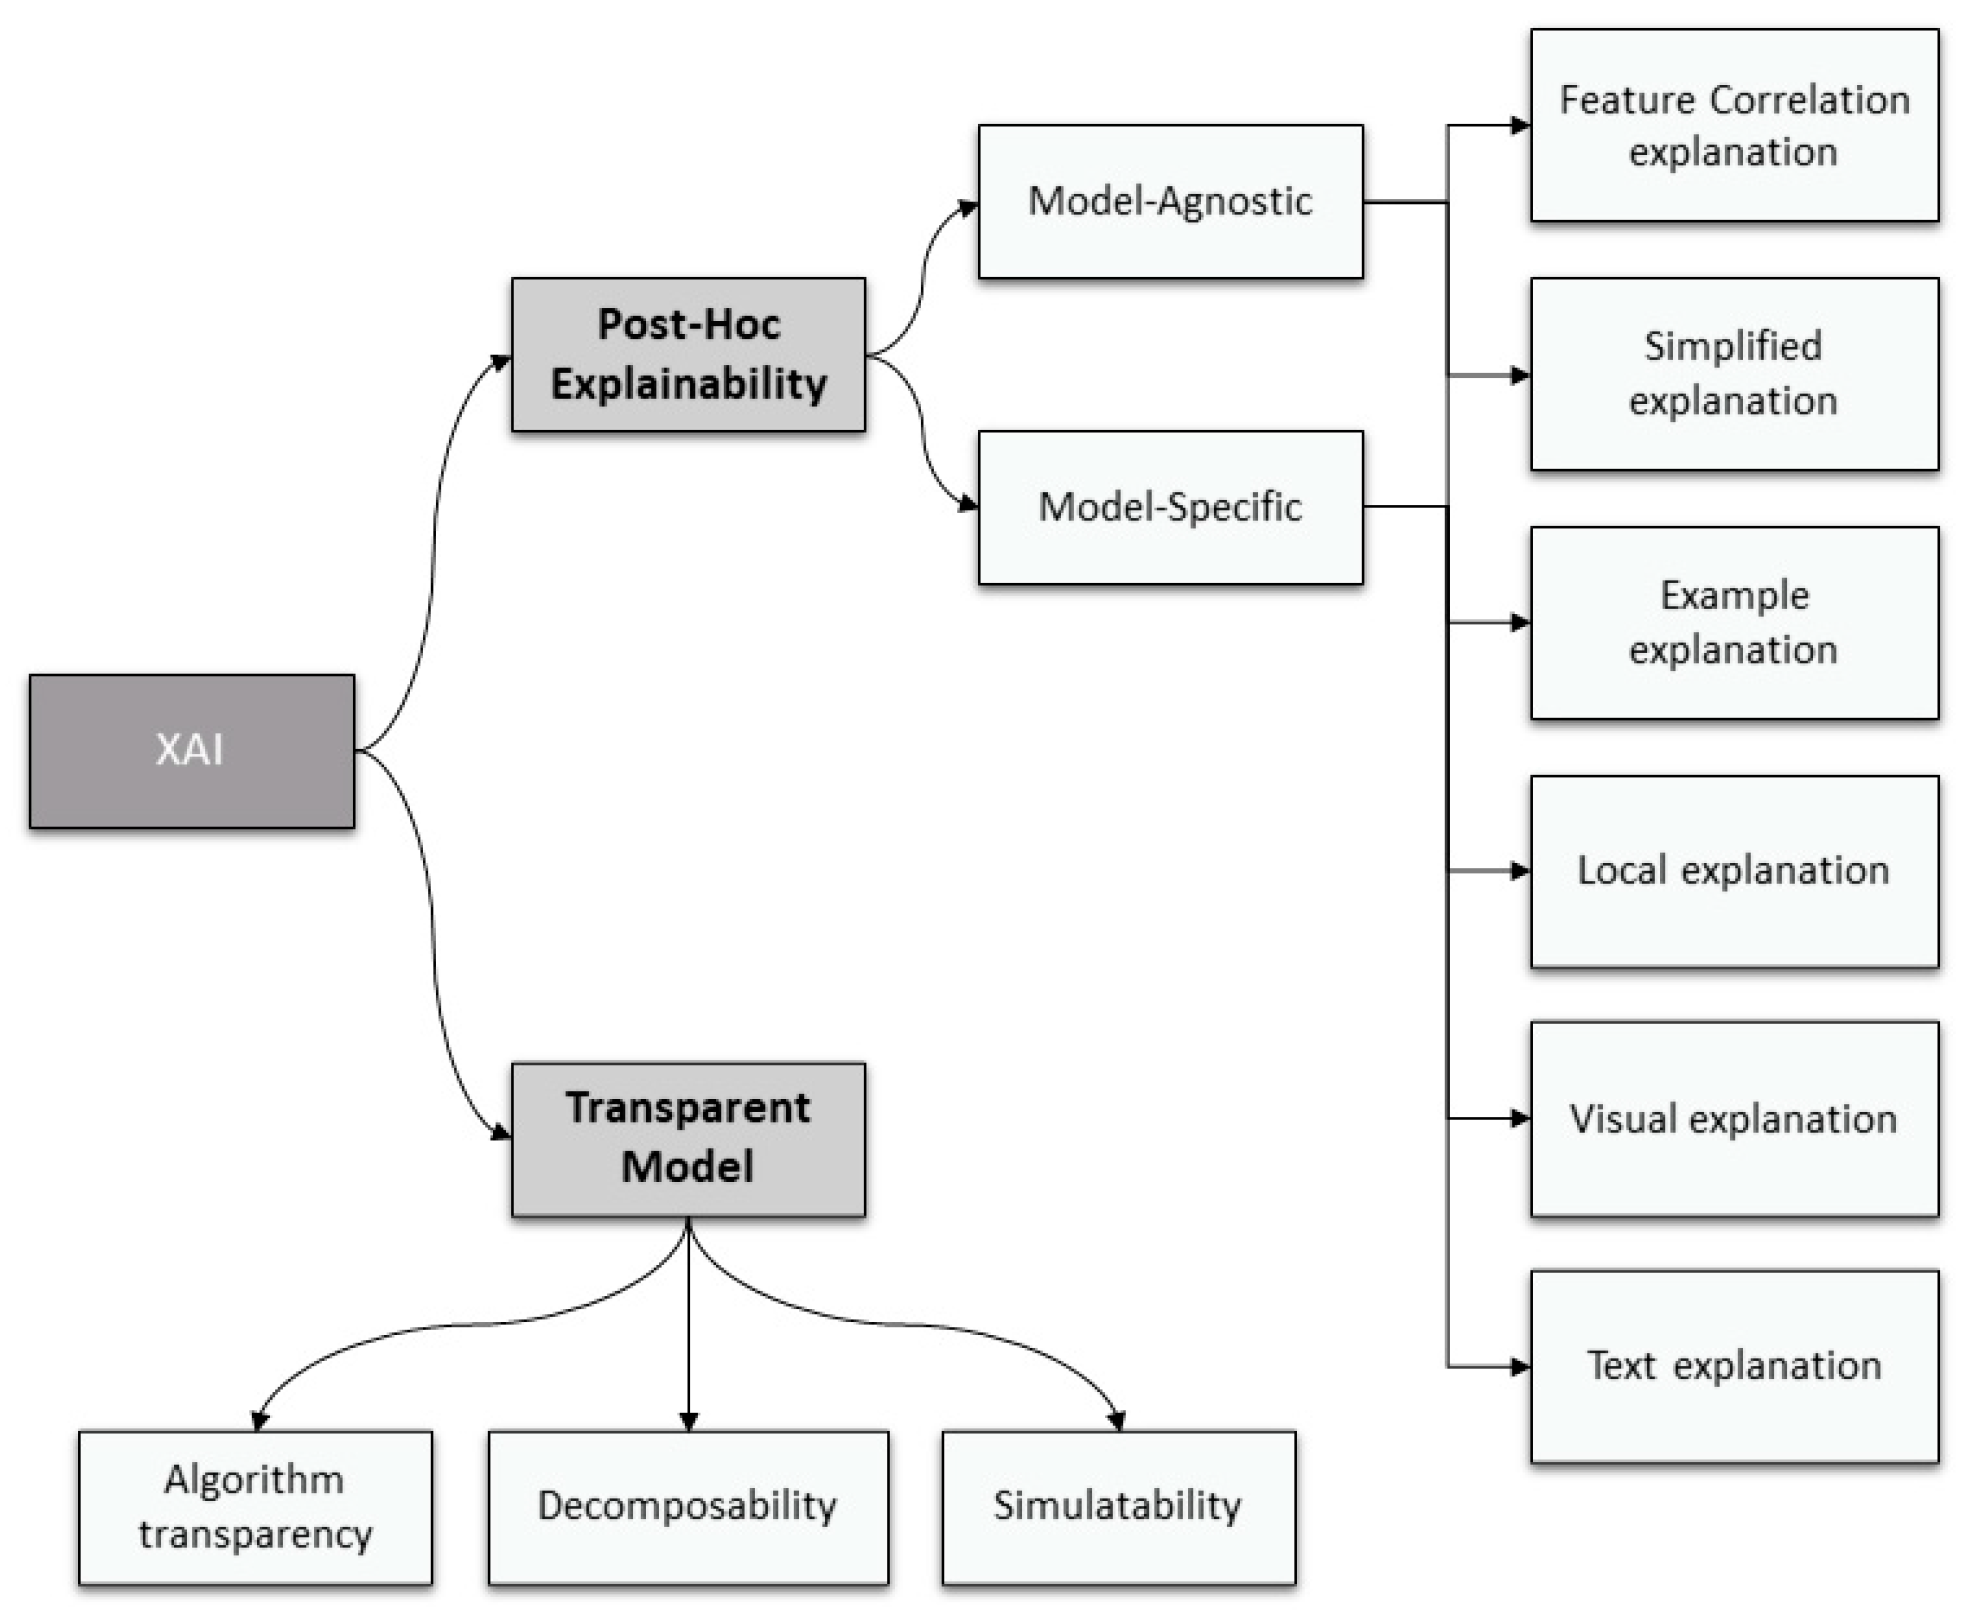
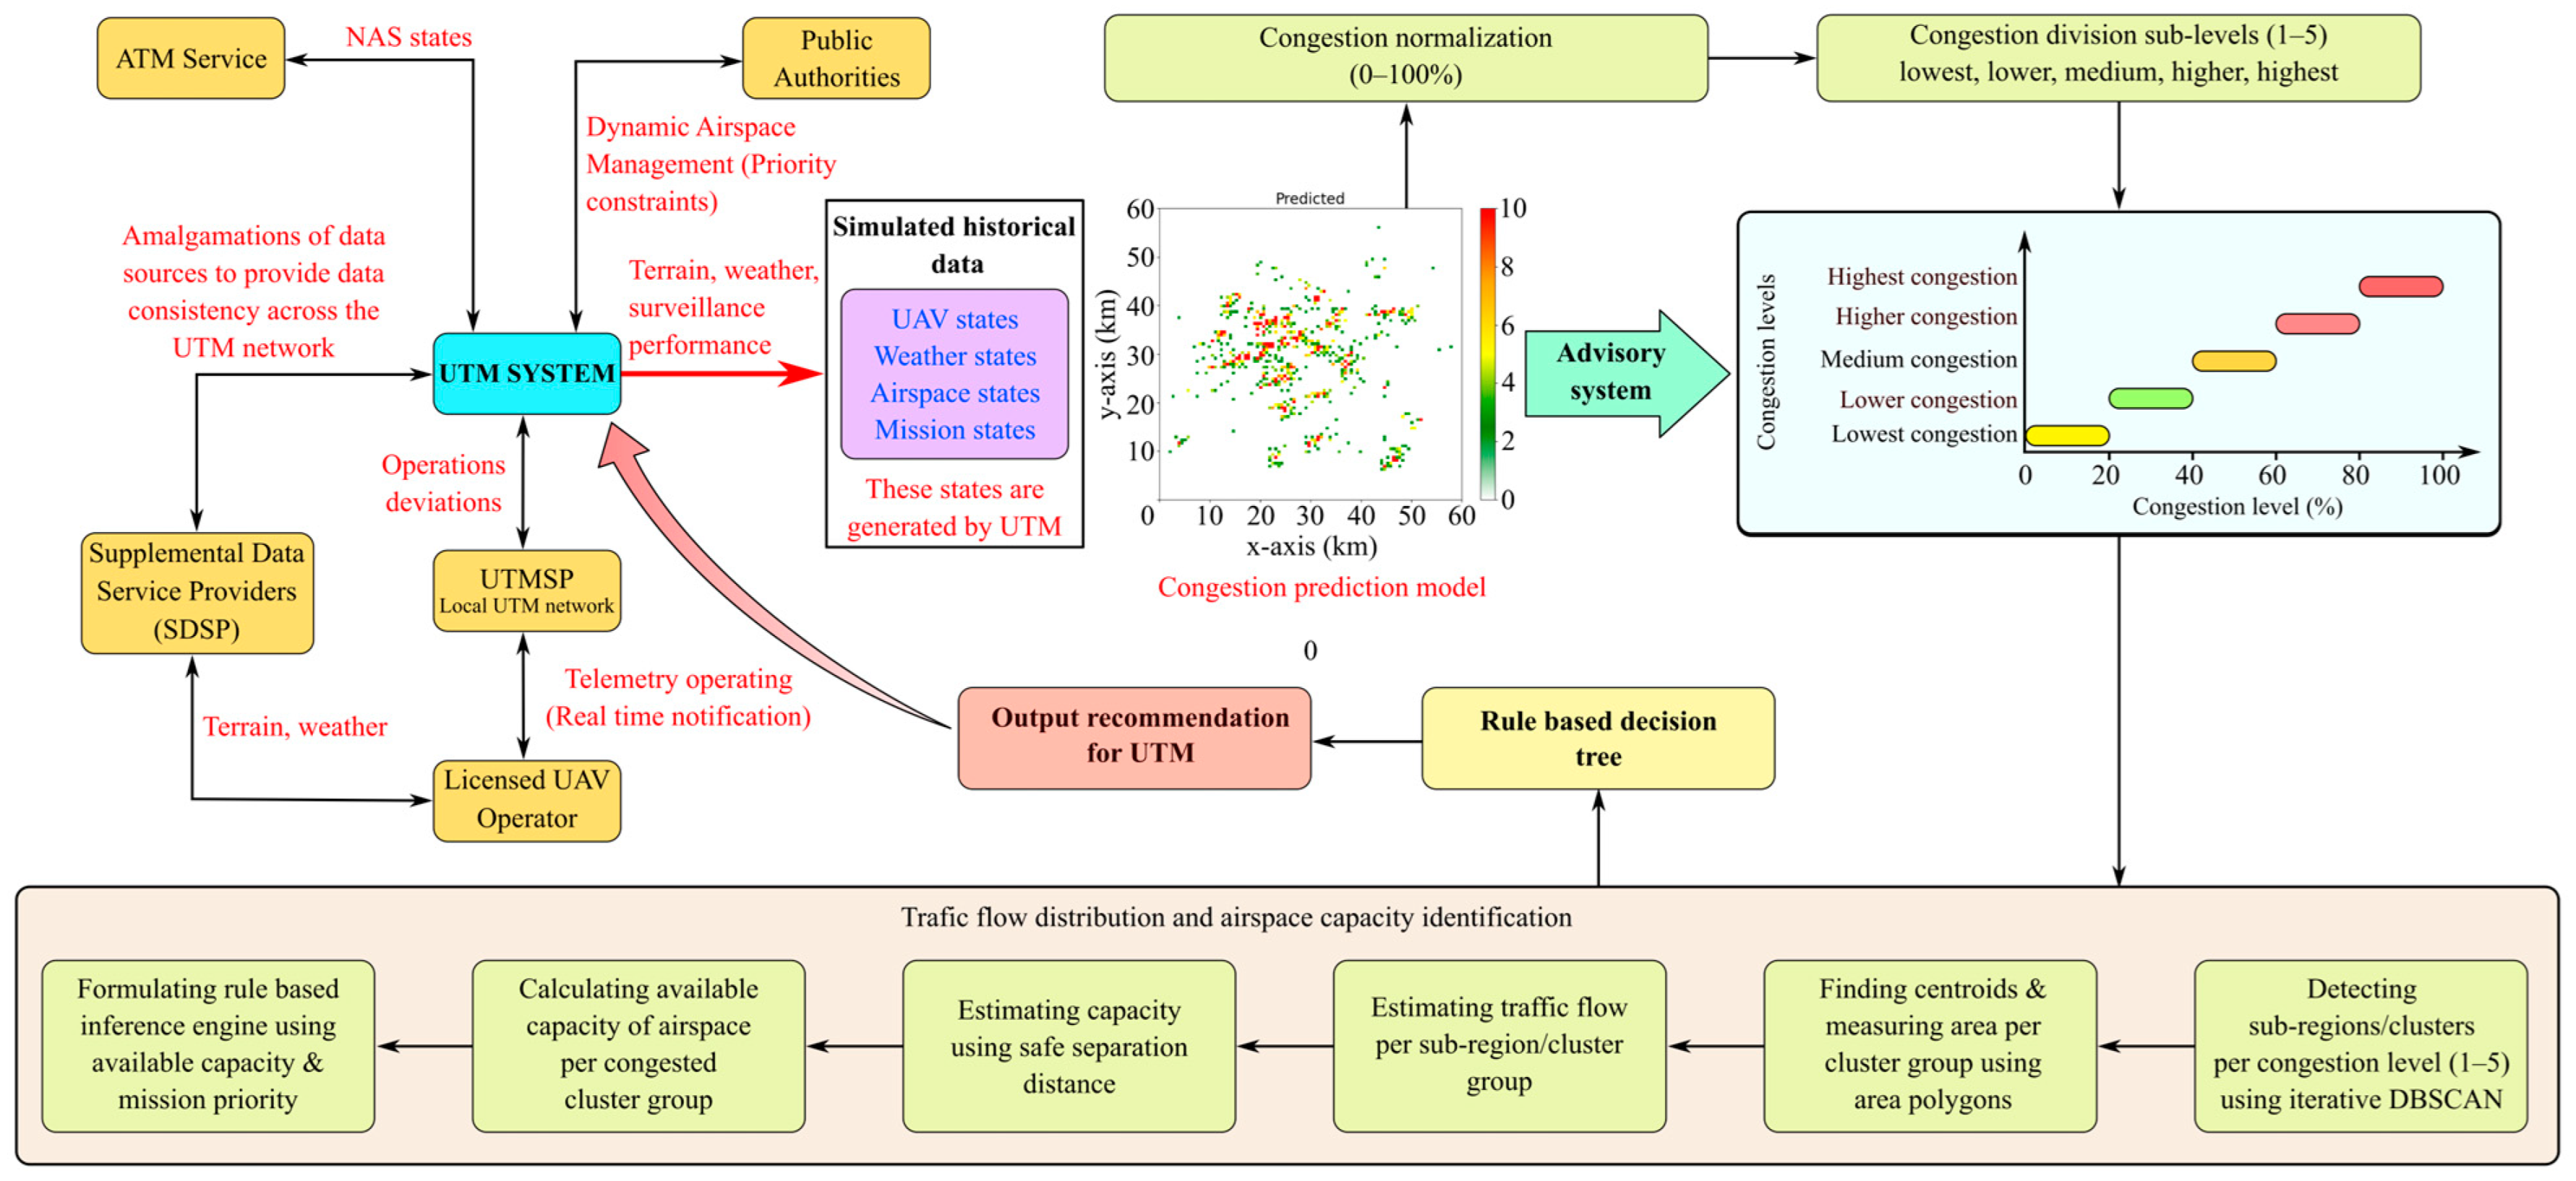
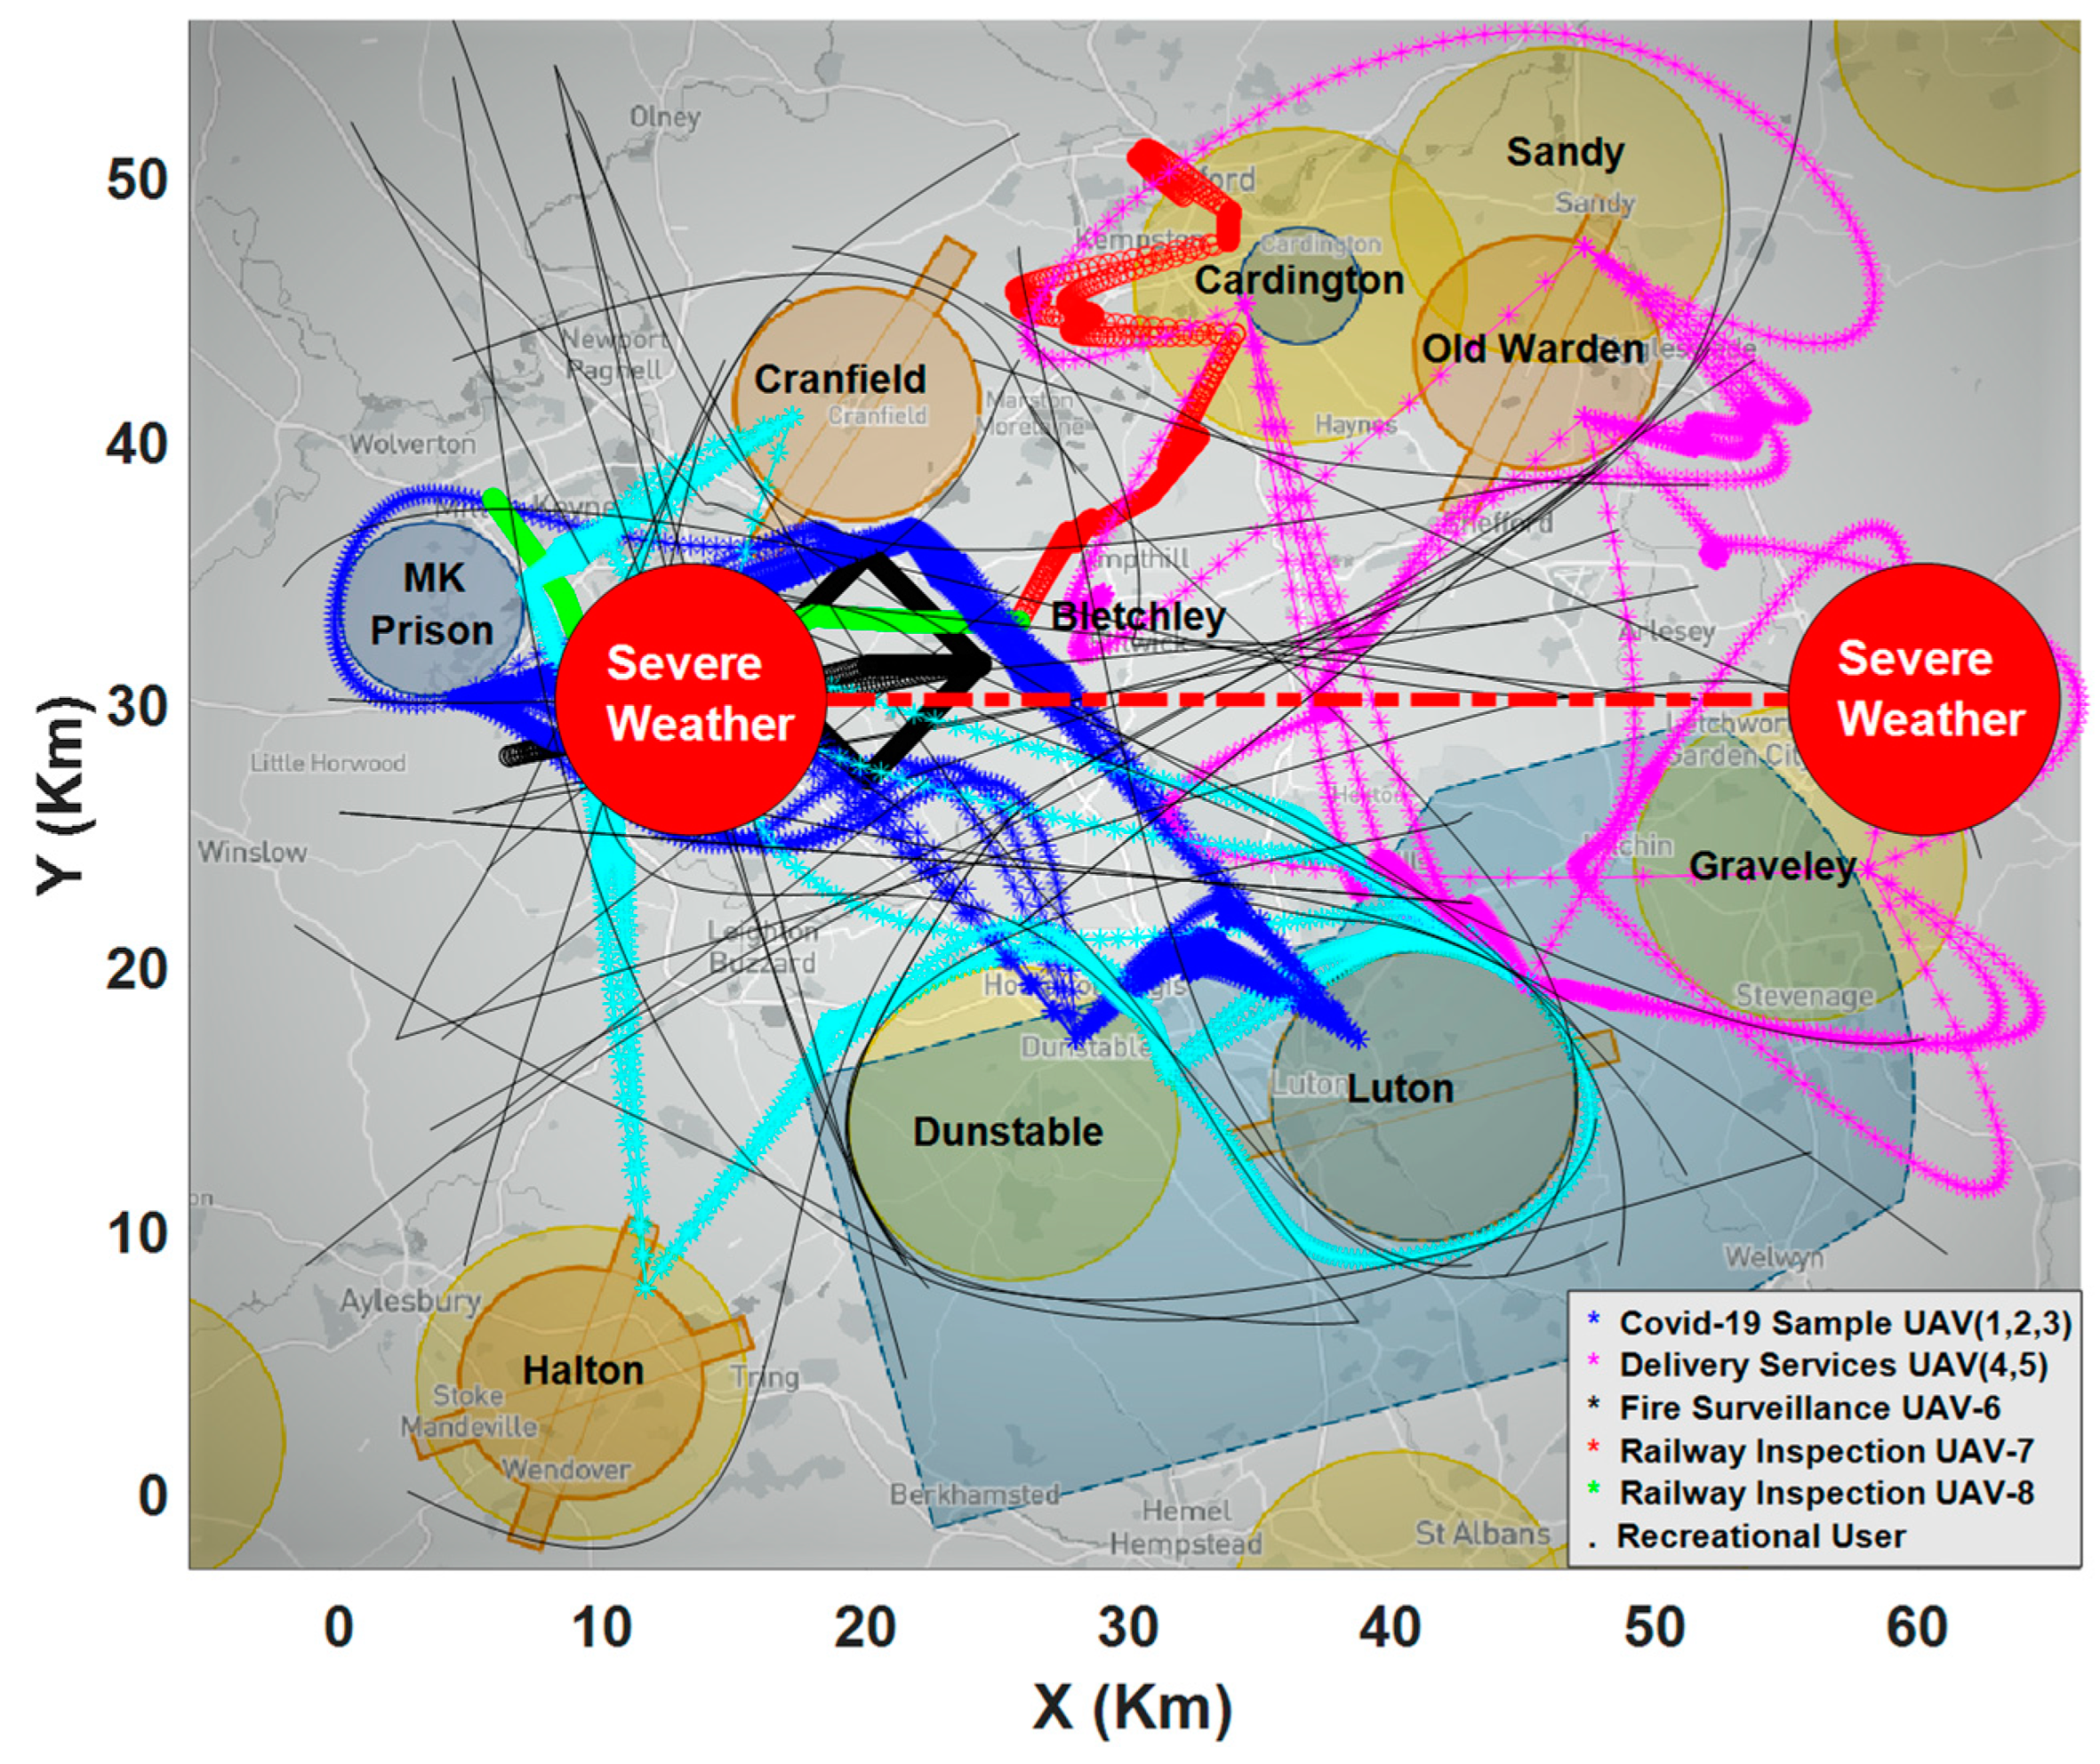
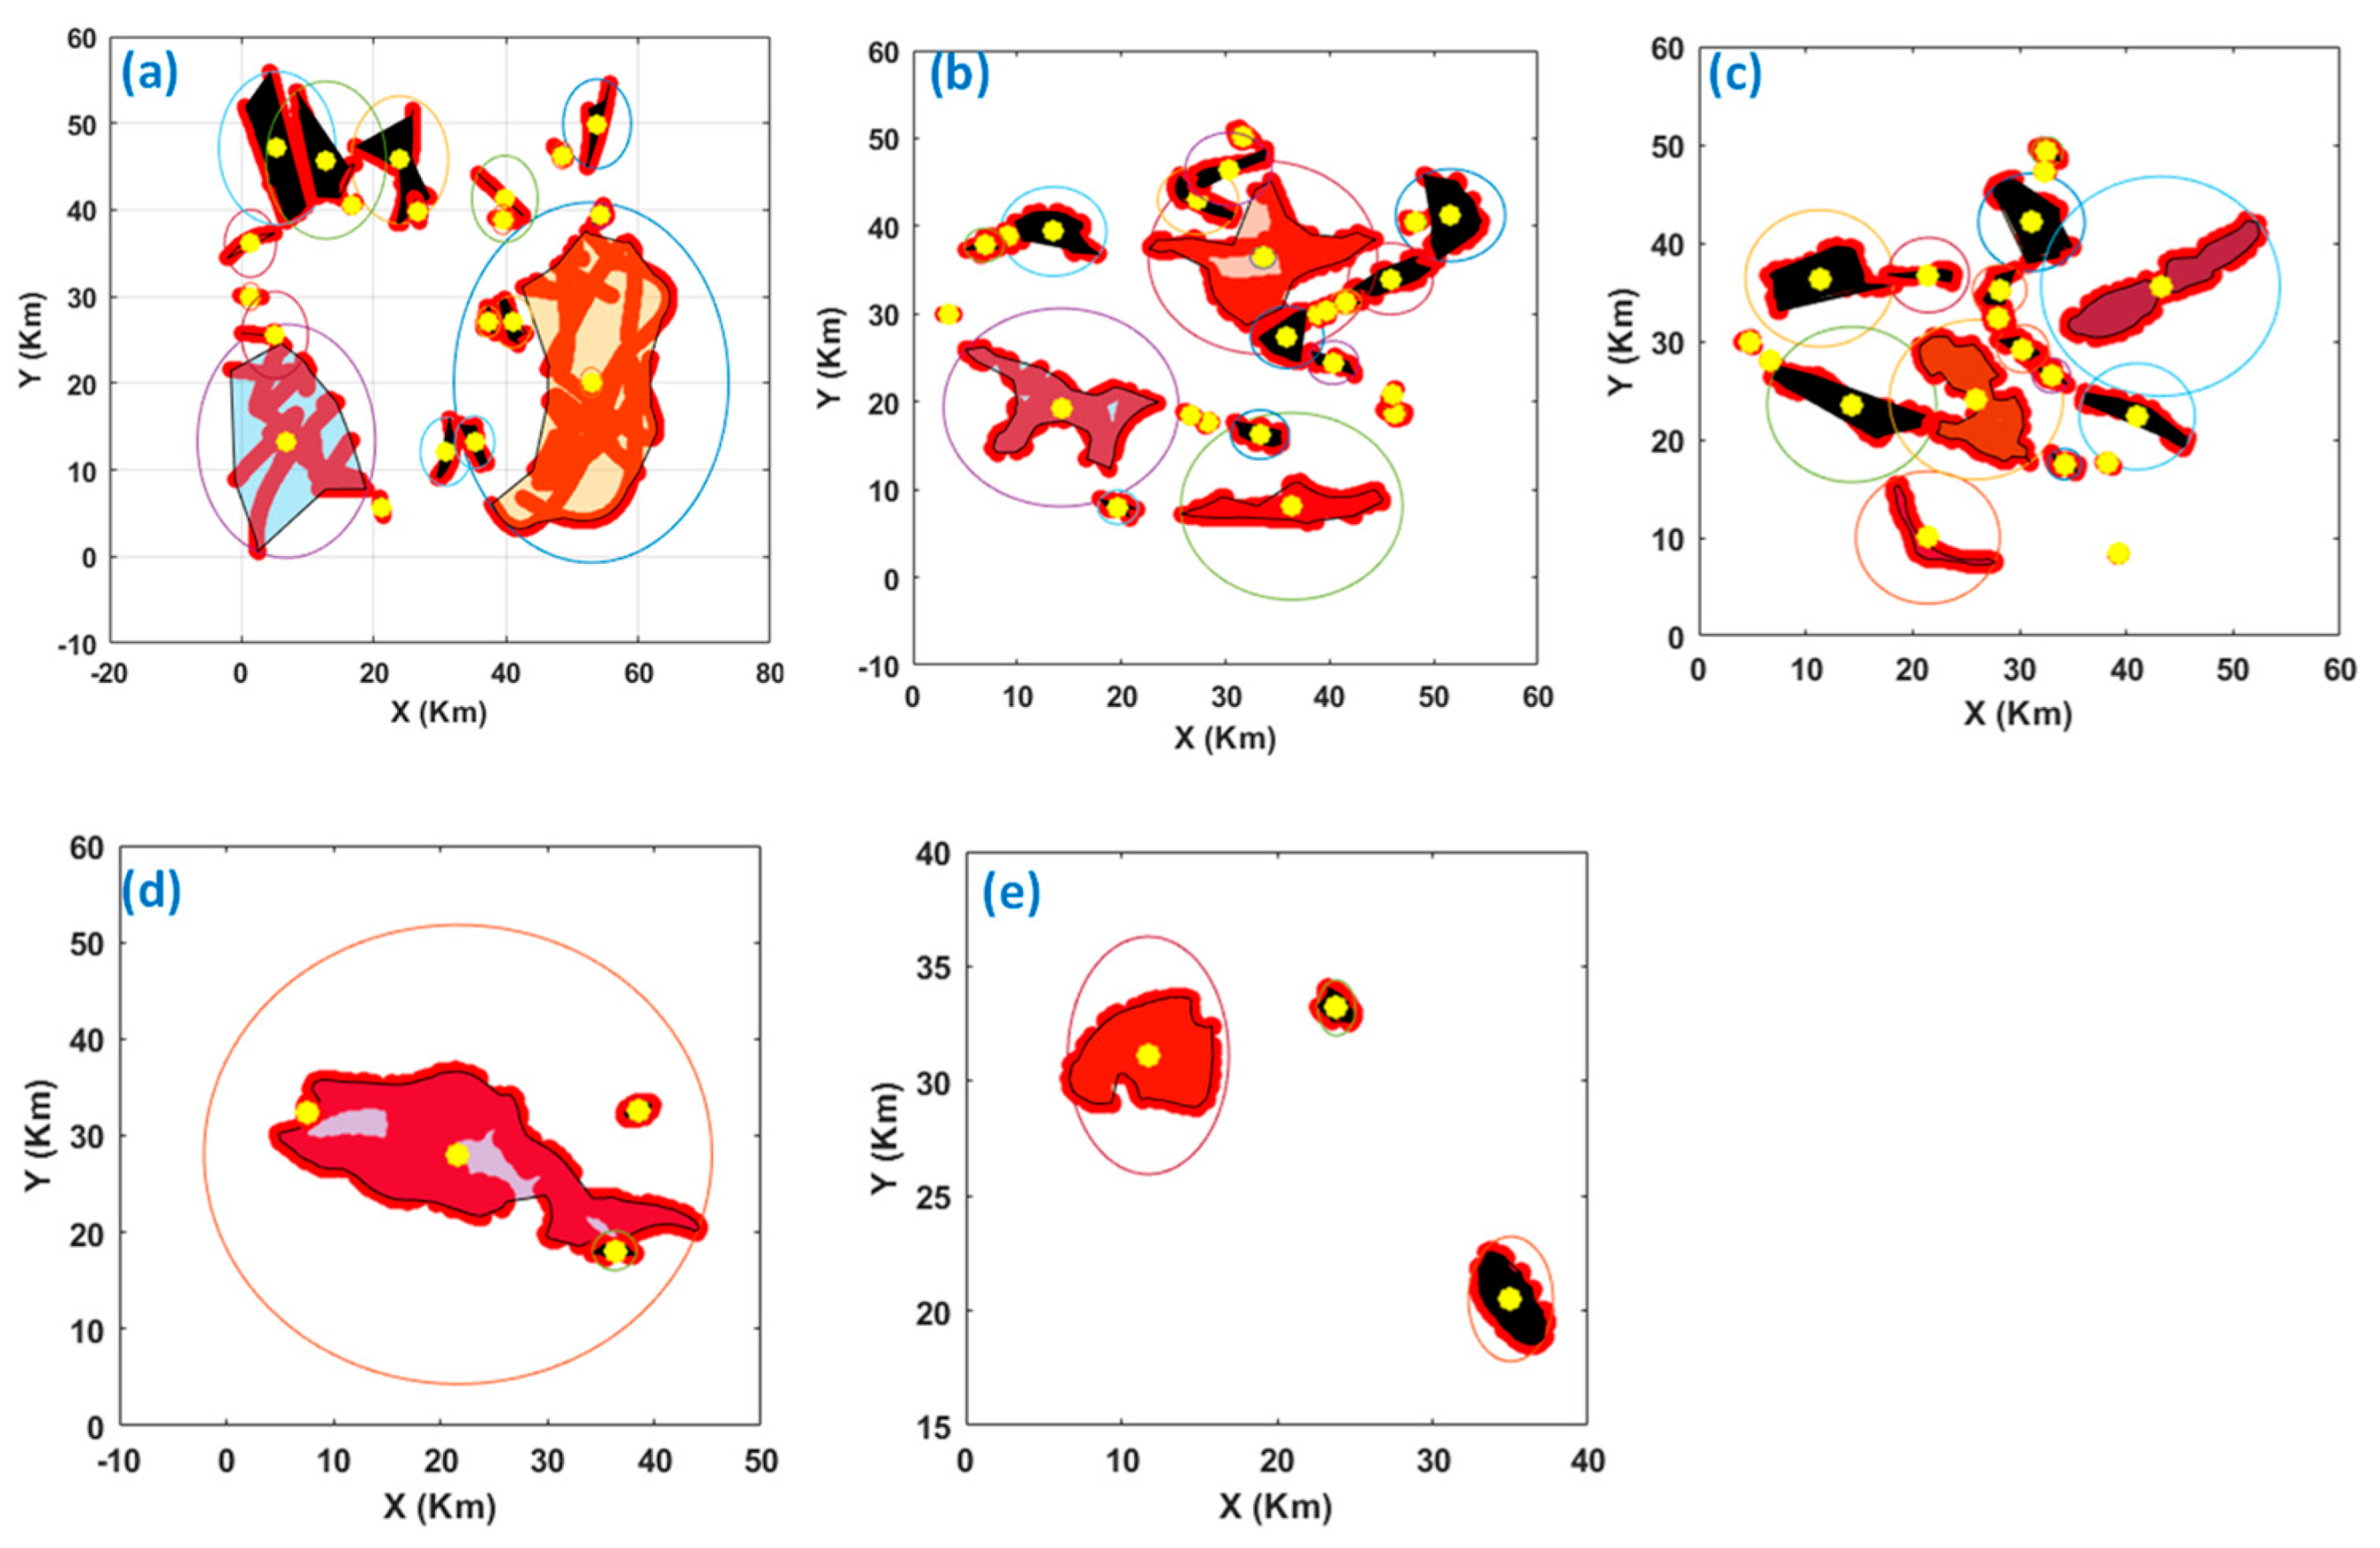
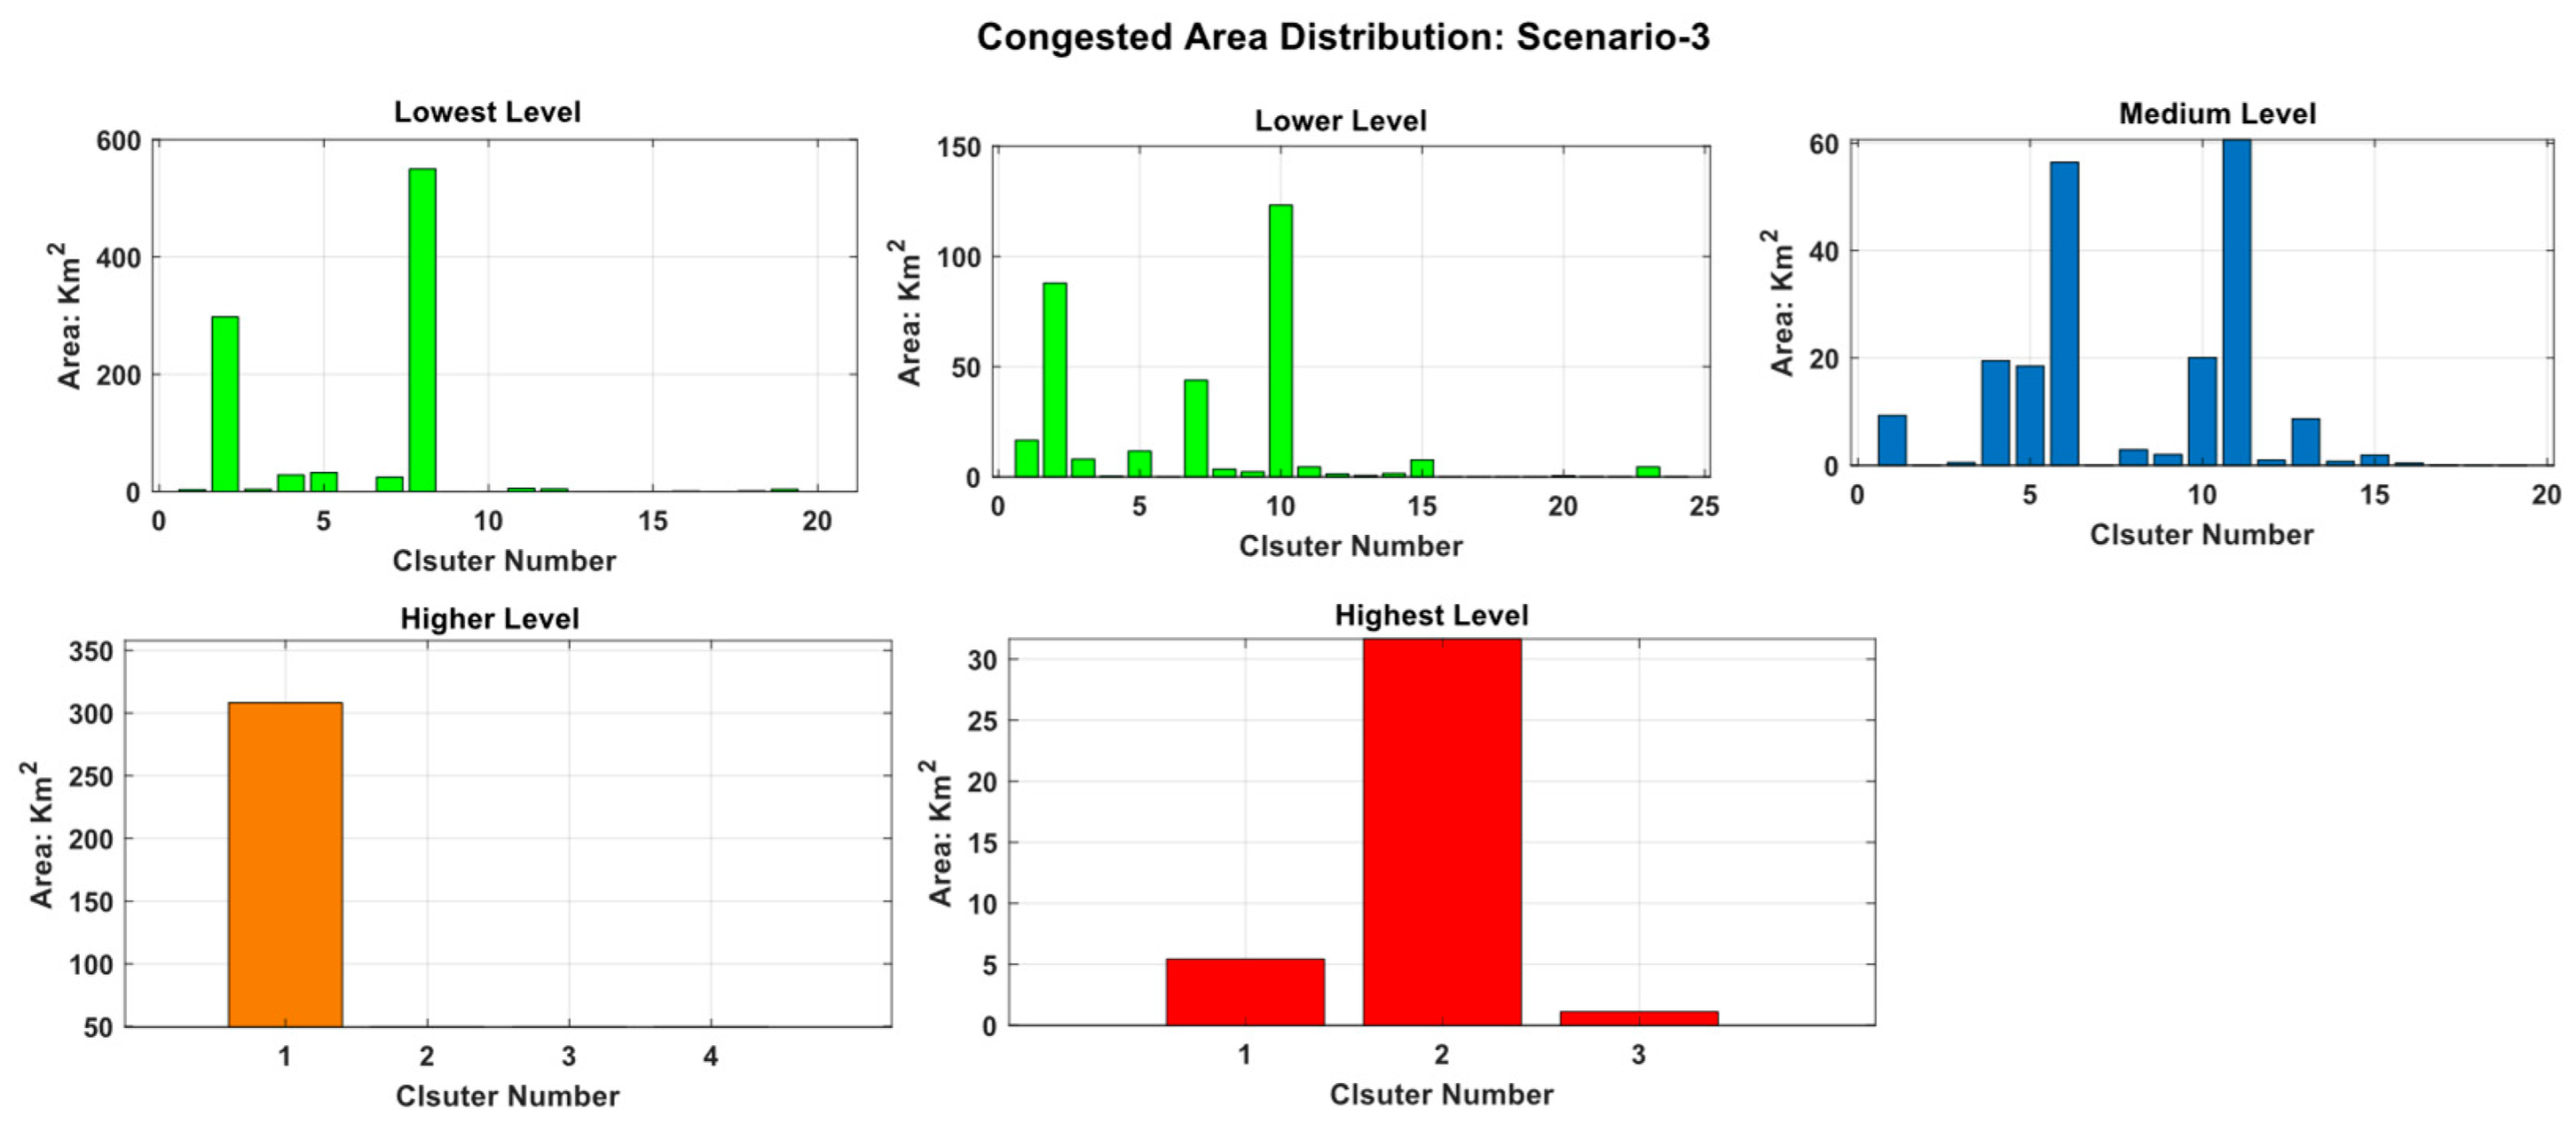
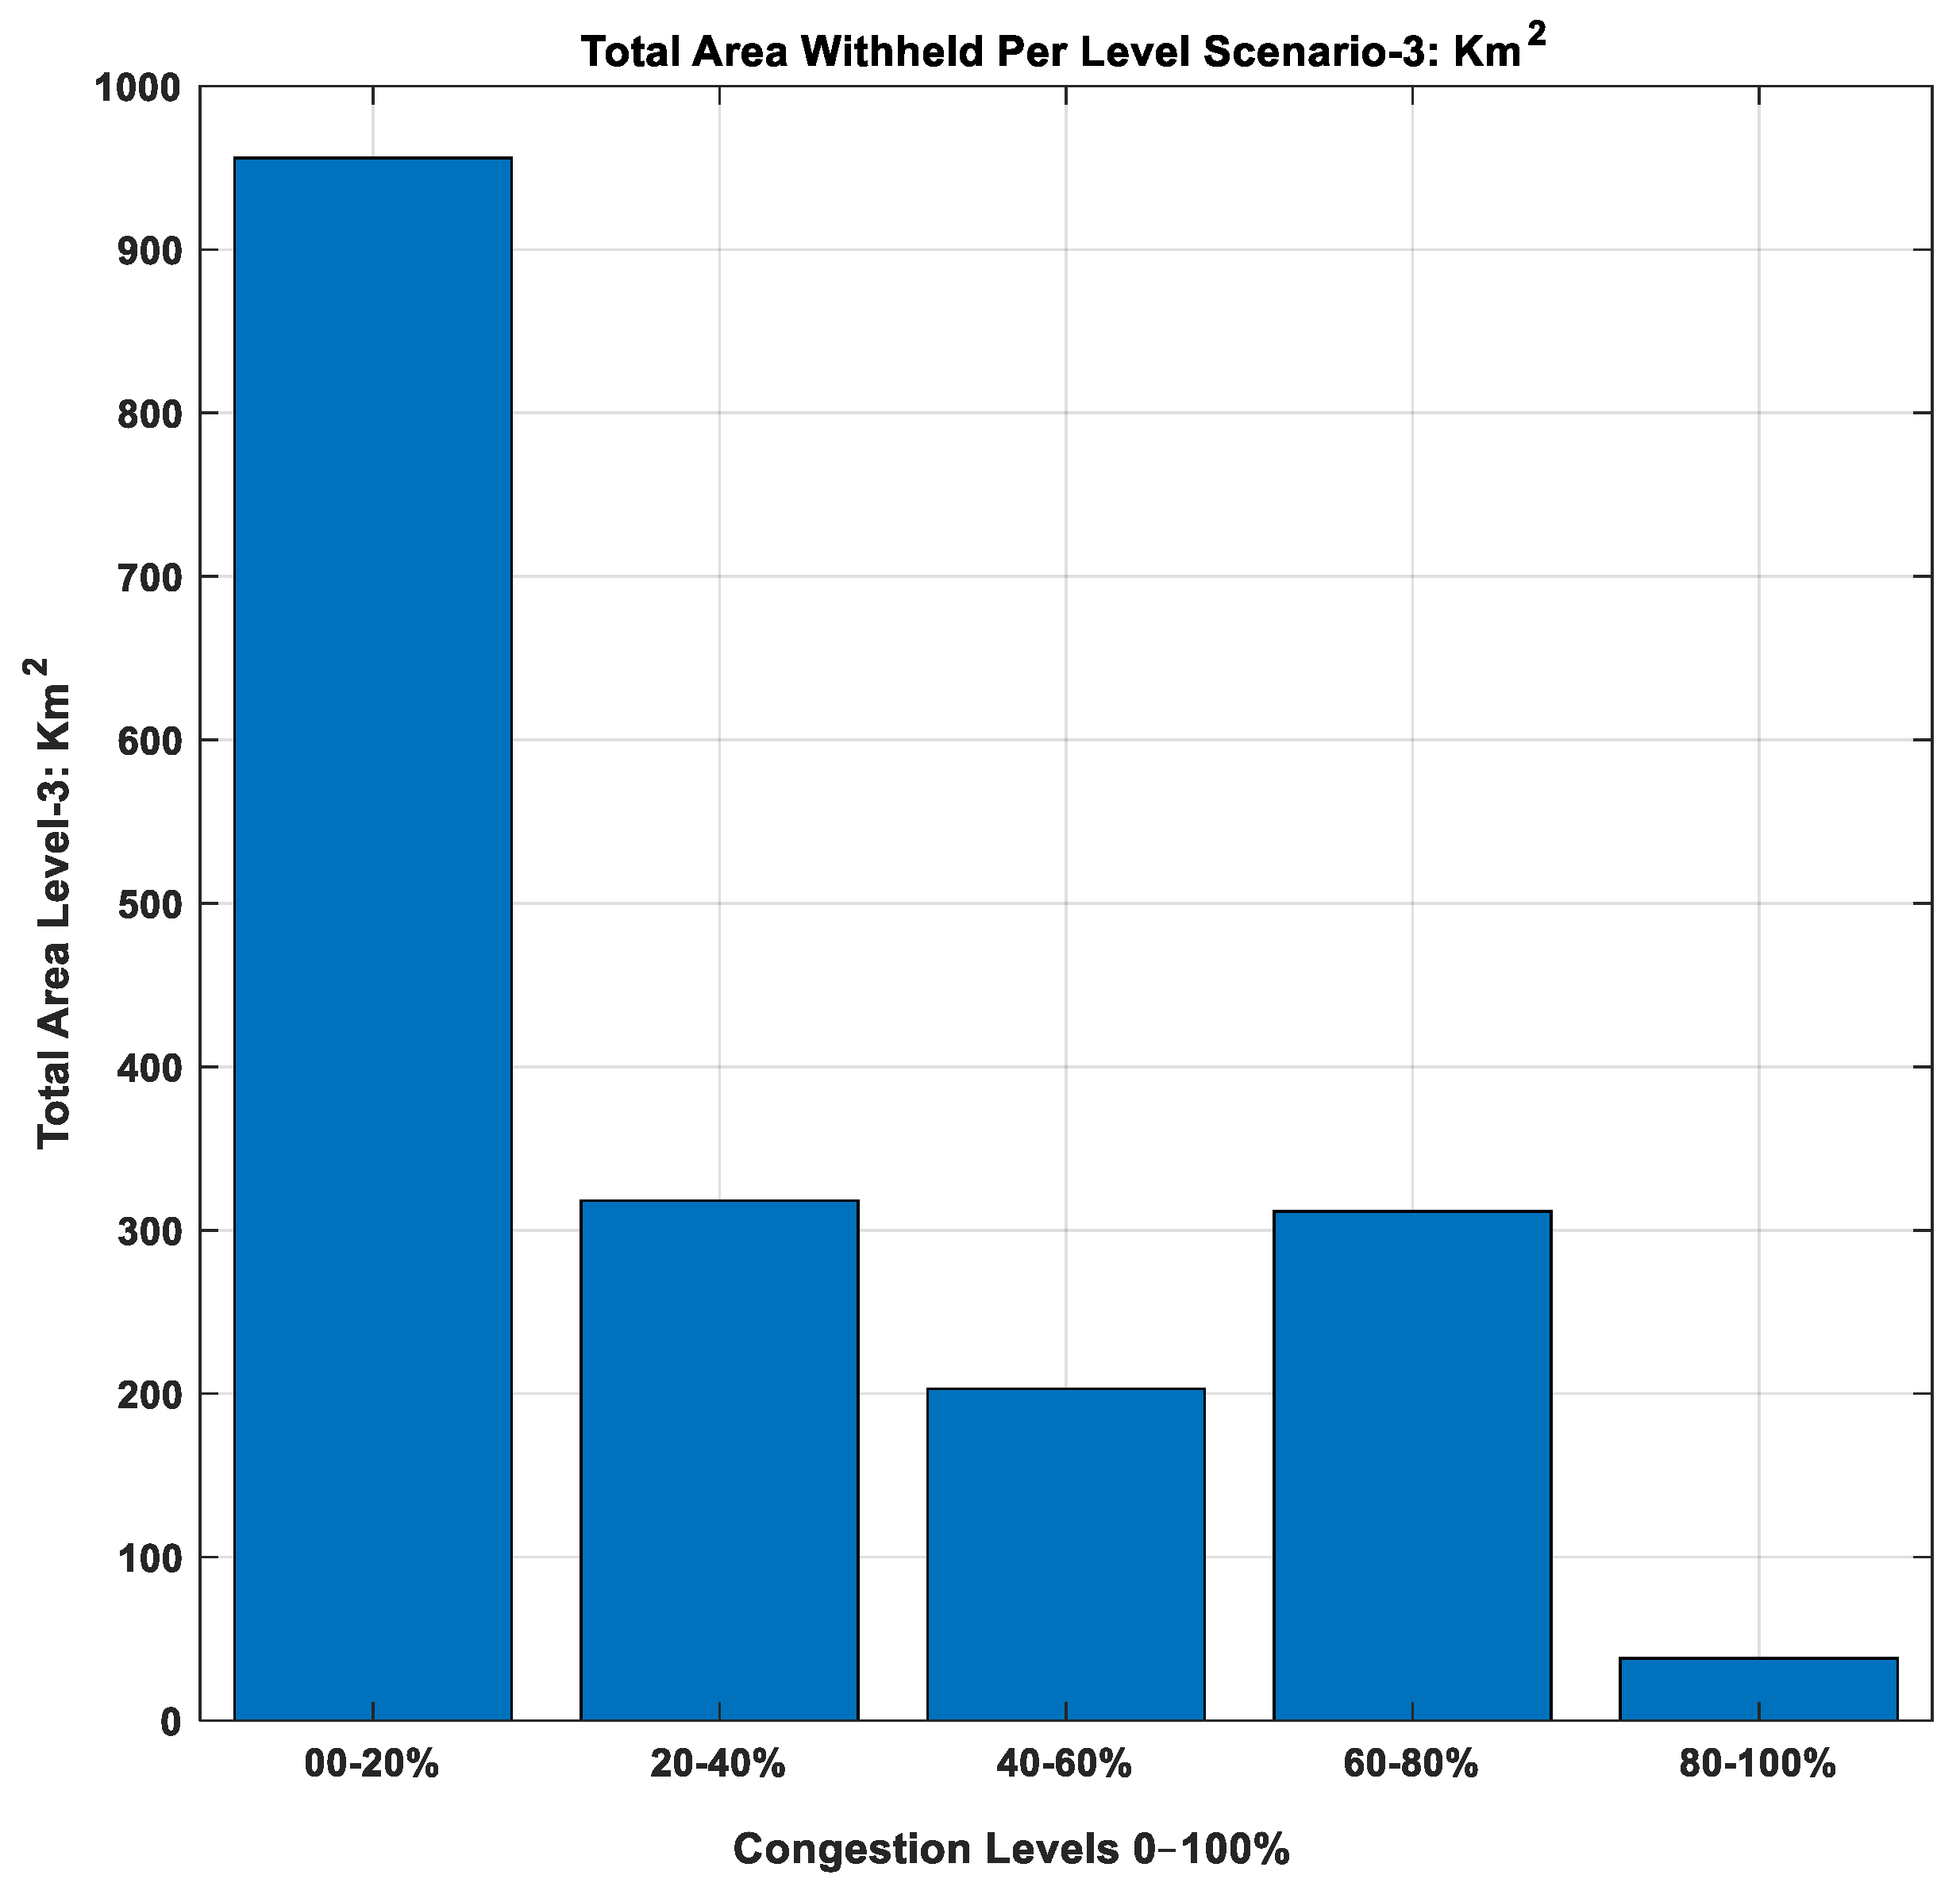
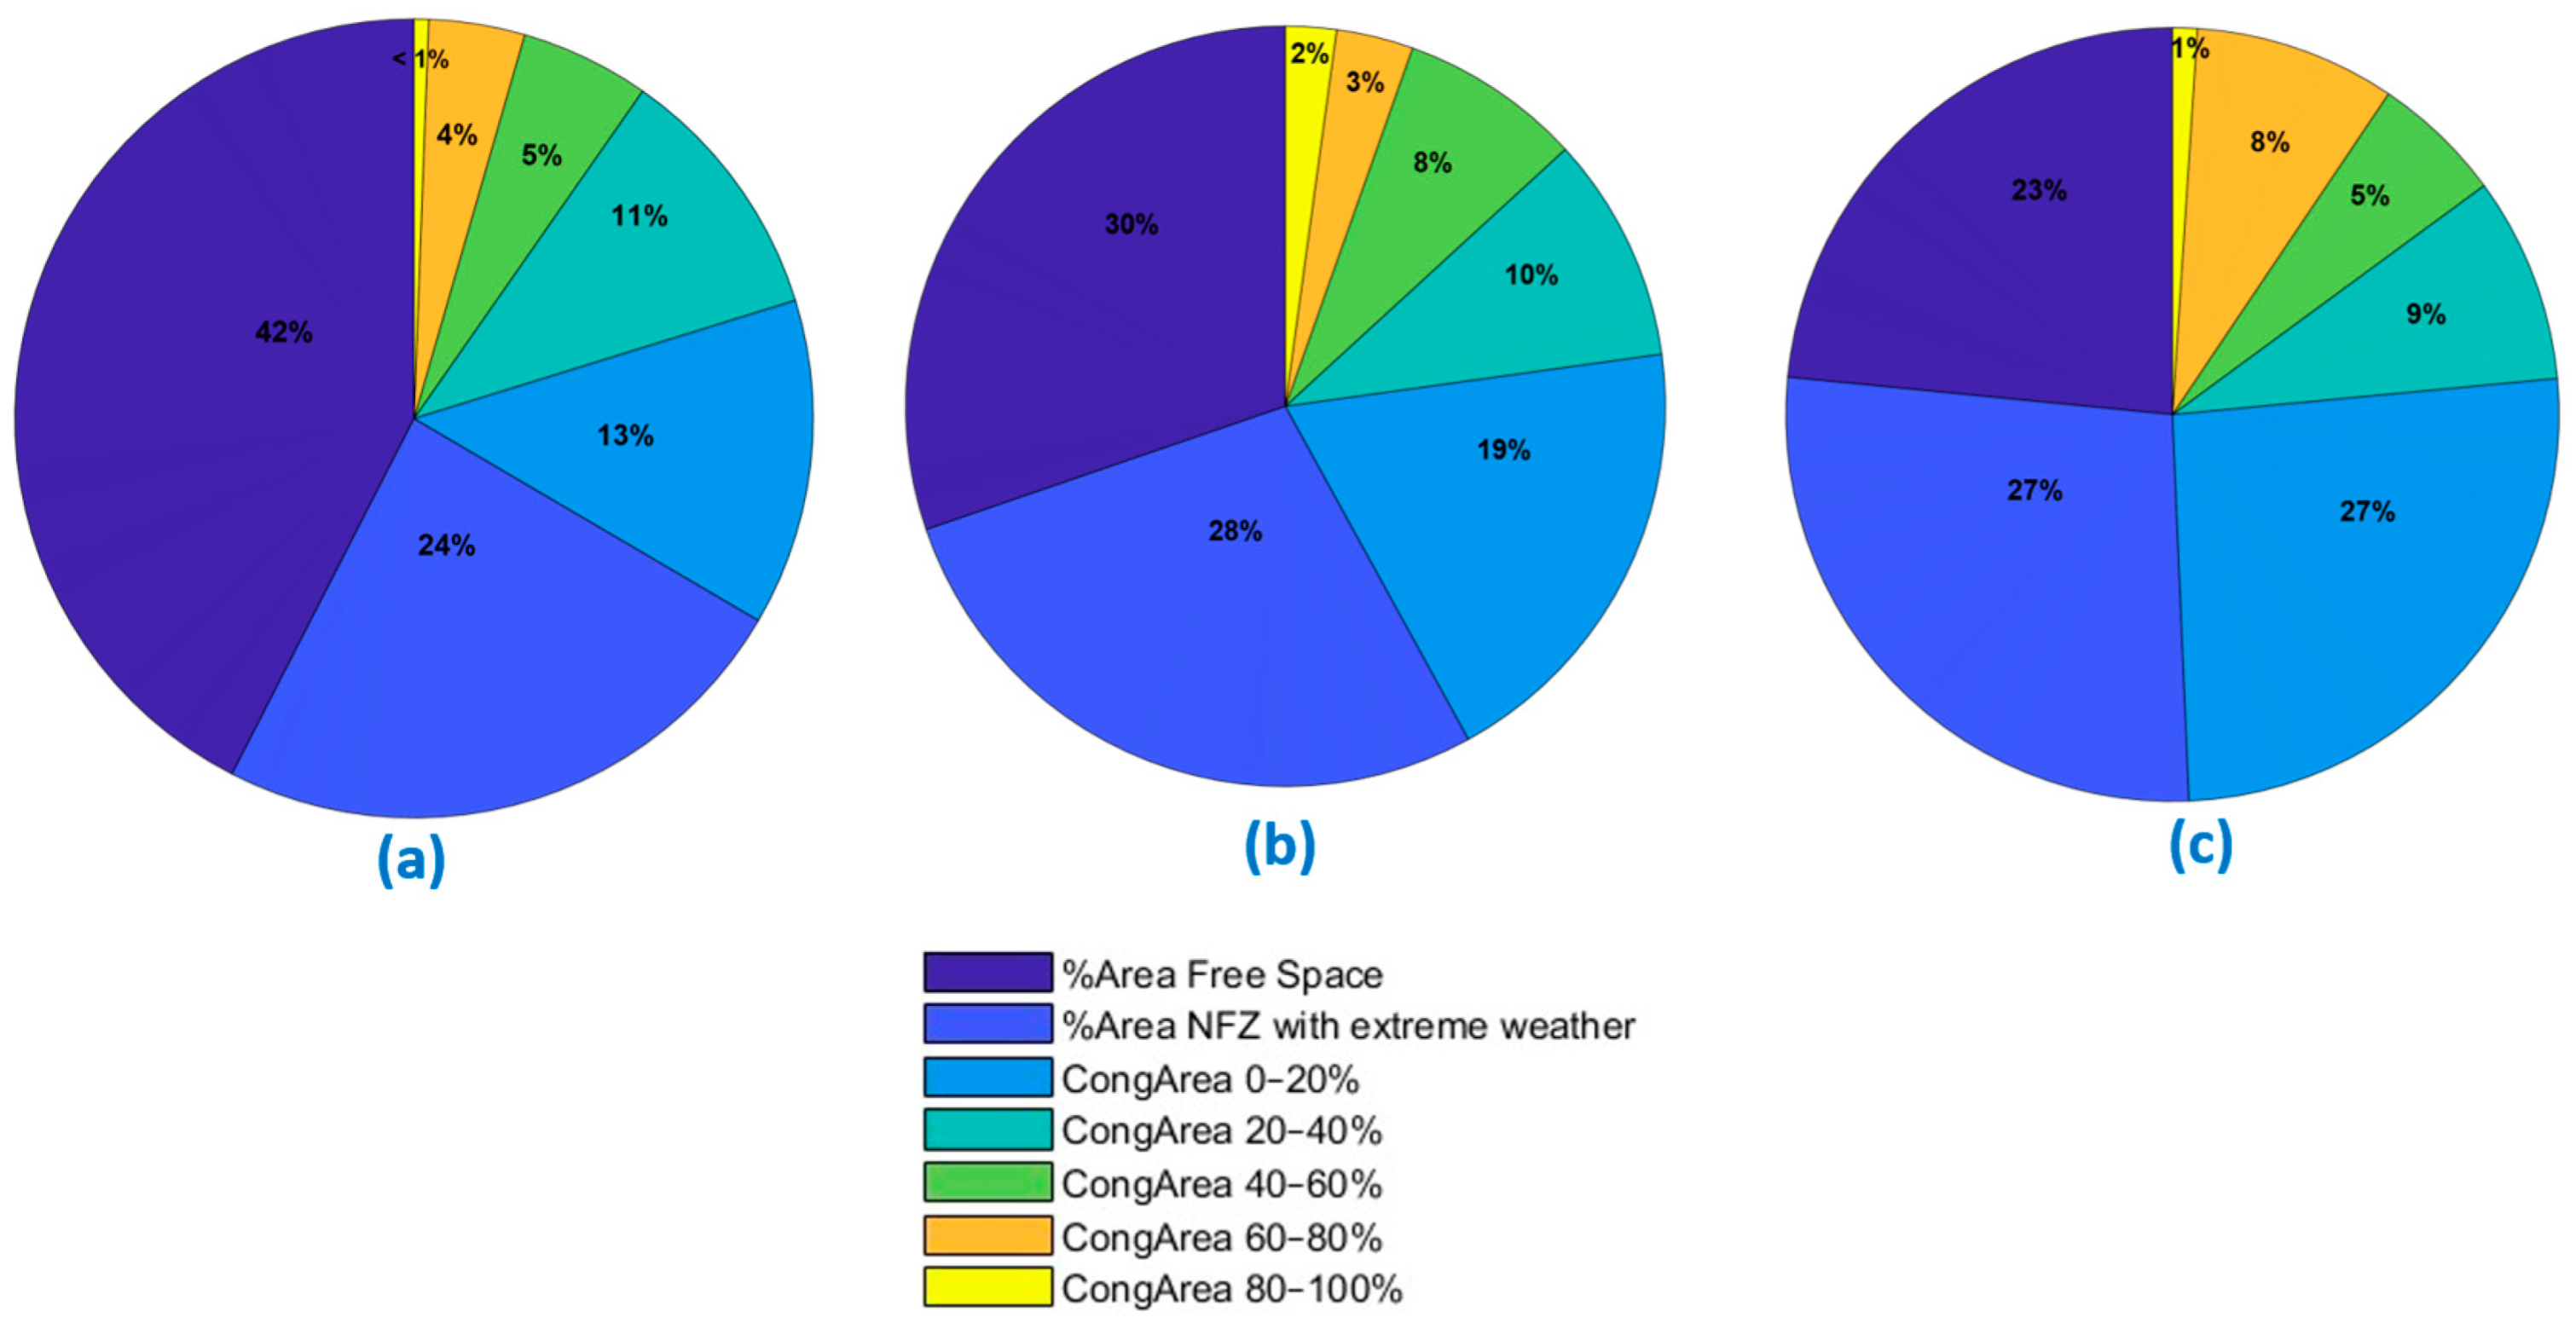
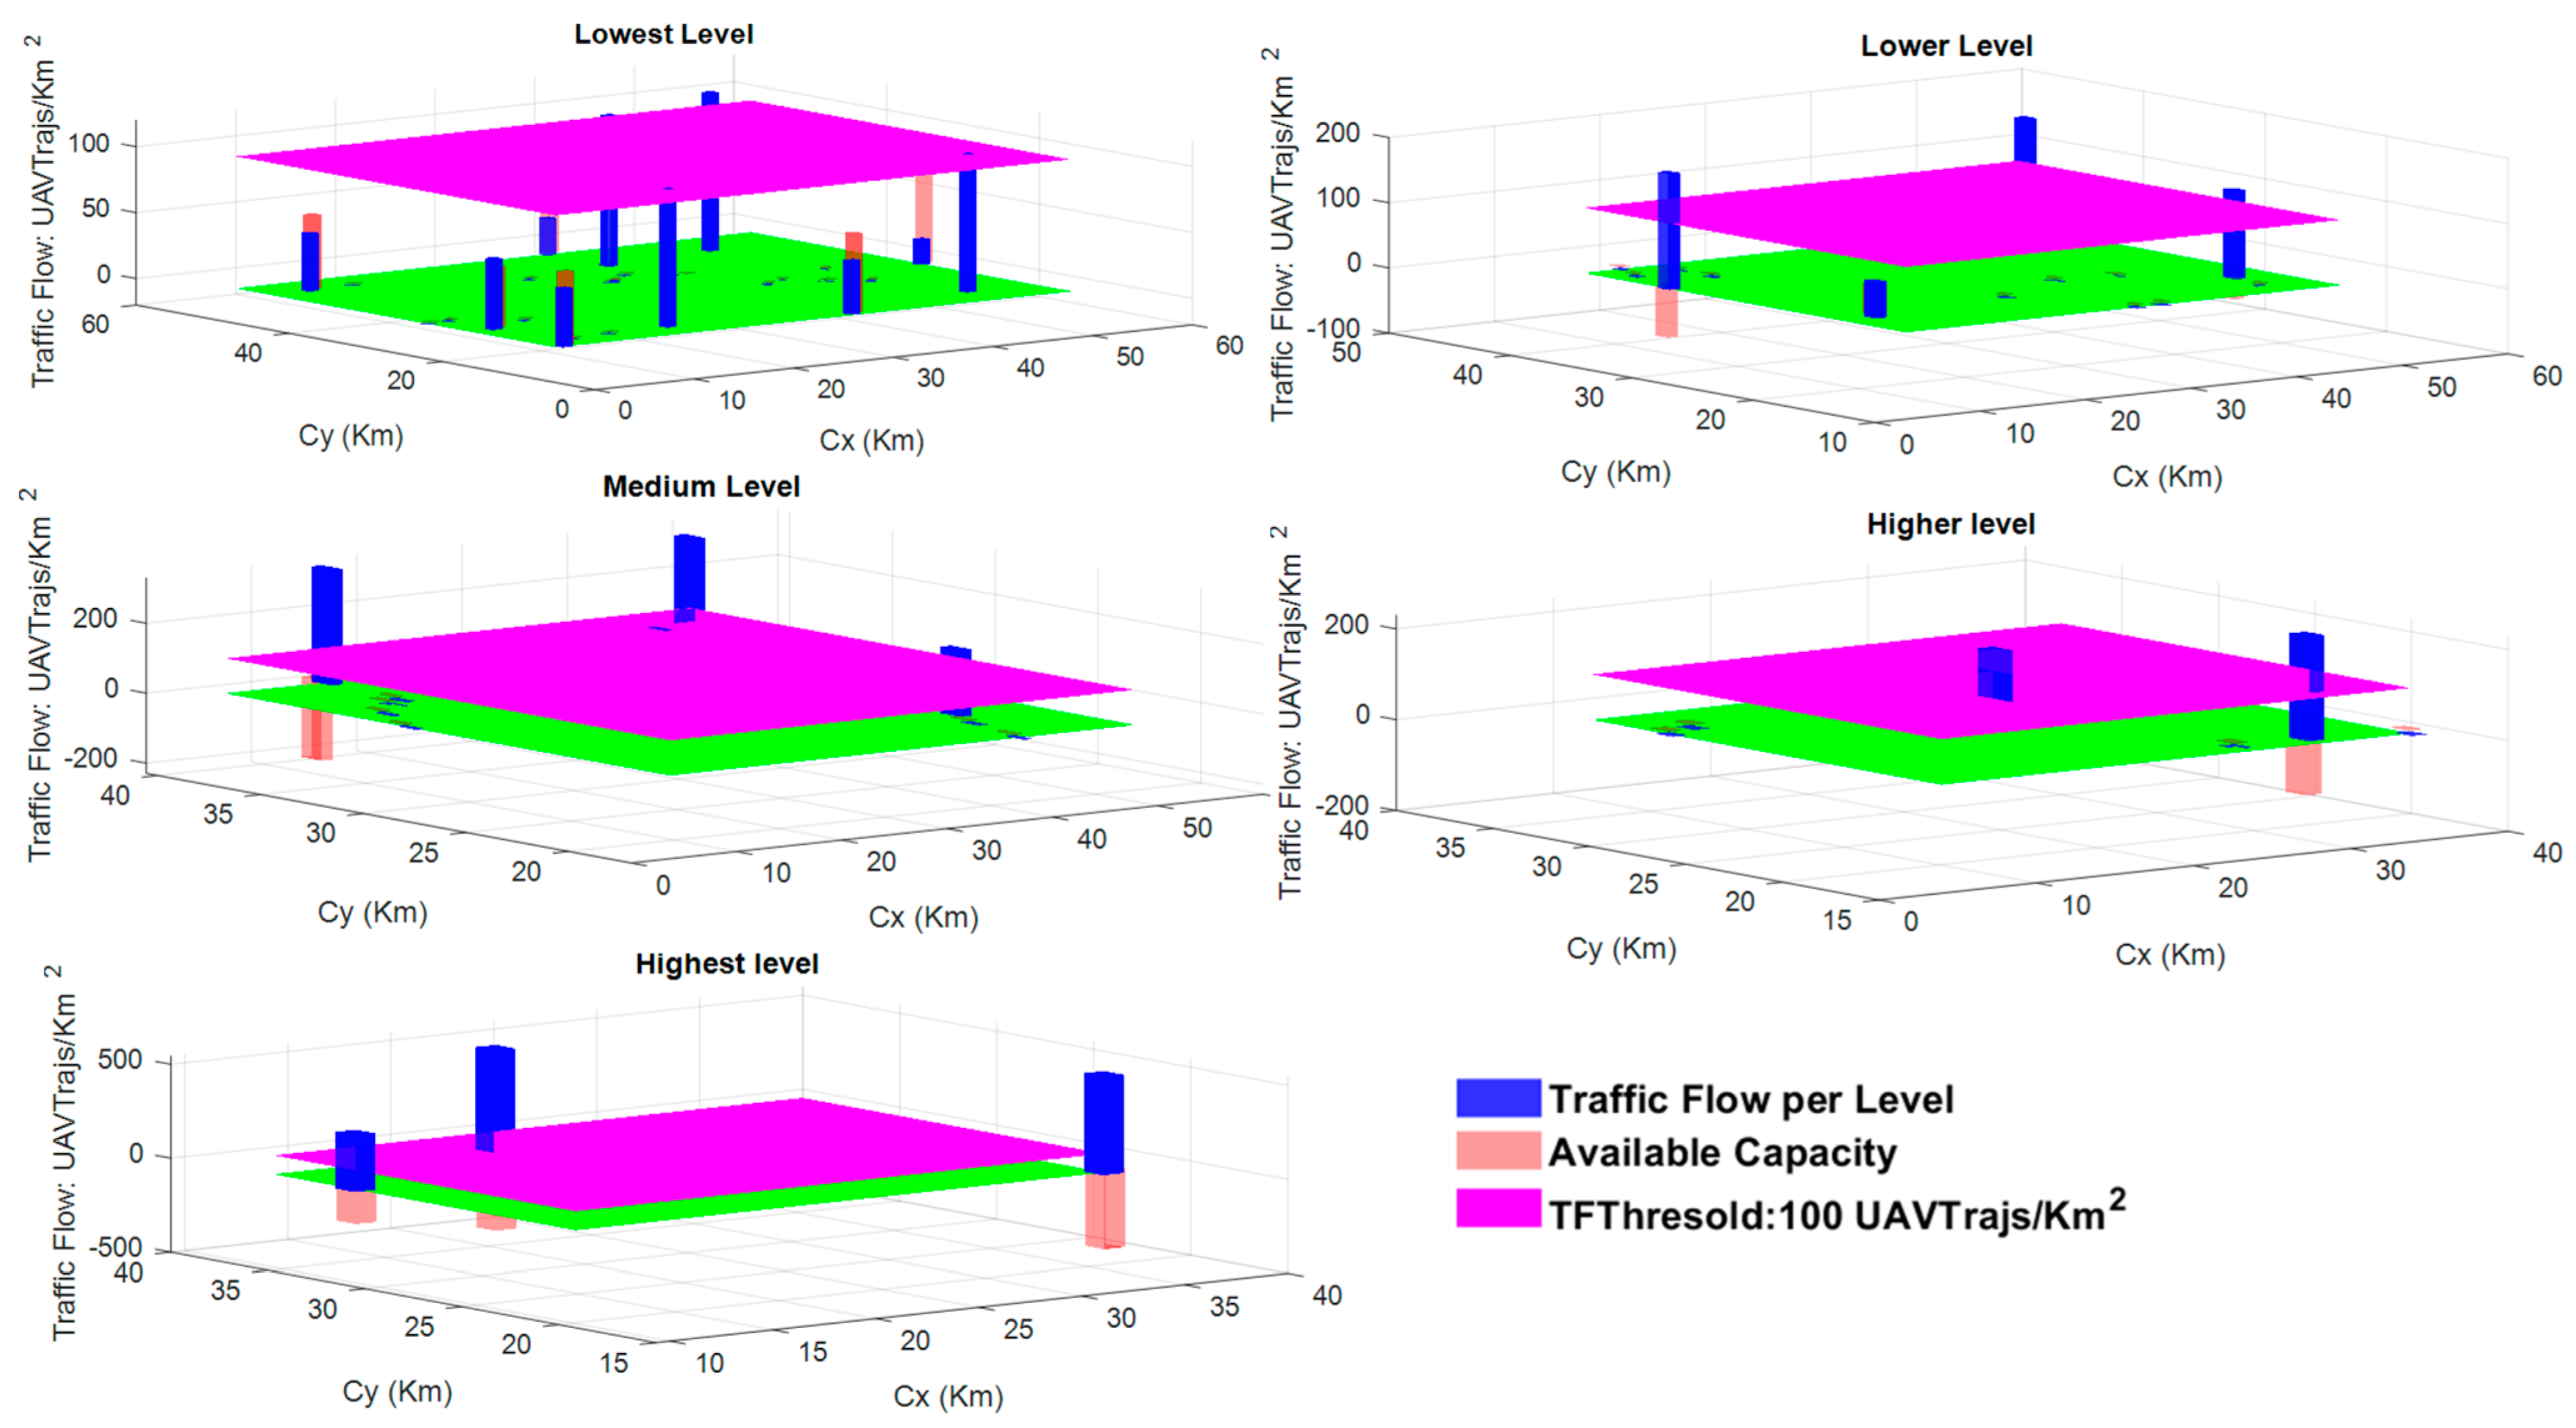
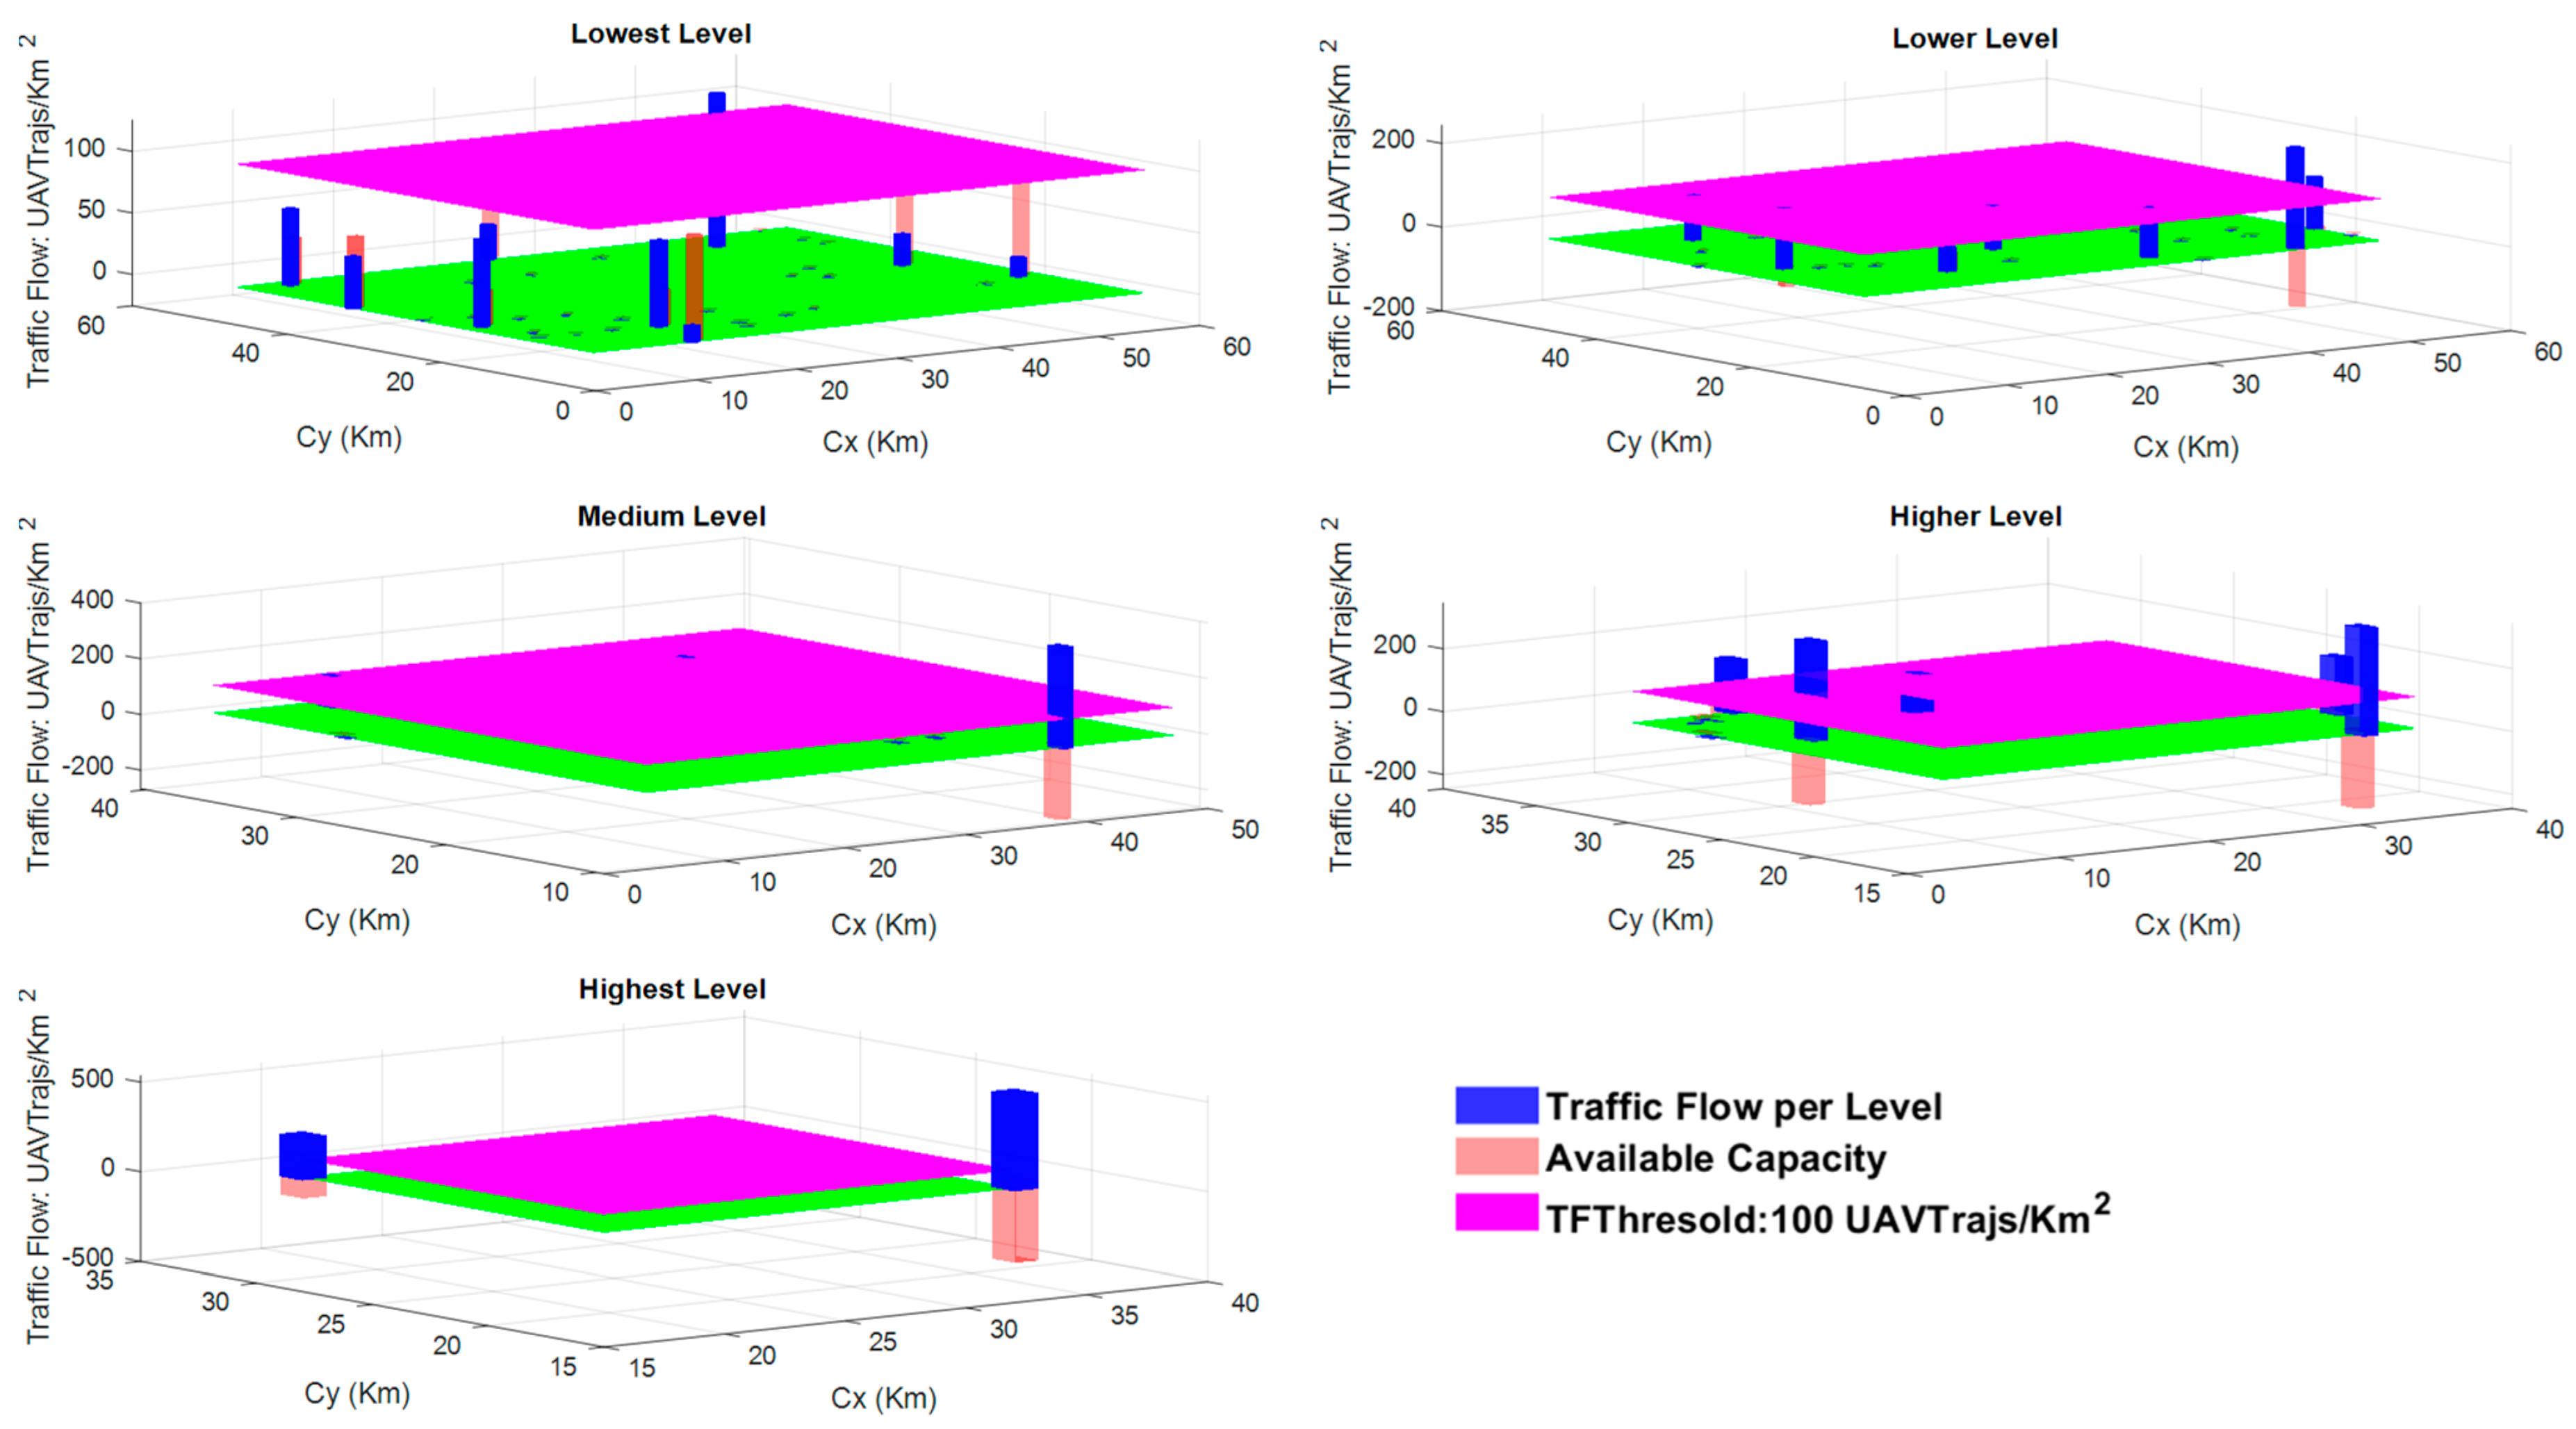
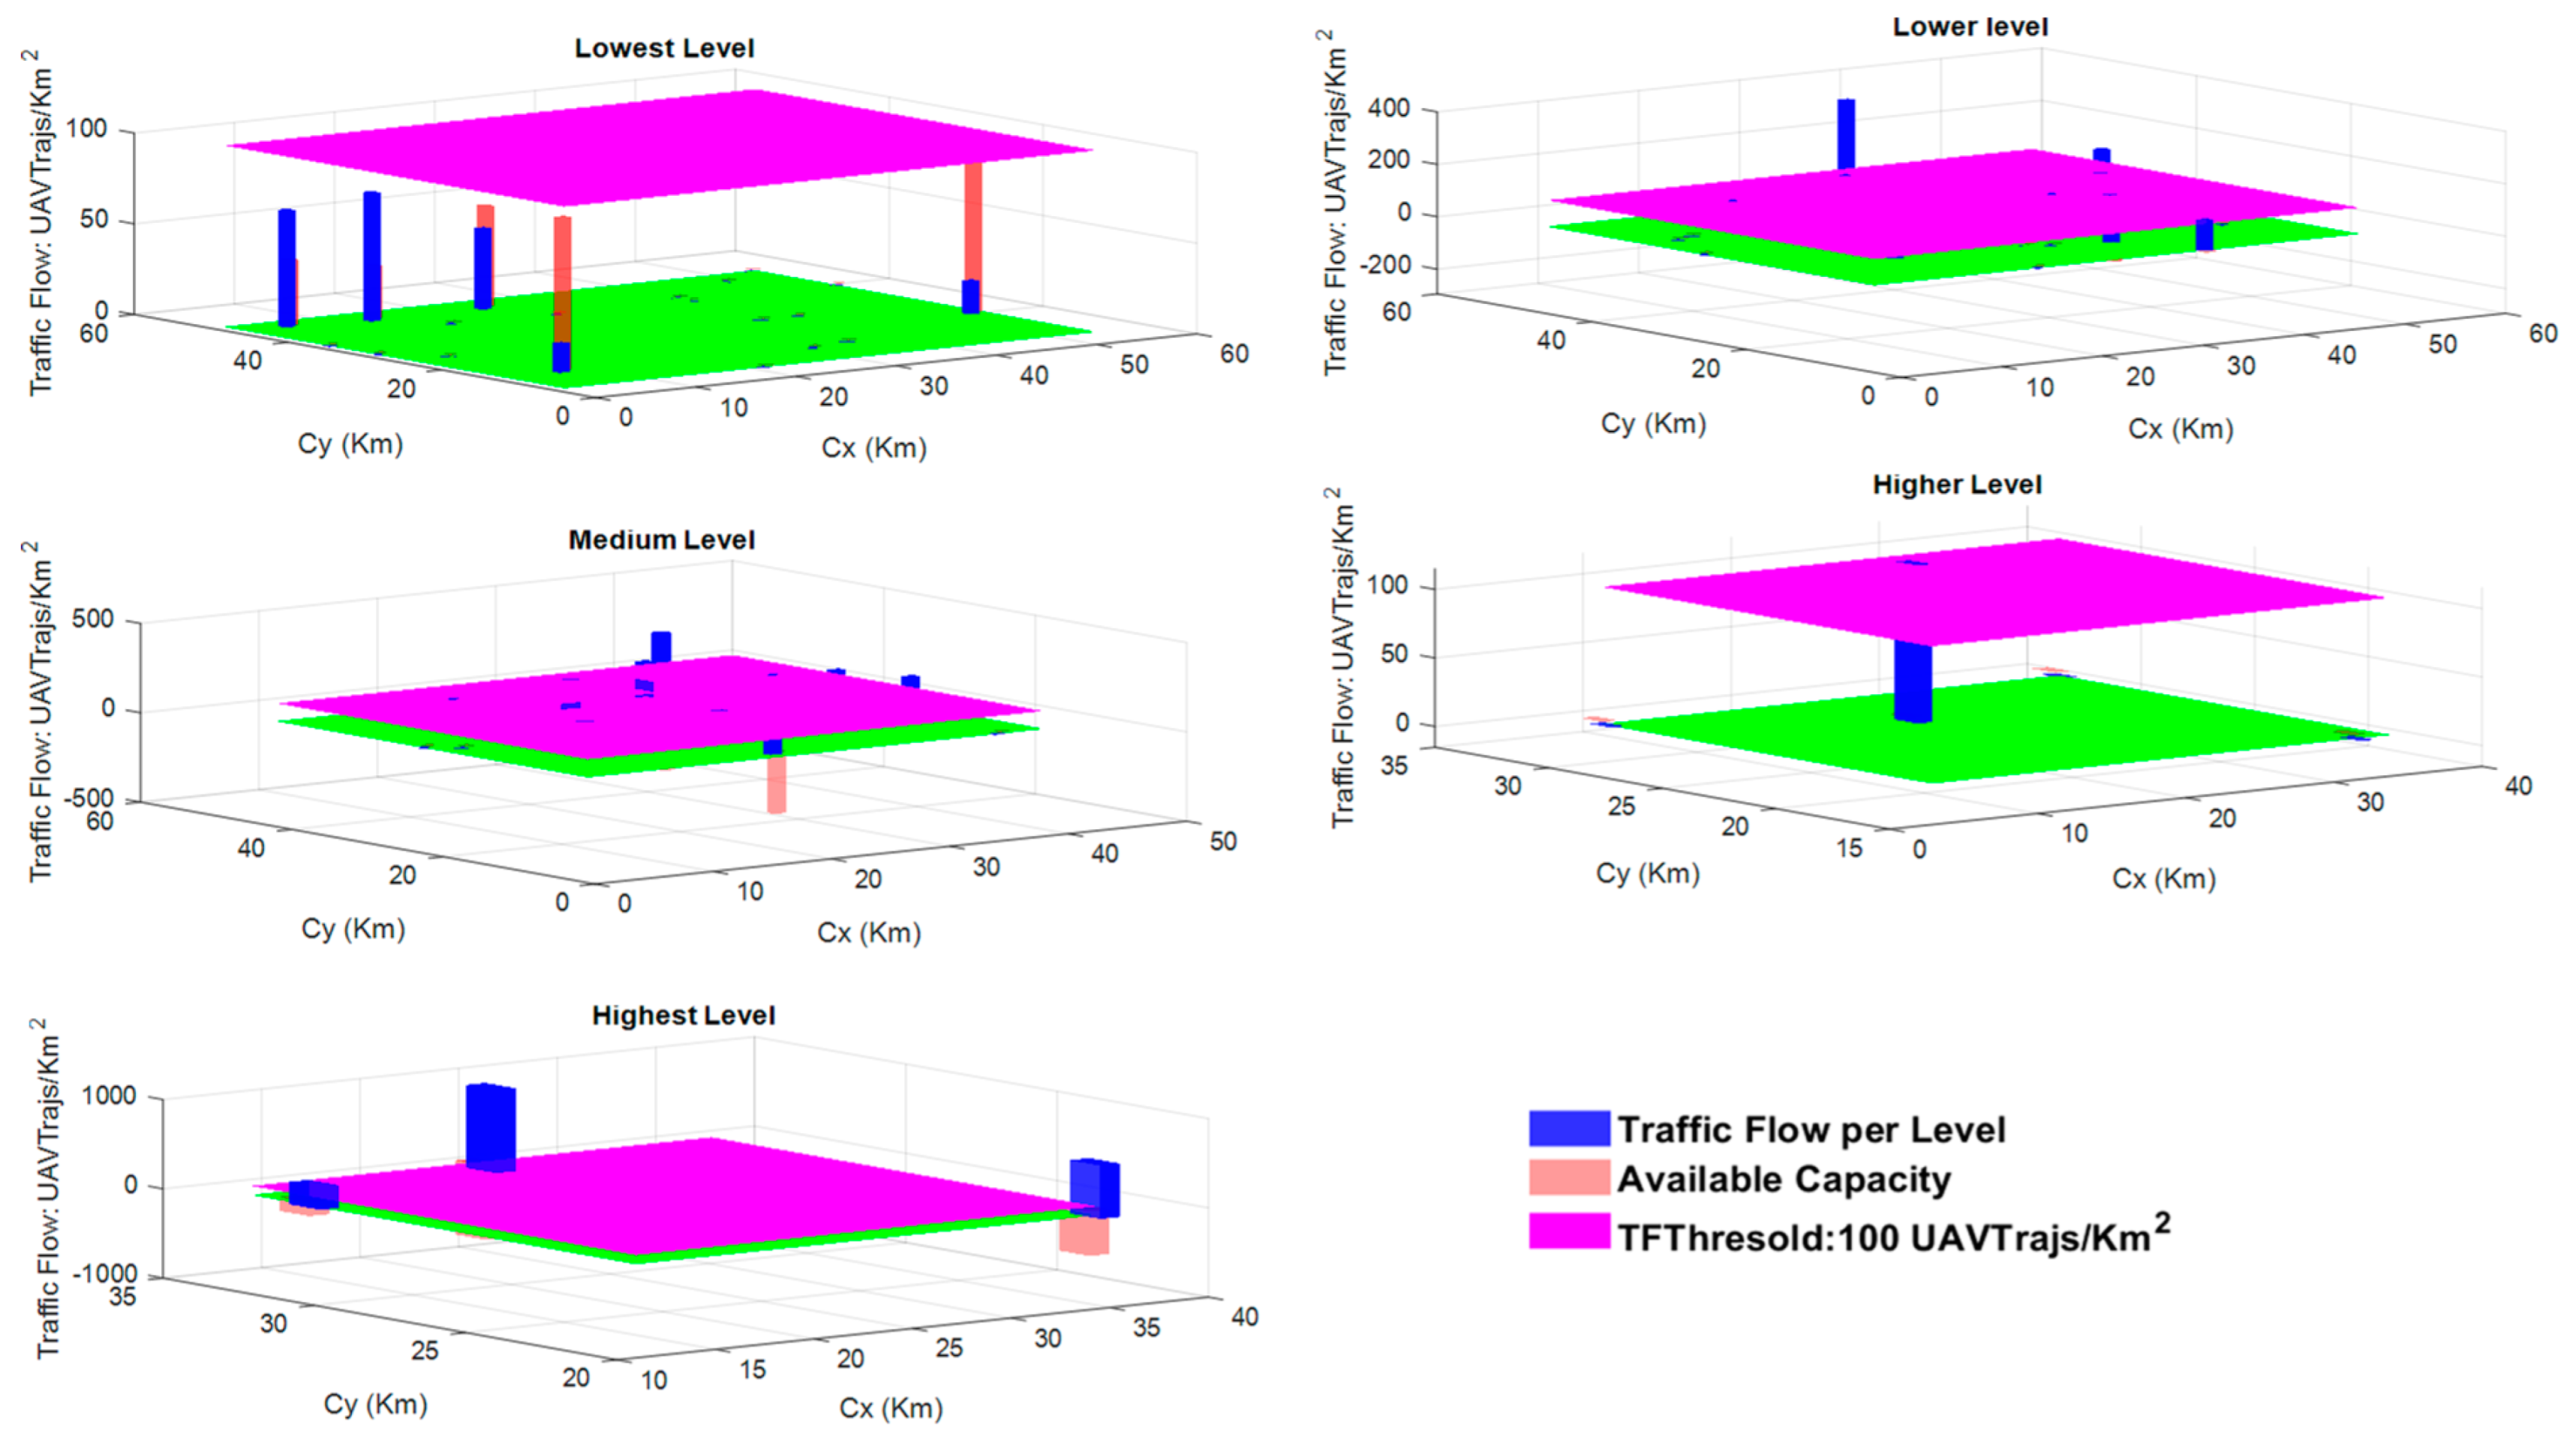
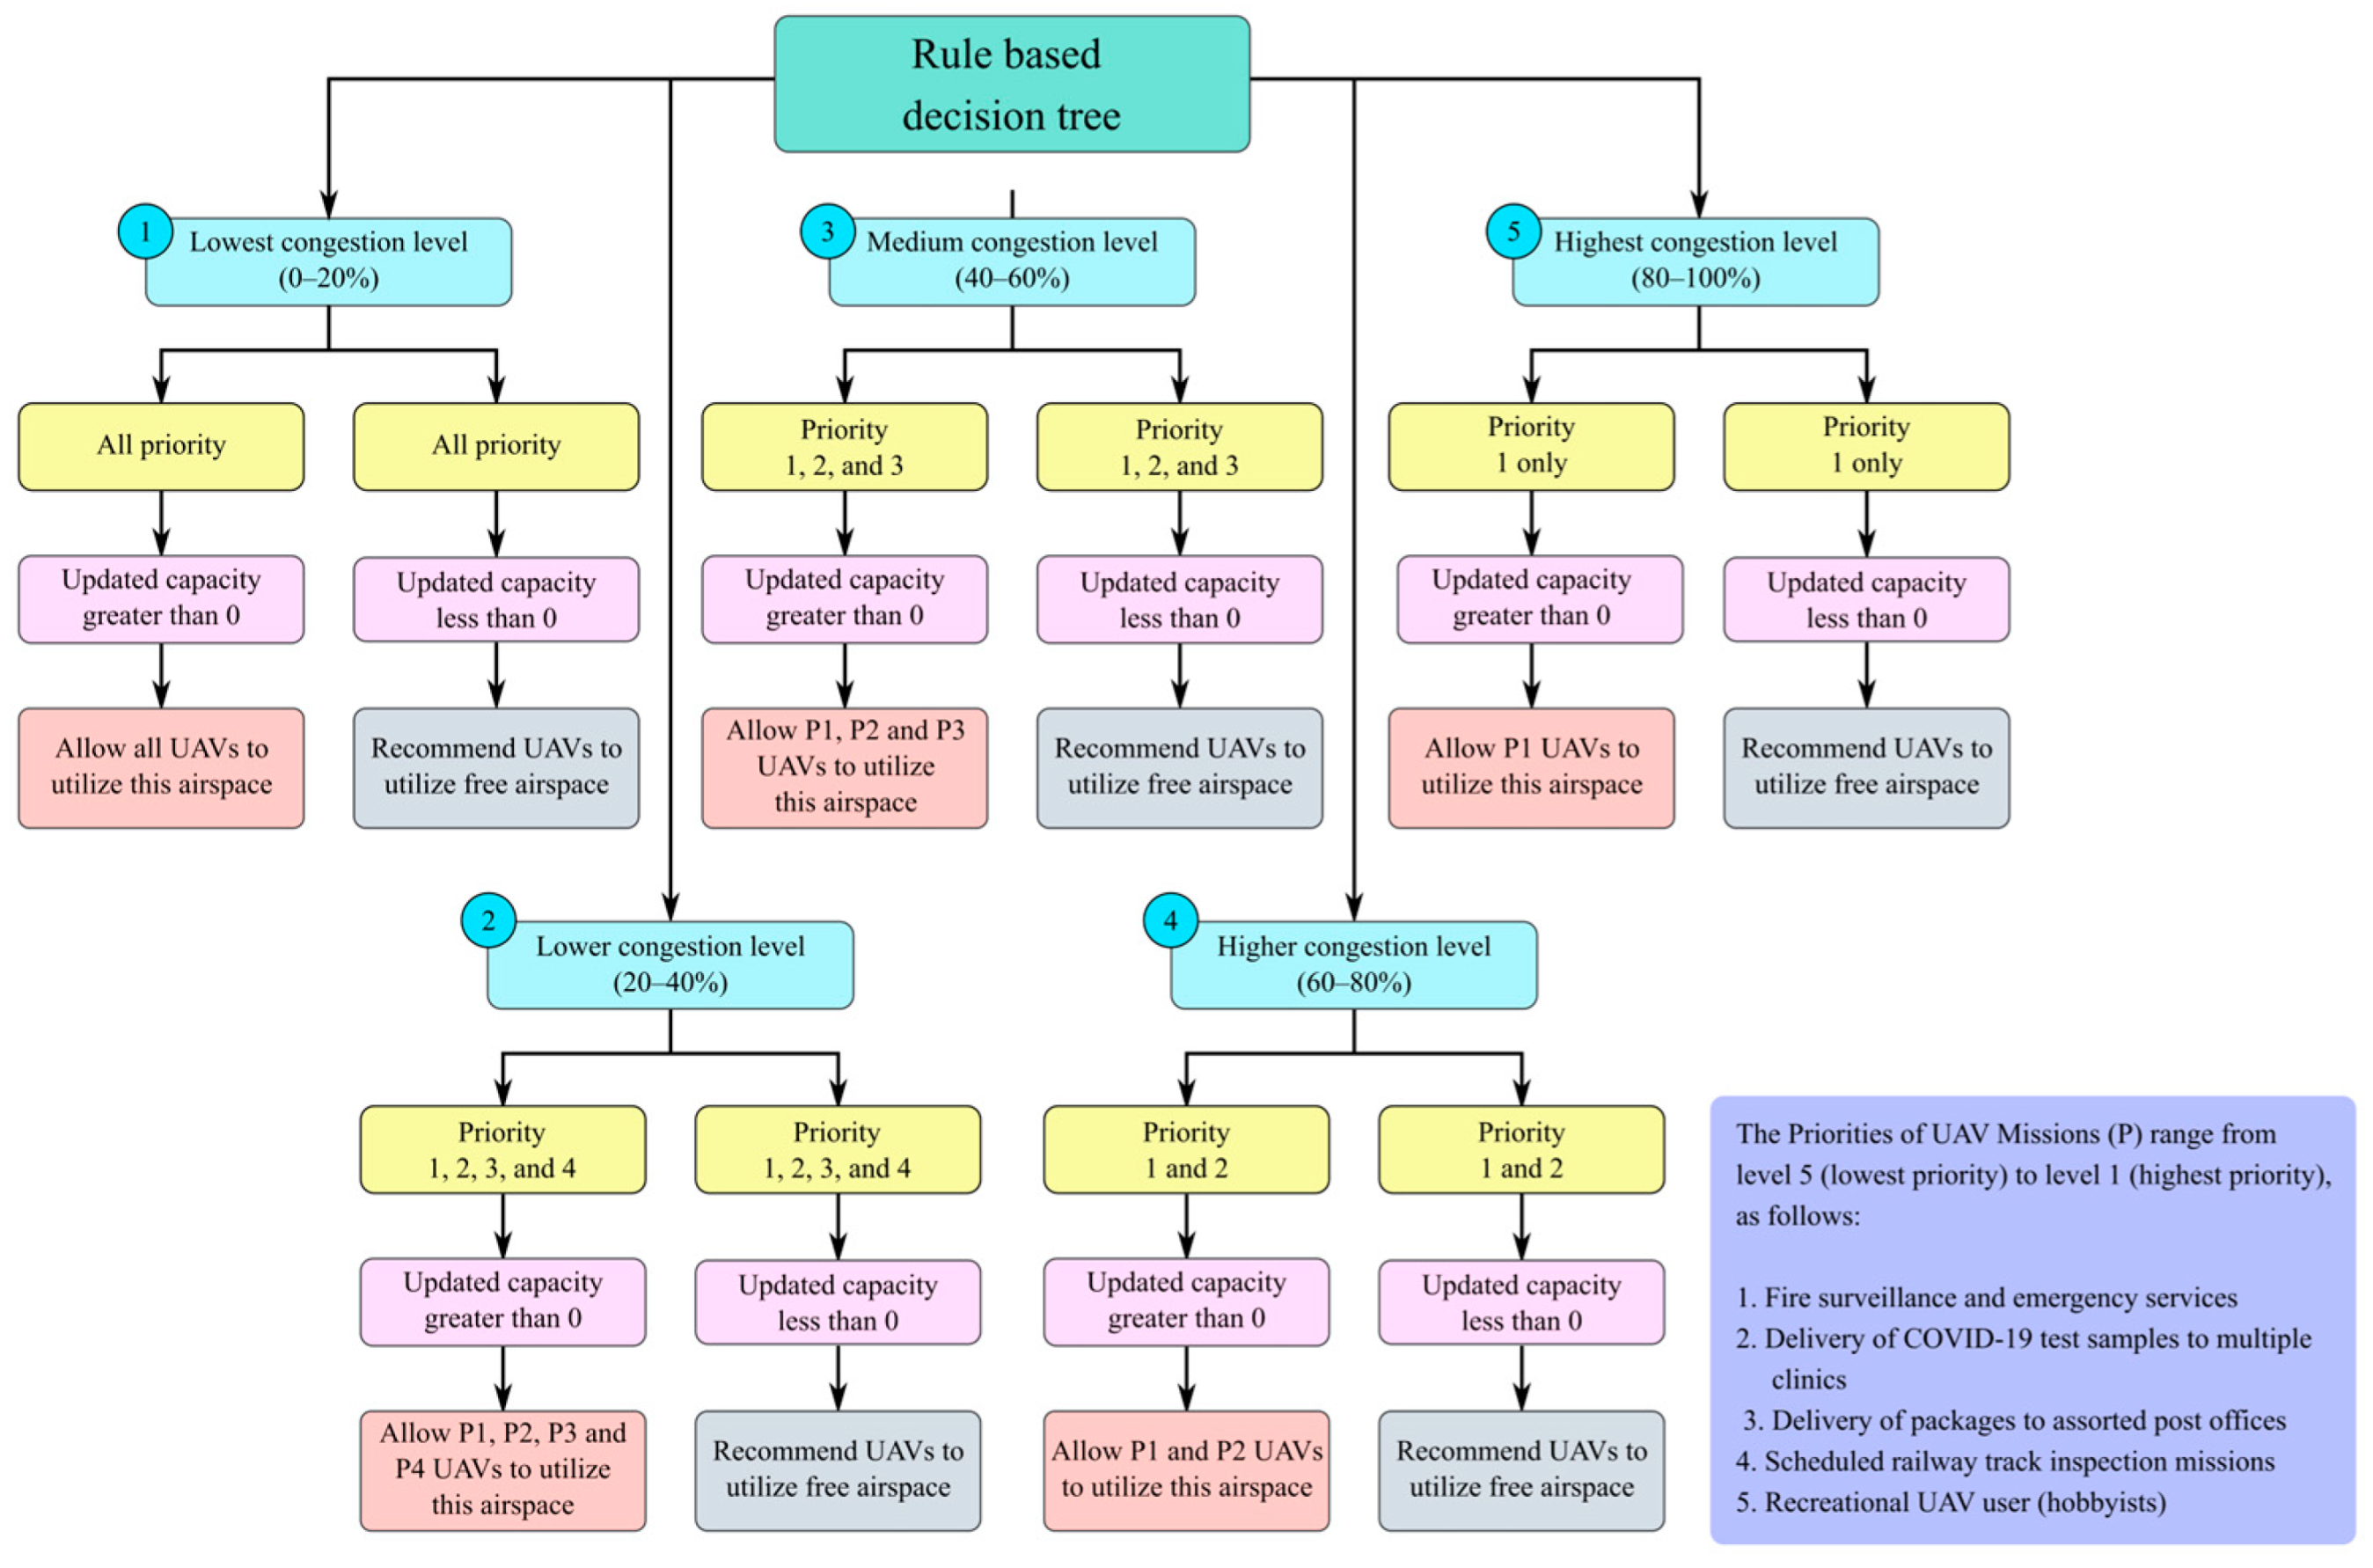
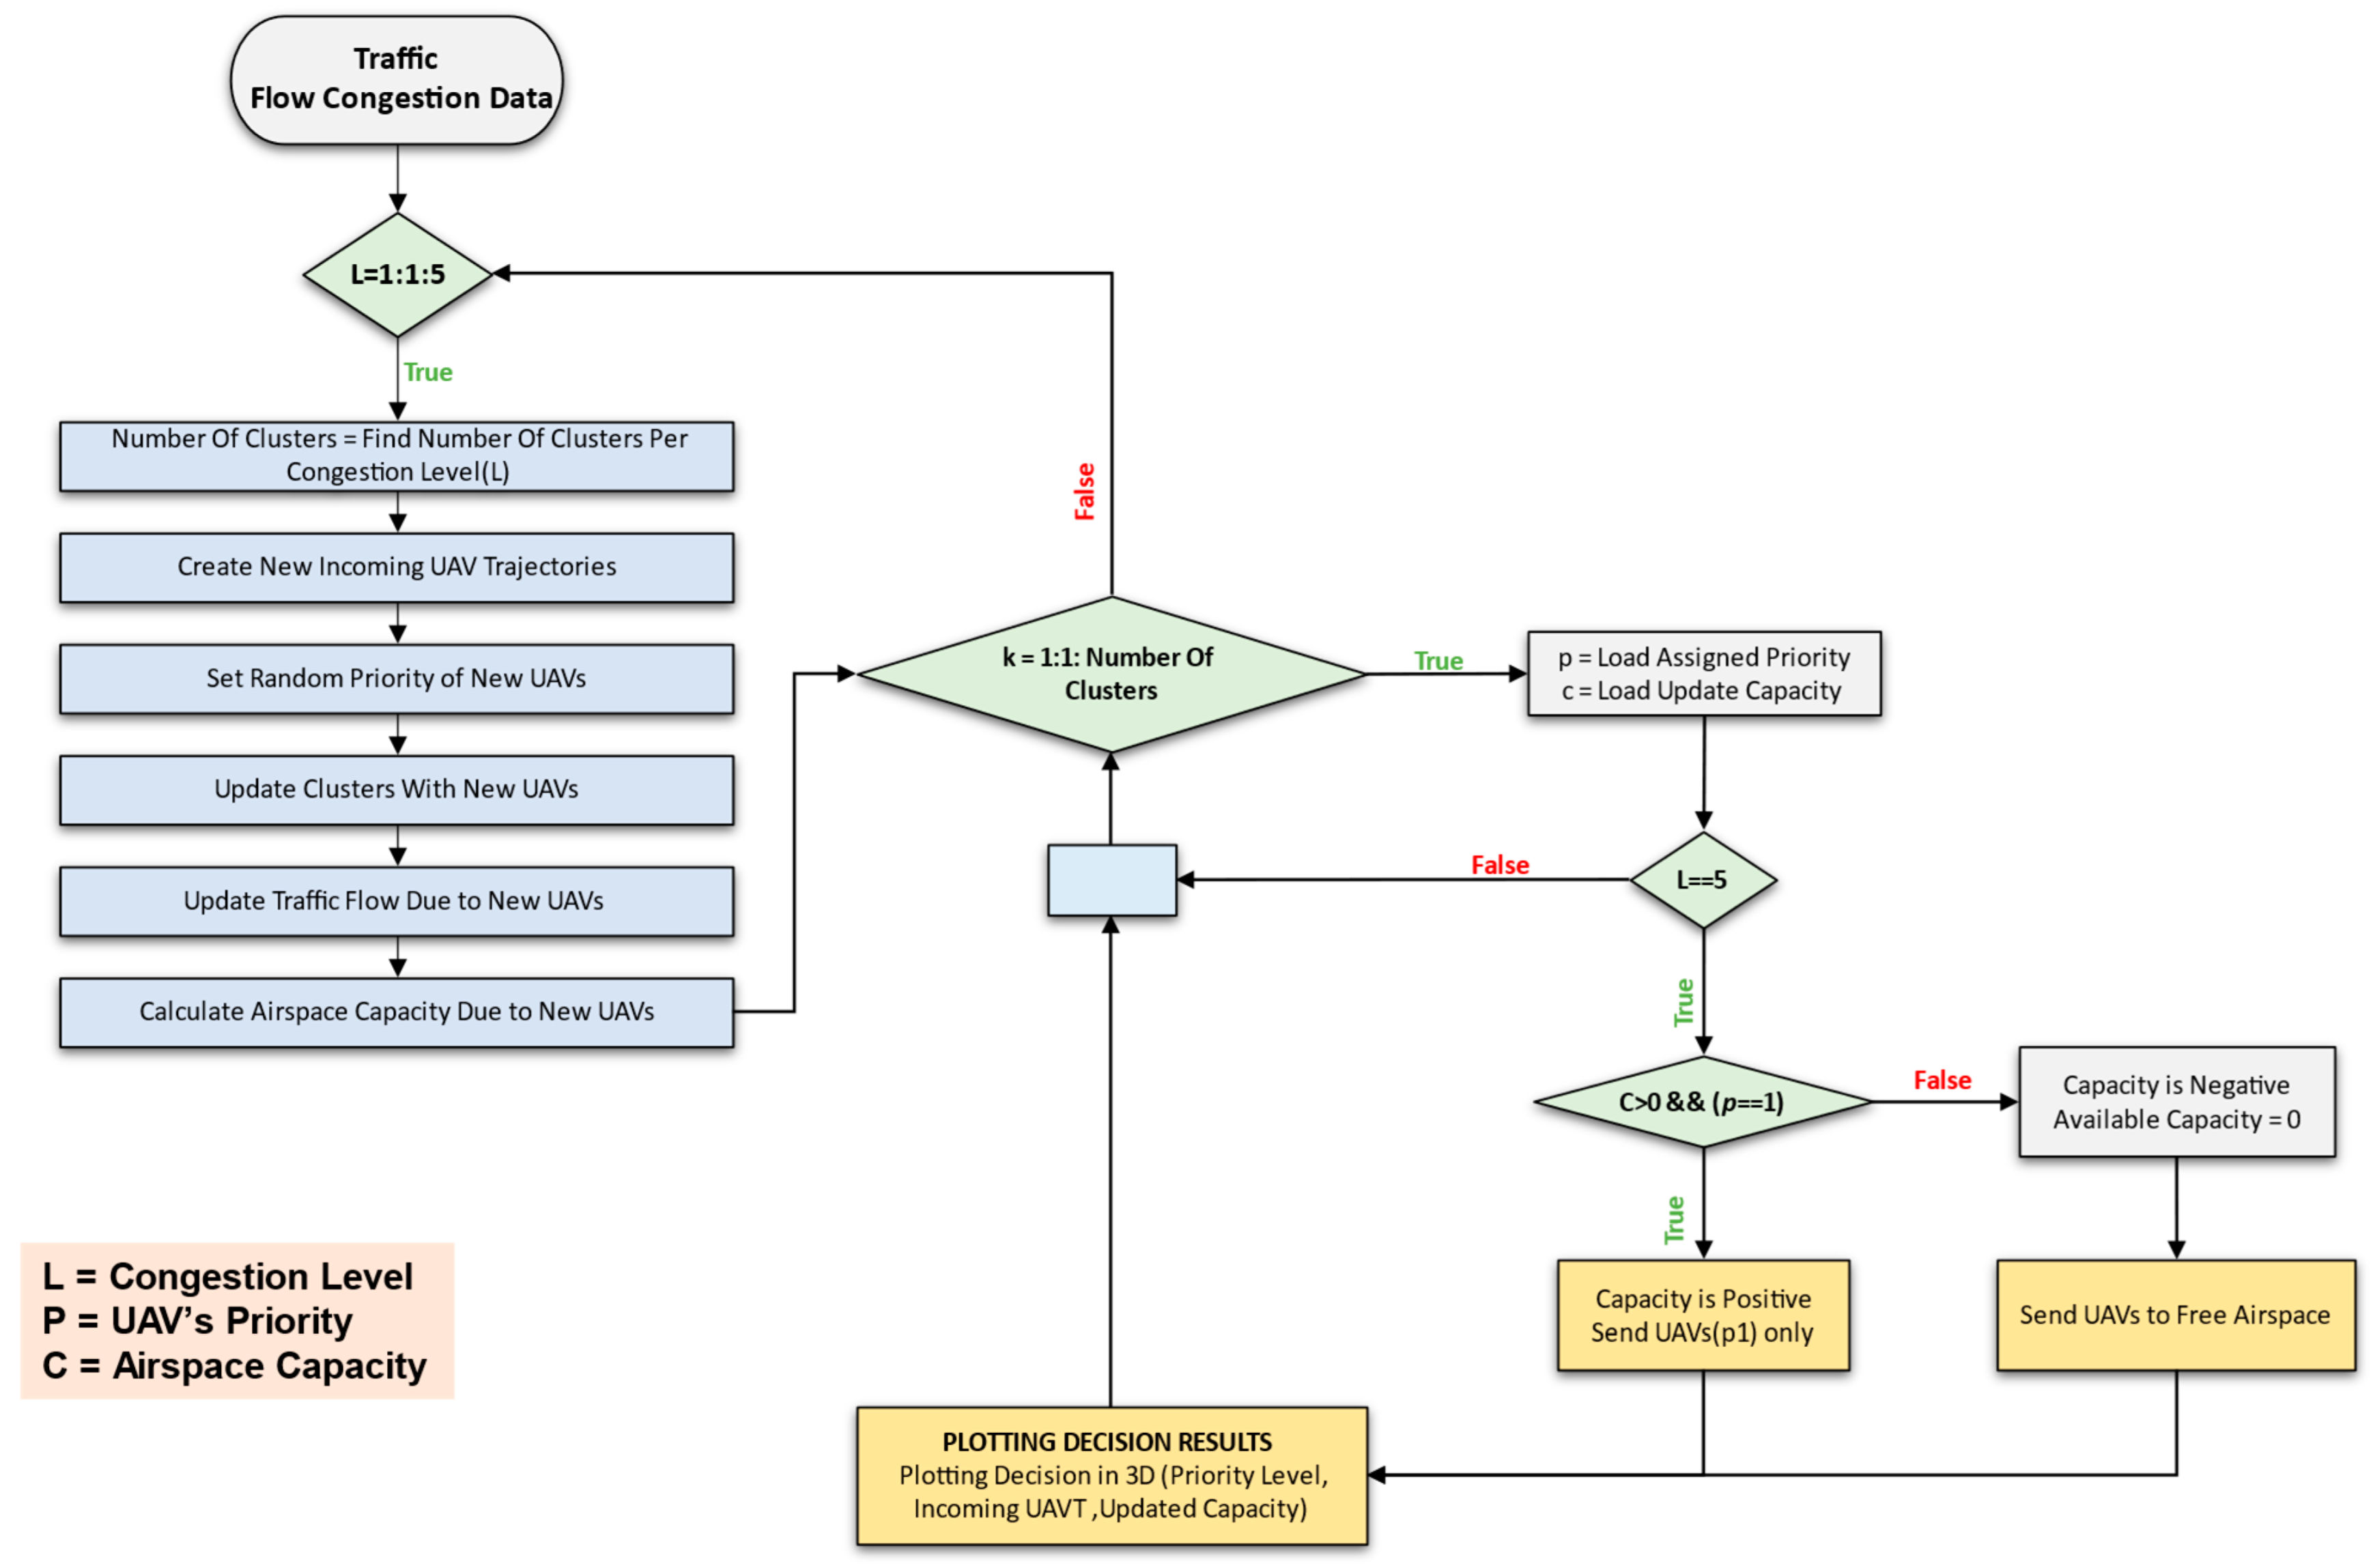
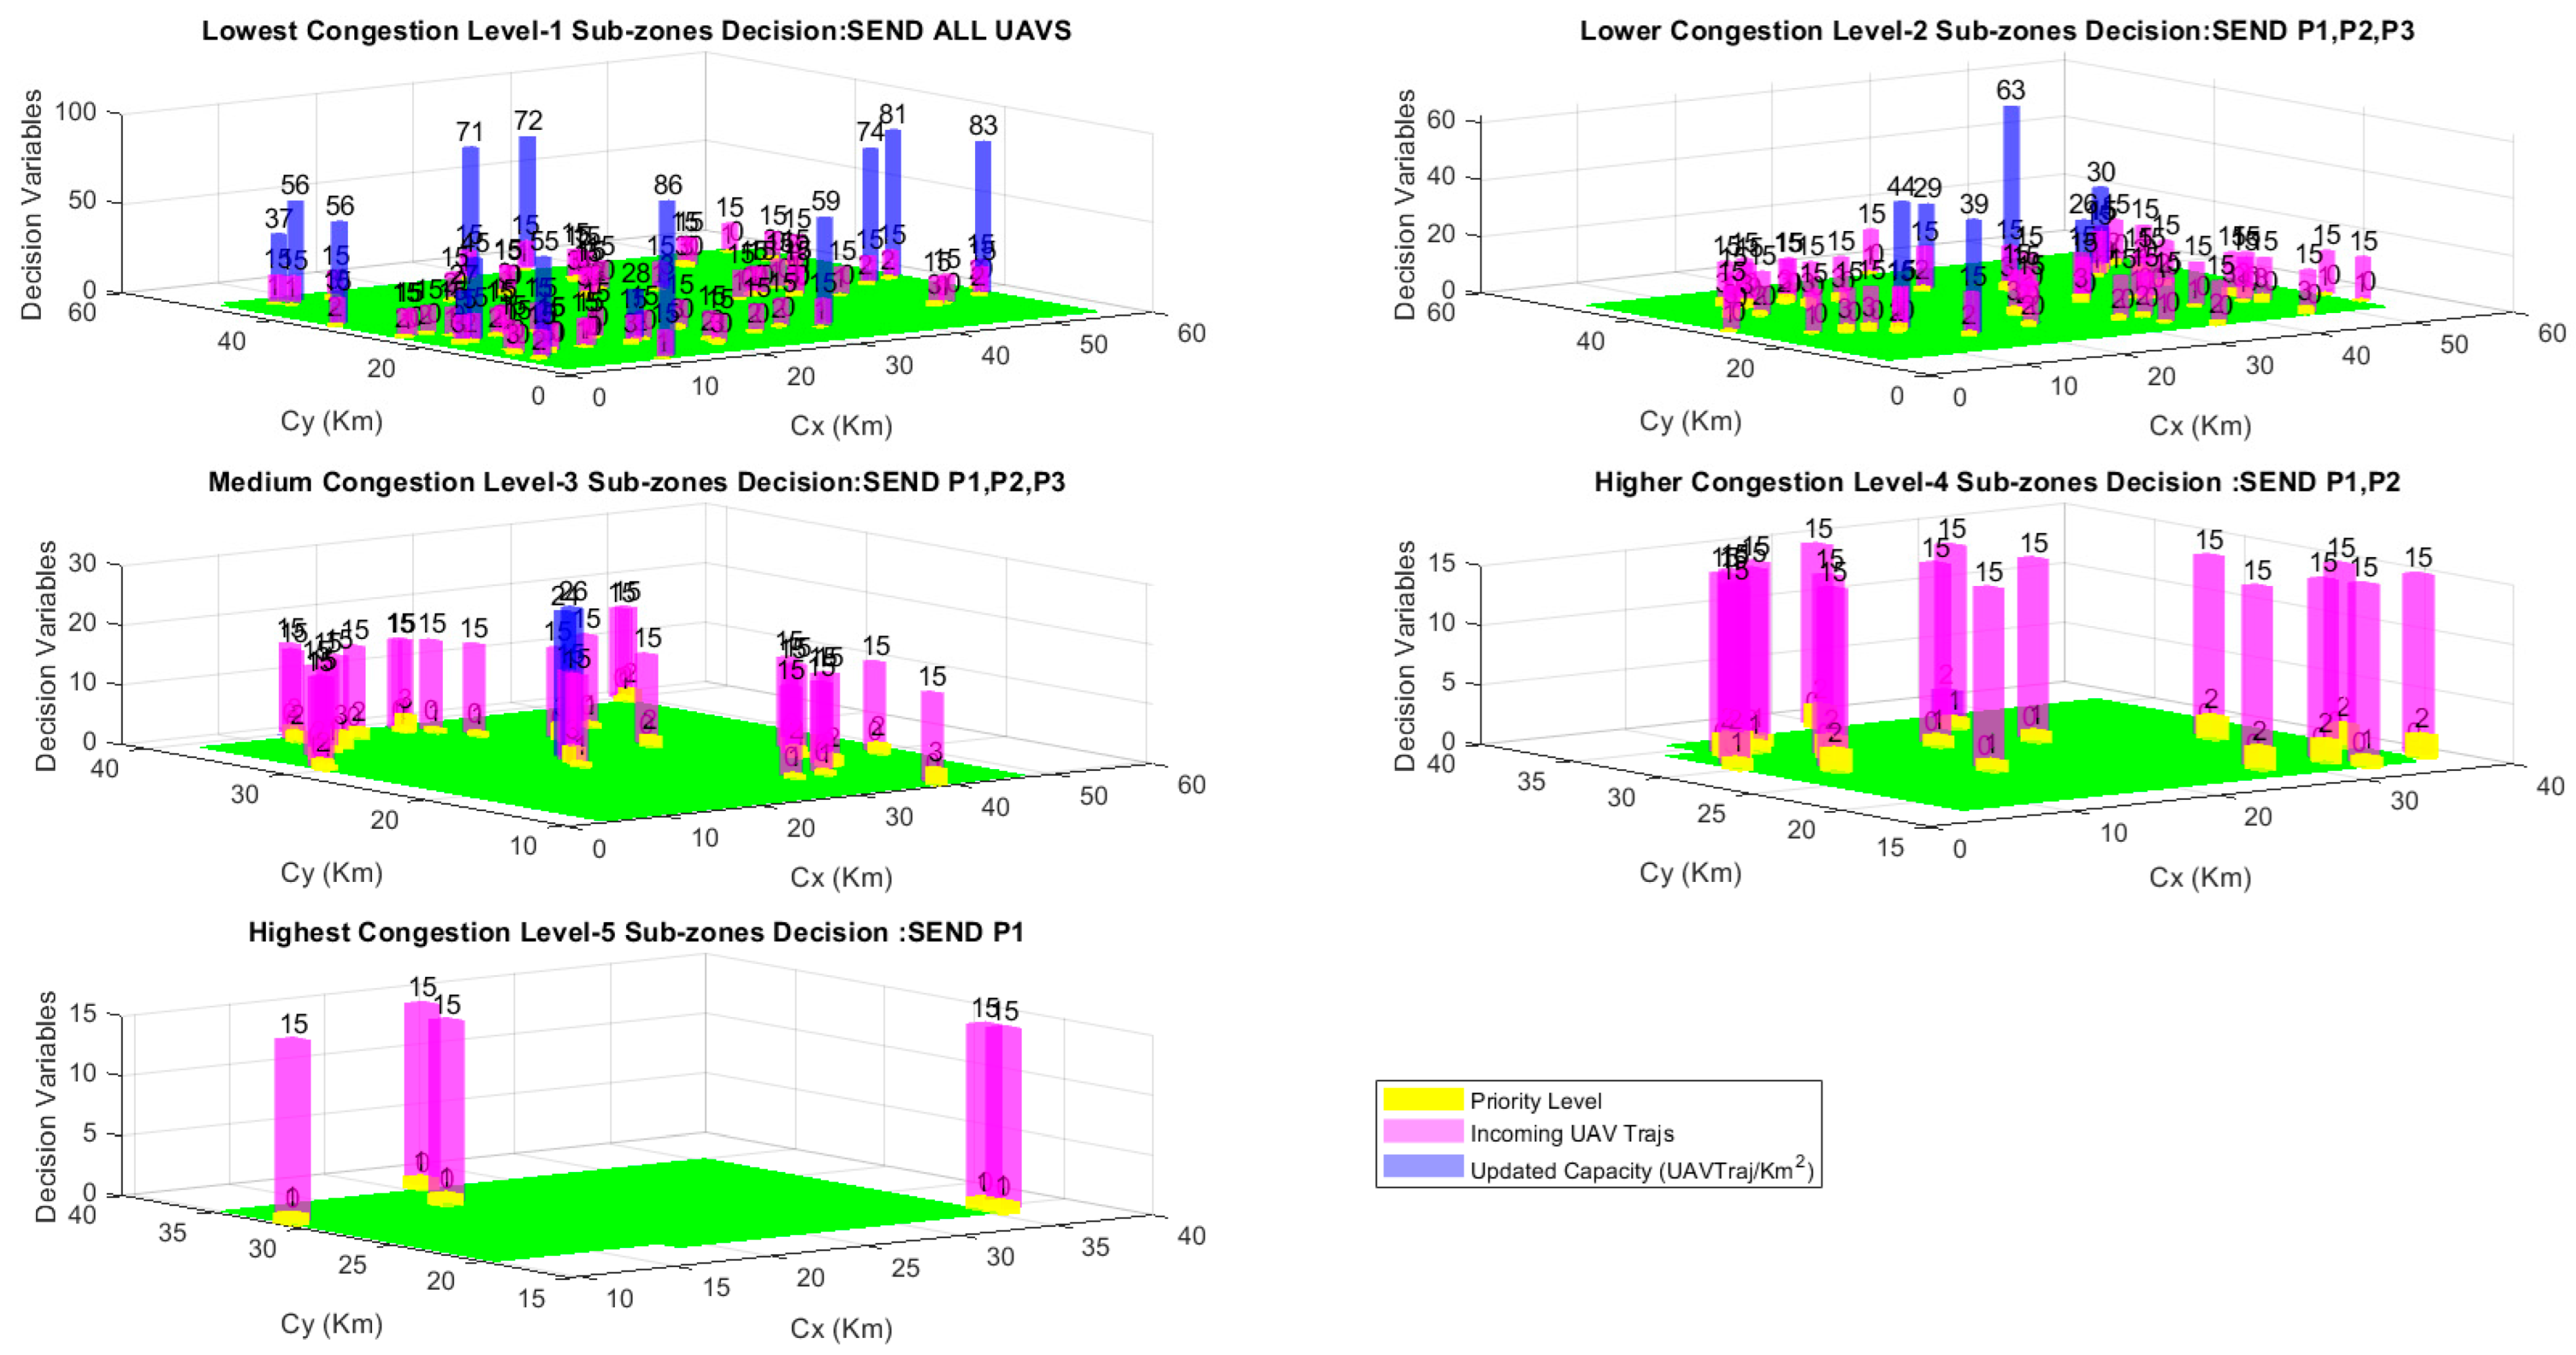
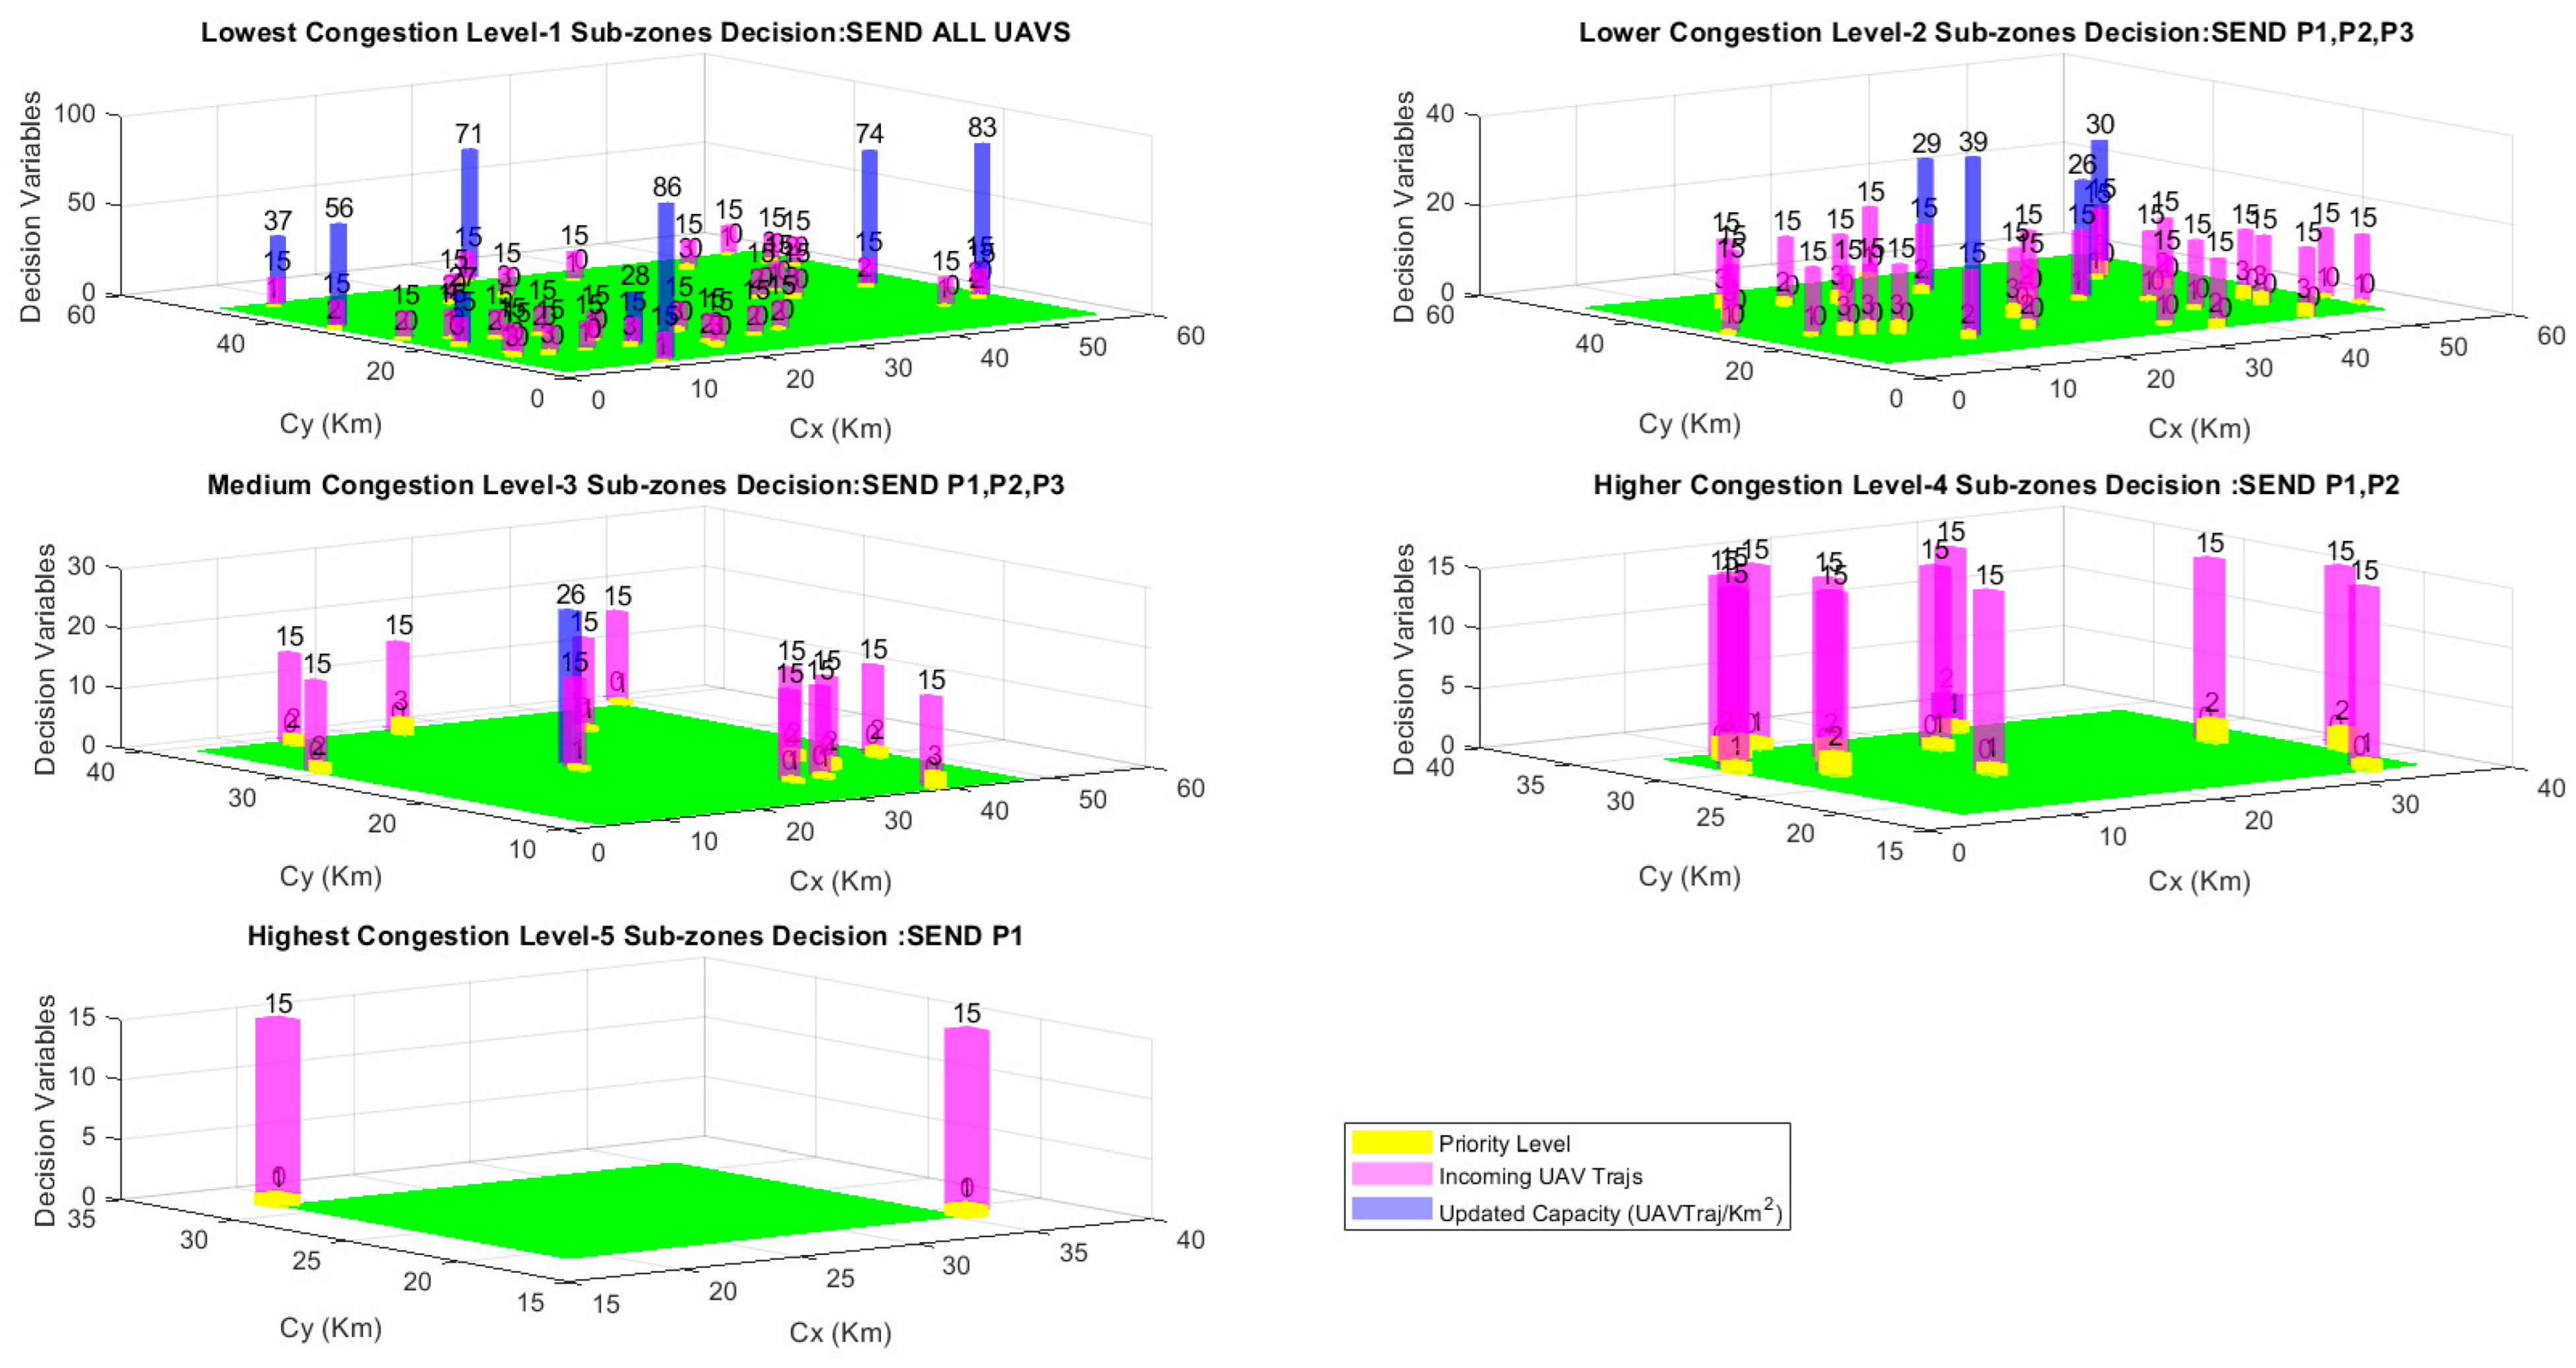
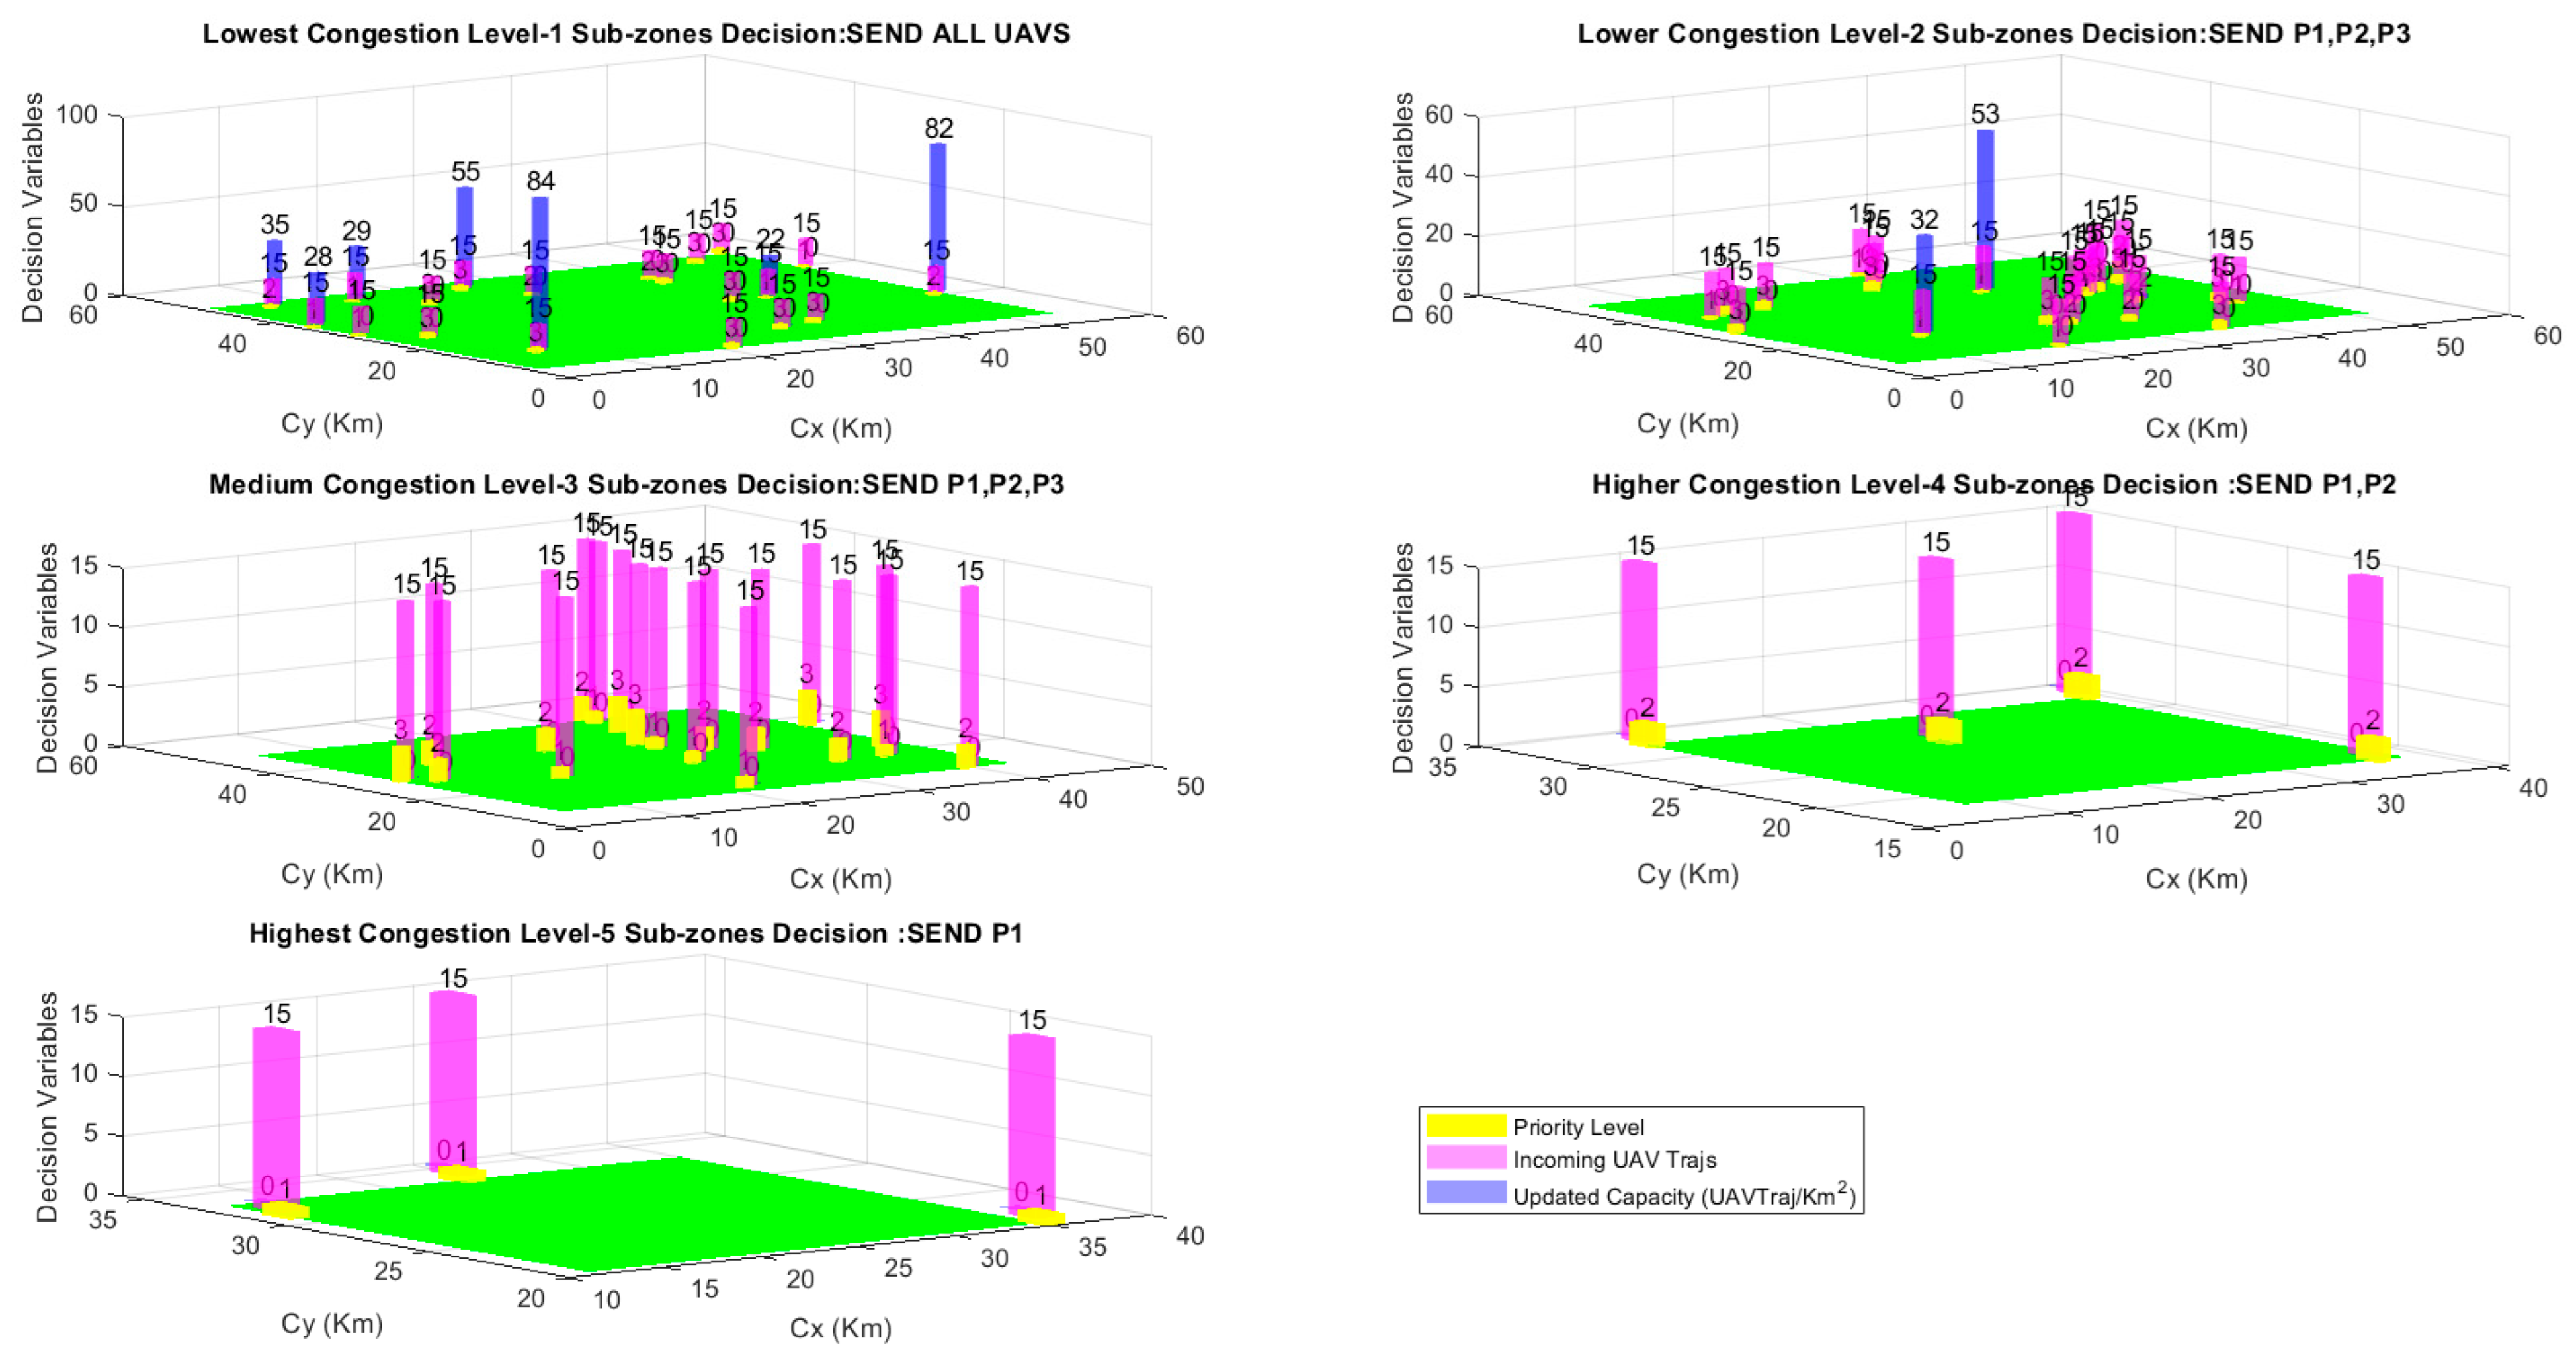
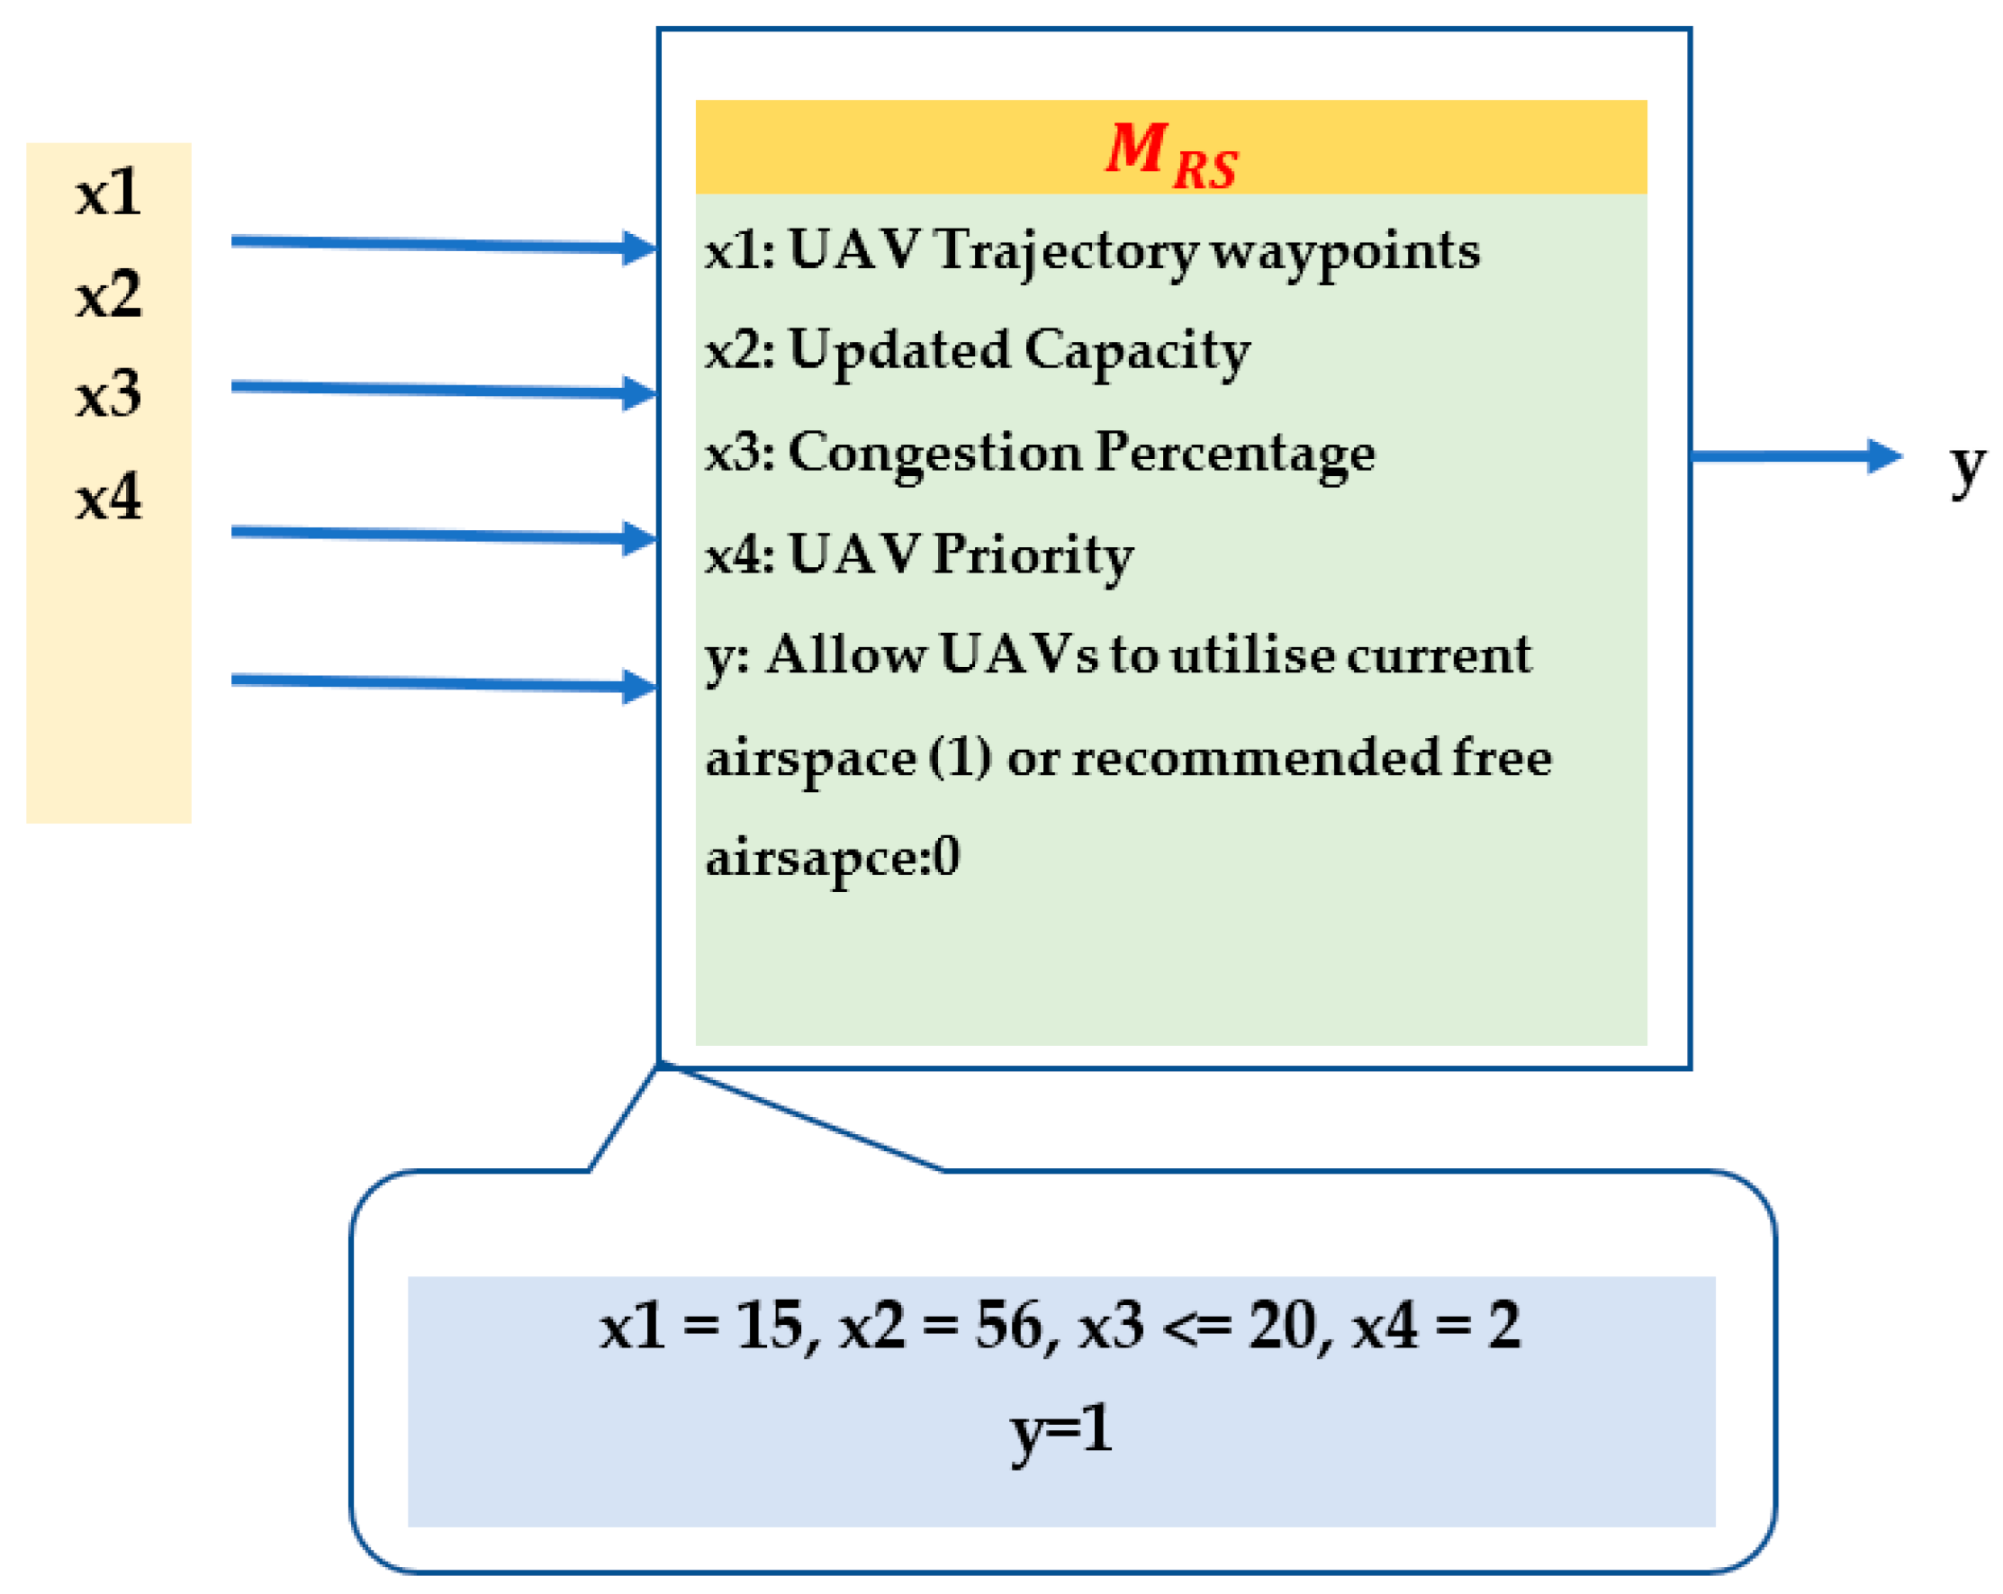
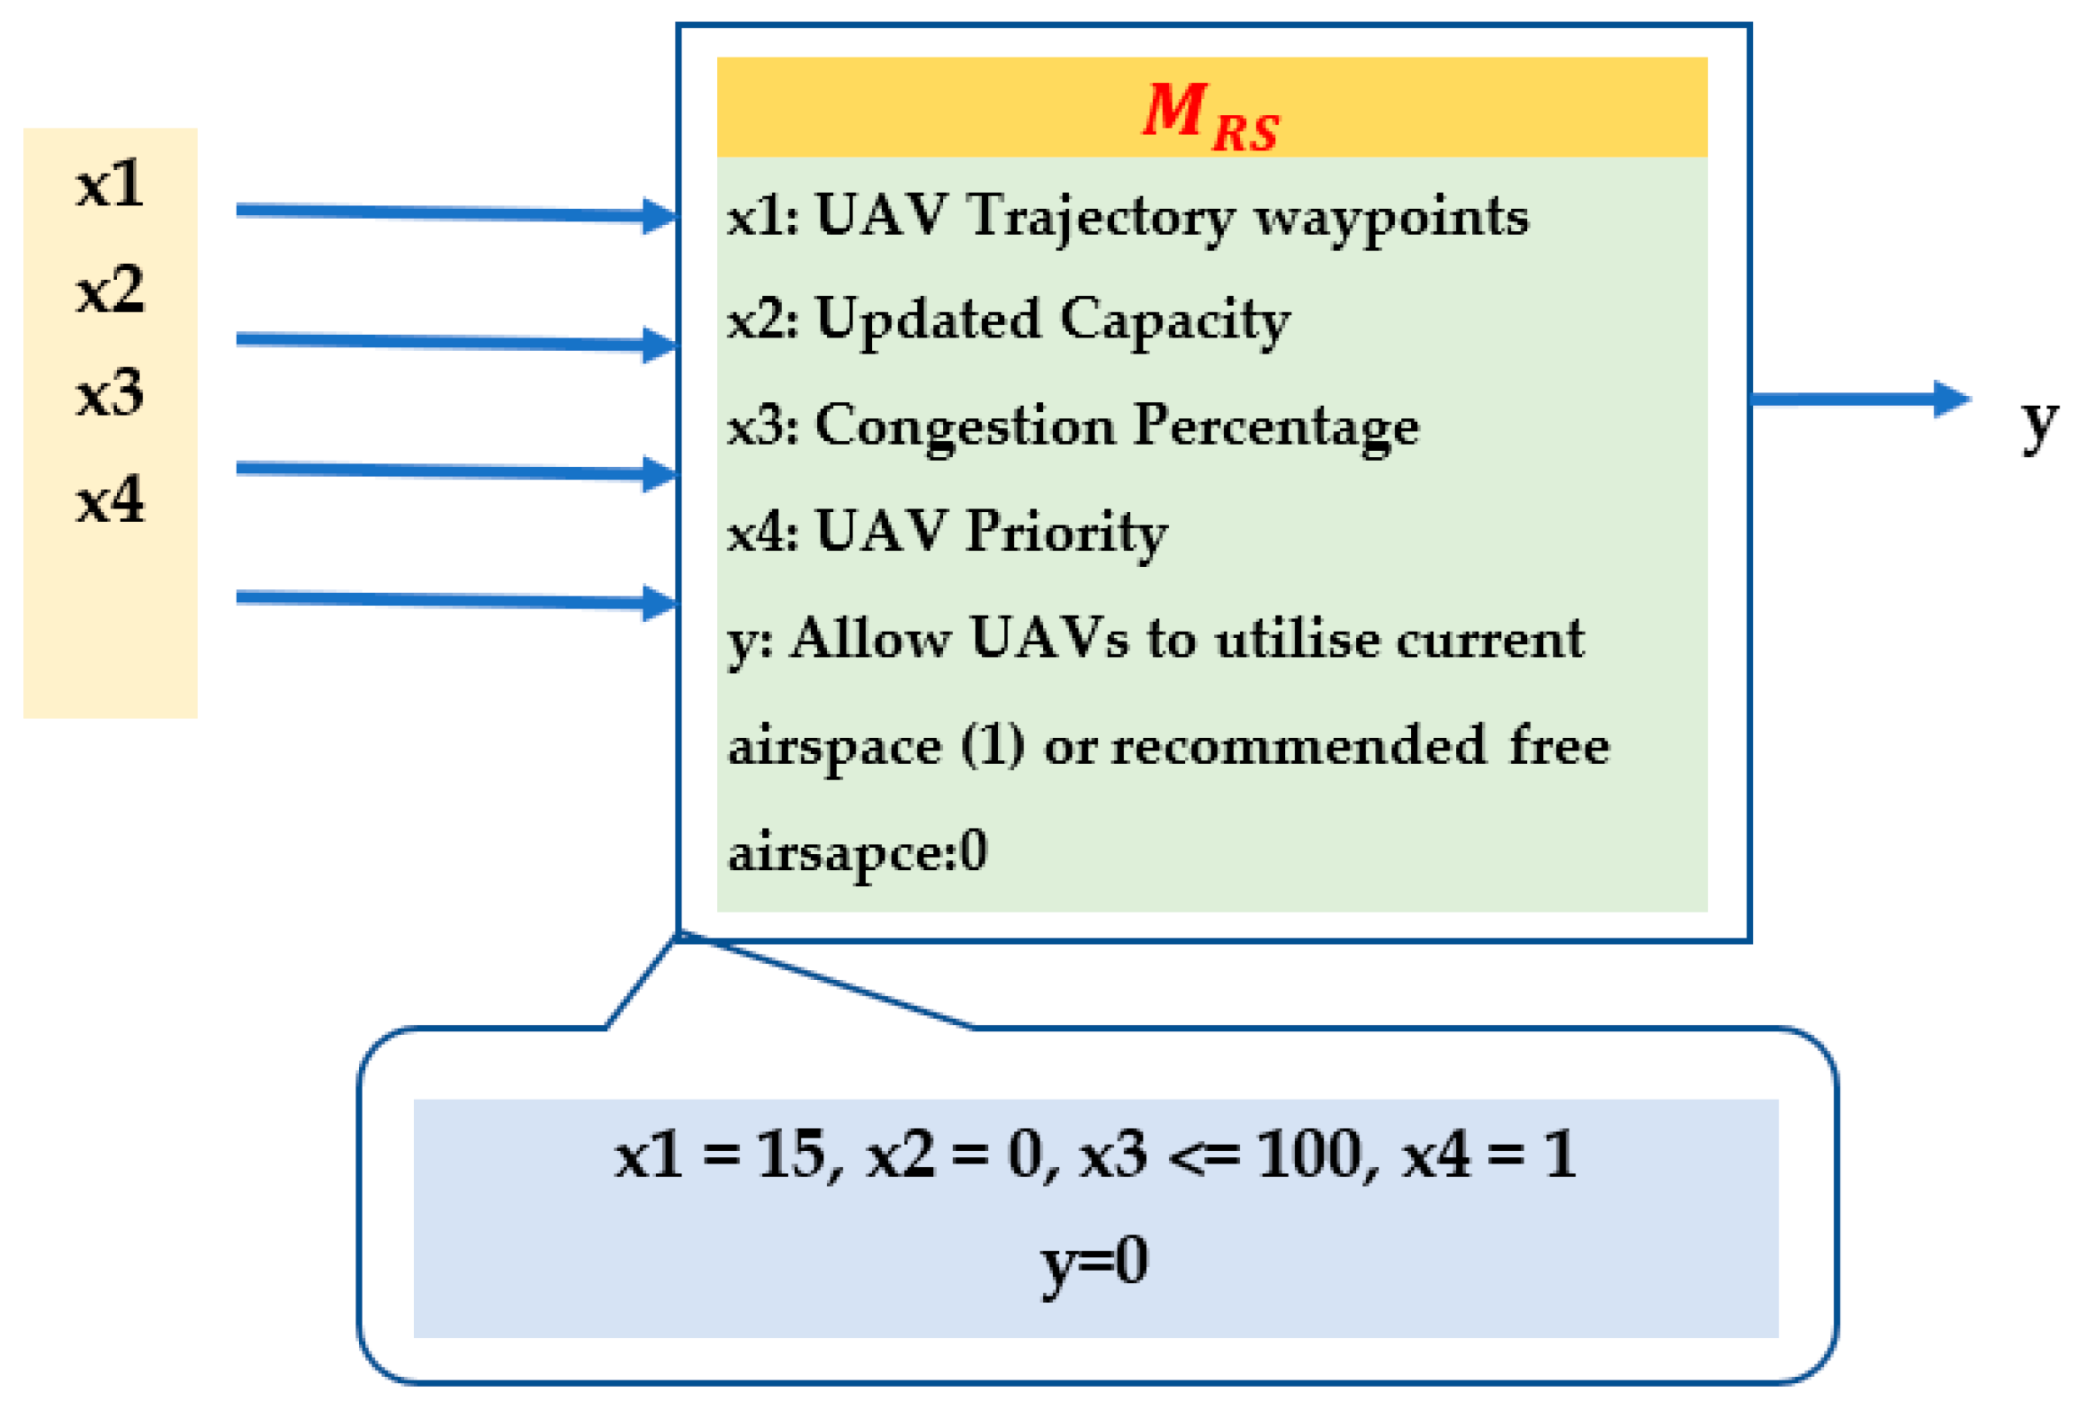
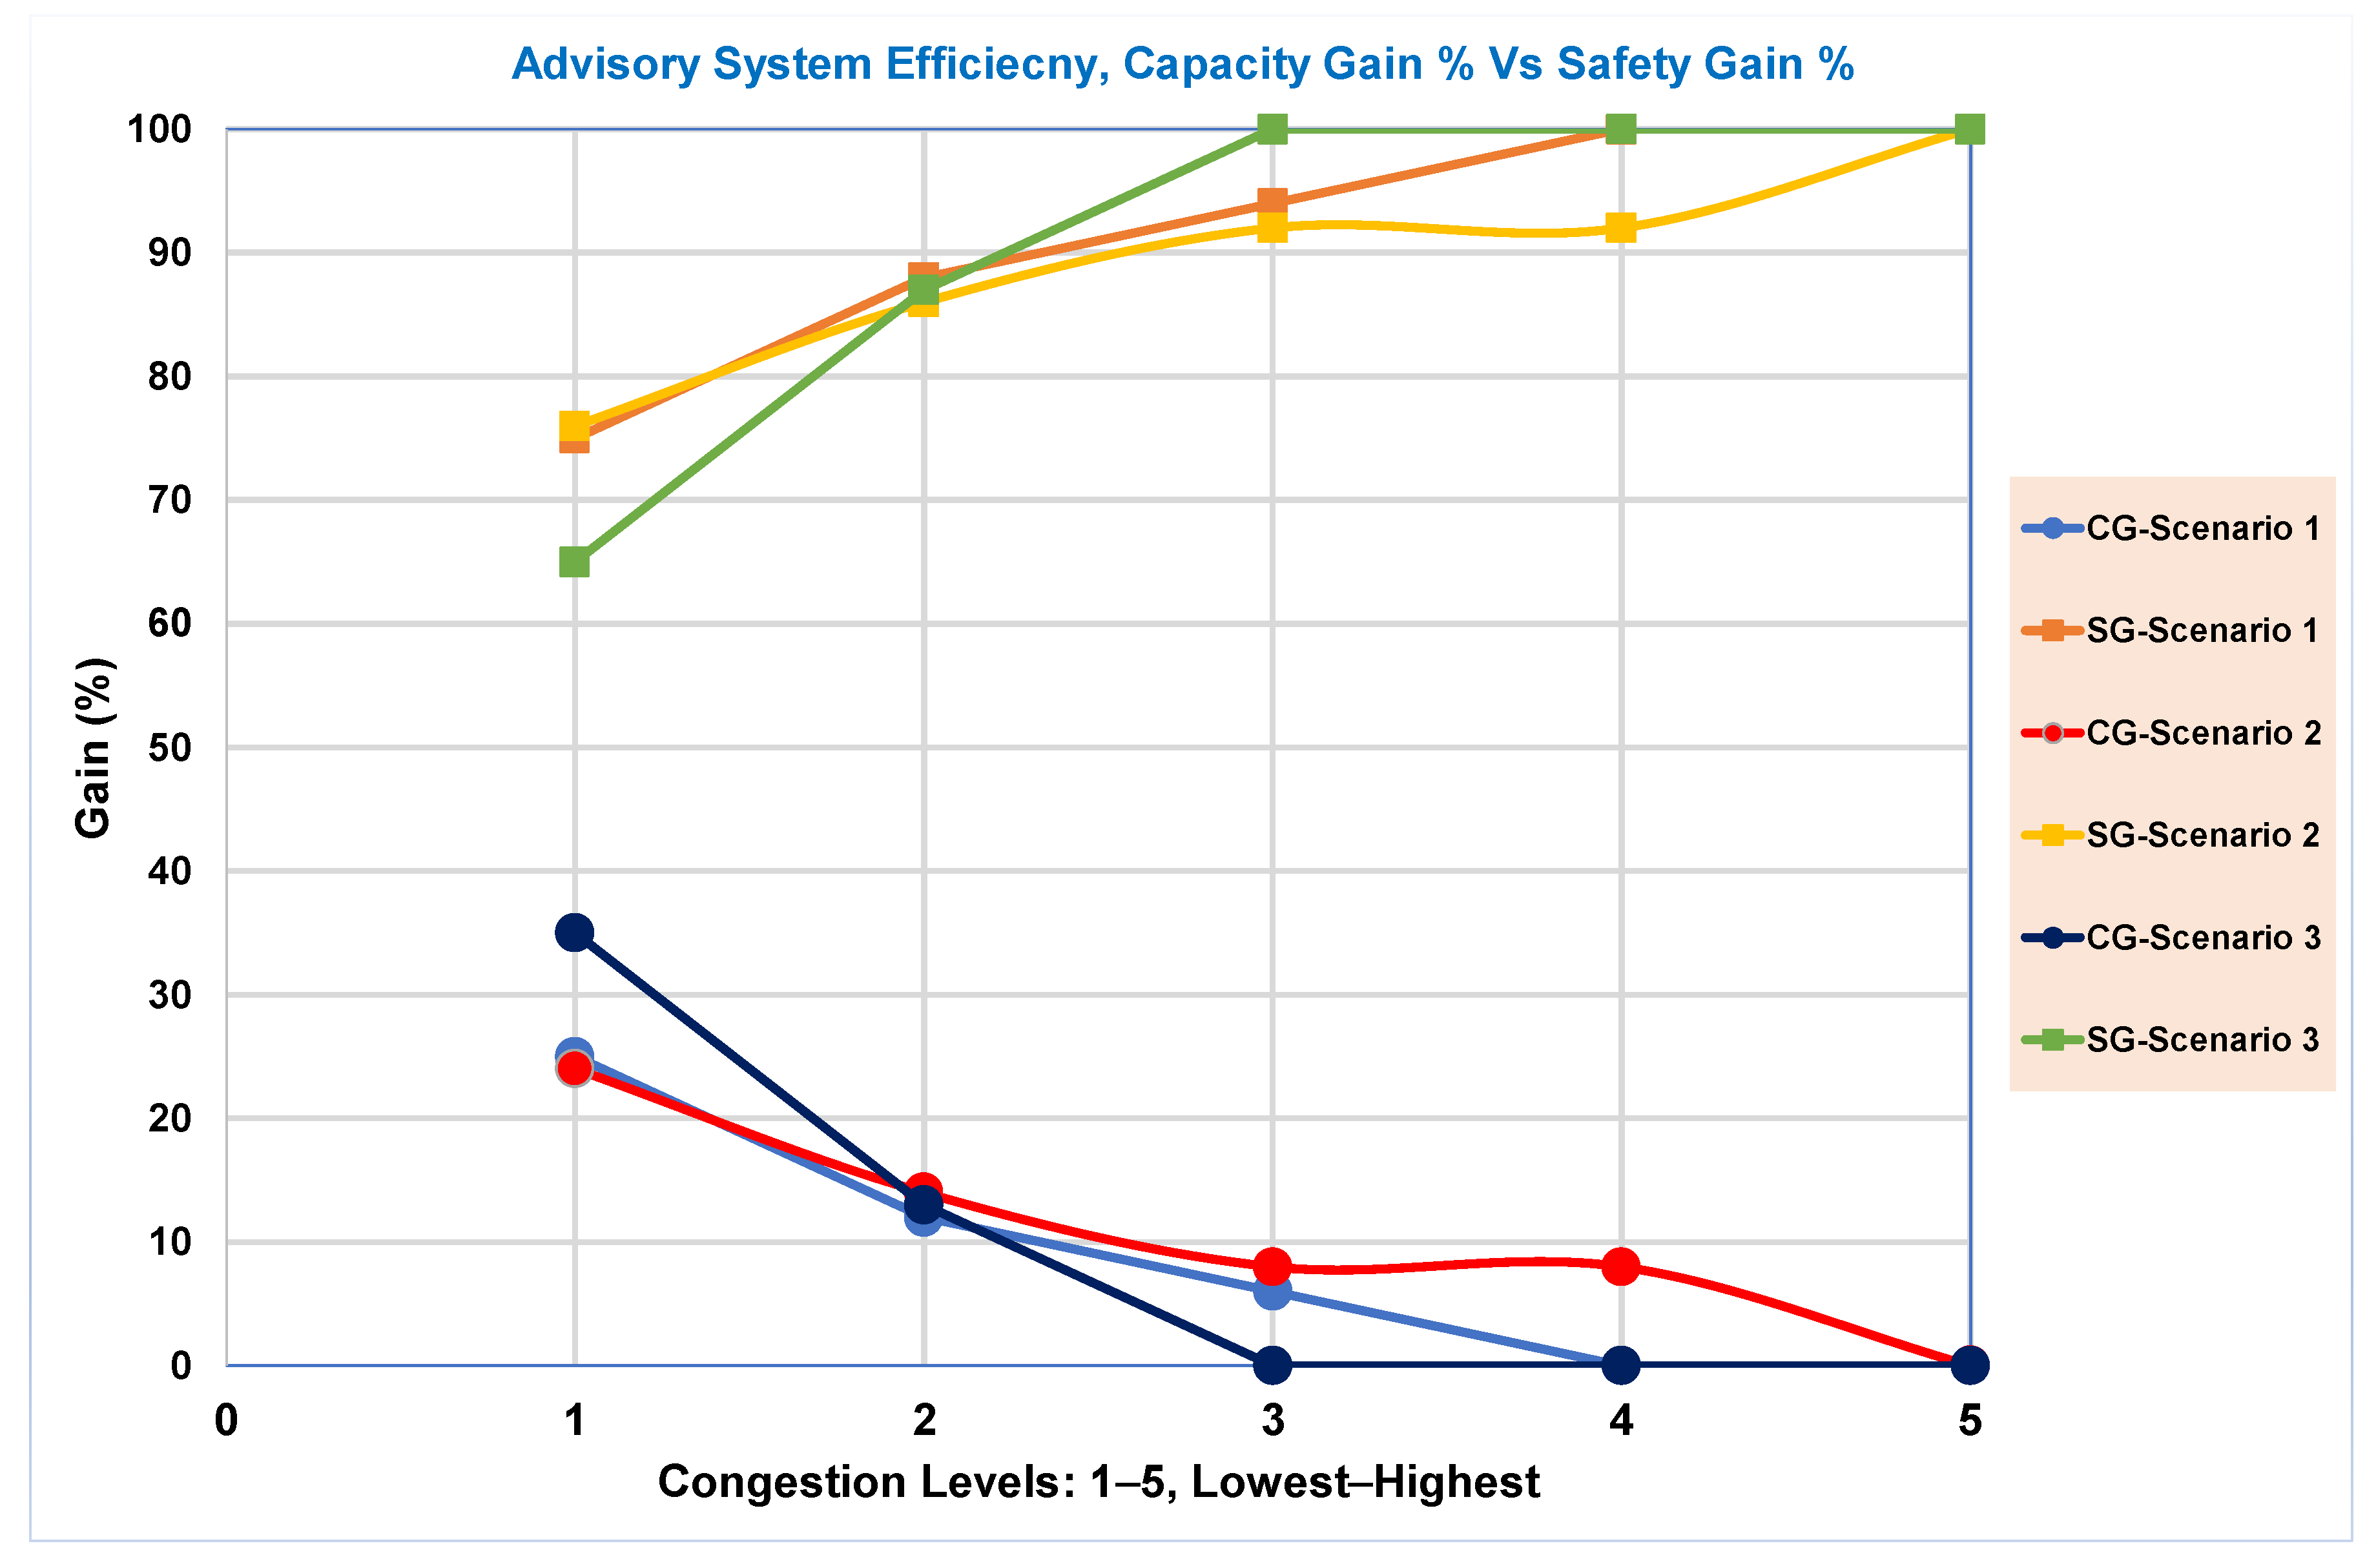
Table 1.
Congestion levels.
| Level Number | % Congestion Range | Congestion Definition |
|---|---|---|
| Level-1 | 00–20% | Lowest |
| Level-2 | 20–40% | Lower |
| Level-3 | 40–60% | Medium |
| Level-4 | 60–80% | Higher |
| Level-5 | 80–100% | Highest |
Table 2.
DBSCAN parameters per congestion level.
| Scenario | Congestion Levels | DBSCAN Parameters | Number of Congestion Clusters Detected | |
|---|---|---|---|---|
| eps | minPts | |||
| 3 | Lowest | 0.20 | 5 | 20 |
| Lower | 0.20 | 5 | 24 | |
| Medium | 0.20 | 5 | 19 | |
| Higher | 0.12 | 5 | 4 | |
| Highest | 0.40 | 5 | 3 | |
Table 3.
Statistics for area utilization (km2) per congestion level, for all scenarios.
| Scenario 1 | |||
| Congestion level | Maximum area (km2) | Mean Area (km2) | STD (km2) |
| Lowest | 264.1664 | 17.8119 | 51.7698 |
| Lower | 248.8680 | 23.3337 | 63.8795 |
| Medium | 172.3195 | 12.3405 | 42.7612 |
| Higher | 135.0970 | 20.9247 | 50.4984 |
| Highest | 13.3878 | 7.3998 | 5.2072 |
| Scenario 2 | |||
| Congestion level | Maximum area (km2) | Mean Area (km2) | STD (km2) |
| Lowest | 375.5019 | 22.0865 | 69.6584 |
| Lower | 122.3201 | 13.4467 | 31.0048 |
| Medium | 159.9153 | 25.2928 | 50.5788 |
| Higher | 47.0391 | 10.6722 | 16.4358 |
| Highest | 80.3852 | 42.2738 | 53.8976 |
| Scenario 3 | |||
| Congestion level | Maximum area (km2) | Mean Area (km2) | STD (km2) |
| Lowest | 549.8083 | 47.8039 | 135.2778 |
| Lower | 123.2273 | 13.2575 | 30.3633 |
| Medium | 60.6678 | 10.6818 | 18.2609 |
| Higher | 308.1550 | 10.6722 | 16.4358 |
| Highest | 31.6595 | 12.7255 | 16.5392 |
Table 4.
Lowest- and highest-congestion clusters: cumulative areas (km2).
| Congestion Level | Cumulative Area | ||
|---|---|---|---|
| Scenario 1 | Scenario 2 | Scenario 3 | |
| Highest | 498.7 | 750.9 | 956.1 |
| Lowest | 22.2 | 84.55 | 38.1 |
Table 5.
Capacity gain: a comparison.
| Congestion Level | Capacity Ratio | ||
|---|---|---|---|
| Scenario 1 9–10 am | Scenario 2 10–11 am | Scenario 3 11–12 pm | |
| Lowest | 6/4 = 1.50 | 8/1 = 8.0 | |
| Lower | 2/3 = 0.66 | 4/6 = 0.66 | 2/8 = 0.25 |
| Medium | 1/4 = 0.25 | 1/3 = 0.33 | 0/9 = 0.0 |
| Higher | 0/2 = 0.0 | 1/5 = 0.20 | 0/1 = 0.0 |
| Highest | 0/3 = 0.0 | 0/2 = 0.0 | 0/3 = 0.0 |
Table 6.
Methodology transparency scoring.
| Methodology | Scores |
|---|---|
| Black Box | 0 |
| Gray Box | 0.5 |
| White Box | 1 |
Table 7.
Advisory-system transparency.
| Advisory DCM Components | Methodology | Transparency Type | Score |
|---|---|---|---|
| Congestion prediction | Deep learning (LSTM) | Black Box | 0 |
| Congestion-level assignment | Simple rule based | White Box | 1 |
| Congestion-subzone identification | Unsupervised clustering ML algorithm (BDSCAN) | Grey Box | 0.5 |
| Airspace-capacity estimation | Rule based | White Box | 1 |
| DCM decision | Decision tree | White Box | 1 |
| Total explainability percentage (%) | 70% | ||
Table 8.
Advisory-system efficiency.
| Congestion Level | Advisory System Efficiencies (%) | |||||||||||
|---|---|---|---|---|---|---|---|---|---|---|---|---|
| Scenario 1 | Scenario 2 | Scenario 3 | ||||||||||
| CG | SG | ECG | ESG | CG | SG | ECG | ESG | CG | SG | ECG | ESG | |
| Lowest | 7 | 21 | 25 | 75 | 8 | 26 | 24 | 76 | 7 | 13 | 35 | 65 |
| Lower | 2 | 15 | 12 | 88 | 4 | 24 | 14 | 86 | 3 | 21 | 13 | 87 |
| Medium | 1 | 15 | 6 | 94 | 1 | 11 | 8 | 92 | 0 | 19 | 0 | 100 |
| Higher | 0 | 7 | 0 | 100 | 1 | 11 | 8 | 92 | 0 | 4 | 0 | 100 |
| Highest | 0 | 3 | 0 | 100 | 0 | 2 | 0 | 100 | 0 | 3 | 0 | 100 |
Table 9.
Comparison of the proposed model with other approaches in the literature.
| Metrics/Parameters | Ref [111] | Ref [129] | Proposed Model | |||
|---|---|---|---|---|---|---|
| Remark | Weight | Remark | Weight | Remark | Weight | |
| Congestion Prediction Usage | No | 0 | No | 0 | Yes | 1 |
| Dynamic Weather Considerations | No | 0 | No | 0 | Yes | 1 |
| Airspace Structure Consideration | Yes | 1 | No | 0 | Yes | 1 |
| Mission Priorities Consideration | No | 0 | No | 0 | Yes | 1 |
| Path Planning Optimization | A * | 1 | GA | 1 | PSO | 1 |
| Mission Scenarios | Yes | 1 | No | Yes | Real mission | 1 |
| Conflict Resolution | Yes | 1 | Yes | 1 | No | 0 |
| Physical Airspace Consideration | 20 × 20 km2 | 1 | 90 × 90 m2 | 1 | 64 × 64 km2 | 1 |
| Traffic Flow Measurements | No | 0 | GA | 1 | DBSCAN | 1 |
| Contingency landing | Yes | 1 | No | 0 | No | 0 |
| Simulate Demand | Yes | 1 | Yes | 1 | Yes | 1 |
| XAI of Decision Support | No | 0 | No | 0 | Post-hoc | 1 |
| Visual Aid for Decision Support | No | 0 | No | 0 | 3D Graphs | 1 |
| Capacity Efficiency % | Demand/Capacity Ratio 64% | 0.64 | Capacity Overload/DCB Ratio 55% | 0.55 | Capacity Gain Ratio 35% | 0.35 |
| Total Counts | 7.64 | 5.55 | 11.35 | |||
| Counts % | 55% | 40% | 81% | |||
Disclaimer/Publisher’s Note: The statements, opinions and data contained in all publications are solely those of the individual author(s) and contributor(s) and not of MDPI and/or the editor(s). MDPI and/or the editor(s) disclaim responsibility for any injury to people or property resulting from any ideas, methods, instructions or products referred to in the content. |
© 2023 by the authors. Licensee MDPI, Basel, Switzerland. This article is an open access article distributed under the terms and conditions of the Creative Commons Attribution (CC BY) license (https://creativecommons.org/licenses/by/4.0/).
Share and Cite
MDPI and ACS Style
Alharbi, A.; Petrunin, I.; Panagiotakopoulos, D. Assuring Safe and Efficient Operation of UAV Using Explainable Machine Learning. Drones 2023, 7, 327. https://doi.org/10.3390/drones7050327
AMA Style
Alharbi A, Petrunin I, Panagiotakopoulos D. Assuring Safe and Efficient Operation of UAV Using Explainable Machine Learning. Drones. 2023; 7(5):327. https://doi.org/10.3390/drones7050327
Chicago/Turabian StyleAlharbi, Abdulrahman, Ivan Petrunin, and Dimitrios Panagiotakopoulos. 2023. "Assuring Safe and Efficient Operation of UAV Using Explainable Machine Learning" Drones 7, no. 5: 327. https://doi.org/10.3390/drones7050327