Article

Planning the Future Electricity Mix for Countries in the Global South: Renewable Energy Potentials and Designing the Use of Artificial Neural Networks to Investigate Their Use Cases

School of Computing, Engineering and Digital Technologies, Teesside University, Middlesbrough TS1 3BX, UK
*
Author to whom correspondence should be addressed.
Designs 2020, 4(3), 20; https://doi.org/10.3390/designs4030020
Submission received: 31 May 2020 / Revised: 25 June 2020 / Accepted: 30 June 2020 / Published: 1 July 2020

Abstract

:
Due to a symbiotic relationship, economic growth leads to greater energy consumption in transportation, manufacturing, and domestic sectors. Electricity consumption in the global south is rising as nations in the region strive for economic development. Due to the high costs of fossil fuels and environmental issues, these countries are planning exploitation of their renewable energy potential for meeting their energy needs. In this paper, we take Myanmar as a case study for which photovoltaic (PV) is seen as the preferred technology owing to its modular nature and Myanmar’s tremendous PV potential. To create sustainable systems, the impact of diurnal PV profiles on electricity demand profiles needs investigating. Accurate load forecasts lead to significant savings in operation and planning and maintenance. Artificial neural networks (ANNs) can easily be used for load profile forecasting. This work proposes a three-stage systematic approach which could be employed by global south countries for designing ANN load forecasting models with the aim of simplifying the design process. While the results of this work demonstrate that PV is a suitable energy source for countries like Myanmar, they also point to the importance of including annual load increase rate and PV output degradation rate in system planning.

1. Introduction

Ample and reliable electricity supply is vital to modern life [1]. Demand for electricity has been rising sharply globally for decades [2], both as a tool for economic growth [2,3,4,5] and as nations increase access levels to the resource through national electrification programs [6]. This has seen developing nations in the global south, such as those in Southeast Asia, increase their share of global consumption dramatically [6,7,8,9]. At the same time governments and the public alike have realized that current electricity networks are environmentally, economically and socially unsustainable due to their heavy reliance on fossil fuels such as coal [10,11]. This has led to an increase in the interest in exploiting rich local renewable energy resources (RERs). Several studies have demonstrated the potential of solar photovoltaic (PV) in Southeast Asia [12,13,14]. However, the variable nature of the output of renewable energy sources such as PV installations makes managing electrical power networks more challenging. Hence it becomes more important to study the effects of increasing renewable penetration levels on load (demand) profiles. Load profiles play a key role in such investigations. Artificial neural networks (ANNs) are a machine-learning method. They are universal function approximators capable of mapping any non-linear function which makes them well suited to forecasting load profiles. The successful application of ANNs in load forecasting problems requires large amounts of data for training. For most developed nations in North America and Europe this data is freely available to the public. This is not the case for developing nations in the global south where processes need to be developed to generate data.

1.1. Aims and Objectives

This work aims to support the planning of the future electricity mix for countries in the global south. From a sustainability and availability point of view, exploitation of renewable energy has a significant role in increasing electrification. Along with investigation of renewable energy generation potentials, their impact on the grid and its capacity to host the renewable energy needs to be factored in through load profile forecasting. The work has the following objectives:
  • To assess the solar-PV potential for a selected location in Myanmar and to determine the impacts on current and future electricity demand profiles in order to aid system planning.
  • To generate accurate and realistic synthetic PV output and load profiles which can be used by system operators and planners to forecast future load profiles through the use of machine-learning models such as ANN.
  • To develop a systematic approach for designing ANN load forecasting that could be employed by global south countries.

1.2. Background

1.2.1. China

The second industrial revolution (1870–1914) was triggered in part by the introduction of public electricity [2]. Since its introduction the demand for electricity across the world has constantly grown as shown in Figure 1 [15,16]. Electricity is now considered to be indispensable in modern day life [3,17], which has led to a steady growth in demand over recent decades [2].
In 1978, Kraft and Kraft discussed the relationship between electricity consumption and economic growth using data from 1947 to 1974 [19]. Since this time there has been a significant volume of research on the connection between the two factors [20]. Today it is widely believed that electricity consumption is the engine of modern economic growth [2,3,4,5], especially in developing countries [3].
China can be used as a case study of the connection between electricity consumption and economic growth. Since the Chinese Economic Reform (CER) in 1978 the country has experienced rapid economic growth and development with an average GDP growth rate of 9.8% [2]. This figure is far higher than the rest of the world and has made China the second largest economy after the United States (US) since 2020 [2].
Prior to the CER China ran an administered labor system in which almost all urban jobs were with state-owned enterprises in which roles were allocated by a bureaucracy [21,22]. Under this system, labor mobility was not permitted which meant that workers were allocated life-long jobs [21]. The CER saw China move away from this centrally planned socialist system to a market orientated system in which labor turnover and mobility was permitted [21,22] which in turn led to a massive growth in China’s domestic urban workforce market [23,24].
The new mobility of the (increased) workforce allowed China to change from an agricultural society to a more industrial-focused one. It also to led to urbanization of the country as large portions of the population left rural areas seeking newly attainable work. The industrialization and urbanization of the country along with agricultural modernization are considered to have triggered the economic development of China and were all supported by an increase in electricity consumption [2].
There is a documented link between economic growth and residential electricity consumption as seen in China where there has been a five-fold increase in electricity consumption in residential buildings between 2000 and 2015 [11]. Before its economic reform, China was the third largest consumer of electricity globally [2]. Since the reform, China has become the principal driver of the increase in global electricity consumption with an average national increase in demand over the past few decades of 9.3% [5,25]. This has seen consumption in China overtake that of the European Union (EU) in 2007, the US in 2010 and continental North America in 2013 [2]. The growth in electricity consumption in China since the economic reform is shown in Figure 2.
The increased consumption in China has seen the Asia Pacific become the highest regional consumer of electricity globally, as seen in Figure 3. Since 1965 the region has increased the percentage of consumption compared to the global total from 11.92 to 43.17%. In the same period, Africa, the Middle East and South and Central America have seen small increases, whilst the Commonwealth of Independent States (CIS), Europe and North America have all decreased their percentage of the global total as seen in Table 1.
It has been shown that during the early stages of a country’s economic development the focus is on production levels and that environmental quality deteriorates [7,26]. This has clearly been seen in China due to the fast speed of its development [27].
China’s development has been fueled by vast amounts of fossil fuels [28]. Coal is particularly dominant in the country’s fuel mix, meeting around 70% of consumers’ electricity demand [11]. Whilst the land mass of China is just 2.2% of the world’s total it consumes more than half of the world’s coal [24].
The link between increased pollution and fossil fuels has been extensively documented in literature [11]. This link can clearly be seen in China, where increasing use of fossil fuels such as coal has resulted in severe air pollution [28], and seen the country become the largest emitter of particulate matter and greenhouse gases such as sulphur dioxide (SO2) and nitrogen oxides [29].
Air pollution is not a problem faced solely by China but one which has become one of the largest global issues of the Anthropocene epoch [28]. Today approximately 92% of the world’s population are exposed to air pollution levels in excess of the suggested limits of the World Health Organization (WHO) [27,30]. Populations in Africa, Asia and the Middle East are particularly at risk [30]. The ever-increasing global demand for electricity is augmenting the air pollution problem and other issues such as global warming [29].
Air pollution in China at times causes heavy haze episodes when particulate matter levels spike [11]. During these periods the population is advised to stay indoors and close all windows and doors. The increase in indoor activities leads to an increase in electricity consumption through the use of appliances such as air conditioners and air purifiers [11]. These pollution mitigation activities have led to the hypothesis of the self-aggravation of air pollution [11].
It has been shown in [7,26] that when economic growth reaches an inflection point, environmental protection awareness increases. This is true in China where over the past decade the public in the country have shown an increased awareness of the problem and its adverse health impacts [11]. The issue of air pollution levels has also been a major concern for the government in China since 2013 as it tries to find a trade-off between environmental protection and continuing economic growth [26,27]. In September of that year, the Ministry of Ecology and Environment of China implemented strict energy conservation and emission reduction policies, “Atmosphere Ten Plans,” to reduce pollution and increase public health and quality of life [26,27].
Another way in which China is trying to combat pollution and global warming is by changing the fuel mix in its electricity network. Since 2000 it has made rapid progress in developing renewable energy with an average annual growth rate over the last decade of 62.5% [29]. This growth has seen China become the global leader in renewable energy [29]. The country’s government have set several targets with regards to this shift, including 60% renewable energy and 86% renewable electricity by 2025 [29].
China’s renewable energy production is currently dominated by hydropower. However, as 80% of this resource has already been explored, other options need to be examined [29]. Fortunately, China has vast resources of other renewable resources such as solar and wind, which has led to an annual increase in capacity of 100.3% and 58.2%, respectively, between 2006 and 2015 [29].

1.2.2. Association of Southeast Asian Nations (ASEAN)

Developing countries in Asia and around the globe have looked closely at the symbiotic relationship between electricity consumption and economic growth in China. They have also looked closely at the risks of the continued reliance on non-sustainable energy sources.
The Association of Southeast Asian Nations (ASEAN) is a regional intergovernmental organization in Southeast Asia which promotes inter-governmental co-operation on a range of policies [7,8]. ASEAN was created in 1967 when five countries; Indonesia, Philippines, Singapore and Thailand signed the ASEAN Declaration. The bloc now consists of 10 member countries after Brunei (1984), Vietnam (1995), Laos (1997), Myanmar (1997) and Cambodia (1997) joined the collation.
According to the United Nations the ASEAN region is home to nearly 650 million people [31]. There has been a rapid increase in urbanization levels in Southeast Asia in recent times with urban populations rising from 40% in 2000 to nearly 50% in 2018 [6]. Driven by rapid economic growth and population urbanization the region is increasingly influencing world energy trends with demand increasing by over 50% between 2000 and 2013 [8]. However, whilst millions of the region’s inhabitants have gained access to electricity since 2000, there are still approximately 45 million without access today [6]. Access to electricity has been identified as essential to ASEANs economic growth programs [7].
Over recent years, several published studies have examined the current and near future energy demands of ASEAN member states by both the ASEAN Centre for Energy (ACE) and the International Energy Agency (IEA) [6,7,8]. The studies hypothesized that energy demand in the region could rise by about 80% up to 2040 and that some countries like Malaysia would possibly double their consumption [8]. Other scenarios found that in order to meet economic growth targets, the regions energy consumption would rise by 2.7 times compared to 2013 levels [8].
Southeast Asia has large concentration of population and economic activities along its extensive coastlines and has a strong reliance on the region’s natural resources such as agriculture and forestry [8]. Therefore, it is at high risk from the effects of climate change [8]. As a result of this, policymakers in the region are focused on finding a sustainable model that allows the region to meet the energy needs required to enable continued economic growth [6,7,8].
The region has relied heavily on fossil fuels for its energy demands in the past [7], and currently three-quarters of ASEAN’s electricity demand is currently met by fossil fuels [6]. However, in lessons learnt from China, policymakers in the region have intensified efforts to create a sustainable energy solution for the future [6,8]. Renewable energies are currently a significant component of the ASEAN energy fuel mix meeting around 25% of primary demand [8]. ACE and IEA both agree that they are likely to play an even larger role in the future as cost reductions in renewable energy (RE) technologies are taken advantage of [6,7,8]. The potential of both solar and wind have been identified as significant candidates in meeting the renewable energy aims of the region [7,8]. Several frameworks have now been put in place to better support investment in wind and solar [6].

1.3. Case Study Country—Myanmar

1.3.1. Background

Myanmar (officially the Republic of the Union of Myanmar) was the 9th country to join ASEAN and is the second largest country in Southeast Asia [12]. It is currently one of the lowest consumers of electricity in the world. In 2011 it was ranked 191 [14], and in 2016 the average electricity consumed per capita was around 150–160 kWh [32]. This figure is far lower than the top 10 consumers (Table 2) [33], and much lower than the world average of 3000 kWh. It is even lower than the average of least developed countries figure of 174 kWh [14].
The low per capita consumption rates of Myanmar are part of a large internal problem in the country: access to electricity [32]. Whilst in ASEAN the number of people without access to electricity has fallen by around two-thirds [8] in Myanmar the electrification rate is around 31–34% [14,32]. This figure is far lower than global average of 87% [35]. At present, there are around 2.3 m million residential connections in Myanmar [36]. This means that around 39.6–41.4 million people out of a population of nearly 60 million do not have access to electricity.
The national grid mainly caters to the urban areas; therefore, it is the country’s major cities that have the highest electrification rates. Yangon city’s electrification rate of 78% is the highest in the country. However, 66% of the population live in rural areas [4], which are poorly electrified with an average rate of less than 20% [12]. Rural communities rely on traditional biomass for their energy needs, particularly for cooking and lighting [14].
Even though Myanmar has one of the fastest growing economies in Asia [37], it is thought that the country’s current energy situation is significantly hindering economic growth as well as human development [4]. To overcome these issues the government approved the National Electrification Plan (NEP) in September 2014 [14]. The NEP targets 100% electrification of households by 2030 [14,32,36], with around 98% of new connections being grid-based [4]. The estimated capital cost of the project is somewhere between $5.9 and $10 billion, with financial help coming from the World Bank and the Japanese government [32,36]. As well as assisting economic growth, it is believed that meeting the NEP targets will improve living standards in the country and enhance activities such as education [4].
The scale of the program is immense and will involve connecting more than 7.2 million households to the national grid. Figure 4 shows the current and targeted annual electrification rate required to supply 100% of households by 2030. To achieve 100% electrification, household connections will need to increase from 189,000 per year currently to around 450,000 per year over the course of the program and even reach as high as over 517,000 in the latter stages [36]. It will also require around 2600 MW of additional generation to be commissioned [36].
Whilst their main priority is electrifying the population, the government of Myanmar has also set goals for their future energy mix through policies such as the National Renewable Energies Policy and Planning–Draft (NREPP). The NREPP has set the goal of achieving an energy mix, which includes 38% hydropower and 9% (2000MW) from other renewable energy (RE) sources by 2030–2031 [7].

1.3.2. Climate Conditions in Myanmar

The Köppen–Geiger (KG) climate classification is a widely used system used to describe terrestrial conditions [37]. The KG classification is based on five major types, which are defined by temperature, precipitation and seasonal fluctuations. The latest KG world map shows that Myanmar has three distinct climatic regions; temperate in the mountainous north and west region, tropical wet central dry region, and tropical monsoon in southern and coastal delta regions. Myanmar has three seasons; Cool (November through February), Hot (March through May) and Rainy (June through October) [37].

1.3.3. Myanmar’s Electricity Fuel Mix

As of 2016 Myanmar had an installed capacity of around 4900 MW with a peak load of around 200 MW, it also had an off-grid capacity of about 135 MW [32]. Myanmar is considered to have an abundance of domestic energy resources such as gas and oil [38,39]. However, the majority of the gas extracted in the country (75–80%) is exported to neighbors such as Thailand and China, whilst the indigenous coal has a low calorific value so the coal burned in electricity generation plants needs to be imported. Myanmar also has an abundant potential for hydropower resources and the country is currently highly dependent on hydropower to meet its electricity needs [12]. In 2015 65% of the electricity generated in Myanmar came from hydropower, with natural gas providing 33.4% and coal the other 1.6% [12]. This heavy reliance on intermittent hydropower often results in blackouts, particularly in the cool and hot seasons which have low rainfall. The current reliance on fossil fuels for power generation is unsustainable both environmentally and economically [4]. The future viability of large-scale hydropower projects is uncertain [4].

1.3.4. Solar Photovoltaic (PV) Potential in Myanmar

Myanmar has tremendous potential for RE, and whilst it is currently in an early stage, solar-PV energy is one of the most promising RE candidates [12]. Sunlight in the country is abundant and Myanmar receives 4.5–5.5 kWh/m2 of solar radiation per day [13]. 60% of the country’s land area was identified as suitable for PV installations and the PV generation potential is estimated to be around 40 TWh per year [14]. For Myanmar solar-PV also has the advantage of working complimentarily with hydropower. Whilst solar-PV output will drop during the rainy season, it can compensate for the decline in hydropower output during the cool and hot seasons [14].

1.4. Future Energy Outlook

Previously several researchers have assessed the electricity outlook of the ASEAN region in the coming decades [7,8,9,37,38,39]. They all concluded that electricity consumption in the area will grow rapidly over the next 20 years due to economic and population growth as well as government policies aimed at increasing access to electricity. They also point out that at the same time the ASEAN member countries have stated their aspirations to move towards a more sustainable energy mix and are, therefore, promoting the uptake of renewable technologies. Studies have shown that due to their climatic conditions, many Southeast Asian countries including Myanmar have high PV potential, and that many new PV projects are expected to be constructed in the near future to try to close the supply–demand gap in a sustainable manner [13,38,39].

1.5. Forecasting of Load Profiles

Load (electricity demand) profiles show the variation in electricity demand over time. They are normally recorded at the system level or the customer category level (residential, commercial etc.) They are an indispensable tool for companies and organizations in the power sector and are used in the decision-making process in areas such as volume of generation and maintenance scheduling.
Power networks around the globe are rapidly evolving due to government policies aimed at finding more sustainable decarbonized models in order to try and reduce the reliance on fossil fuels and to combat global warming and other environmental issues. These changes have seen increasing levels of penetration of renewable energy resources (RERs) [40] and electric vehicles (EVs) [41]. Within RERs, PV applications have seen continuous growth over recent years [42], and there has been a global trend to promote rooftop PV applications in urban areas [43]. The proliferation of electric vehicles (EVs) and RER applications such as rooftop PV systems leads to dramatic changes to the behavior and peaking characteristics of load (electrical demand) profiles particularly at the distribution level [42]. This change in behavior brings new regulatory, economic and technical challenges to network operators and other stakeholders [40,41,42,43,44].
Load forecasting involves predicting load profiles of the future. Forecasting can be carried out in the short-term (STLF) which is from a few minutes to a few days ahead, up to the long-term (LTLF) which can be from one year up to several years ahead [45]. Accurate load forecasts lead to significant savings in operation and planning and maintenance and this has meant that research into forecasting has become a major field in power engineering [45].
The majority of forecasting techniques found in literature are based around univariate time series models such as the Box–Jenkins approach or artificial intelligence (AI) models such as expert systems, adaptive neural fuzzy inference systems (ANFIS), wavelet analysis and ANNs [46]. Of the AI techniques, ANN is applied to load forecasting in most papers [46].
ANN models are easily applied to STLF. However, due to the large uncertainties of the long-term future and the difficulty of collecting and processing of the data required, ANN models have not typically been applied to LTLF [46]. A search of previous literature also found no papers which comprehensively dealt with the application of ANNs to the creation of future load profiles in which the penetration of RERs and EVs was considered.

2. Methodology for Assessing Photovoltaic Energy Potential and Its Impact on Electricity Demand Profiles

2.1. Case Study Location

Yangon City, Myanmar, is the region considered for PV generation forecasting and electricity demand forecasting. Formally known as Rangoon, Yangon City is the state capital of the Yangon Region of Myanmar and served as the capital city of the country until 2006. It is the largest city in Myanmar and home to over seven million people. As of 2015, the electrification rate in the city was 78% and it consumed 44% of the electricity in Myanmar (4.95 GWh out of a total of 11.25 GWh) [28]. Located in the heart of lower Myanmar, it has a KG classification of tropical monsoon climate, and experiences little variance in both temperature and sunlight hours throughout the year as shown in Table 3.

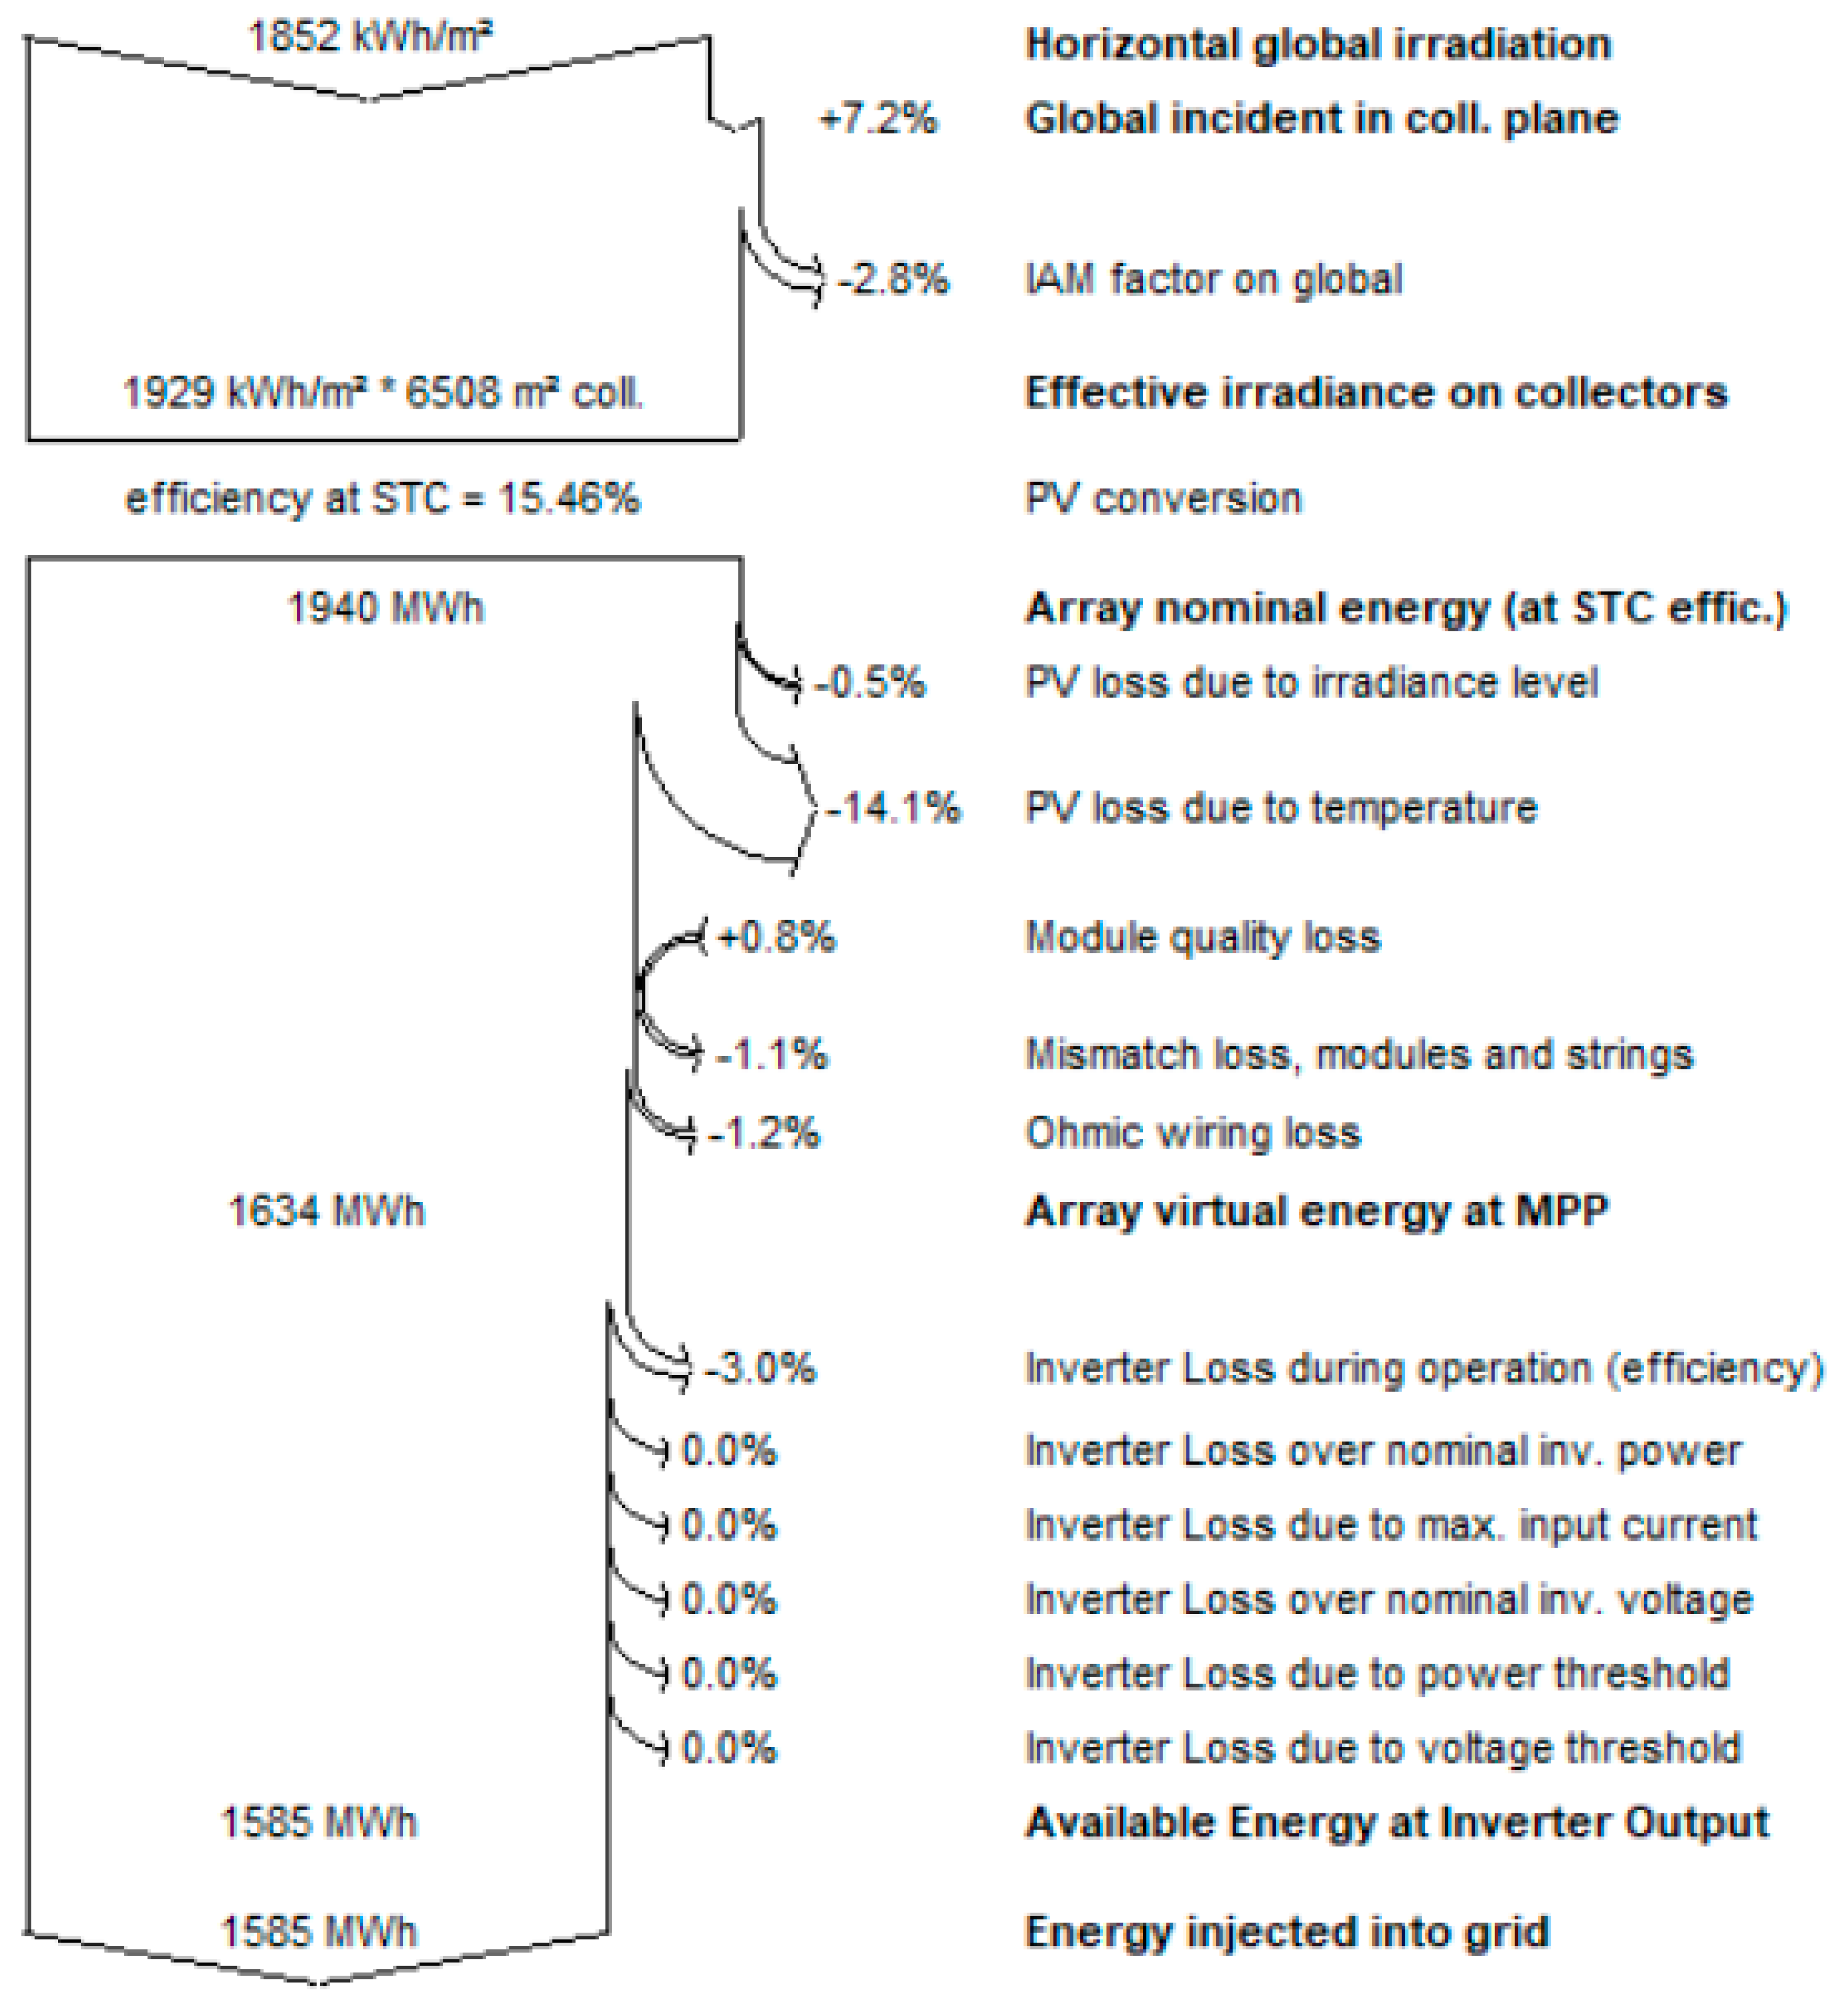
2.2. PV Generation Modelling

PV generation modelling involved two stages: pre-sizing and detailed system simulation. PVGIS 5, which is a free-to-use Geographic Information System (GIS)-based online PV energy estimation tool, was used for pre-sizing. PVGIS 5 generates PV energy output data with hourly time resolution for 365 days of the year for both standalone and grid-connected systems. A typical grid-connected polycrystalline PV system on the outskirts of Yangon City was simulated using PVGIS. Based on the simulation, the size of the PV system needed to substantially supply the annual electricity demand of the Yangon City was estimated at approximately 1 MW.
Being a satellite-based GIS, PVGIS also serves as a source of weather data. Averaged monthly, seasonal and annual irradiance datasets were created using the daily solar irradiance data obtained from PVGIS 5. PVsyst is an industrial standard detailed PV system design software, which has an up-to-date library of PV modules and inverters. The average monthly datasets from PVGIS were imported into PVsyst in order to model the potential electricity generation of a 1 MW PV system on the outskirts of Yangon City with an assumed operational start time of 2020. The details of the PV installation modelled in PVsyst are shown in Table 4.

2.3. PV Generation Forecasting

Polycrystalline PV modules have an expected lifespan of around 20 years. The output of these modules over their lifetime is dependent on their annual degradation rate. Degradation rates in modern crystalline silicon PV modules is between 0.2% and 0.5% [43]. In Mongolia and India, data has shown that the degradation rate of polycrystalline PV modules was about 0.4% per year over 4 years of operation [35]. In this study, the analysis is over a 10-year period, and therefore the upper future of 0.5% was chosen as the degradation rate used to generate future annual PV output profiles up to 2030.

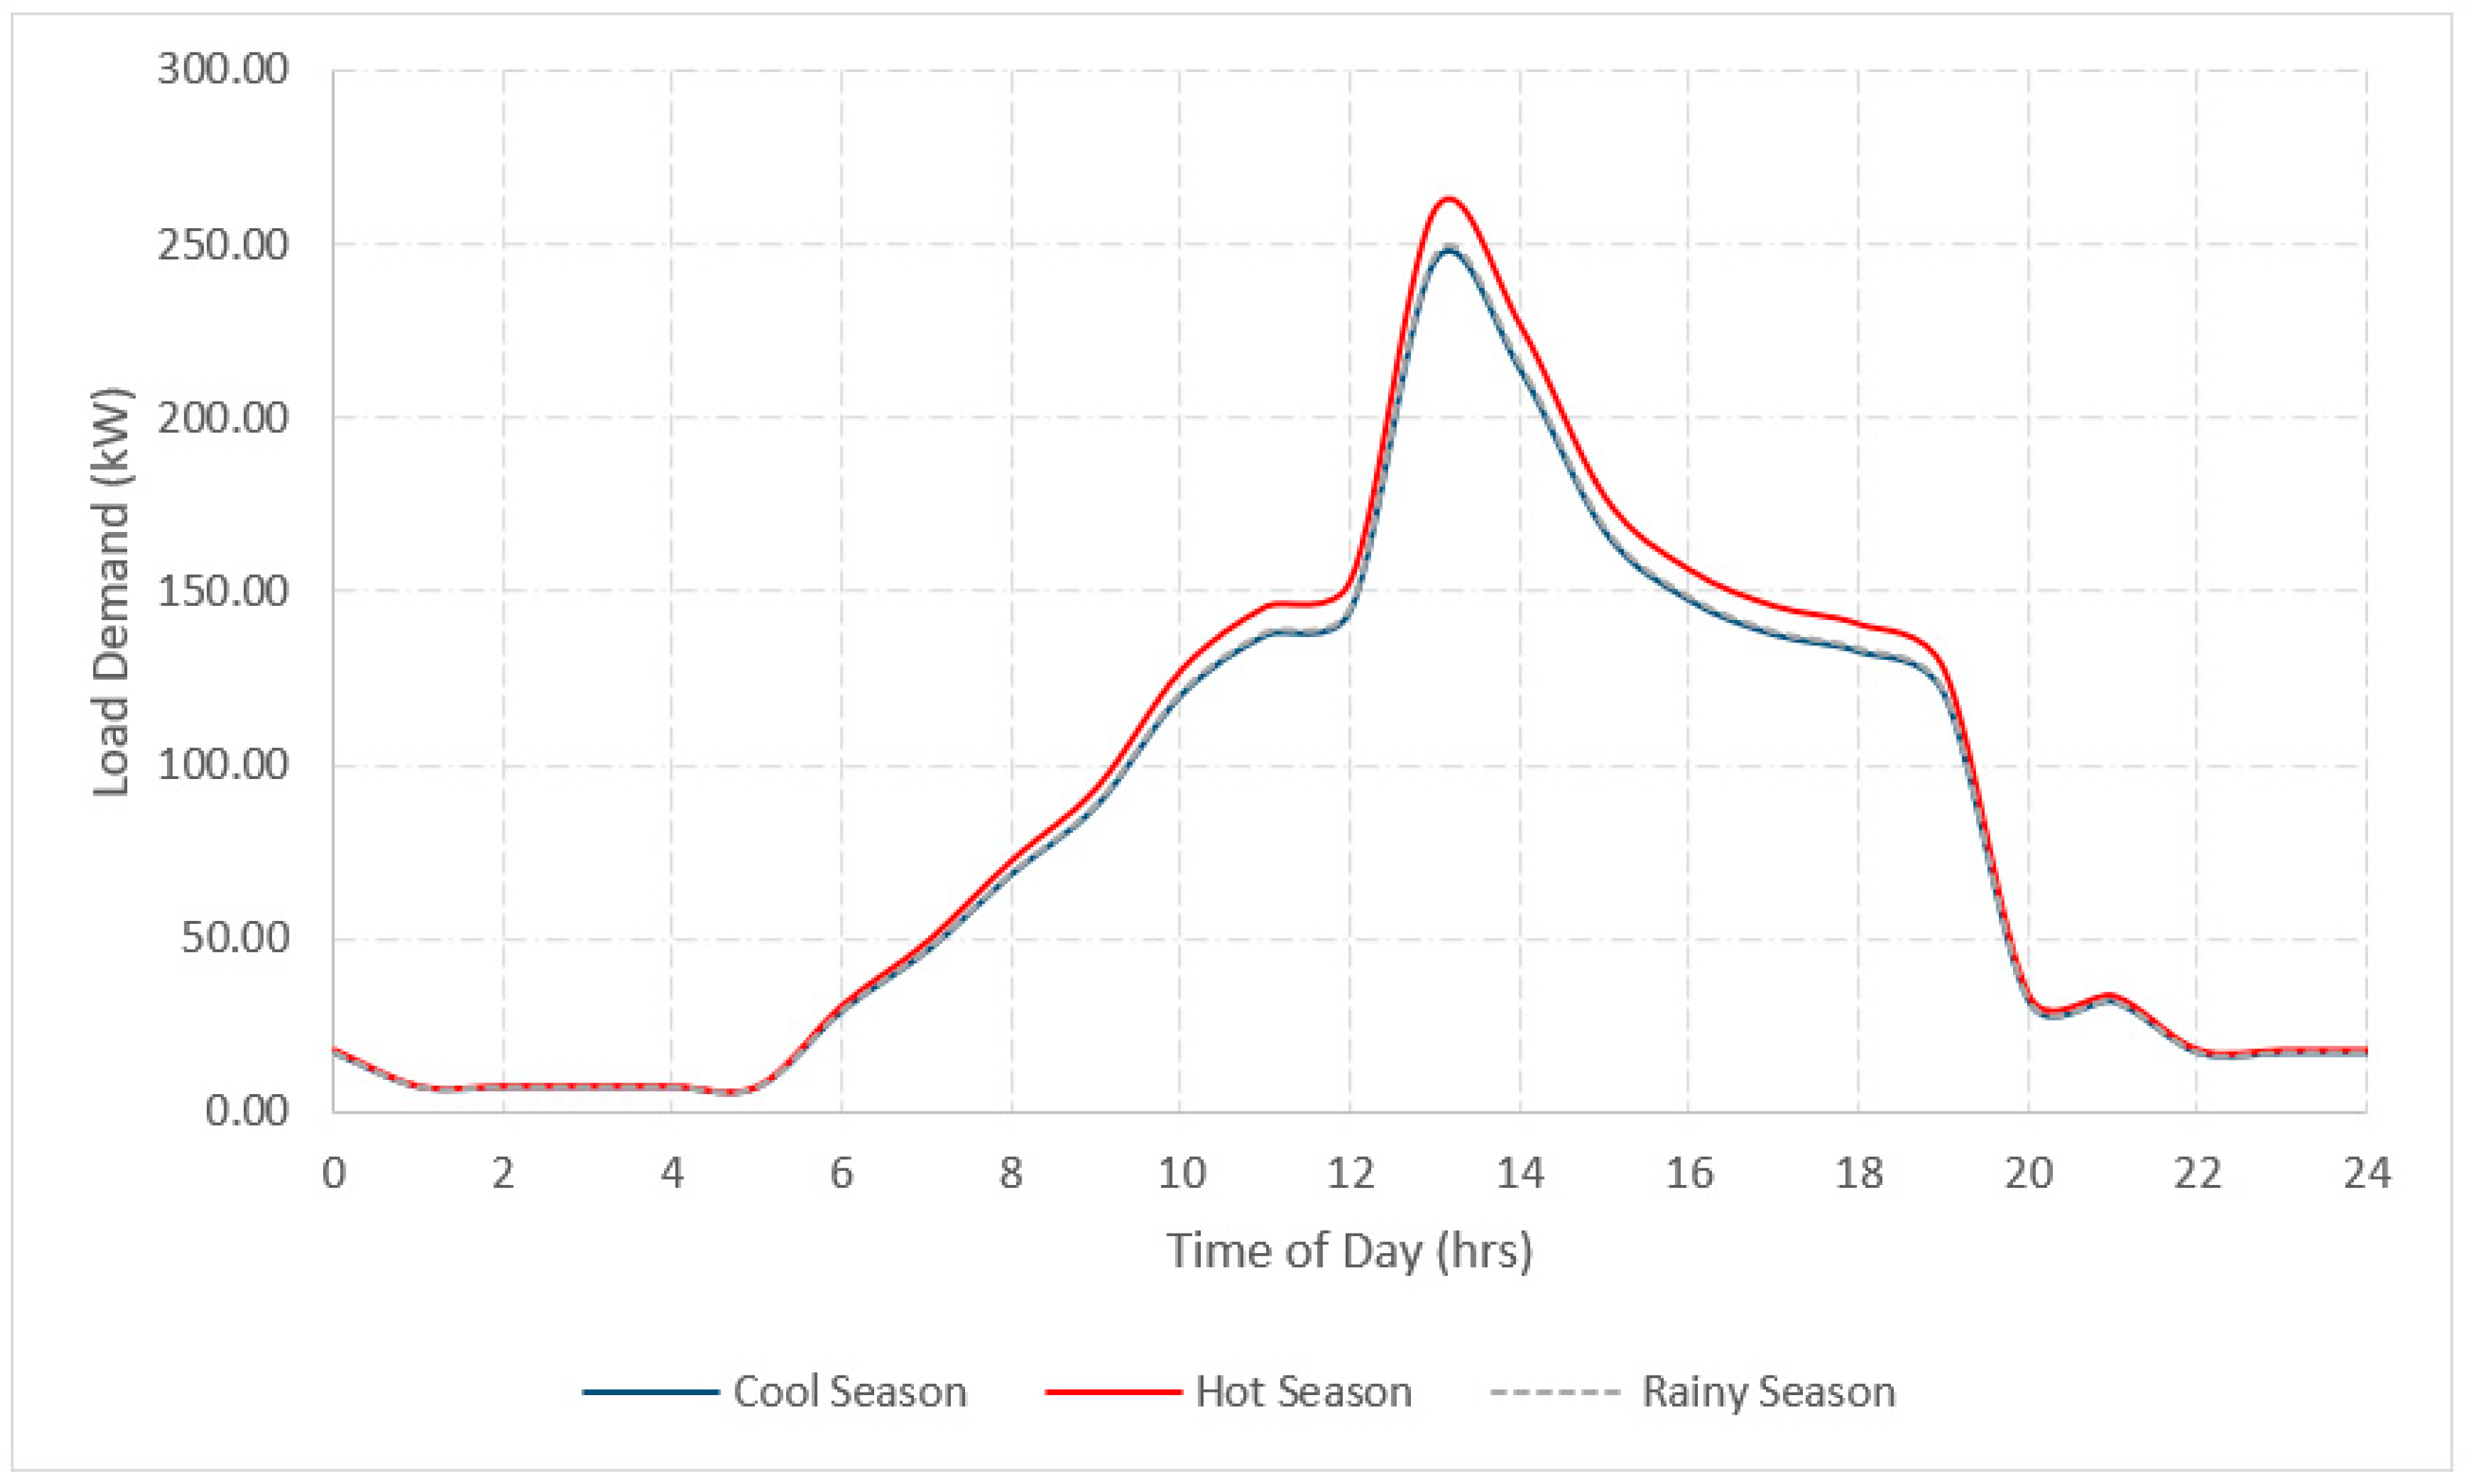
2.4. Electricity Demand Forecasting
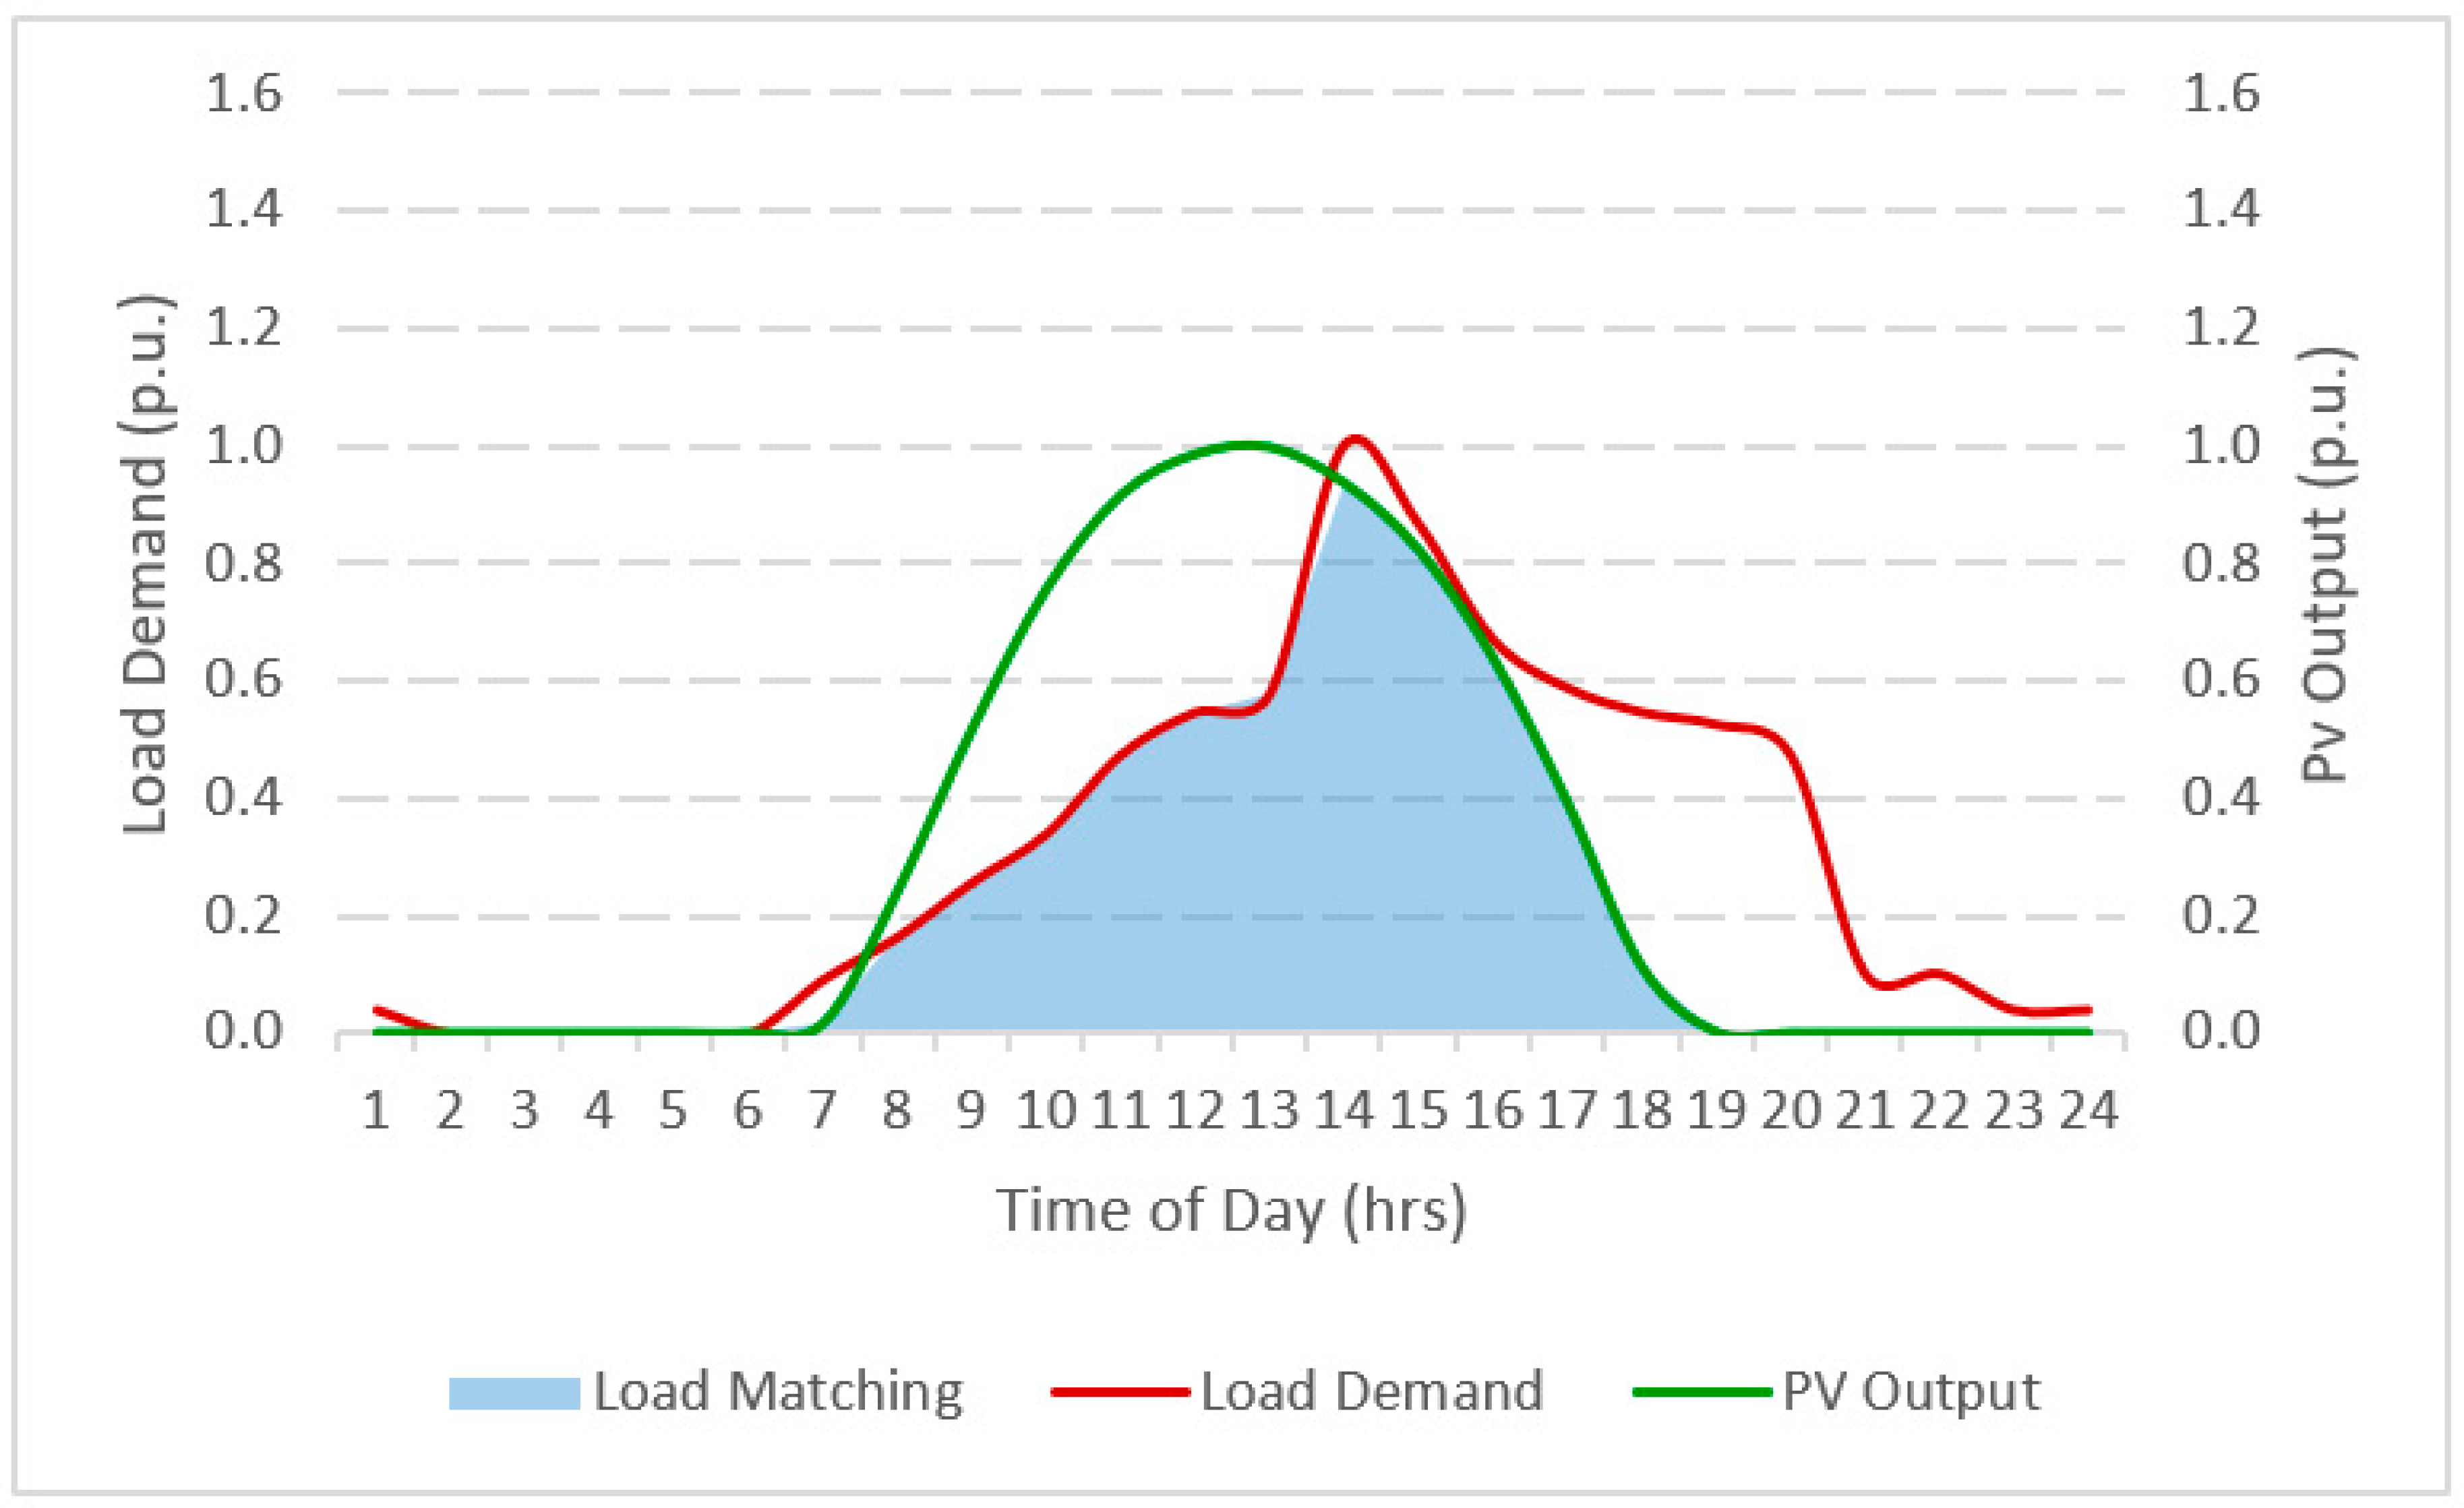
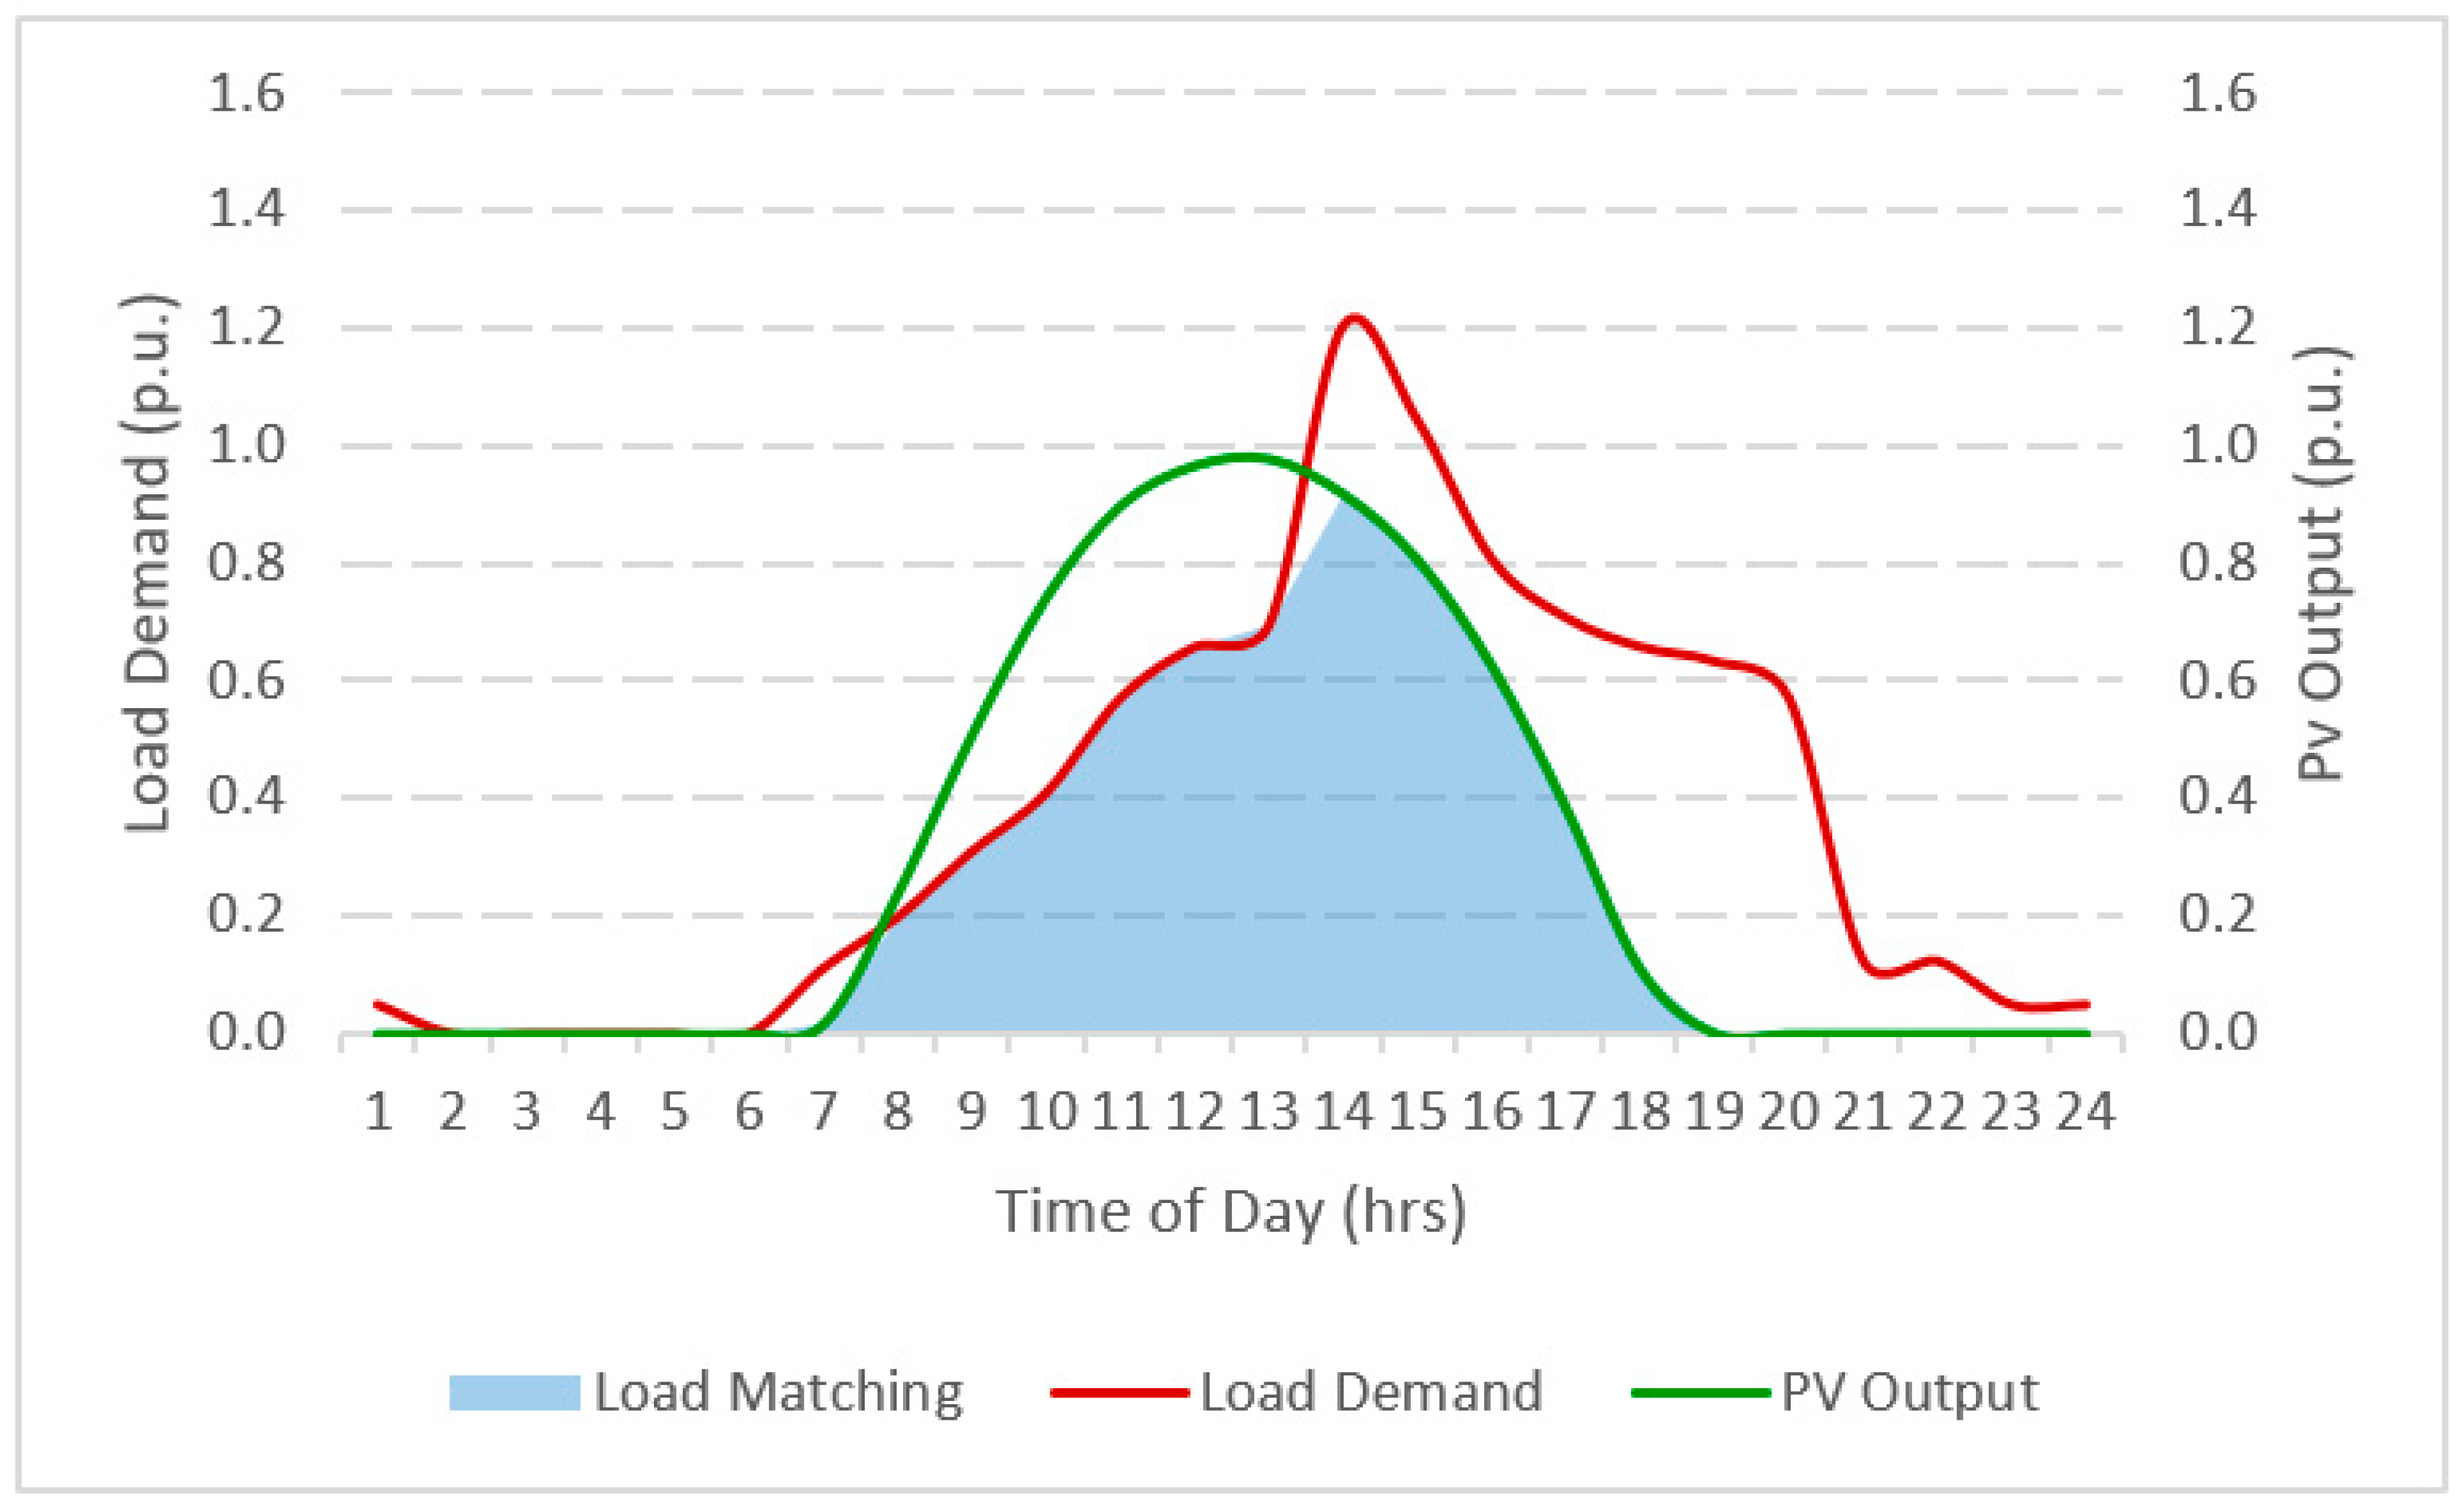
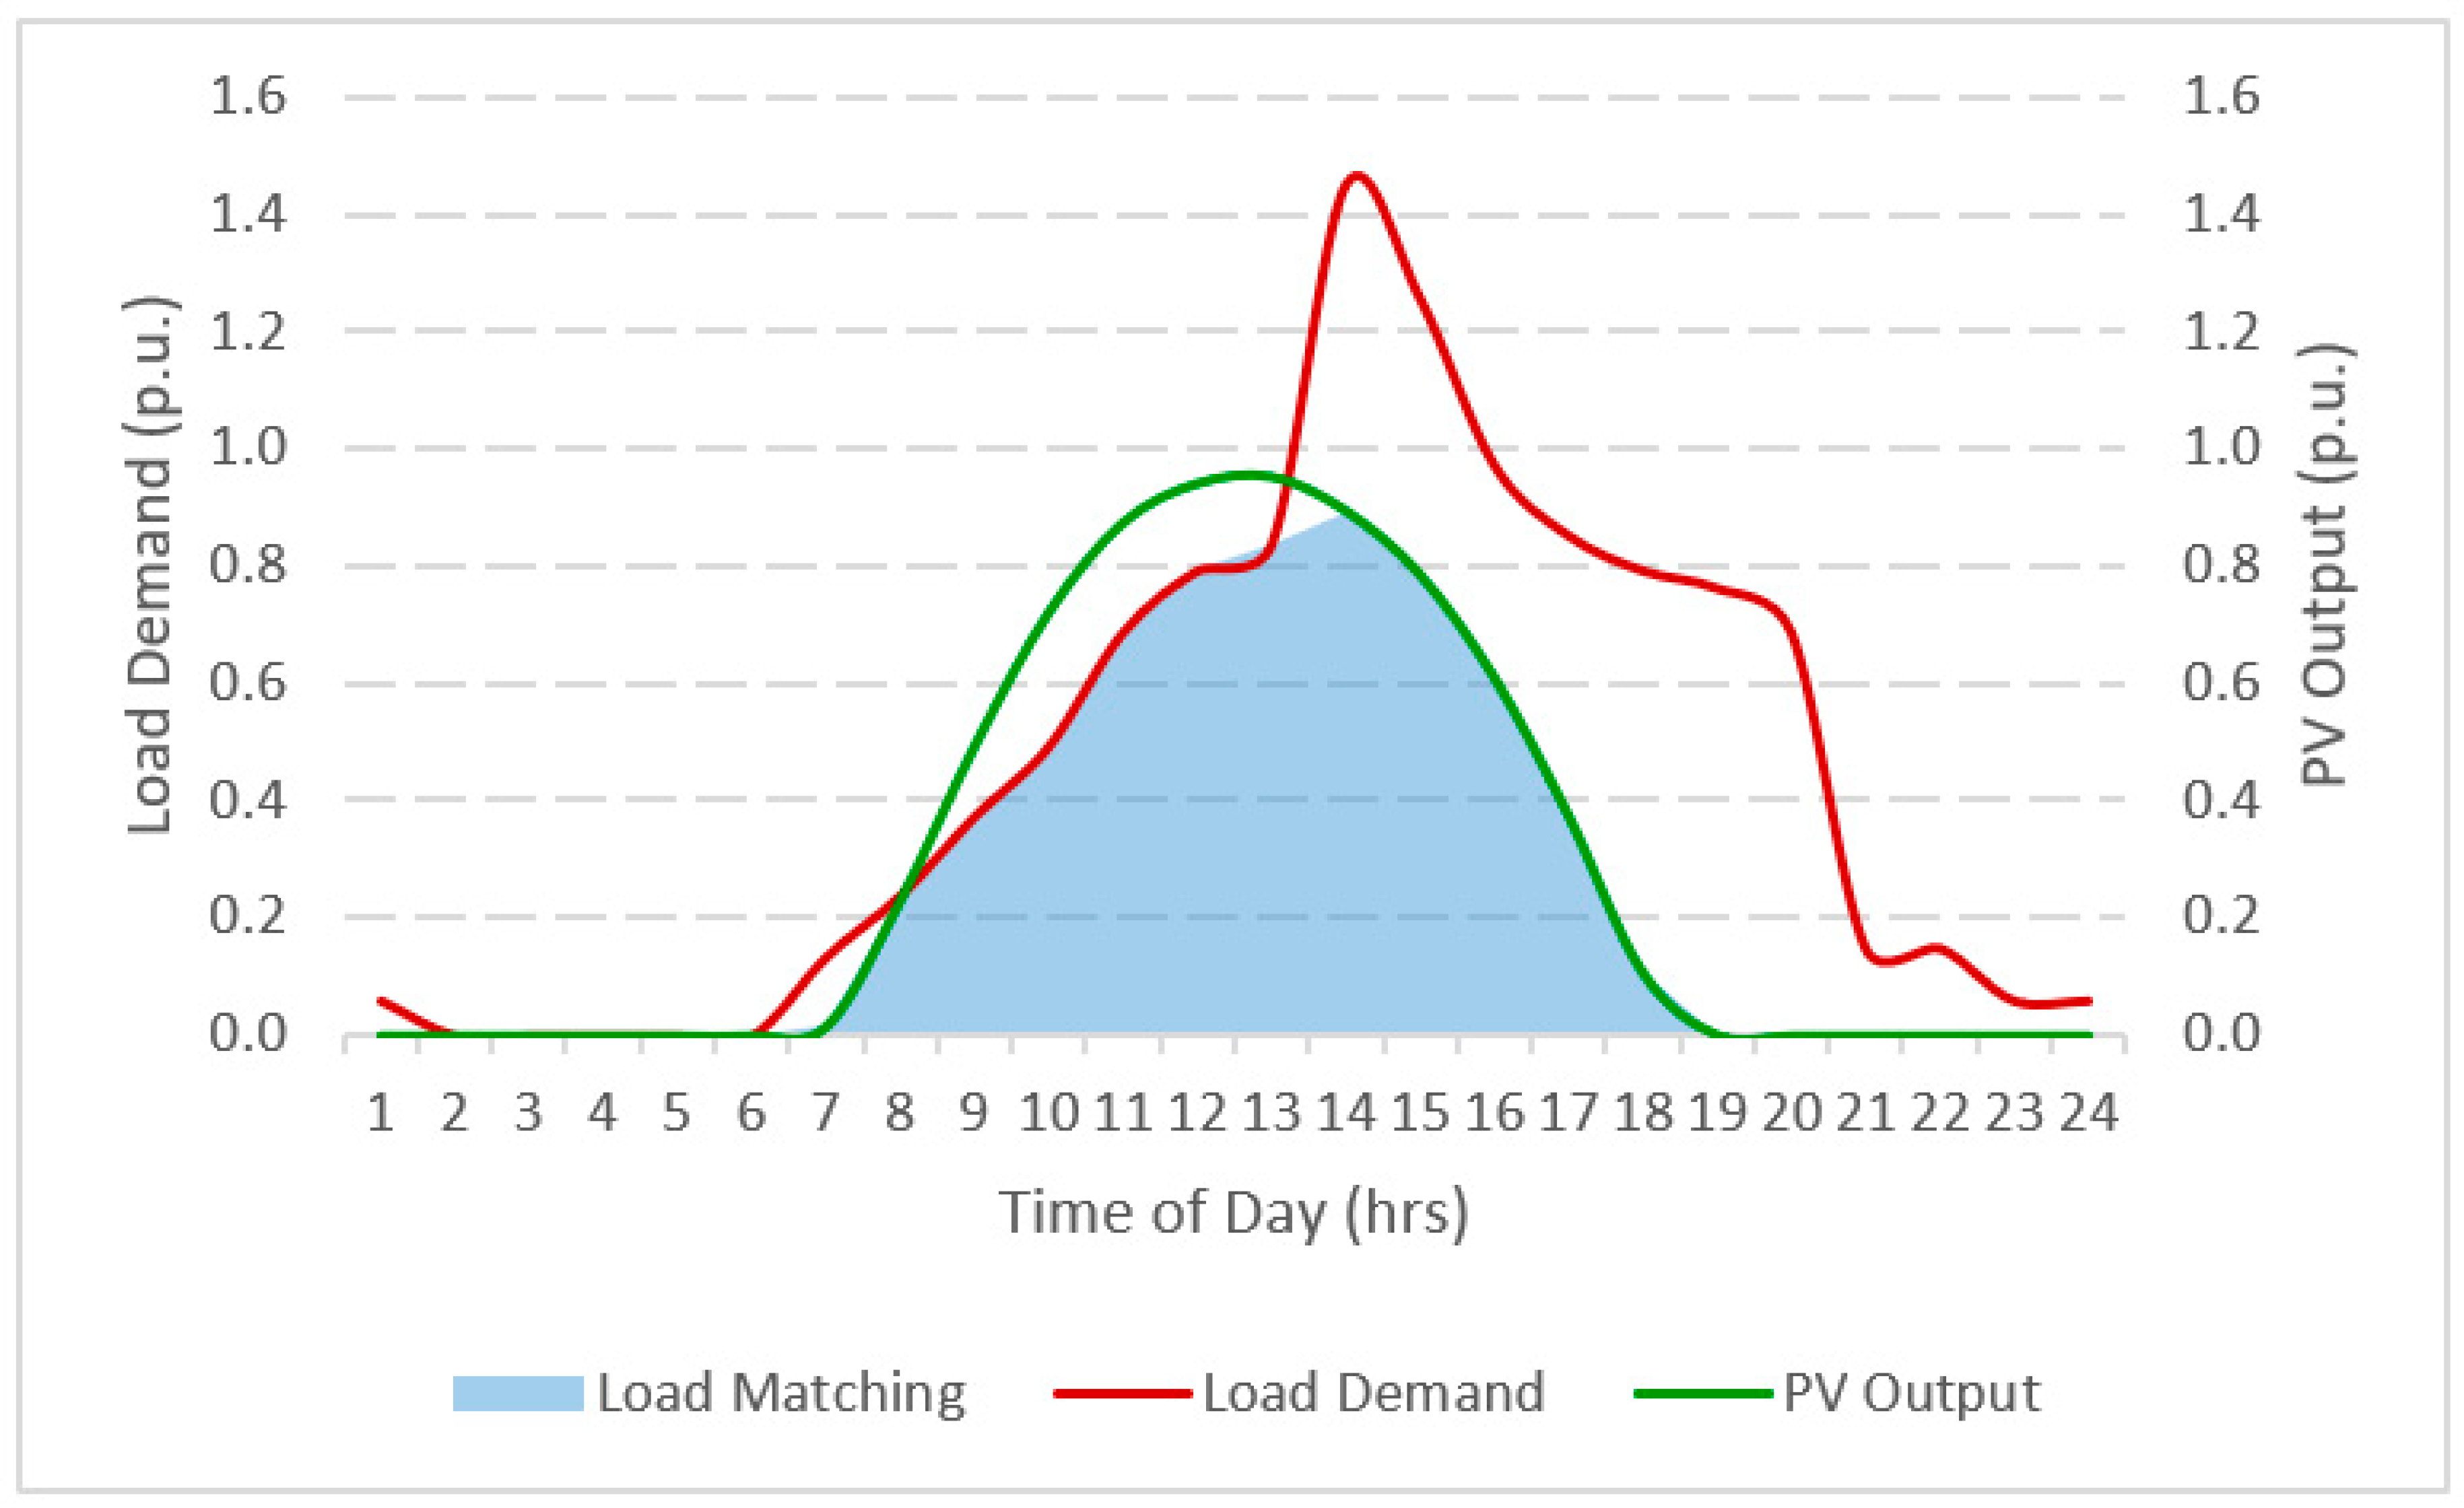
Actual load profiles for developing countries such as Myanmar are difficult to obtain [29]. The load profiles used in this work are based on a synthetic load scenario created in [4] and refers to the hourly, over the day, variation in the maximum demand of 100 residences over 365 days of a typical year. The scenario was developed based on data from the local energy use patterns in the neighboring countries with climate and economic environments like Myanmar. The scenario used assumptions about the basic electricity demand of urban residences in developing countries in East Asia such as lighting, fans, televisions and other home appliances such as refrigerators and mobile phone chargers. It was also assumed in the scenario that the peak demand would occur during the daytime due to the use of fans to combat the perennial high temperatures of the region. The data from neighboring countries and the assumptions about basic electricity needs were used together by the author to generate a typical daily synthetic load profile and seasonal variations reflective of the electricity demand of urban household consumers in Myanmar.
Using the typical daily profile and the maximum variations in the seasonal profile of [4], average daily profiles with an hourly resolution were created for the twelve months of a year. Aggregated seasonal and annual load profiles were then generated from the monthly profiles.
The data from the seasonal profile from [4] showed very little variance in the projected demand over the course of a year. The average daily peak demand was 250 kW. The maximum averaged daily peak demand occurred in March when the peak was 261.49 kW, 4.6% above the yearly average. July had the lowest averaged daily peak demand at 240.09 kW, 3.9% below the yearly average. The aggregated seasonal figures showed an even smaller variance. The hot season had the highest average daily peak demand at 252.56 kW, 1% above the yearly average. The cool season had the lowest average daily peak demand at 247.78 kW, 0.9% below the yearly average.
The aggregated synthetic seasonal load profiles for urban Yangon City are shown in Figure 5 where the rainy season profile (grey dotted line) can just be seen slightly below the profile for the cool season (blue solid line), highlighting the low variation in load over the seasons. The low variance in load is due to the climate in the region and the assumption that electricity demand is driven by basic needs such as cooling and lighting [4].
The ASEAN Centre for Energy (ACE) predict that load in Myanmar and other South-East Asia countries will increase 3.8% annually up to 2035 [7]. This figure was calculated considering electrification programs such as NEP as well as a GDP increase of 4.7% annually and a population growth of 0.9% annually in the region over the same time period.
Using the predicted annual load increase figure from ACE, synthetic future annual load figures for urban Yangon City were generated up to 2030.

2.5. Load Matching

Solar supply rate is a measure of the percentage of load supplied by solar PV Systems, and is calculated by dividing the annual load by the annual supply of a solar PV system [47]. However, solar PV systems can only supply power during daylight hours and this is not taken into consideration with solar supply calculations [48].
Load matching is the correlation between generation and load and refers to the degree of matching between generation and load profiles at instantaneous points in time. It is commonly used in the study of Net Zero Energy Buildings to evaluate performance in terms of the amount of on-site energy produced that is locally consumed [49].
At any instant the level of load matching can be calculated as follows [50]:
M ( t ) = min ( ( L ( t ) ,   P ( t ) ) L ( t )
where M is the load matching, L is the load, P is the electricity produced and t is an instantaneous point in time.
To study the load matching by the output of the solar PV installation described in Table 4 to the load of urban Yangon City, normalized annual diurnal profiles for the year 2020 were created using feature scaling as follows:
x ( n ) = x min ( x ) max ( x ) min ( x )
where x is the original value and x(n) is the normalized (per unit value) of PV output or electricity demand at the nth hour.
Normalizing the data gave peak points in both the PV output profiles and the load profiles a value of 1, with all other values scaled to the peak with values between 0 and 1. Normalization allows better visualization of the correlation between the two profiles as it absorbs the large differences in the absolute two profiles. Future profiles up to 2030 were then forecasted using the annual load increase rate of 3.8% and the PV degradation rate of 0.5% with the 2020 profiles as a baseline.

2.6. Scenarios Considered

To assess the solar-PV potential for Yangon City, two forecasted scenarios were created to examine the profile matching between the output of the PV system and the local load. The first scenario looks at figures from 2020, the assumed first year of operation for the PV installation. The second scenario looks at the figures from 2030 to determine the effects of electricity demand increase and PV system degradation.

3. Results and Discussion
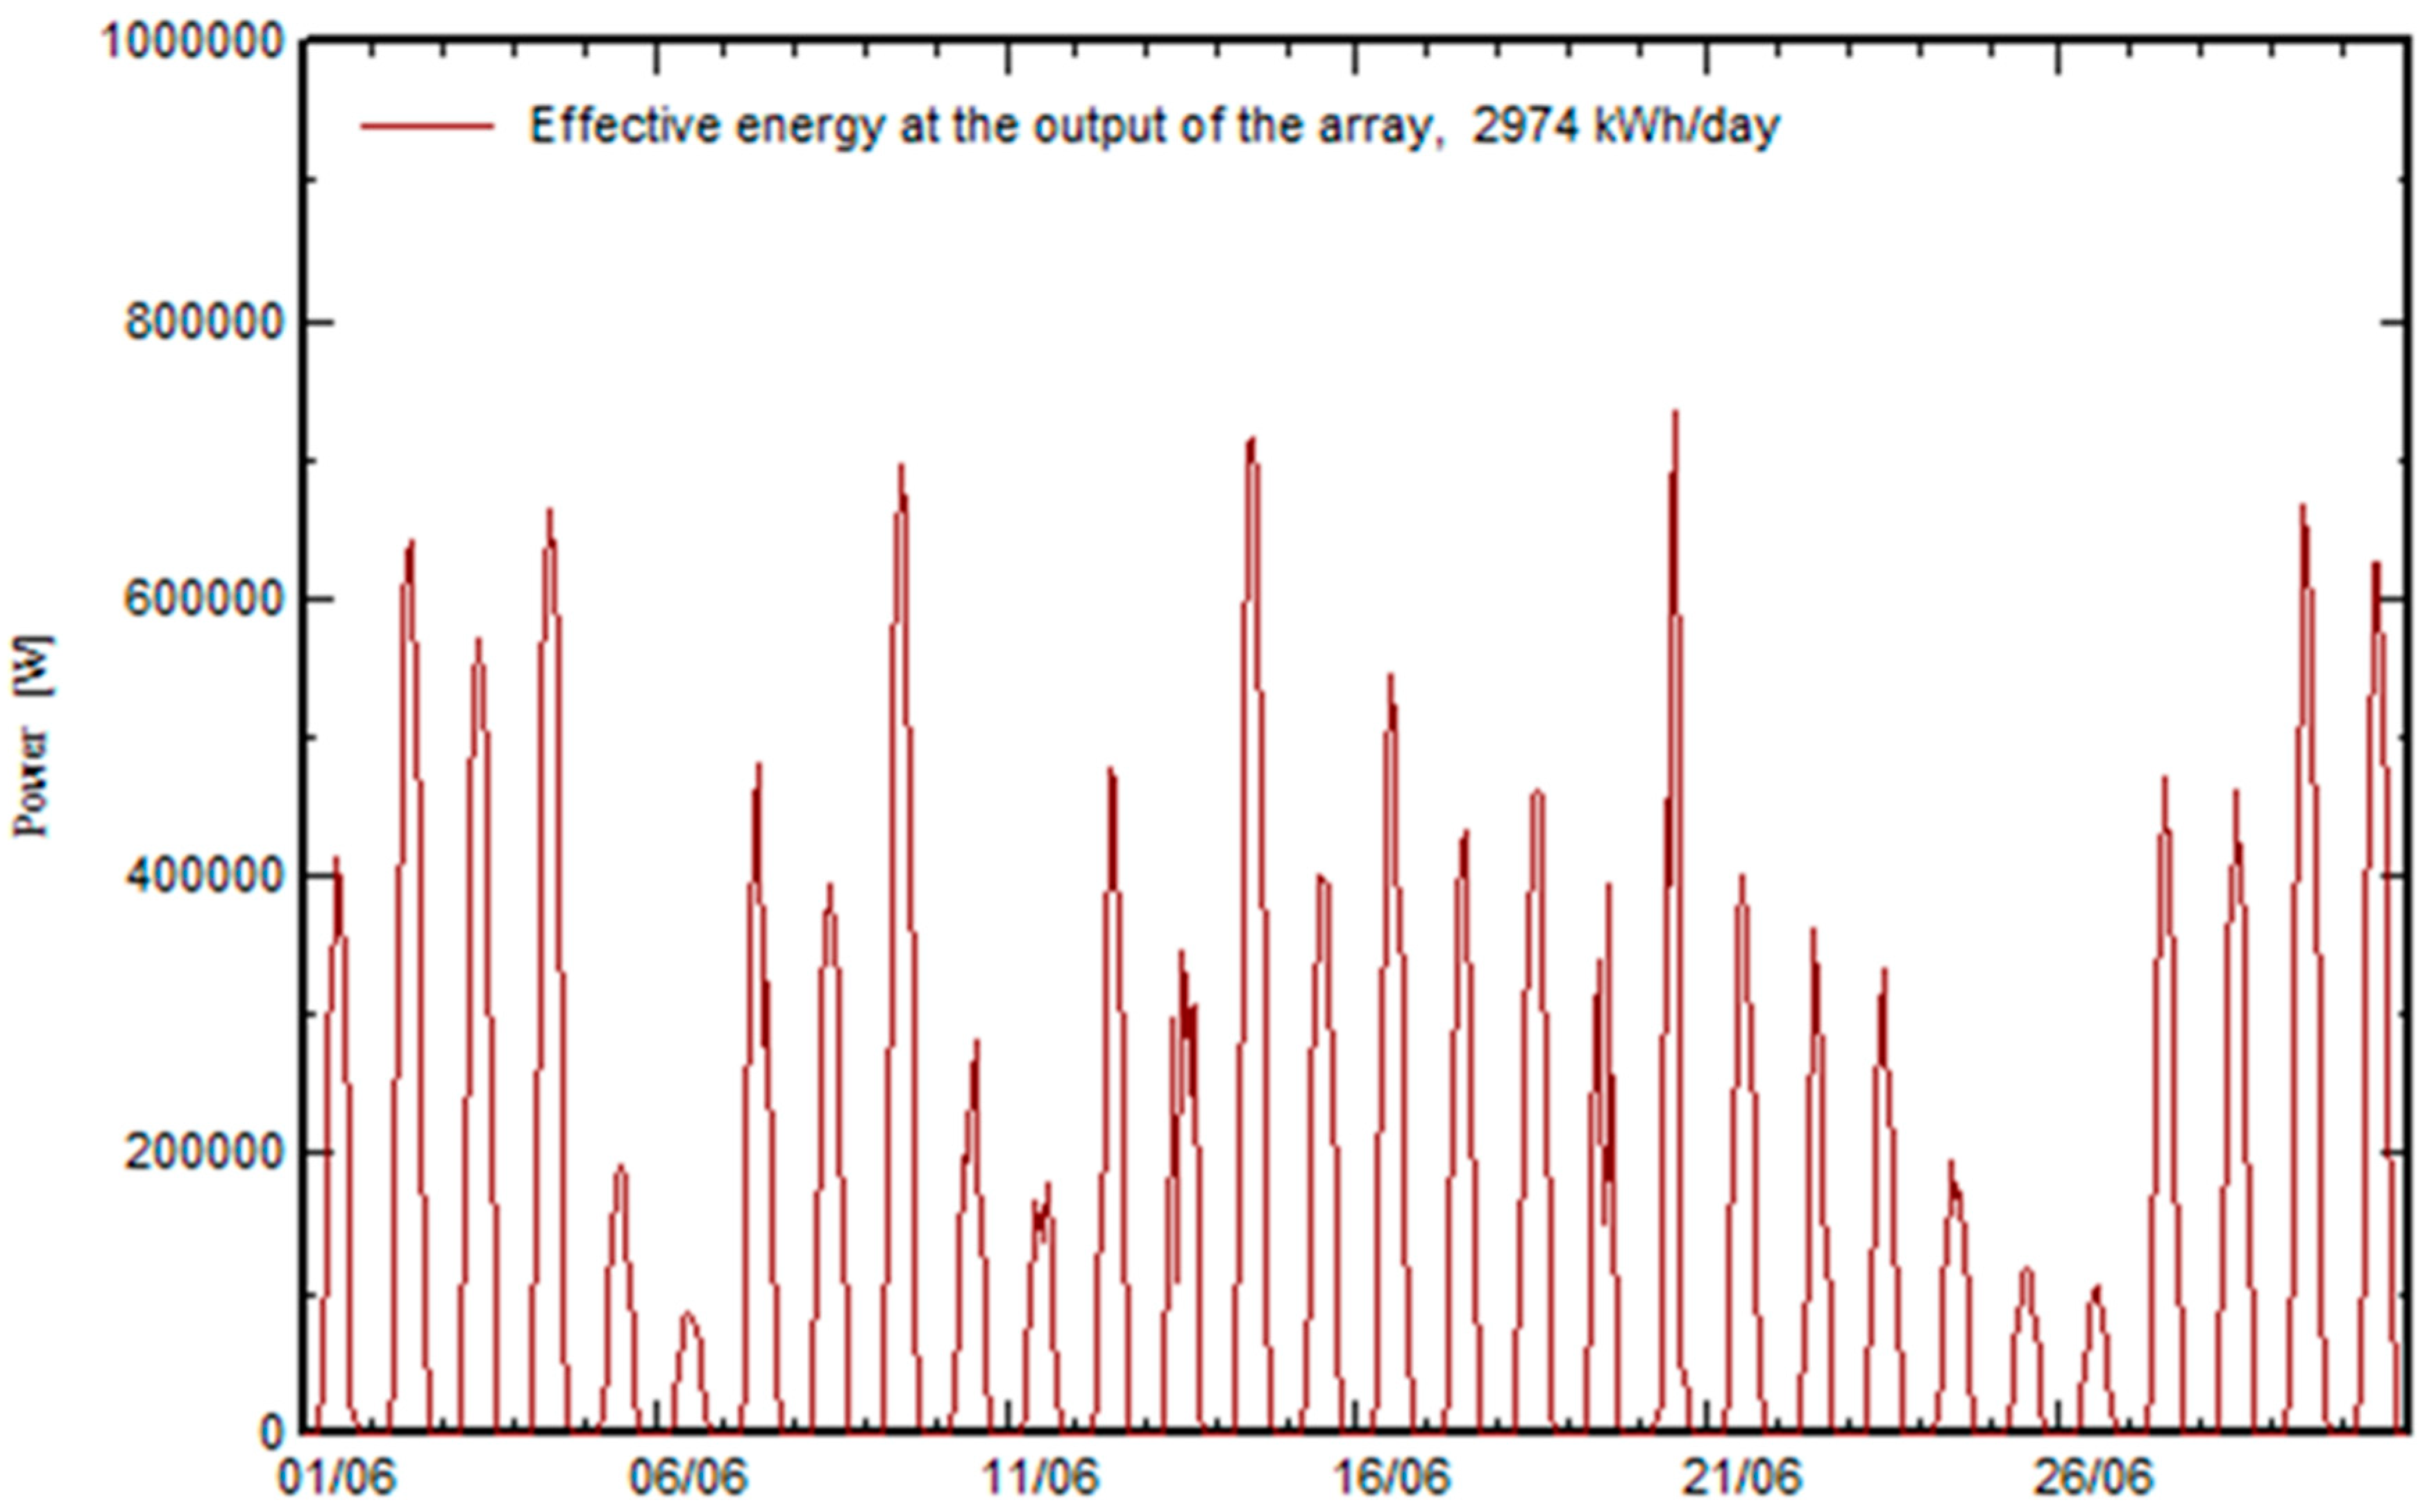
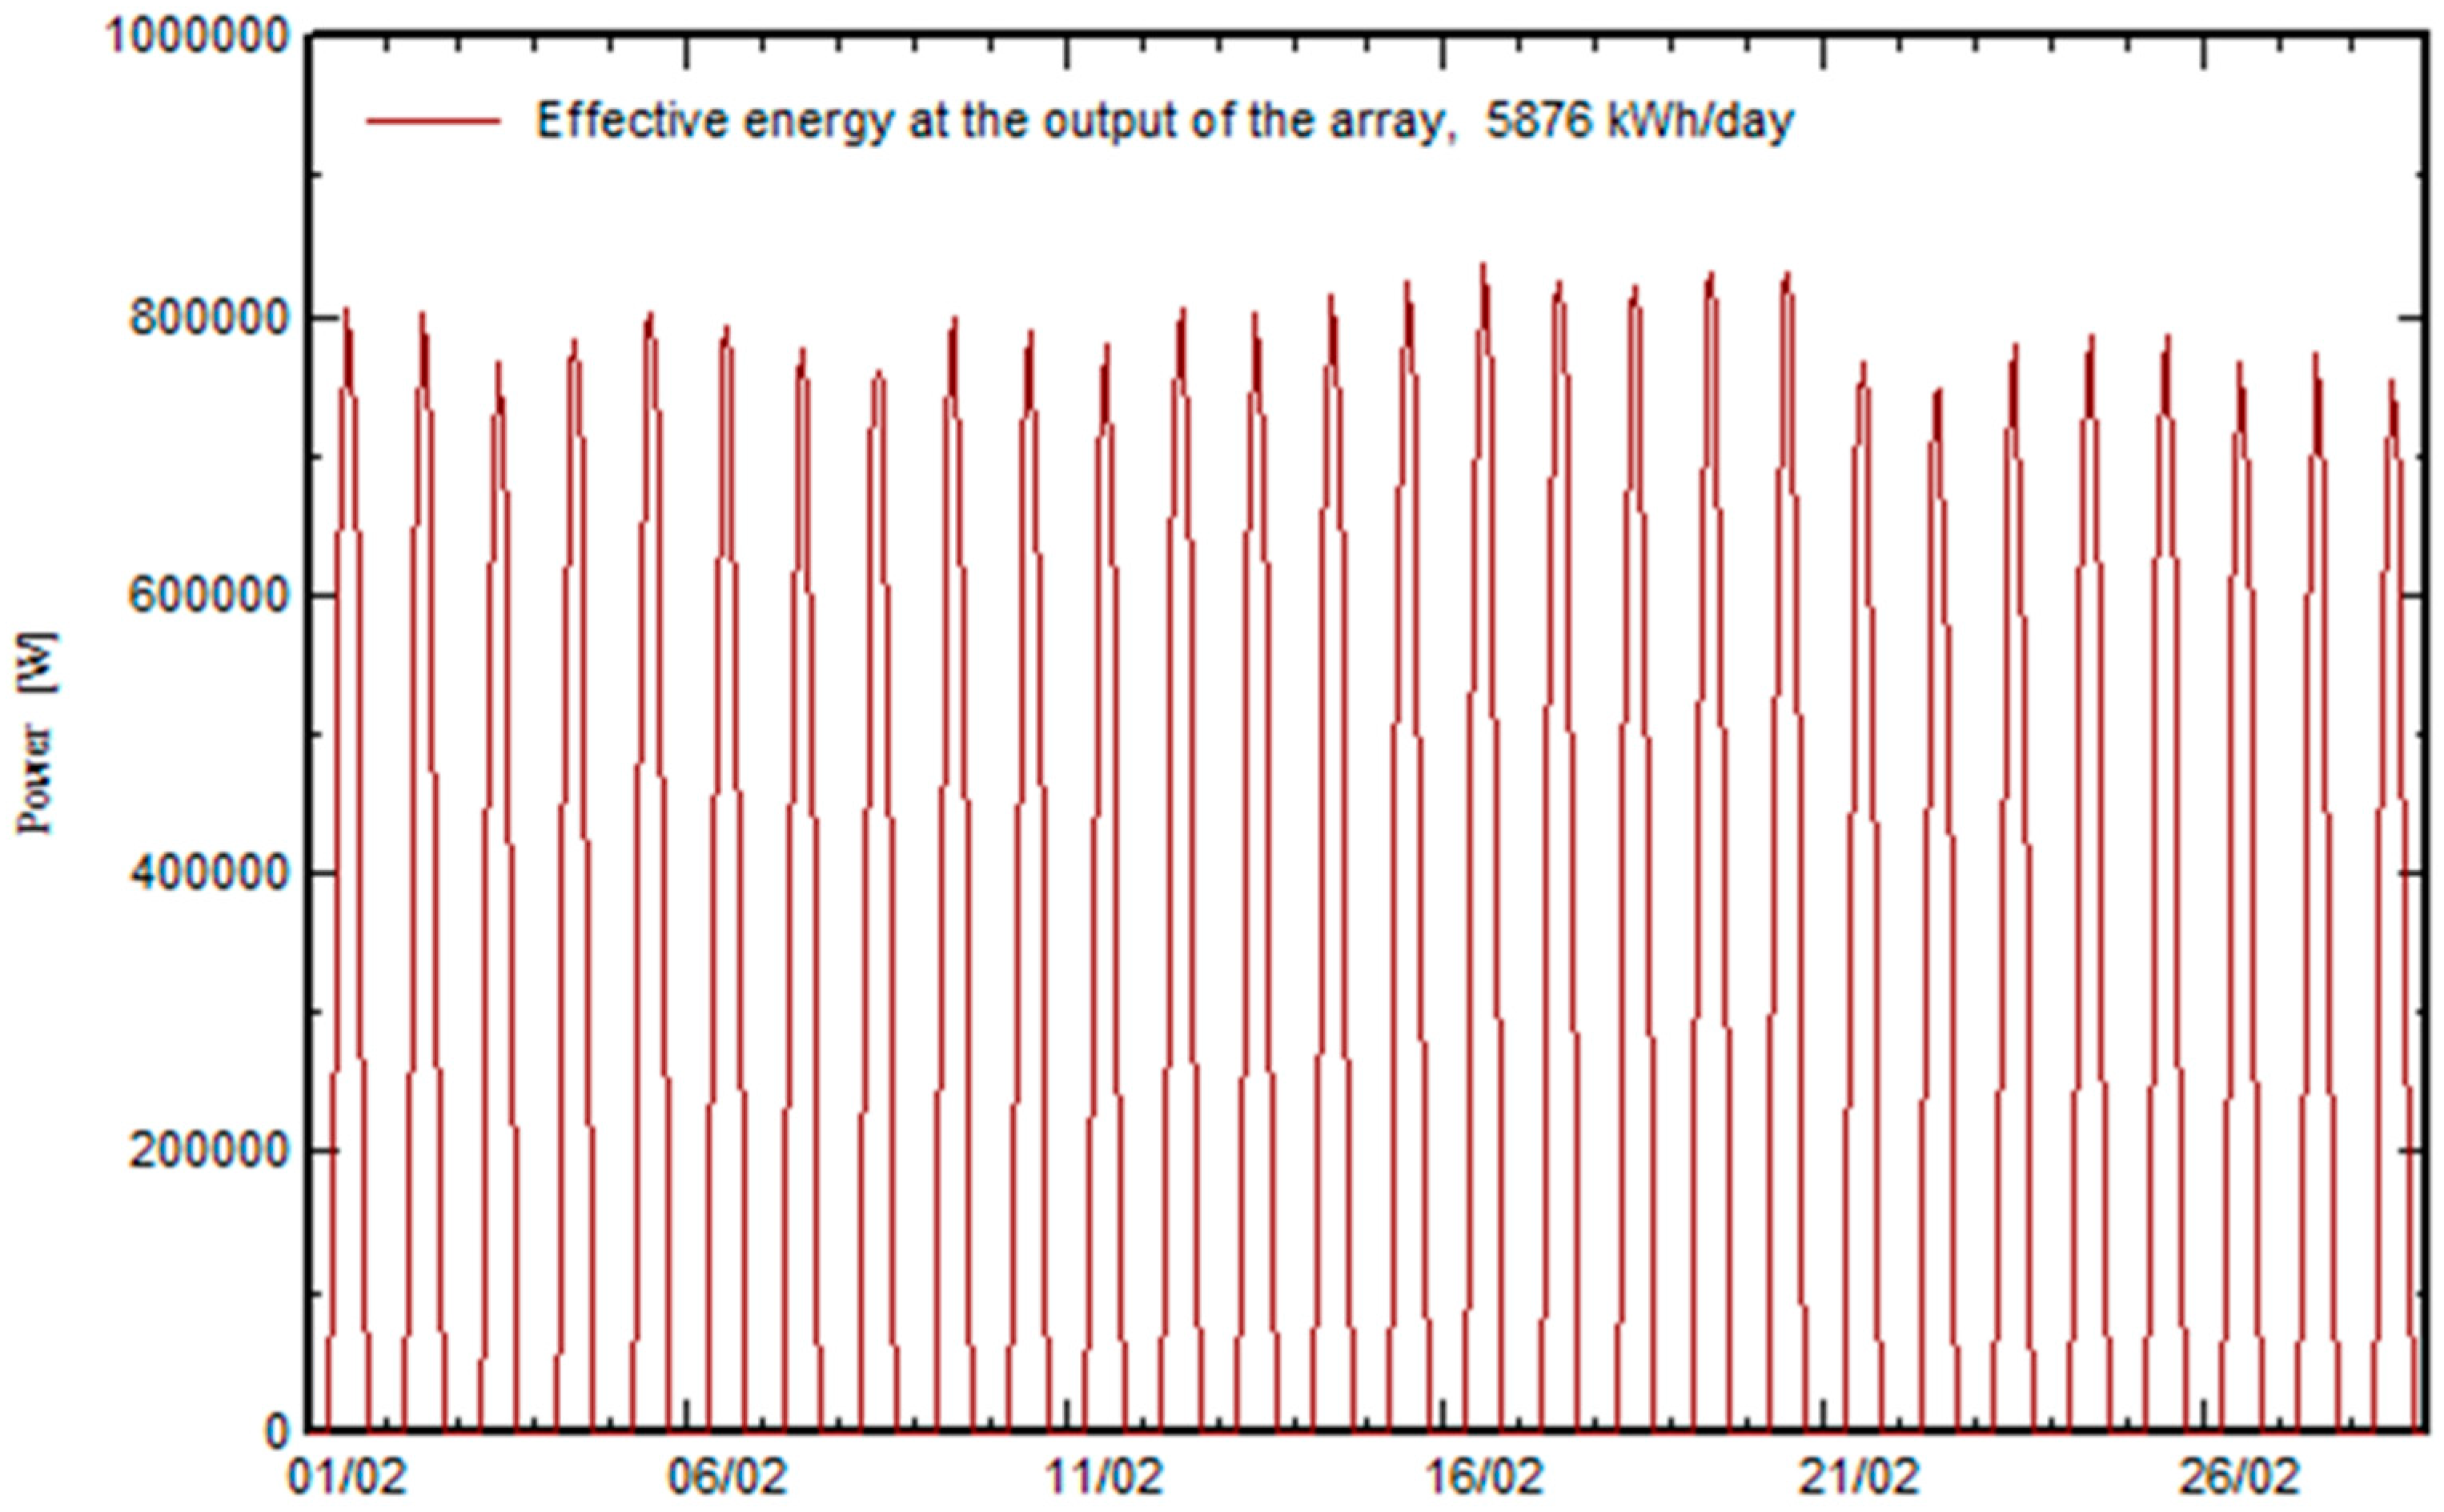
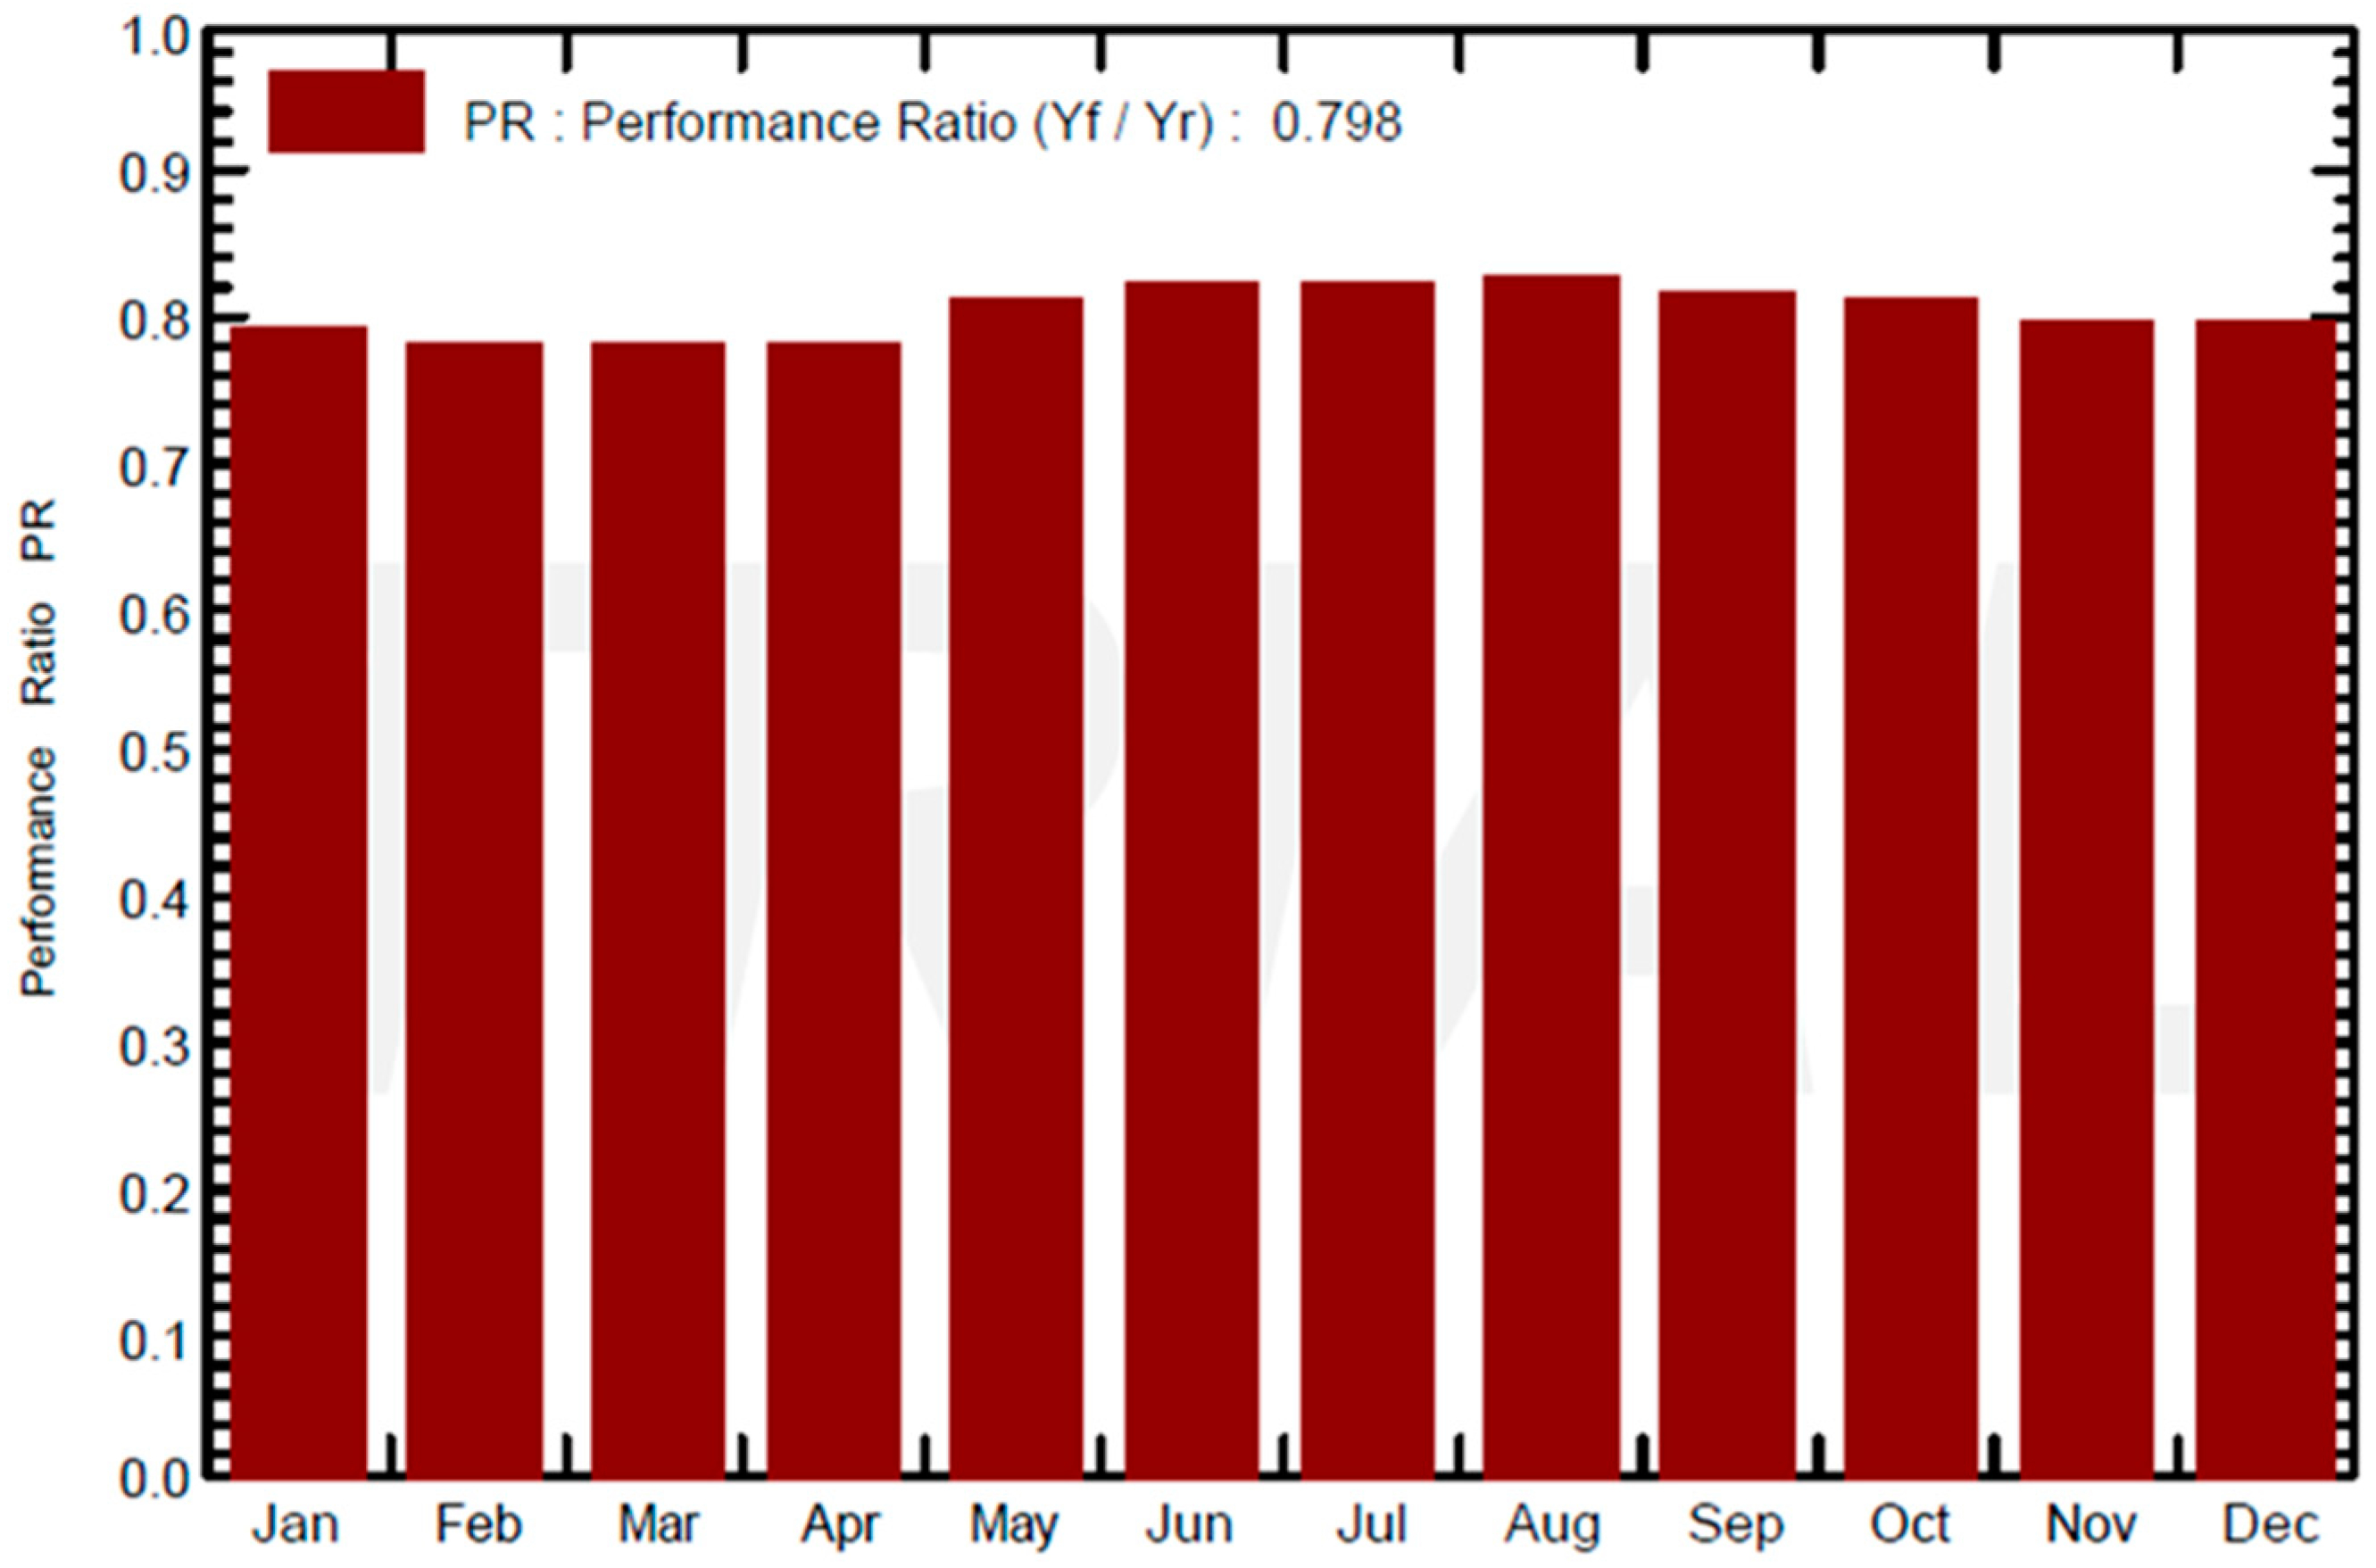
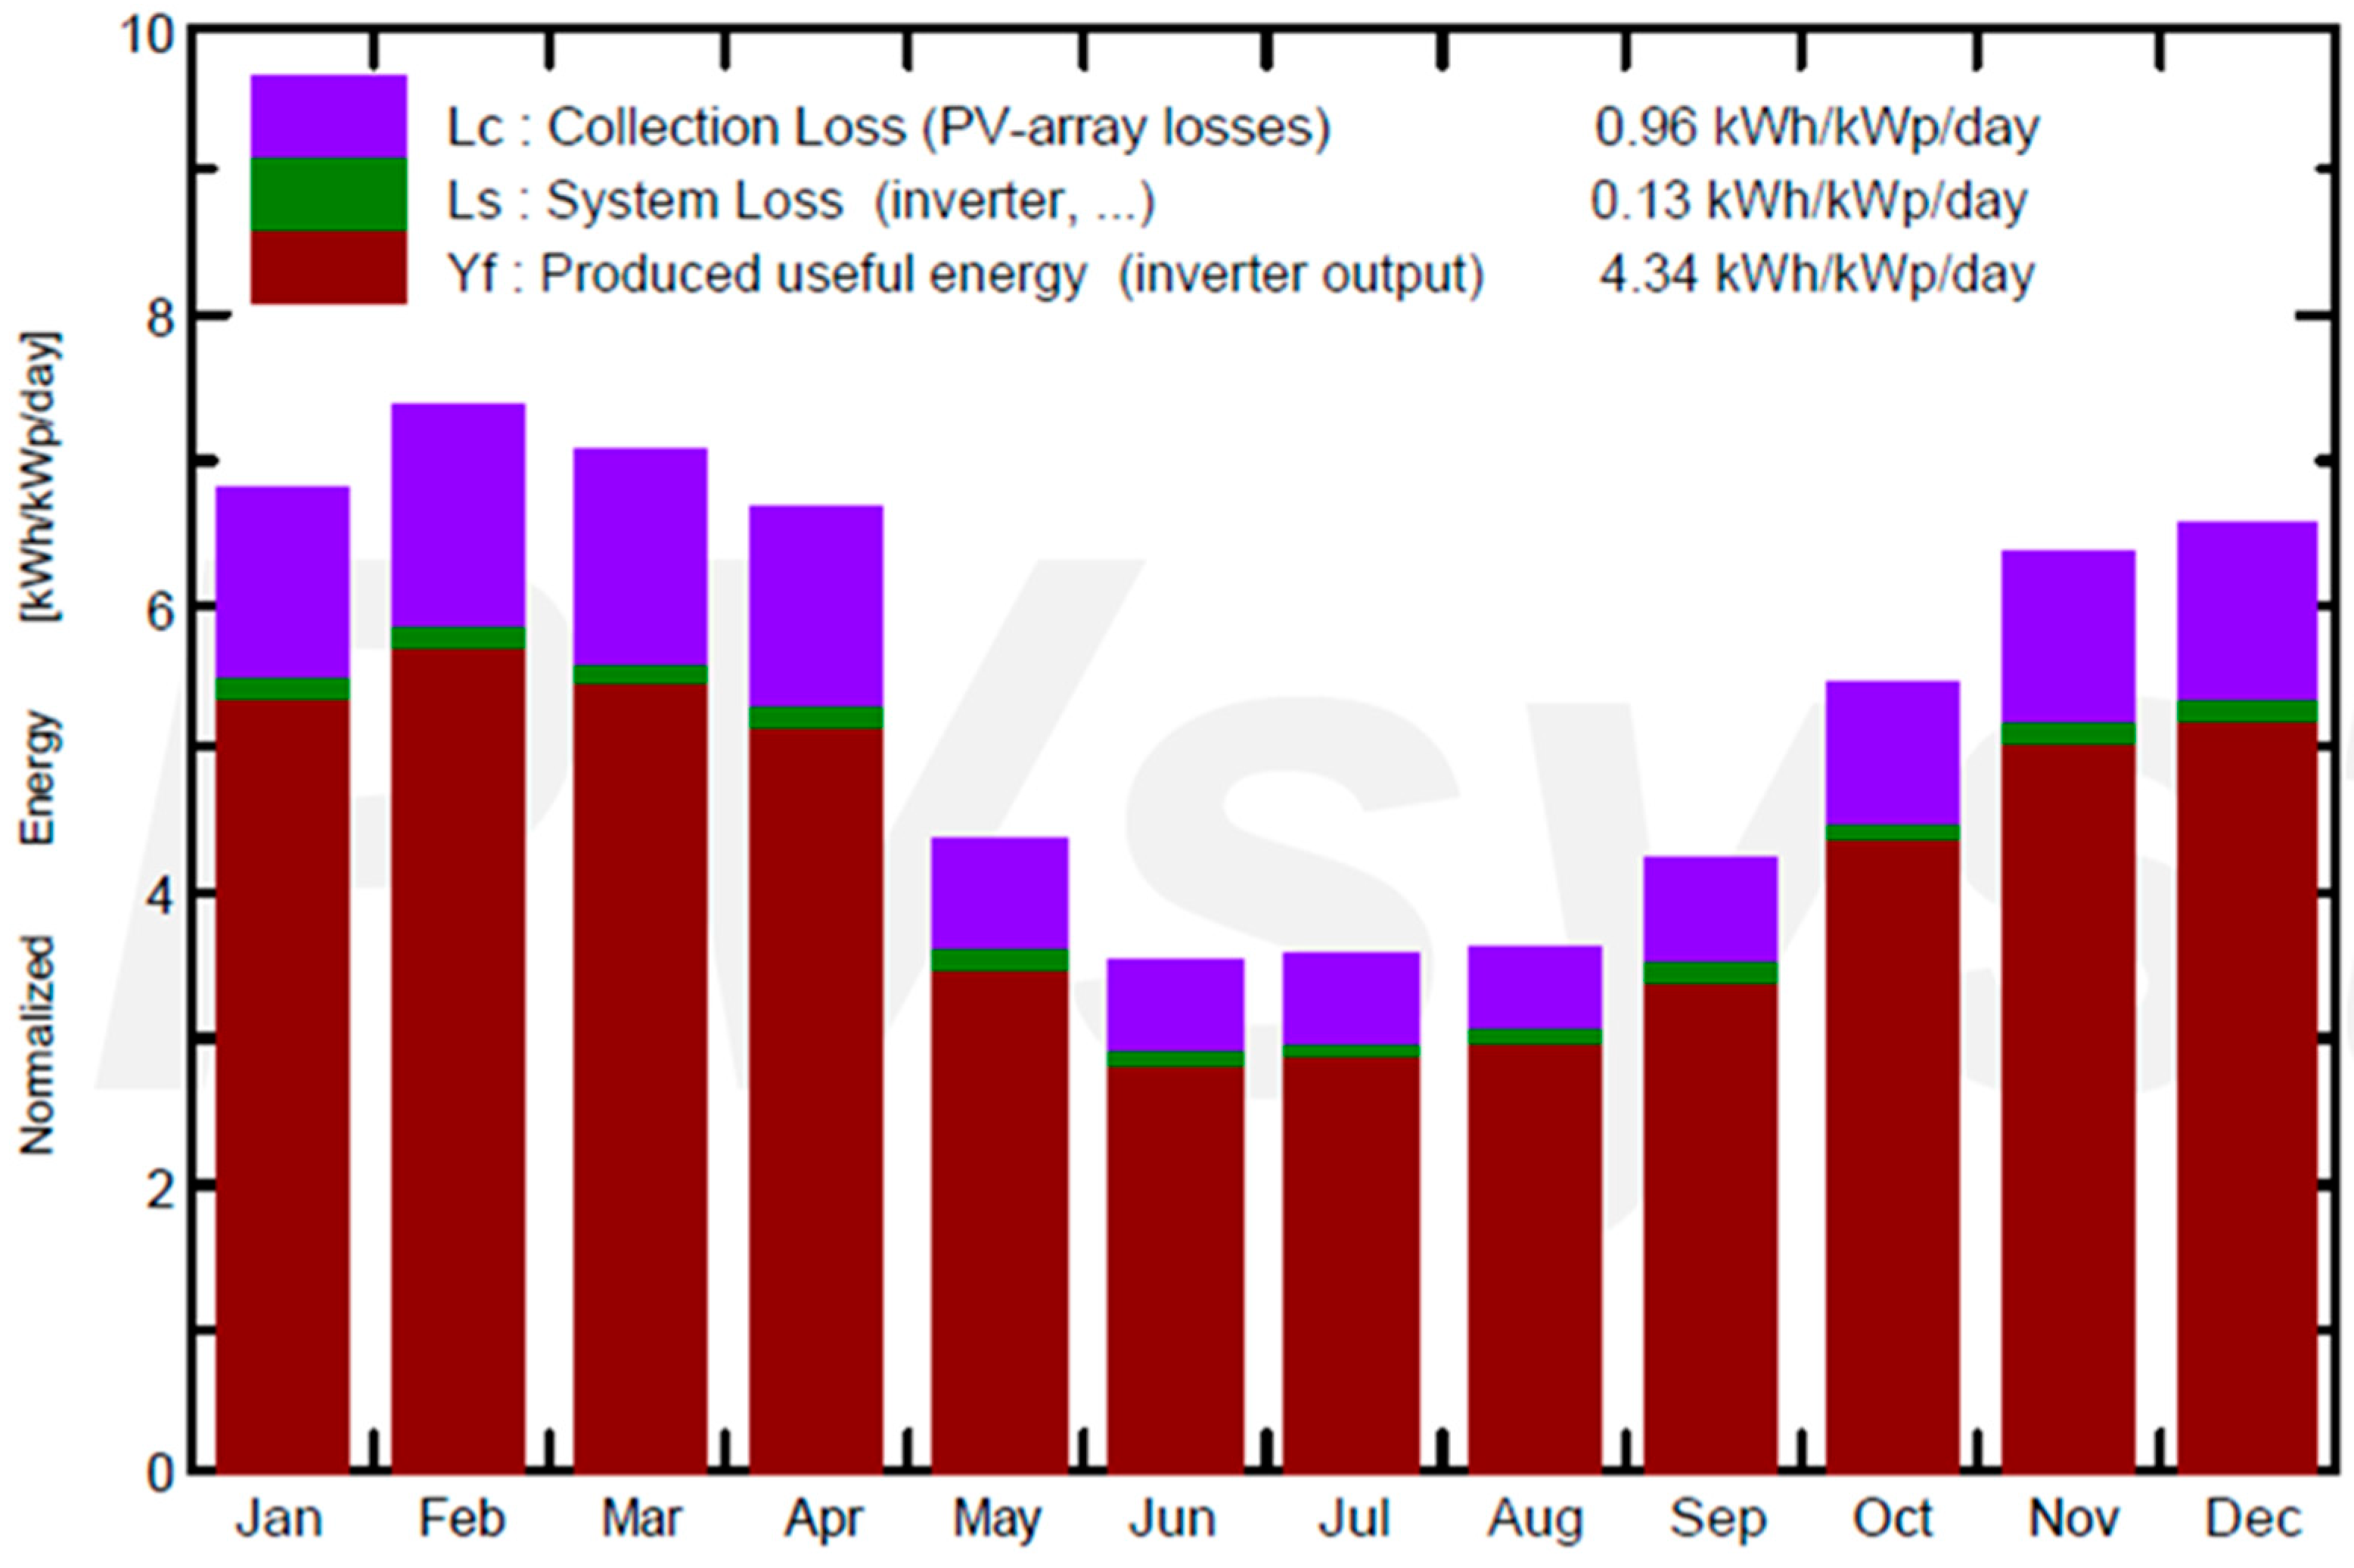
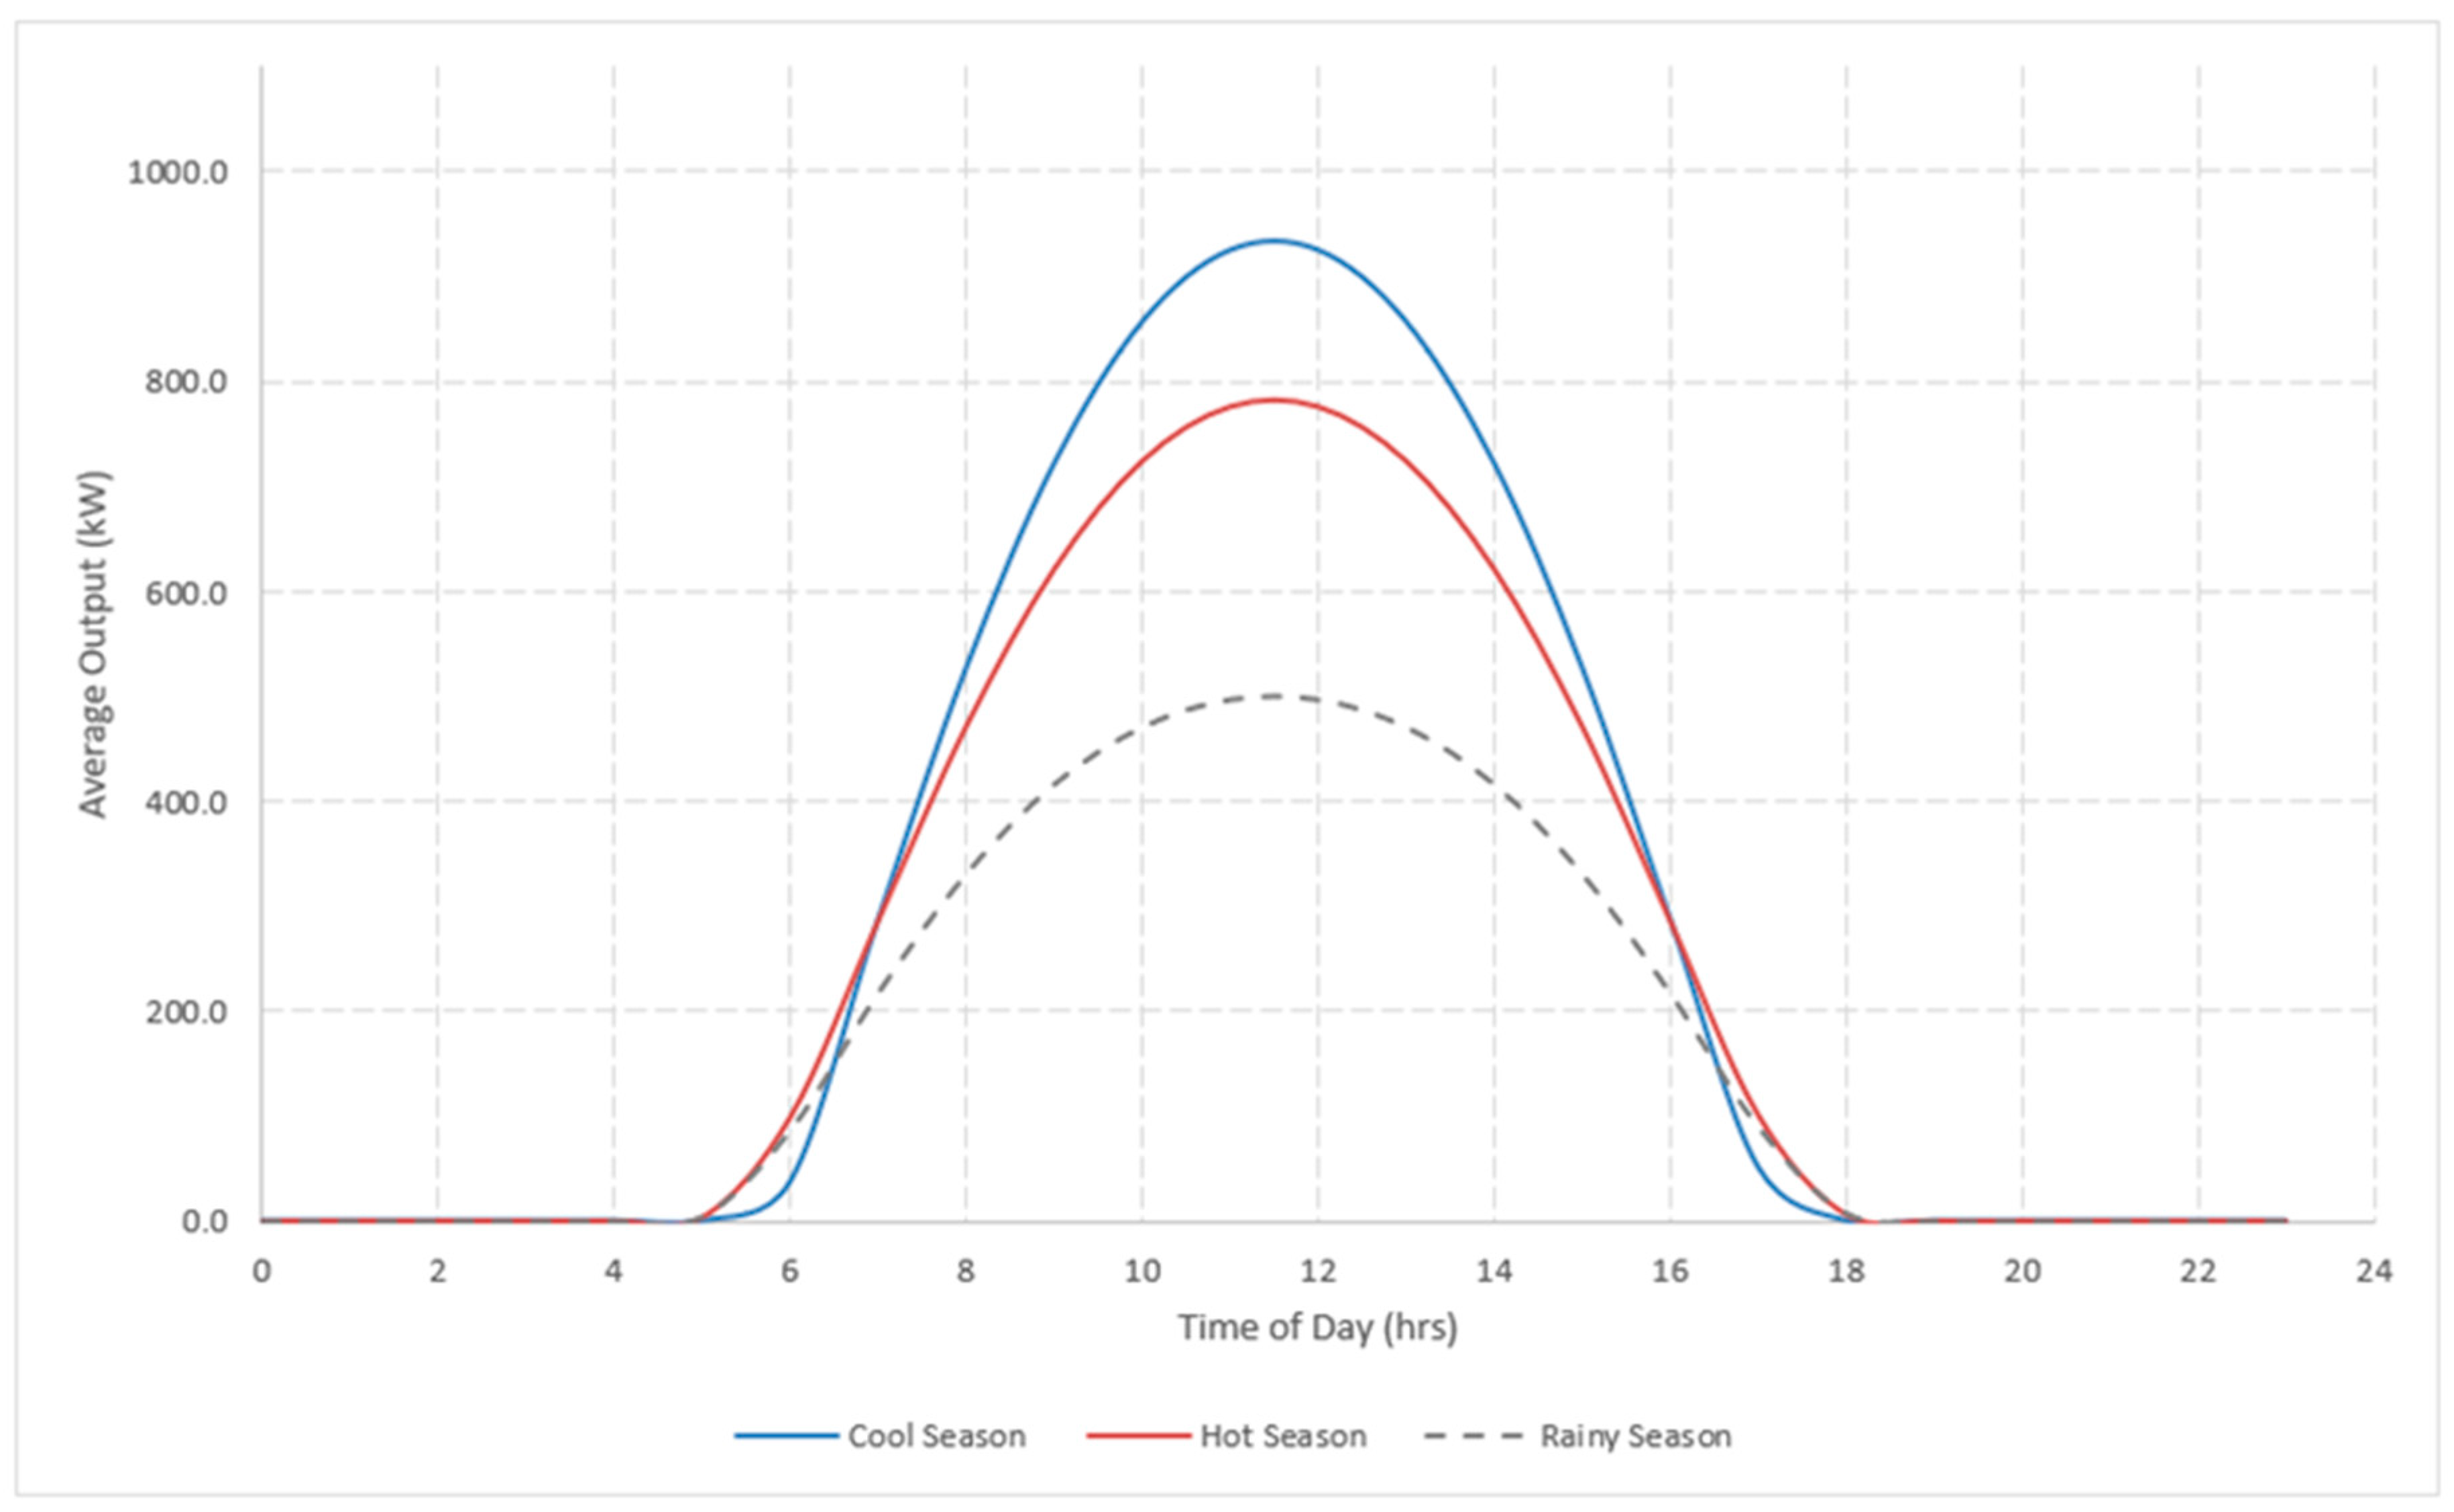
3.1. PV Generation

Analysis of the results obtained through the PVsyst simulation showed that in the first year of operation the PV installation described in Table 4 would inject a total of 16,345,600 kWh into the local grid at an average of 4490 kWh/Day. With the highest average normalized output (the energy injected into the grid) occurring in the cool season of November to February (5502 kWh/day). During the hot season of March to April the average would be slightly less at 4882 kWh/day. During the rainy season of June to October the output would drop noticeably to 3434 kWh/day.
Table 5 shows the breakdown of the average energy injected into the grid by month. Table 5 shows that the lowest average injection of energy would occur in June (Figure 6) with 2974 kWh/day, and the highest in February (Figure 7) with 5876 kWh/day.
The International Electrotechnical Commission (IEC) 61724 “Photovoltaic system performance” series of standards defines performance ratio (PR) as ‘the ratio of the effective energy produced by a PV system.’ For a grid connected PV system PR is calculated by [51]:
P R = EGrid GlobInc × PnomPv
where: EGrid is energy injected into the grid, GlobInc is the global incident irradiance in the collection pane, PnomPv is the standard test conditions power.
PR is used to evaluate the quality of the performance of a PV system [51]. The PR over a year of the proposed installation in Yangon city was 0.798. The PR was consistent through the year as can be seen in Figure 8. February was the poorest performing month (PR = 0.779) and August the best (0.824). During the rainy season the PR was 0.818, in the cool season it was 0.791, and in the hot season it was 0.790.
The PR figures show that 79.8% of the energy collected by the installation was converted into useful energy and injected into the grid, meaning that the combined annual losses of the installation were 20.2%. Figure 9 shows a detailed breakdown of the annual losses of the system.
Some of the causes of losses in the system were due to inverter efficiency, ohmic wiring losses and PV module and string mismatch. The main cause of losses in the system was due to temperature and low irradiance (14.8%). This high figure helps to explain why PV output was lower in the hot season compared to the cool season. Figure 10 shows the normalized production of the installation over the first year of operation.
The data obtained from the PVsystTM simulation were used to create average daily PV output profiles of the PV system described in Table 4 at the same hourly resolution as the synthetic seasonal load profiles created for urban Yangon City. As with the synthetic load profiles, aggregated monthly, seasonal (Figure 11) and annual output profiles were then generated from the monthly profiles.
Although the cool season had the fewest daylight hours, 12 as opposed to 14 for both the hot and rainy seasons, the average daily output was highest in this season. Output fell by 11.4% in the hot season and by 39.6% in the rainy season.

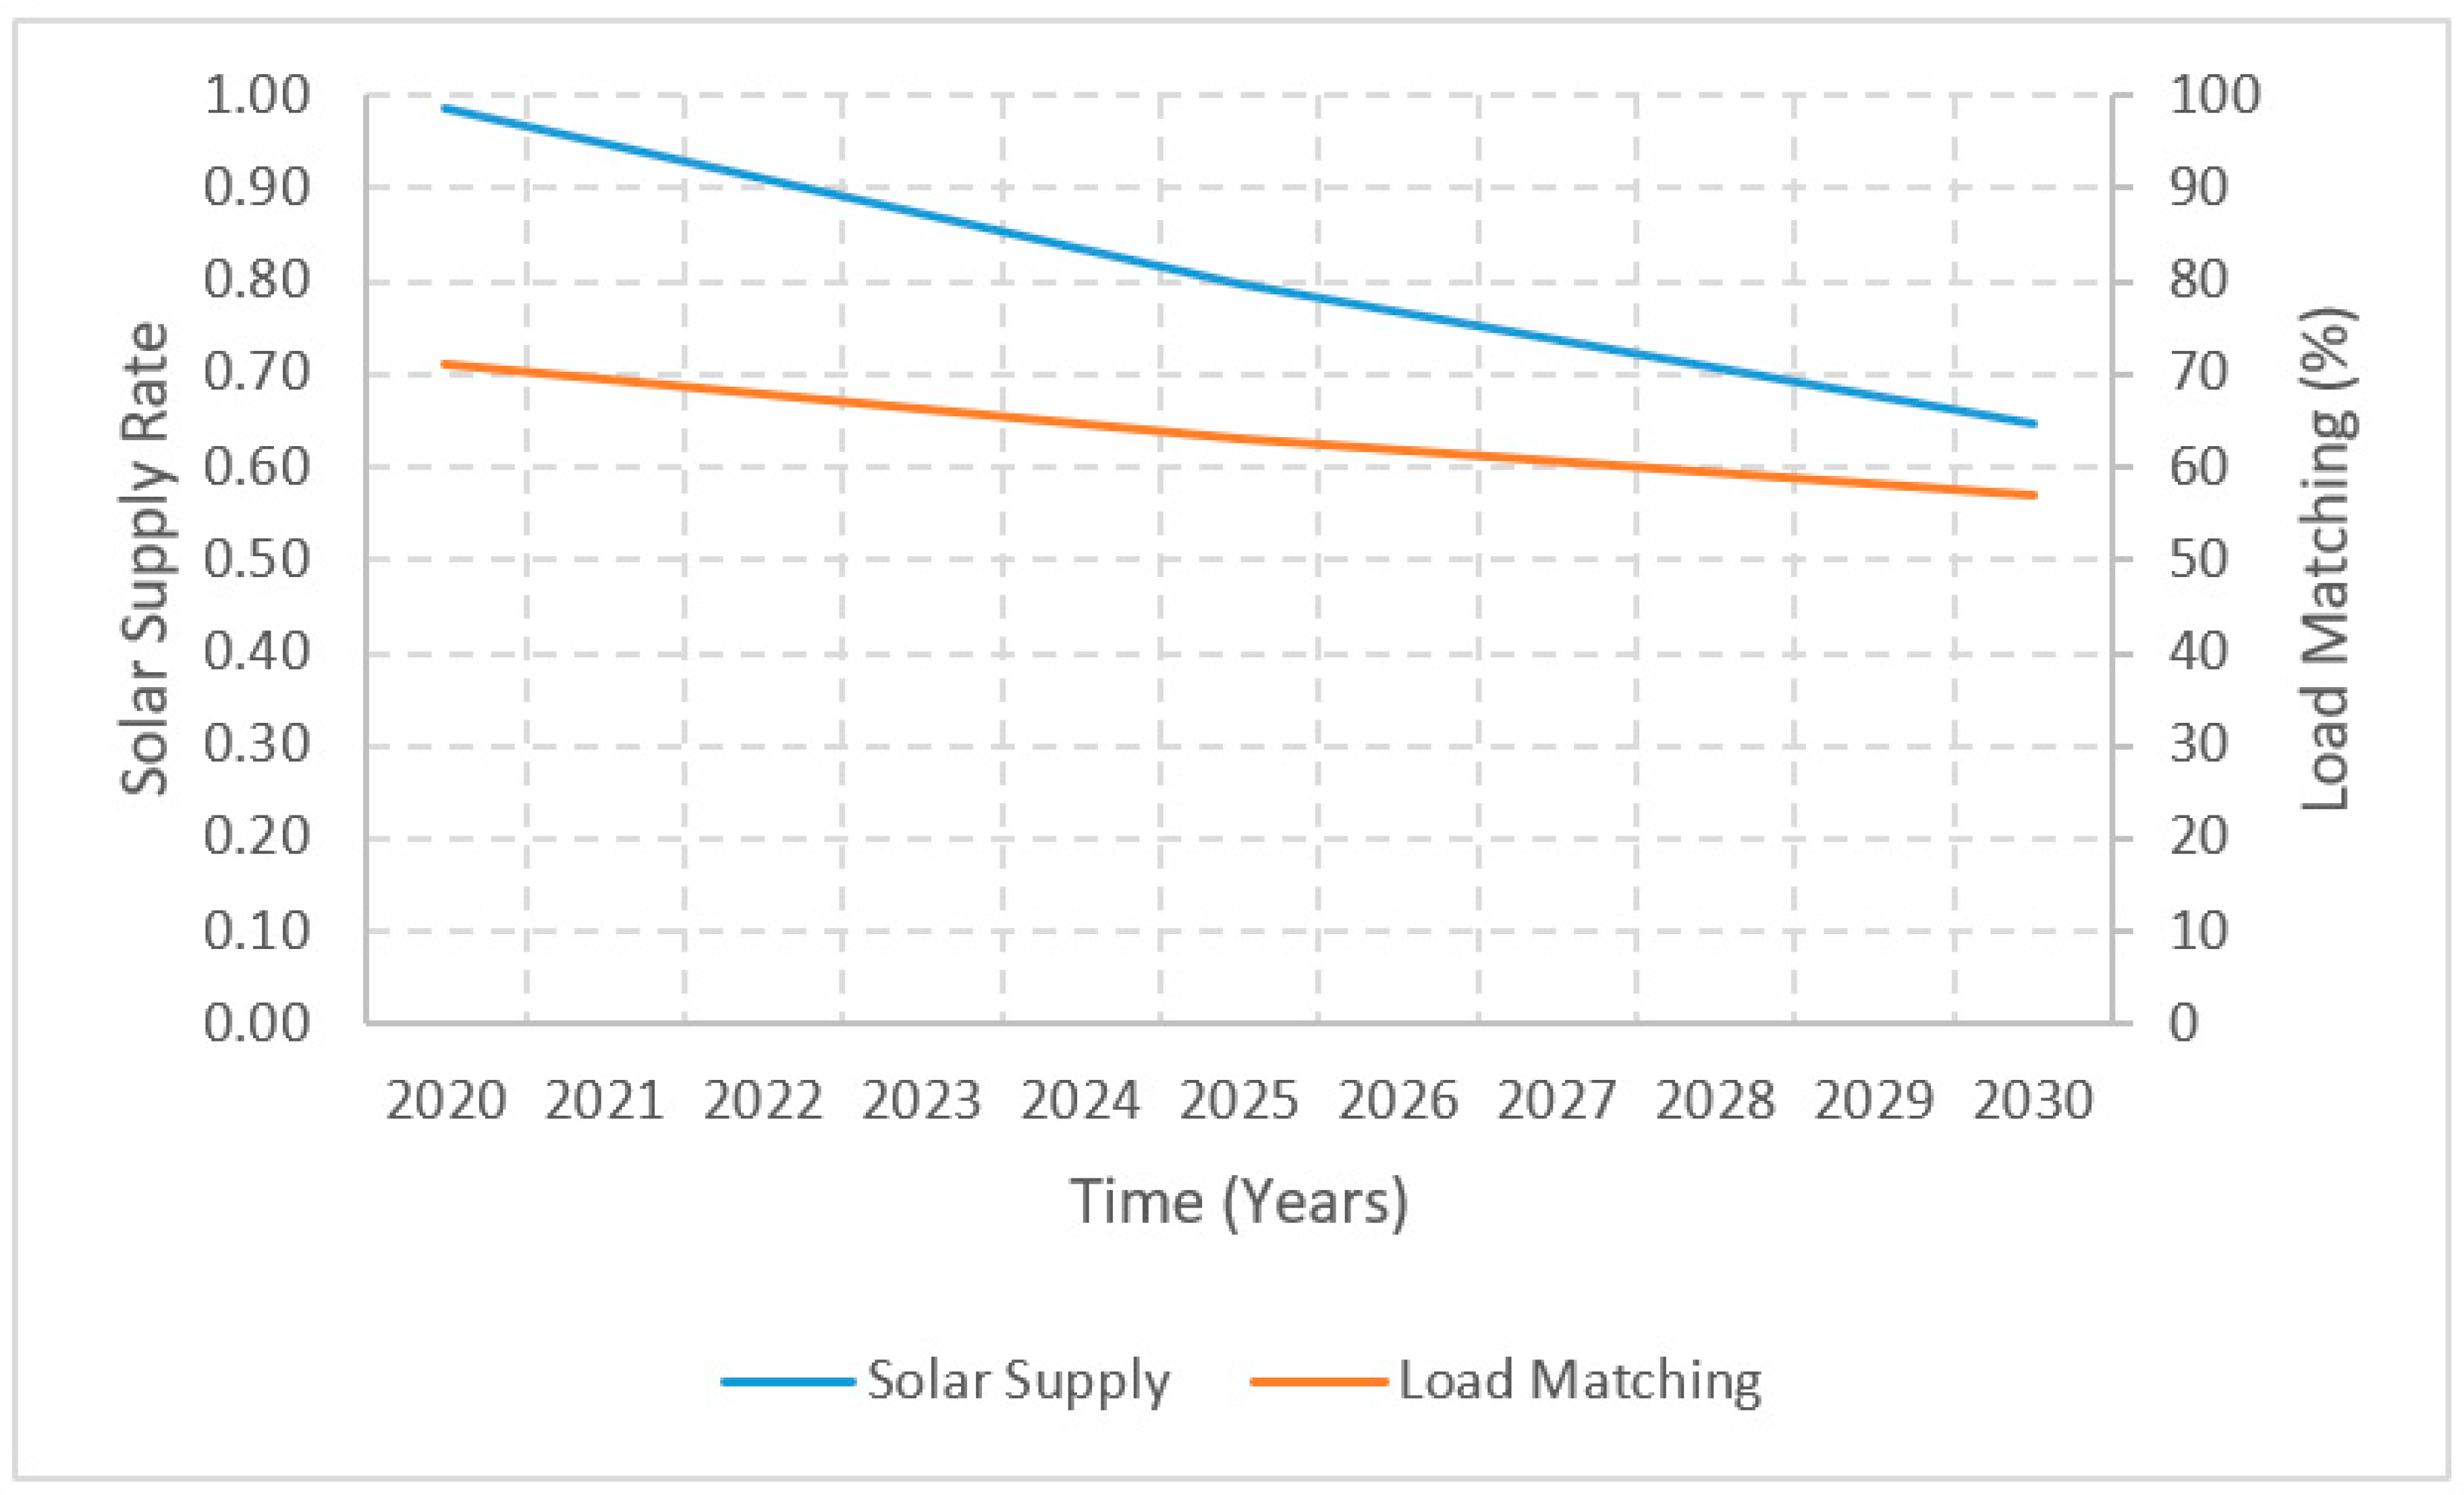
3.2. Solar Supply and Load Matching

The results obtained from this study found that in the first year of operation of the proposed PV installation (2020) the solar supply rate was 0.99, suggesting that there is a 99% match between energy needs and the output from the PV installation. However, as stated previously, the solar supply rate does not consider whether the output from the PV installation temporally coincides with load.
Figure 12 shows the normalized yearly profiles of both the PV installation and the local load, with the shaded area highlighting the degree of matching between the output of the PV system and the local load it is supplying.
The degree of load matching for the year would be 71%, and as seen in Figure 12 there is a reasonable correlation between the output of PV installation and the load of an urban setting such as Yangon City. As stated previously this work assumes that the times of high peak demand in areas such as Yangon City would occur during the hottest parts of the day (early afternoon) as consumers use electric devices such as fans to combat the high temperatures. Figure 12 also shows that these times coincide with the times of high PV output.
Analysis of the results also showed that, as expected due to the climatic conditions and basic energy needs of the region under study, there was little variance in both solar supply rate and load matching for the three seasons. The solar supply rate was lowest in the cool season at 0.98 and highest in the rainy season at 1.09 a difference of 0.12. In terms of load matching the maximum variation in seasons (6.6%) was again between the cool season (67.7%) and the rainy season (74.3%).
Figure 13 and Figure 14 show the forecasted load profiles, forecasted PV output profiles and load matching in 2025 and 2030, assuming the expected regional annual load demand increase, and the degradation rate of the PV system discussed previously.
The increase in load and degradation of the PV system output mean that by 2030 the solar supply rate would decrease to 0.65 and load matching would decrease to 57.3%. Figure 15 shows the decrease in solar supply factor and load matching of the PV system in the first 10 years of operation (2020–2030).
There has been a continued rise in the penetration levels of variable energy sources (VRE) such as solar/PV over the previous few decades [52]. Due to the move towards a more sustainable energy future this rise is expected to continue [53]. One stumbling block to the continued integration of PV is thought to be the relationship between PV output and load demand. This is particularly true in Europe where the highest output levels coincide with periods of low demand.
The results from this study have shown that for developing nations in the global south with economic and climate conditions similar to Myanmar that there is a good correlation between PV output and local load demand. During the first year of operation of the PV installation the majority of the electricity generated (approximately 75%) would coincide with local demand. This means that there will still be grid support needs from non-renewable generation technologies/ storage, although at a lower capacity that needs to be factored into the electricity generation planning. The results also show that if load demand in the region continues as predicted, the correlation between PV output and local load demand will increase over time. However, it should be stated that it is not the intention of this work to claim that PV could be used to meet all the electricity needs of a country like Myanmar. It is merely intended to demonstrate that PV could be easily incorporated into electricity networks of developing nations in the global south, and that in the case of Myanmar, it is a suitable candidate for meeting the country’s ambitions of creating a sustainable network with significant levels of RE in the near future.

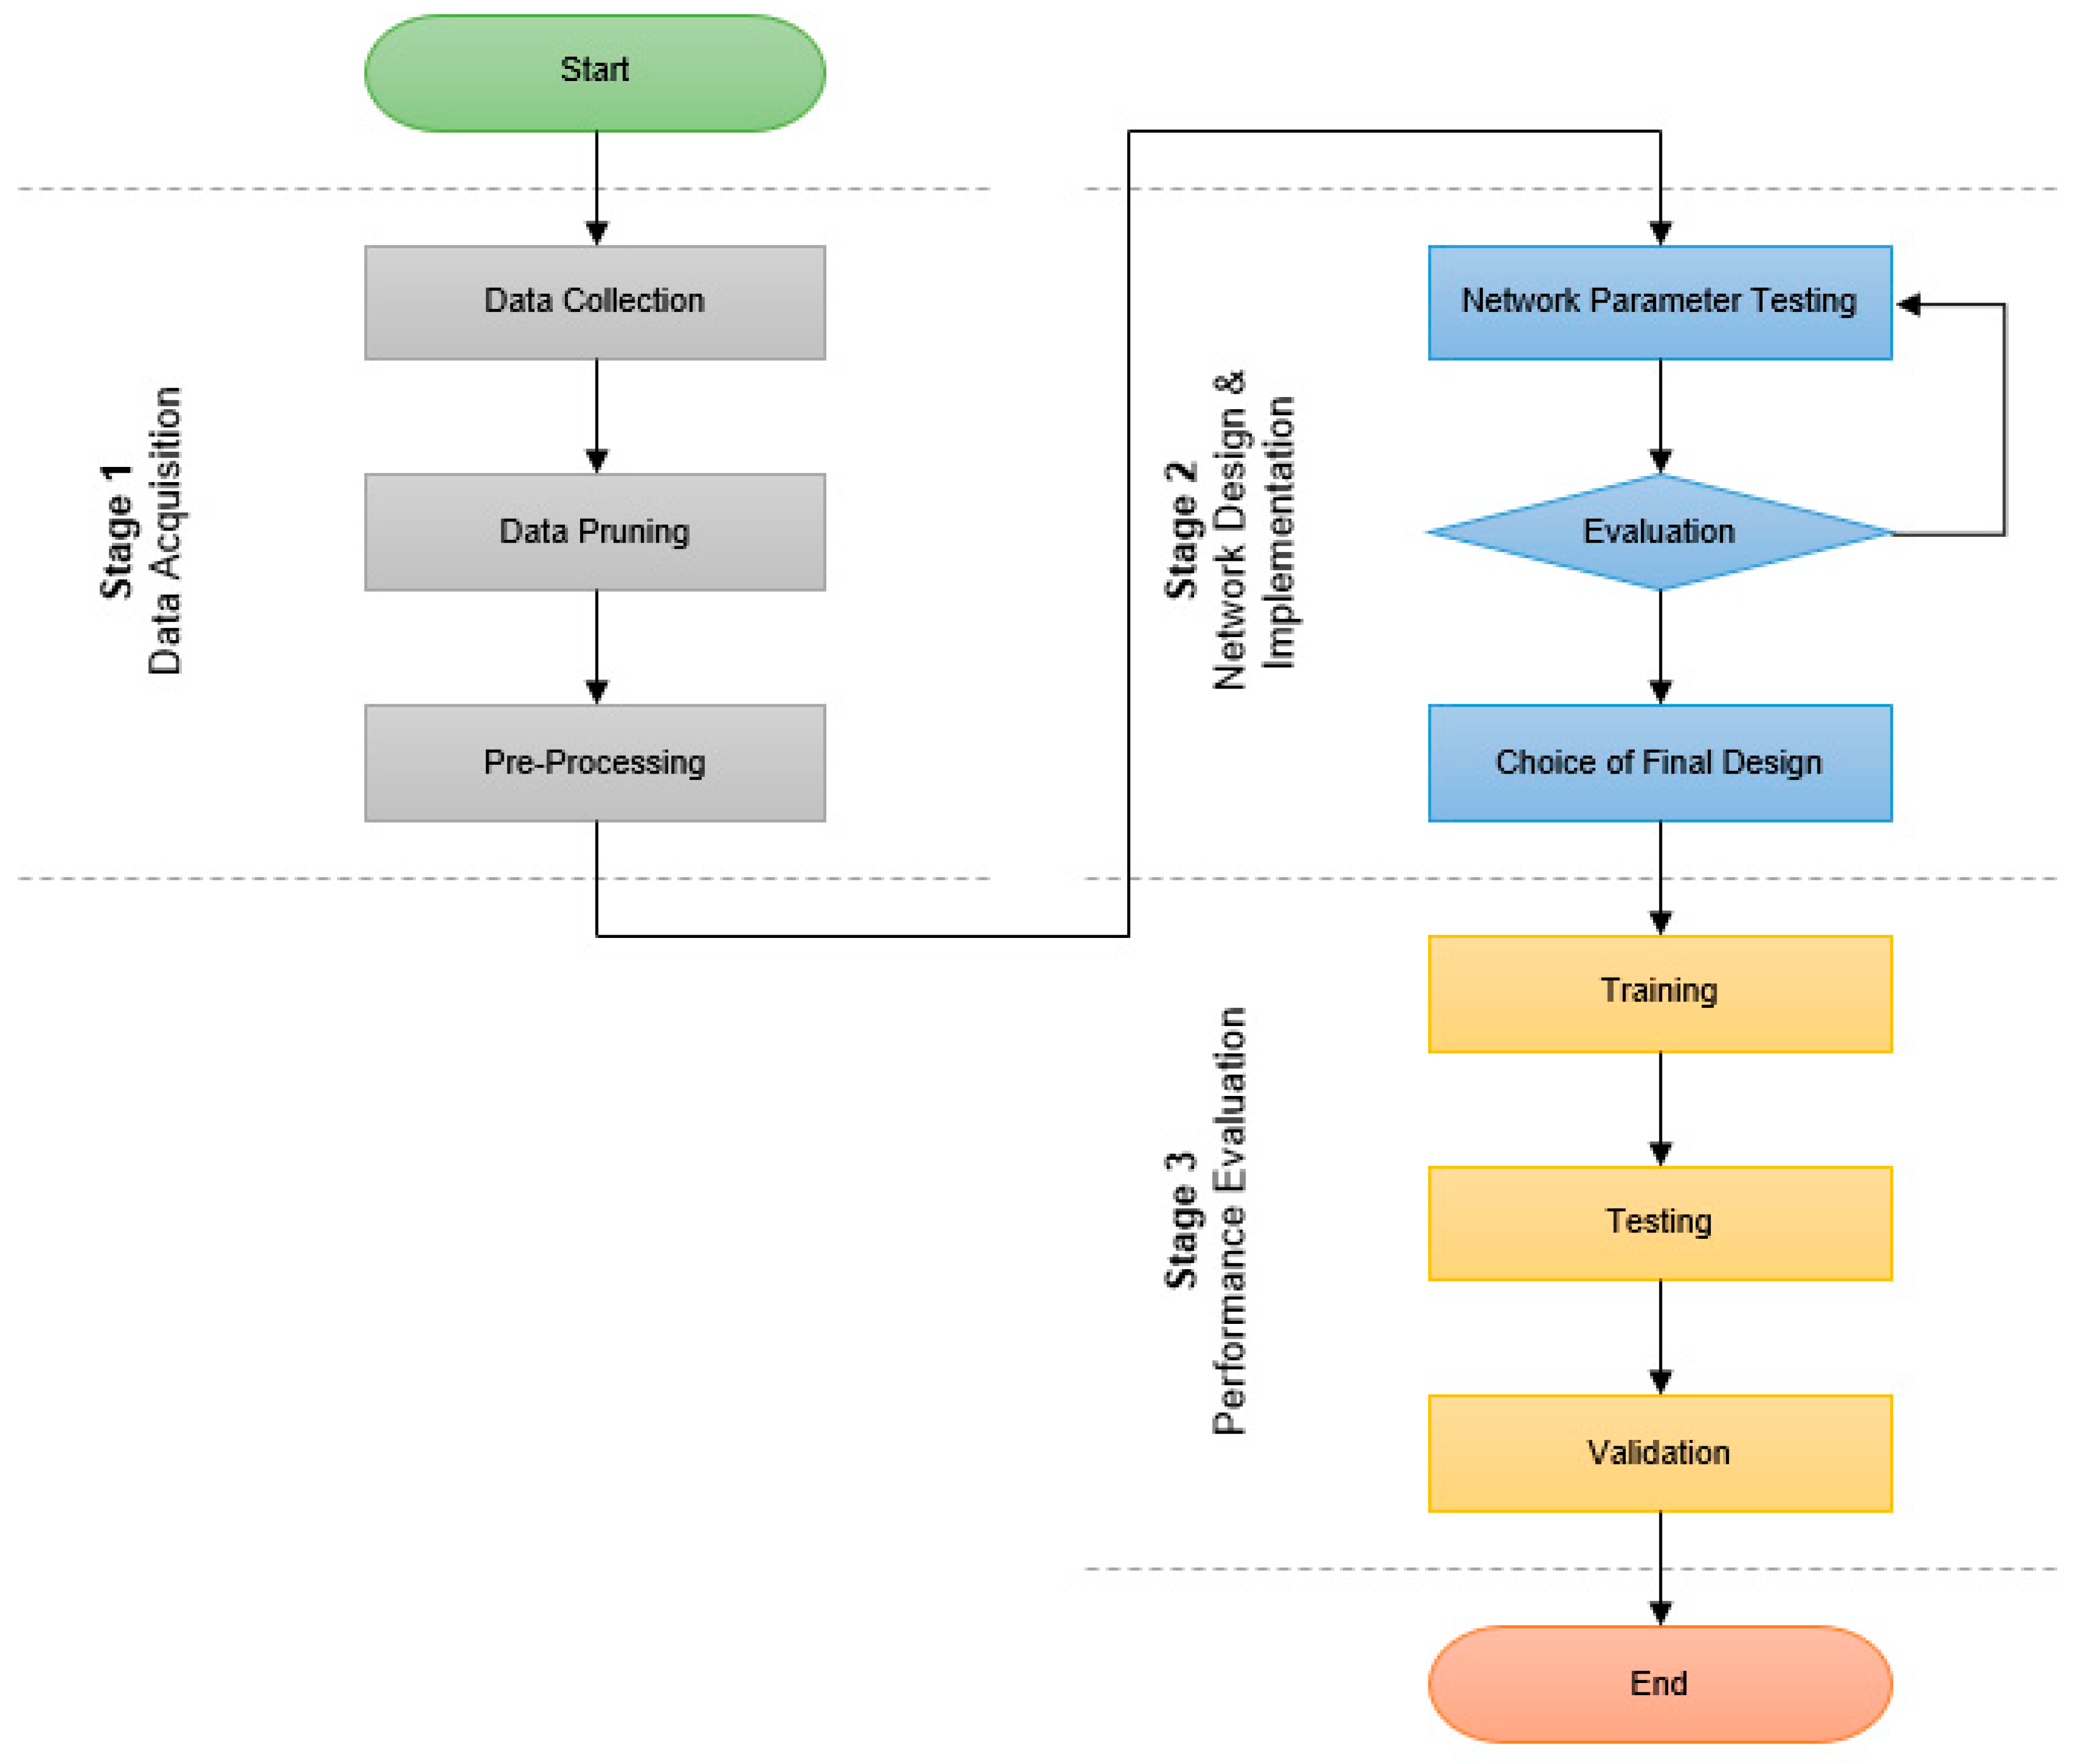
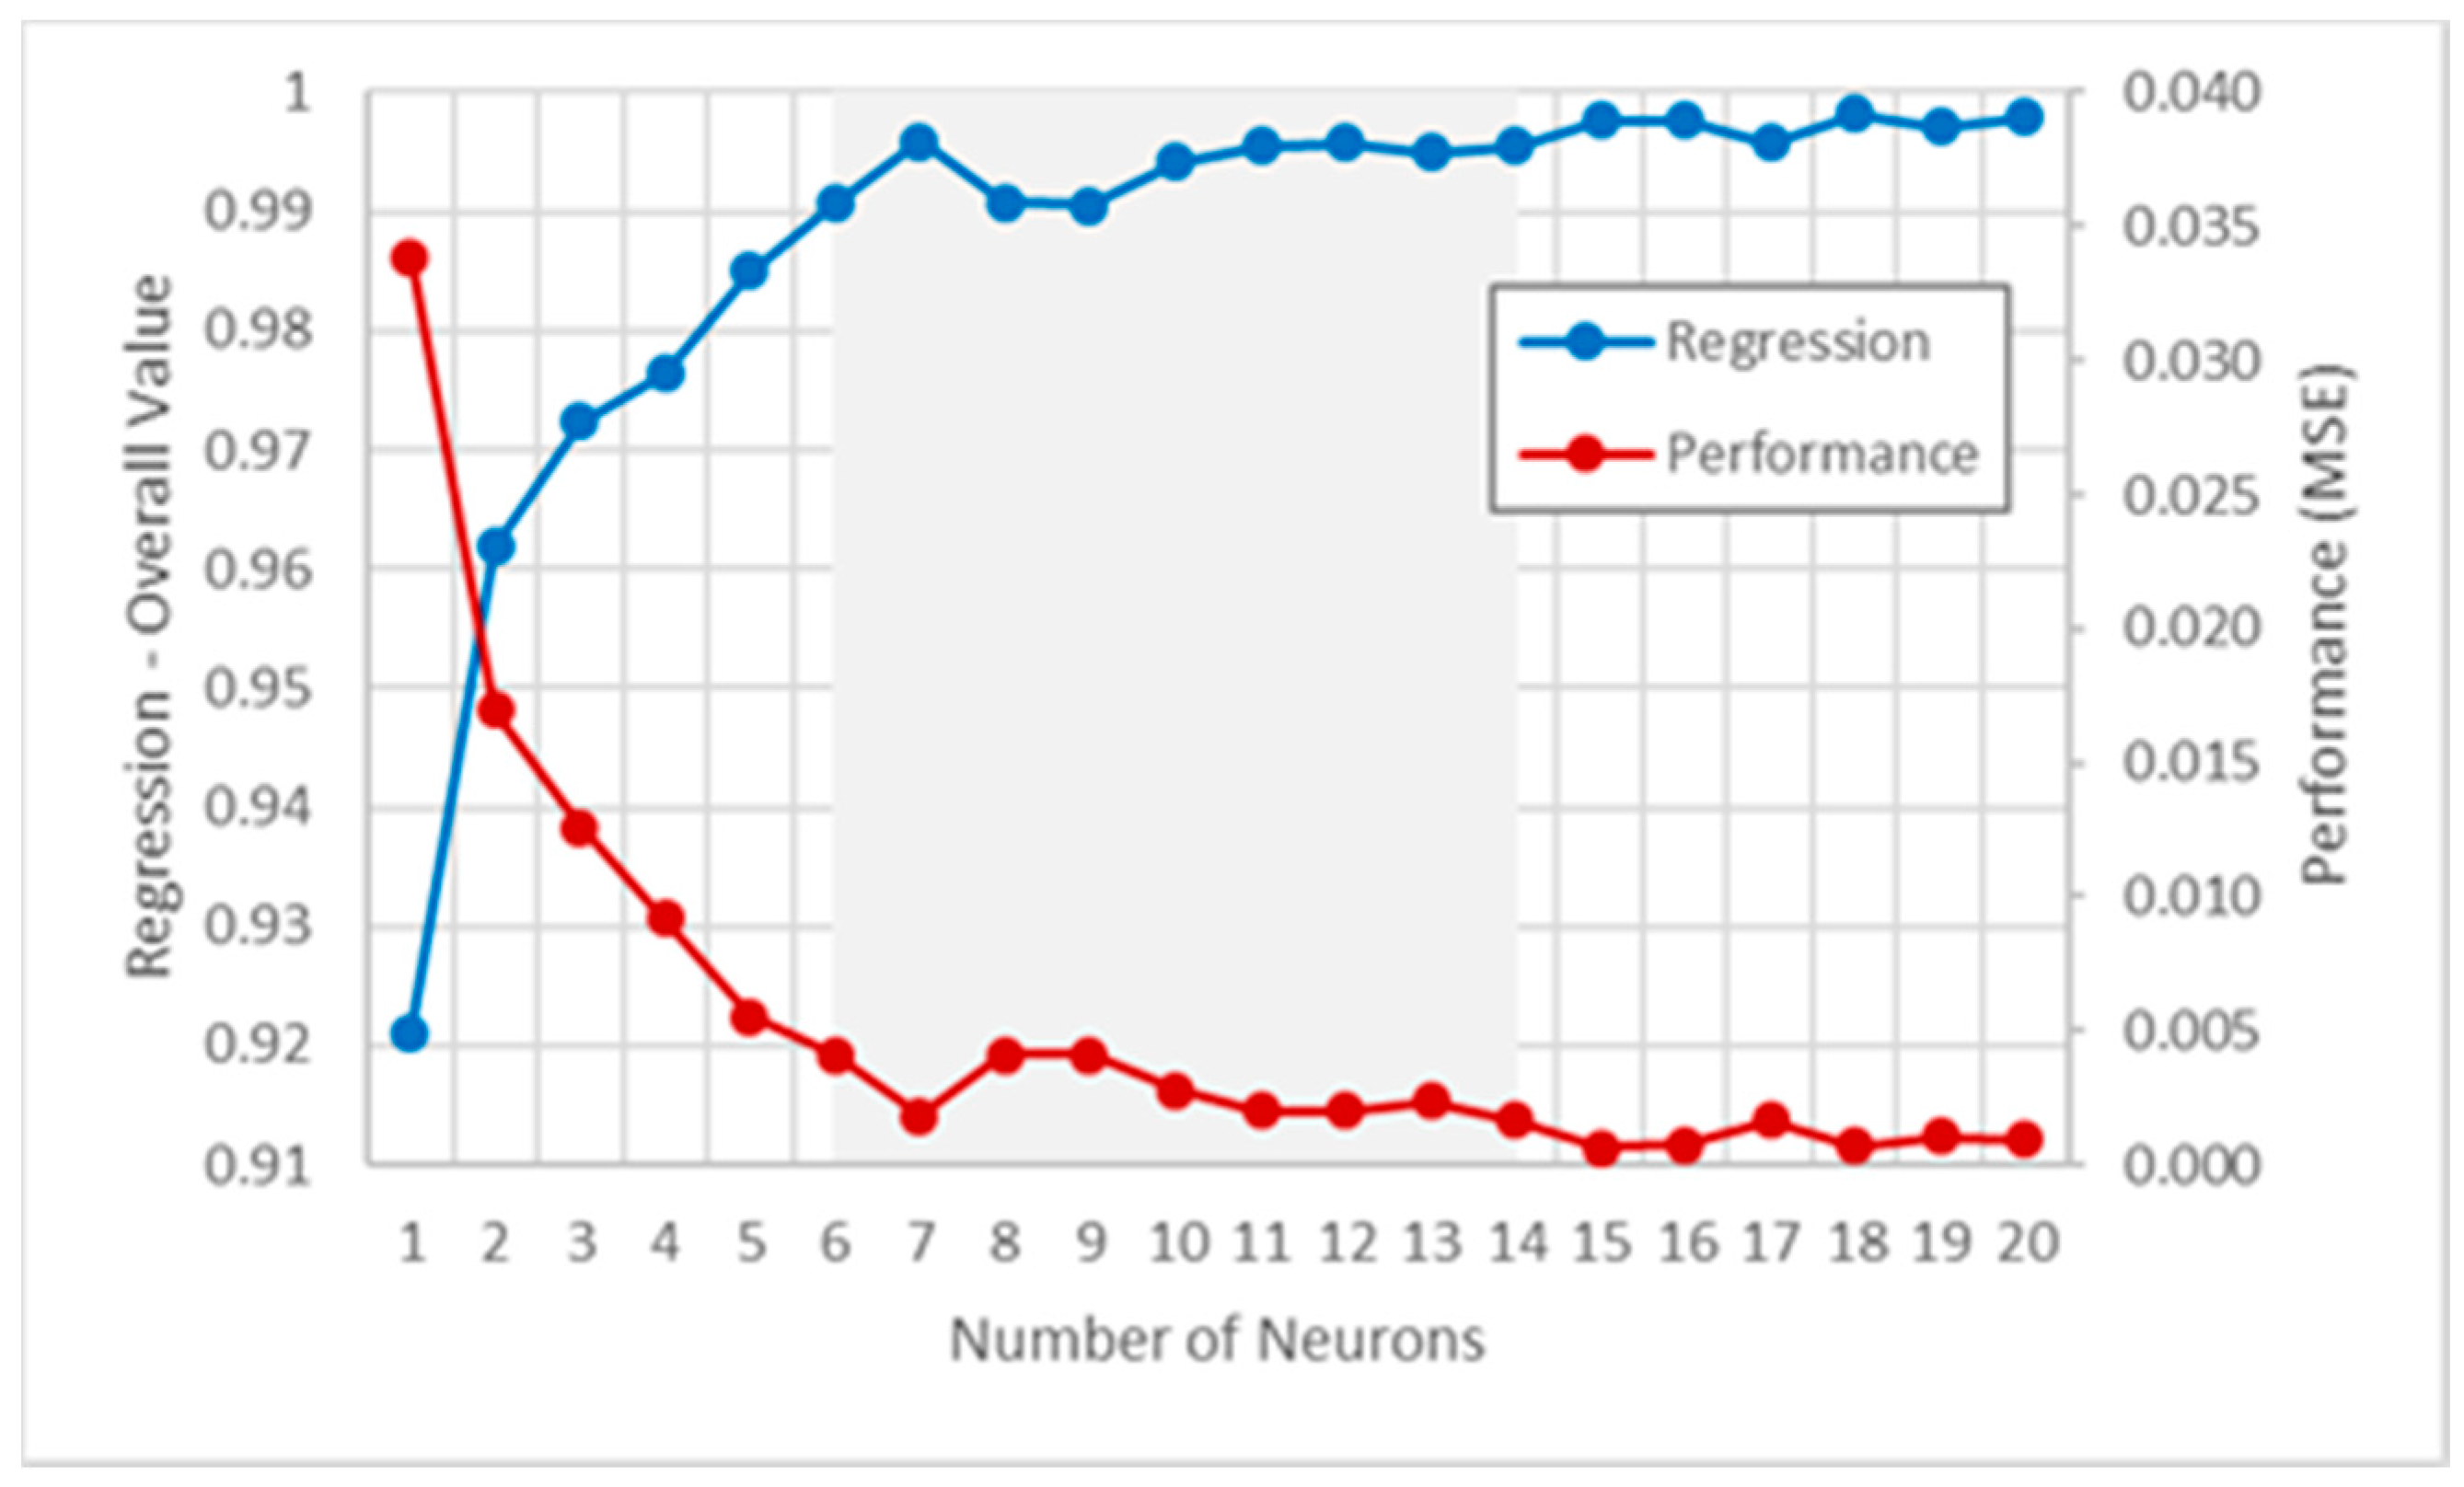
3.3. Systematic Artificial Neural Network (ANN) Design Approach Development and Indicative Results

The viability of basic ANN models to synthesize future load profiles of networks with varying penetration levels of typical modern-day loads such as PV and electric vehicle charging has previously been proven by the authors through a UK-based study [54]. The model was built using the Matlab Neural Network Toolbox with default settings, namely: a function fitting neural network, with 10 neurons in one hidden layer, hyperbolic tangent sigmoid transfer functions in the hidden layer, a linear transfer function in the output layer with the network trained using the Levenberg–Marquardt backpropagation (supervised) training algorithm. Learning from these results will be used to determine the optimal ANN model structure.
Over the years several authors have proposed different empirical rules which have been claimed as can be used in the design of ANN models in order to improve their performance [46,55]. For example, when designing an ANN model with one hidden layer different authors have proposed a variety of different formula to determine the number of hidden nodes: n, 2n, n/2 and 2n + 1, where n is the number of input nodes in the model as reported in [49]. In a model which has five inputs, use of these formulae would mean the hidden nodes used would be 5, 2.5, 10 or 11 depending on the formula employed. This translates to a high amount of effort in load forecasting using ANN applications due to the exploratory and iterative nature of the designing process. The hidden node ranges mentioned in the example also clearly shows why empirical rules do not work well for all applications [46], and why designing ANNs is often considered to be more of an art form rather than a science.
In order to address the knowledge gap and simplify the design process, the authors propose a new systematic approach that could be employed in designing any ANN model for load forecasting by nations of the Global South or elsewhere, that involves three stages (Figure 16). The approach is demonstrated using an example case from the UK. The first stage is data acquisition and involves data collection, data pruning and pre-processing to remove abnormal data entries. The second stage of the process is network design and implementation, which starts with extensive and systematic testing of network parameters such as network type, number of neurons, number of layers, training function, activation function and division of data. The data from these tests is then used to create a final design network. The final stage of the process is evaluating the performance of the created ANN model in predicting future load profiles. The first step of this stage is supervised learning (training the ANN with data from a known case, the UK in this work). Next, the model is tested again as part of supervised learning using data from the UK, but which the model has no a priori knowledge of. Finally, the model is validated for general load forecasting outside the training case using datasets from other countries such as Ireland, Norway, and Myanmar.
The idea behind this forecasting procedure is that the ANN model is learning: the peaking and energy consumption behavior of RERs such as PV on their penetration levels; and the socio-economic tendencies embedded in electricity consumption, the impact of weather variables on RERs and consumer demand. As the socio-economic tendencies are a function of climate, culture and income levels, validation cases have been selected appropriately.
It was identified from testing carried out for the authors’ UK example case that of the 20 training algorithms available in Matlab’s Neural Network Toolbox, 16 are suitable candidates for ANN models used in load forecasting scenarios that use supervised training. It was also identified that of the 19 model networks available 5, including the standard feed-forward neural network, can be used for forecasting problems. Initial testing also showed that there are 15 transfer functions that can be used in both the hidden and output layers of neural networks created in Matlab.
The systematic testing of network parameters of ANN models used to forecast load profiles involved creating several ANNs which modelled the load profile of a typical UK domestic electricity network with RER generation in the form PV installations and future high ampacity loads. The ANNs were all trained with the same data that was obtained from publicly available sources such as Low Carbon London project and the UK Energy Research Centre. Each ANN used this data fed through 5 inputs nodes to model the load profile continuously over a day-long period at an hourly resolution through one output node.
Testing has been carried out on the standard function-fitting neural network to determine the best performing training algorithms and the optimal model structure in terms of both hidden neurons and hidden layer. In order to evaluate the effects each of these parameters has on the prediction accuracy of ANN models, it is important to properly define some performance indicators [56]. In this work performance is measured in terms of mean square error (MSE) and the Pearson correlation coefficient (R) value. MSE is a metric commonly used to measure of the goodness of fit in the training, validation and testing sets of ANN models [57,58,59,60]. It is a measure of the average squared difference between targets and outputs of a network [58]. Therefore, the smaller the value of MSE the closer the fit is to the data and the better the performance of a network [57]. R values are a measure of the relationship between two variables. They are commonly used to show the prediction accuracy of ANN models by evaluating the relationship between predicted and actual values [57,58,59,60,61]. Where an R value near to 1 indicates a high degree of correlation between actual and predicted values (good prediction performance) and R values close to 0 indicate poor correlation between actual and predicted values (poor prediction performance) [62].
Demonstrated in Figure 17 are the performance results (mean square error and regression) for the UK example for the Broyden Fletcher Goldfarb Shanno quasi-Newton backpropagation algorithm (Trainbfgs) in tests carried out to determine the performance of models with one hidden layer and neurons varying from 1 to 20.
Table 6 shows the performance matrix from tests which generated 1700 ANN models that were created to determine the five best performing training algorithms out of the 16 candidates identified by initial testing (abbreviated names shown in column 1).

4. Conclusions

It is a widely held belief that electricity consumption is the engine of modern economic growth, especially in developing countries. The validity of this belief has been demonstrated by China’s rapid economic growth since the 1970s. It has also been shown that there is a symbiotic relationship between economic growth and energy consumption. Whilst energy is a vital component in the early stages of economic growth, economic growth leads to ever greater energy consumption. Electricity consumption is rising in the global south as governments try to encourage economic growth and increase low levels of access to the resource in the region.
Due to financial and environmental concerns, fossil fuels are increasingly seen as an undesirable source of energy. Instead, developing nations in the global south increasingly seek to take advantage of their high renewable-energy potentials in order to create more sustainable electricity networks capable of meeting their rising needs. In this work, Myanmar was used as a case study to determine the suitability of PV to meet the increasing electricity needs of developing countries in the global south soon.
Rather than simply look at the annual, monthly, weekly or daily average output of a typical PV system, this work examined the variation in output over a day and the effects of this variable output on local load demand profiles. The results from the work also demonstrated the importance of including the annual load increase rate and the PV output degradation rate in system planning.
A brief outline was given of a systematic approach to the design process of ANN models that will be used to forecast load profiles in networks with increasing levels of renewables and other modern day loads such as electric vehicle charging. In the next stage of this work, ANN models created using this approach will be used along with the PV output and load profiles mentioned in this paper to assess the ability of ANNs to accurately predict load profiles of developing nations in the global south in several scenarios.

Author Contributions

Conceptualization, M.A. and G.P.; methodology, G.P.; software, M.A.; validation, M.A.; formal analysis, M.A.; investigation, M.A.; resources, G.P.; writing—original draft preparation, M.A. and G.P.; writing—review and editing, M.A. and G.P.; visualization, M.A.; supervision, G.P. All authors have read and agreed to the published version of the manuscript.

Funding

This research received no external funding.

Conflicts of Interest

The authors declare no conflict of interest.

References

  1. Wang, C.-H.; Grozev, G.; Seo, S. Decomposition and statistical analysis for regional electricity demand forecasting. Energy 2012, 41, 313–325. [Google Scholar] [CrossRef]
  2. Zhang, C.; Zhou, K.; Yang, S.; Shao, Z. On electricity consumption and economic growth in China. Renew. Sustain. Energy Rev. 2017, 76, 353–368. [Google Scholar] [CrossRef]
  3. Soualmia, A.; Chenni, R. Modeling and simulation of 15MW grid-connected photovoltaic system using PVsyst software. In Proceedings of the 2016 International Renewable and Sustainable Energy Conference (IRSEC), Marrakesh, Morocco, 14–17 November 2016; pp. 702–705. [Google Scholar]
  4. Kim, H.; Jung, T.Y. Independent solar photovoltaic with Energy Storage Systems (ESS) for rural electrification in Myanmar. Renew. Sustain. Energy Rev. 2018, 82, 1187–1194. [Google Scholar] [CrossRef]
  5. Lin, B.; Zhu, J. Chinese electricity demand and electricity consumption efficiency: Do the structural changes matter? Appl. Energy 2020, 262, 114505. [Google Scholar] [CrossRef]
  6. International Energy Agency. Southeast Asia Energy Outlook; Springer: Berlin, Germany, 2019. [Google Scholar]
  7. ASEAN Centre for Energy. The 5th ASEAN Energy Outlook 2015–2040; ACE: Oak Brook, IL, USA, 2017. [Google Scholar]
  8. IEA. Southeast Asia Energy Outlook; Springer: Berlin, Germany, 2015. [Google Scholar]
  9. ASEAN Centre for Energy. The 4th ASEAN Energy Outlook 2013–2035; International Energy Agency: Paris, France, 2015. [Google Scholar]
  10. Al-Saeed, Y.W.; Ahmed, A. Evaluating Design Strategies for Nearly Zero Energy Buildings in the Middle East and North Africa Regions. Designs 2018, 2, 35. [Google Scholar] [CrossRef] [Green Version]
  11. Yi, F.; Ye, H.; Wu, X.; Zhang, Y.Y.; Jiang, F. Self-aggravation effect of air pollution: Evidence from residential electricity consumption in China. Energy Econ. 2020, 86, 104684. [Google Scholar] [CrossRef]
  12. Allison, M.; Pillai, G. Photovoltaic Energy Potential and its Impact on Electricity Demand Profiles. In International Conference on Science and Technology for Sustainable Development; TeesRep: Yangon, Myanmar, 2018. [Google Scholar]
  13. Ismail, A.M.; Ramirez-Iniguez, R.; Asif, M.; Munir, A.B.; Muhammad-Sukki, F. Progress of solar photovoltaic in ASEAN countries: A review. Renew. Sustain. Energy Rev. 2015, 48, 399–412. [Google Scholar] [CrossRef]
  14. Asian Development Bank. MYANMAR Energy Sector Assessment, Strategy, and Road Map; Asian Development Bank: Mandaluyong, Philippines, 2016. [Google Scholar]
  15. Haque, M.; Wolfs, P.J. A review of high PV penetrations in LV distribution networks: Present status, impacts and mitigation measures. Renew. Sustain. Energy Rev. 2016, 62, 1195–1208. [Google Scholar] [CrossRef]
  16. Liu, C.; Xu, W.; Li, A.; Sun, D.; Huo, H. Analysis and optimization of load matching in photovoltaic systems for zero energy buildings in different climate zones of China. J. Clean. Prod. 2019, 238, 117914. [Google Scholar] [CrossRef]
  17. Kandasamy, C.; Prabu, P.; Niruba, K. Solar potential assessment using PVSYST software. In Proceedings of the 2013 International Conference on Green Computing, Communication and Conservation of Energy (ICGCE), Chennai, India, 12–14 December 2013; pp. 667–672. [Google Scholar]
  18. Ritchie, H.; Roser, M. Energy. Available online: https://ourworldindata.org/energy (accessed on 21 May 2020).
  19. Kraft, J.; Kraft, A. Relationship between energy and GNP. J. Energy Dev. 1978, 3, 2. [Google Scholar]
  20. Salahuddin, M.; Alam, K.; Ozturk, I.; Sohag, K. The effects of electricity consumption, economic growth, financial development and foreign direct investment on CO2 emissions in Kuwait. Renew. Sustain. Energy Rev. 2018, 81, 2002–2010. [Google Scholar] [CrossRef] [Green Version]
  21. Knight, J.; Yueh, L. Job mobility of residents and migrants in urban China. J. Comp. Econ. 2004, 32, 637–660. [Google Scholar] [CrossRef] [Green Version]
  22. Iyer, L.; Meng, X.; Qian, N.; Zhao, X. Economic Transition and Private-Sector Labor Demand: Evidence from Urban China. SSRN Electron. J. 2013. [Google Scholar] [CrossRef] [Green Version]
  23. Rong, S.; Liu, K.; Huang, S.; Zhang, Q. FDI, labor market flexibility and employment in China. China Econ. Rev. 2020, 61, 101449. [Google Scholar] [CrossRef]
  24. Xu, X.; Li, D.D.; Zhao, M. “Made in China” matters: Integration of the global labor market and the global labor share decline. China Econ. Rev. 2018, 52, 16–29. [Google Scholar] [CrossRef]
  25. Slideshare.Net. 2020. BP Statistical Review of World Energy 2014: Presentation. Available online: https://www.slideshare.net/BP_plc/bp-statistical-review-of-world-energy-2014-presentation (accessed on 24 May 2020).
  26. Li, Z.; Song, Y.; Zhou, A.; Liu, J.; Pang, J.; Zhang, M. Study on the pollution emission efficiency of China’s provincial regions: The perspective of Environmental Kuznets curve. J. Clean. Prod. 2020, 263, 121497. [Google Scholar] [CrossRef]
  27. Zou, B.; Li, S.; Lin, Y.; Wang, B.; Cao, S.; Zhao, X.; Peng, F.; Qin, N.; Guo, Q.; Feng, H.; et al. Efforts in reducing air pollution exposure risk in China: State versus individuals. Environ. Int. 2020, 137, 105504. [Google Scholar] [CrossRef]
  28. Zhu, Y.; Wang, Z.; Yang, J.; Zhu, L. Does renewable energy technological innovation control China’s air pollution? A spatial analysis. J. Clean. Prod. 2020, 250, 119515. [Google Scholar] [CrossRef]
  29. Yang, X.; Hu, H.; Tan, T.; Li, J. China’s renewable energy goals by 2050. Environ. Dev. 2016, 20, 83–90. [Google Scholar] [CrossRef]
  30. Li, P.; Lu, Y.; Wang, J. The effects of fuel standards on air pollution: Evidence from China. J. Dev. Econ. 2020, 146, 102488. [Google Scholar] [CrossRef]
  31. World Population Prospects-Population Division-United Nations. Available online: https://population.un.org/wpp/Download/Standard/Population/ (accessed on 29 May 2020).
  32. Dobermann, T. Energy in Myanmar; International Growth Centre (IGC): Tokyo, Japan, 2016. [Google Scholar]
  33. International Energy Agency (IEA) via data.worldbank.org. 2020. World Development Indicators (WDI) | Data Catalog. Available online: http://data.worldbank.org/data-catalog/world-development-indicators (accessed on 29 May 2020).
  34. CIA, The World Factbook. Available online: https://www.cia.gov/library/publications/the-world-factbook/geos/bm.html (accessed on 22 May 2020).
  35. Bhagavathy, S.M.; Pillai, G.G. PV Microgrid Design for Rural Electrification. Designs 2018, 2, 33. [Google Scholar] [CrossRef] [Green Version]
  36. Castalia Strategic Advisors. Myanmar National Electrification Program (NEP) Roadmap and Investment Prospectus; Castalia Strategic Advisors: Washington, DC, USA, 2014. [Google Scholar]
  37. Siala, K.; Stich, J. Estimation of the PV potential in ASEAN with a high spatial and temporal resolution. Renew. Energy 2016, 88, 445–456. [Google Scholar] [CrossRef]
  38. Ang, B.; Goh, T. Carbon intensity of electricity in ASEAN: Drivers, performance and outlook. Energy Policy 2016, 98, 170–179. [Google Scholar] [CrossRef]
  39. Shi, X. The future of ASEAN energy mix: A SWOT analysis. Renew. Sustain. Energy Rev. 2016, 53, 672–680. [Google Scholar] [CrossRef]
  40. Wu, D.; Aldaoudeyeh, A.M.; Javadi, M.; Ma, F.; Tan, J.; Jiang, J.N. A method to identify weak points of interconnection of renewable energy resources. Int. J. Electr. Power Energy Syst. 2019, 110, 72–82. [Google Scholar] [CrossRef]
  41. Monteiro, V.; Pinto, J.G.; Afonso, J.L. Improved vehicle-for-grid (iV4G) mode: Novel operation mode for EVs battery chargers in smart grids. Int. J. Electr. Power Energy Syst. 2019, 110, 579–587. [Google Scholar] [CrossRef]
  42. Tina, G.M.; Garozzo, D.; Siano, P. Scheduling of PV inverter reactive power set-point and battery charge/discharge profile for voltage regulation in low voltage networks. Int. J. Electr. Power Energy Syst. 2019, 107, 131–139. [Google Scholar] [CrossRef]
  43. Tévar, G.; Gómez-Expósito, A.; Arcos-Vargas, A.; Rodríguez-Montañés, M. Influence of rooftop PV generation on net demand, losses and network congestions: A case study. Int. J. Electr. Power Energy Syst. 2019, 106, 68–86. [Google Scholar] [CrossRef]
  44. Foster, J.; Liu, X.; McLoone, S. Load forecasting techniques for power systems with high levels of unmetered renewable generation: A comparative study. IFAC Pap. 2018, 51, 109–114. [Google Scholar] [CrossRef]
  45. Hippert, H.; Pedreira, C.E.; Souza, R. Neural networks for short-term load forecasting: A review and evaluation. IEEE Trans. Power Syst. 2001, 16, 44–55. [Google Scholar] [CrossRef]
  46. Xia, C.; Wang, J.; Mcmenemy, K. Short, medium and long term load forecasting model and virtual load forecaster based on radial basis function neural networks. Int. J. Electr. Power Energy Syst. 2010, 32, 743–750. [Google Scholar] [CrossRef] [Green Version]
  47. Pillai, G.G.; Naser, H.A.Y. Techno-economic potential of largescale photovoltaics in Bahrain. Sustain. Energy Technol. Assess. 2018, 27, 40–45. [Google Scholar] [CrossRef] [Green Version]
  48. Molin, A.; Schneider, S.; Rohdin, P.; Moshfegh, B. Assessing a regional building applied PV potential – Spatial and dynamic analysis of supply and load matching. Renew. Energy 2016, 91, 261–274. [Google Scholar] [CrossRef]
  49. Sørnes, K.; Fredriksen, E.; Tunheim, K.; Sartori, I. Analysis of the impact resolution has on load matching in the Norwegian context. Energy Procedia 2017, 132, 610–615. [Google Scholar] [CrossRef]
  50. Lopes, R.A.; Martins, J.; Aelenei, D.; Lima, C.P. A cooperative net zero energy community to improve load matching. Renew. Energy 2016, 93, 1–13. [Google Scholar] [CrossRef]
  51. Michael, G. Update on Edition 2 of IEC 61724: PV System Performance Monitoring. Available online: https://www.nrel.gov/pv/assets/pdfs/2014_pvmrw_84_gostein.pdf (accessed on 20 May 2020).
  52. Mararakanye, N.; Bekker, B. Renewable energy integration impacts within the context of generator type, penetration level and grid characteristics. Renew. Sustain. Energy Rev. 2019, 108, 441–451. [Google Scholar] [CrossRef]
  53. Graabak, I.; Korpås, M.; Jaehnert, S.; Belsnes, M. Balancing future variable wind and solar power production in Central-West Europe with Norwegian hydropower. Energy 2019, 168, 870–882. [Google Scholar] [CrossRef]
  54. Allison, M.; Akakabota, E.; Pillai, G. Future load profiles under scenarios of increasing renewable generation and electric transport. In Proceedings of the 2018 5th International Conference on Renewable Energy: Generation and Applications (ICREGA), Los Alamitos, CA, USA, 25 February 2018; pp. 296–300. [Google Scholar]
  55. Zhang, G.; Patuwo, B.E.; Hu, M.Y. Forecasting with artificial neural networks: The state of the art. Int. J. Forecast. 1998, 14, 35–62. [Google Scholar] [CrossRef]
  56. Nespoli, A.; Ogliari, E.; Dolara, A.; Grimaccia, F.; Leva, S.; Mussetta, M. Validation of ANN Training Approaches for Day-Ahead Photovoltaic Forecasts. In Proceedings of the 2018 International Joint Conference on Neural Networks (IJCNN), Los Alamitos, CA, USA, 8–13 July 2018; pp. 1–6. [Google Scholar]
  57. Toghraie, D.; Sina, N.; Jolfaei, N.A.; Hajian, M.; Afrand, M. Designing an Artificial Neural Network (ANN) to predict the viscosity of Silver/Ethylene glycol nanofluid at different temperatures and volume fraction of nanoparticles. Phys. A Stat. Mech. Its Appl. 2019, 534, 122142. [Google Scholar] [CrossRef]
  58. Tran, V.-L.; Thai, D.-K.; Kim, S.-E. Application of ANN in predicting ACC of SCFST column. Compos. Struct. 2019, 228, 111332. [Google Scholar] [CrossRef]
  59. Li, F.; Wang, W.; Xu, J.; Yi, J.; Wang, Q. Comparative study on vulnerability assessment for urban buried gas pipeline network based on SVM and ANN methods. Process. Saf. Environ. Prot. 2019, 122, 23–32. [Google Scholar] [CrossRef]
  60. Souza, P.; Dotto, G.L.; Salau, N.P.G. Artificial neural network (ANN) and adaptive neuro-fuzzy interference system (ANFIS) modelling for nickel adsorption onto agro-wastes and commercial activated carbon. J. Environ. Chem. Eng. 2018, 6, 7152–7160. [Google Scholar] [CrossRef]
  61. Motahar, S. Experimental study and ANN-based prediction of melting heat transfer in a uniform heat flux PCM enclosure. J. Energy Storage 2020, 30, 101535. [Google Scholar] [CrossRef]
  62. Notton, G.; Voyant, C.; Fouilloy, A.; Duchaud, J.L.; Nivet, M.L. Some Applications of ANN to Solar Radiation Estimation and Forecasting for Energy Applications. Appl. Sci. 2019, 9, 209. [Google Scholar] [CrossRef] [Green Version]
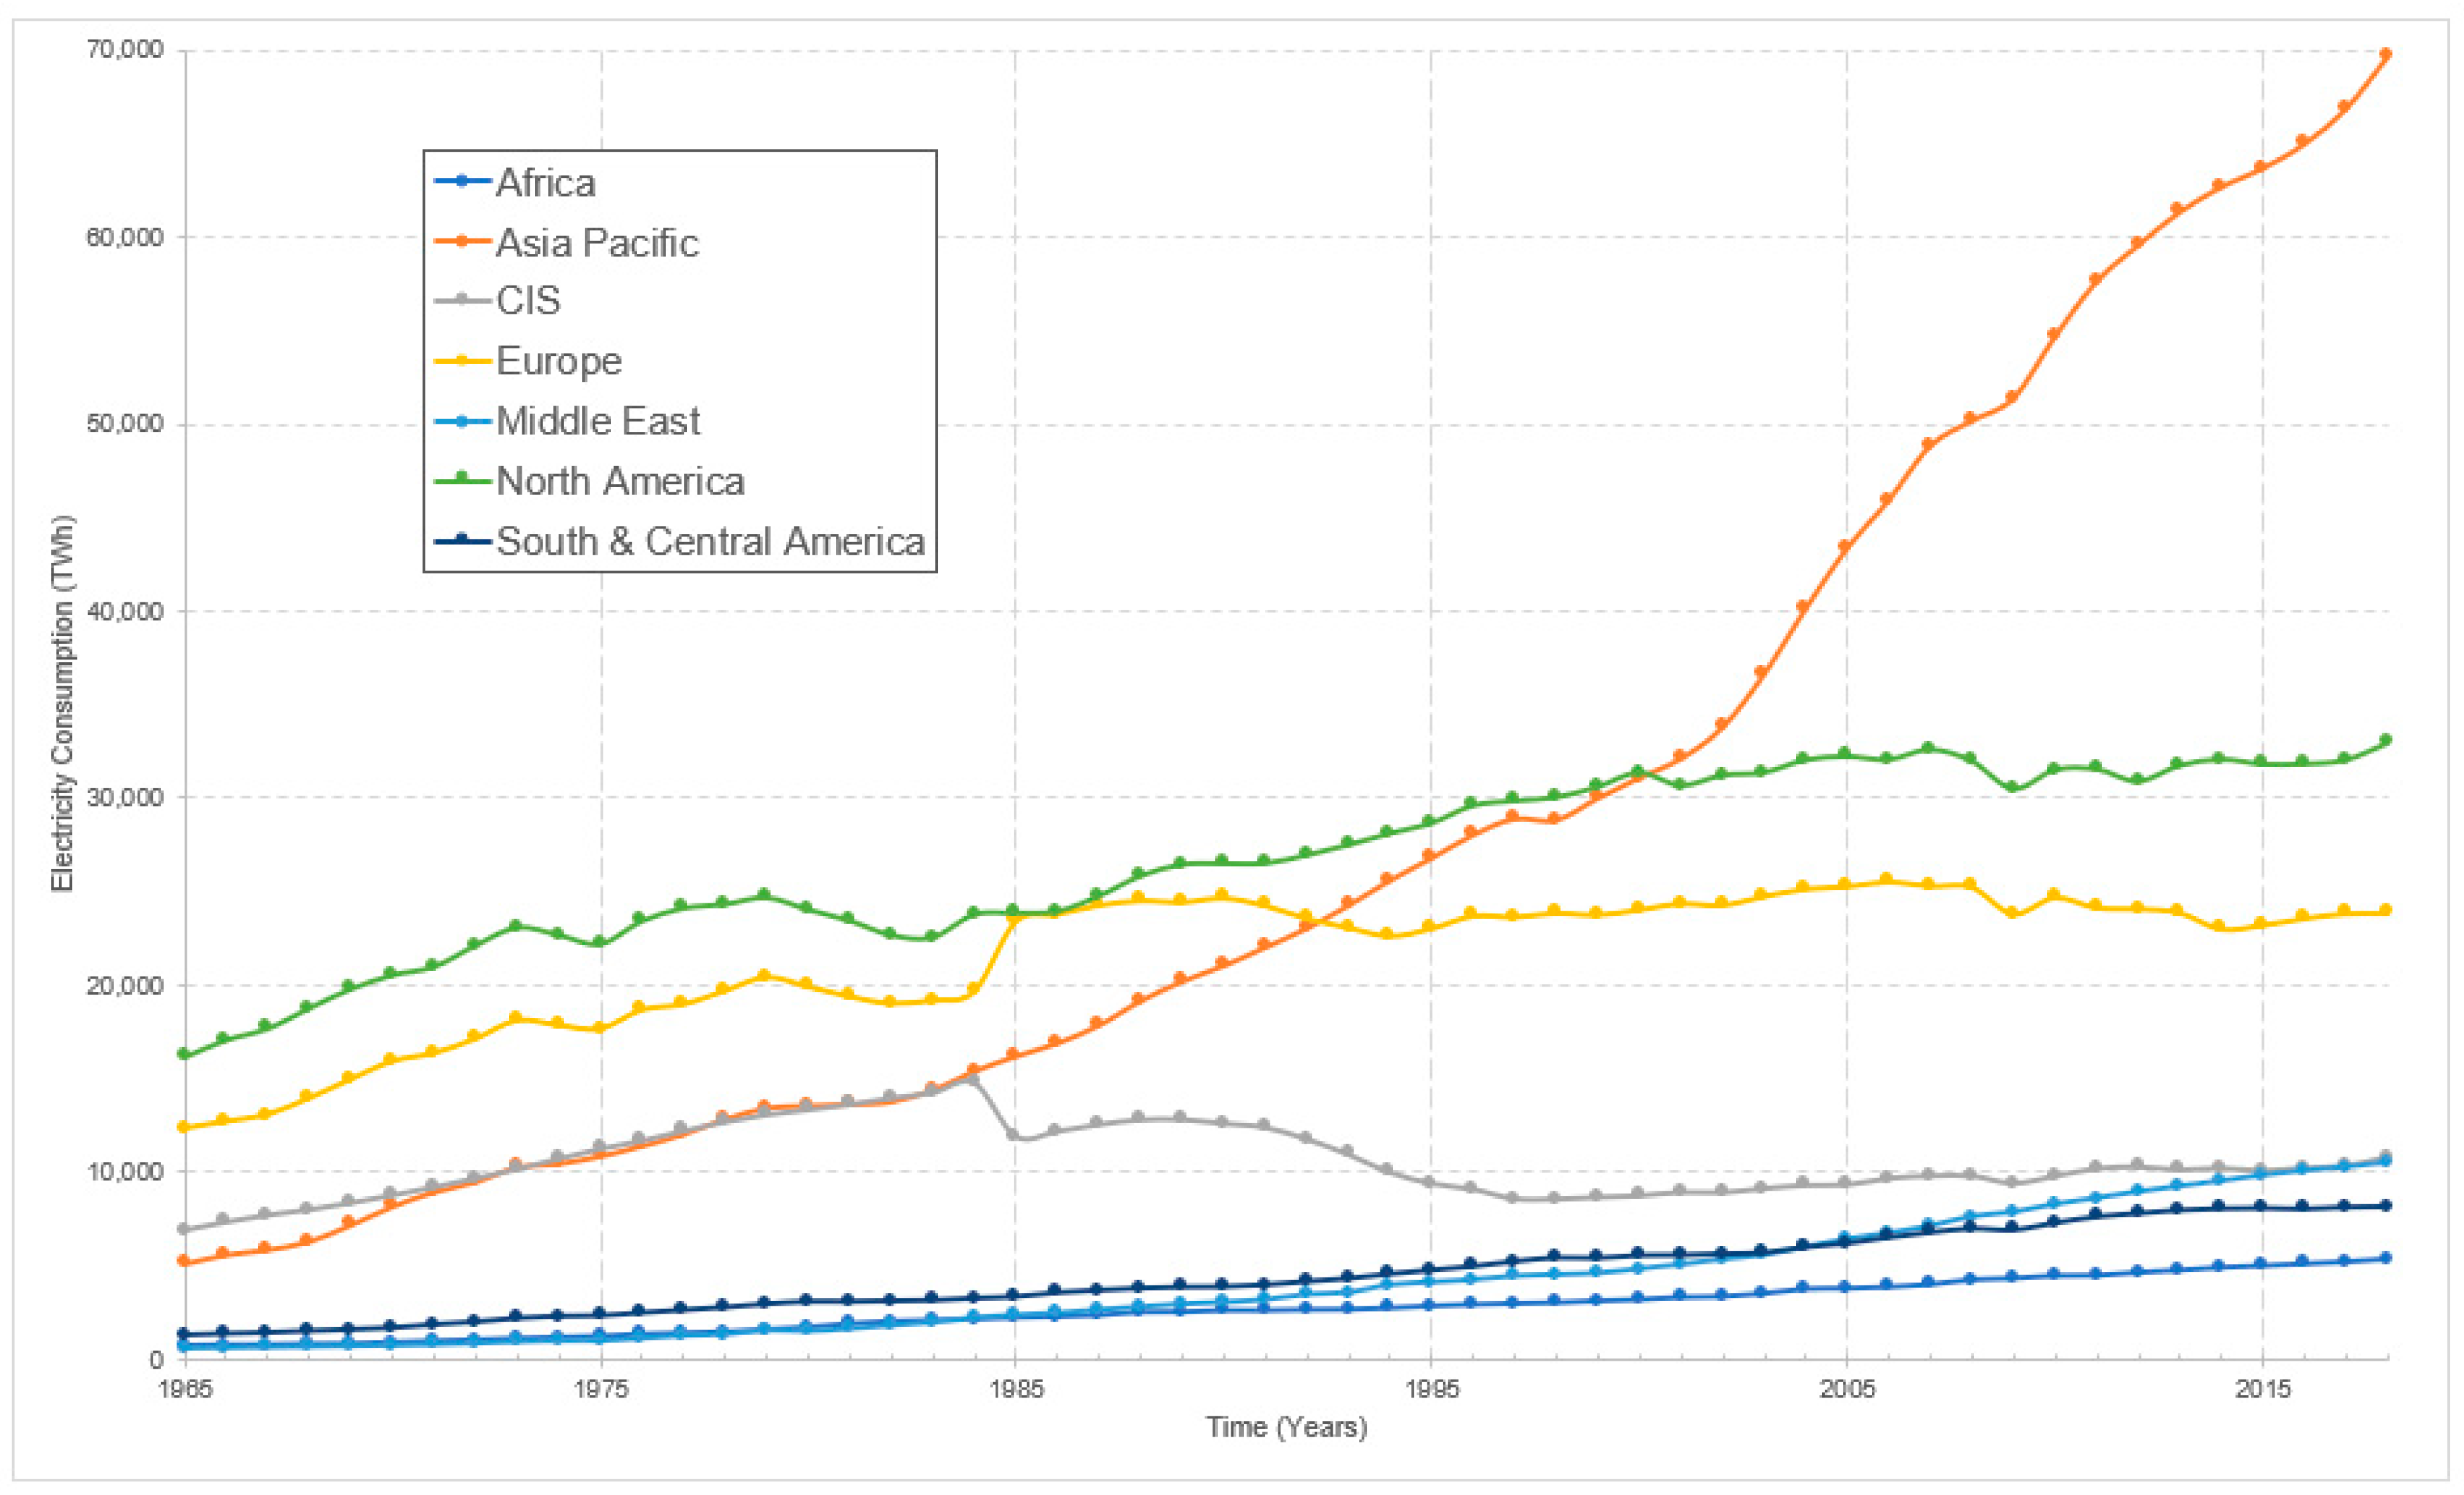
Figure 1. Historical global electricity consumption [18].
Designs 04 00020 g001
Figure 2. Electricity consumption in China (1965–2018) [18].
Designs 04 00020 g002
Figure 3. Historical global electricity consumption by region [18].
Designs 04 00020 g003
Figure 4. Electrification rate in Myanmar [36].
Designs 04 00020 g004
Figure 5. Averaged synthetic daily load profiles for urban Yangon city.
Designs 04 00020 g005
Figure 6. Energy injected into the grid in the month of June.
Designs 04 00020 g006
Figure 7. Energy injected into the grid in the month of February.
Designs 04 00020 g007
Figure 8. Performance ratio.
Designs 04 00020 g008
Figure 9. System loss diagram.
Designs 04 00020 g009
Figure 10. Normalized production.
Designs 04 00020 g010
Figure 11. Averaged daily photovoltaic (PV) output profiles.
Designs 04 00020 g011
Figure 12. Load matching in 2020.
Designs 04 00020 g012
Figure 13. Load matching in 2025.
Designs 04 00020 g013
Figure 14. Load matching in 2030.
Designs 04 00020 g014
Figure 15. Solar supply rate and load matching.
Designs 04 00020 g015
Figure 16. Flowchart: proposed systematic design approach.
Designs 04 00020 g016
Figure 17. Neuron test—Broyden Fletcher Goldfarb Shanno quasi-Newton backpropagation (Trainbfgs) algorithm.
Designs 04 00020 g017
Table 1. Percentage of global electricity consumption by region [18].
YearAfricaAsia PacificCommonwealth
of Independent
States
EuropeMiddle EastNorth AmericaSouth and Central America
19651.6511.0216.0228.581.337.552.97
20002.9228.598.0422.14.4128.835.1
20183.3343.176.7114.796.5120.435.06
Table 2. Top 10 consumers of electricity per capita [33,34].
RankCountry2020 Population (Millions)Energy Consumption (kWh Per Capita)
1Iceland0.3453,832
2Norway5.4223,000
3Bahrain1.719,597
4Kuwait4.2715,591
5Canada37.7415,588
6Finland5.5415,250
7Qatar2.8814,782
8Luxembourg0.6313,915
9Sweden10.0113,480
10United States33012,994
Table 3. Climate conditions in Yangon city.
SeasonAvg. Min. Temperature(°C)Avg. Max. Temperature (°C)Relative Humidity (%)Sunlight Hours
Cool19.8326611.4
Hot23.7357112.2
Rainy2429.885.812.5
Table 4. Photovoltaic (PV) installation details.
LocationLatitude16.8° N
Longitude96.1° E
Altitude4 m
SummaryModule TypeGeneric 250W 25V 60 cell Si-poly
Number of Modules4000
Module Area6508 m2
Array Design250 strings of 16 modules
Inverter Typegeneric 500kW 320–700V LF Tr 50 Hz
No of Inverters2
OptimisationPlane Tilt24°
Azimuth
Table 5. Daily average energy injected into the grid.
MonthSeasonEnergy Injected into Grid
(kWh/day)
JanuaryCool5551
FebruaryCool5876
MarchHot5648
AprilHot5352
MayHot3646
JuneRainy2974
JulyRainy3017
AugustRainy3100
SeptemberRainy3545
OctoberRainy4534
NovemberCool5207
DecemberCool5372
Table 6. Algorithm performance matrix.
AlgorithmPerformanceRegressionOverall
BestWorstAvg.BestWorstAvg.ScoreRank
RunRunRunRun
Trainlm132212111
Trainbr271121142
Trainbfg323333173
Trainrp6144114304
Traincgb846645335
Trainscg755587376
Traincgf13128866537
Traincgp12137759538
Trainoss11111010710599
Traingdx109111110116210
Traingda58131312126311
Traingd410121213136412
Trainr151599986513
Trainb96151515157514
Trains1414141414148415
Traingdm916161616168916

