
Assessing the Effects of Phytoplankton Structure on Zooplankton Communities in Different Types of Urban Lakes

 , , , and
Abstract
:1. Introduction
2. Materials and Methods
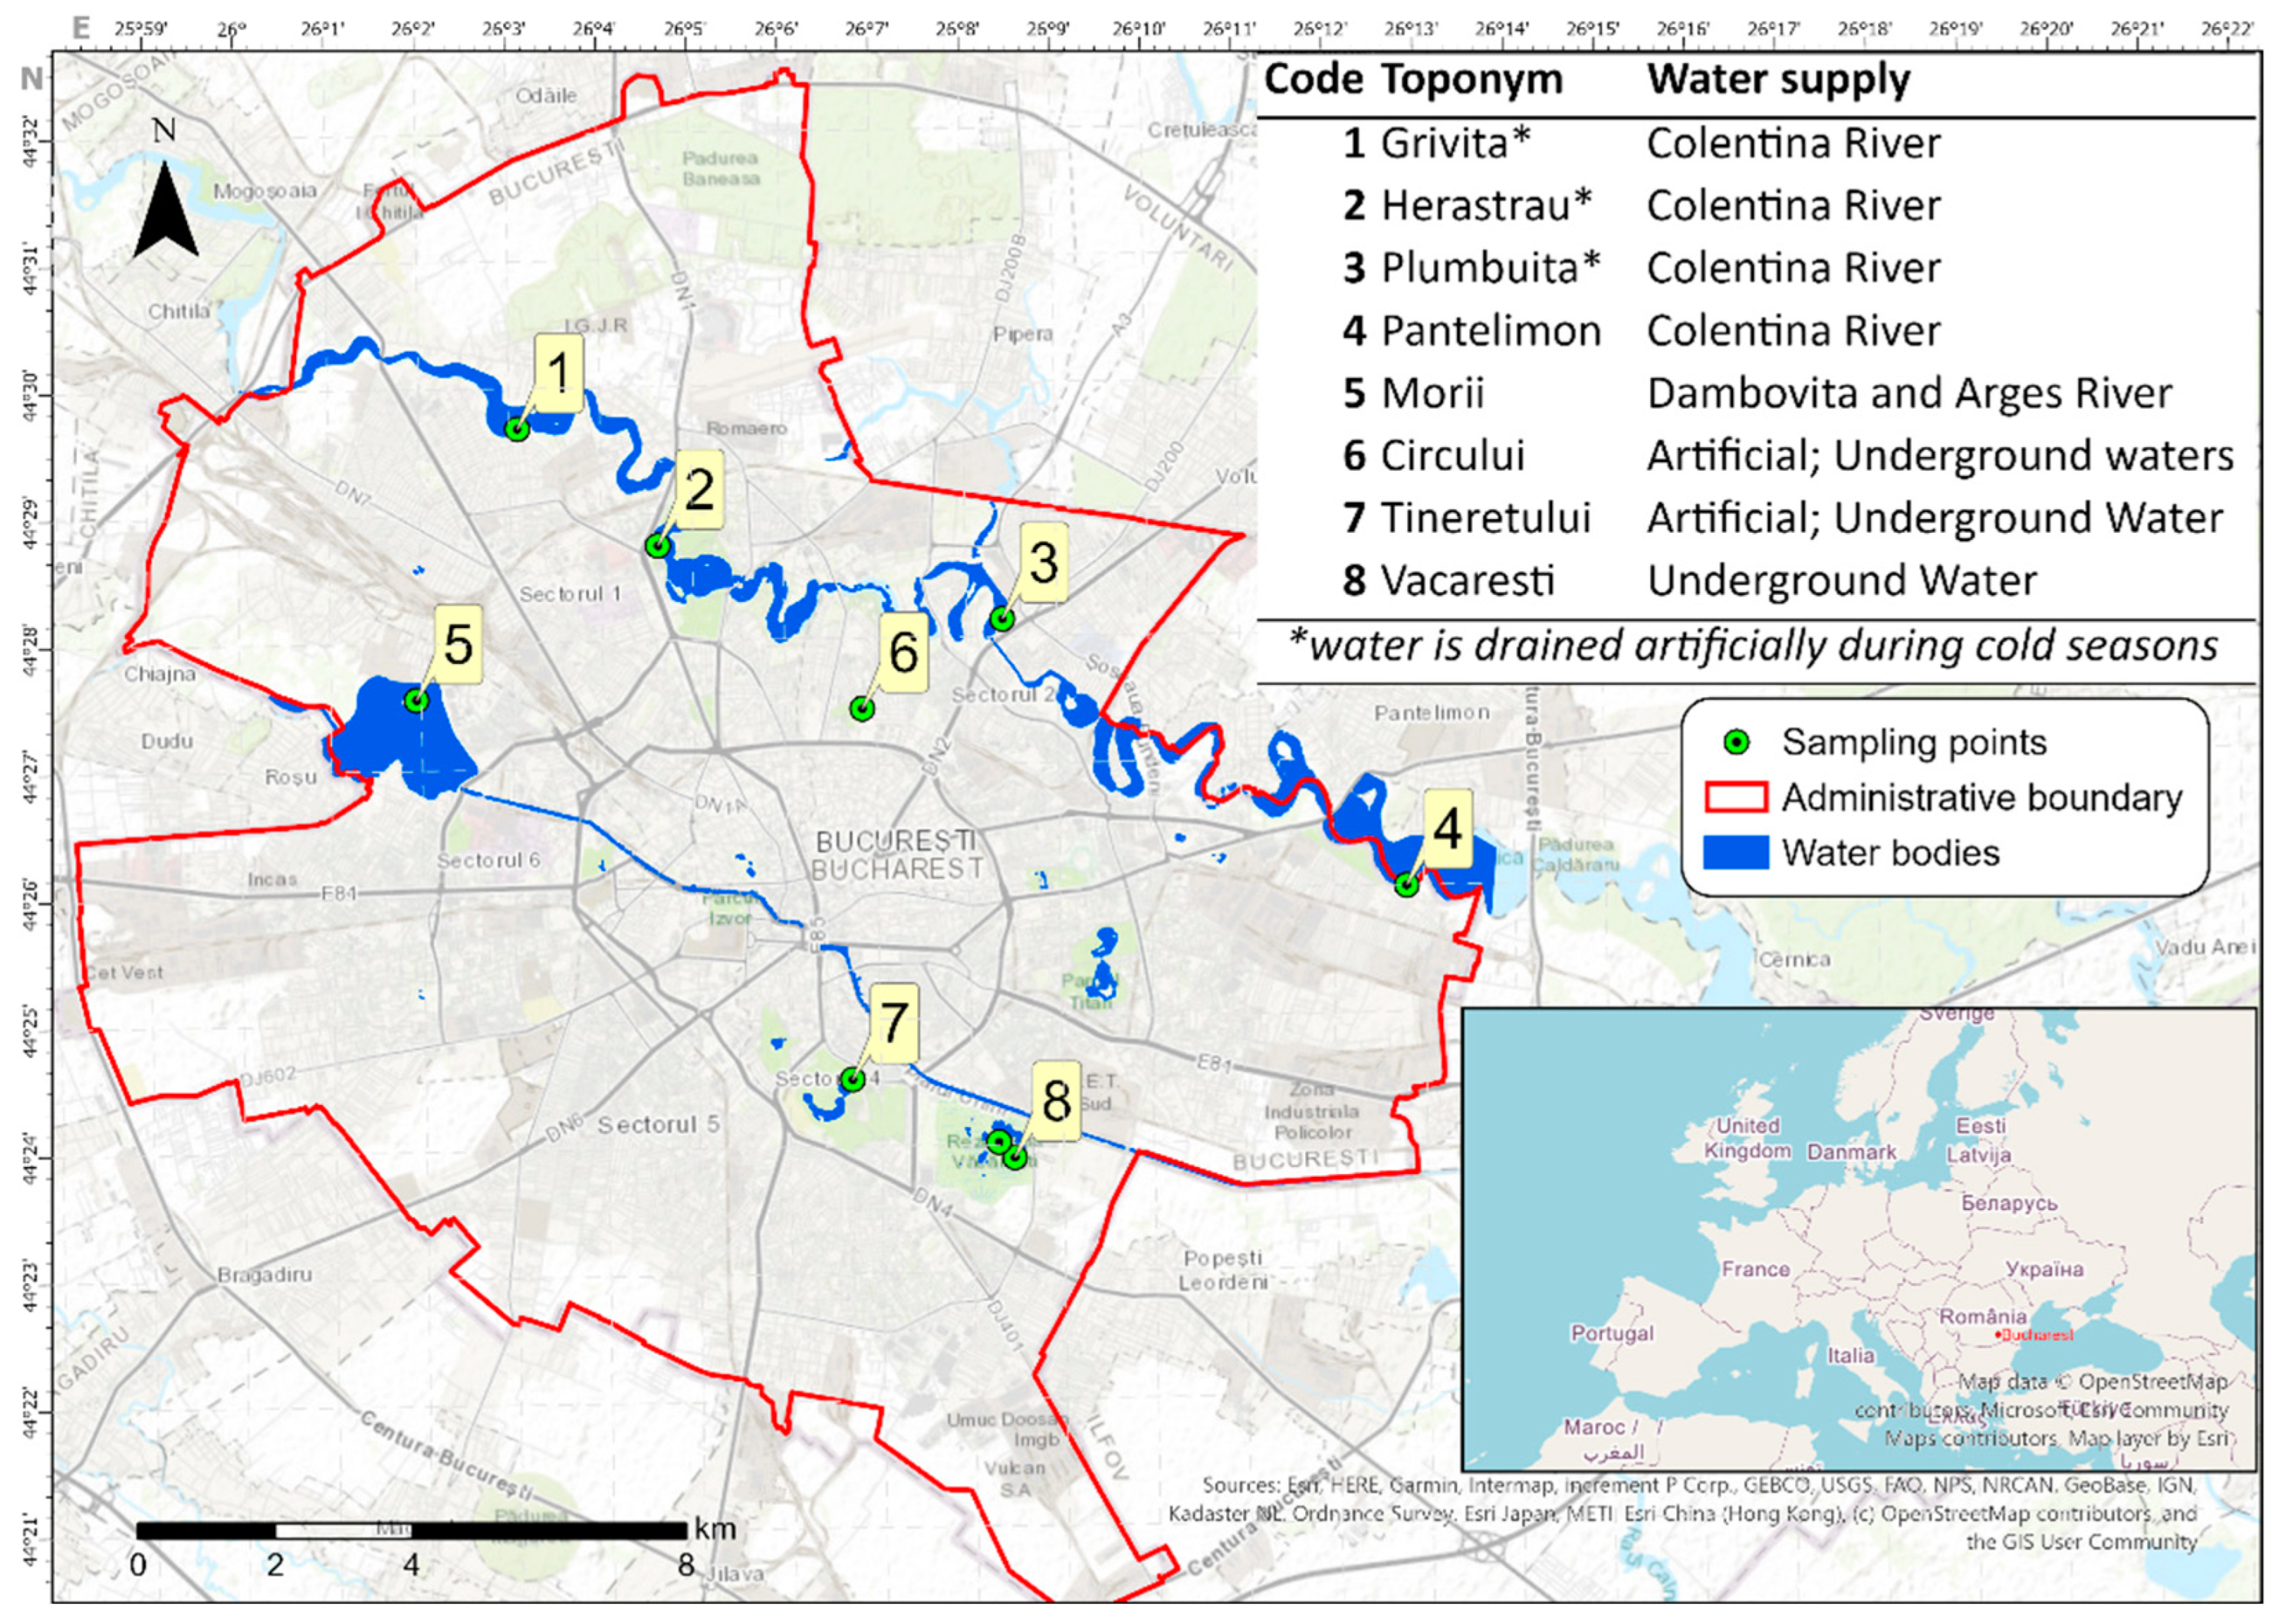
2.1. Study Site
2.2. Sampling and Laboratory Analysis
2.3. Nutrient Samples and Phytoplankton Community
2.4. Water Quality Parameters
2.5. Zooplankton Community
2.6. Statistical Analysis
3. Results
3.1. In Situ Physicochemical Parameters
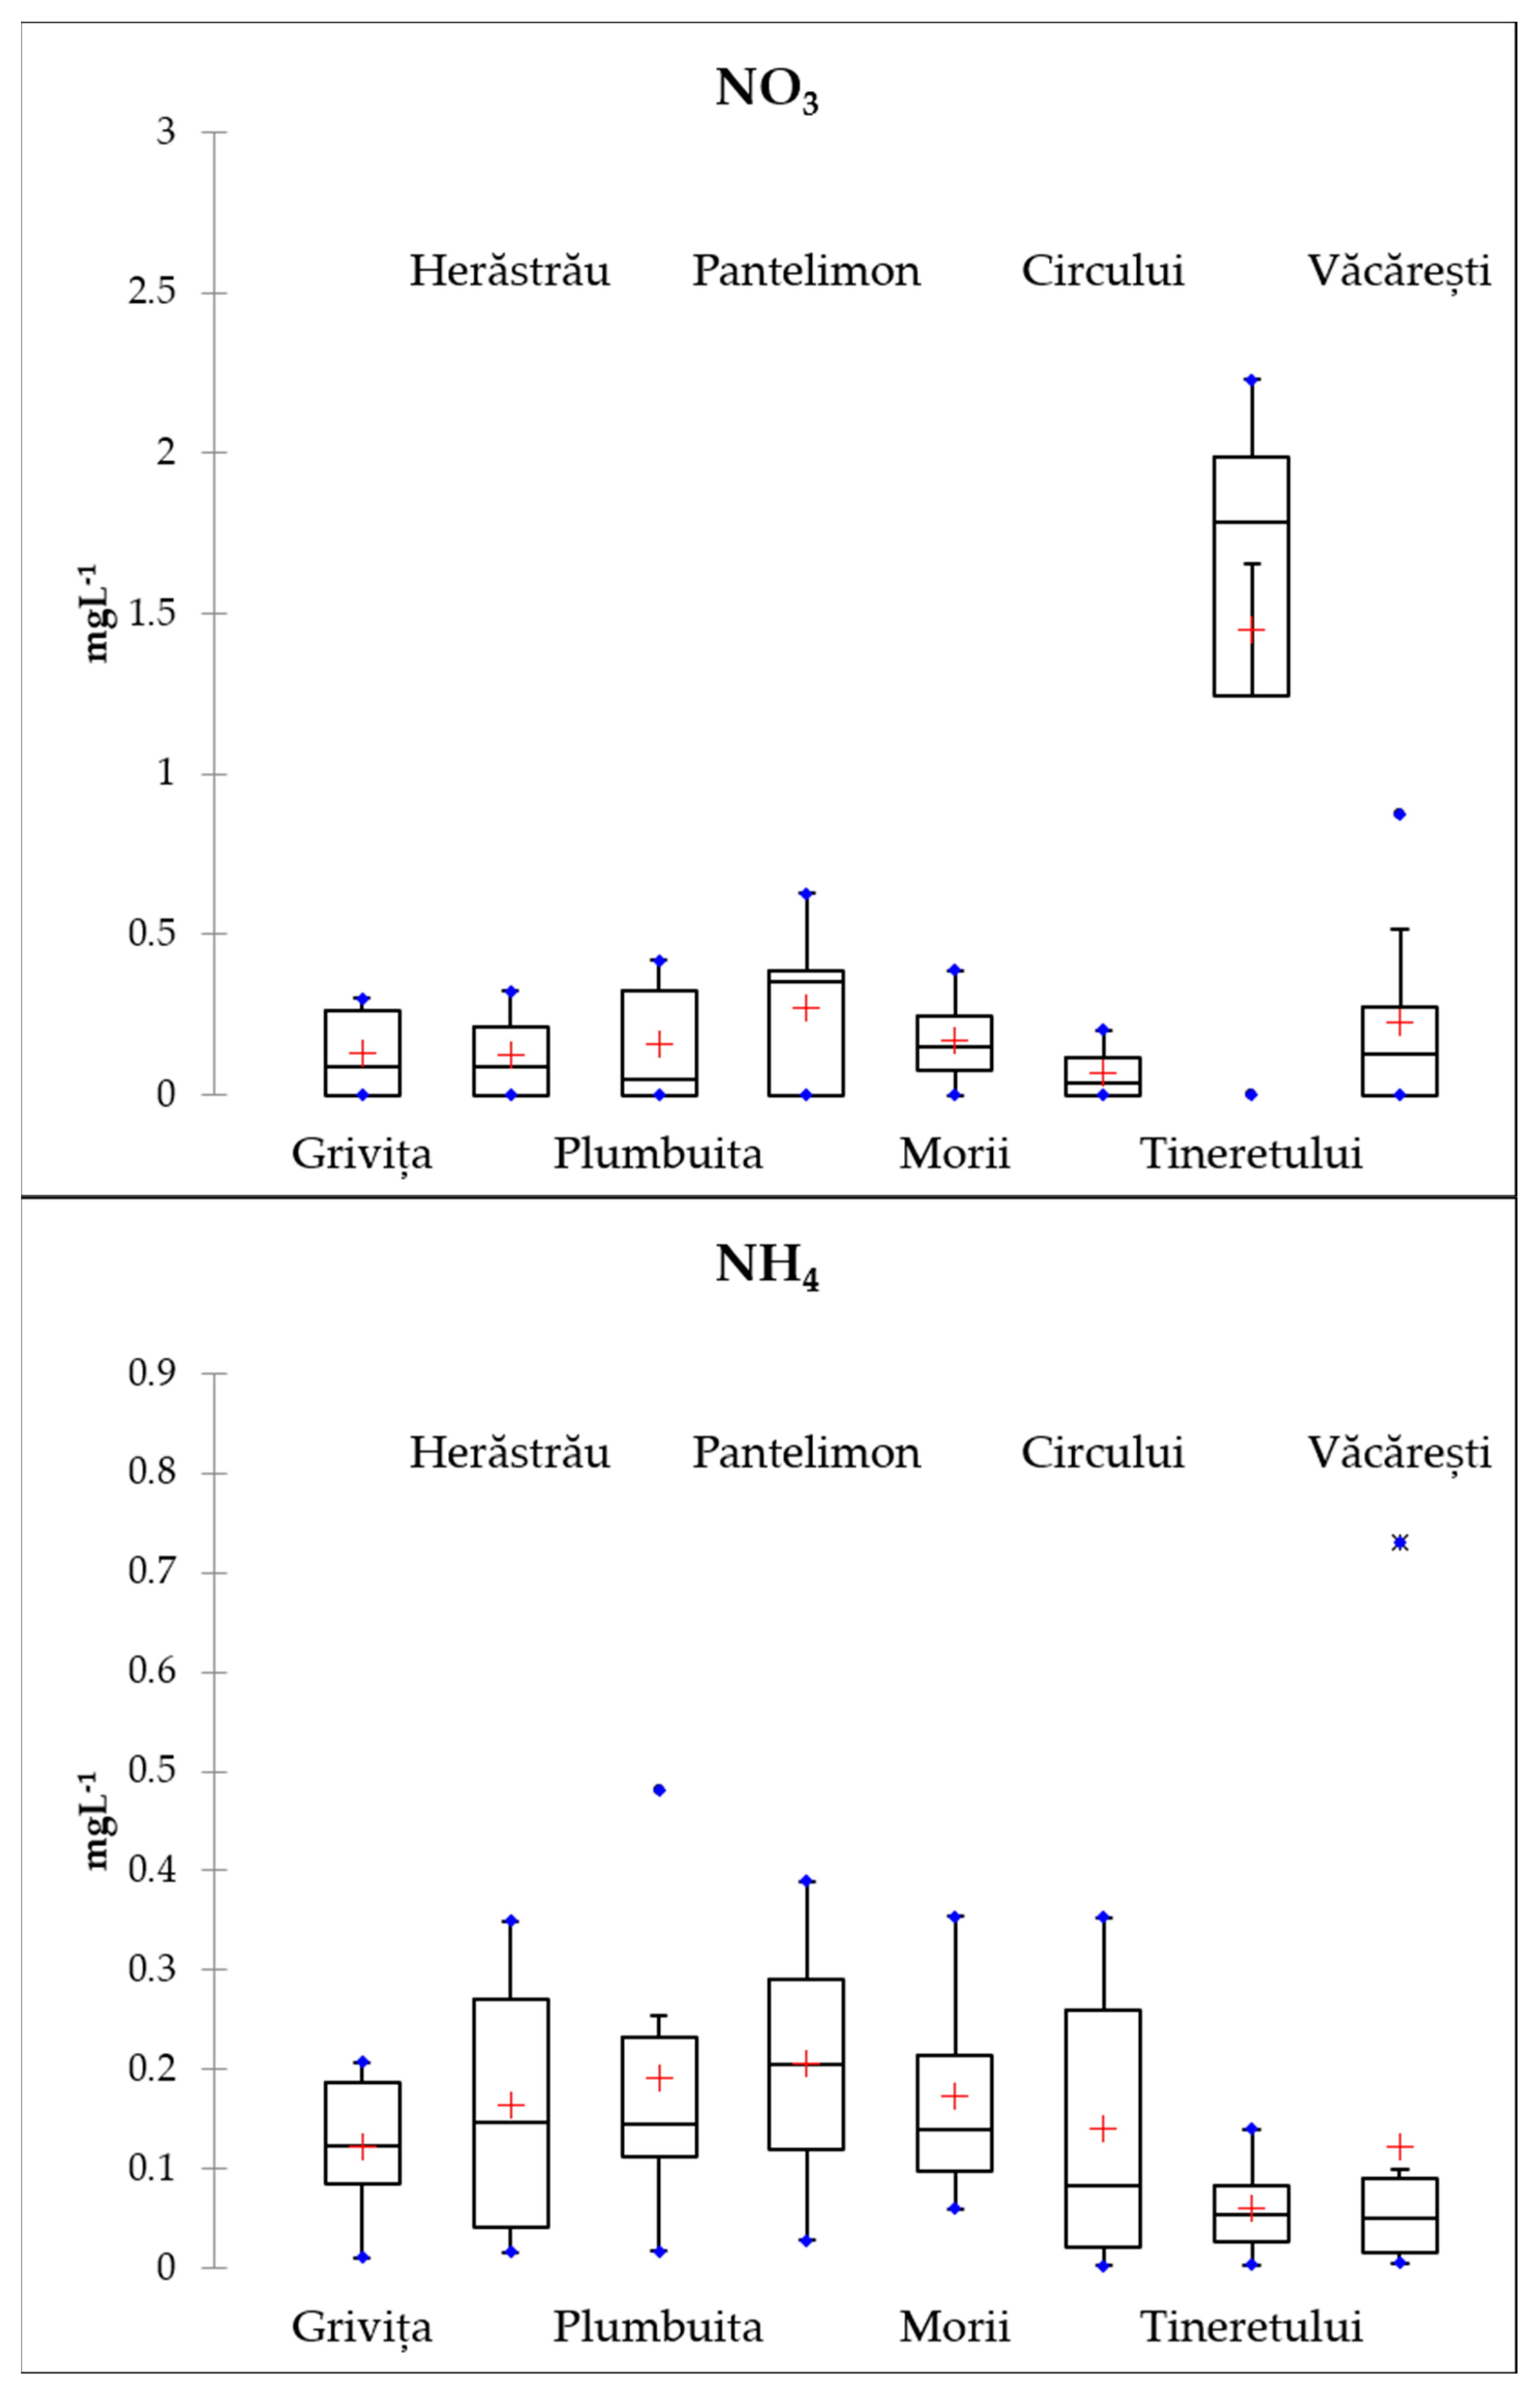
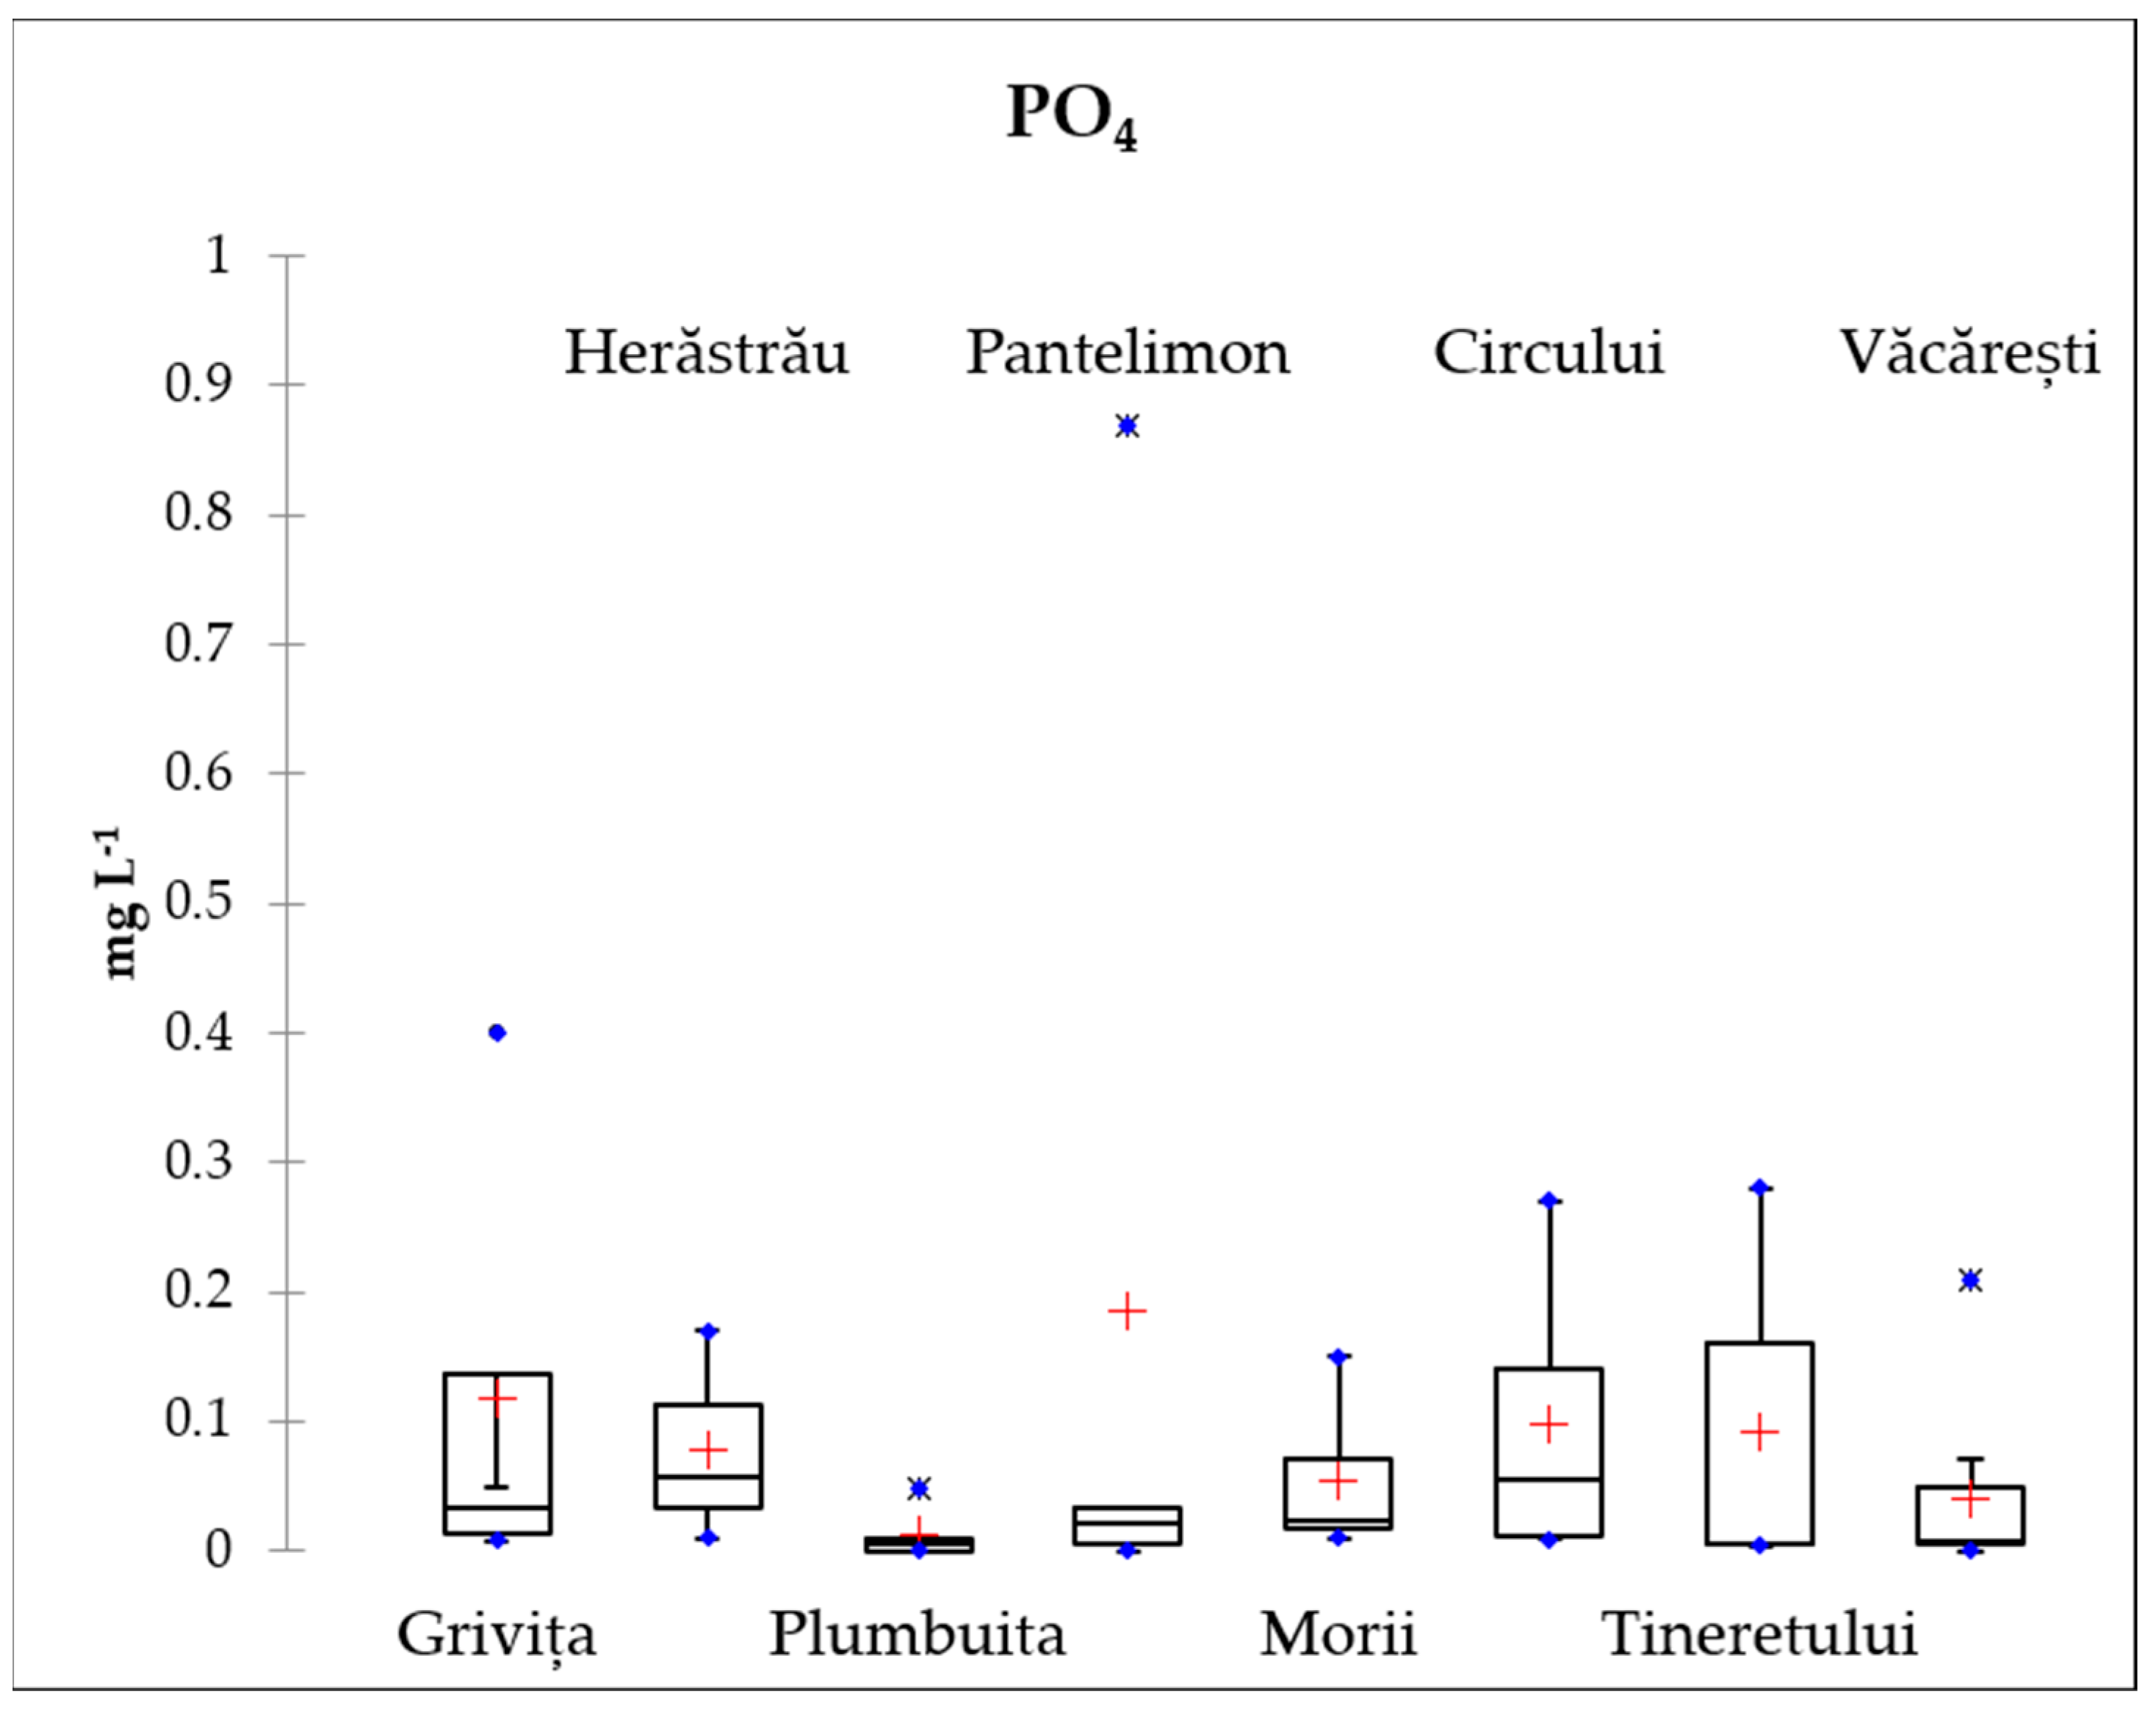
3.2. Nutrients
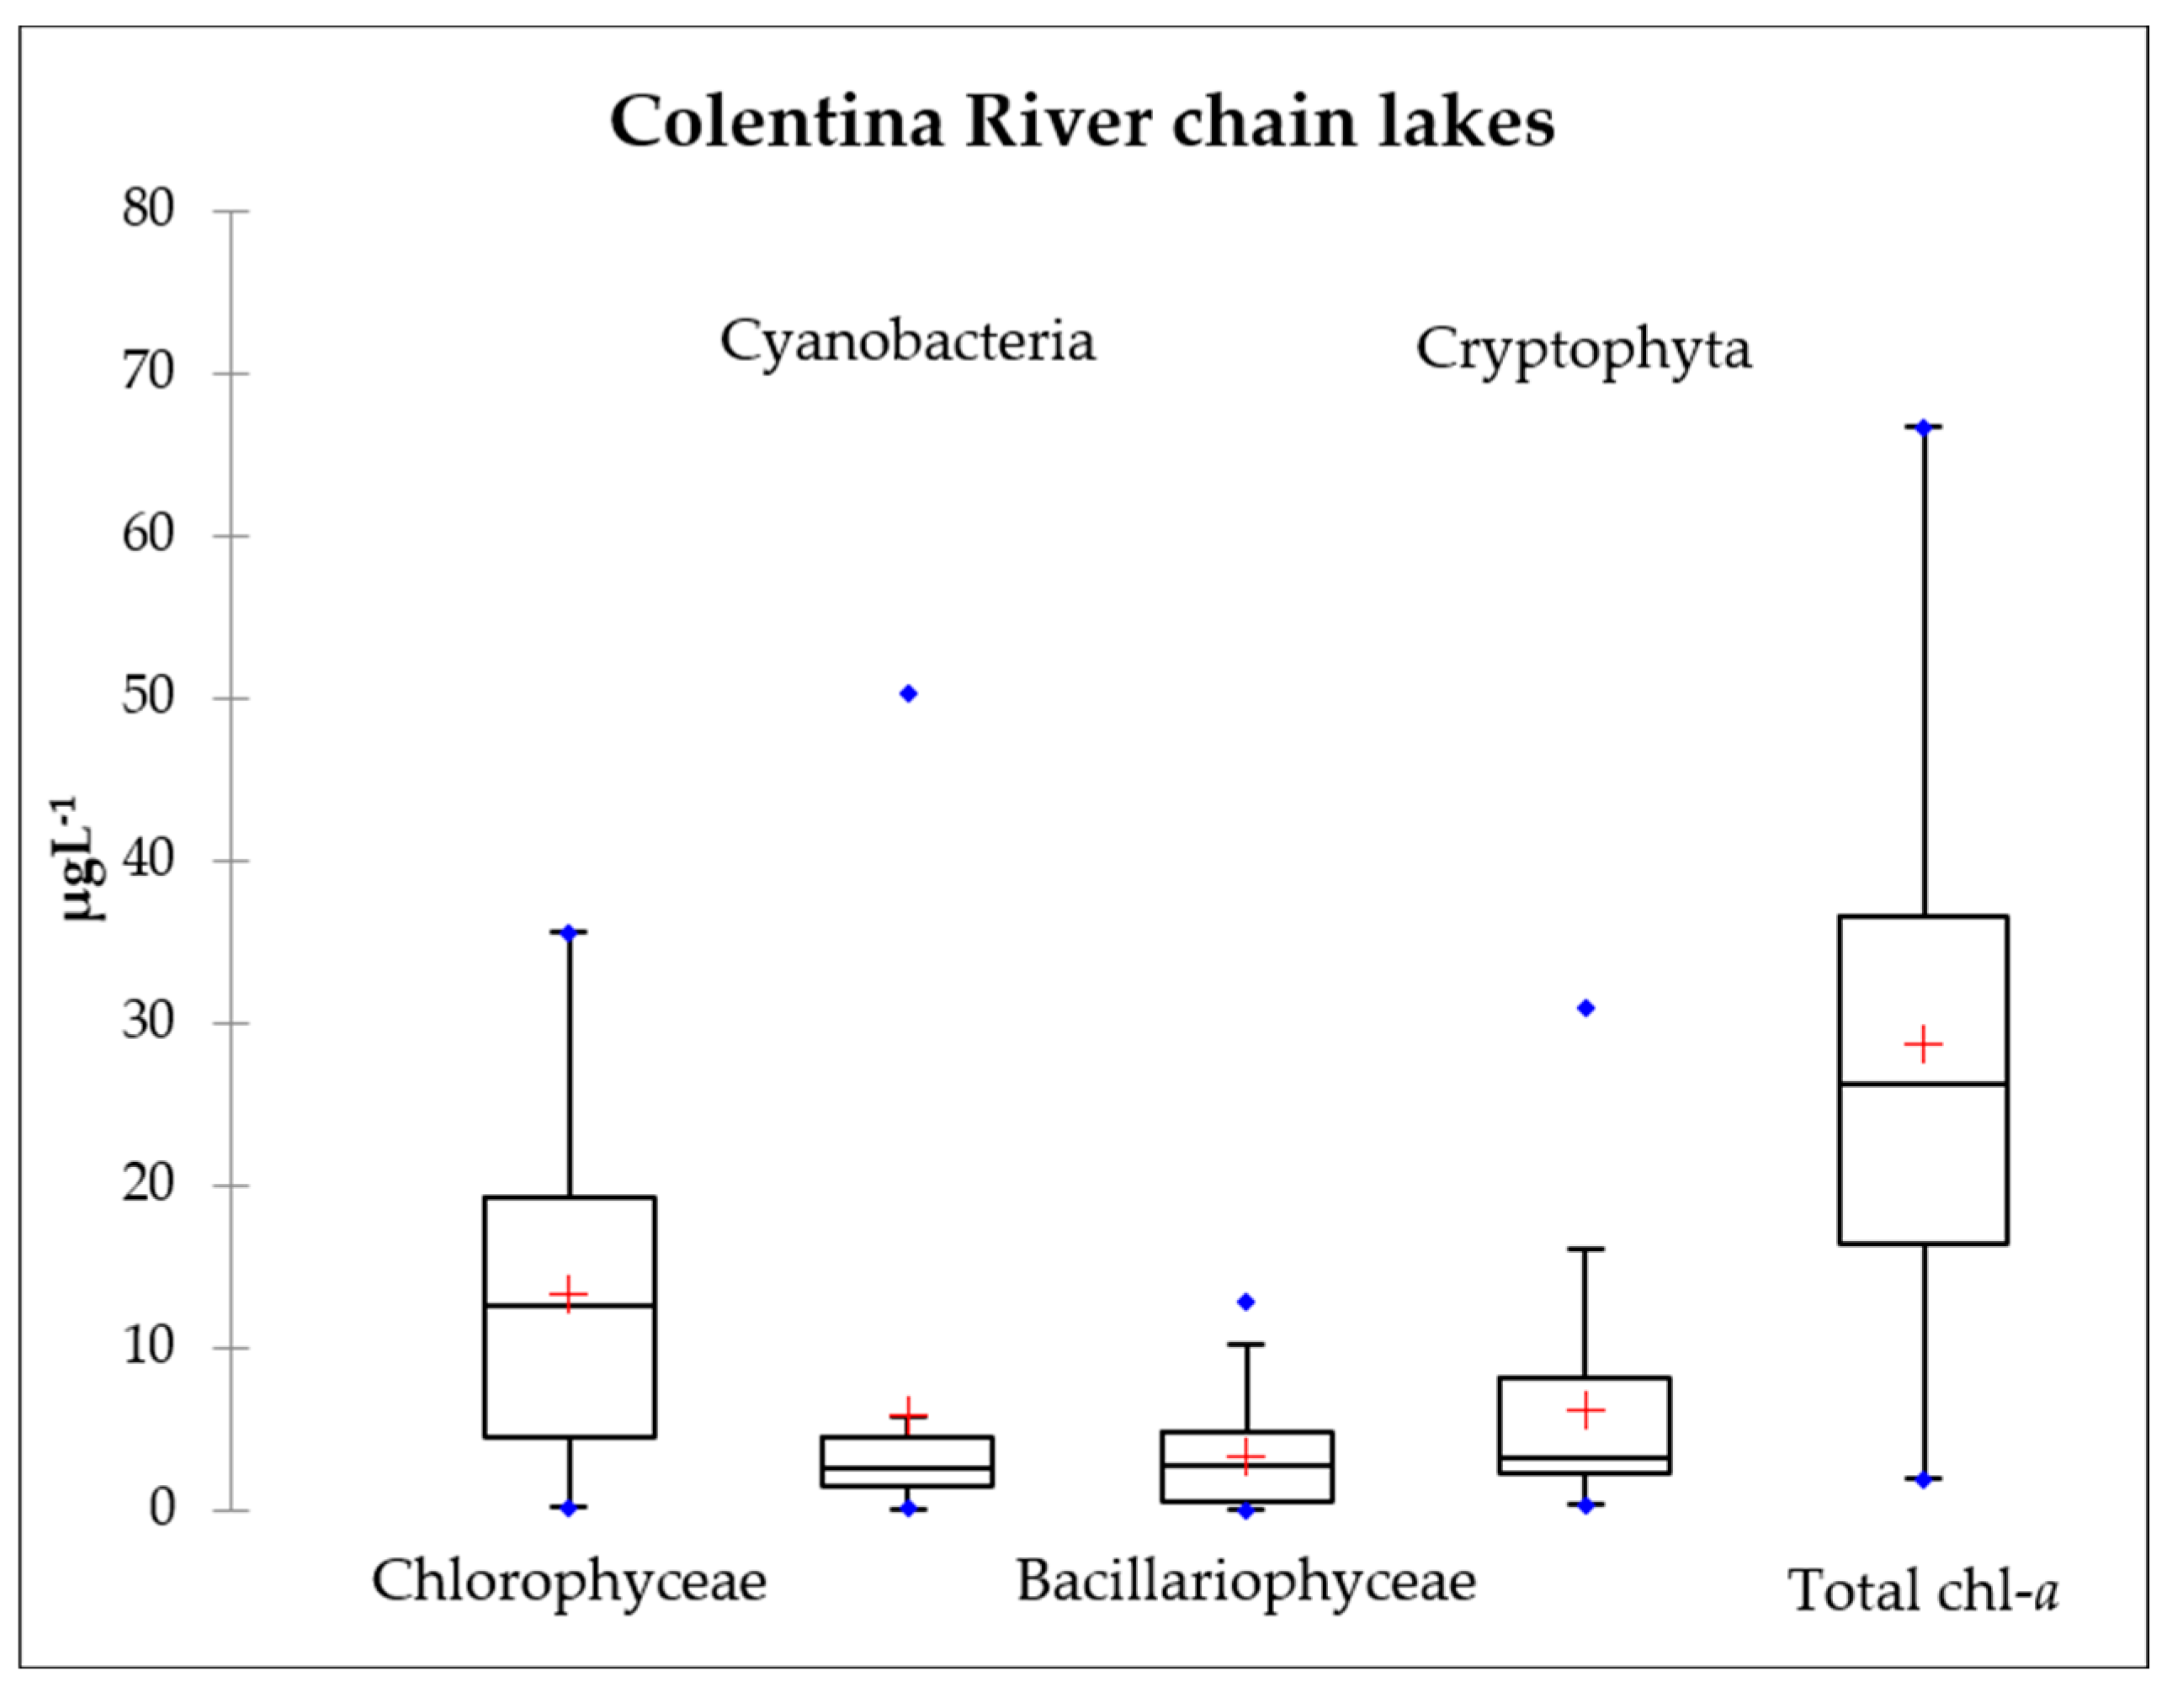
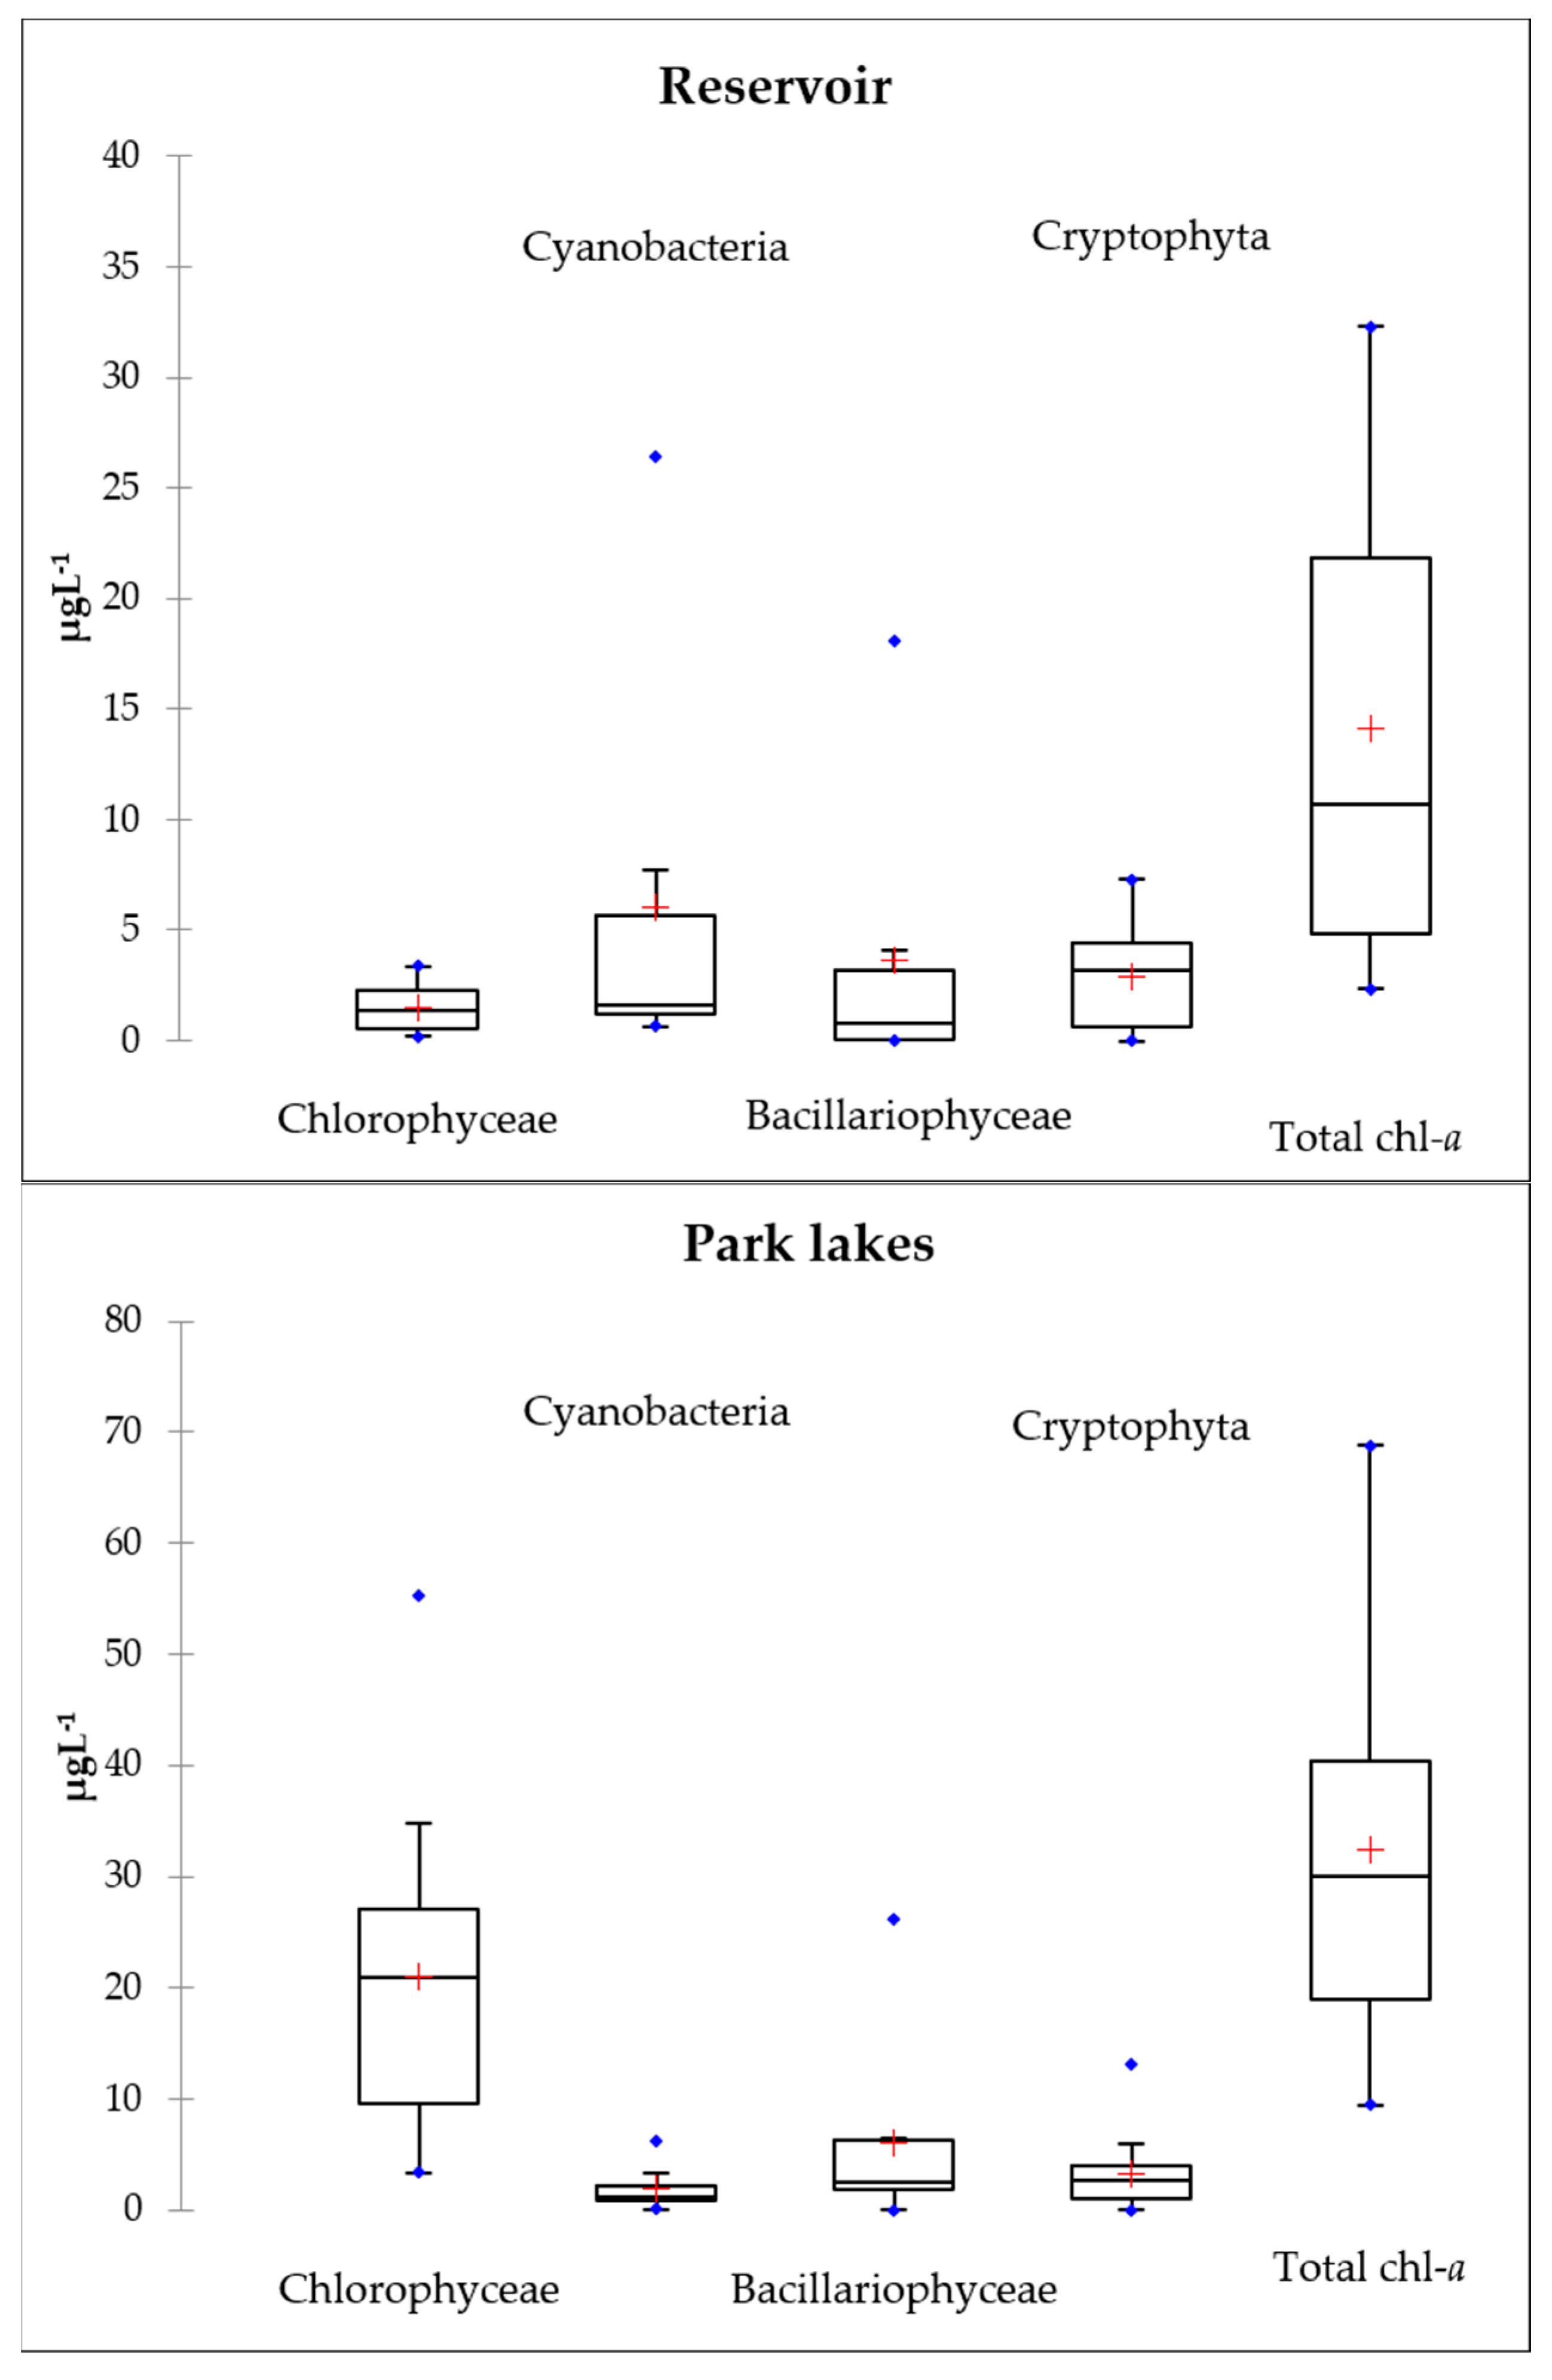
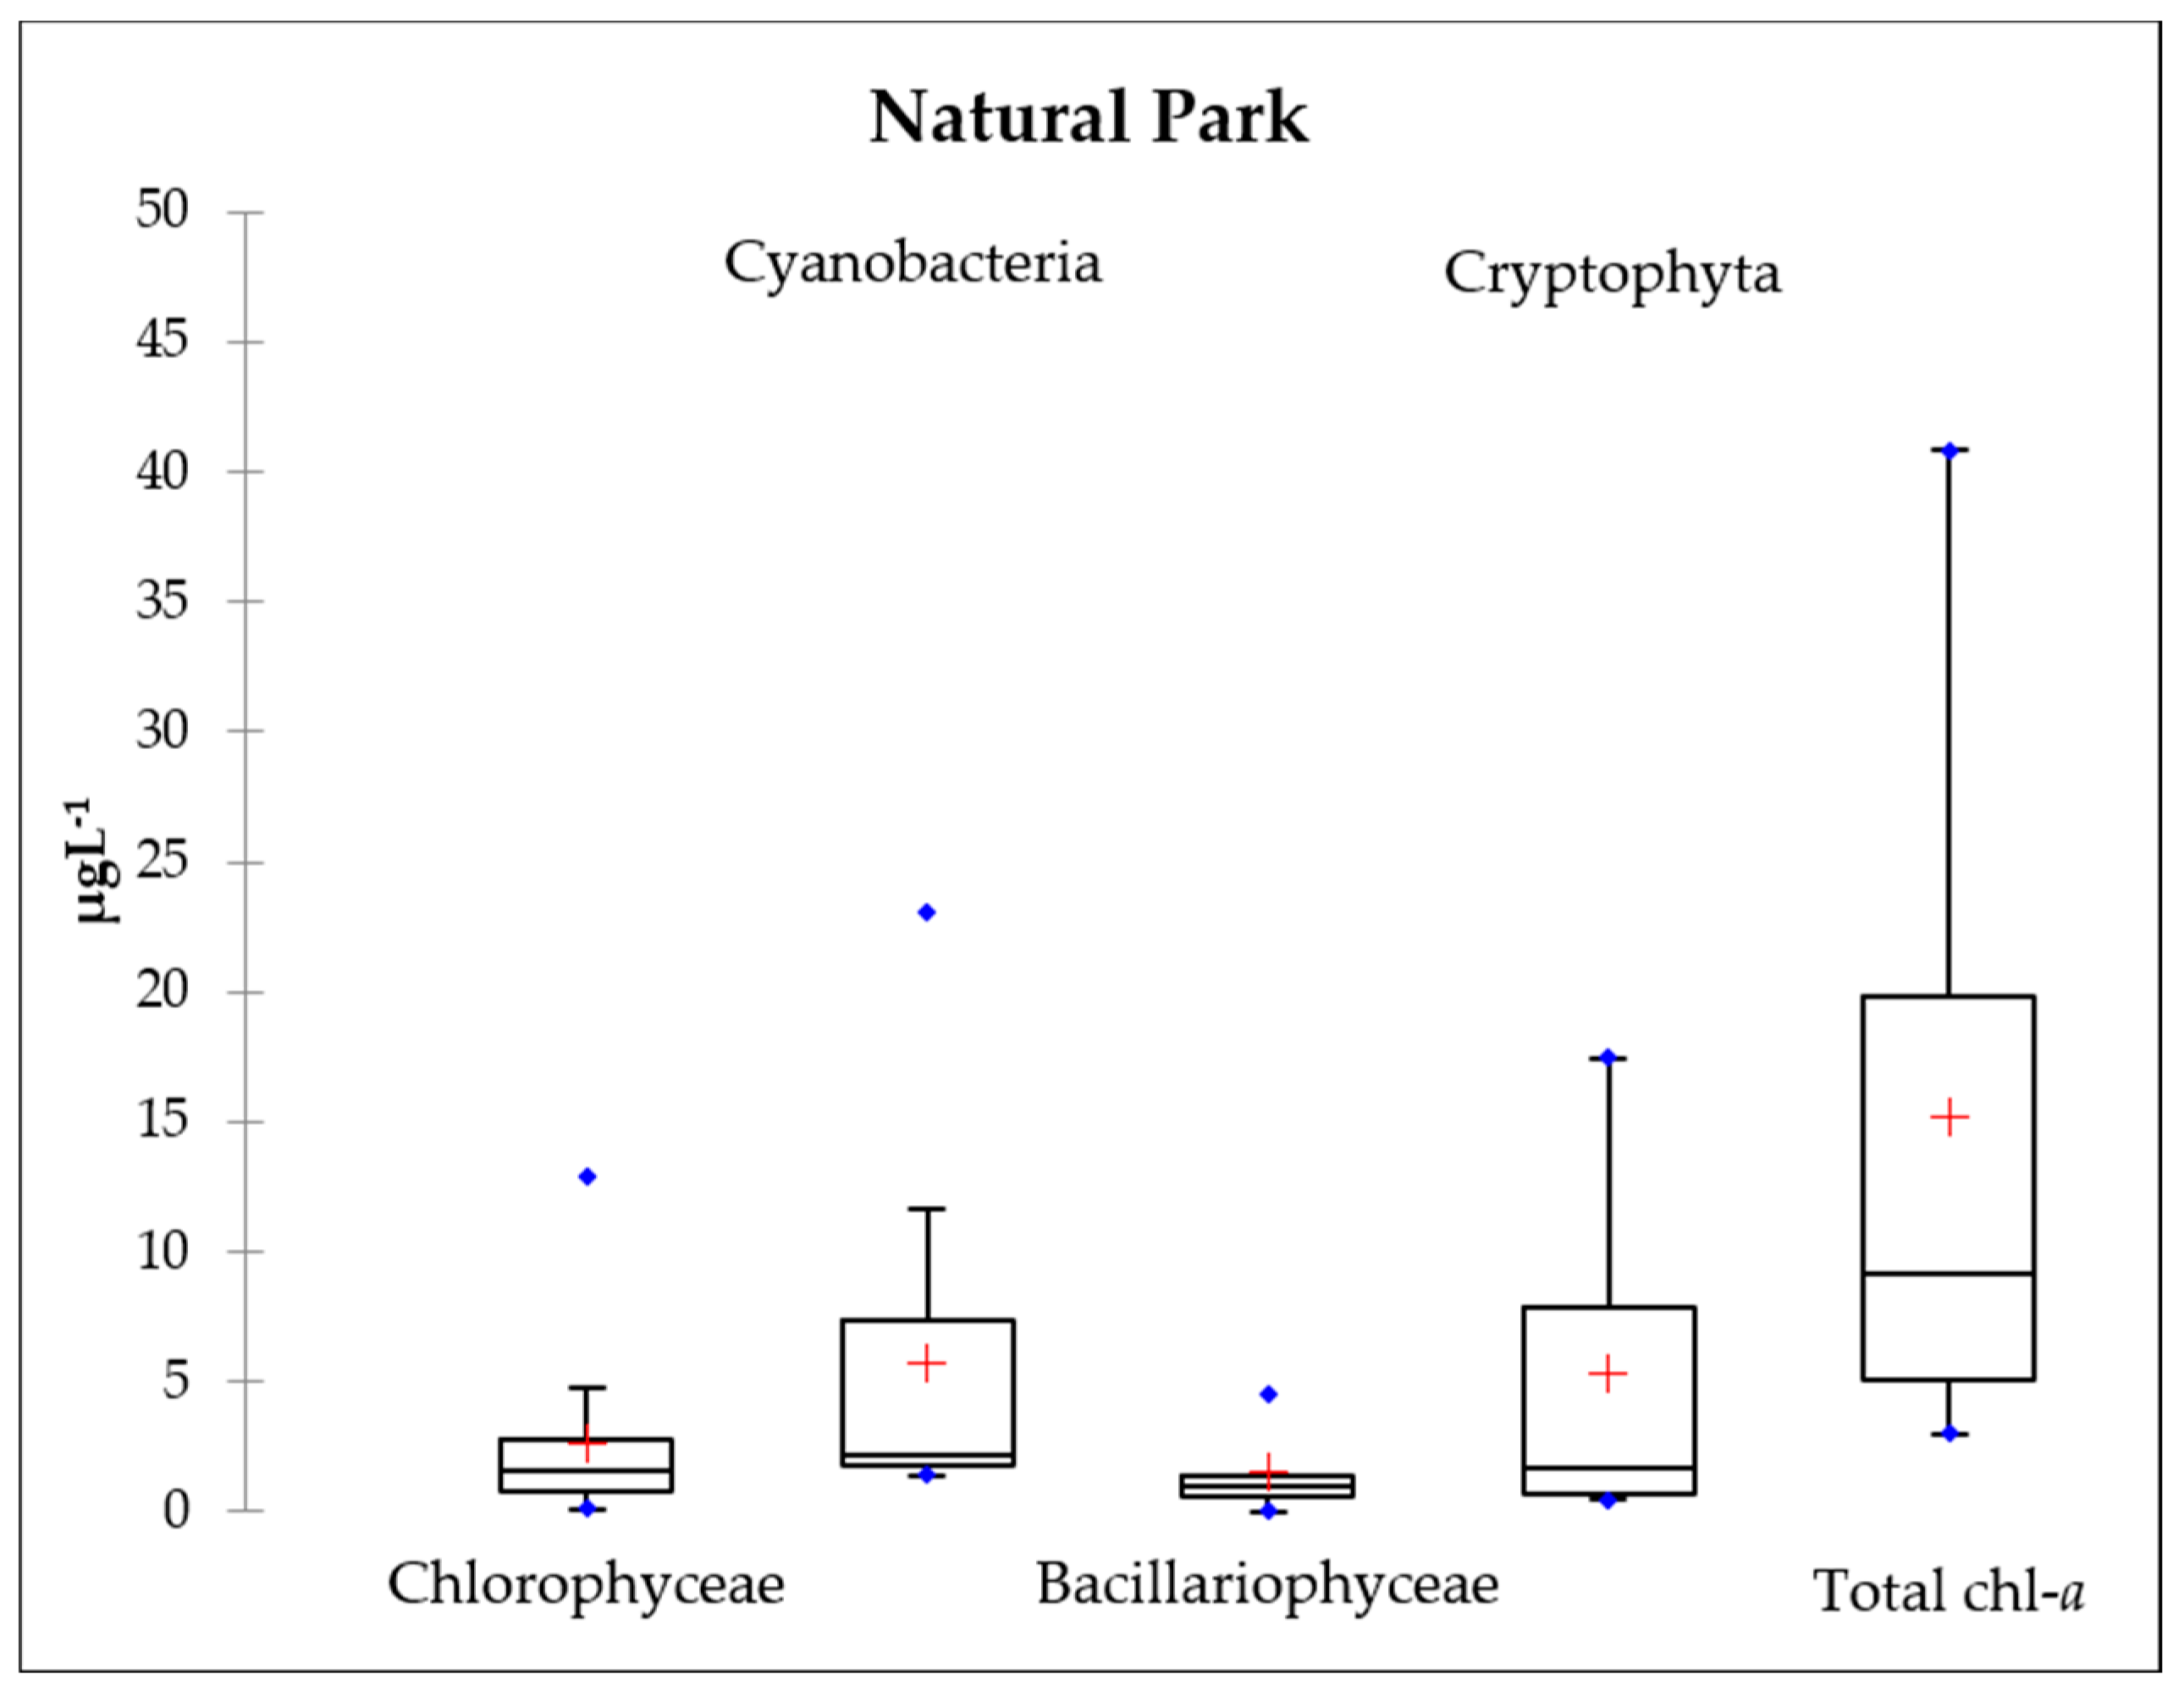
3.3. Chlorophyll-a
3.4. Phytoplankton Communities
3.4.1. Diversity
3.4.2. Abundance
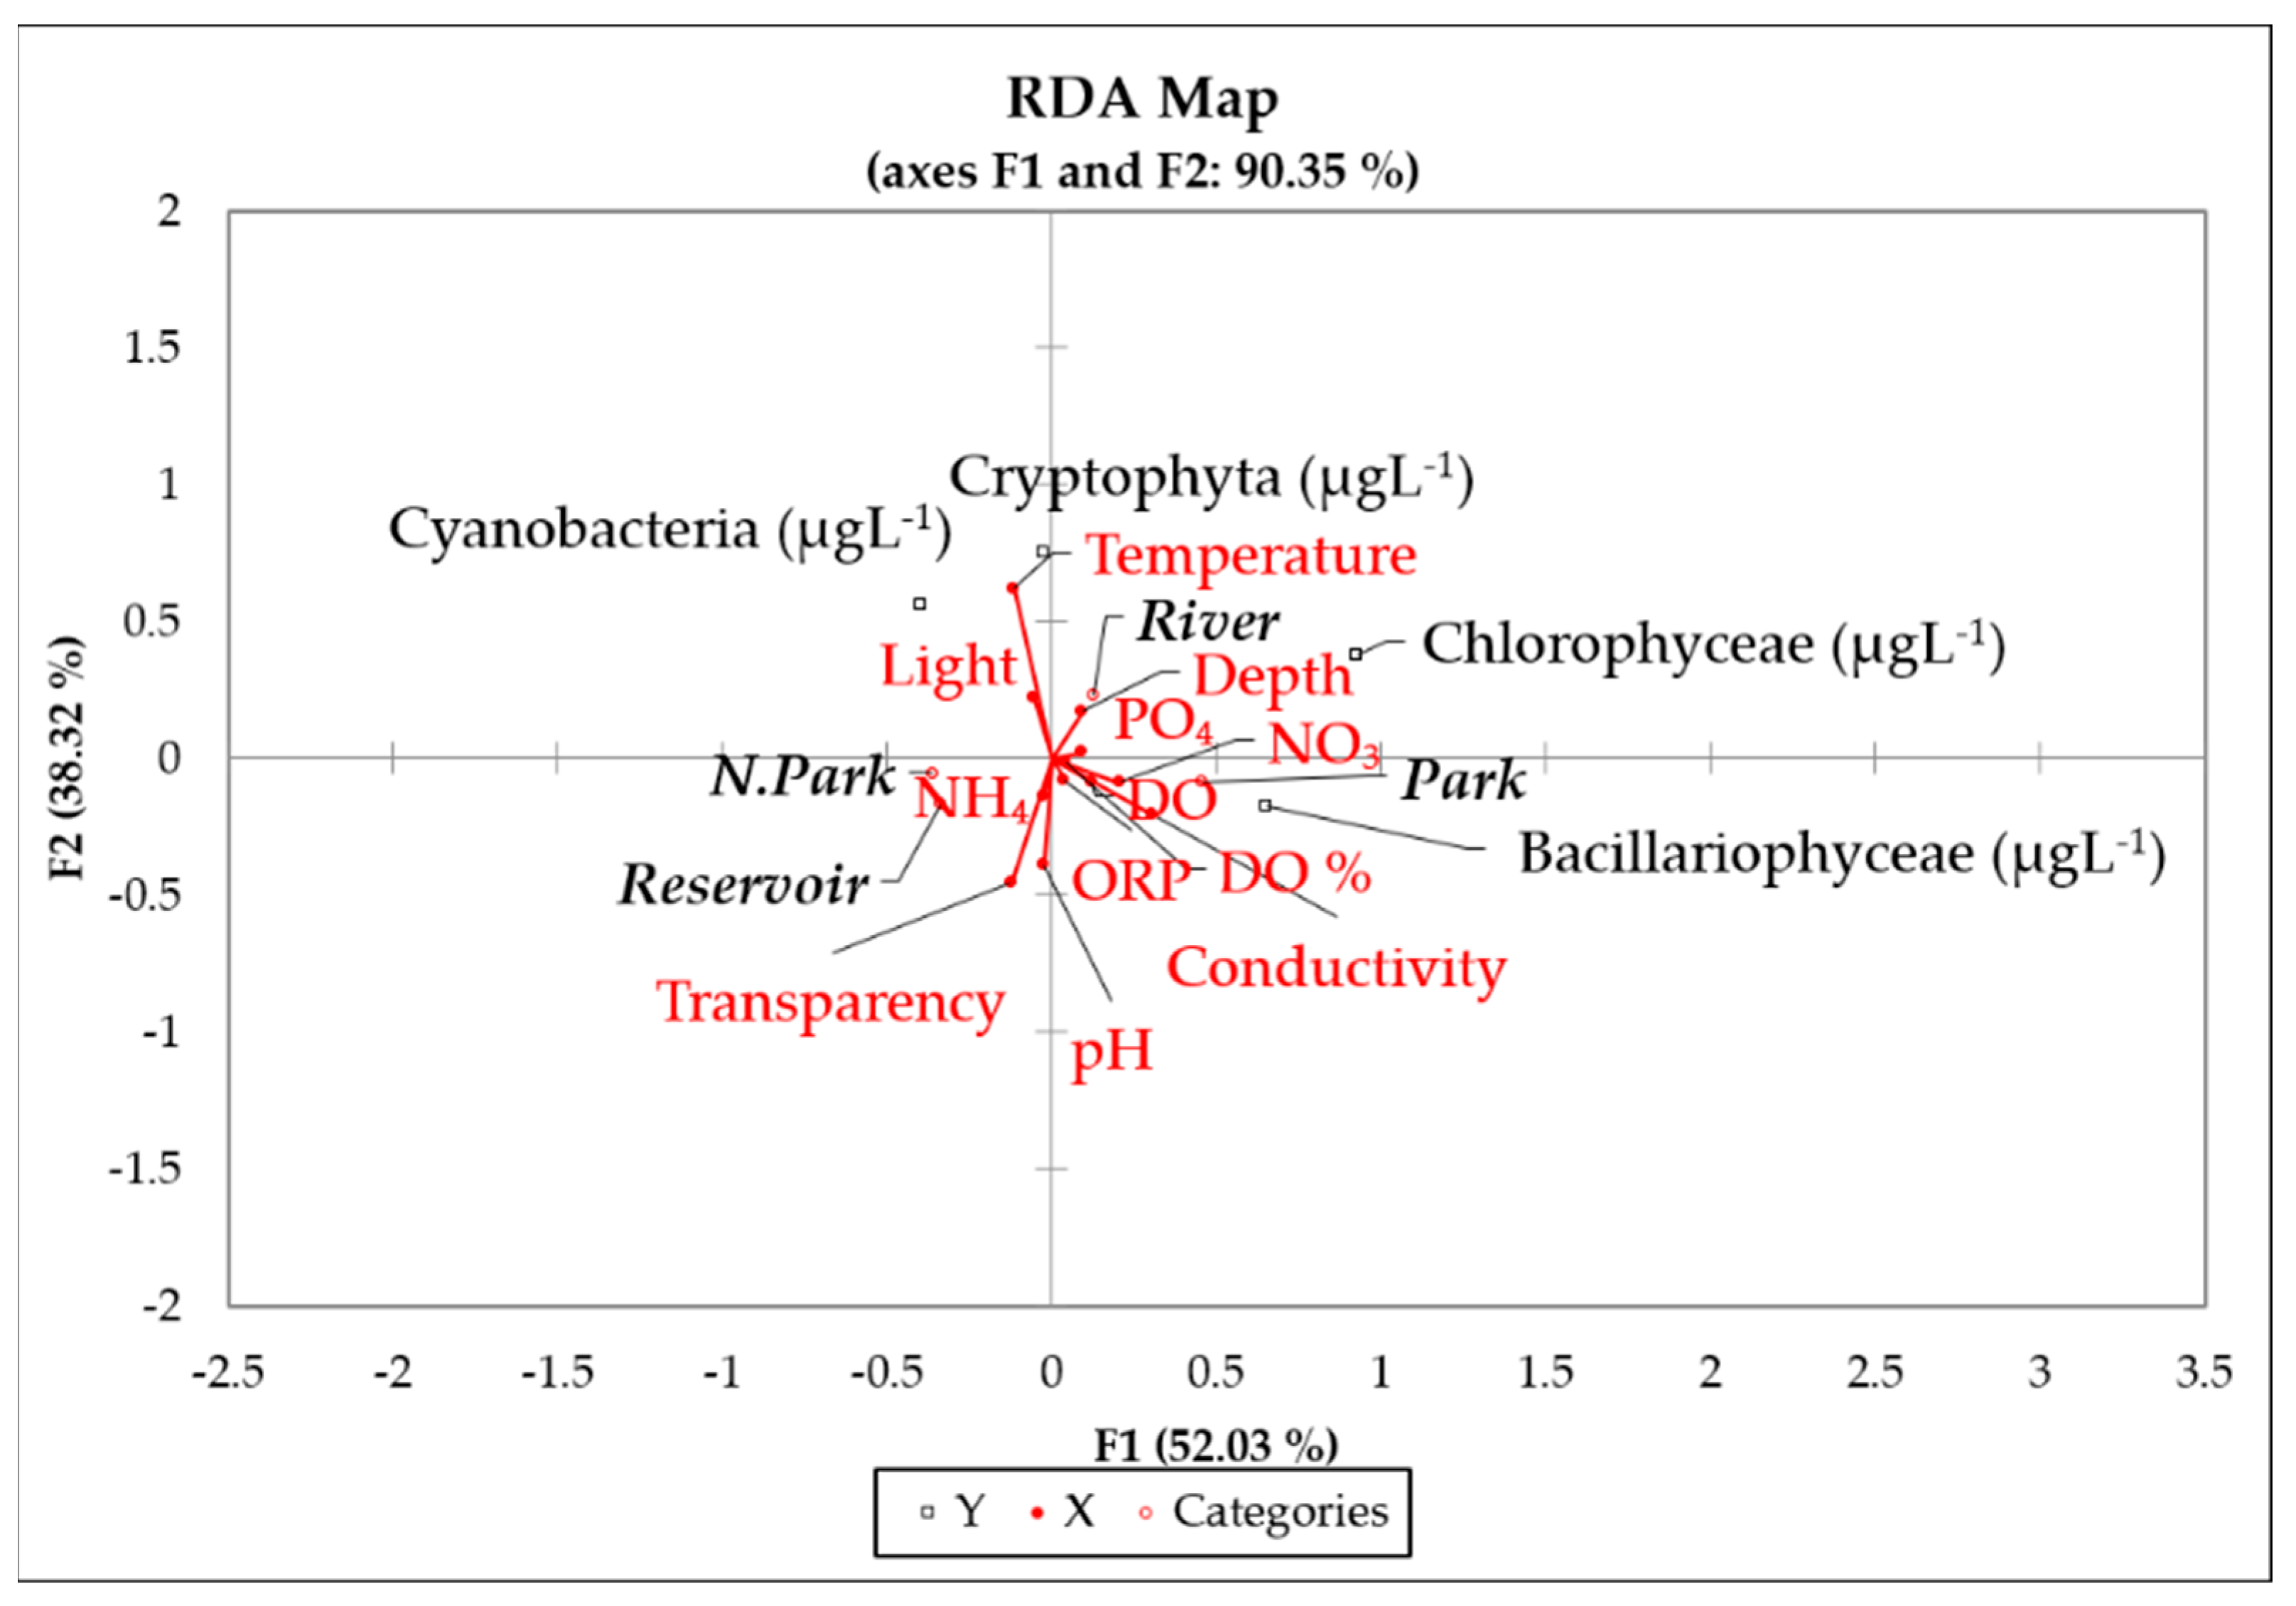
3.5. Phytoplankton and Physicochemical Variables Relationship
3.6. Zooplankton Communities
3.6.1. Diversity
3.6.2. Abundance
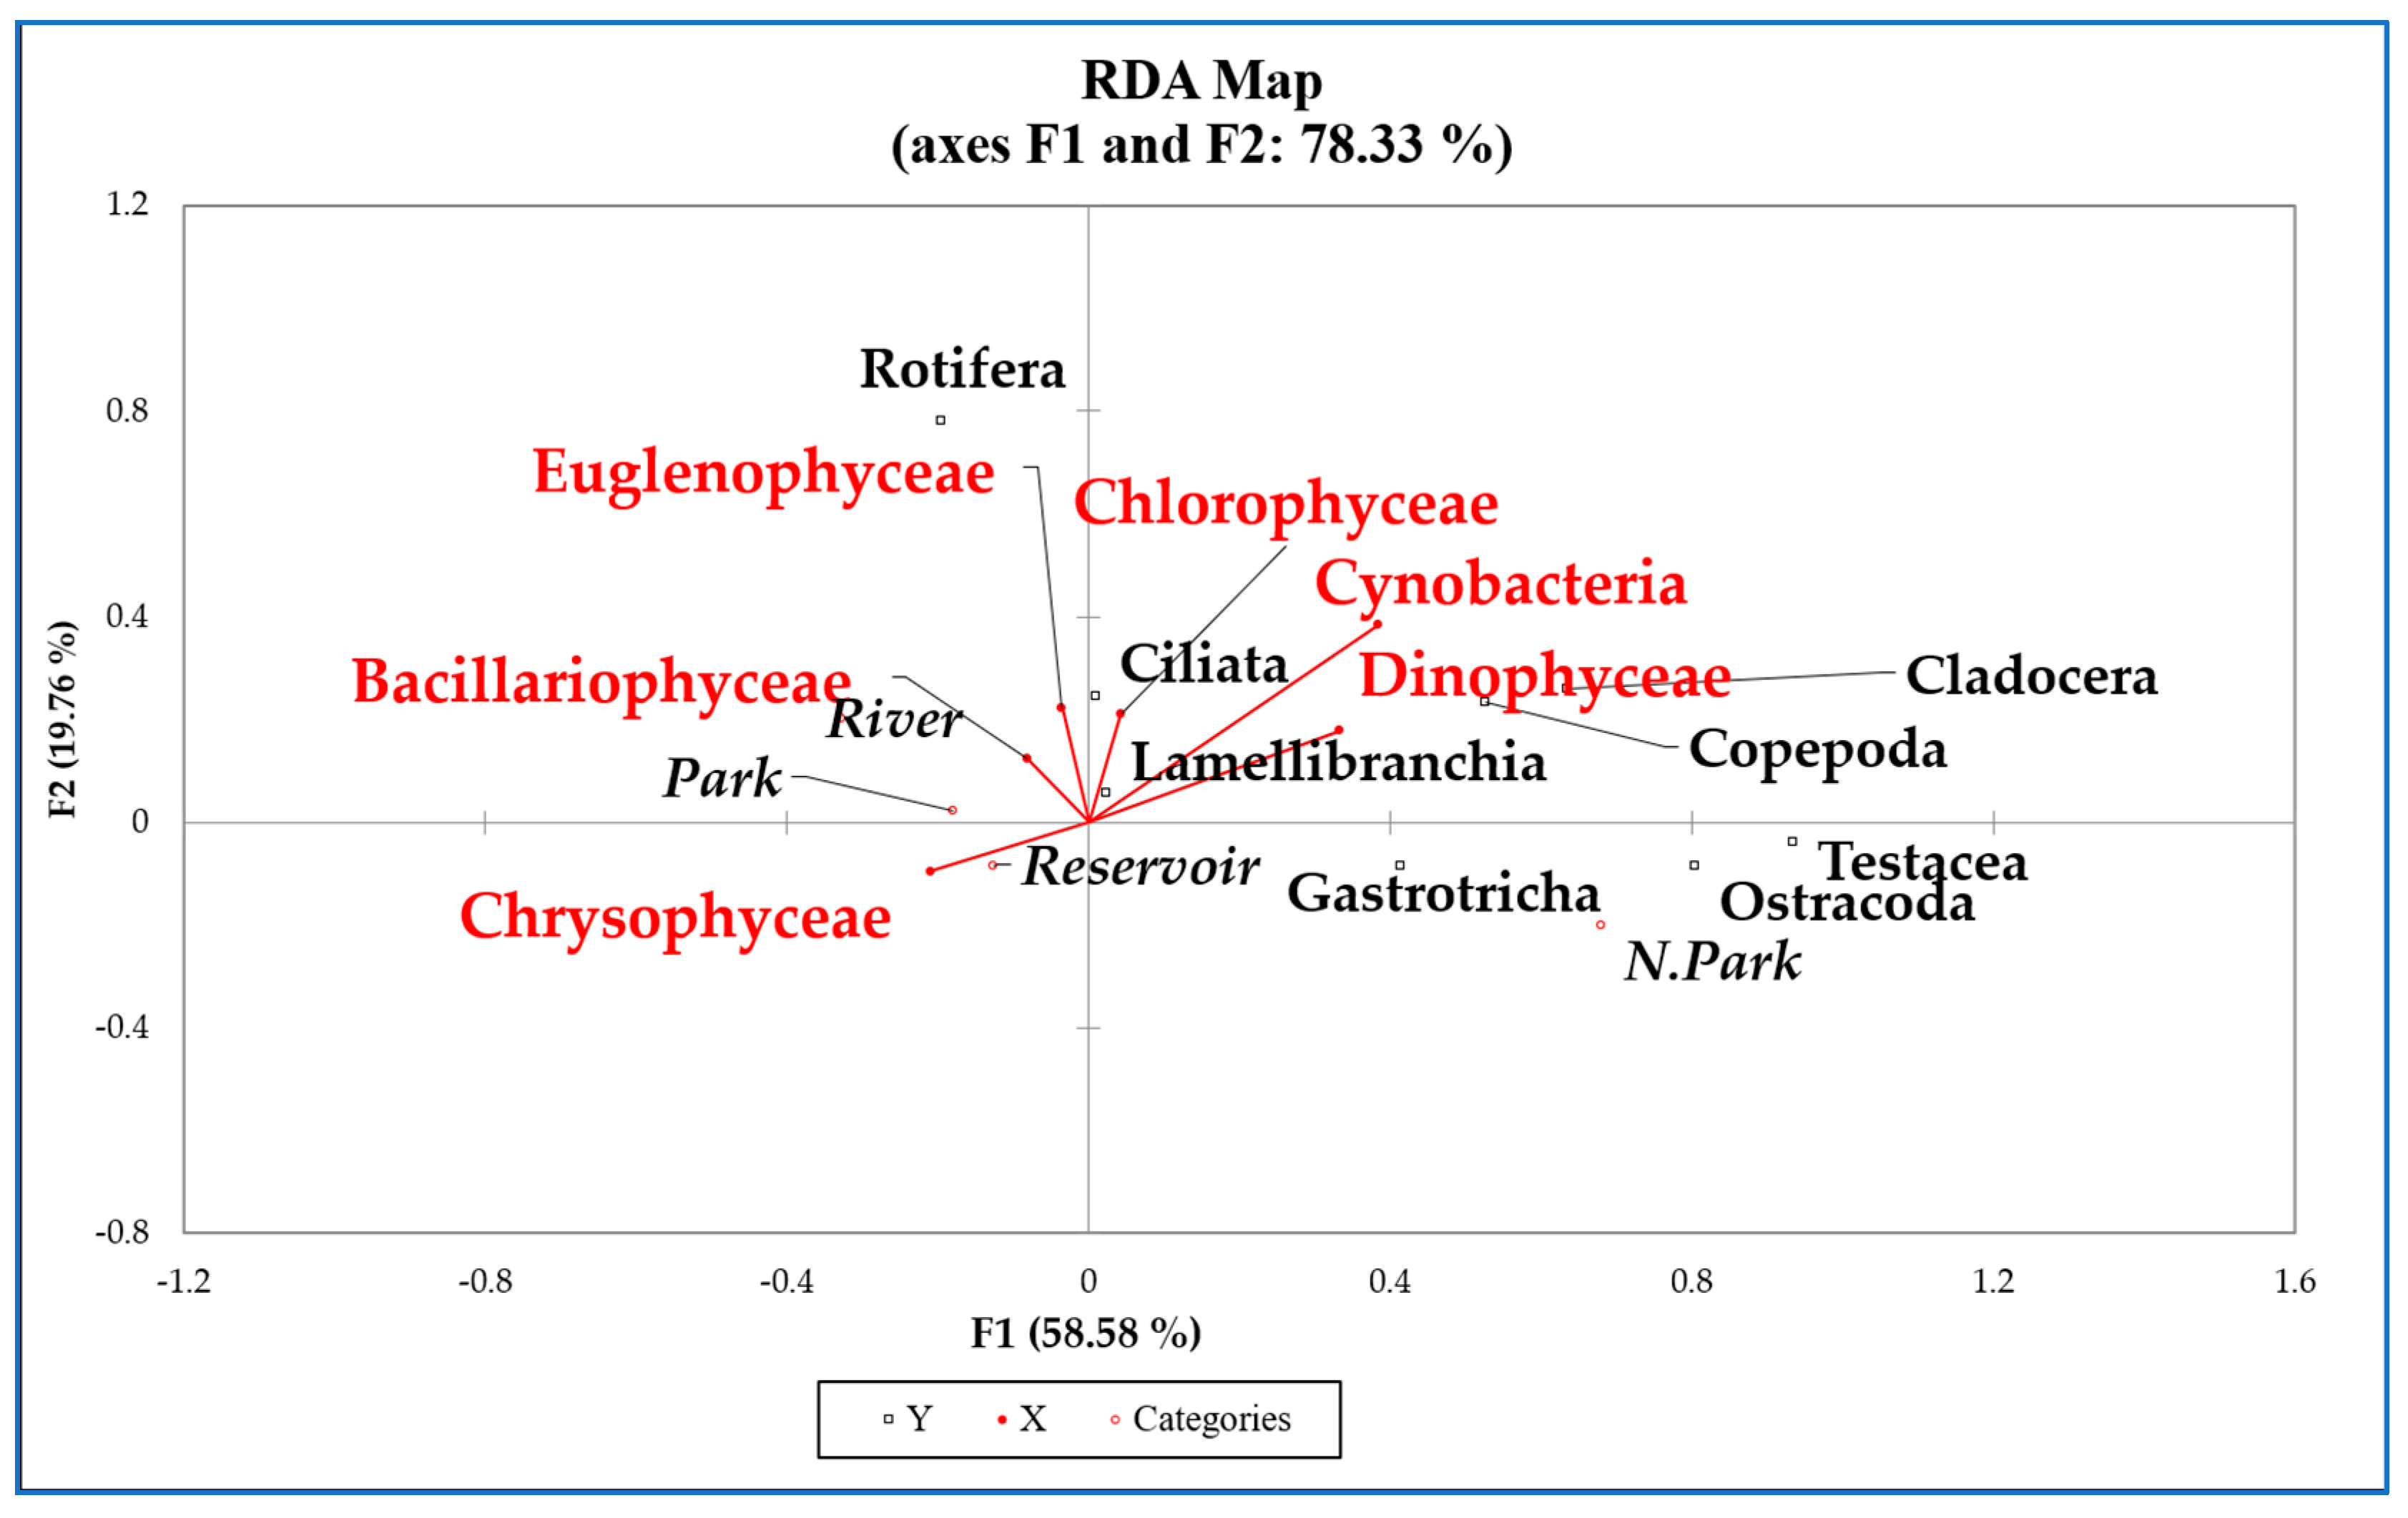
3.7. Phytoplankton and Zooplankton Interactions
4. Discussion
5. Conclusions
Author Contributions
Funding
Institutional Review Board Statement
Data Availability Statement
Acknowledgments
Conflicts of Interest
References
- Li, F.; Liu, X.; Zhang, X.; Zhao, D.; Liu, H.; Zhou, C.; Wang, R. Urban ecological infrastructure: An integrated network for ecosystem services and sustainable urban systems. J. Clean. Prod. 2017, 163, S12–S18. [Google Scholar] [CrossRef]
- Naselli-Flores, L. Urban Lakes: Ecosystems at Risk, Worthy of the Best Care. In Proceedings of the Taal 2007: The 12th World Lake Conference, Jaipur, India, 28 October–2 November 2007; pp. 1333–1337. [Google Scholar]
- Qian, M.; Liao, C.; Wu, Z.; Guan, W.; Yang, W.; Tang, Y.; Wu, G. Effects of Land Cover Pattern Along Urban-Rural Gradient on Bird Diversity in Wetlands. Diversity 2019, 11, 86. [Google Scholar] [CrossRef] [Green Version]
- Costanza, R. Toward an operational definition of ecosystem health. In Ecosystem Health: New Goals for Environmental Management; Costanza, R., Norton, B.G., Haskell, B.D., Eds.; Island Press: Washington, DC, USA, 1992; pp. 239–256. [Google Scholar]
- Fu-Liu, X.; Jørgensen, S.E.; Kong, X.Z.; He, W.; Qin, N. Chapter 13-Development of Ecological Models for the Effects of Macrophyte Restoration on the Ecosystem Health of a Large Eutrophic Chinese Lake (Lake Chaohu). In Developments in Environmental Modelling; Jørgensen, S.E., Chang, N.B., Xu, F.L., Eds.; Elsevier: Amsterdam, The Netherlands, 2014; Volume 26, pp. 337–373. [Google Scholar]
- Rapport, D.J. On the transformation from healthy to degraded aquatic ecosystems. Aquat. Ecosyst. Health Manag. 1999, 2, 97–103. [Google Scholar] [CrossRef]
- Shen, J.; Ge, Q.; Yu, R.; Zhao, Y.; Yang, J.; Shuqing, A.; Run, L.; Leng, X.; Wan, Y. Urbanization has changed the distribution pattern of zooplankton species diversity and the structure of functional groups. Ecol. Indic. 2021, 120, 106944. [Google Scholar] [CrossRef]
- Garmendia, M.; Borja, A.; Franco, J.; Revilla, M. Phytoplankton composition indicators for the assessment of eutrophication in marine waters: Present state and challenges within the European directives. Mar. Pollut. Bull. 2013, 66, 7–16. [Google Scholar] [CrossRef]
- Radu, M.; Stoiculescu, R.C. Landscape changes in Colentina river basin as reflected in cartographic documents. Present Environ. Sustain. Dev. 2010, 12, 23–26. [Google Scholar]
- Stănescu, S.V.; Gavriloaie, C. Aspecte privind vegetaţia şi fauna râului Colentina pe traseul din Municipiul Bucureşti (România). Ecoterra 2011, 27, 49–52. [Google Scholar]
- Gogu, C.R.; Serpescu, I.; Perju, S.; Gaitanaru, D.; Bica, I. Urban groundwater modeling scenarios to simulate a Bucharest city lake disturbance.Hydrogeology. Eng. Geol. Geotech. SGEM 2015, 1, 834–840. [Google Scholar]
- Ionescu, P.; Marcu, E.; Radu, V.M.; Ciobotaru, I.E.; Tociu, C. Evaluation of heavy metal contamination through indexes analysis. Case studies: Plumbuita and Circului Lakes, Bucharest (Romania). ECOTERRA J. Environ. Res. Prot. 2017, 14, 19–25. [Google Scholar]
- Merciu, F.C.; Sîrodoev, M.; Merciu, G.; Zamfir, D.; Schvab, A.; Stoica, I.V.; Paraschiv, M.; Saghin, I.; Cerleux, A.L.; Văidianu, N.; et al. The “Văcărești Lake” protected area, a neverending debatable issue? Carpathian J. Earth Environ. Sci. 2017, 12, 463–472. [Google Scholar]
- Catherine, A.; Escoffier, N.; Belhocine, A.; Nasri, A.B.; Hamlaoui, S.; Yéprémian, C.; Bernard, C.; Troussellier, M. On the use’ of the FluoroProbe(r), a phytoplankton quantification method based on fluorescence excitation spectra for large-scale surveys of lakes and reservoirs. Water Res. 2012, 46, 1771–1784. [Google Scholar] [CrossRef]
- Tartari, G.; Mosello, R. Metodologie Analitiche e Controlli di Qualita Nel Laboratorio Chimico Dell’Istituto Italiano di Idrobiologia. Documenta Dell’Istituto Italiano di Idrobiologia; N° 60; Consiglio Nazionale delle Ricerche: Verbania, Italia, 1997; p. 160.
- Komárek, J.; Anagnostidis, K. Cyanoprokaryota, Teil 1, Chroococcales, Süßwasserflora von Mitteleuropa; Springer: Spektrum, Germany, 1998. [Google Scholar]
- Komárek, J.; Anagnostidis, K. Cyanoprokaryota, Teil. 2, Oscillatoriales, Süßwasserflora von Mitteleuropa; Springer: Spektrum, Germany, 2005. [Google Scholar]
- Ettl, H.; Chlorophyta, I. Süßwasserflora von Mitteleuropa; Spektrum Akademischer Verlag: Berlin/Heidelberg, Germany, 1983. [Google Scholar]
- Ettl, H.; Gärtner, G. Chlorophyta, II. Süßwasserflora von Mitteleuropa; Spektrum Akademischer Verlag: Berlin/Heidelberg, Germany, 1988. [Google Scholar]
- Krammer, K.; Lange-Bertalot, H.; Naviculaceae, I. Süßwasserflora von Mitteleuropa; Springer: Berlin/Heidelberg, Germany, 1986. [Google Scholar]
- Krammer, K.; Lange-Bertalot, H. Bacillariophyceae, Teil 2, Süßwasserflora von Mitteleuropa; Springer: Berlin/Heidelberg, Germany, 1988. [Google Scholar]
- Krammer, K.; Lange-Bertalot, H. Bacillariophyceae, Teil 3, Süßwasserflora von Mitteleuropa; Springer: Berlin/Heidelberg, Germany, 1991. [Google Scholar]
- Krammer, K.; Lange-Bertalot, H. Bacillariophyceae, Teil 4, Süßwasserflora von Mitteleuropa; Springer: Berlin/Heidelberg, Germany, 1991. [Google Scholar]
- Huber-Pestalozzi, G. Das Phytoplankton des Süßwassers: Systematik und Biologie Teil 4, Euglenophyceen; Die Binnengewässer: Stuttgart, Germany, 1955. [Google Scholar]
- Huber-Pestalozzi, G. Das Phytoplankton des Suswassers. Systematic und Biologie. Teil 3. Cryptophyceae. Chloromonadinen. Peridineen; E. Schweizerbart’sche Verlagsbuchhandlung: Stuttgart, Germany, 1950. [Google Scholar]
- Huber-Pestalozzi, G. Das Phytoplankton des Suswassers. Systematic und Biologie. Teil 2. Chrysophyceen. FarbloseFlagellaten Heterokonten; E. Schweizerbart’sche Verlagsbuchhandlung: Stuttgart, Germany, 1941. [Google Scholar]
- Edler, L.; Elbrächter, M. The Utermöhl method for quantitative phytoplankton analysis. In Microscopic and Molecular Methods for Quantitative Phytoplankton Analysis; Karlson, B., Cusack, C., Bresnan, E., Eds.; UNESCO: Paris, France, 2010; pp. 13–20. [Google Scholar]
- Order MEWM no 161/2006 of Romanian Ministry of Environment and Water Management regarding Norms for Surface Water Classification in Order to Establish Ecological State of Water Bodies, In Romanian Official Monitor no. 511 (Pub-lished in 13 June 2006), Bucharest. Available online: http://www.legex.ro/Ordin-161-2006-71706.aspx (accessed on 12 August 2021).
- Foissner, W.; Blatterer, H.; Berger, H.; Kohmann, F. Taxonomical and Ecological Revision of Ciliata from Saprobic Systems, Volume I: Cyrtophorida, Oligotrichida, Hypotrichia, Colpodea; Reports by the Bavarian State Office for Water Management, 1 (91); Informationsberichte des Bayer Landesamtes für Wasserwirtschaft: Munich, Germany, 1991. [Google Scholar]
- Foissner, W.; Blatterer, H.; Berger, H.; Kohmann, F. Taxonomical and Ecological Revicion of Ciliata from Saprobic Systems, Volume II: Peritrichia, Heterotrichida, Odontostomatida; Reports by the Bavarian State Office for Water Management, 5 (92); Informationsberichte des Bayer Landesamtes für Wasserwirtschaft: Munich, Germany, 1992. [Google Scholar]
- Foissner, W.; Berger, H.; Kohmann, F. Taxonomical and Ecological Revision of Ciliata from Saprobic Systems, Volume III: Hymenostomata, Prostomatida, Nassulida; Reports by the Bavarian State Office for Water Management, 1 (94); Informationsberichte des Bayer Landesamtes für Wasserwirtschaft: Munich, Germany, 1994. [Google Scholar]
- Foissner, W.; Berger, H.; Kohmann, F. Taxonomical and Ecological Revision of Ciliata from Saprobic Systems, Volume IV: Gymnostomatea, Loxodes, Suctoria; Reports by the Bavarian State Office for Water Management, 1 (95); Informationsberichte des Bayer Landesamtes für Wasserwirtschaft: Munich, Germany, 1995. [Google Scholar]
- Bartoš, E. Rhizopoda Order Testacea; Slovak Academy of Sciences: Bratislava, Slovakia, 1954; p. 190. [Google Scholar]
- Grospietsch, T. Wechsel-Tierchen (Rhizopoden); Kosmos-Verlag Franckh: Stuttgar, Germany, 1972. (In German) [Google Scholar]
- Rudescu, L. Rotatoria. Fauna R.P. Române. Trochelminthes 2 (2); Editura Academiei Române: București, Romania, 1960. [Google Scholar]
- Negrea, Ş. Fauna Republicii Socialiste Romania. Cladocera; Editura Academiei Române: București, Romania, 1960. [Google Scholar]
- Edmonson, W.T.; Winberg, G.G. A Manual on the Methods for the Assessment of Secondary Productivity in Freshwaters (IPB Handbook 17); Blackwell Scientific Publications: Oxford, UK, 1971; p. 358. [Google Scholar]
- XLSTAT pro. Data Analysis and Statistical Solution for Microsoft Excel; Addinsoft: Paris, France, 2013. [Google Scholar]
- Hammer, Ø. PAST PAleontological STatistics Version 2.15 Reference Manual. Available online: http://folk.uio.no/ohammer/past (accessed on 12 August 2021).
- Hammer, O.; Harper, D.A.T.; Ryan, P.D. PAST: Paleontological statistics software package for education and data analysis. Palaeontol. Electron. 2001, 4, 9. [Google Scholar]
- Chap, L. Introductory Biostatistics; Wiley Interscience: Hoboken, NJ, USA, 2003; p. 536. [Google Scholar]
- Falconer, I.; Bartram, J.; Chorus, I.; Kuiper-Goodman, T.; Utkilen, H.; Burch, M.; Codd, G. Safe Levels and Practices. In Toxic Cyanobacteria in Water, A Guide to Their Public Health Consequences, Monitoring and Management; Chorus, I., Bartam, J., Eds.; E& FN Spon: London, UK, 1999. [Google Scholar]
- Romero, I.; Pachés, M.; Martinez-Guijarro, R.; Ferrer, J. Glophymed: An index to establish the Water Framework Directive based on phytoplankton in coastal waters. Mar. Pollut. Bull. 2013, 75, 218–223. [Google Scholar] [CrossRef]
- Grizzetti, B.; Liquete, C.; Pistocchi, A.; Vigiak, O.; Zulian, G.; Bouraoui, F.; De Roo, A.; Cardoso, A.C. Relationship between ecological condition and ecosystem services in European rivers, lakes and coastal waters. Sci. Total Environ. 2019, 671, 452–465. [Google Scholar] [CrossRef]
- Spatharis, S.; Tsirtsis, G. Ecological quality scales based on phytoplankton for the implementation of Water Framework Directive in the Eastern Mediterranean. Ecol. Indic. 2010, 10, 840–884. [Google Scholar] [CrossRef]
- Rolando, J.L.; Turin, C.; Ramirez, D.A.; Mares, V.; Monerris, J.; Quiroz, R. Key ecosystem services and ecological intensification of agriculture in the tropical high-Andean Puna as affected by land-use and climate changes. Agric. Ecosyst. Environ. 2017, 236, 221–233. [Google Scholar] [CrossRef]
- Grizzetti, B.; Lanzanova, D.; Liquete, C.; Reynaud, A.; Cardoso, A.C. Assessing water ecosystem services for water resource management. Environ. Sci. Policy 2016, 61, 194–203. [Google Scholar] [CrossRef]
- Li, H.; Alsanea, A.; Barber, M.; Goel, R. High-throughput DNA sequencing reveals the dominance of pico- and other filamentous cyanobacteria in an urban freshwater Lake. Sci. Total Environ. 2019, 661, 465–480. [Google Scholar] [CrossRef]
- Hoagland, P.; Scatasta, S. The Economic Effects of Harmful Algal Blooms. In Ecology of Harmful Algae. Ecological Studies (Analysis and Synthesis); Granéli, E., Turner, J.T., Eds.; Springer: Berlin/Heidelberg, Germany, 2006; Volume 189. [Google Scholar] [CrossRef]
- Dodds, W.K.; Bouska, W.W.; Eitzmann, J.L.; Pilger, T.J.; Pitts, K.L.; Riley, A.J.; Schloesser, J.T.; Thornbrugh, D.J. Eutrophication of U.S. freshwaters: Analysis of potential economic damages. Environ. Sci. Technol. 2009, 43, 12–19. [Google Scholar] [CrossRef] [Green Version]
- Akbulut, A.; Yildiz, K. The planktonic diatoms of lake Çilder (Ardahan-Turkey). Turk. J. Bot. 2002, 26, 55–75. [Google Scholar]
- Maraşlioĝlu, F.; Soylu, E.N.; Gönülol, A. Seasonal Variation of the Phytoplankton of Lake Ladik Samsun, Turkey. J. Freshw. Ecol 2005, 20, 549–553. [Google Scholar] [CrossRef] [Green Version]
- Beyhan, T.; Gonulol, A. An ecologic and taxonomic study on phytoplankton of a shallow lake. Turk. J. Environ. Biol. 2007, 28, 439–445. [Google Scholar]
- Kagalou, I.; Tsimarakis, G.; Patsias, A. Phytoplankton dynamics and physical-chemical features of a shallow lake (Lake Pamvotis, Greece). Fresenius Environ. Bull. 2001, 10, 845–849. [Google Scholar]
- Wang, X.; Wang, Y.; Lusan, L.; Jianmin, S.; Yanzhong, Z.; Juan, Z. Phytoplankton and Eutrophication Degree Assessment of Baiyangdian Lake Wetland, China. Sci. World J. 2013, 11, 436965. [Google Scholar] [CrossRef]
- Carrick, H.; Barbiero, R.P.; Tuchman, M. Variation in Lake Michigan Plankton: Temporal, Spatial, and Historical Trends. J. Great Lakes Res. 2001, 27, 467–485. [Google Scholar] [CrossRef]
- Xavier, L.; Vale, M.; Vasconcelos, V.M. Eutrophication, phytoplankton dynamics and nutrient removal in two man-made urban lakes (Palácio de Cristal and Serralves), Porto, Portugal. Lakes Reserv. Manag. 2007, 12, 209–214. [Google Scholar] [CrossRef]
- Cai, L.; Zhu, G.; Zhu, M.; Xu, H.; Qin, B. Effects of temperature and nutrients on phytoplankton biomass during bloom seasons in Taihu Lake. Water Sci. Eng. 2012, 5, 361–374. [Google Scholar] [CrossRef]
- Vidussi, F.; Mas, S.; Parin, D.; Simier, M.; Mostajir, B. Water temperature drives phytoplankton blooms in coastal waters. PLoS ONE 2019, 14, e0214933. [Google Scholar] [CrossRef] [Green Version]
- Zhou, S.; Cai, Q.; Xu, Y.; Han, X. Daily and vertical dynamics of rotifers under the impact of diatom blooms in the Three Gorges Reservoir, China. Hydrobiologia 2011, 675, 29–40. [Google Scholar] [CrossRef] [Green Version]
- Mimouni, E.A.; Pinel-Alloul, B.; Beisner, B.E.; Legendre, P. Summer assessment of zooplankton biodiversity and environmental control in urban waterbodies on the Island of Montreal. Ecosphere 2018, 9, 02277. [Google Scholar] [CrossRef]
- Amorim, C.A.; do Nascimento Moura, A. Ecological impacts of freshwater algal blooms on water quality, plankton biodiversity, structure, and ecosystem functioning. Sci. Total Environ. 2020, 758, 143605. [Google Scholar] [CrossRef]
- Qin, H.; Cao, X.; Cui, L.; Lv, Q.; Chen, T. The Influence of Human Interference on Zooplankton and Fungal Diversity in Poyang Lake Watershed in China. Diversity 2020, 12, 296. [Google Scholar] [CrossRef]
- Bai, Y.; Zhuang, C.; Ouyang, Z.; Zheng, H.; Jiang, B. Spatial characteristics between biodiversity and ecosystem services in a human-dominated watershed. Ecol. Complex. 2011, 8, 177–183. [Google Scholar] [CrossRef]
- Costanza, R.; Fisher, B.; Mulder, K.; Liu, S.; Christopher, T. Biodiversity and ecosystem services: A multi-scale empirical study of the relationship between species richness and net primary production. Ecol. Econom. 2007, 61, 478–491. [Google Scholar] [CrossRef]
- Filstrup, C.T.; Hillebrand, H.; Heathcote, A.J.; Harpole, W.S.; Downing, J.A. Cyanobacteria dominance influences resource use efficiency and community turnover in phytoplankton and zooplankton communities. Ecol. Lett. 2014, 17, 464–474. [Google Scholar] [CrossRef]
- Caro-Borrero, A.; Carmona-Jimenez, J.; Gonzalez-Martinez, T.; Mazari-Hiriart, M. Hydrological evaluation of a peri-urban stream and its impact on ecosystem services potential. Glob. Ecol. Conserv. 2015, 3, 628–644. [Google Scholar]
- Tian, W.; Zhang, H.Y.; Zhang, J.; Zhao, L.; Miao, M.S.; Huang, H. Responses of Zooplankton community to environmental factors and phytoplankton biomass in lake Nansihu. China Pak. J. 2017, 49, 493–504. [Google Scholar] [CrossRef]
- Lodi, S.; Ludgero, V.; Velho, L.; Bonecker, C.; Carvalho, P.; Bini, L. Zooplankton Community Metrics as Indicators of Eutrophication in Urban Lakes. Nat. Conserv. 2011, 9, 87–92. [Google Scholar] [CrossRef]
- Protasov, A.; Barinova, S.; Novoselova, T.; Sylaieva, A. The aquatic organisms diversity, community structure, and environmental conditions. Diversity 2019, 11, 190. [Google Scholar] [CrossRef] [Green Version]


| Ecosystem Features | Indicators of Ecosystem Health |
|---|---|
| Primary production | In situ Chlorophyll-a |
| Water quality |
|
| Top-down and bottom-up control of phytoplankton |
|
| Diversity of phytoplankton and zooplankton |
|
| April 2015 | August 2015 | July 2016 | November 2016 | April 2017 | August 2017 | ||
|---|---|---|---|---|---|---|---|
| Colentina River chain lakes | Grivița | E | H | E | M | H | H |
| Herăstrău | H | H | E | H | |||
| Plumbuita | H | H | E | E | E | H | |
| Pantelimon | M | H | H | E | E | H | |
| Reservoir | Morii | O | H | H | M | M | E |
| Park | Circului | E | H | H | H | H | H |
| Tineretului | E | E | H | H | E | M | |
| N. Park | Văcărești 1 | M | H | E | M | E | E |
| Văcărești 2 | M | M | H | M | H |
| April 2015 | August 2015 | July 2016 | November 2016 | April 2017 | August 2017 | ||
|---|---|---|---|---|---|---|---|
| Colentina River chain lakes | Grivița | I | III | I | I | II | II |
| Herăstrău | II | II | I | II | |||
| Plumbuita | II | II | I | I | I | II | |
| Pantelimon | I | III | II | I | I | II | |
| Reservoir | Morii | I | II | II | I | I | I |
| Park | Circului | I | II | II | III | II | II |
| Tineretului | I | I | II | III | I | II | |
| N. Park | Văcărești 1 | I | II | I | I | I | I |
| Văcărești 2 | I | I | II | I | II |
| River | Reservoir | Park | N. Park | |||||
|---|---|---|---|---|---|---|---|---|
| 1 | 2 | 3 | 4 | 5 | 6 | 7 | 8 | |
| Total species | 58 | 45 | 63 | 70 | 42 | 51 | 45 | 80 |
| Cyanobacteria | 8 | 5 | 10 | 23 | 8 | 12 | 9 | 18 |
| Euglenophyceae | 6 | 6 | 5 | 0 | 1 | 4 | 1 | 4 |
| Dinophyceae | 0 | 1 | 2 | 1 | 1 | 2 | 1 | 3 |
| Chrysophyceae | 1 | 1 | 1 | 1 | 1 | 1 | 1 | |
| Bacillariophyceae | 17 | 6 | 20 | 12 | 18 | 9 | 15 | 28 |
| Chlorophyceae | 26 | 27 | 25 | 33 | 13 | 23 | 18 | 26 |
| Shannon (H) | 2.93 | 3.06 | 3.12 | 2.62 | 1.59 | 2.81 | 1.87 | 1.78 |
| Evenness | 0.32 | 0.48 | 0.32 | 0.2 | 0.12 | 0.32 | 0.14 | 0.07 |
| Contrast | Difference | Standardized Difference | Critical Value | Pr > Diff | Significant |
|---|---|---|---|---|---|
| Colentina vs. N.Park | 0.189 | 5.496 | 2.667 | <0.0001 | Yes |
| Colentina vs. Reservoir | 0.124 | 2.983 | 2.667 | 0.023 | Yes |
| Colentina vs. Park | 0.122 | 3.758 | 2.667 | 0.003 | Yes |
| Park vs. N.Park | 0.067 | 1.755 | 2.667 | 0.308 | No |
| Park vs. Reservoir | 0.002 | 0.042 | 2.667 | 1.000 | No |
| Reservoir vs. N.Park | 0.065 | 1.415 | 2.667 | 0.497 | No |
| Tukey’s d critical value: | 3.772 |
| River | Reservoir | Park | Natural Park | |||||
|---|---|---|---|---|---|---|---|---|
| 1 | 2 | 3 | 4 | 5 | 6 | 7 | 8 | |
| Total | 1.96 × 10⁷ | 2.04 × 10⁷ | 1.17 × 10⁷ | 3.85 × 10⁷ | 2.68 × 10⁷ | 3.46 × 10⁷ | 4.10 × 10⁷ | 4.18 × 10⁷ |
| Cyanobacteria | 4.53 × 10⁶ | 6.69 × 10⁶ | 3.12 × 10⁶ | 3.30 × 10⁷ | 2.35 × 10⁷ | 2.01 × 10⁷ | 8.86 × 10⁶ | 3.94 × 10⁷ |
| Euglenophyceae | 9.28 × 10⁵ | 1.07 × 10⁶ | 5.65 × 10⁴ | - | 4.04 × 10³ | 8.17 × 10⁴ | 7.77 × 10³ | 1.86 × 10⁴ |
| Dinophyceae | - | 4.58 × 10⁴ | 2.02 × 10⁴ | 1.68 × 10⁴ | 9.61 × 10⁴ | 9.19 × 10⁵ | 2.69 × 10⁵ | 5.77 × 10⁴ |
| Chrysophyceae | 1.01 × 10⁴ | - | 2.68× 10³ | 1.58 × 10⁵ | 5.81 × 10⁵ | 3.37 × 10⁵ | 7.99 × 10⁶ | 2.25 × 10⁵ |
| Bacillariophyceae | 2.25 × 10⁶ | 1.72 × 10⁶ | 2.16 × 10⁶ | 1.27 × 10⁶ | 1.34 × 10⁶ | 1.91× 10⁶ | 2.24 × 10⁷ | 3.65 × 10⁵ |
| Chlorophyceae | 1.19 × 10⁷ | 1.09 × 10⁷ | 6.33 × 10⁶ | 4.09 × 10⁶ | 1.32 × 10⁶ | 1.21× 10⁷ | 1.48 × 10⁶ | 1.71× 10⁶ |
| Genus/Species | Bloom Event |
|---|---|
| Chlorophyceae | |
| Coelastrum microporum Nägeli 1855 | Circului autumn 2015 |
| Desmodesmus communis (E. Hegewald) E. Hegewald | Plumbuita spring 2015 Circului autumn 2016 |
| Kirchneriella lunaris (Kirchner) Mőbius 1894 | Grivița autumn 2015 Herăstrău spring 2015 |
| Scenedesmus ecornis (Ehrenberg) Chodat 1926 | Plumbuita summer 2016 |
| Tetradesmus lagerheimii M.J. Wynne & Guiry | Plumbuita spring 2015 Circului autumn 2016 |
| Cyanobacteria | |
| Planktolyngbya limnetica (Lemmermann) Komárková-Legnerová&Cronberg | Circului spring 2015 |
| Snowella lacustris (Chodat) Komárek&Hindák | Tineretului summer 2016 |
| Wollea saccata (Wolle) Bornet et Flahault 1886 | Pantelimon autumn 2015 |
| Aphanizomenon flosaquae Ralfs ex Bornet&Flahault 1886 | Pantelimon summer 2016 Morii autumn 2015 Morii summer 2016 |
| Chroococcus dispersus (V. Keissler) Lemm. 1904 | Văcărești autumn 2015 |
| Cylindrospermum sp. F.T. Kűtzing ex E. Bornet & C. Flahault, 1886 | Văcărești summer 2016 Văcărești autumn 2017 |
| Jaaginema minimum (Gicklhom) Anagnostidis&Komárek | Grivița spring 2015 Herăstrău spring 2015 Herăstrău autumn 2015 Pantelimon summer 2016 Circului autumn 2016 |
| Merismopedia tenuissima Lemmermann 1898 | Plumbuita summer 2016 Circului autumn 2015 Tineretului summer 2016 |
| Merismopedia tranquilla (Ehrenberg) Trevisan | Plumbuita summer 2016 |
| Microcystis flosaquae (Wittrock) Kirchner 1898 | Pantelimon summer 2016 Morii summer 2016 |
| Microcystis sp. Lemmermann, 1907 | Herăstrău autumn 2015 |
| Oscillatoria limosa C.Agardh ex Gomont 1892 | Morii autumn 2015 Văcărești autumn 2015 |
| Oscillatoria sp. Vaucher ex Gomont, 1892 | Morii autumn 2015 Circului summer 2016 Văcărești autumn 2017 |
| Oscillatoria tenuis C.Agardh ex Gomont 1892 | Pantelimon autumn 2015 Văcărești autumn 2015 Văcărești summer 2016 |
| Bacillariophyceae | |
| Nitzschia acicularis (Kűtzing) W. Smith 1853 | Tineretului summer 2016 Tineretului autumn 2017 |
| Ulnaria acus (Kützing) Aboal | Tineretului spring 2015 |
| Chrysophyceae | |
| Dinobryon sertularia Ehrenberg 1834 | Tineretului spring 2015 |
| River | Reservoir | Park | Natural Park | |||||
|---|---|---|---|---|---|---|---|---|
| 1 | 2 | 3 | 4 | 5 | 6 | 7 | 8 | |
| Total species | 57 | 55 | 57 | 64 | 42 | 52 | 54 | 89 |
| Ciliata | 5 | 9 | 6 | 9 | 5 | 5 | 6 | 4 |
| Testacea | 6 | 3 | 7 | 6 | 2 | 7 | 7 | 9 |
| Lamellibranchia | 1 | 1 | ||||||
| Rotifera | 41 | 34 | 36 | 36 | 22 | 33 | 29 | 50 |
| Gastrotricha | 1 | 2 | ||||||
| Cladocera | 5 | 6 | 5 | 9 | 9 | 4 | 9 | 20 |
| Copepoda | 0 | 2 | 2 | 2 | 3 | 2 | 2 | 3 |
| Ostracoda | 1 | 1 | 1 | 1 | 1 | |||
| Shannon (H) | 2.59 | 2.67 | 2.35 | 2.68 | 2.14 | 2.20 | 1.92 | 3.48 |
| Evenness | 0.23 | 0.26 | 0.18 | 0.23 | 0.20 | 0.17 | 0.13 | 0.37 |
| River | Reservoir | Park | N. Park | |||||
|---|---|---|---|---|---|---|---|---|
| 1 | 2 | 3 | 4 | 5 | 6 | 7 | 8 | |
| Total | 576.96 | 921.5 | 939.66 | 1240.13 | 381.2 | 822.61 | 479.8 | 514.91 |
| Ciliata | 9.28 | 50.38 | 4.57 | 138.5 | 15.7 | 12.22 | 7.43 | 15.56 |
| Testacea | 2.79 | 1.69 | 5.64 | 7.16 | 0.83 | 11.96 | 4.68 | 104.24 |
| Lamellibranchia | 0 | 0.31 | 0 | 2.11 | 0 | 0 | 0 | 0 |
| Rotifera | 519.01 | 799.69 | 854.82 | 860.86 | 244.18 | 638.98 | 380.19 | 171.82 |
| Gastrotricha | 0 | 0 | 0 | 0 | 0 | 0.28 | 0 | 5.98 |
| Cladocera | 5.38 | 22.5 | 4.4 | 22.24 | 10.14 | 1.75 | 34.16 | 39.2 |
| Copepoda | 40.49 | 46.94 | 69.98 | 210.04 | 108.67 | 157.43 | 52.09 | 155.81 |
| Ostracoda | 0 | 0 | 0.25 | 1.34 | 1.67 | 0 | 1.25 | 22.3 |
Publisher’s Note: MDPI stays neutral with regard to jurisdictional claims in published maps and institutional affiliations. |
© 2022 by the authors. Licensee MDPI, Basel, Switzerland. This article is an open access article distributed under the terms and conditions of the Creative Commons Attribution (CC BY) license (https://creativecommons.org/licenses/by/4.0/).
Share and Cite
Florescu, L.I.; Moldoveanu, M.M.; Catană, R.D.; Păceșilă, I.; Dumitrache, A.; Gavrilidis, A.A.; Iojă, C.I. Assessing the Effects of Phytoplankton Structure on Zooplankton Communities in Different Types of Urban Lakes. Diversity 2022, 14, 231. https://doi.org/10.3390/d14030231
Florescu LI, Moldoveanu MM, Catană RD, Păceșilă I, Dumitrache A, Gavrilidis AA, Iojă CI. Assessing the Effects of Phytoplankton Structure on Zooplankton Communities in Different Types of Urban Lakes. Diversity. 2022; 14(3):231. https://doi.org/10.3390/d14030231
Chicago/Turabian StyleFlorescu, Larisa I., Mirela M. Moldoveanu, Rodica D. Catană, Ioan Păceșilă, Alina Dumitrache, Athanasios A. Gavrilidis, and Cristian I. Iojă. 2022. "Assessing the Effects of Phytoplankton Structure on Zooplankton Communities in Different Types of Urban Lakes" Diversity 14, no. 3: 231. https://doi.org/10.3390/d14030231