Cross-Shelf Variation Among Juvenile and Adult Coral Assemblages on Australia’s Great Barrier Reef


1
Australian Institute of Marine Science, PMB 3, Townsville, QLD 4810, Australia
2
School of Mathematics and Physics, University of Queensland, St Lucia, QLD 4069, Australia
*
Author to whom correspondence should be addressed.
Diversity 2019, 11(6), 85; https://doi.org/10.3390/d11060085
Submission received: 19 April 2019
/
Revised: 24 May 2019
/
Accepted: 27 May 2019
/
Published: 30 May 2019
(This article belongs to the Special Issue Cross-shelf Variation in the Structure and Function of Coral Reef Assemblages)
Abstract
:Coral reefs are under increasing pressure from a variety of stressors, highlighting the need for information about the status of coral reef communities including the distribution, abundance and composition of juvenile and adult coral assemblages. This information is currently limited for the Great Barrier Reef (GBR) and is necessary for understanding the impacts of disturbances and the system’s potential for recovery. This study reports juvenile and adult hard coral abundance and composition from 122 reefs on the GBR during a period of limited acute disturbance. The data represent baseline observations for juvenile hard coral assemblages spanning the longitudinal cross-shelf gradient of the GBR and 12 degrees of latitude and augment reported distribution of adult coral assemblages over the same scale with inclusion of additional reefs. Juvenile and adult coral assemblages reflected broad differences imposed by the gradient of environmental conditions across the GBR. The mean density of juvenile hard corals was lower in the inshore reefs (5.51 m2) than at either the mid-shelf (11.8 m2) or outer shelf reefs (11.2 m2). The composition of juvenile and adult coral assemblages covaried overall, although there were different relationships between these two life stages across the continental shelf and among community types. Dissimilarity between juvenile and adult coral assemblages was greater on inshore and outer shelf reefs than on reefs in the mid-shelf, although, there were differences in community types both within these shelf positions and those that spanned mid- and outer shelf reefs. Dissimilarity was greatest for Inshore branching Acropora and high for Southern Acropora communities, although very high coral cover and very low juvenile densities at these reefs precluded interpretation beyond the clear competitive dominance of Acropora on those reefs. Dissimilarity was also high between juvenile and adult coral assemblages of Turbid inshore communities suggesting water quality pressures, along with synergistic effects of other stressors, pose ongoing selective pressures beyond the juvenile stage. Conversely, relatively low dissimilarity between juvenile and adult coral assemblages on mid-shelf and lower latitude outer shelf reefs suggests pressures beyond those influencing settlement and early post-settlement survival were having less influence on the composition of adult coral assemblages.
1. Introduction
Scleractinian corals (hereafter coral) are the primary habitat architects of coral reefs and provide much of the three-dimensional structure that is used by the myriad of organisms in these highly diverse ecosystems [1,2,3,4]. In addition to high diversity, coral reefs also exhibit large variability in the composition of coral assemblages at a range of spatial scales [5,6]. Reefs are dynamic systems frequently punctuated by perturbations [7], and a key factor underpinning their health is the ability of coral species to maintain or renew their populations in order to retain the diversity of habitats they provide. Coral replenishment can occur from regrowth of coral fragments [8,9,10,11], but on most reefs replenishment is primarily driven by the settlement of sexually produced larvae and their subsequent survival and growth, i.e., recruitment [10,11,12,13].
The culmination of larval dispersal, pre- and post-settlement selective pressures is reflected in the abundance and composition of juvenile coral assemblages (i.e., corals from ~5–50 mm diameter) [13,14,15,16,17,18,19,20,21,22,23]. Coral larvae selectively settle into habitats suitable for their subsequent survival and growth [21,22,23,24]. This behavior, in addition to density dependent feedbacks such as stock-recruitment relationships [17,25], and hydrodynamic processes that help retain planulae larvae on natal or local reefs [15,26,27,28], are thought to promote the relative stability in community types that has been observed on reefs within the Great Barrier Reef (GBR) system over single or multiple disturbance cycles [29,30,31,32]. Positive relationships between juvenile and adult life stages is one indication of a persistent adult assemblage, as observed in locally abundant taxa in French Polynesia—Acropora, Fungia, Montipora and Pavona; Tonga—Turbinaria, Montastrea, Pocillopora, Favites, Montipora, Acropora and Goniastrea and New Caledonia—Acropora, Favia, Pocillopora and Porites [24,33,34]. For dominant taxa in these locations, this correspondence of juvenile and adult life stages demonstrates that despite likely differences in the underlying mechanisms that coral species employ to maintain competitive dominance, juvenile coral assemblages at least broadly reflect the suitability of a location for their future success [24,33,34,35].
In contrast, breakdown in apparent stock-recruitment relationships can occur due to several factors. These factors include: Highly variable or failed recruitment [5,36], selective post-settlement mortality of coral taxa [17,18,19,20,36,37,38,39,40], differing life-history traits between species [41,42] and reefs in the early stages of recovery [40,43,44]. These factors may lead to bottlenecks in recovery [36,45,46] and potentially indicate situations where changing disturbance regimes are contributing to permanent shifts in coral community composition and changes in recovery potential [47,48,49]. In this regard, abundance and composition of juvenile coral assemblages may provide an early indication of whether the effects of stressors on coral reefs are likely to lead to long-term changes in coral assemblages and their resulting ecosystem services or whether critical thresholds for coral replenishment and recovery will be met (e.g., [42,47,48,50]).
On the GBR adult coral assemblages differ across the continental shelf and with latitude, reflecting variability in environmental conditions such as light availability, temperature, exposure to waves and river runoff [51,52,53,54,55,56]. Large-scale hydrodynamic features like the East Australian Current [57] interacting with regional hydrodynamics produced by tidal currents [58,59] and reef geomorphology [60] are thought to additionally influence coral community composition [61,62]. Similarity in adult coral assemblage composition at scales of tens of kilometers have been described as a patchwork mosaic reflecting the interaction of environmental drivers but also acute disturbances such as cyclones and outbreaks of the corallivorous crown-of-thorns starfish (COTS), Acanthaster cf. solaris [63]. Whether juvenile coral assemblages exhibit the same large-scale patterns remains unresolved. To date, GBR studies comparing juvenile and adult coral assemblages have been limited in spatial extent and have considered variation between aspect, latitude or different habitats but have not examined cross-shelf variation with latitude concurrently [20,37,38,40,52,64,65].
Ocean warming and other chronic stressors are increasing pressure on coral reefs around the world [66]. The potential for chronic stressors to influence community composition is greatest during early life stages [67,68,69] and where stressors interact with acute disturbance regimes [70]. On GBR, ocean warming has increased the frequency of coral bleaching and intensity of cyclones [71,72], while runoff has been implicated in increasing survival in COTS larvae [73] and in causing increased mortality from coral diseases [38]. Given that the state of coral reefs is tightly linked to disturbance and recovery cycles, understanding spatial differences in selective processes operating on the juvenile or later life-stages of corals will help to identify pressures most limiting coral community recovery.
This study examines spatial variation of juvenile coral assemblages across the GBR, the relationship between adult and juvenile coral assemblages, and whether this relationship suggests spatial differences in the processes shaping the composition of coral assemblages. Results are presented from the first large-scale collection of juvenile coral data on the GBR, collected as part of reef monitoring programs undertaken by the Australian Institute of Marine Science (AIMS), during a period with few acute disturbances [29]. We addressed two specific questions; (1) do juvenile coral densities and taxonomic composition vary spatially over the GBR? and (2) are there areas where there are differences between juvenile and adult coral assemblages indicative of changing selective pressures?
2. Materials and Methods
2.1. Sampling Design
Between 2007 and 2008, juvenile and adult hard corals and other benthic cover were surveyed concurrently on 122 reefs on the GBR by two monitoring programs run by the AIMS, the Long-Term Monitoring Program (LTMP) and the Marine Monitoring Program (MMP). The LTMP surveys reefs were in three positions across the continental shelf: Inshore were defined as reefs shoreward of the shipping channel that runs the length of the GBR and separates the main GBR reef matrix from the mostly island fringing reefs situated in more coastal settings, mid-shelf were defined as reefs in the main GBR matrix seaward of the shipping channel but exclusive of those exposed to the open Coral Sea, and outer shelf were those reefs on the Coral Sea margin of GBR. The LTMP reefs span between 14° S and 24° S with 46 reefs surveyed in 2007 and 45 in 2008. LTMP transects are located along a single depth contour on sections of contiguous reef slope habitat generally on the windward or partly exposed flank of the reef [74]. The MMP surveys inshore reefs only, between 16° S and 24° S and completed 23 surveys in 2007 and eight in 2008. The MMP also locates transects along a single depth contour on areas of contiguous reef slope, however, the availability of this habitat on some inshore reefs means a range of windward and leeward settings are included. Both programs use the same sampling methods, employed along transects permanently marked with steel markers at 10 m intervals, although the level of replication varies (Table 1) [74].
2.2. Survey Methods for Juvenile Coral and Adult Coral Assemblages
Along each permanent transect estimates of benthic cover were derived using the photo point intercept technique applied to digital photographs capturing ~0.5 m by 0.4 m portions of the substrate [74]. Hard and soft corals were identified following Veron [75] and Fabricius and Alderslade [76] to the lowest taxonomic resolution possible under five fixed points on each image [74]. Taxonomic resolution was typically genus for hard corals and family for soft corals and the total number of points for each taxonomic unit was converted to percent cover. We then grouped hard and soft corals into 37 categories based on a combination of taxonomy and growth forms (Table S1). Juvenile corals (~5 mm to <50 mm) were identified and counted in situ along a 0.34 m wide belt for the first 5 m of each 50 m transect (LTMP) or along the entire 20 m transect (MMP) [74]. We acknowledge that the size class chosen will include corals of a range of ages due to variability in growth within and between species [13,37], and for very few genera with small colony sizes, potentially adult corals. However, for the relatively abundant genera on the GBR we considered that this size class captures cohorts predominantly up to 3–4 years old [37] and are within the range of size classes typically used to define juvenile corals [14]. Colonies considered to be recently recruited to the substrate were identified to the finest taxonomic resolution possible, typically genus or otherwise family and counted as juvenile corals. Coral colonies that were remnants of larger colonies were not counted as juveniles.
2.3. Community Types
Processes and pressures structuring coral reef assemblages will vary over a multitude of spatial and temporal scales and community composition of corals will logically reflect the cumulative selective pressures imposed. To examine the composition of the juvenile and adult coral assemblages that had similar community composition our first goal was to define the community types. We used data from the year of maximum hard coral cover on each reef between 1997 and 2018 as the basis for describing community types, because we considered this would best capture the cumulative response to selective pressures experienced at each location. The classification included a two-stage process. Firstly, hard and soft coral percent cover was converted to relative abundance of total coral cover (i.e., hard and soft coral cover). Data were first normalized (row-centered) and square-root transformed before Bray–Curtis dissimilarities were calculated [77] and a hierarchical cluster analysis was performed. Secondly, the hierarchical cluster analysis results were used to inform our final classification of the coral assemblages into groups of community types that preserved both the major differences in composition, while maintaining spatial congruency so as to facilitate interpretation of results in terms of potential pressures or processes that are likely to vary spatially. This second stage of the classification was undertaken informally by expert elicitation [30]. Within the final community type groupings, indicator taxa were identified using the Dufrêne–Legendre index [78]. All the statistical analyses were done using R version 3.4.4 [79] and vegan [80], tidyverse [81], dendextend [82] and indval [78] packages.
2.4. Analysis of the Composition of Juvenile and Adult Coral Assemblages
Prior to all analyses juvenile coral abundance was converted to density per area of substrate suitable for coral settlement. Juvenile density was calculated at the site level for each reef by dividing the total abundance of juvenile corals for a given site by the surveyed area multiplied by the proportion of substrate occupied by algae. Total algae cover for each site was estimated from concurrent point intercept transects. We used total algal cover as corals do not only settle on coralline algae and we wished to preserve the possible negative effects of heavy fouling by macroalgae. Data for both juvenile and adult coral assemblages were also summarized to provide reef-level estimates of taxonomic richness (hereafter richness) and taxonomic diversity (from here on in, diversity) using the Shannon–Wiener index.
Separate generalized linear models (GLM) were used to test whether there were differences in juvenile density, juvenile richness, adult richness, juvenile diversity and adult diversity among (a) location across the continental shelf and (b) community types. For each analysis, Tukey’s pairwise comparisons among shelf locations or community types were conducted with p-values corrected using the Benjamini–Hochberg method [83]. These models were fitted assuming gamma distribution of the responses [84]. Goodness of fit for all the models was assessed by examining residuals plots, which included Anscombe plots (fitted versus residuals) and quantile-quantile plots; model deviances were also evaluated using Pearson’s chi-squared test. All the GLM successfully passed all the visual diagnostics as well as Pearson’s chi-squared test. The stats [79] and multcomp [85] packages were used for these statistical analyses in R [79].
Principal coordinate analysis was used to examine the composition of both juvenile and adult coral assemblages. For these analyses reef level data were row-centered, and then square root transformed prior to Bray–Curtis dissimilarity matrices being calculated [77]. Species scores for coral taxa were overlaid on the principal coordinate analysis ordination plots to visualize the relationship among shelf position, community types and coral taxa with the ordination axes. These analyses were done in R using the vegan [80] package.
2.5. Relationship between Juvenile and Adult Coral Assemblages
To measure the association between juvenile and adult coral assemblages, observations for both data sets were first row-centered and then square root transformed and differences between the juvenile and adult coral assemblages were estimated as Bray–Curtis dissimilarities. To define a threshold for reefs that were similar we used the first quantile of the dissimilarity values among reefs, whereas reefs that were dissimilar were defined by the third quantile. We then fitted generalized additive models for location, scale and space using beta distributions, because the data was scaled between 0 and 1 [86]. Differences in dissimilarity across the continental shelf and between community types were tested using Tukey’s pairwise comparisons where p-values were corrected using the Benjamini–Hochberg method [83]. To assess the association between individual juvenile and adult coral taxa and their contribution to dissimilarity across the continental shelf and community types, we compared the relative abundance between juvenile and adults of each of the 34 taxa. Significant differences between these pairs were assessed using a Student’s t-test. These statistical analyses were carried out using the R packages vegan [80], gamlss [86] and multcomp [85].
3. Results
3.1. Coral Community Types
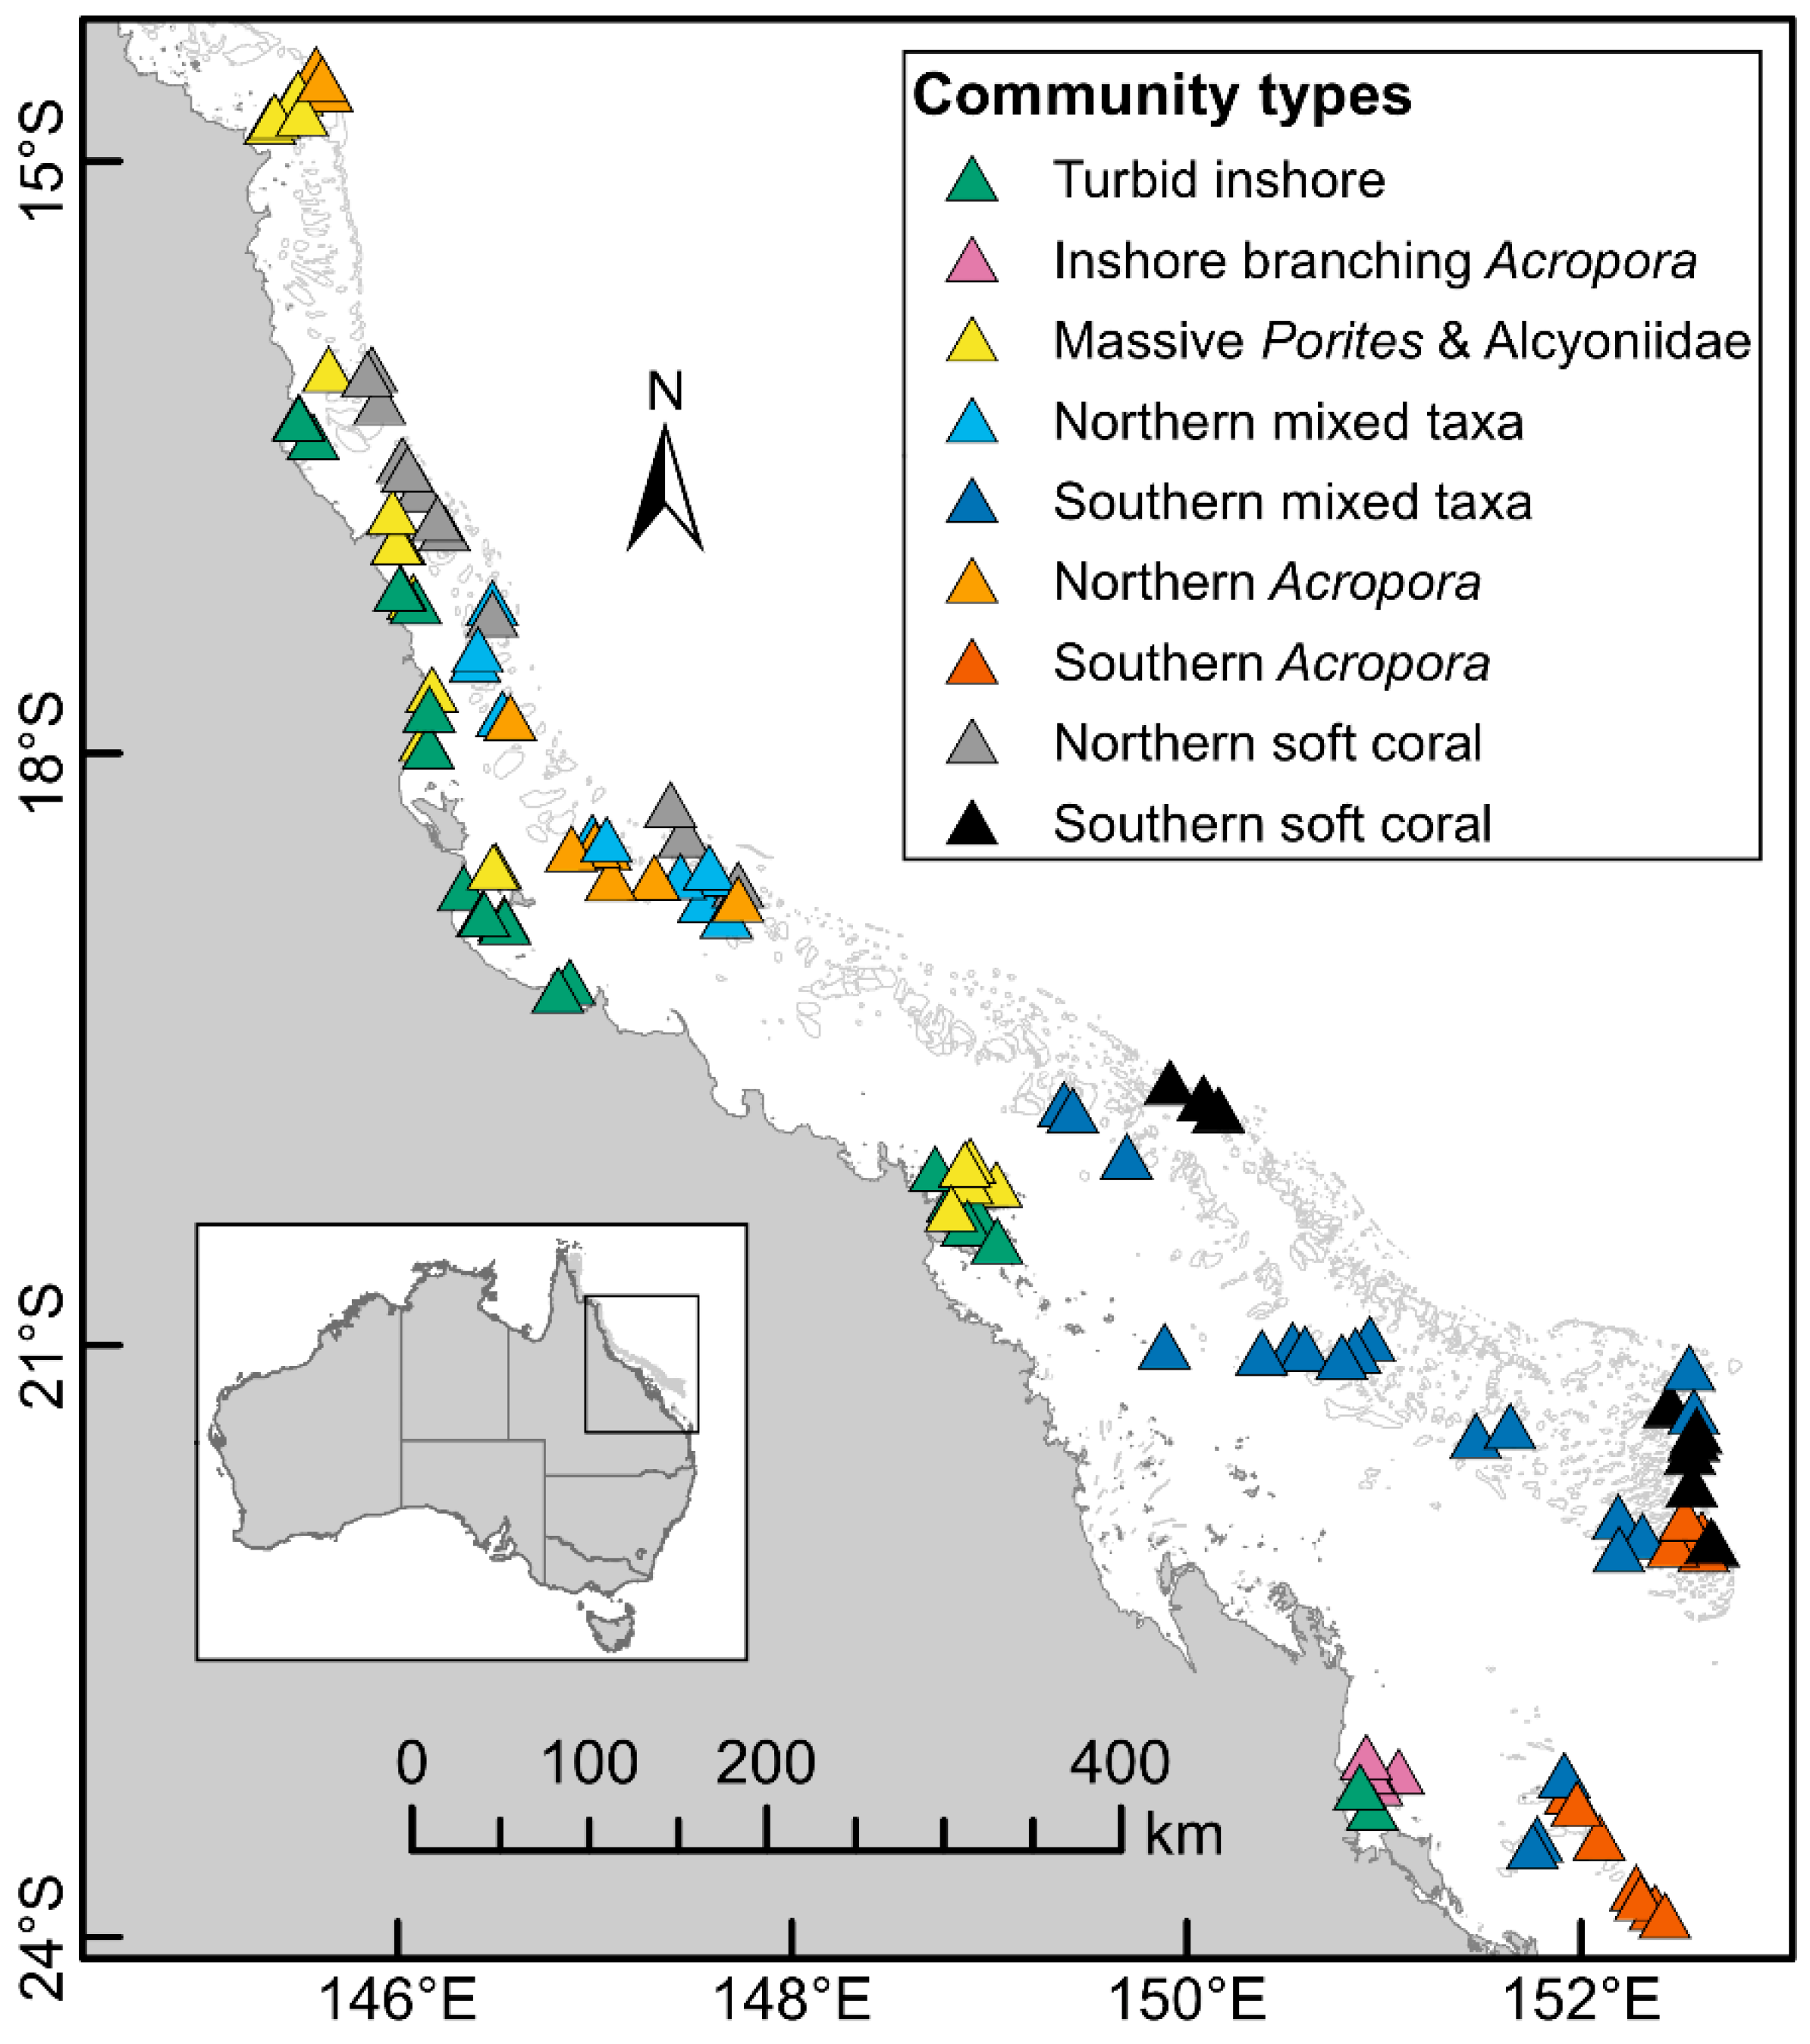
The hierarchical cluster analysis and expert elicitation resulted in nine community types (Figure 1) based on the maximum cover of hard and soft corals, with indicator taxa derived from the Dufrêne–Legendre index (Figure 1, Figure S1, Table S1). The community types were 1. Turbid inshore, 2. Inshore branching Acropora, 3. Massive Porites and Alcyoniidae, 4. Northern mixed coral taxa, 5. Southern mixed coral taxa, 6. Northern Acropora, 7. Southern Acropora, 8. Northern soft coral and 9. Southern soft coral communities.
Community types were generally constrained by location across the shelf, by latitudinal boundaries or by both (Figure 1, Figure S1). Turbid inshore communities occurred on 21 inshore reefs from 16° S to 23° S and were characterized by hard corals such as Goniopora/Alveopora, Porites rus, branching Porites, foliose Agariciidae, Galaxea, Pectiniidae, foliose Turbinaria as well as encrusting and foliose Fungiidae (primarily Podobacia). The community type Inshore branching Acropora was found exclusively on four inshore reefs from the Keppel Island group at 23° S, although it did not include all the reefs in that area. Inshore branching Acropora communities were dominated by high cover of branching/bottlebrush Acropora along with some tabulate/corymbose Acropora but few other coral taxa/groups. Massive Porites and Alcyoniidae communities included 21 reefs that occurred on inshore and mid-shelf reefs from 14° S to 20° S and were characterized by massive Porites and the soft coral family Alcyoniidae.
Mixed coral taxa communities were divided by latitude. Northern mixed coral taxa communities occurred on eleven mid and outer shelf reefs from 17° S to 18.9° S (Figure 1) and included no dominant indicator taxa (Table S1). Southern mixed coral taxa communities included 22 reefs from 19.6° S to 23° S, where the most abundant taxa were tabulate/corymbose Acropora and Montipora, while less abundant indicator taxa were branching Echinopora and mushroom Fungiidae.
Acropora communities were found on mid- and outer shelf reefs from 14° S to 23° S and were characterized by a high abundance of tabulate/corymbose Acropora. Like mixed coral taxa communities, Acropora communities were split by latitude, with ten Northern Acropora communities found between 14° S and 18° S, whereas the eleven Southern Acropora communities were found between 21° S and 24° S (Figure 1). Northern Acropora communities included digitate Acropora as an indicator taxon, but were dominated by tabulate/corymbose Acropora. Southern Acropora communities were characterized by tabulate/corymbose Acropora but also had a high abundance of branching/bottlebrush Acropora (Table S1).
Soft coral communities occurred on mid and outer shelf reefs and were characterized by Xeniidae, Nephtheidae and other soft corals and tabulate/corymbose Acropora. Northern soft coral communities occurred on twelve reefs from 15° S to 19.6° S and had the second highest abundances of the soft coral families Alcyoniidae, Nephtheidae, Xeniidae, other soft coral and an average of 8% tabulate/corymbose Acropora. The indicator taxa were Isopora, other Pocillopora and Stylophora. Southern soft coral communities occurred on ten reefs from 19° S to 22° S and indicator taxa were Xeniidae, other soft corals, as well as encrusting and submassive Porites (Figure S1).
3.2. Juvenile Coral Densities
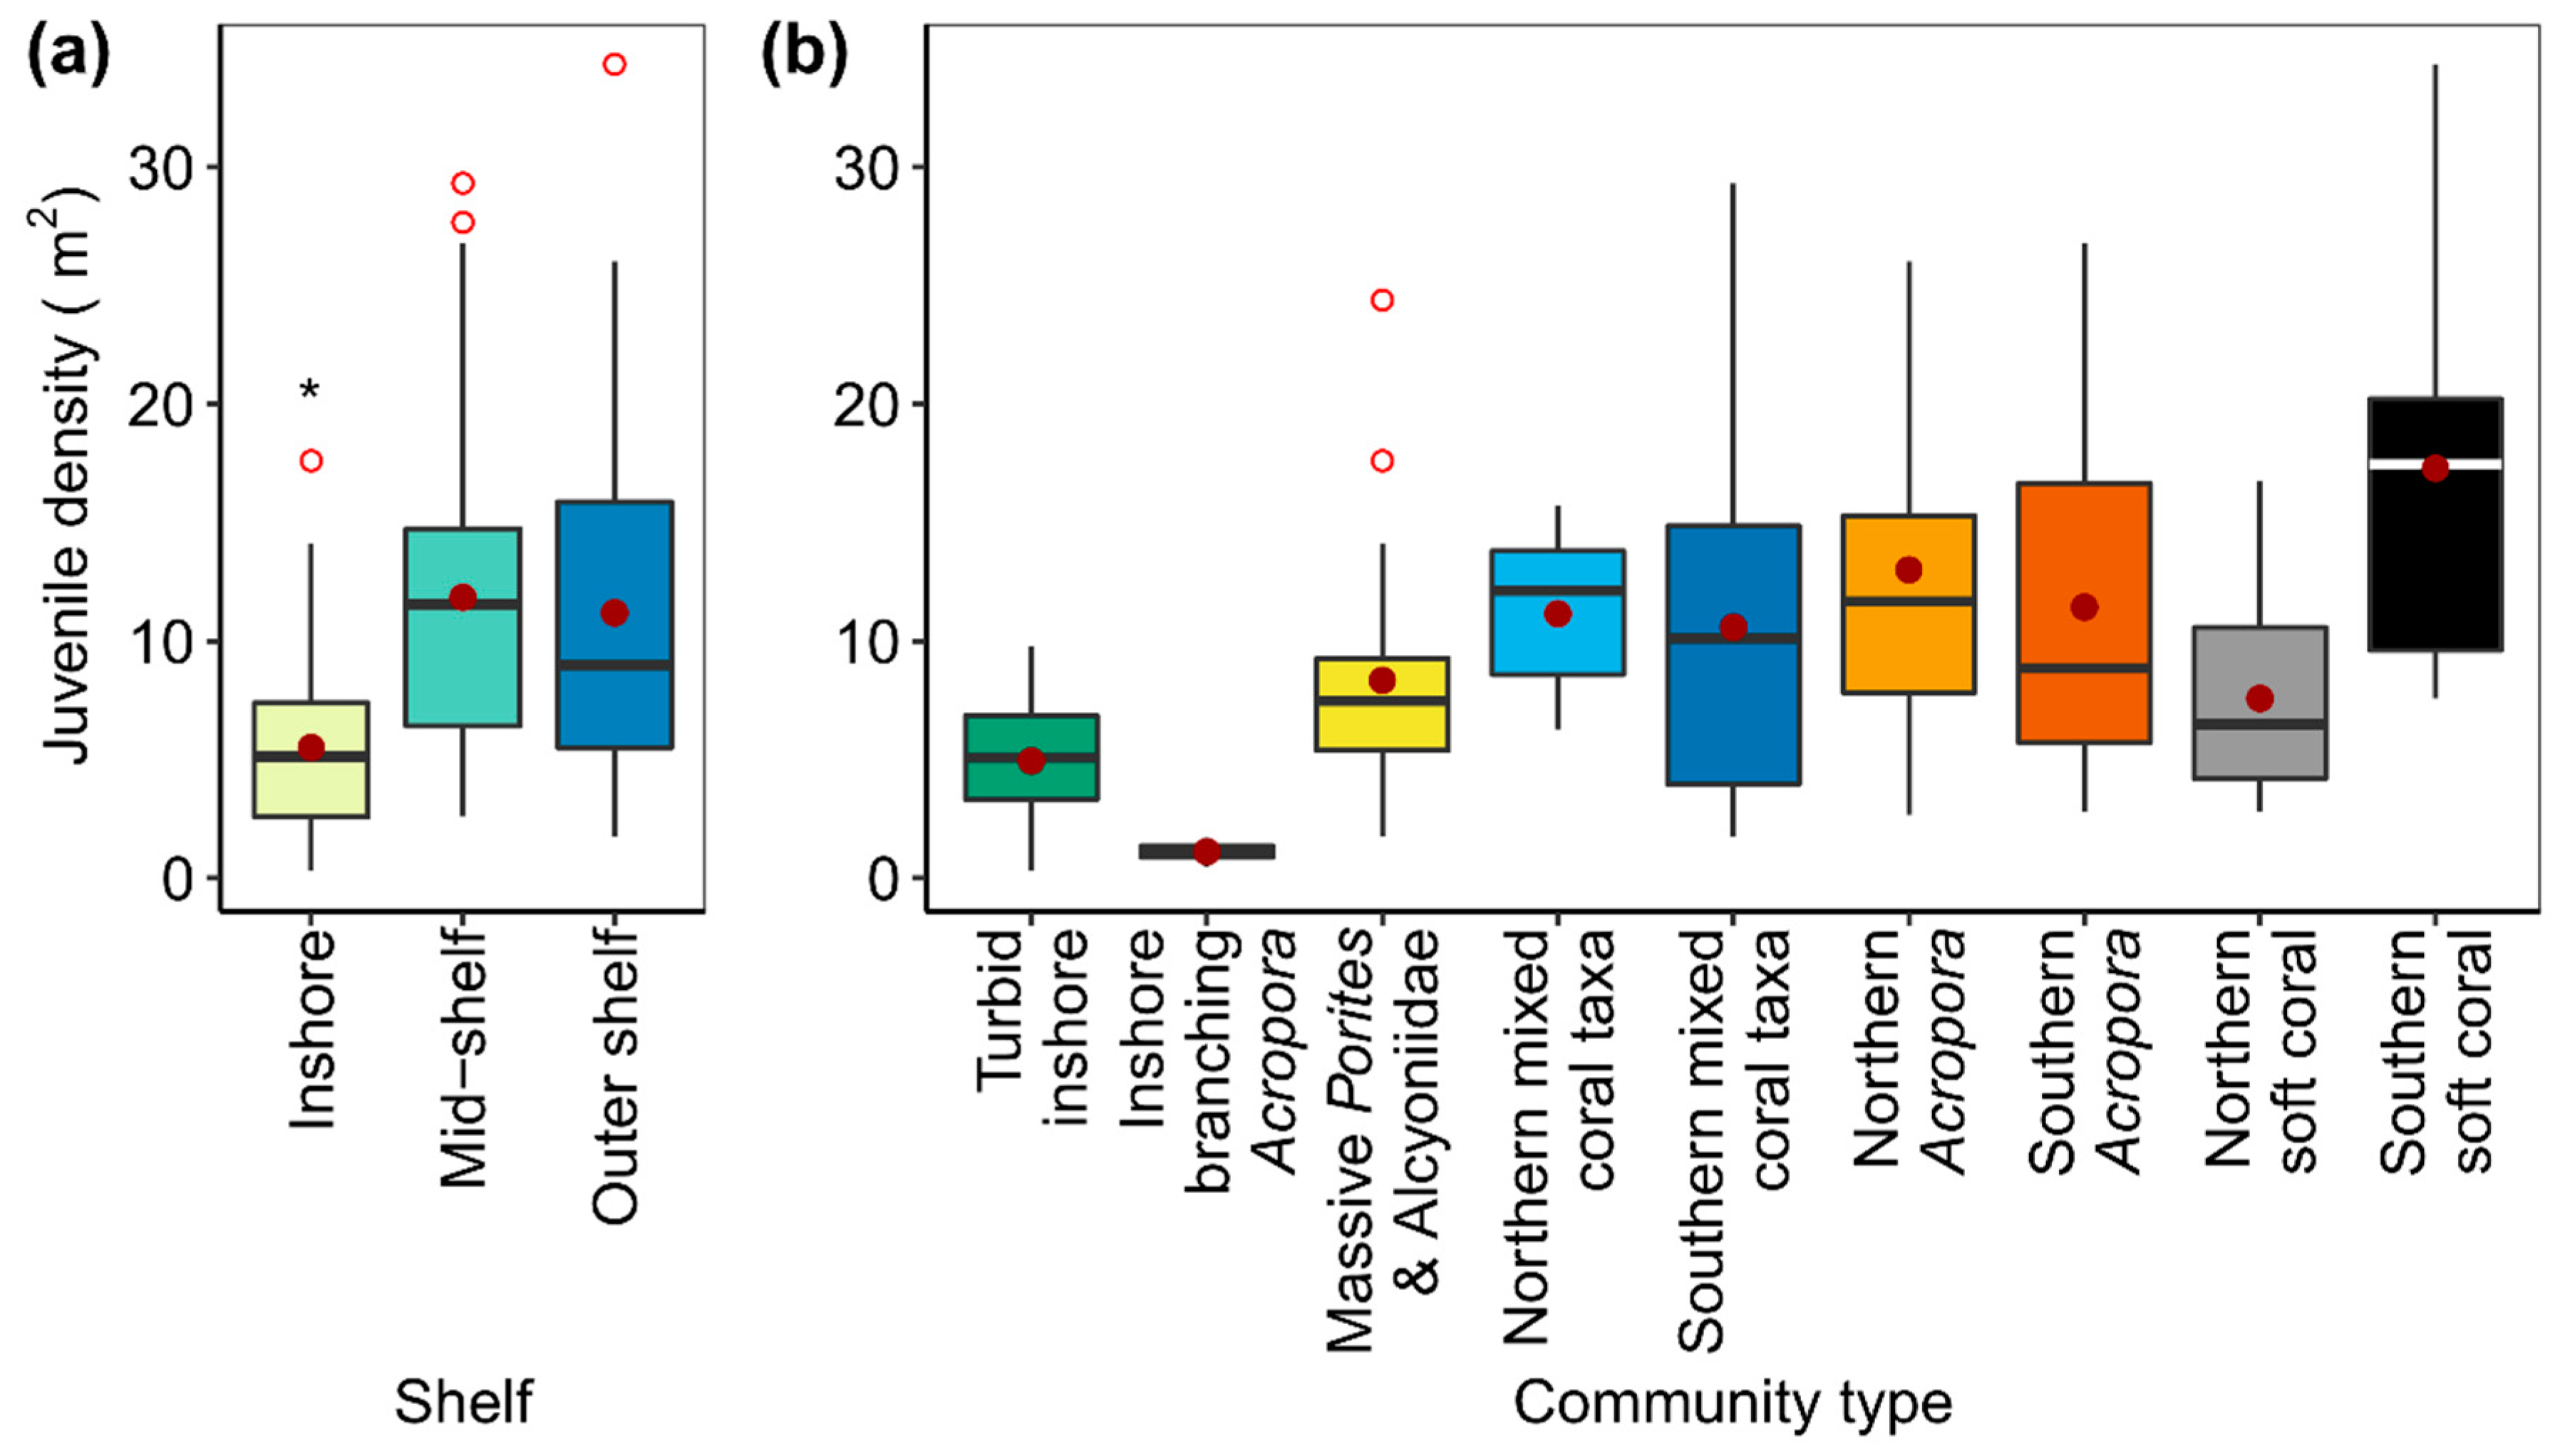
On each reef, juvenile density ranged from 0.2 to 39.8 per m² with a GBR-wide average of 9.9 (8.6, 11.2) per m2 (mean and Wald confidence intervals (CI)). Inshore reefs had average juvenile densities of 5.5, CI = (4.4, 6.6) per m², which were significantly lower than both mid-shelf at 11.8, CI = (9.9, 13.7) per m² and outer shelf reefs at 11.2, CI = (8.5, 13.9) per m² (pairwise comparisons p < 0.001, Figure 2a, Table S2). However, there was no difference between the juvenile densities on the mid-shelf and outer shelf reefs (pairwise comparison, p = 0.7, Figure 2a, Table S2). Juvenile densities also varied significantly among community types (Figure 2b, Table S2). Juvenile densities were lowest for Inshore branching Acropora communities at 1.1 CI = (0.6, 1.6) per m2 and differed significantly from all other community types (all pairwise comparisons resulted in p-values <0.05, Table S2). Juvenile densities in Turbid inshore communities were also low at 4.9, CI = (3.9, 5.9) per m2 and were significantly different from all other community types except Northern soft coral (pairwise comparisons, p-values were all <0.05, Table S2). Juvenile densities were highest in Southern soft coral communities at 17.3, CI = (11.9, 22.7) per m2 and differed significantly from Inshore branching Acropora, Turbid inshore, Massive Porites and Alcyoniidae, Southern mixed coral taxa and Northern soft coral communities (all pairwise comparisons had p < 0.05, Table A2).
3.3. Composition of Juvenile Coral Assemblages on GBR
The composition of GBR juvenile coral assemblages varied across the continental shelf and among community types (Figure 3). The composition of juvenile coral assemblages on inshore reefs was distinct from mid and outer shelf reefs, which were more similar to each other (Figure 3a, Table A1). Changes in assemblage structure across the shelf were expressed predominantly on the first axis of the principal coordinate analysis, accounting for 21% of the variance (Figure 3). The second axis (10% of variance) captured some of the differences in dominance between community types in the most abundant taxa Acropora and Porites.
The Inshore branching Acropora communities had depauperate juvenile coral assemblages that did not align with any coral taxa (Figure 3b, Table S2, Table A2). The composition of juvenile coral assemblages from Turbid inshore and Massive Porites and Alcyoniidae communities were mainly aligned with taxa that were spawners: Turbinaria, Goniopora/Alveopora, Lobophyllia, Pectiniidae, Favia, Moseleya and taxa that were both brooders and spawners (i.e., mixed mode) Goniastrea, Fungiids and Galaxea (Figure 3b, Table A2). The other community types overlapped and were mainly mid- and outer shelf reefs that aligned with the most abundant spawner Acropora and the brooders Seriatopora and Stylophora, as well as the mixed mode genera Pocillopora and Porites.
3.4. Relationship between Juvenile and Adult Coral Assemblages
3.4.1. Cross-Shelf
There was substantial variation in the relationship between GBR juvenile and adult coral assemblages. In particular, Bray–Curtis dissimilarity values ranged from 0.17 to 0.68 per reef with a GBR-wide mean of 0.37 and Wald’s confidence interval (CI) = (0.36, 0.39). Dissimilarity values between juvenile and adult coral assemblages on mid-shelf reefs (0.32, CI = (0.29, 0.35)) were significantly lower (pairwise comparison, p < 0.01) than both inshore reefs (0.43, CI = (0.40, 0.46)) and outer shelf reefs (0.39, CI = (0.36, 0.42)), which had similar comparable dissimilarity values (pairwise comparison, p < 0.061). However, John Brewer Reef, a mid-shelf reef, in the Northern Acropora community type, had the most dissimilar juvenile and adult coral assemblages (dissimilarity value = 0.68, Figure 4).
The higher dissimilarity between juvenile and adult coral assemblages on inshore and outer shelf reefs reflects the differences in both richness and diversity of juvenile and adult coral assemblages across the continental shelf. Juvenile richness was lower for outer shelf than mid-shelf assemblages, while diversity was lower for outer shelf than either inshore or mid-shelf assemblages (Figure S2a,c, Table S3, pairwise comparisons <0.05). In contrast, adult assemblages had lower richness on inshore reefs compared to mid- and outer shelf, whereas higher adult diversity occurred on the mid-shelf compared to either inshore or outer shelf coral assemblages (Figure S2a,c, Table S3, Table A1, pairwise comparisons <0.001).
The threshold for defining low dissimilarity within juvenile and adult coral assemblages was <0.297, whereas high dissimilarity of juvenile and adult coral assemblages was >0.436. Nearly half of mid-shelf reefs had low dissimilarity, compared with 7% of inshore and 13% of outer shelf reefs (Table S4). A third of inshore and outer shelf reefs were within the high dissimilarity threshold, whereas only 16% of mid-shelf reefs had high dissimilarity (Table S4).
3.4.2. Community Types
Dissimilarity values varied significantly among community type (Figure 4b, Table S5). Mean dissimilarity values between juvenile and adult coral assemblages were significantly higher for the Inshore branching Acropora (0.52, CI = (0.41, 0.63)), than dissimilarity values for all other community types (all pairwise comparisons were p < 0.05, Table S5) with the exception of Turbid inshore. The Inshore branching Acropora adult coral assemblages were dominated by Acropora (mean cover ± se of 45.73% ± 9.98%, ~98% relative abundance, Table A2, Figure S3). With few other genera observed in the adult coral assemblage, this dominance resulted in significantly lower adult richness and diversity of the Inshore branching Acropora communities compared to all other community types (Figure S2b,d, Table S6, all pairwise comparisons p < 0.05). Although juvenile coral assemblages of Inshore branching Acropora communities were also dominated by Acropora (~50% relative abundance, Table A2) with significantly lower juvenile densities, richness and diversity than all other community types (Figure S2b,d, Table S2, Table S6, all pairwise comparisons p < 0.05), the substantially lower relative abundance of Acropora in the juvenile coral assemblages ensured higher diversity relative to the adult coral assemblages (Table A2).
Turbid inshore communities also had high dissimilarity (0.44, CI = (0.40, 0.48)) and differed significantly from the community types with the lowest dissimilarity between juvenile and adult coral assemblages: Northern mixed coral taxa (0.31, CI = (0.27, 0.35)), Southern mixed coral taxa (0.34, CI = (0.30, 0.38)), Northern Acropora (0.33, CI = (0.25, 0.41)) and Southern soft coral (0.34, CI = (0.30, 0.38); all pairwise comparisons p < 0.05, Table S5, Figure 4b, Figure S2b). Turbid inshore communities had similar juvenile richness to all but Inshore branching Acropora communities, which contrasted with significantly lower adult richness of Turbid inshore communities than all community types other than Inshore branching Acropora adult richness, which was significantly lower (Figure S2b, Table S6, pairwise comparisons p < 0.05). In comparison, these Turbid inshore communities had significantly higher juvenile diversity than the Inshore branching Acropora, Southern Acropora, Northern soft coral and Southern soft coral communities, while adult diversity was significantly higher than Inshore branching Acropora and Southern Acropora, but not significantly different from other community types (Table S6).
The dissimilarity values were lowest for Northern mixed coral taxa and Northern Acropora communities (Figure 4b). While 50% of Northern Acropora and 42% of Northern soft coral communities were in the low dissimilarity threshold (Table S7), only 36% of Southern Acropora communities were within the low dissimilarity threshold and were mid-shelf reefs (Table S7). In contrast, 55% of Southern Acropora communities reached the threshold for high dissimilarity and these were outer shelf reefs (Table S7). Southern Acropora adult communities were mainly composed of tabulate/corymbose Acropora (43.46% ± 6.78 se, Figure S3, ~70% relative abundance, Table A2) and adult diversity was significantly lower than all other community types, except for Inshore branching Acropora communities, which had the lowest adult diversity (Figure S2d, pairwise comparisons p < 0.05, Table S6).
3.4.3. Relative Abundance
Across all the reefs in this study, two coral taxa, Acropora and Porites had the highest relative abundances, accounting for 42.4% of GBR juvenile assemblages and 47.8% of GBR adult assemblages (Figure 5). Additionally, the relative abundance of Pocillopora was greater than 5% for both juvenile and adult hard coral taxa, as well as adult Montipora, juvenile Favia and juvenile Fungiidae (Figure 5). All other taxa had low relative abundances (<5%), but collectively these taxa (30 adult, 29 juvenile) accounted for nearly the same relative abundance as the two most common genera in the juvenile (41.6%) and adult (39.8%) coral assemblages (Figure 5).
The coral taxa with significant differences in mean relative abundance of juveniles and adults differed across the continental shelf and between community types. Across all reefs and across the shelf, the broadcast spawners, Acropora and Diploastrea, had lower juvenile mean relative abundances than adult counterparts. Differences between Acropora mean relative abundances of adults were significantly higher than juveniles for Inshore branching Acropora, Northern mixed coral taxa, Southern mixed coral taxa and Southern Acropora communities, whilst for Diploastrea, juveniles were absent or had very low mean relative abundances (Table A1 and Table A2). For the taxa Porites and Fungiidae, which have mixed modes of reproduction, juvenile mean relative abundances were higher than adult mean relative abundances, at the GBR-wide level and in mid- and outer shelf positions (Table A1 and Table A2). Within community types the relative abundance of Porites was significantly higher in juvenile coral assemblages in Northern mixed coral taxa, Southern mixed coral taxa and Northern soft coral communities, whereas relative abundance of adults were significantly greater in Massive Porites and Alcyoniidae communities (Table A2). Fungiidae had higher mean juvenile relative abundances in Turbid inshore, Massive Porites and Alcyoniidae, Northern mixed coral taxa, Northern Acropora and Northern soft coral communities (Table A2). The brooders Isopora and Seriatopora had opposite trends in relative abundance between life stages, with Isopora having greater mean adult relative abundance than juveniles for mid-shelf, outer shelf reefs, Southern mixed coral taxa, Northern soft coral and Southern soft coral communities, whereas Seriatopora had greater mean juvenile relative abundance than adults on outer shelf reefs and in Northern soft coral communities.
Juvenile and adult Moseleya were only found on inshore reefs and in community types containing inshore reefs (Table A1 and Table A2). There were 17 coral taxa absent, in both juvenile and adult coral taxa for Inshore branching Acropora communities (Table A2). Some adult coral taxa were absent, but the corresponding juveniles were present at low relative abundance for Inshore branching Acropora and Northern soft coral communities (Table A2). On the other hand, juveniles from some coral taxa were absent, where the equivalent adults were present at low relative abundances for all community types other than Northern mixed coral taxa and Southern Acropora communities. Most notably, juvenile Diploastrea only occurred on mid-shelf and outer shelf reefs, which equated to two of the seven community types where adult Diploastrea were found (Table A1 and Table A2).
Inshore branching Acropora adult coral assemblages were dominated by Acropora, while juvenile assemblages had low juvenile densities that comprised of a greater diversity of taxa (Table A2). In fact, only one juvenile from each of Pocillopora, Leptastrea and Lobophyllia were observed on Inshore branching Acropora reefs in our study. In Turbid inshore communities, Turbinaria a broadcast-spawner had the highest relative abundance among the juvenile assemblage while Porites was most abundant among the adult assemblage (Table A2). The differences in relative abundances between juvenile and adult coral taxa of Agariciidae, Favia, Fungiidae, Turbinaria, Goniopora/Alveopora, Echinopora and Moseleya mainly contributed to the dissimilarity within the Turbid inshore community type (Table A2).
4. Discussion
This study reported significant spatial heterogeneity of juvenile densities, juvenile taxonomic composition and the relationship between juvenile and adult coral assemblages across the continental shelf and among community types on the GBR. Juvenile densities were highly variable, although lowest for inshore reefs, but consistent with the range of values for reefs within the Indo-Pacific region such as French Polynesia, Seychelles, Tonga and New Caledonia [24,33,34,35,45], although lower than densities reported from the Red Sea [23,87]. The spatial variation in taxonomic composition of juvenile coral assemblages (Figure 2) broadly reflects differences imposed by the gradient of environmental conditions (for example, from inshore reefs exposed to terrestrial runoff, to outer reefs influenced by wave exposure and proximity to Coral Sea) across the GBR [54,61,88,89]. Cross-shelf changes in adult coral community composition have been previously described for the GBR, where inshore communities differ from mid- and outer shelf communities (Figure S3) [51,53,62]. Our results described broadly similar cross-shelf patterns for juvenile coral assemblages (Figure 3a, Figure S3). The dissimilarity between juvenile and adult coral assemblages we observed (Figure 4) were broadly consistent with those reported from Florida (28–70% dissimilarity) [39], for juvenile coral assemblages from the Red Sea (~30–70% dissimilarity within reef sites) [23], between coral assemblages within the GBR and Coral Sea (~5–60% dissimilarity, mean dissimilarity of 37.7%) [90], as well as French Polynesia (~20%–45% dissimilarity) but not Indonesia, Papua New Guinea, Solomon Islands and Samoa (45–90% dissimilarity) [6]. Furthermore, this demonstrates the resultant processes governing larval supply, settlement and early post-settlement survival are fundamental in shaping adult coral assemblages. However, we also identified variability in the similarity of juvenile and adult coral assemblages among community types suggesting differences in the processes shaping coral assemblages, such as a combination of recruitment, competition, predation, disease and susceptibility to episodic, acute and chronic disturbances beyond the early life history stages can be implied [38].
Within the spatial domain of our study we found that reefs at environmental extremes of either water quality (i.e., inshore reefs) or southern latitude had the most dissimilar juvenile and adult coral assemblages (Figure 3 and Figure 4). The greatest dissimilarity occurred on inshore reefs with community types classified as Turbid inshore or Inshore branching Acropora (Figure 4). Corals in turbid inshore areas of the GBR exist in environments where total suspended sediment loads reach levels that are detrimental to coral fertilization, settlement, juvenile survival and subsequent growth of some species [29,54,69,91,92,93]. While these conditions are likely influencing the lower density and distinct composition of juvenile coral assemblages on most inshore reefs, the richness and diversity of Turbid inshore juvenile coral assemblages remain comparable to those further offshore (Figure S2). That adult richness diverges from that observed at more offshore reefs and adult diversity declines, implies that the high dissimilarities between juvenile and adult Turbid inshore communities reflects additional selective pressures beyond the juvenile stage (Figure S2). It is to be expected that selective pressures will be strongest once species-specific critical thresholds are exceeded. As such maximum selective pressures ultimately shaping the adult coral assemblage will be realized during infrequent or episodic events [35,38,70]. The greater representation of coral taxa characterized as stress-tolerant or opportunists on inshore reefs supports this hypothesis [42].
In contrast, the high dissimilarity between juvenile and adult coral assemblages for the Inshore branching Acropora and Southern Acropora communities are likely to reflect the competitive dominance of Acropora implicit in the classification of these community types [42,94]. The very low density of juvenile corals observed in Inshore branching Acropora communities (mean juvenile density of 1.1 per m2, Figure 2 and Figure 3) reflects the almost complete absence of coral recruitment into the understory of branching Acropora thickets that dominate these communities (authors’ pers. obs). In Southern Acropora communities there is evidence for declining diversity between juvenile and adult coral assemblages, with adult coral assemblages more consistently showing lower diversity compared to other community types than do the juvenile coral assemblages (Figure S2). This decline in diversity is expected as moderate to high coral cover of tabulate and corymbose Acropora over-top slower growing or more prostrate taxa [94]. Intermediate between these extremes, the lower dissimilarity between juvenile and adult coral assemblages observed over most of the mid- and some outer shelf reefs suggest selective pressures acting after juvenile life stages neither overwhelmingly select against, or promote competitive dominance of, the constituent taxa.
Patterns in juvenile and adult coral assemblages among community types were partly due to differences in the reproductive strategies of the most common genera [10]. We found the brooders Isopora, Stylophora, Seriatopora and mixed mode brooders and spawners, Pocillopora, were lowest in both juvenile and adult coral assemblages on inshore reefs (Table A1). Inshore GBR reefs typically have less area of reef habitat than offshore reefs, which dictates lower population sizes, and as such a reliance on locally brooded larvae may make species more vulnerable to local extirpation [95]. The relative abundance of mixed mode Pocillopora juveniles was comparatively even among the community types on mid- and outer shelf communities, but adult abundance was higher in Northern Acropora and Northern soft coral communities (Table A1 and Table A2), suggesting conditions for growth and survival for this genus is more favorable on the Northern GBR. Pocillopora has often been described as a “loser” after coral bleaching [96,97], but there is increasing evidence that on reefs with more offshore condition the dominance of both adults (as survivors) and juveniles have increased [49].
Among the spawners, juvenile Diploastrea only occurred in two of the seven community types on mid-shelf and outer shelf, where their adults were found suggesting this species is a poor recruiter (Table A1 and Table A2). Diploastrea is a long-lived slow growing massive coral with only one species in the genus [10]. Diploastrea is considered robust to COTS or cyclone damage [98] and has been susceptible to coral bleaching in severe bleaching events, resulting in either full recovery or partial mortality [99,100]. Reduced reproductive success as a consequence of coral bleaching [101] may result in recruitment failure and thus could make Diploastrea vulnerable to extinction. While other species with similarly poor recruitment potential and vulnerability to extinction may occur on the GBR, our genus level data may mask these patterns.
Contrasting relationships between juvenile and adult life stages of brooding taxa were observed in our study. The relative abundance of juvenile Seriatopora, a brooding genus known for its weedy life history strategy and bleaching sensitivity, [102] was highest in Northern Acropora and Southern soft coral communities and double that of adults in these locations (Table A2), suggesting chronic warming may be affecting the survival of the adults in these regions [30]. In comparison, Isopora adults were relatively abundant in both the Northern and Southern soft coral communities (Table A2), but juvenile abundance was uniformly low, an indication of a bottleneck or a community shift away from this genus. Despite these different patterns in juvenile and adult abundance, Isopora is known for bleaching sensitivity [103], suggesting the ability of this genus to repopulate will be hampered by reduced broodstock under chronic warming [104]. Alternatively, Isopora may have few juveniles because their size at settlement is large (2–2.7 mm) compared to other coral genera (~0.35–1.37 mm) [104] and the linear extension of Isopora recruits is rapid (~17–21 mm/year) [13], meaning colonies may outgrow the juvenile size class relatively quickly [37]. An experimental study found brooders were more likely to dominate where coralline algae was not available as a settlement cue [105] or more generally where survival of larvae was low [106]. However, in our study a relatively high abundance of brooders and soft corals co-occurred with a diversity of broadcast spawning taxa on mid– and outer shelf reefs where coralline and turf algae were abundant [62].
Similarity in adult and juvenile coral assemblages has been ascribed to density dependent feedbacks and stock-recruitment relationships [25]. On the GBR these processes are likely to be facilitated by higher connectivity and larval retention where the reefs are closely aggregated [27]. In addition, intermediate disturbance plays a role in maintaining a “mixed” community comprised of corals with diverse life history strategies [7,42]. On the GBR high dominance of Acropora in recruits [107,108] indicated the potential for this genus to dominate coral assemblages due to its competitive life history traits [42]. However, Acropora is a “loser” with respect to adult declines due to disturbances that may limit the ability of Acropora to dominate coral assemblages in these environments [29]. In other reef regions declines in adult Acropora have been maintained by recruitment failure [37] resulting in shifts to other genera such as Pocillopora [49] or macroalgal dominance [109]. Where corals that create structural complexity have been lost and the dominant coral types have shifted to simple forms, shelter for fish and invertebrates is reduced [2,4,110]. That Acropora were not attaining high relative abundance as adults in our study despite an almost ubiquitous presence as juveniles suggests the innate competitive advantage of this genus is being tempered by pressures after the juvenile stage on the majority of the GBR.
Variability in dissimilarity values occurred within each community type (Figure 4). Differences in adult coral cover (Figure S3) and variable dissimilarity values in each community type are expected where reefs are at different stages of the disturbance and recovery continuum. The high dissimilarity observed at John Brewer Reef, may have reflected a transient shift while the reef was in the early stages of recovery. Adult cover was very low due to a recent outbreak of COTS in 2004 and low juvenile coral densities were observed in this study (Figure 2, Figure S3). In the short-term, bleaching mortality can also alter the juvenile and adult coral assemblages differentially [40,111]. Long-term studies after disturbance have shown coral assemblages can recover and reassemble even after severe disturbances, provided they have around a decade or more largely free from additional pressures and have external larval sources or the ability to self-seed [31,43,44,48,93]. At Scott Reef in Western Australia [43] and in the Maldives [44], similar patterns of recovery after severe mortality caused by coral bleaching in 1998 were observed. During early recovery, the abundance of juvenile corals was low due to the reduced broodstock and the composition of juvenile coral assemblages was markedly different due to the emergency spawning of non-dominant taxa that occurred before the bleaching event [44]. It took nearly a decade for the juvenile assemblage to resemble the pre-bleaching assemblage [44]. While we found divergences in juvenile and adult coral assemblages, long-term studies are required to assess whether temporary lags or permanent shifts in juvenile and adult coral assemblages are occurring on the GBR and at what scale.
Our results are an important recent status or “baseline” against which to monitor the effects of recent cumulative disturbance events on the composition of GBR coral assemblages. Apart from turbid inshore reefs, where water quality is a significant selective pressure, coral assemblage composition appeared to be mediated by recruitment processes that culminate in juvenile coral assemblages [23,44]. The juvenile surveys presented pre-date a number of severe disturbances over the last decade; including intense cyclones [72] and severe thermal coral bleaching in 2016 and 2017 [71,111]. The recent disturbances have reduced coral cover at large spatial scales [71]. These disturbances have had differential impacts on juvenile and adult abundances across taxa and short-term recruitment failure has been demonstrated [40,46,71,112]. The concern raised by our baseline data is that prior to these recent disturbances, recruitment potential for some taxa appeared low while post-recruitment processes appeared sufficient to limit the competitive success of Acropora. Reduced populations and increased pressures thus have the potential to extend observed short-term shifts into long-term changes in community composition [102].
Supplementary Materials
The following are available online at https://www.mdpi.com/1424-2818/11/6/85/s1, Table S1: Mean (± se) percent cover of maximum hard and soft coral cover per community type for GBR…, Figure S1: Principal coordinate analysis (PCoA) of maximum coral cover on reefs between 1997 and 2017, Table S2: Summary tables of GLM and pairwise comparisons for juvenile densities between co Summary tables of GLM and pairwise comparisons of juvenile densities for shelf and community type, Figure S2: Boxplots of mean juvenile and adult taxonomic richness (a) across the shelf, (b) by community types; mean diversity measured using the Shannon-Wiener index (c) across the shelf and (d) by community types, Table S3. Summary of GLM and pairwise comparison tables of juvenile and adult coral richness and diversity across the continental shelf, Table S4. Summary of percent of reefs within the thresholds for low or high dissimilarity across the continental shelf, Table S5: Summary of GLM and pairwise comparison tables of Bray-Curtis dissimilarity of juvenile and adult coral assemblages across the continental shelf and by community type, Table S6. Summary of GLM and pairwise comparison for juvenile and adult coral richness and diversity for community types. Table S7: Summary of percent of reefs in the within the thresholds for low and high dissimilarity per community type, Figure S3: Principal coordinate analysis (PCoA) of adult coral assemblages on GBR.
Author Contributions
Conceptualization, M.J.J. and K.O.; methodology, P.M., A.A.T. and M.J.J.; formal analysis, A.A.T., P.M. and M.J.J.; resources, M.J.J., A.A.T., P.M. and K.O.; data curation, A.A.T.; writing—original draft preparation, M.J.J., K.O., A.A.T. and P.M.; writing—review and editing, M.J.J., A.A.T., P.M., K.O.
Funding
This research was funded by the Australian Government’s Marine and Tropical Sciences Research Facility.
Acknowledgments
We thank past and present member of the AIMS LTMP and MMP who collected the data used in these analyses. Thanks to the AIMS Data Centre, especially Greg Coleman for data management. B. Schaffelke, M. Emslie, M. Gonzalez-Rivero, K. Johns provided helpful comments during the development of this manuscript. We acknowledge the Traditional Owners of the sea country in which we conducted our work. Thank you to the reviewers for their constructive feedback that improved our manuscript.
Conflicts of Interest
The authors declare no conflict of interest. The funders had no role in the design of the study; in the collection, analyses, or interpretation of data; in the writing of the manuscript, or in the decision to publish the results.
Appendix A

Table A1.
Relative abundance of juvenile and adult coral taxa (mean ± se) for all reefs surveyed, by shelf position. Bold values represent which pairs of coral taxa that had significantly different population mean ranks (p < 0.05) from nonparametric Wilcoxon paired tests.
Table A1.
Relative abundance of juvenile and adult coral taxa (mean ± se) for all reefs surveyed, by shelf position. Bold values represent which pairs of coral taxa that had significantly different population mean ranks (p < 0.05) from nonparametric Wilcoxon paired tests.
| Taxon | Inshore | Mid-Shelf | Outer Shelf | |||
|---|---|---|---|---|---|---|
| Juvenile | Adult | Juvenile | Adult | Juvenile | Adult | |
| Acropora | 14.82 ± 2.35 | 24.92 ± 4.43 | 21.84 ± 1.58 | 28.03 ± 1.89 | 29.26 ± 3.01 | 47.53 ± 5.12 |
| Porites | 10.12 ± 1.51 | 17.8 ± 3.31 | 24.74 ± 2.05 | 16.7 ± 1.49 | 30.29 ± 3.61 | 12.01 ± 1.98 |
| Montipora | 4.11 ± 0.71 | 7.81 ± 1.7 | 5.72 ± 1.02 | 8.51 ± 1.11 | 2.6 ± 0.5 | 4.71 ± 0.77 |
| Pocillopora | 2.39 ± 0.61 | 1.34 ± 0.43 | 6.68 ± 0.73 | 7.52 ± 1.1 | 8.05 ± 0.76 | 6.16 ± 0.88 |
| Goniopora | 5.18 ± 1.04 | 10.11 ± 2.33 | 0.42 ± 0.11 | 0.76 ± 0.16 | 0.23 ± 0.15 | 0.64 ± 0.21 |
| Echinopora | 0.74 ± 0.24 | 2.64 ± 0.98 | 1.28 ± 0.23 | 4.17 ± 0.68 | 0.5 ± 0.15 | 1.46 ± 0.23 |
| Isopora | 0.08 ± 0.05 | 0.18 ± 0.11 | 0.44 ± 0.14 | 1.88 ± 0.36 | 1.01 ± 0.24 | 6.93 ± 1.55 |
| Agariciidae | 1.74 ± 0.44 | 4.67 ± 0.85 | 0.89 ± 0.17 | 1.09 ± 0.16 | 0.5 ± 0.14 | 0.64 ± 0.18 |
| Stylophora | 0.26 ± 0.09 | 0.78 ± 0.24 | 2 ± 0.55 | 2.7 ± 0.35 | 4.79 ± 0.99 | 3.33 ± 0.51 |
| Favia | 7.59 ± 0.95 | 2.05 ± 0.42 | 4.93 ± 0.89 | 2.07 ± 0.22 | 2.81 ± 0.7 | 2.12 ± 0.28 |
| Pectiniidae | 3.35 ± 0.63 | 3.52 ± 0.8 | 0.97 ± 0.16 | 1.68 ± 0.26 | 0.1 ± 0.05 | 0.35 ± 0.11 |
| Goniastrea | 4.47 ± 1.1 | 2.11 ± 0.74 | 2.31 ± 0.3 | 1.64 ± 0.13 | 1.09 ± 0.24 | 1.62 ± 0.24 |
| Seriatopora | 0.69 ± 0.27 | 0.5 ± 0.19 | 3.64 ± 0.57 | 3.01 ± 0.53 | 4.27 ± 1.23 | 1.4 ± 0.51 |
| Galaxea | 4.37 ± 0.73 | 2.89 ± 0.86 | 1.23 ± 0.31 | 1.42 ± 0.31 | 0.77 ± 0.2 | 0.55 ± 0.12 |
| Fungiidae | 8.3 ± 1.76 | 1.88 ± 0.38 | 4.58 ± 0.53 | 2.26 ± 0.35 | 1.3 ± 0.41 | 0.27 ± 0.08 |
| Turbinaria | 8.57 ± 2.21 | 3.44 ± 0.98 | 0.22 ± 0.07 | 0.49 ± 0.19 | 0.15 ± 0.07 | 0.44 ± 0.19 |
| Lobophyllia | 4.77 ± 0.79 | 2.02 ± 0.34 | 3.37 ± 0.41 | 1.45 ± 0.23 | 1.46 ± 0.59 | 0.49 ± 0.19 |
| Platygyra | 1.37 ± 0.25 | 1.24 ± 0.22 | 1.2 ± 0.2 | 1.47 ± 0.17 | 0.87 ± 0.23 | 1.25 ± 0.25 |
| Other hard coral | 2.3 ± 0.72 | 0.15 ± 0.04 | 1.58 ± 0.27 | 2.39 ± 0.22 | 2.43 ± 0.56 | 1.12 ± 0.14 |
| Favites | 2.97 ± 0.48 | 1.05 ± 0.24 | 2.87 ± 0.34 | 1.51 ± 0.14 | 1.92 ± 0.54 | 1.18 ± 0.2 |
| Diploastrea | 0 ± 0 | 1.28 ± 0.42 | 0.02 ± 0.02 | 1.33 ± 0.48 | 0.01 ± 0.01 | 0.89 ± 0.37 |
| Merulina | 1.1 ± 0.22 | 1.3 ± 0.36 | 0.94 ± 0.25 | 1.31 ± 0.24 | 0.33 ± 0.16 | 0.54 ± 0.18 |
| Siderastreidae | 1.86 ± 0.55 | 1.58 ± 0.96 | 0.72 ± 0.2 | 1.08 ± 0.31 | 1.25 ± 0.36 | 0.52 ± 0.18 |
| Cyphastrea | 1.87 ± 0.5 | 1.37 ± 0.5 | 2.48 ± 0.32 | 0.81 ± 0.1 | 1.34 ± 0.27 | 0.38 ± 0.08 |
| Hydnophora | 0.43 ± 0.1 | 0.98 ± 0.33 | 0.65 ± 0.14 | 0.93 ± 0.13 | 0.16 ± 0.07 | 0.53 ± 0.1 |
| Other Faviidae | 1.48 ± 0.54 | 0.91 ± 0.4 | 0.53 ± 0.15 | 0.73 ± 0.12 | 0.29 ± 0.14 | 0.5 ± 0.09 |
| Symphyllia | 0.04 ± 0.03 | 0.11 ± 0.04 | 0.23 ± 0.07 | 0.97 ± 0.13 | 0.1 ± 0.04 | 0.63 ± 0.12 |
| Montastrea | 0.54 ± 0.16 | 0.09 ± 0.04 | 2.11 ± 0.29 | 0.82 ± 0.1 | 1.26 ± 0.31 | 0.72 ± 0.13 |
| Leptoria | 0.37 ± 0.12 | 0.34 ± 0.18 | 0.31 ± 0.11 | 0.64 ± 0.09 | 0.18 ± 0.09 | 0.47 ± 0.1 |
| Astreopora | 0.28 ± 0.14 | 0.42 ± 0.2 | 0.58 ± 0.15 | 0.37 ± 0.06 | 0.25 ± 0.14 | 0.47 ± 0.11 |
| Leptastrea | 0.81 ± 0.17 | 0.31 ± 0.11 | 0.19 ± 0.05 | 0.13 ± 0.03 | 0.16 ± 0.07 | 0.08 ± 0.06 |
| Euphyllidae | 0.54 ± 0.15 | 0.16 ± 0.06 | 0.21 ± 0.08 | 0.09 ± 0.03 | 0.05 ± 0.03 | 0.02 ± 0.02 |
| Acanthastrea | 0.52 ± 0.19 | 0.02 ± 0.01 | 0.13 ± 0.04 | 0.07 ± 0.02 | 0.23 ± 0.13 | 0.06 ± 0.02 |
| Moseleya | 1.96 ± 0.58 | 0.04 ± 0.02 | 0 ± 0 | 0 ± 0 | 0 ± 0 | 0 ± 0 |
Table A2.
Relative abundances of juvenile and adult coral taxa (mean ± se) by community type. Bold values represent significant t-tests (p < 0.05) between juvenile and adults per taxa.
Table A2.
Relative abundances of juvenile and adult coral taxa (mean ± se) by community type. Bold values represent significant t-tests (p < 0.05) between juvenile and adults per taxa.
| Taxon | Turbid Inshore | Inshore Branching Acropora | Massive Porites & Alcyoniidae | Northern Mixed Coral Taxa | Southern Mixed Coral Taxa | Northern Acropora | Southern Acropora | Northern Soft Coral | Southern Soft Coral | |||||||||
|---|---|---|---|---|---|---|---|---|---|---|---|---|---|---|---|---|---|---|
| Juvenile | Adult | Juvenile | Adult | Juvenile | Adult | Juvenile | Adult | Juvenile | Adult | Juvenile | Adult | Juvenile | Adult | Juvenile | Adult | Juvenile | Adult | |
| Acropora | 9.17 ± 1.35 | 12.49 ± 3.85 | 49.97 ± 11.19 | 97.68 ± 0.84 | 14.34 ± 2.17 | 21.15 ± 2.95 | 14.79 ± 2.19 | 26.02 ± 4.23 | 22.3 ± 2.45 | 35.12 ± 3.6 | 26.38 ± 2.89 | 30.56 ± 4.76 | 44.02 ± 3.22 | 69.61 ± 8.97 | 25.3 ± 3.47 | 31.58 ± 4.58 | 20.08 ± 5.3 | 28.74 ± 4.05 |
| Porites | 10.15 ± 2.15 | 19.06 ± 5.87 | 1.46 ± 0.91 | 0.05 ± 0.05 | 12.19 ± 2.24 | 21.16 ± 3.15 | 39.04 ± 5.45 | 20.29 ± 2.73 | 22.17 ± 2.76 | 11.95 ± 1.87 | 26.32 ± 3.43 | 13.03 ± 2.91 | 14.92 ± 1.66 | 9.19 ± 3.8 | 34.08 ± 4.51 | 11.79 ± 1.74 | 34.79 ± 7.79 | 23.43 ± 3.16 |
| Montipora | 3.11 ± 0.73 | 3.77 ± 0.91 | 4.06 ± 2.5 | 0.66 ± 0.19 | 5.06 ± 1.16 | 12.29 ± 3 | 2.19 ± 0.54 | 4.96 ± 0.58 | 8.73 ± 2.03 | 13.63 ± 2.03 | 1.38 ± 0.43 | 5.71 ± 1.4 | 4.79 ± 1.14 | 3.92 ± 0.84 | 2.62 ± 0.63 | 4.29 ± 0.84 | 3.2 ± 0.86 | 4.49 ± 1.04 |
| Pocillopora | 0.76 ± 0.25 | 0.27 ± 0.1 | 3.33 ± 3.33 | 0.18 ± 0.18 | 4.42 ± 1 | 3.62 ± 1.05 | 5.47 ± 1.27 | 6.46 ± 1.18 | 7.3 ± 1.17 | 4.03 ± 0.51 | 7.79 ± 1.63 | 14.54 ± 3.82 | 9.08 ± 1.67 | 1.73 ± 0.58 | 6.94 ± 1.26 | 12.45 ± 1.41 | 7.37 ± 1.07 | 5.97 ± 1.03 |
| Goniopora | 7.81 ± 1.85 | 14.65 ± 3.86 | 1.56 ± 1.56 | 0 ± 0 | 2.37 ± 0.52 | 5.69 ± 2.3 | 0.22 ± 0.13 | 0.77 ± 0.25 | 0.76 ± 0.26 | 0.67 ± 0.23 | 0.48 ± 0.3 | 0.64 ± 0.41 | 0.13 ± 0.09 | 0.19 ± 0.1 | 0 ± 0 | 0.21 ± 0.07 | 0 ± 0 | 2 ± 0.56 |
| Echinopora | 0.95 ± 0.44 | 3.04 ± 1.86 | 0 ± 0 | 0 ± 0 | 1.13 ± 0.31 | 3.93 ± 1.01 | 0.68 ± 0.18 | 2.68 ± 0.56 | 1.22 ± 0.39 | 5.08 ± 1.18 | 0.6 ± 0.27 | 0.92 ± 0.23 | 0.13 ± 0.09 | 1.2 ± 0.82 | 1.23 ± 0.45 | 2.65 ± 0.38 | 0.9 ± 0.38 | 1.87 ± 0.35 |
| Isopora | 0.14 ± 0.11 | 0.35 ± 0.22 | 0 ± 0 | 0 ± 0 | 0.02 ± 0.02 | 0.02 ± 0.02 | 0.82 ± 0.44 | 1.35 ± 0.45 | 0.75 ± 0.28 | 3.85 ± 1.08 | 0.42 ± 0.21 | 2.14 ± 0.99 | 0.47 ± 0.25 | 0.91 ± 0.46 | 0.55 ± 0.32 | 9.7 ± 3.21 | 1.13 ± 0.47 | 5.95 ± 1.82 |
| Agariciidae | 2.66 ± 0.79 | 6.93 ± 1.43 | 0 ± 0 | 0 ± 0 | 1.11 ± 0.32 | 2.73 ± 0.61 | 0.89 ± 0.21 | 0.69 ± 0.23 | 0.48 ± 0.25 | 0.92 ± 0.19 | 1.12 ± 0.31 | 1.56 ± 0.65 | 0.25 ± 0.14 | 0.41 ± 0.14 | 0.59 ± 0.32 | 0.98 ± 0.41 | 1.16 ± 0.41 | 0.7 ± 0.15 |
| Stylophora | 0.24 ± 0.12 | 0.25 ± 0.12 | 0 ± 0 | 0 ± 0 | 2.24 ± 1.14 | 2.23 ± 0.52 | 3.08 ± 1.81 | 5.31 ± 1 | 1.11 ± 0.49 | 1.2 ± 0.3 | 2.98 ± 1.16 | 4.09 ± 0.66 | 1.56 ± 0.59 | 0.78 ± 0.28 | 2.94 ± 1.02 | 4.4 ± 0.8 | 6.48 ± 1.98 | 2.92 ± 0.41 |
| Favia | 6.88 ± 1.33 | 2.48 ± 0.74 | 3.25 ± 1.92 | 0.06 ± 0.06 | 8.83 ± 1.31 | 2.03 ± 0.36 | 2.66 ± 0.53 | 2.73 ± 0.45 | 7.8 ± 1.9 | 1.8 ± 0.33 | 1.84 ± 0.48 | 1.78 ± 0.52 | 1.48 ± 0.41 | 0.91 ± 0.2 | 3.65 ± 0.76 | 2.82 ± 0.37 | 2.53 ± 0.61 | 2.68 ± 0.48 |
| Pectiniidae | 4.12 ± 0.83 | 5.17 ± 1.46 | 0 ± 0 | 0.11 ± 0.11 | 2.8 ± 0.92 | 2.46 ± 0.53 | 1.28 ± 0.39 | 1.53 ± 0.36 | 0.53 ± 0.2 | 1.51 ± 0.32 | 0.63 ± 0.26 | 1.12 ± 0.56 | 0.34 ± 0.22 | 0.57 ± 0.4 | 0.85 ± 0.37 | 0.49 ± 0.13 | 0 ± 0 | 0.66 ± 0.27 |
| Goniastrea | 4.33 ± 1.66 | 3.06 ± 1.45 | 6.03 ± 5.48 | 0 ± 0 | 4.54 ± 1.21 | 1.57 ± 0.26 | 2.55 ± 0.42 | 1.76 ± 0.4 | 1.81 ± 0.38 | 1.48 ± 0.2 | 2.03 ± 0.63 | 1.55 ± 0.25 | 0.7 ± 0.33 | 0.63 ± 0.17 | 1.61 ± 0.43 | 2.1 ± 0.27 | 0.91 ± 0.31 | 2.22 ± 0.45 |
| Seriatopora | 0.28 ± 0.28 | 0.14 ± 0.11 | 0 ± 0 | 0 ± 0 | 1.26 ± 0.44 | 1.13 ± 0.35 | 1.95 ± 1.08 | 1.95 ± 0.85 | 3.66 ± 0.96 | 2.6 ± 0.81 | 5.46 ± 1.63 | 2.66 ± 0.52 | 3.57 ± 1 | 3.31 ± 1.6 | 2.65 ± 0.97 | 0.43 ± 0.18 | 7.97 ± 3.05 | 3.87 ± 1.37 |
| Galaxea | 5.04 ± 1.13 | 4.18 ± 1.65 | 0 ± 0 | 0 ± 0 | 3.99 ± 0.91 | 1.88 ± 0.37 | 1.93 ± 1.08 | 2.61 ± 1.15 | 0.64 ± 0.25 | 1.15 ± 0.33 | 1.57 ± 0.44 | 0.67 ± 0.27 | 0.54 ± 0.36 | 0.32 ± 0.11 | 1.15 ± 0.49 | 0.6 ± 0.14 | 0.73 ± 0.24 | 0.96 ± 0.27 |
| Fungiidae | 9.44 ± 2.67 | 2.5 ± 0.64 | 12.75 ± 8.88 | 0.17 ± 0.17 | 6.36 ± 1.7 | 2.11 ± 0.49 | 5.38 ± 1.53 | 1.42 ± 0.3 | 2.7 ± 0.52 | 2.45 ± 0.68 | 3.45 ± 0.77 | 1.07 ± 0.44 | 2.02 ± 1.26 | 0.88 ± 0.5 | 2 ± 0.63 | 0.31 ± 0.1 | 3.13 ± 1.24 | 0.71 ± 0.18 |
| Turbinaria | 11.94 ± 3.32 | 5.51 ± 1.72 | 3.22 ± 1.86 | 0 ± 0 | 4.74 ± 2.82 | 1.86 ± 0.81 | 0.22 ± 0.15 | 0.37 ± 0.24 | 0.12 ± 0.05 | 0.6 ± 0.24 | 0.04 ± 0.04 | 0.1 ± 0.06 | 0.08 ± 0.06 | 0.17 ± 0.08 | 0.15 ± 0.12 | 0.16 ± 0.05 | 0.38 ± 0.2 | 0.54 ± 0.26 |
| Lobophyllia | 4.77 ± 1.36 | 1.86 ± 0.43 | 2.79 ± 2.79 | 0.23 ± 0.23 | 4.88 ± 0.69 | 2.74 ± 0.52 | 3.76 ± 0.85 | 0.66 ± 0.15 | 4.07 ± 1 | 1.76 ± 0.42 | 2.82 ± 0.79 | 0.47 ± 0.2 | 1.74 ± 0.54 | 0.42 ± 0.2 | 0.92 ± 0.3 | 0.39 ± 0.14 | 0.78 ± 0.33 | 1.33 ± 0.51 |
| Platygyra | 0.9 ± 0.26 | 1.32 ± 0.39 | 0.93 ± 0.93 | 0.12 ± 0.07 | 1.93 ± 0.4 | 1.29 ± 0.2 | 1.33 ± 0.27 | 2.12 ± 0.4 | 1.36 ± 0.43 | 1.31 ± 0.2 | 0.33 ± 0.13 | 0.94 ± 0.35 | 1.01 ± 0.36 | 0.41 ± 0.15 | 1.36 ± 0.33 | 2.26 ± 0.52 | 0.49 ± 0.18 | 1.43 ± 0.34 |
| Other hard coral | 1.82 ± 0.56 | 0.04 ± 0.02 | 0 ± 0 | 0 ± 0 | 3.22 ± 1.34 | 0.66 ± 0.22 | 0.82 ± 0.19 | 2.22 ± 0.36 | 1.86 ± 0.52 | 1.66 ± 0.19 | 1.43 ± 0.4 | 4.14 ± 0.65 | 3.55 ± 1.31 | 1.13 ± 0.38 | 2.6 ± 0.66 | 1.54 ± 0.18 | 0.89 ± 0.32 | 0.98 ± 0.16 |
| Favites | 2.74 ± 0.65 | 1.17 ± 0.39 | 2.34 ± 2.34 | 0.06 ± 0.06 | 3.48 ± 0.7 | 1.15 ± 0.27 | 2.6 ± 0.51 | 1.89 ± 0.37 | 3.42 ± 0.68 | 1.2 ± 0.21 | 2.51 ± 0.55 | 1.52 ± 0.33 | 1.37 ± 0.51 | 0.61 ± 0.16 | 2.48 ± 0.95 | 1.88 ± 0.37 | 1.14 ± 0.51 | 1.39 ± 0.28 |
| Diploastrea | 0 ± 0 | 1.37 ± 0.76 | 0 ± 0 | 0 ± 0 | 0 ± 0 | 1.84 ± 0.46 | 0.07 ± 0.07 | 2.83 ± 1.48 | 0 ± 0 | 0.14 ± 0.09 | 0 ± 0 | 2.15 ± 1.47 | 0 ± 0 | 0 ± 0 | 0.03 ± 0.03 | 1.69 ± 0.86 | 0 ± 0 | 0.34 ± 0.31 |
| Merulina | 1.52 ± 0.37 | 1.81 ± 0.65 | 0 ± 0 | 0 ± 0 | 1.03 ± 0.29 | 1.45 ± 0.44 | 0.2 ± 0.11 | 0.45 ± 0.15 | 1.08 ± 0.33 | 1.6 ± 0.35 | 0.07 ± 0.07 | 0.83 ± 0.33 | 0.26 ± 0.16 | 0.21 ± 0.12 | 1.21 ± 0.8 | 0.36 ± 0.11 | 0.5 ± 0.28 | 1.19 ± 0.47 |
| Siderastreidae | 1.84 ± 0.88 | 2.77 ± 1.91 | 3.32 ± 2.66 | 0.32 ± 0.22 | 1.36 ± 0.52 | 0.5 ± 0.1 | 0.78 ± 0.18 | 1.04 ± 0.28 | 0.2 ± 0.1 | 0.21 ± 0.05 | 2.8 ± 0.73 | 3.19 ± 1.33 | 1.55 ± 0.7 | 0.16 ± 0.07 | 0.19 ± 0.09 | 1.03 ± 0.41 | 1.17 ± 0.72 | 0.34 ± 0.1 |
| Cyphastrea | 1.78 ± 0.48 | 2.11 ± 0.96 | 4.67 ± 4.67 | 0.24 ± 0.24 | 1.56 ± 0.34 | 0.65 ± 0.18 | 2.97 ± 0.65 | 1.21 ± 0.26 | 1.59 ± 0.43 | 0.47 ± 0.11 | 3.54 ± 0.9 | 1.14 ± 0.22 | 1.54 ± 0.5 | 0.45 ± 0.19 | 0.88 ± 0.28 | 0.51 ± 0.15 | 2.22 ± 0.53 | 0.39 ± 0.09 |
| Hydnophora | 0.6 ± 0.17 | 1.16 ± 0.6 | 0 ± 0 | 0 ± 0 | 0.35 ± 0.1 | 1.1 ± 0.29 | 0.64 ± 0.2 | 1.53 ± 0.33 | 0.68 ± 0.25 | 0.65 ± 0.11 | 0.38 ± 0.19 | 0.44 ± 0.27 | 0.3 ± 0.18 | 0.2 ± 0.07 | 0.41 ± 0.25 | 0.69 ± 0.17 | 0.08 ± 0.05 | 0.96 ± 0.21 |
| Other Faviidae | 1.25 ± 0.49 | 1.42 ± 0.79 | 0 ± 0 | 0 ± 0 | 1.82 ± 0.97 | 0.5 ± 0.11 | 0.31 ± 0.11 | 1.22 ± 0.41 | 0.54 ± 0.21 | 0.5 ± 0.08 | 0.07 ± 0.07 | 0.84 ± 0.31 | 0.49 ± 0.34 | 0.35 ± 0.1 | 0.9 ± 0.47 | 0.5 ± 0.15 | 0.05 ± 0.05 | 0.67 ± 0.14 |
| Symphyllia | 0 ± 0 | 0.07 ± 0.05 | 0 ± 0 | 0 ± 0 | 0.1 ± 0.06 | 0.24 ± 0.06 | 0.3 ± 0.19 | 1.16 ± 0.31 | 0.08 ± 0.04 | 0.51 ± 0.12 | 0.22 ± 0.1 | 0.8 ± 0.19 | 0.2 ± 0.12 | 0.39 ± 0.21 | 0.37 ± 0.21 | 1.62 ± 0.35 | 0 ± 0 | 0.95 ± 0.16 |
| Montastrea | 0.29 ± 0.14 | 0.06 ± 0.05 | 0 ± 0 | 0 ± 0 | 0.88 ± 0.27 | 0.22 ± 0.09 | 1.28 ± 0.23 | 1.13 ± 0.23 | 1.86 ± 0.47 | 0.58 ± 0.14 | 1.87 ± 0.68 | 0.66 ± 0.15 | 3.02 ± 0.59 | 0.47 ± 0.23 | 1.42 ± 0.6 | 1 ± 0.21 | 1.67 ± 0.65 | 1.11 ± 0.26 |
| Leptoria | 0.13 ± 0.1 | 0.12 ± 0.07 | 0 ± 0 | 0 ± 0 | 1.05 ± 0.28 | 0.61 ± 0.36 | 0.08 ± 0.08 | 0.63 ± 0.14 | 0.09 ± 0.04 | 0.64 ± 0.17 | 0.11 ± 0.06 | 0.36 ± 0.18 | 0.24 ± 0.2 | 0.23 ± 0.08 | 0.27 ± 0.16 | 0.79 ± 0.15 | 0.14 ± 0.14 | 0.82 ± 0.21 |
| Astreopora | 0.23 ± 0.17 | 0.59 ± 0.39 | 0 ± 0 | 0 ± 0 | 0.43 ± 0.24 | 0.3 ± 0.09 | 0.63 ± 0.2 | 0.68 ± 0.2 | 0.74 ± 0.3 | 0.57 ± 0.12 | 0.45 ± 0.27 | 0.25 ± 0.11 | 0.11 ± 0.11 | 0.04 ± 0.03 | 0.37 ± 0.31 | 0.45 ± 0.14 | 0.06 ± 0.06 | 0.32 ± 0.11 |
| Leptastrea | 0.85 ± 0.21 | 0.15 ± 0.06 | 0.31 ± 0.31 | 0 ± 0 | 0.71 ± 0.27 | 0.54 ± 0.2 | 0.57 ± 0.17 | 0.06 ± 0.03 | 0.12 ± 0.06 | 0.06 ± 0.03 | 0.29 ± 0.16 | 0.11 ± 0.05 | 0.03 ± 0.03 | 0.14 ± 0.08 | 0.15 ± 0.1 | 0.23 ± 0.15 | 0.04 ± 0.04 | 0 ± 0 |
| Euphyllidae | 0.69 ± 0.19 | 0.07 ± 0.04 | 0 ± 0 | 0 ± 0 | 0.43 ± 0.22 | 0.27 ± 0.11 | 0.45 ± 0.21 | 0.23 ± 0.13 | 0.17 ± 0.13 | 0.06 ± 0.03 | 0.19 ± 0.1 | 0.02 ± 0.02 | 0 ± 0 | 0 ± 0 | 0.03 ± 0.03 | 0 ± 0 | 0 ± 0 | 0.02 ± 0.02 |
| Acanthastrea | 0.56 ± 0.32 | 0 ± 0 | 0 ± 0 | 0.11 ± 0.06 | 0.51 ± 0.23 | 0.05 ± 0.03 | 0.04 ± 0.04 | 0.05 ± 0.03 | 0.05 ± 0.04 | 0.09 ± 0.02 | 0.42 ± 0.17 | 0 ± 0 | 0.53 ± 0.34 | 0.05 ± 0.02 | 0.11 ± 0.11 | 0.09 ± 0.04 | 0 ± 0 | 0.05 ± 0.03 |
| Moseleya | 3.03 ± 0.93 | 0.06 ± 0.03 | 0 ± 0 | 0 ± 0 | 0.88 ± 0.63 | 0.02 ± 0.02 | 0 ± 0 | 0 ± 0 | 0 ± 0 | 0 ± 0 | 0 ± 0 | 0 ± 0 | 0 ± 0 | 0 ± 0 | 0 ± 0 | 0 ± 0 | 0 ± 0 | 0 ± 0 |
References
- Gattuso, J.-P.; Allemand, D.; Frankignoulle, M. Photosynthesis and calcification at cellular, organismal and community levels in coral reefs: A review of interactions and control by carbonate chemistry. Am. Zool. 1999, 39, 160–183. [Google Scholar] [CrossRef]
- Stella, J.S.; Pratchett, M.S.; Hutching, P.A. Jones GP Coral-associated invertebrates: Diversity, ecological importance and vulnerability to disturbance. Oceanogr. Mar. Biol. Ann. Rev. 2011, 49, 43–104. [Google Scholar]
- Coker, D.J.; Wilson, S.K.; Pratchett, M.S. Importance of live coral habitat for reef fishes. Rev. Fish. Biol. Fish. 2014, 24, 89–126. [Google Scholar] [CrossRef]
- Emslie, M.J.; Cheal, A.J.; Johns, K.A. Retention of habitat complexity minimizes disassembly of reef fish communities following disturbance: A large- scale natural experiment. PLoS ONE 2014, 9, e105384. [Google Scholar] [CrossRef] [PubMed]
- Hughes, T.P.; Baird, A.H.; Dinsdale, E.A.; Moltschaniwskyj, N.A.; Pratchett, M.S.; Tanner, J.E.; Willis, B.L. Assembly rules of reef corals are flexible along a steep climatic gradient. Curr. Biol. 2012, 22, 736–741. [Google Scholar] [CrossRef]
- Dornelas, M.; Connolly, S.R.; Hughes, T.P. Coral reef diversity refutes the neutral theory of biodiversity. Nature 2006, 440, 80–82. [Google Scholar] [CrossRef]
- Connell, J.H. Diversity in tropical rain forests and coral reefs. Science 1978, 199, 1302–1310. [Google Scholar] [CrossRef] [PubMed]
- Hughes, T.P.; Jackson, J.B.C. Do corals lie about their age? Some demographic consequences of partial mortality, fission and fusion. Science 1980, 209, 713–715. [Google Scholar] [CrossRef]
- Smith, L.D.; Hughes, T.P. An experimental assessment of survival, re-attachment and fecundity of coral fragmentation. J. Exp. Mar. Biol. Ecol. 1999, 235, 147–164. [Google Scholar] [CrossRef]
- Baird, A.H.; Guest, J.R.; Willis, B.L. Systematic and biogeological patterns in the reproductive biology of scleractinian corals. Annu. Rev. Ecol. Evol. Syst. 2009, 40, 551–571. [Google Scholar] [CrossRef]
- Smith, L.D.; Devlin, M.; Haynes, D.; Gilmour, J.P. A Demographic approach to monitoring the health of coral reefs. Mar. Pollut. Bull. 2005, 51, 399–407. [Google Scholar] [CrossRef]
- Gilmour, J.P.; Smith, L.D.; Brinkman, R.M. Biannual spawning, rapid larval development and evidence of self-seeding for scleractinian corals at an isolated system of reefs. Mar. Biol. 2009, 156, 1297–1309. [Google Scholar] [CrossRef]
- Pratchett, M.S.; Anderson, K.D.; Hoogenboom, M.O.; Widman, E.; Baird, A.H.; Pandolfi, J.M.; Edmunds, P.J.; Lough, J.M. Spatial, temporal and taxonomic variation in coral growth: implications for the structure and function of coral reef ecosystems. Oceanogr. Mar. Biol. Ann. Rev. 2015, 53, 215–295. [Google Scholar]
- Roth, M.S.; Knowlton, N. Distribution, abundance, and microhabitat characterization of small juvenile coral at Palmyra Atoll. Mar. Ecol. Prog. Ser. 2009, 376, 133–142. [Google Scholar] [CrossRef]
- Graham, E.M.; Baird, A.H.; Connolly, S.R. Survival dynamics of scleractinian coral larvae and implications for dispersal. Coral Reefs 2008, 27, 529–539. [Google Scholar] [CrossRef]
- Graham, E.M.; Baird, A.H.; Willis, B.L.; Connolly, S.R. Effects of delayed settlement on post-settlement growth and survival of scleractinian coral larvae. Oecologia 2013, 173, 431–438. [Google Scholar] [CrossRef] [PubMed]
- Penin, L.; Michonneau, F.; Baird, A.H.; Connolly, S.R.; Pratchett, M.S.; Kayal, M.; Adjeroud, M. Early post-settlement mortality and the structure of coral assemblages. Mar. Ecol. Prog. Ser. 2010, 408, 55–64. [Google Scholar] [CrossRef] [Green Version]
- Martinez, S.; Abelson, A. Coral recruitment: the critical role of early post-settlement survival. ICES J. Mar. Sci. 2013, 70, 1294–1298. [Google Scholar] [CrossRef] [Green Version]
- Trapon, M.L.; Pratchett, M.S.; Hoey, A.S.; Baird, A.H. Influence of fish grazing and sedimentation on the early post-settlement survival of the tabular coral Acropora cytherea. Coral Reefs 2013, 32, 1051–1059. [Google Scholar] [CrossRef]
- Trapon, M.L.; Pratchett, M.S.; Hoey, A.S. Spatial variation in abundance, size and orientation of juvenile corals related to the biomass of parrotfishes on the Great Barrier Reef, Australia. PLoS ONE 2013, 8, e57788. [Google Scholar] [CrossRef]
- Baird, A.H.; Babcock, R.C.; Mundy, C.P. Habitat selection by larvae influences the depth distribution of six common coral species. Mar. Ecol. Prog. Ser. 2003, 252, 289–293. [Google Scholar] [CrossRef] [Green Version]
- Done, T.J. Coral community adaptability to environmental change at the scales of regions, reefs and reef zones. Integr. Comp. Biol. 1999, 39, 66–79. [Google Scholar] [CrossRef]
- Glassom, D.; Chadwick, N.E. Recruitment, growth and mortality of juvenile corals at Eilat, northern Red Sea. Mar. Ecol. Prog. Ser. 2006, 318, 111–122. [Google Scholar] [CrossRef] [Green Version]
- Penin, L.; Adjeroud, M.; Pratchett, M.S.; Hughes, T.P. Spatial distribution of juvenile and adult corals around Moorea (French Polynesia): Implications for population regulation. Bull. Mar. Sci. 2007, 80, 379–390. [Google Scholar]
- Hughes, T.P.; Baird, A.H.; Dinsdale, E.A.; Moltschaniwskyj, N.A.; Pratchett, M.S.; Tanner, J.E.; Willis, B.L. Supply-side ecology works both ways: the link between benthic adults, fecundity, and larval recruits. Ecology 2000, 81, 2241–2249. [Google Scholar] [CrossRef]
- Cetina-Heredia, P.; Connolly, S.R. A simple approximation for larval retention around reefs. Coral Reefs 2011, 30, 593–605. [Google Scholar] [CrossRef]
- Andutta, F.P.; Kingsford, M.J.; Wolanski, E. ‘Sticky water’ enables the retention of larvae in a reef mosaic. Estuar. Coast Shelf Sci. 2012, 101, 54–63. [Google Scholar] [CrossRef]
- Underwood, J.N.; Smith, L.D.; van Oppen, M.J.H.; Gilmour, J.P. Multiple scales of genetic connectivity in a brooding coral on isolated reefs following catastrophic bleaching. Mol. Ecol. 2007, 16, 771–784. [Google Scholar] [CrossRef] [PubMed]
- Osborne, K.; Dolman, A.M.; Burgess, S.C.; Johns, K.A. Disturbance and the dynamics of coral cover on the Great Barrier Reef (1995–2009). PLoS ONE 2011, 6, e17516. [Google Scholar] [CrossRef]
- Osborne, K.; Thompson, A.A.; Cheal, A.J.; Johns, K.A.; Jonker, M.J.; Logan, M.; Miller, I.R.; Sweatman, H.P.A. Delayed coral recovery in a warming ocean. Glob. Chang. Biol. 2017, 23, 3869–3881. [Google Scholar] [CrossRef]
- Johns, K.A.; Osborne, K.O.; Logan, M. Contrasting rates of coral recovery and reassembly in coral communities on the Great Barrier Reef. Coral Reefs 2014, 33, 553–563. [Google Scholar] [CrossRef] [Green Version]
- Halford, A.; Cheal, A.J.; Ryan, D.; Williams, D. McB. Resilience to large-scale disturbance in coral and fish assemblages on the Great Barrier Reef. Ecology 2004, 85, 1892–1905. [Google Scholar] [CrossRef]
- Adjeroud, M.; Fernandez, J.M.; Carroll, A.G.; Harrison, P.L.; Penin, L. Spatial patterns and recruitment processes of coral assemblages among contrasting environmental conditions in the southwestern lagoon of New Caledonia. Mar. Pollut. Bull. 2010, 61, 375–386. [Google Scholar] [CrossRef] [PubMed]
- Adjeroud, M.; Briand, M.J.; Kayal, M.; Dumas, P. Coral assemblages in Tonga: spatial patterns, replenishment capacities, and implications for conservation strategies. Environ. Monit. Assess 2013, 185, 5763–5773. [Google Scholar] [CrossRef]
- Edmunds, P.J.; Steneck, R.; Albright, R.; Carpenter, R.C.; Chui, A.P.Y.; Fan, T.-Y.; Harii, S.; Kitano, H.; Kurihara, H.; Legendre, L.; et al. Geographic variation in long-term trajectories of change in coral recruitment: A global-to-local perspective. Mar. Freshw. Res. 2015, 66, 609–622. [Google Scholar] [CrossRef]
- Edmunds, P.J. The hidden dynamics of low coral cover communities. Hydrobiologia 2018, 818, 193–209. [Google Scholar] [CrossRef]
- Doropoulos, C.; Ward, S.; Roff, G.; González-Rivero, M.; Mumby, P.J. Linking demographic processes of juvenile corals to benthic recovery trajectories in two common reef habitats. PLoS ONE 2015, 10, e0128535. [Google Scholar] [CrossRef]
- Thompson, A.; Schroeder, T.; Brando, V.E.; Schaffelke, B. Coral community responses to declining water quality; Whitsunday Islands, Great Barrier Reef, Australia. Coral Reefs 2014, 33, 923–938. [Google Scholar] [CrossRef]
- Bartlett, L.A.; Brinkhuis, V.I.P.; Ruzicka, R.R.; Colella, M.A.; Semon Lunz, K.; Leone, E.H.; Hallock, P. Dynamics of stony coral and octocoral juvenile assemblages following disturbance on patch reefs of the Florida Reef Tract. In Corals in a Changing World; Duque, C., Tello Camacho, E., Eds.; IntechOpen Limited: London, UK, 2018; ISBN 978-953-51-3910-2. [Google Scholar] [CrossRef]
- Álvarez-Noriega, M.; Baird, A.H.; Bridge, T.C.L.; Dornelas, M.; Fontoura, L.; Pizarro, O.; Precoda, K.; Torres-Pulliza, D.; Woods, R.M.; Zawada, K.; et al. Contrasting patterns of changes in abundance following a bleaching event between juvenile and adult scleractinian corals. Coral Reefs 2018, 37, 527–532. [Google Scholar] [CrossRef] [Green Version]
- Bak, R.P.M.; Engel, M.S. Distribution, abundance and survival of juvenile hermatypic corals (Scleractinia) and the importance of life history strategies in the parental coral community. Mar. Biol. 1979, 54, 341–352. [Google Scholar] [CrossRef]
- Darling, E.S.; McClanahan, T.R.; Côté, I.M. Life histories predict coral community disassembly under multiple stressors. Glob. Chang. Biol. 2013, 19, 1930–1940. [Google Scholar] [CrossRef] [PubMed]
- Gilmour, J.P.; Smith, L.D.; Heyward, A.J.; Baird, A.H.; Pratchett, M.S. Recovery of an isolated coral reef system following severe disturbance. Science 2013, 340, 69–71. [Google Scholar] [CrossRef] [PubMed]
- Morri, C.; Montefalcone, M.; Lasagna, R.; Gatti, G.; Rovere, A.; Parravicini, V.; Baldelli, G.; Colantoni, P.; Bianchi, C.N. Through bleaching and tsunami: Coral reef recovery in the Maldives. Mar. Pollut. Bull. 2015, 98, 188–200. [Google Scholar] [CrossRef]
- Chong-Seng, K.M.; Graham, N.A.J.; Pratchett, M.S. Bottlenecks to coral recovery in the Seychelles. Coral Reefs 2014, 33, 449–461. [Google Scholar] [CrossRef]
- Hughes, T.P.; Kerry, J.T.; Baird, A.H.; Connolly, S.R.; Chase, T.J.; Dietzel, A.; Hill, T.; Hoey, A.H.; Hoogenboom, M.O.; Jacobson, M.; et al. Global warming impairs stock-recruitment dynamics of corals. Nature 2019. [Google Scholar] [CrossRef]
- Pratchett, M.S.; Baird, A.H.; Bauman, A.G.; Burt, J.A. Abundance and composition of juvenile corals reveals divergent trajectories for coral assemblages across the United Arab Emirates. Mar. Pollut. Bull. 2017, 114, 1031–1035. [Google Scholar] [CrossRef]
- McClanahan, T.R. Decadal coral community reassembly on an African fringing reef. Coral Reefs 2014, 33, 939–950. [Google Scholar] [CrossRef]
- Adjeroud, M.; Kayal, M.; Iborra-Cantonnet, C.; Vercelloni, J.; Bosserelle, P.; Liao, V.; Chancerelle, Y.; Claudet, J.; Penin, L. Recovery of coral assemblages, despite acute and recurrent disturbances on a South Central Pacific reef. Sci. Rep. 2018, 8, 9680. [Google Scholar] [CrossRef] [PubMed]
- Graham, N.A.J.; Jennings, S.; MacNeil, M.A.; Mouillot, D.; Wilson, S.K. Predicting climate-driven regime shifts versus rebound potential in coral reefs. Nature 2015, 518, 94–97. [Google Scholar] [CrossRef] [PubMed]
- Ninio, R.; Meekan, M. Spatial patterns in benthic communities and the dynamics of a mosaic ecosystem on the Great Barrier Reef, Australia. Coral Reefs. 2002, 21, 95–104. [Google Scholar] [CrossRef]
- Van Woesik, R.; Tomascik, T.; Blake, S. Coral assemblages and physico-chemical characteristics of the Whitsunday Islands: evidence of recent community changes. Mar. Freshw. Res. 1999, 50, 427–440. [Google Scholar] [CrossRef]
- Done, T. Patterns in the distribution of coral communities across the central Great Barrier Reef. Coral Reefs 1982, 1, 95–107. [Google Scholar] [CrossRef]
- Fabricius, K.E. Effects of terrestrial runoff on the ecology of corals and coral reefs: Review and synthesis. Mar. Pollut. Bull. 2005, 50, 125–166. [Google Scholar] [CrossRef]
- Fabricius, K.E.; Logan, M.; Weeks, S.; Brodie, J. The effects of river run-off on water clarity across the central Great Barrier Reef. Mar. Pollut. Bull. 2014, 84, 191–200. [Google Scholar] [CrossRef] [PubMed]
- Anthony, K.R.N.; Connolly, S.R. Environmental limits to growth: physiological nice boundaries of corals along turbidity-light gradients. Oecologia 2004, 141, 373–384. [Google Scholar] [CrossRef] [PubMed]
- Wolanski, E. Physical Oceanographic Processes of the Great Barrier Reef; CRC Press: Boca Raton, FL, USA, 1994. [Google Scholar]
- Choukroun, S.; Ridd, P.V.; Brinkman, R.; McKinna, L.I.W. On the surface circulation in the western Coral Sea and residence times in the Great Barrier Reef. J. Geophys. Res. 2010, 115, C06013. [Google Scholar] [CrossRef]
- Steinberg, C. Impacts of climate change on the physical oceanography of the Great Barrier Reef. In Climate Change and the Great Barrier Reef; Johnson, J.E., Marshall, P.A., Eds.; Great Barrier Reef Marine Park Authority and Australian Greenhouse Office: Townsville, Australia, 2007; pp. 51–74. [Google Scholar]
- Hopley, D. The Geomorphology of the Great Barrier Reef: Quaternary Development of Coral Reefs; Wiley: New York, NY, USA, 1982. [Google Scholar]
- Burgess, S.C.; Osborne, K.; Caley, M.J. Similar regional effects among local habitats on the structure of tropical reef fish and coral communities. Glob. Ecol. Biogeogr. 2010, 19, 363–375. [Google Scholar] [CrossRef]
- Emslie, M.J.; Pratchett, M.S.; Cheal, A.J.; Osborne, K. Great Barrier Reef butterflyfish community structure: the role of shelf position and benthic community type. Coral Reefs 2010, 29, 705–715. [Google Scholar] [CrossRef]
- Ninio, R.; Meekan, M.; Done, T.; Sweatman, H. Temporal patterns in coral assemblages on the Great Barrier Reef from local to large spatial scales. Mar. Ecol. Prog. Ser. 2000, 194, 65–74. [Google Scholar] [CrossRef]
- Trapon, M.L.; Pratchett, M.S.; Adjeroud, M.; Hoey, A.S.; Baird, A.H. Post-settlement growth and mortality rates of juvenile scleractinian coral in Moorea, French Polynesia versus Trunk Reef, Australia. Mar. Ecol. Prog. Ser. 2013, 488, 157–170. [Google Scholar] [CrossRef]
- Graham, N.A.J.; Chong-Seng, K.M.; Huchery, C.; Januchowski-Hartley, F.A.; Nash, K.L. Coral reef community composition in the context of disturbance history on the Great Barrier Reef, Australia. PLoS ONE 2014, 9, e101204. [Google Scholar] [CrossRef]
- Hoegh-Guldberg, O.; Mumby, P.J.; Hooten, A.J.; Steneck, R.S.; Greenfield, P.; Gomez, E.; Harvell, C.D.; Sale, P.F.; Edwards, A.J.; Caldeira, K.; Knowlton, N.; Eakin, C.M.; Iglesias-Prieto, R.; et al. Coral reefs under rapid climate change and ocean acidification. Science 2007, 318, 1737–1742. [Google Scholar] [CrossRef]
- Jones, R.; Ricardo, G.F.; Negri, A.P. Effects of sediments on the reproductive cycle of corals. Mar. Pollut. Bull. 2015, 100, 13–33. [Google Scholar] [CrossRef]
- Humanes, A.; Noonan, S.H.C.; Willis, B.L.; Fabricius, K.E.; Negri, A.P. Cumulative effects of nutrient enrichment and elevated temperature compromise the early life history stages of the coral Acropora tenuis. PLoS ONE 2016, 11, e0161616. [Google Scholar] [CrossRef] [PubMed]
- Humanes, A.; Fink, A.; Willis, B.L.; Fabricius, K.E.; de Beer, D.; Negri, A.P. Effects of suspended sediments and nutrient on juvenile corals. Mar. Pollut. Bull. 2017, 125, 166–175. [Google Scholar] [CrossRef] [PubMed]
- Lam, V.Y.Y.; Chaloupka, M.; Thompson, A.; Doropoulos, C.; Mumby, P.J. Acute drivers influence recent inshore Great Barrier Reef dynamics. Proc. R. Soc. Lond. B Biol. Sci. 2018, 285, 1890. [Google Scholar] [CrossRef] [PubMed]
- Hughes, T.P.; Kerry, J.T.; Baird, A.H.; Connolly, S.R.; Dietzel, A.; Eakin, C.M.; Heron, S.F.; Hoey, A.S.; Hoogenboom, M.O.; Liu, G.; et al. Global warming transforms coral reef assemblages. Nature 2018, 556, 492–496. [Google Scholar] [CrossRef] [PubMed]
- Cheal, A.J.; MacNeil, M.A.; Emslie, M.J. Sweatman, H. The threat to coral reefs from more intense cyclones under climate change. Glob. Chang. Biol. 2017, 23, 1511–1524. [Google Scholar] [CrossRef]
- Uthicke, S.; Logan, M.; Liddy, M.; Francis, D.; Hardy, N.; Lamare, M. Climate change as an unexpected co-factor promoting coral eating seastar (Acanthaster planci) outbreaks. Sci. Rep. 2015, 5, 8402. [Google Scholar] [CrossRef]
- Jonker, M.; Johns, K.; Osborne, K. Surveys of Benthic Reef Communities using Underwater Digital Photography and Counts of Juvenile Corals; Long-term Monitoring of the Great Barrier Reef. Standard Operational Procedure Number 10; Australian Institute of Marine Science: Townsville, Australia, 2008.
- Veron, J.E.N. Corals of the world, 1st ed.; Australian Institute of Marine Science: Townsville, Australia, 2000; Volume 1–3.
- Fabricius, K.E.; Alderslade, P. Soft Corals and Sea Fans: A Comprehensive Guide to the Tropical Shallow Water Genera of the Central-West Pacific, the Indian Ocean and the Red Sea, 1st ed.; Australian Institute of Marine Science: Townsville, Australia, 2001; ISBN 064-232-210-4.
- Legendre, P.; Legendre, L. Numerical Ecology, 3rd ed.; Elsevier: Oxford, UK, 2012. [Google Scholar]
- Dufrêne, M.; Legendre, P. Species assemblages and indicator species: The need for a flexible asymmetrical approach. Ecol. Monogr. 1997, 67, 345–366. [Google Scholar] [CrossRef]
- R Core Team. R: A Language and Environment for Statistical Computing; R Foundation for Statistical Computing: Vienna, Austria, 2018; Available online: https://www.R-project.org/ (accessed on 30 May 2019).
- Oksanen, J.; Blanchet, F.G.; Friendly, M.; Kindt, R.; Legendre, P.; McGlinn, D.; Minchin, P.R.; O’Hara, R.B.; Simpson, G.L.; Solymos, P.; et al. Vegan: Community Ecology Package. R package version 2.5–2. 2018. Available online: https://CRAN.R-project.org/package=vegan (accessed on 30 May 2019).
- Wickham, H. Tidyverse: Easily Install and Load the ‘Tidyverse’. R package version 1.2.1. 2017. Available online: https://CRAN.R-project.org/package=tidyverse (accessed on 30 May 2019).
- Galili, T. Dendextend: An R package for visualizing, adjusting, and comparing trees of hierarchical clustering. Bioinformatics 2015, 31, 3718–3720. [Google Scholar] [CrossRef]
- Benjamini, Y.; Hochberg, Y. Controlling the false discovery rate: A practical and powerful approach to multiple testing. J. R. Stat. Soc. Ser. B Stat. Methodol. 1995, 57, 289–300. [Google Scholar] [CrossRef]
- Zuur, A.F.; Ieno, E.N.; Walker, N.J.; Saveliev, A.A.; Smith, G.M. Mixed Effects Models and Extensions in Ecology with R; Springer: New York, NY, USA, 2009. [Google Scholar]
- Hothorn, T.; Bretz, F.; Westfall, P. Simultaneous inference in general parametric models. Biom. J. 2008, 50, 346–363. [Google Scholar] [CrossRef] [PubMed]
- Rigby, R.A.; Stasinopoulos, D.M. Generalized additive models for location, scale and shape (with discussion). Appl. Stat. 2005, 54, 507–544. [Google Scholar] [CrossRef]
- Shlesinger, T.; Loya, Y. Recruitment, mortality, and resilience potential of scleractinian corals at Eilat, Red Sea. Coral Reefs 2016, 35, 1357–1368. [Google Scholar] [CrossRef]
- Connell, J.H.; Hughes, T.P.; Wallace, C.C. A 30-year study of coral abundance, recruitment, and disturbance as several scales in space and time. Ecol. Monogr. 1997, 67, 461–488. [Google Scholar] [CrossRef]
- Caley, M.J.; Carr, M.H.; Hixon, M.A.; Hughes, T.P.; Jones, G.P.; Menge, B.A. Recruitment and the local dynamics of open marine populations. Annu. Rev. Ecol. Syst. 1996, 27, 477–500. [Google Scholar] [CrossRef]
- González-Rivero, M.; Beijom, O.; Rodriguez-Ramirez, A.; Holtrop, T.; González-Marrero, Y.; Ganase, A.; Roelfsema, C.; Phinn, S.; Hoegh-Guldberg, O. Scaling up ecological measurements of coral reefs using semi-automated field image collection and analysis. Remote Sens. 2016, 8, 30. [Google Scholar] [CrossRef]
- Anthony, K.R.N. Enhanced energy status of corals on coastal, high-turbidity reefs. Mar. Ecol. Prog. Ser. 2006, 319, 111–116. [Google Scholar] [CrossRef]
- Sofonia, J.J.; Anthony, K.R.N. High-sediment tolerance in the reef coral Turbinaria mesenterina from the inner Great Barrier Reef lagoon (Australia). Estuar Coast Shelf Sci. 2008, 78, 748–752. [Google Scholar] [CrossRef]
- Mellin, C.; Thompson, A.; Jonker, M.J.; Emslie, M.J. Cross-shelf variation in coral community response to disturbance. Diversity (Basel) 2019, 11, 38. [Google Scholar] [CrossRef]
- Baird, A.H.; Hughes, T.P. Competitive dominance by tabular corals: An experimental analysis of recruitment and survival of understorey assemblages. J. Exp. Mar. Biol. Ecol. 2000, 251, 117–132. [Google Scholar] [CrossRef]
- Torda, G.; Sambrook, K.; Cross, P.; Sato, Y.; Bourne, D.G.; Lukoschek, V.; Hill, T.; Torras Jorda, G.; Moya, A.; Willis, B.L.; et al. Decadal erosion of coral assemblages by multiple disturbances in the Palm Islands, central Great Barrier Reef. Sci. Rep. 2018, 8, 11885. [Google Scholar] [CrossRef]
- Loya, Y.; Sakai, K.; Yamazato, K.; Nakano, Y.; Sambali, H.; van Woesik, R. Coral bleaching: the winners and losers. Ecol. Lett. 2001, 4, 122–131. [Google Scholar] [CrossRef]
- Van Woesik, R.; Sakai, K.; Ganase, A.; Loya, Y. Revisiting the winners and losers a decade after coral bleaching. Mar. Ecol. Prog. Ser. 2011, 434, 67–76. [Google Scholar] [CrossRef]
- Done, T.J.; Potts, D.C. Influences of habitat and natural disturbances on contributions of massive Porites coral to reef communities. Mar. Biol. 1992, 114, 479–493. [Google Scholar] [CrossRef]
- Marimuthu, N.; Jerald Wilson, J.; Vinithkumar, N.V.; Kirubagaran, R. Coral reef recovery status in South Andaman Islands after the bleaching event 2010. J. Ocean Univ. China 2013, 12, 91–96. [Google Scholar] [CrossRef]
- Schuhmacher, H.; Loch, K.; Loch, W.; See, W.R. The aftermath of coral bleaching on a Maldivian reef- a quantitative study. Facies 2005, 51, 80–92. [Google Scholar] [CrossRef]
- Baird, A.H.; Marshall, P.A. Mortality, growth and reproduction in scleractinian corals following bleaching on the Great Barrier Reef. Mar. Ecol. Prog. Ser. 2002, 237, 133–141. [Google Scholar] [CrossRef]
- Darling, E.S.; Alvarez-Filip, L.; Oliver, T.A.; McClanahan, T.R.; Cote, I.M. Evaluation life-history strategies of reef corals from species traits. Ecol. Lett. 2012, 15, 1378–1386. [Google Scholar] [CrossRef]
- Frade, P.; Bongaerts, P.; Englebert, N.; Rogers, A.; Gonzalez-Rivero, M.; Hoegh-Guldberg, O. Deep reefs of the Great Barrier Reef offer limited thermal refuge during mass coral bleaching. Nat. Commun. 2018, 9, 3447. [Google Scholar] [CrossRef]
- Babcock, R.C.; Baird, A.H.; Piromvaragorn, S.; Thomson, D.P.; Willis, B.L. Identification of scleractinian coral recruits from Indo-Pacific reefs. Zool. Stud. 2003, 42, 211–226. [Google Scholar]
- Ritson-Williams, R.; Arnold, S.N.; Paul, V.J. Patterns of larval settlement preferences and post-settlement survival for seven Caribbean corals. Mar. Ecol. Prog. Ser. 2016, 548, 127–138. [Google Scholar] [CrossRef]
- Szmant, A. Reproductive ecology of Caribbean reef corals. Coral Reefs 1986, 5, 43–53. [Google Scholar] [CrossRef]
- Hughes, T.P.; Baird, A.H.; Dinsdale, E.A.; Moltschaniwskyj, N.; Pratchett, M.S.; Tanner, J.E.; Willis, B.L. Patterns of recruitment and abundance of corals along the Great Barrier Reef. Nature 1999, 397, 59–63. [Google Scholar] [CrossRef] [Green Version]
- Davidson, J.; Thompson, A.; Logan, M.; Schaffelke, B. High spatio-temporal variability in Acroporidae settlement to inshore reefs of the Great Barrier Reef. PLoS ONE 2019, 14, e0209771. [Google Scholar] [CrossRef] [PubMed] [Green Version]
- Mumby, P.J.; Hastings, A.; Edwards, H.J. Thresholds and the resilience of Caribbean coral reefs. Nature 2007, 450, 98–101. [Google Scholar] [CrossRef]
- Kayal, M.; Vercelloni, J.; Lison de Loma, T.; Bosserelle, P.; Chancerelle, Y.; Geoffroy, S.; Stievenart, C.; Michonneau, F.; Penin, L.; Planes, S.; et al. Predator crown-of-thorns starfish (Acanthaster planci) outbreak, mass mortality of corals, and cascading effects on reef fish and benthic communities. PLoS ONE 2012, 7, e47363. [Google Scholar] [CrossRef] [PubMed]
- Dajka, J.-C.; Wilson, S.K.; Robinson, J.P.W.; Chong-Seng, K.M.; Harris, A.; Graham, N.A.J. Uncovering drivers of juvenile coral density following mass bleaching. Coral Reefs 2019. [Google Scholar] [CrossRef]
- Madin, J.S.; Baird, A.H.; Bridge, T.C.L.; Connolly, S.R.; Zawada, K.J.A.; Dornelas, M. Cumulative effects of cyclones and bleaching on coral cover and species richness at Lizard Island. Mar. Ecol. Prog. Ser. 2018, 604, 263–268. [Google Scholar] [CrossRef] [Green Version]
Figure 1.
Location of survey reefs for this study within the Great Barrier Reef (GBR), reefs are color coded by community types computed using hierarchical clustering and expert elicitation.
Figure 1.
Location of survey reefs for this study within the Great Barrier Reef (GBR), reefs are color coded by community types computed using hierarchical clustering and expert elicitation.

Figure 2.
Boxplots of juvenile coral densities on the GBR (a) by position across the continental shelf and; (b) by community types arranged across the continental shelf from inshore to outer shelf. The line in the middle of each boxplot represents the median, colored portions contain the 25th to 75th percentiles of the observations and bars extent to 1.5 times the interquartile range. Mean values per boxplot are symbolized by a solid dark red circle and outliers represented by open red circles. Refer to Figure 1 for locations of each reef group.

Figure 3.
Principal coordinate analysis (PCoA) ordination plots using Bray–Curtis dissimilarity of juvenile coral assemblages for 122 reefs; (a) position across the continental shelf are represented by color and the juvenile densities per reef are represented by circle diameter, (b) community types classified by composition of adult communities, at their relative cover of coral taxa at maximum coral cover, are represented by color and dissimilarity distances are represented by circle diameter.

Figure 4.
Boxplot of dissimilarity between juvenile and adult coral assemblages, where the line in the middle of each boxplot represents the median, colored portions contain the 25th to 75th percentiles of the observations and bars extent to 1.5 times the interquartile range. Solid dark red circles represent the mean and unusual observations are represented by red open circles (a) across the continental shelf and (b) for community type.

Figure 5.
Mean relative abundance of juvenile and adult coral taxa for all reefs in this study. Asterisks indicate significant differences p < 0.05 from Student’s t-tests.
Figure 5.
Mean relative abundance of juvenile and adult coral taxa for all reefs in this study. Asterisks indicate significant differences p < 0.05 from Student’s t-tests.

Table 1.
Sampling design of two monitoring programs used to estimate benthic cover and juvenile density at each reef.
Table 1.
Sampling design of two monitoring programs used to estimate benthic cover and juvenile density at each reef.
| Elements of Sampling Design | LTMP | MMP |
|---|---|---|
| Depth * | 6–9 m | 5 m |
| Sites | 3 | 2 |
| Transects | 5 | 5 |
| Length of benthic transects | 50 m | 20 m |
| Images per transect | 40 | 32 |
| Total points identified per reef | 3000 | 1600 |
| Total area of juvenile transects per reef | 25.5 m2 | 68 m2 |
* LTMP depths are relative to mean tide height, and MMP depth is set below lowest astronomic tide datum.
© 2019 by the authors. Licensee MDPI, Basel, Switzerland. This article is an open access article distributed under the terms and conditions of the Creative Commons Attribution (CC BY) license (http://creativecommons.org/licenses/by/4.0/).
Share and Cite
MDPI and ACS Style
Jonker, M.J.; Thompson, A.A.; Menéndez, P.; Osborne, K. Cross-Shelf Variation Among Juvenile and Adult Coral Assemblages on Australia’s Great Barrier Reef. Diversity 2019, 11, 85. https://doi.org/10.3390/d11060085
AMA Style
Jonker MJ, Thompson AA, Menéndez P, Osborne K. Cross-Shelf Variation Among Juvenile and Adult Coral Assemblages on Australia’s Great Barrier Reef. Diversity. 2019; 11(6):85. https://doi.org/10.3390/d11060085
Chicago/Turabian StyleJonker, Michelle J., Angus A. Thompson, Patricia Menéndez, and Kate Osborne. 2019. "Cross-Shelf Variation Among Juvenile and Adult Coral Assemblages on Australia’s Great Barrier Reef" Diversity 11, no. 6: 85. https://doi.org/10.3390/d11060085
Note that from the first issue of 2016, this journal uses article numbers instead of page numbers. See further details here.