Review of Size Effects during Micropillar Compression Test: Experiments and Atomistic Simulations
by
Sharif Shahbeyk
1, 
George Z. Voyiadjis
2,*,
Vahid Habibi
3,
Sarah Hashemi Astaneh
4 and
Mohammadreza Yaghoobi
5,* 1
Faculty of Civil and Environmental Engineering, Tarbiat Modares University, Jalal Ale Ahmad Highway, P.O. Box 14115-143, Tehran, Iran
2
Computational Solid Mechanics Laboratory, Department of Civil and Environmental Engineering, Louisiana State University, Baton Rouge, LA 70803, USA
3
Department of Mechanical Engineering, K. N. Toosi University of Technology, Tehran, Iran
4
Chemical Engineering Department, University of Illinois at Chicago, Chicago, IL 60607, USA
5
Materials Science and Engineering, University of Michigan, Ann Arbor, MI 48109, USA
*
Authors to whom correspondence should be addressed.
Crystals 2019, 9(11), 591; https://doi.org/10.3390/cryst9110591
Submission received: 17 October 2019
/
Revised: 7 November 2019
/
Accepted: 8 November 2019
/
Published: 10 November 2019
(This article belongs to the Special Issue Quantum and Molecular Mechanic Analysis of Crystalline Materials)
Abstract
:The micropillar compression test is a novel experiment to study the mechanical properties of materials at small length scales of micro and nano. The results of the micropillar compression experiments show that the strength of the material depends on the pillar diameter, which is commonly termed as size effects. In the current work, first, the experimental observations and theoretical models of size effects during micropillar compression tests are reviewed in the case of crystalline metals. In the next step, the recent computer simulations using molecular dynamics are reviewed as a powerful tool to investigate the micropillar compression experiment and its governing mechanisms of size effects.
1. Introduction
The current work reviews the size effects, during micropillar compression experiments. Size effect is the change in mechanical properties of the sample as its characteristic length varies. The metallic structures of confined volumes have many applications spanning from thin films in the electrical industry to bio applications, and the understanding of the effects of sample size is gaining a lot of attention among researchers [1,2,3,4,5,6]. The focus of this work is on the governing mechanisms of size effects for crystalline metals during micropillar compression tests. The micropillar compression test was introduced by Uchic and his coworkers [7,8,9]. They used the focused ion beam (FIB) machining to prepare pillars with diameters in the order of microns and smaller. A very apparent size effect was observed in a way that reducing the pillar diameter to 0.5 μm leads to strength increase up to 15 times of the bulk strength. Following that, many experimental studies have been conducted using the same technique to address the size effects in materials (see, e.g., [2,3,4]). One interesting aspect of micropillar compression tests is, unlike the nanoindentation experiment that includes the strain gradients [10], there is no strain gradient during this test. Accordingly, the size effects mechanisms can be investigated independent of the size effects induced by such strain gradient. Papanikolaou et al. [11] reviewed the experimental and numerical studies of dislocation avalanche that leads to strain bursts in crystal plasticity.
One way to address the size effects in crystalline metal during the micropillar compression experiment is to model the sample with full atomistic details using molecular dynamics (MD). The simulation results can be used along with the experimental results to extract the underlying mechanism of size effects [12,13,14,15,16,17,18,19,20,21]. MD simulation has its own limitations of time and length scales. Nowadays, by developing supercomputers and efficient numerical algorithms, samples with the length scale on the order of microns can be captured using atomistic simulations [21,22,23]. However, when it comes to the time scale, the simulation times are much shorter than the experiment, which leads to higher strain rates during the MD simulation. Accordingly, understanding the coupling effects of strain rate and sample size is essential to interpret the results obtained from the atomistic simulation. Voyiadjis and Yaghoobi [24] reviewed the atomistic simulation studies on governing mechanisms of size effects.
The current work reviews the size effects in crystalline metals during micropillar compression tests. The governing mechanisms of size effect are the focus of the current work. In the first step, available experimental results for samples with different crystal structures of FCC, BCC, and HCP are presented. Accordingly, the observed size effects will be elaborated for each crystal structure. Three size effects mechanisms of source truncation, source exhaustion, and weakest link theory are elaborated to explain the observed size effects. In the next step, the methodology and framework of MD simulation of crystalline metals during micropillar compression test are presented. The available results of MD simulation are incorporated to investigate the presented size effects’ mechanisms. MD simulation captures different size effects’ mechanisms including dislocation starvation, source exhaustion, and forest hardening mechanisms. The results showed that the governing mechanisms of size effects depend on the size of the pillar in a way that the mechanisms changed from dislocation starvation, which is a special subset of source exhaustion mechanism, for very small samples to the forest hardening mechanism for larger samples. Another aspect that is addressed here is to study the coupling effects of size and strain rate during the micropillar compression experiment. The results show that, as the strain rate increases, less size effects will be observed. The observed trend can justify why the observed size effects in MD simulation is different from those of the quasi-static experiments.
2. Experimental Observations
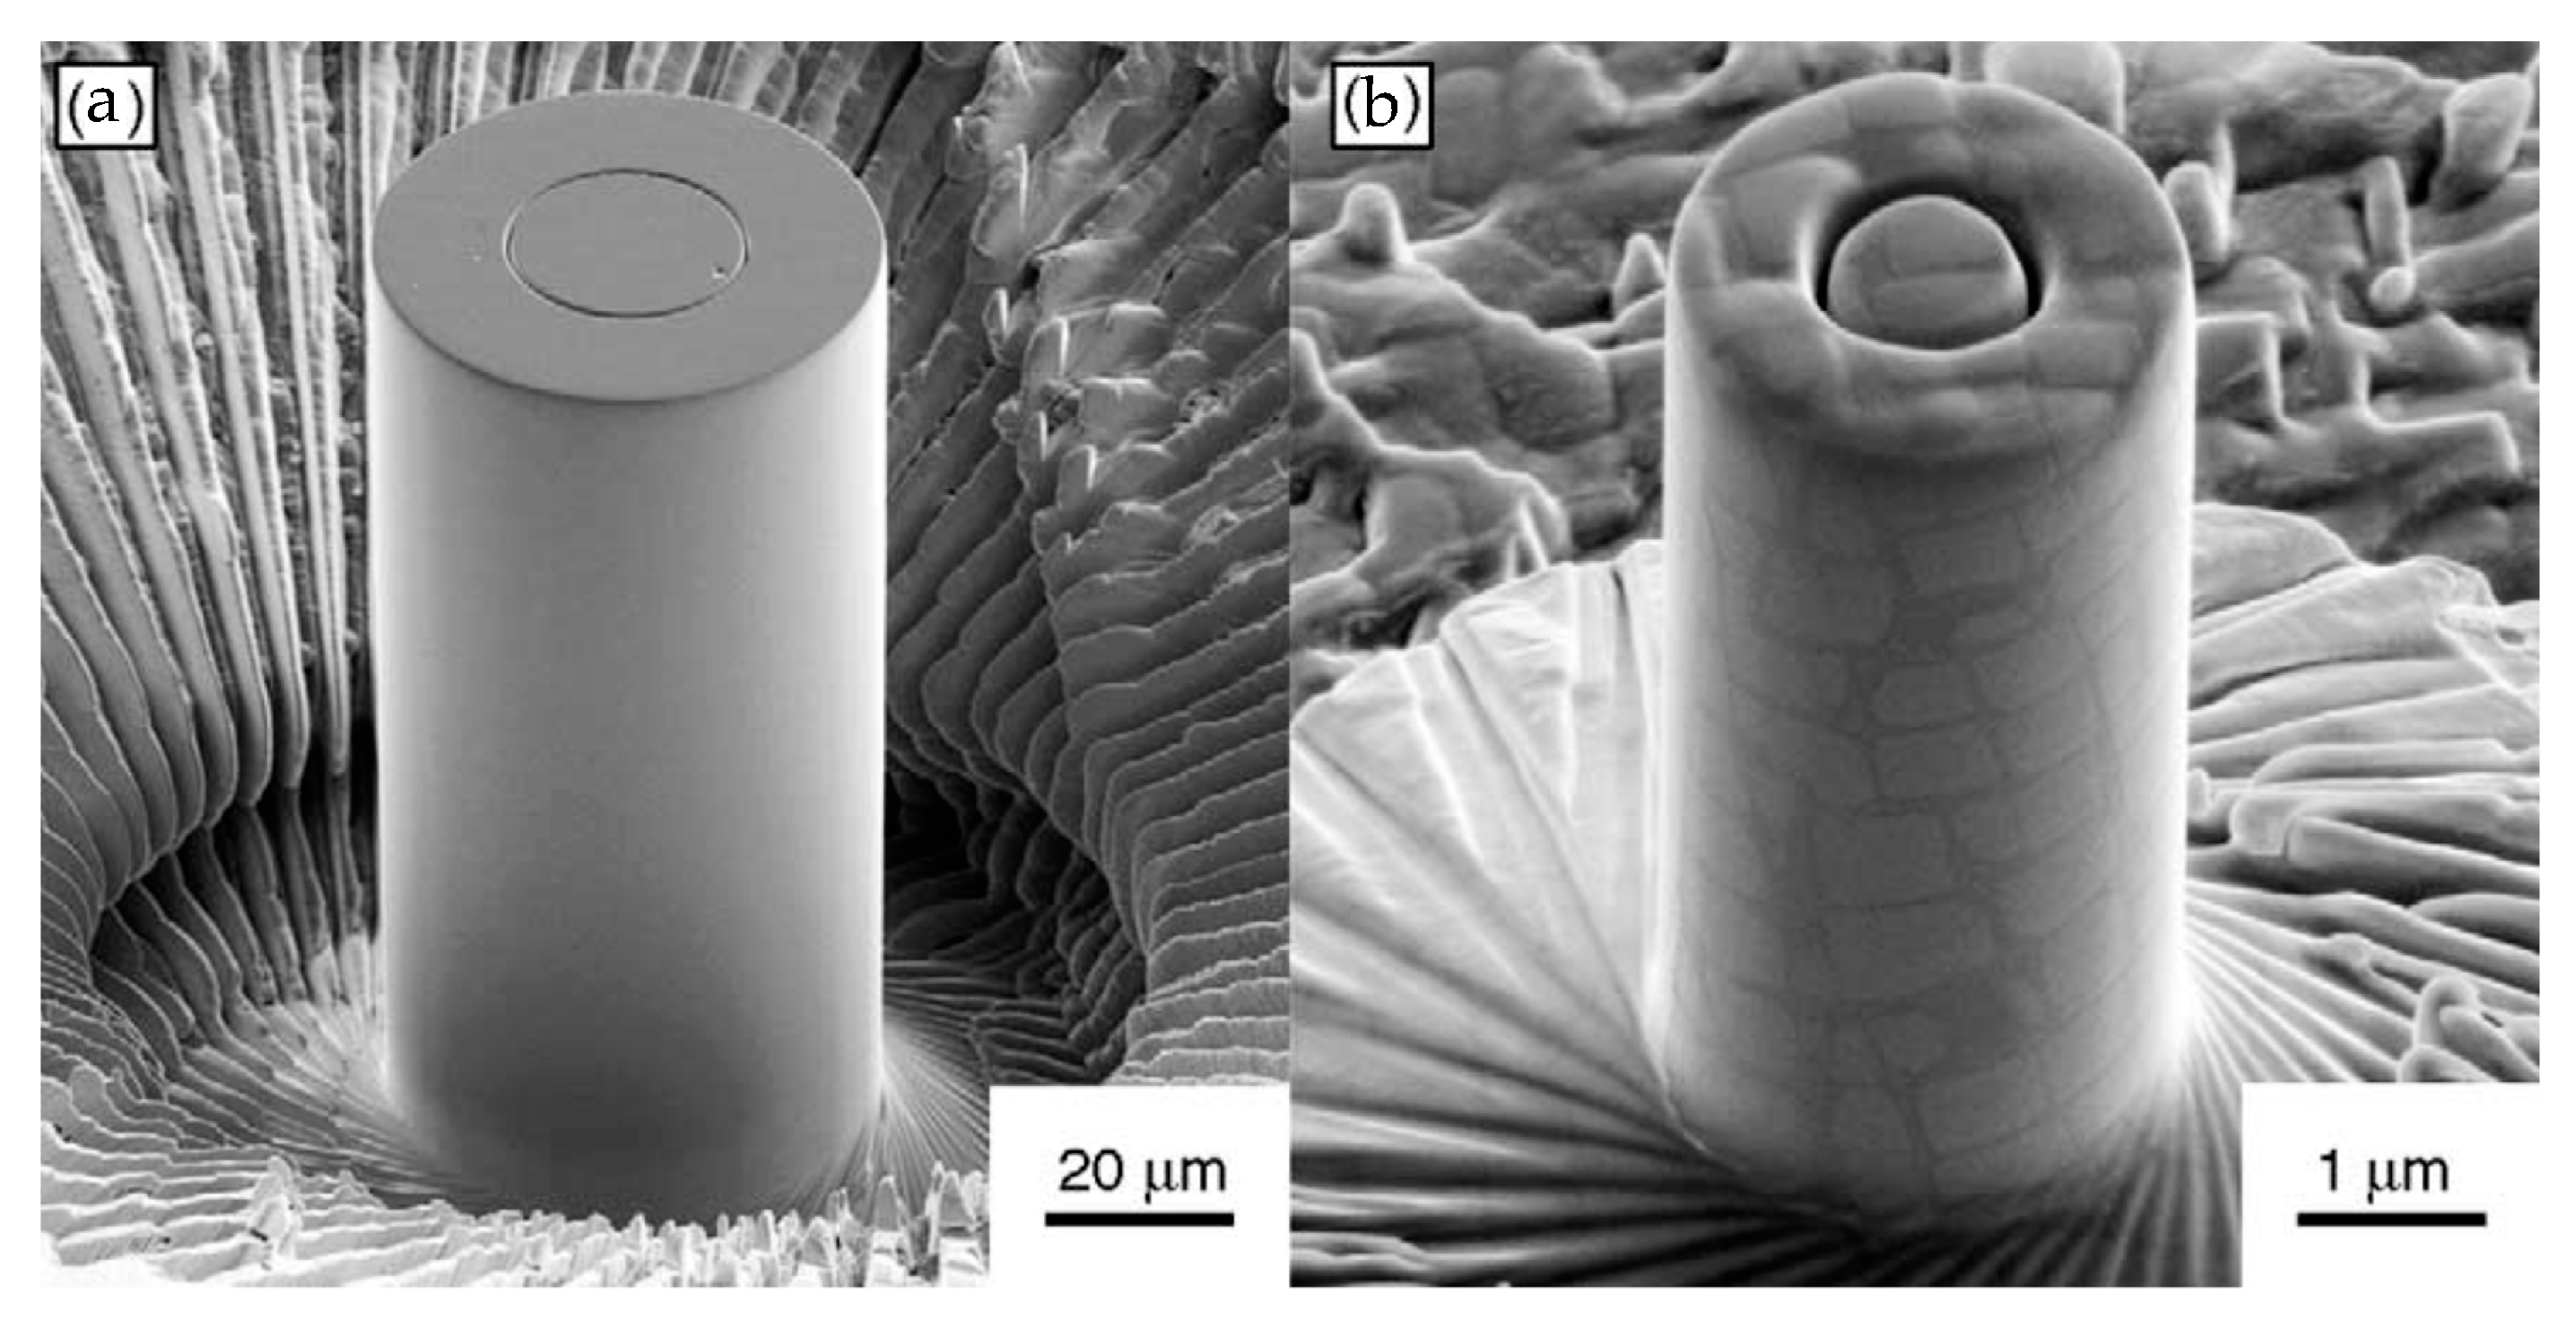
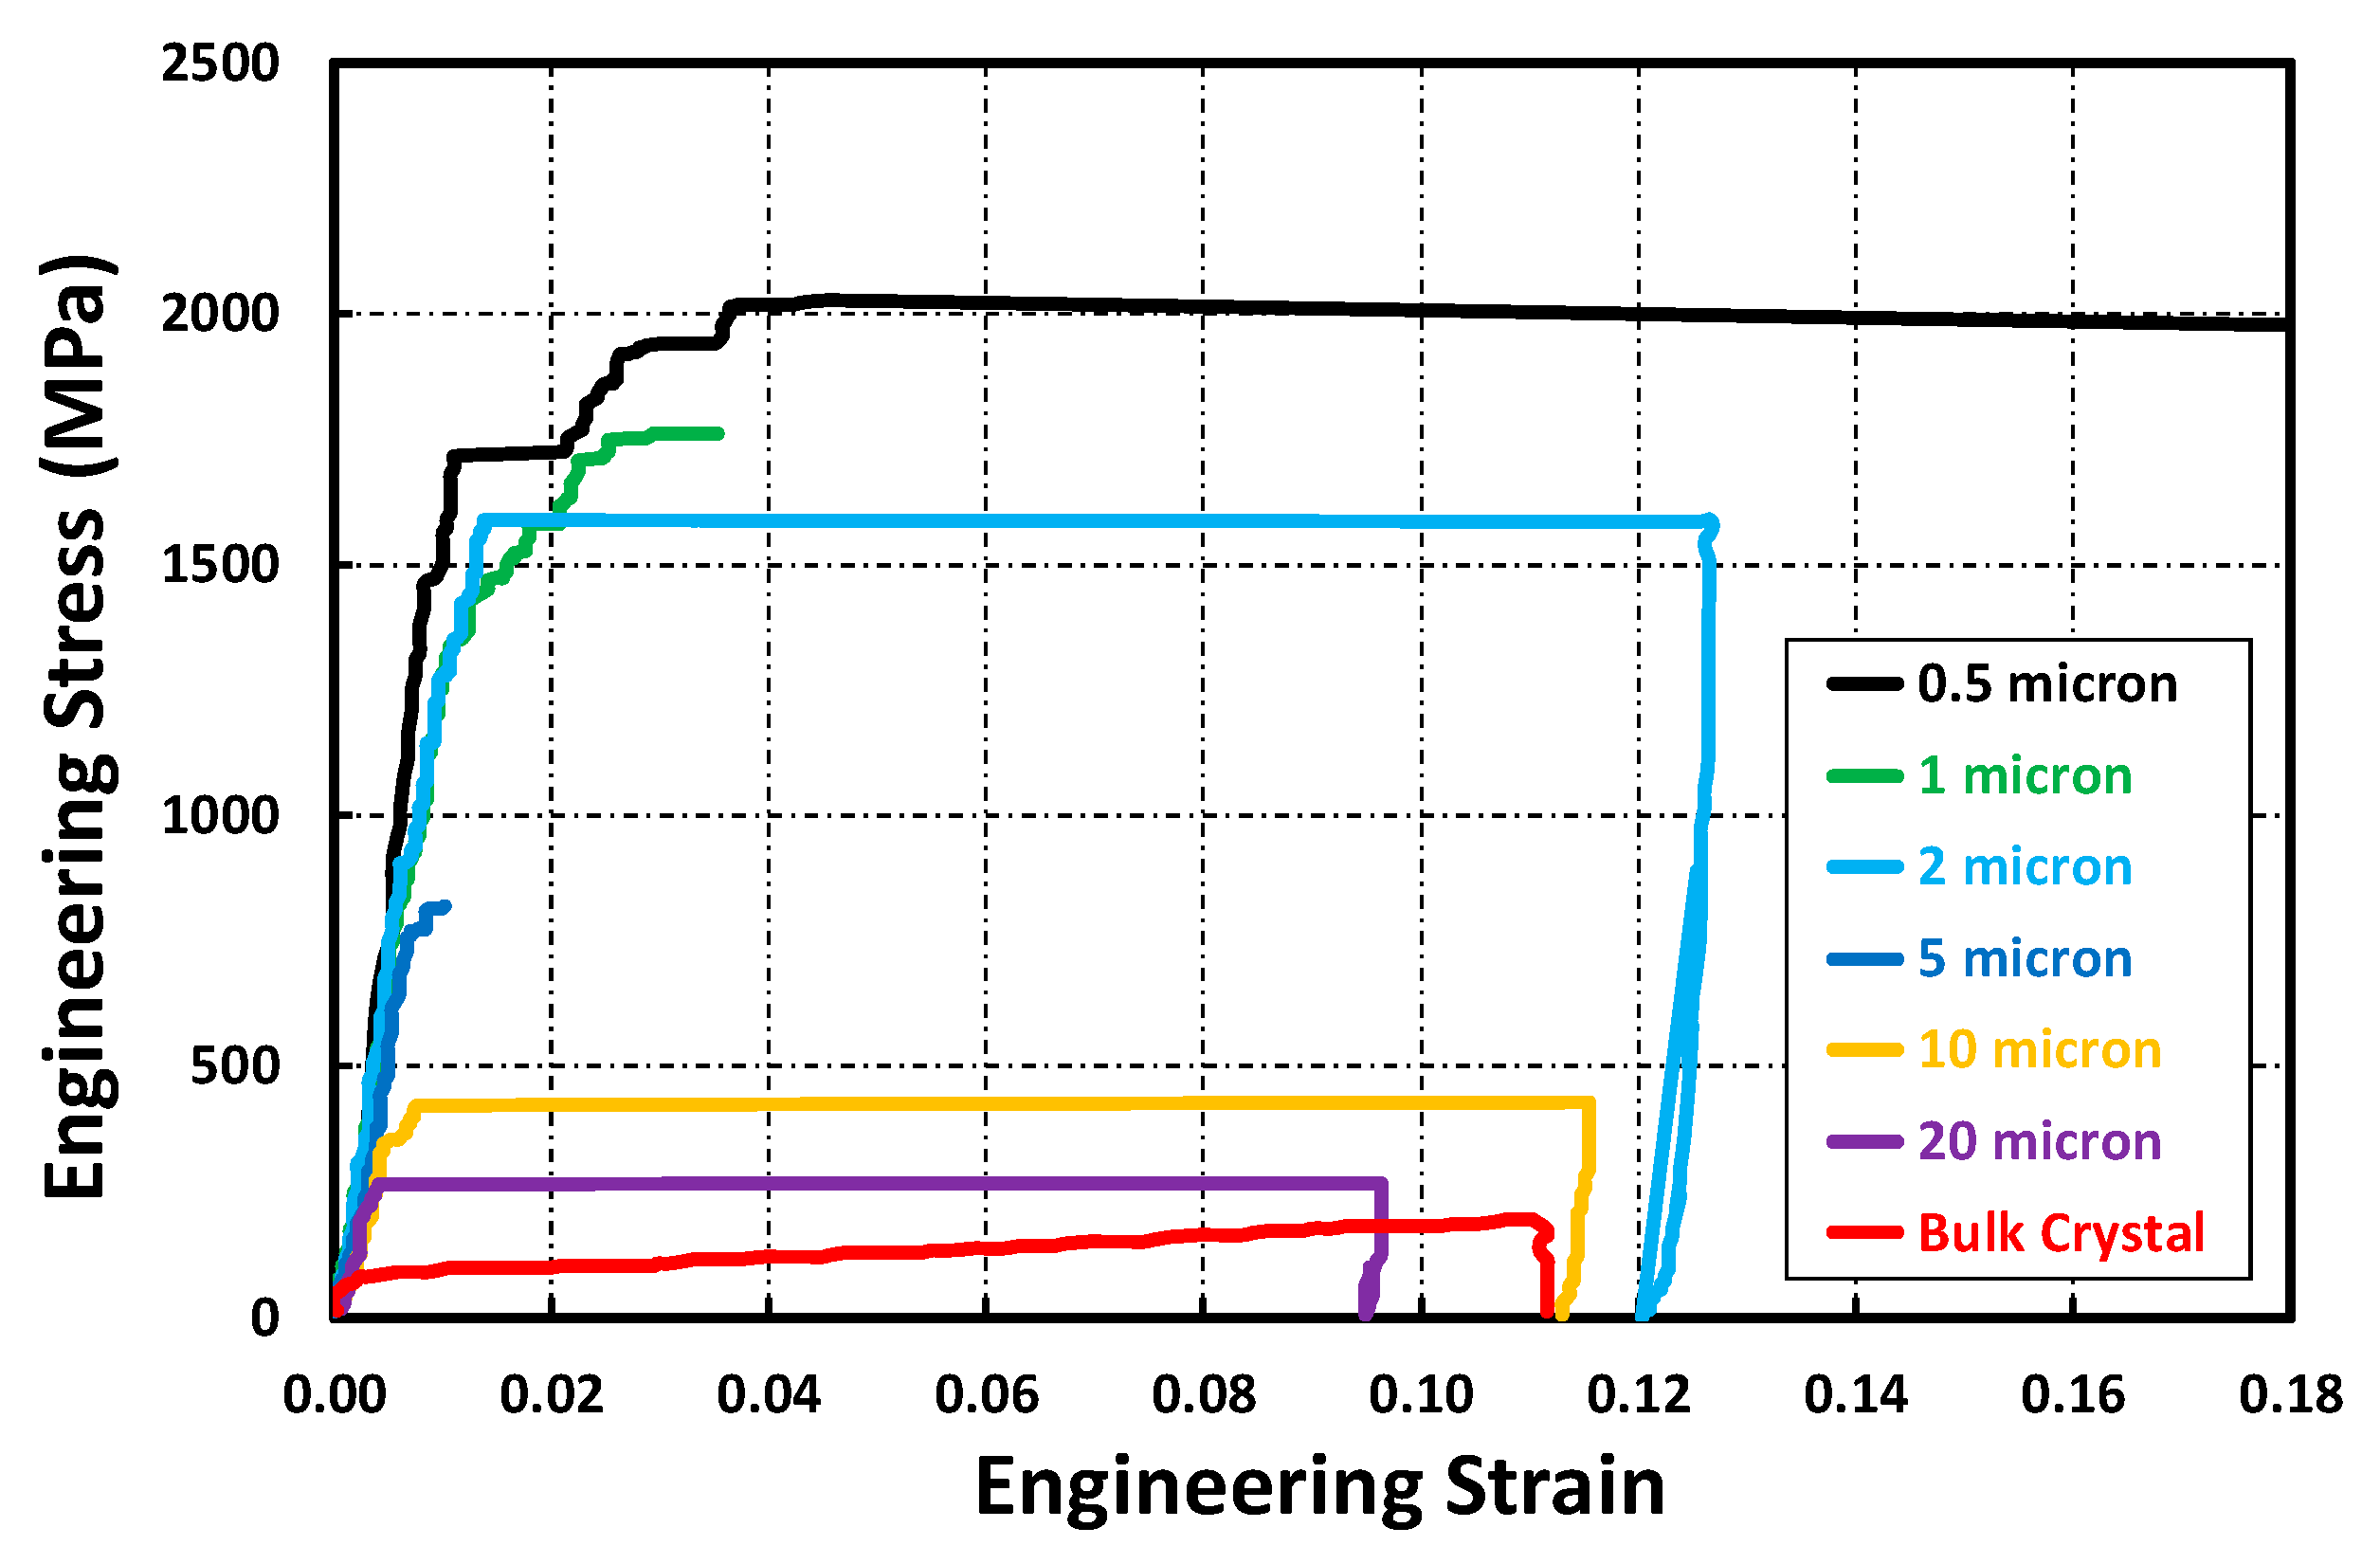
Inspired by the uniaxial compression test of bulk samples, Uchic and his coworkers [7,8,9] combined the focused-ion-beam (FIB) milling and flattened-tip nanoindentation to assess the in situ deformation plasticity of micron/submicron sized pillars of pure Ni and Ni super alloy at room temperature (Figure 1). Uchic and his coworkers [7,8,9] reported the variation of stress–strain curves as the pillar diameter changes and observed that the yield stress inversely depends on sample size. For instance, Figure 2 shows that the yield stress of a 0.5 μm Ni3Al-Ta pillar is more than one order larger than that of the bulk sample. Following that, this technique has become very popular for studying the size effects in different materials.
The original finding of Uchic and his coworkers [7,8,9] confirmed that both extrinsic and intrinsic length scales should be simultaneously considered to explain the size effects in crystalline materials. This opened a new era in the field of mechanical metallurgy and triggered an avalanche of researches aim at exploring the effect of samples size on the uniaxial stress–strain curves of different classes of materials raging from face centered cubic (FCC), body centered cubic (BCC), hexagonal close-packed (HCP), tetragonal metals, to shape memory alloys, metallic glasses, and nanocrystalline materials. Uchic et al. [2] reviewed the relevant literature on the pillar compression tests of metals with FCC, BCC, and HCP crystal structures and discussed the required experimental procedures and challenges including the nonuniform stress distribution along the slightly tapered FIB-machined pillars, the presence of FIB-irradiation damaged layer, the confinement provided by the elastic substrate, and the plastic instability of micropillars. They also put forward some possible governing mechanisms for the observed smaller-being-stronger size effect. After Uchic et al. [2], other groups have also reviewed the size effects and deformation mechanisms in metallic micro/nano-sized pillars (Kraft et al. [4] and Greer and De Hosson [3]).
In this section, the uniaxial compressive micropillar test results of the FCC, BCC, and HCP crystal structures are presented and discussed in more detail. Among them, most of the earlier studies were devoted to the FCC crystals. The key reasons behind this tendency were twofold as, first, there exists good knowledge around the dislocation mechanisms associated with the bulk and whisker samples of FCC metals, and, second, Au has been favorable since it is not trivial at all to interpret micropillar test results in the presence of interfering oxide layers. The measured yield or flow stress, i.e., , of FCC micropillar samples showed a strong size dependency of the following power law function of the pillar diameter, i.e., ,
where is a constant and is the power law exponent.
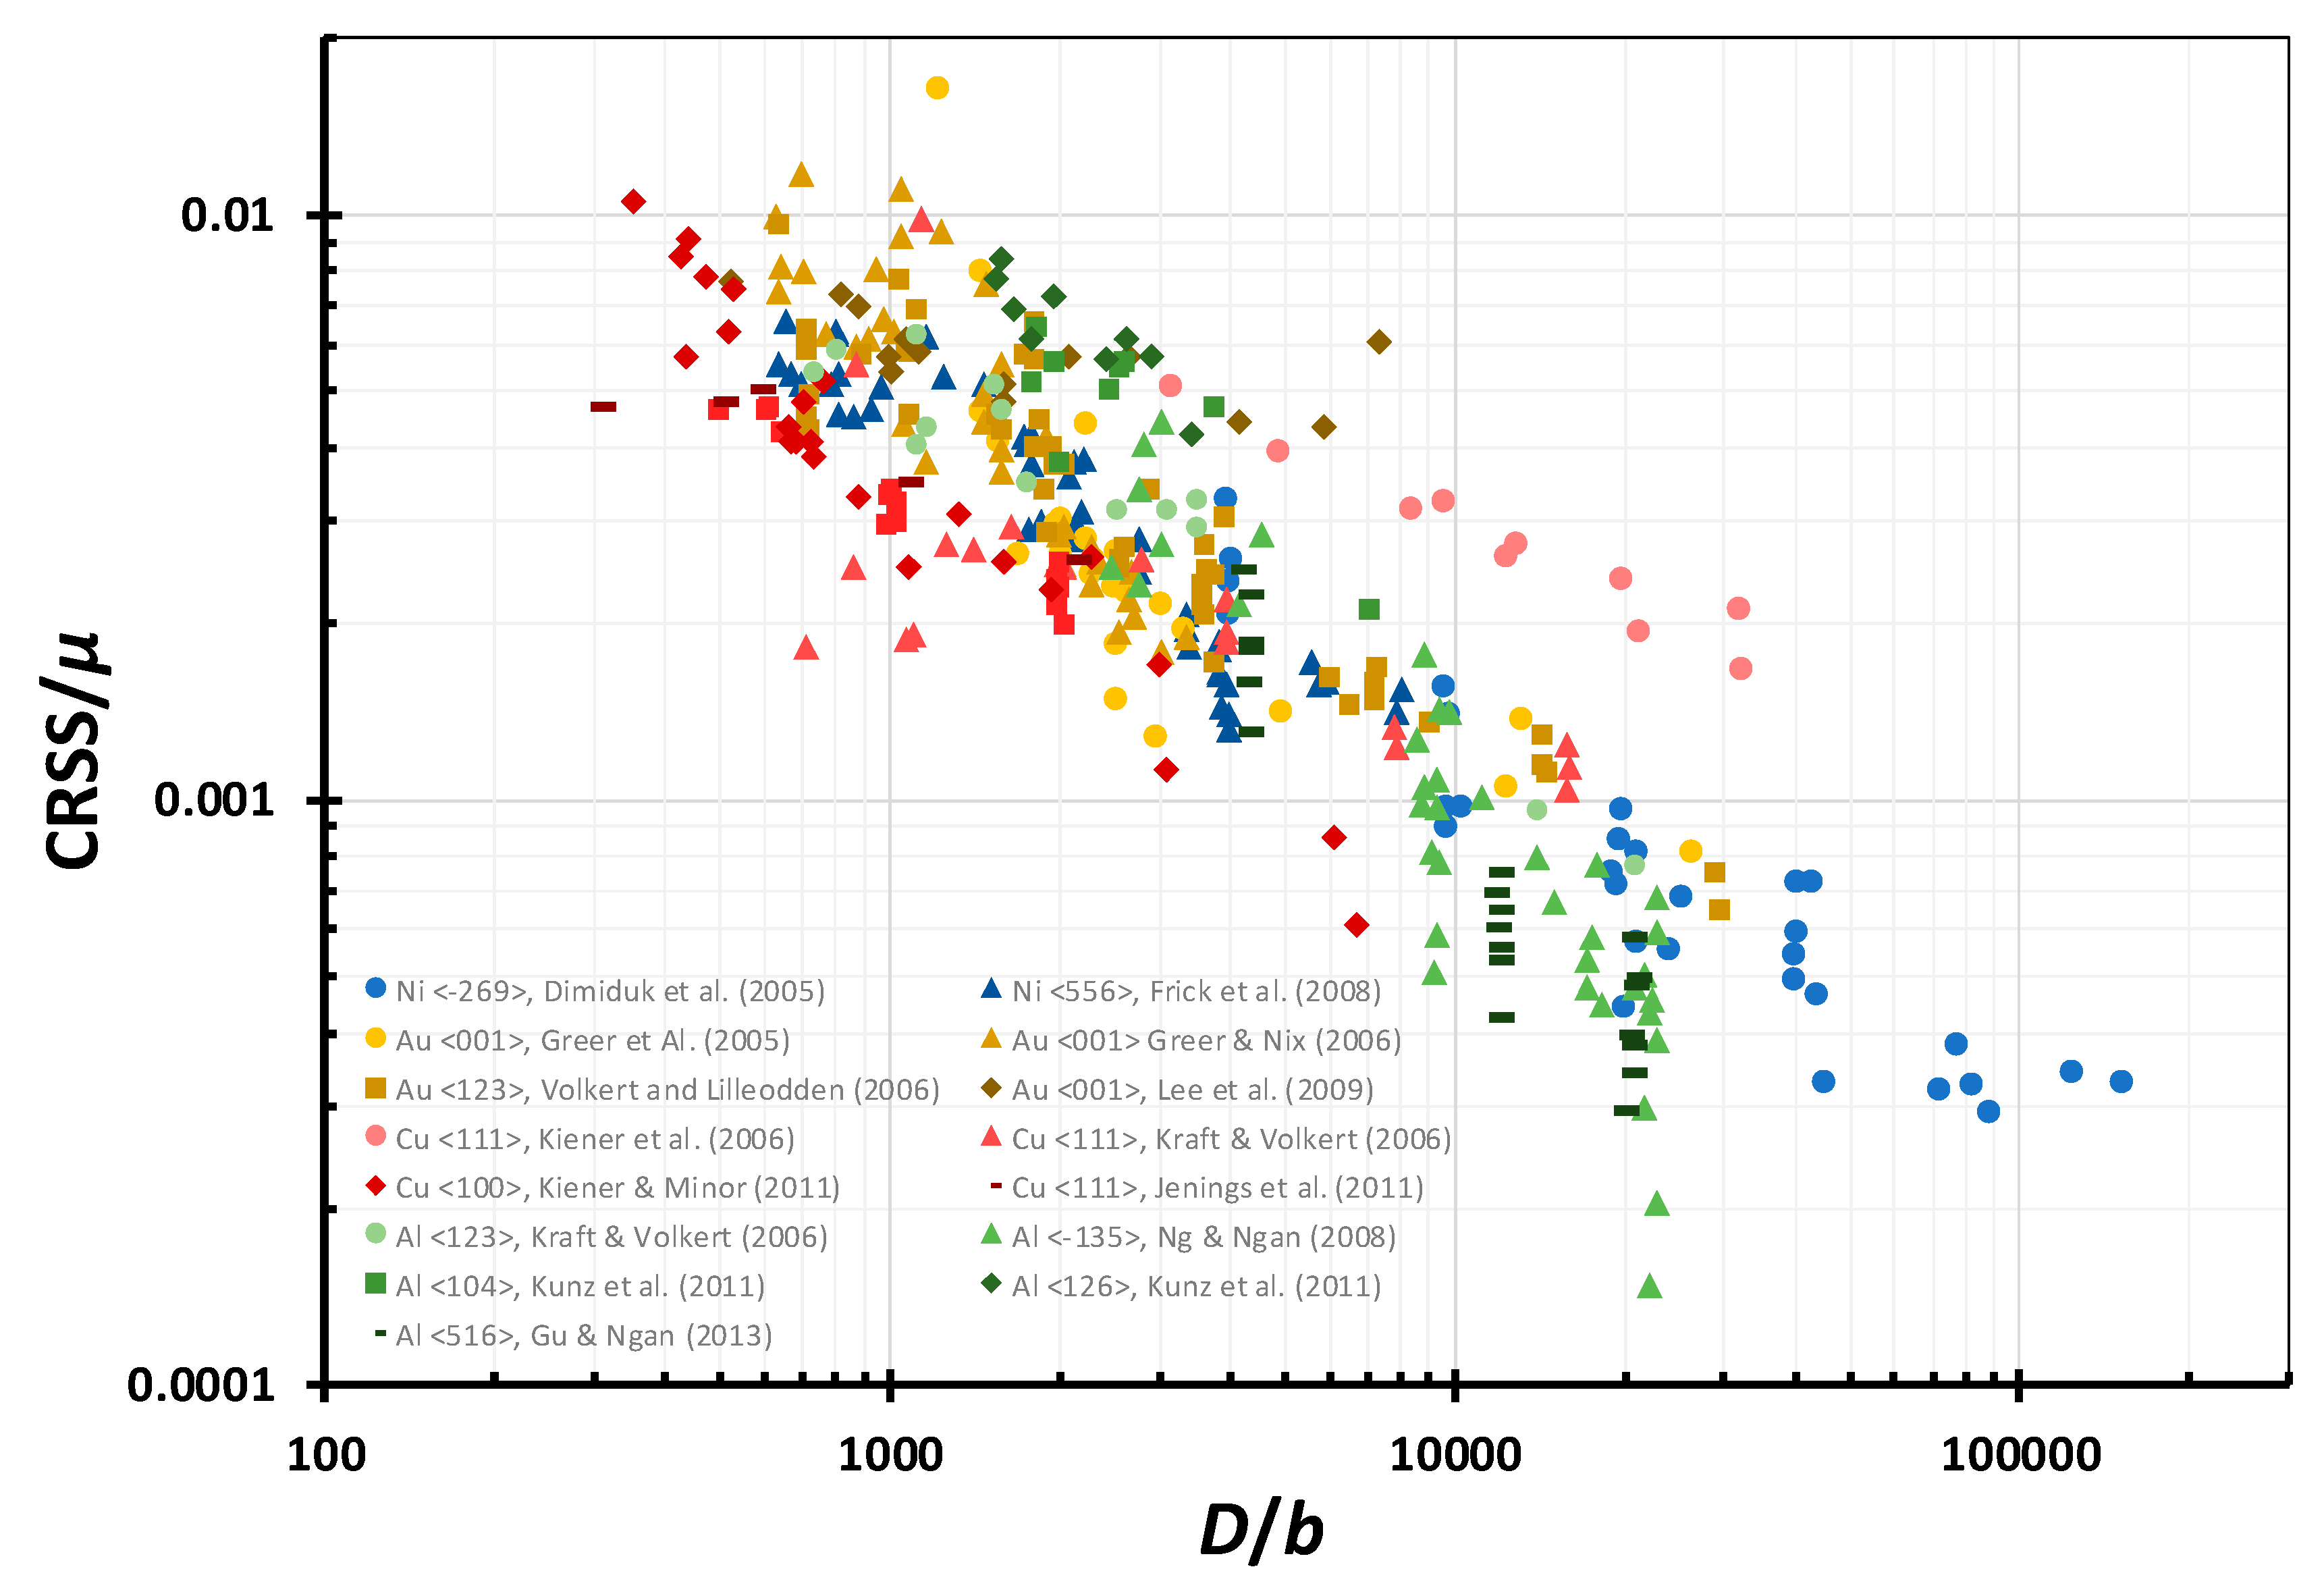
In order to remove the effect of sample’s texture, one should consider the critical resolved shear stress, i.e., , instead of the flow stress. In Figure 3, the critical resolved shear stress normalized by the shear modulus, , of a broad range of micro/nano-sized FCC metallic pillars are extracted from the literature and plotted against the sample diameter normalized by the Burgers vector, . It can be seen that a reasonable fit of the following form can be achieved for :
The calculated exponent is almost identical to those obtained by Uchic et al. [2] and Greer and De Hosson [3].
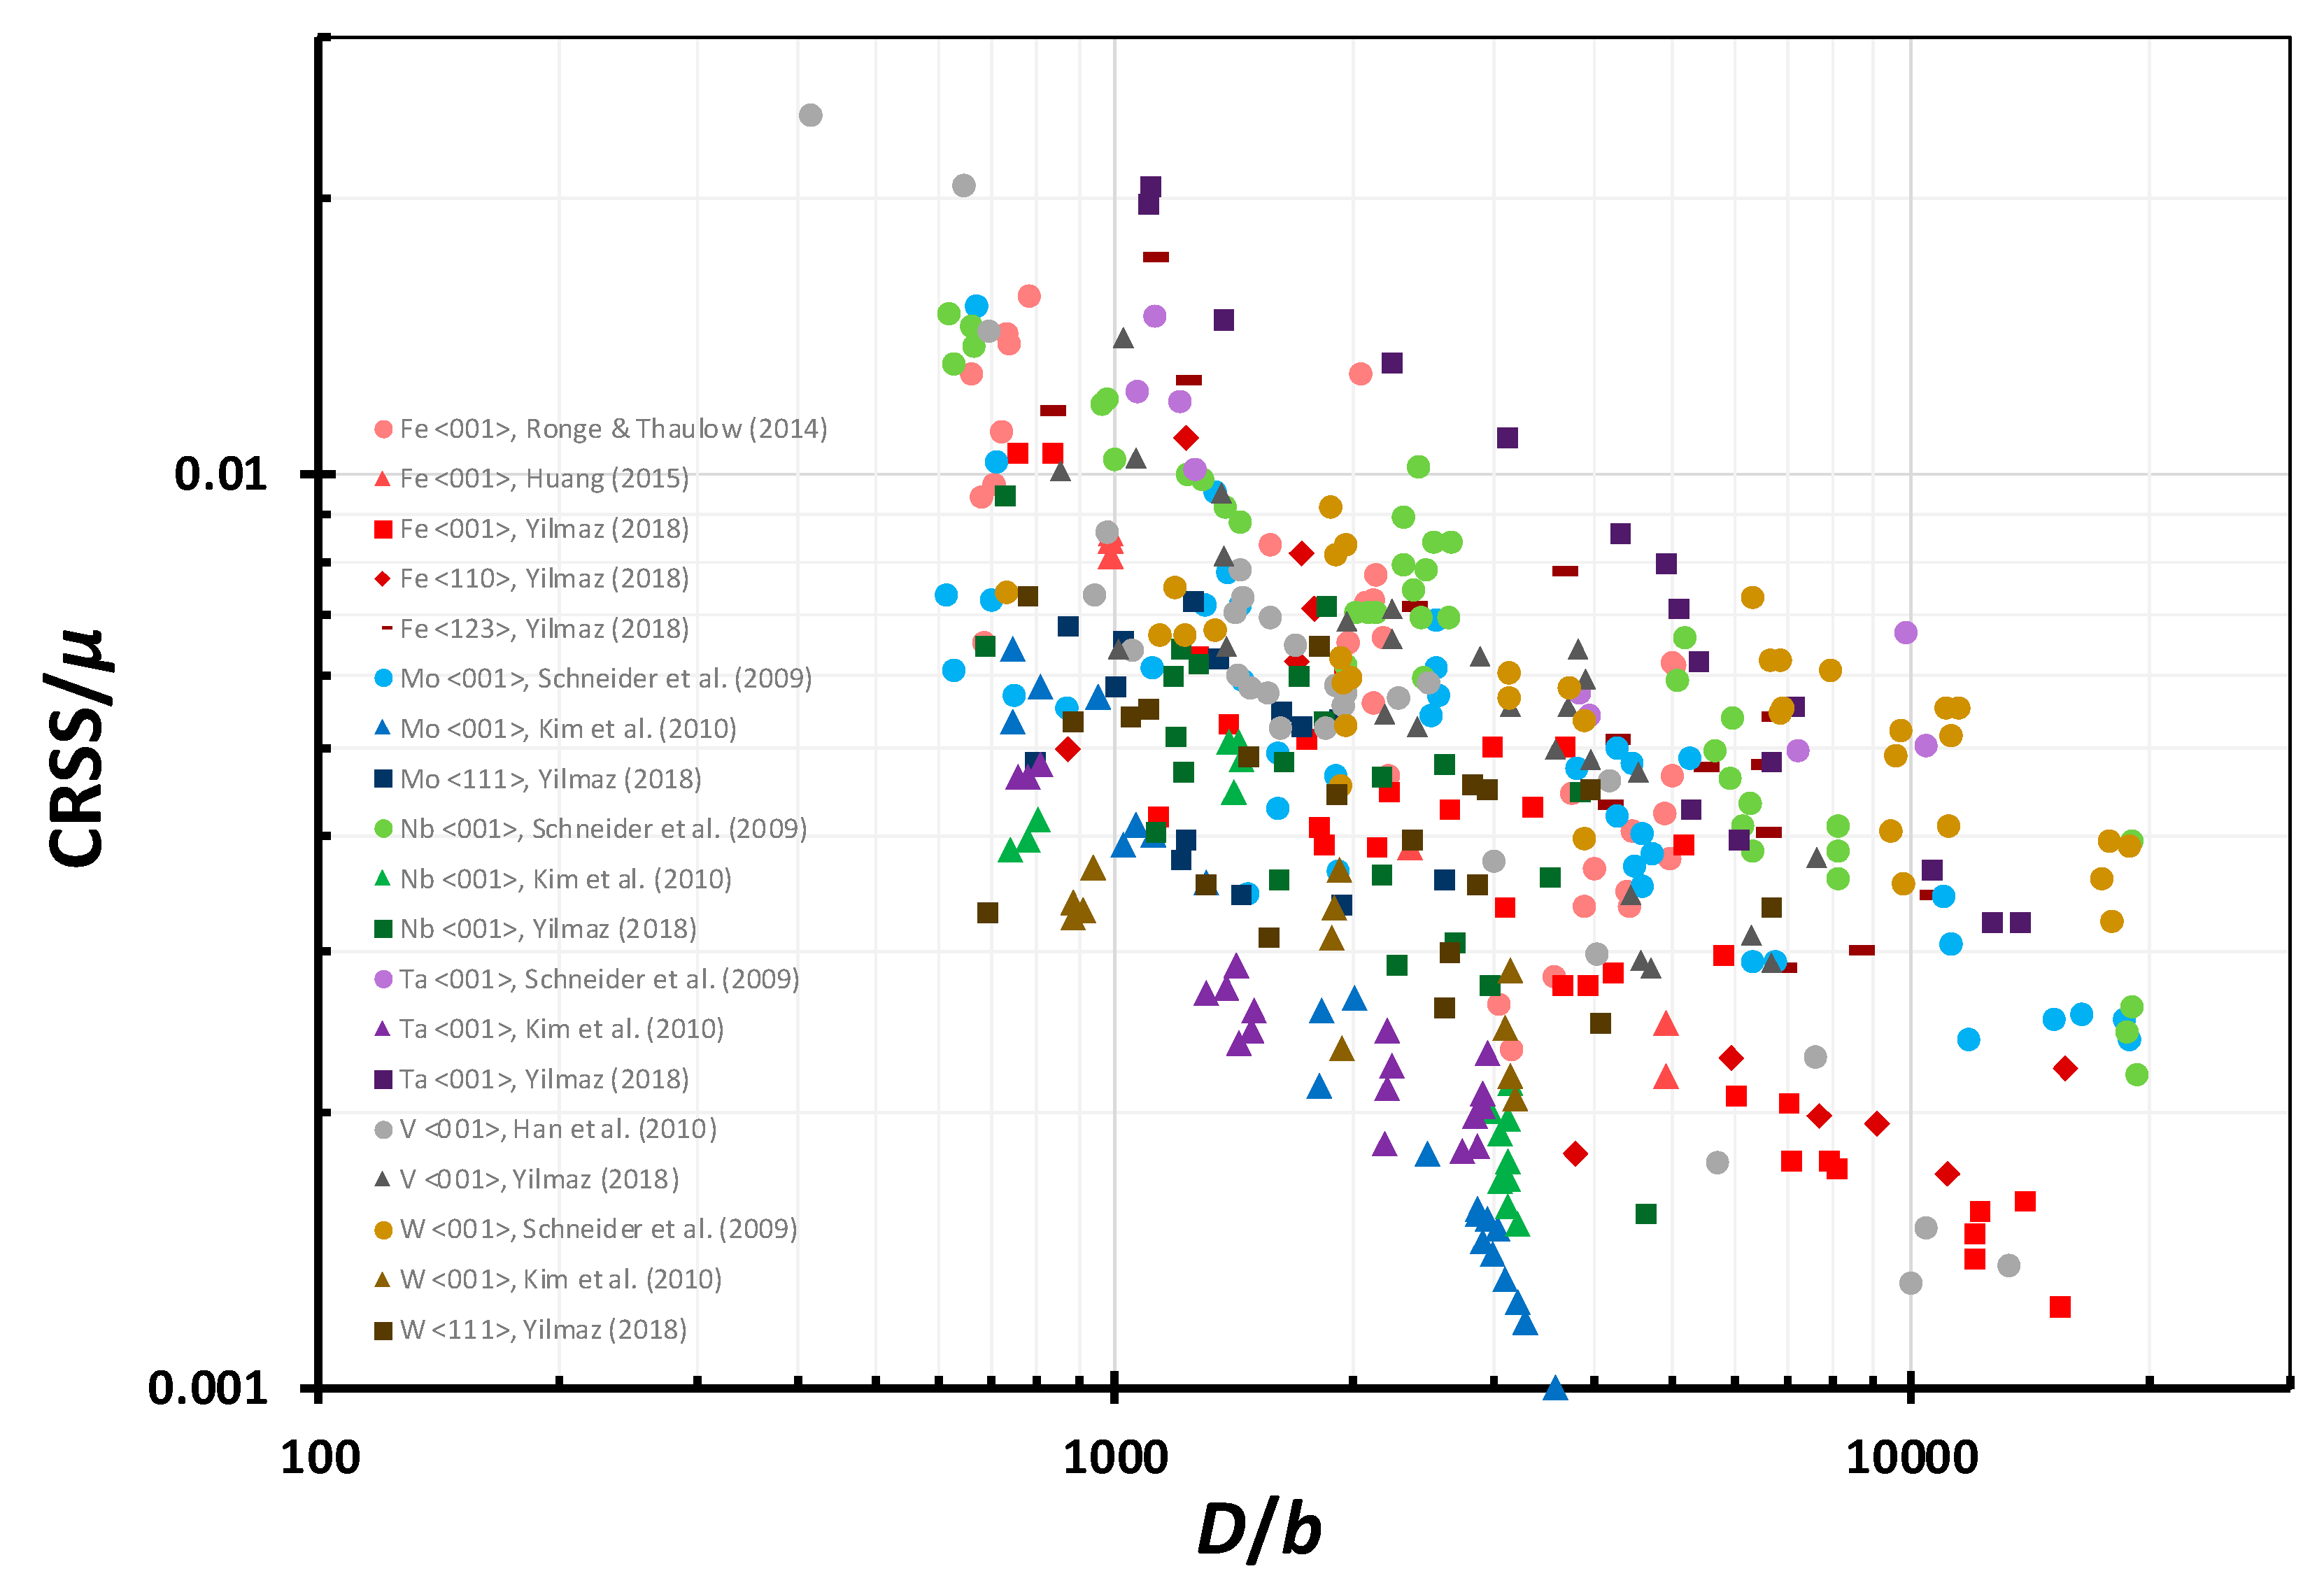
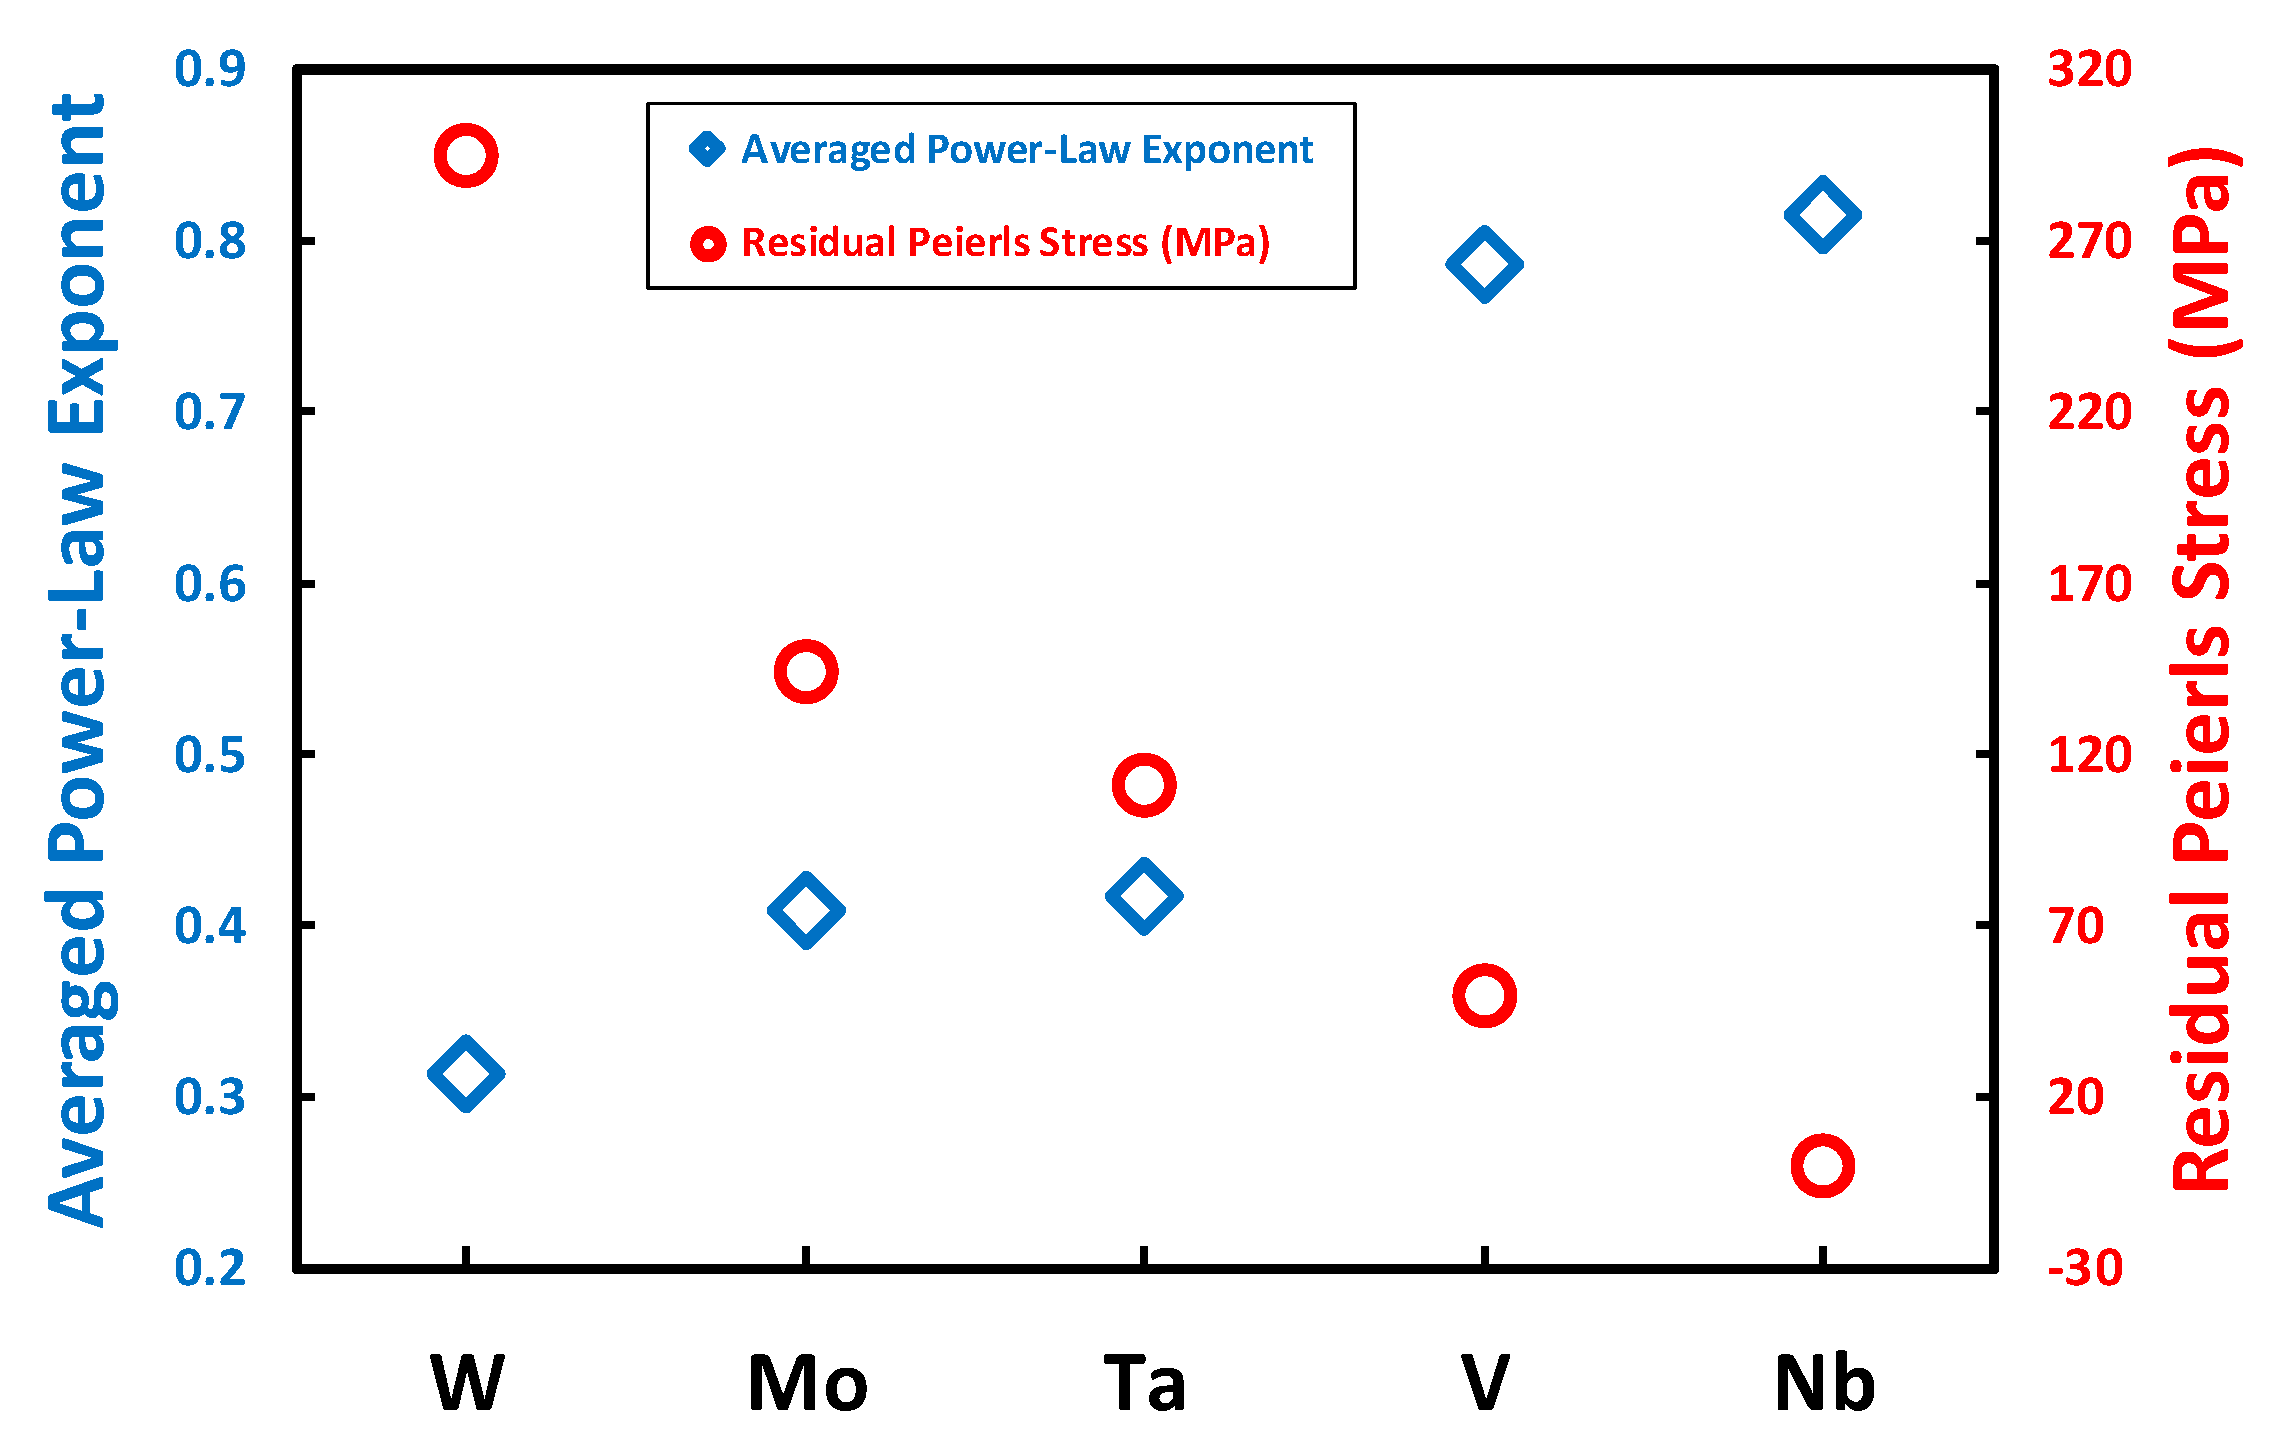
As mentioned previously, most of the experimental data available in the literature regarding the micropillar compression experiments are for FCC samples. However, some studies also have addressed the BCC materials. Figure 4 summarizes the data for the BCC pillars available in the literature. The results show a trend similar to FCC samples in which smaller samples are stronger. However, unlike the FCC materials, one cannot find a global fit for BCC metals due to their complex deformation mechanisms. For example, unlike the FCC metals which can be fully described using the Schmid’s law, this may not be true for BCC metals and the slip system with the maximum resolved shear stress might not always become the dominant mode of deformation. Furthermore, many factors including the temperature, strain rate, and orientation may influence the size effects in BCC pillars. Greer and De Hosson [3] found a strong correlation between the BCC metals observed power law exponents and their residual Peierls barrier at room temperature. They stated that a higher residual Peierls stress leads to a lower power law exponent (Figure 5).
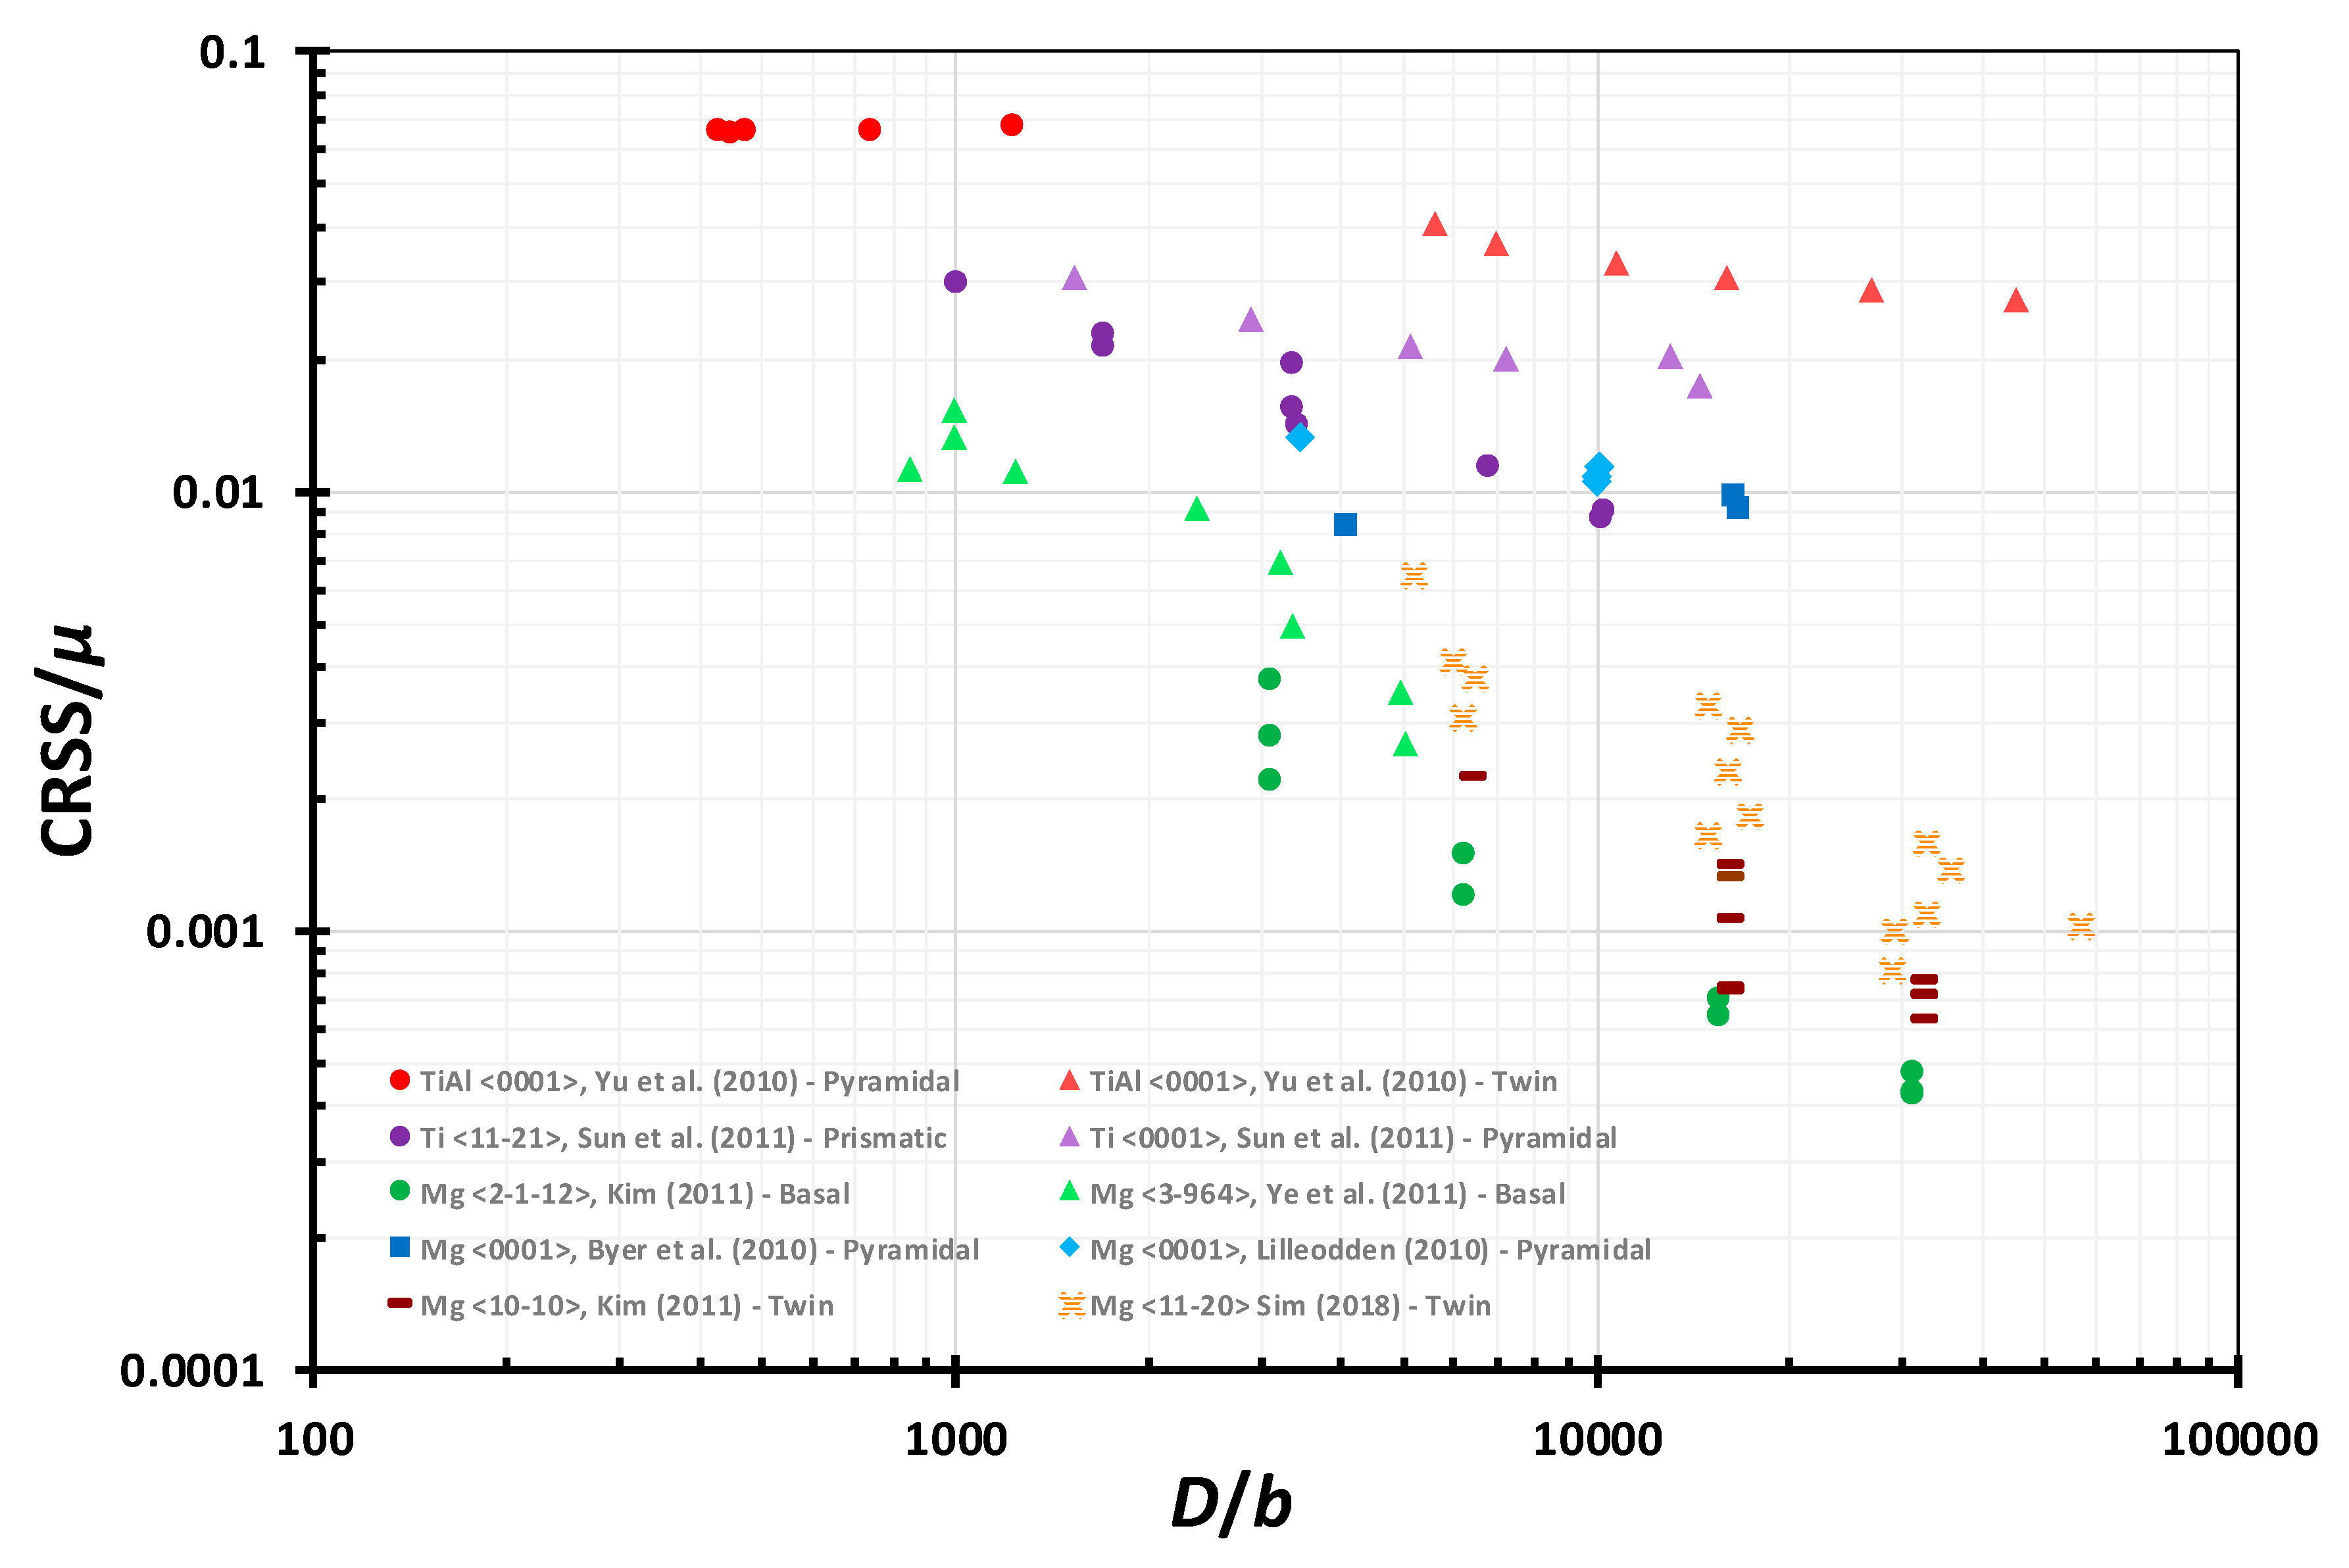
In the case of the HCP metals, the size effects data obtained from the pillar compression test are limited compared to the FCC structure. Figure 6 summarizes the available data in the literature regarding size effects of HCP samples during micropillar compression test. In the case of samples with [0001] orientations, basal and prismatic slip systems cannot be activated. Accordingly, the yield occurs due to two deformation mechanisms of pyramidal slip and twinning. In the case of Ti, Sun et al. [45], the twin system is the governing deformation mechanism. However, Lilleodden [46] and Byer et al. [47] reported the pyramidal slip systems to be dominant in the case of pure Mg. For HCP metallic samples of orientations other than [0001], both basal and prismatic slip modes have been reported to become activated. Ye et al. [48] reported that the basal slip occurs for the pure Mg sample with the loading axis close to the [364] direction. They observed that the smaller pillars required higher stresses to initiate the basal sliding which governs the size effects. In the case of Ti with the loading axis along [110], Sun et al. [45] reported that the slip occurs on the prismatic planes. Similar to the observations of Greer and De Hosson [3], depending on the governing deformation mode occurred, different power law slopes can be obtained for HCP metals. In the case of basal slip mode, the slope is close to FCC metals, i.e., ; however, for the prismatic slip mode, the power law exponent is about 0.44.
3. Size Effects Models
From a theoretical point of view, various models have been already suggested to interpret the extrinsic size effects observed. Among them, source truncation, source exhaustion hardening, and weakest link theory are the three underlying mechanisms mostly addressed by the researchers. These mechanisms are discussed in more details in the following sections.
3.1. Dislocation Source Truncation Mechanism
In confined volumes like micro- and nanopillars, the source truncation mechanism occurs when the double-ended dislocation sources are transformed into the single-ended ones due to the presence of free surfaces. Consequently, the mean length of dislocation sources reduces as the sample size decreases and thus the flow stress increases. Parthasarathy et al. [52] adopted this mechanism and mathematically interpreted the role of size on the flow stress. To do so, they assumed a cylindrical pillar containing randomly positioned pins. Now, for this set of pins, the probability to have the maximum distance from the free surface equals , which can be estimated from the following equation:
where is the specimen radius, is the major axis of the elliptical glide plane, and is the angle between the primary slip plane and the loading axis. Defining as the mean effective dislocation source length, it can be readily calculated from the following integral:
Basically, Parthasarathy et al. [52] and later Rao et al. [53] related the size effects to this mean effective dislocation source length. Parthasarathy et al. [52] neglected the effect of sample size on the truncation of the Taylor potential and assumed that the critical resolved shear stress (CRSS) is related to as follows:
where is a constant, is the shear modulus, is the Burgers vector, is the friction stress, and is the dislocation density. The number of pins, , can also be estimated from the equation below:
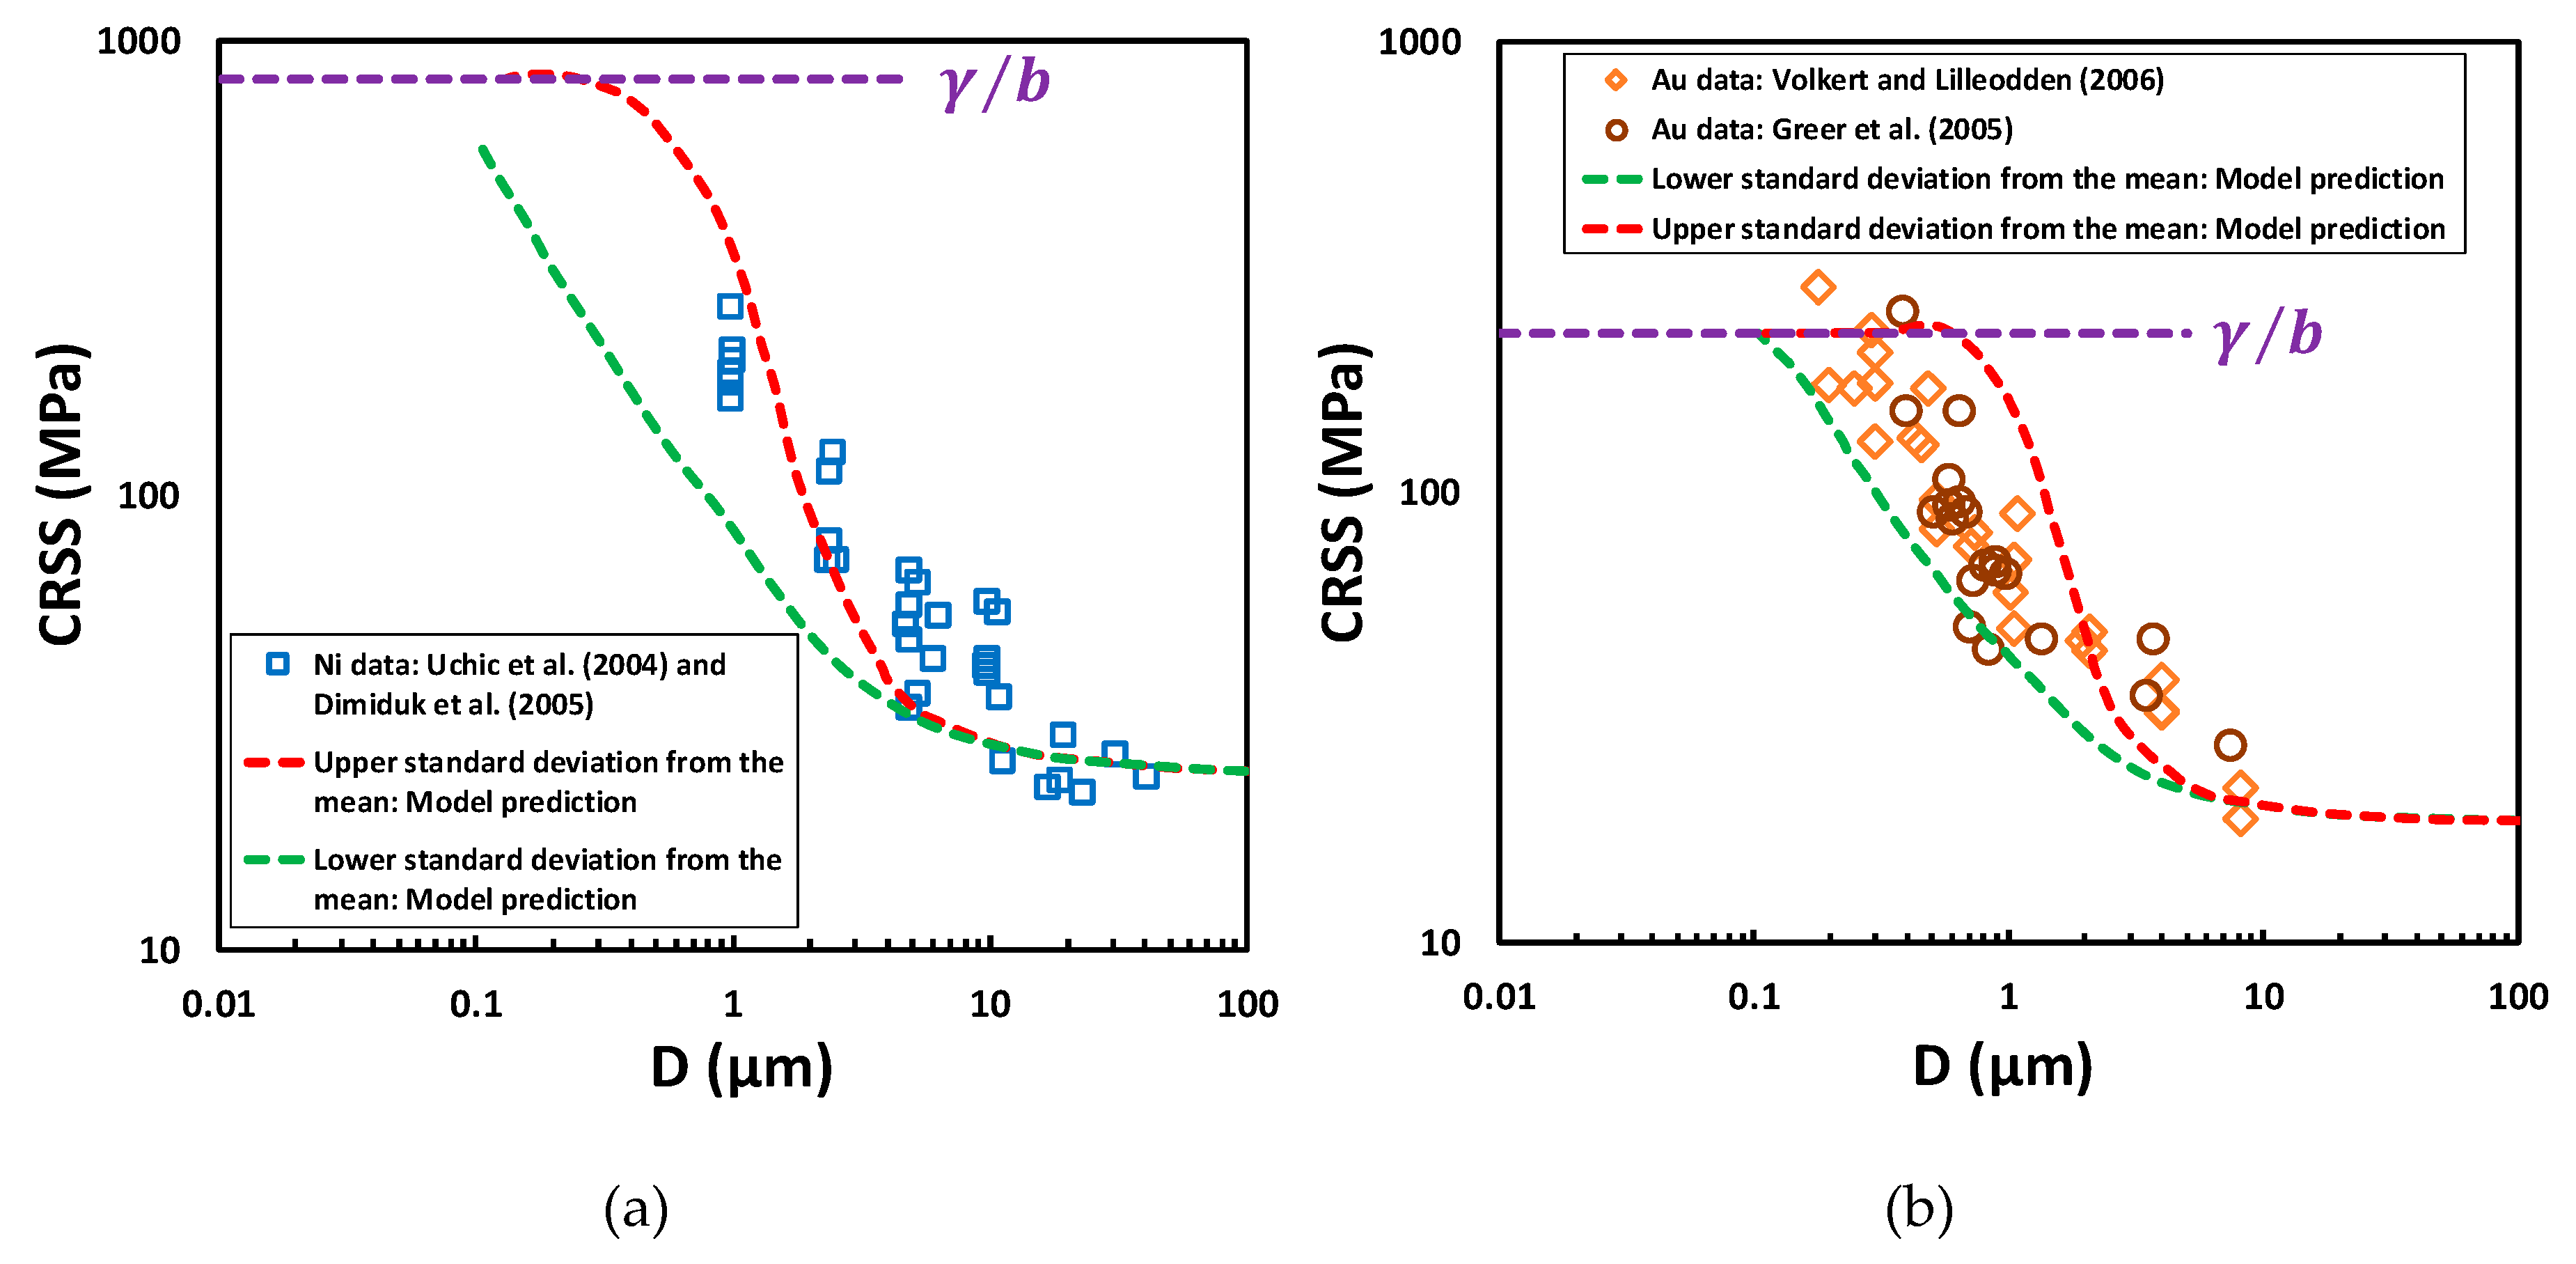
where is the total length of mobile dislocations. is the height of the pillar and is the number of slip system. is the average length of dislocation segments. Parthasarathy et al. [52] also assumed that ( is the stacking fault energy). Figure 7 shows the predictions of the proposed model which compares well with the experimental results for Ni ([7,25]) and Au ([26,28]).
3.2. Dislocation Source Exhaustion Mechanism
There exist several mechanisms such as dislocation escape from the free surfaces, dislocation source shutdown, and mechanical annealing that can decrease the mobile dislocation density and make the population of available dislocations insufficient to sustain the applied plastic flow. Consequently, the stress should be increased to activate stronger sources for the plastic flow to be continued. This is commonly termed in the literature as the dislocation source exhaustion hardening (see, e.g., [54]). As a special case of dislocation source exhaustion, dislocation starvation may occur in a confined volume when all its mobile dislocations leave the body. In such a case, the plastic flow mechanism, which is known as the dislocation starvation hardening [26], depends on source-limited activations.
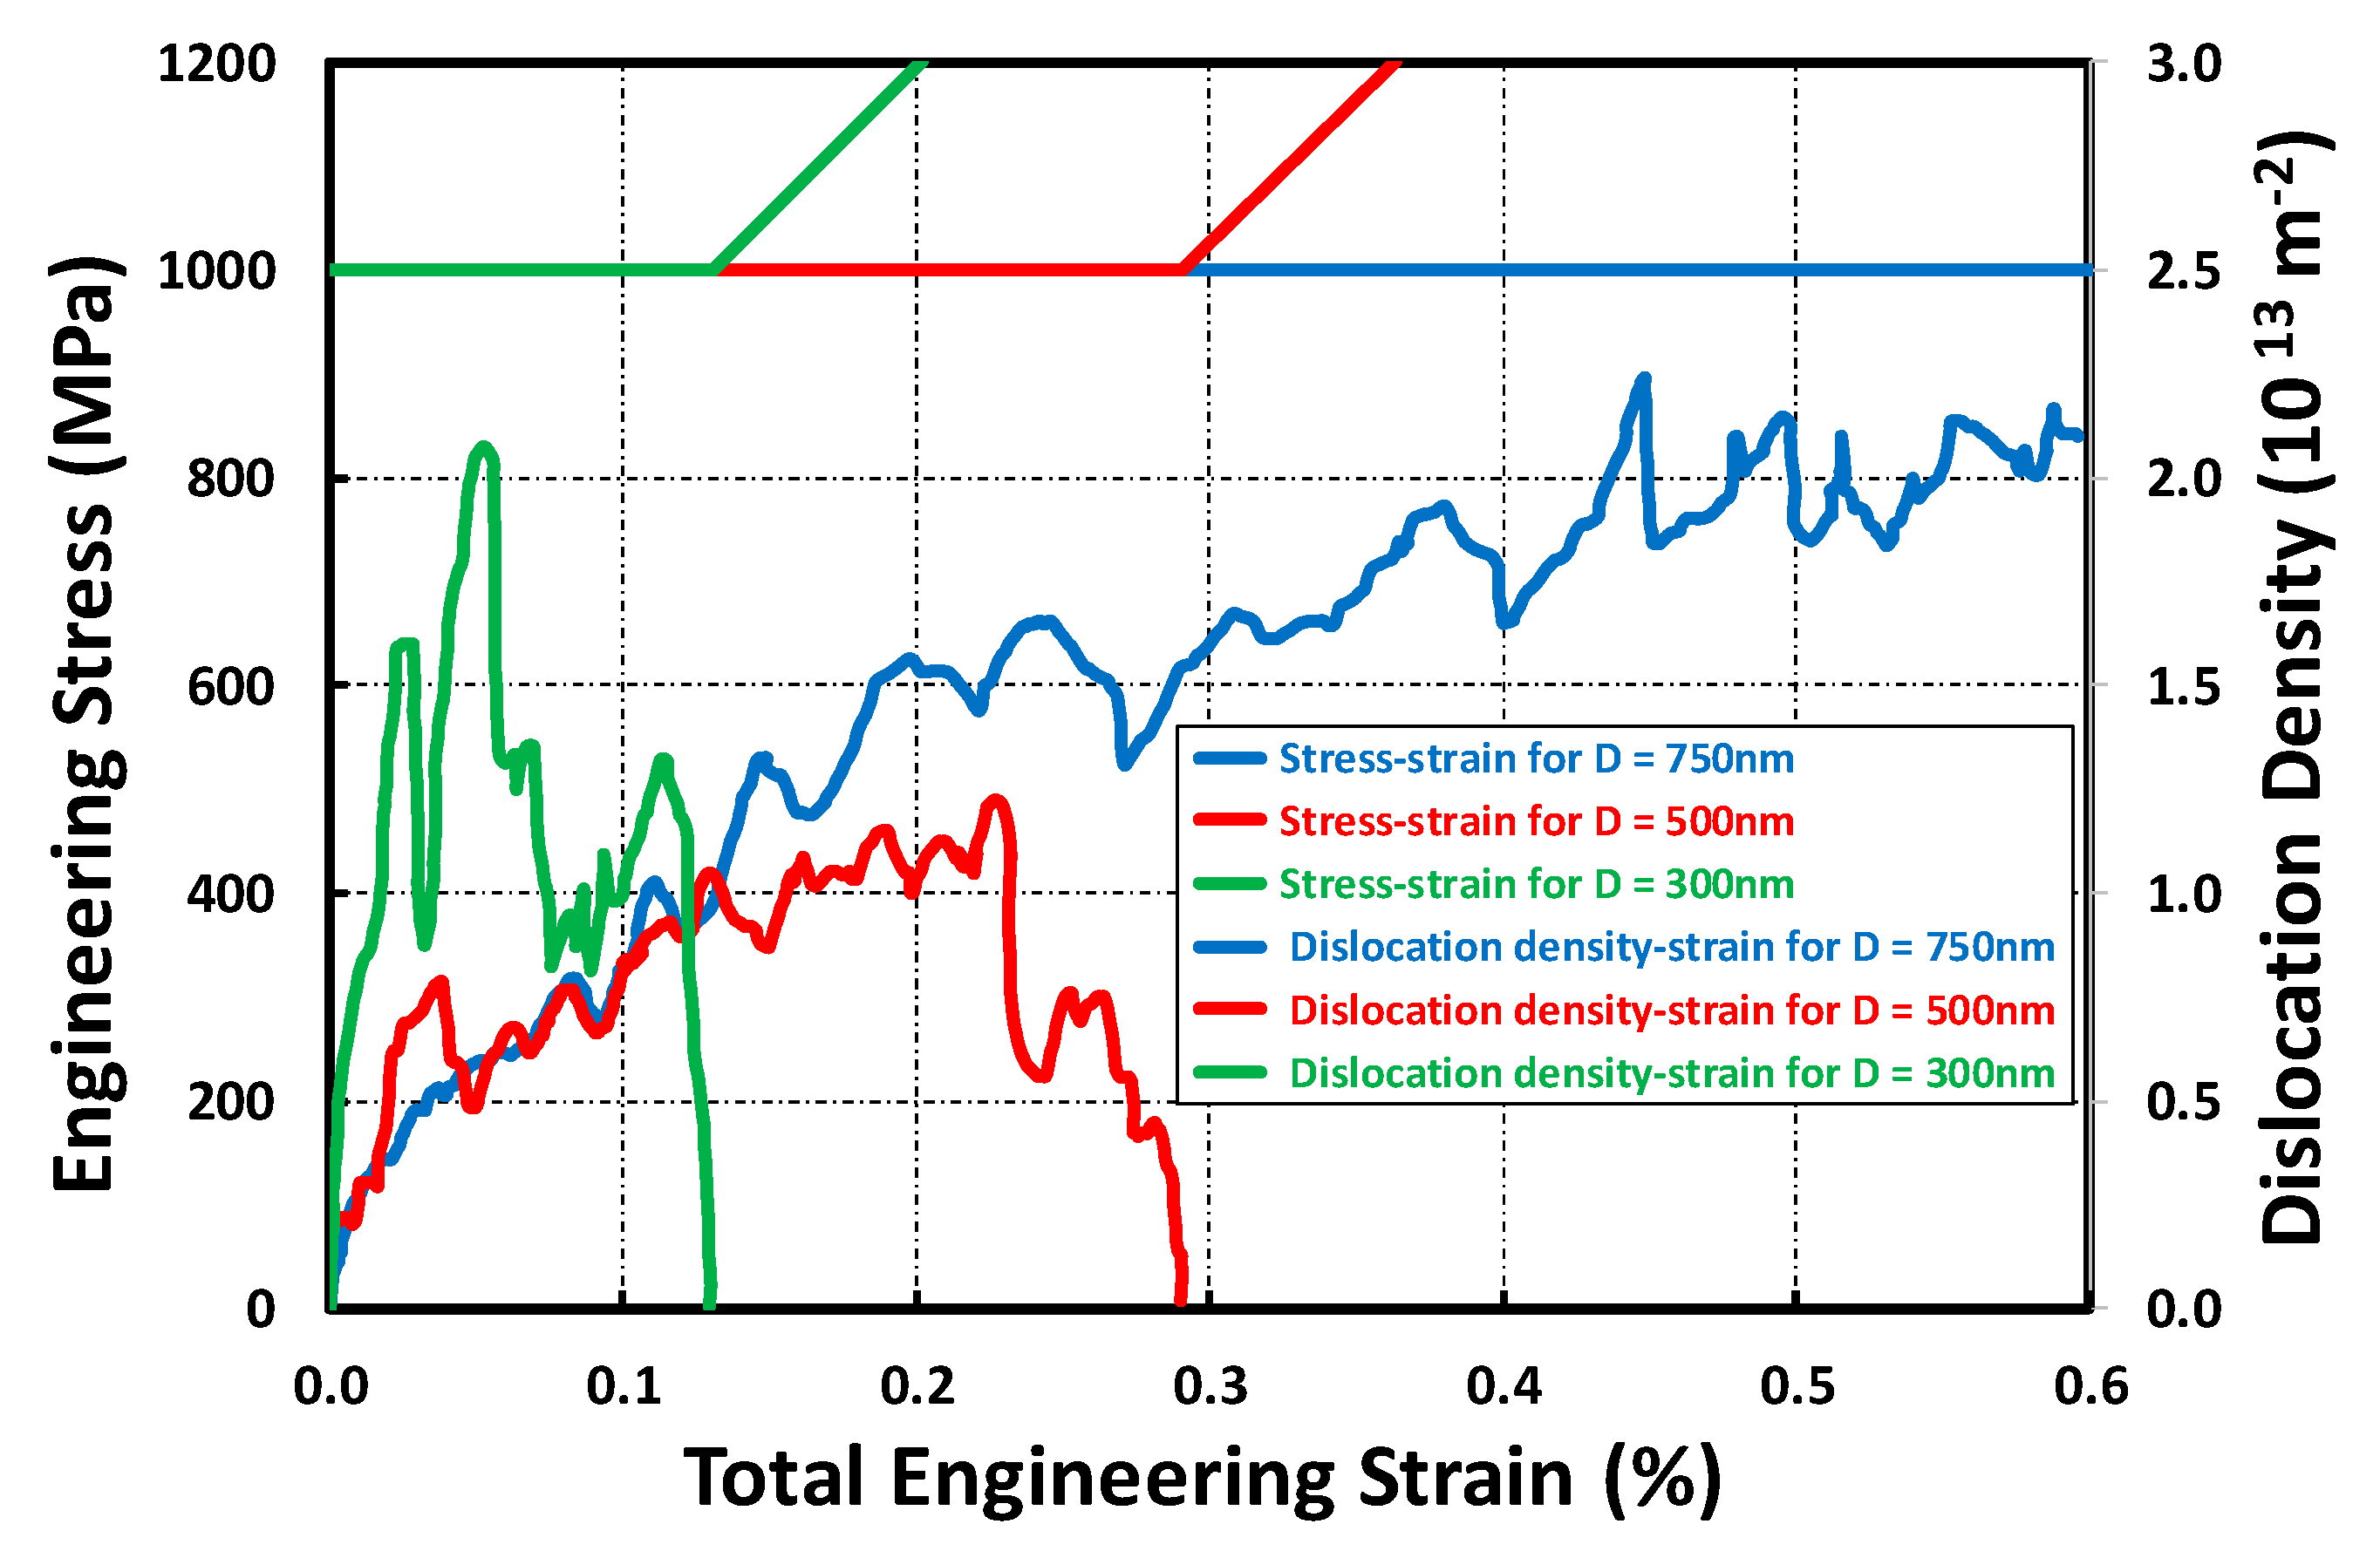
The dislocation source exhaustion mechanism including dislocation starvation was addressed by Zhou et al. [55] in a numerical study in which they used 3D discrete dislocation dynamics (DDD) to model uniaxially loaded Ni single crystal pillars of various diameters from 300 nm to 1000 nm. Assuming the primary glide plane at an angle of with respect to the loading axis, 50% escaping chance for any dislocation closer than from free surfaces, and neglecting dislocation losses due to annihilation or source shutdown, they estimated dislocation loss rate, , as the following inverse function of the pillar radius, ,
where is the velocity of dislocation and is the density of mobile dislocations. Considering the rate of dislocation multiplication as where is the dislocation mean free path, the dislocation content of the sample can be estimated as follows:
where , , and is the initial dislocation content, the Schmid factor, and the plastic strain induced by the movement of mobile dislocations, respectively. For negative values of the second term in in the RHS of Equation (8), the total dislocation content of the pillar decreases as plastic flow increases, and, if continued, dislocation starvation is unavoidable. Figure 8 shows the numerically predicted stress and dislocation density as the strain changes. As seen, dislocation starvation has occurred for the two pillar diameters of 300 nm and 500 nm, while the total dislocation content of 750 nm sample has increased with the growth of plastic flow. Moreover, with the appearance of dislocation starvation in the two smaller pillars, they start to behave elastically. Figure 8 depicts the stress and dislocation density with respect to the applied engineering strain for the case of a pillar diameter of 750 nm, which shows no trace of dislocation starvation.
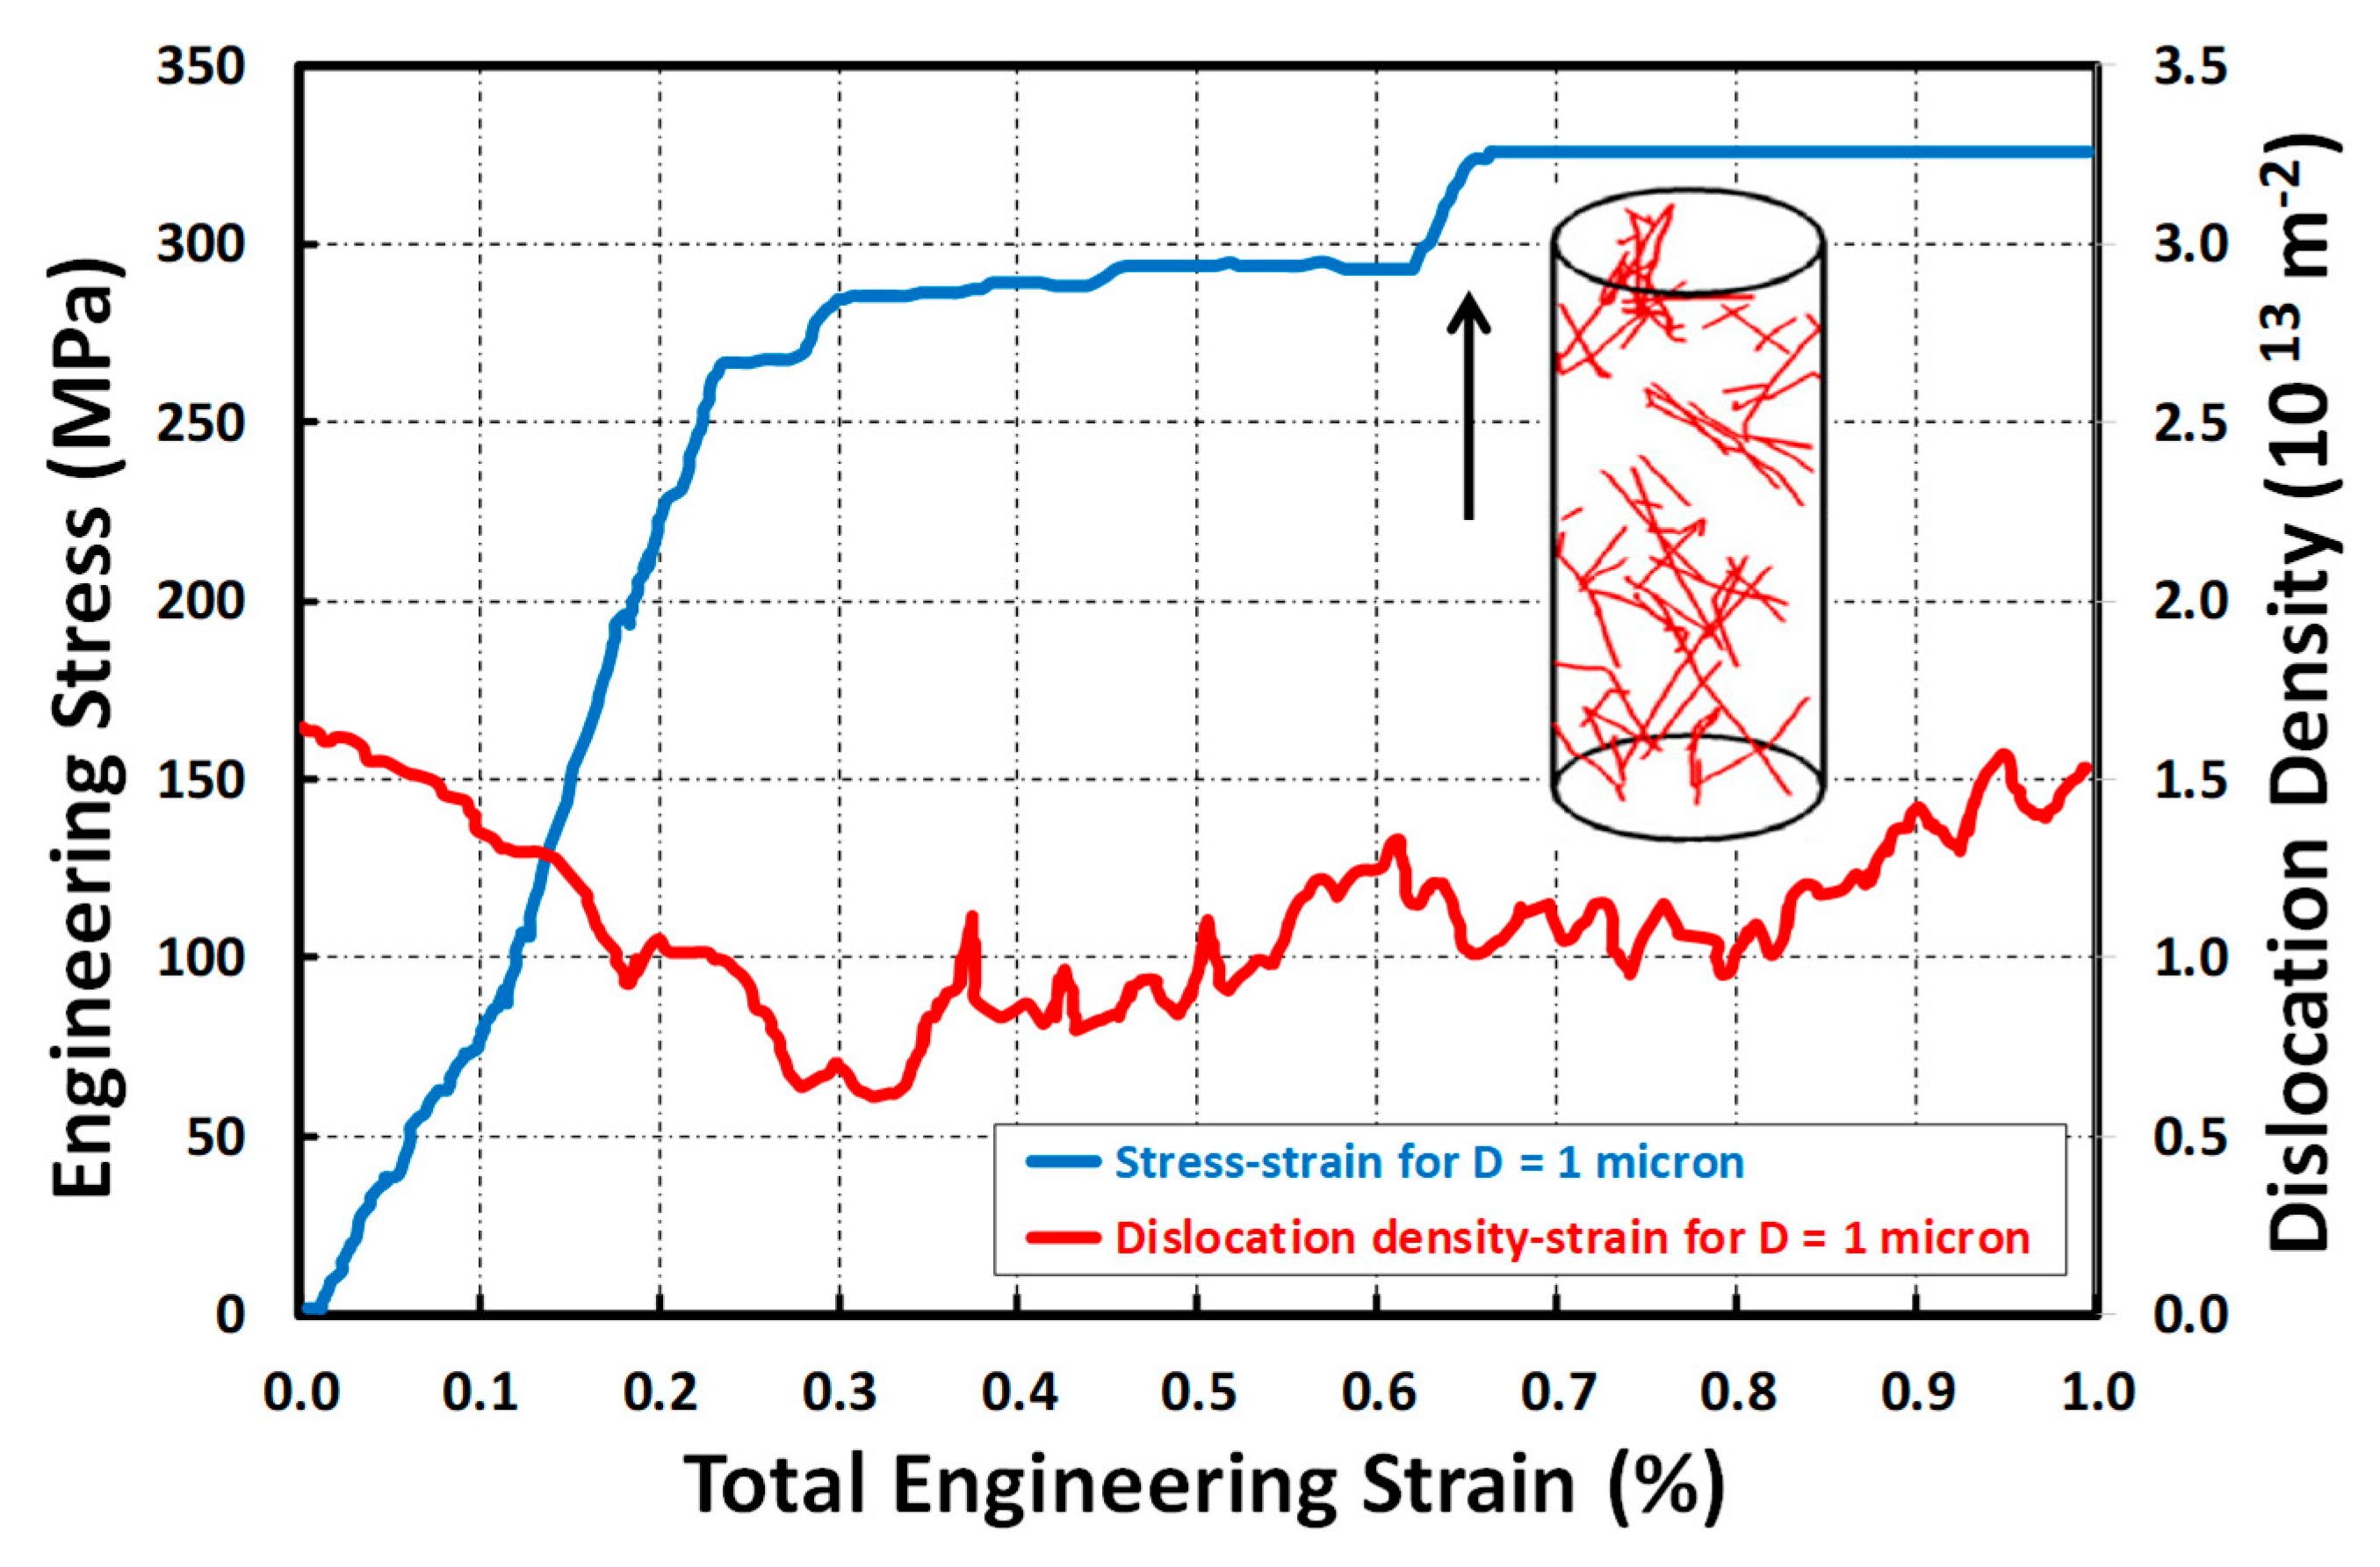
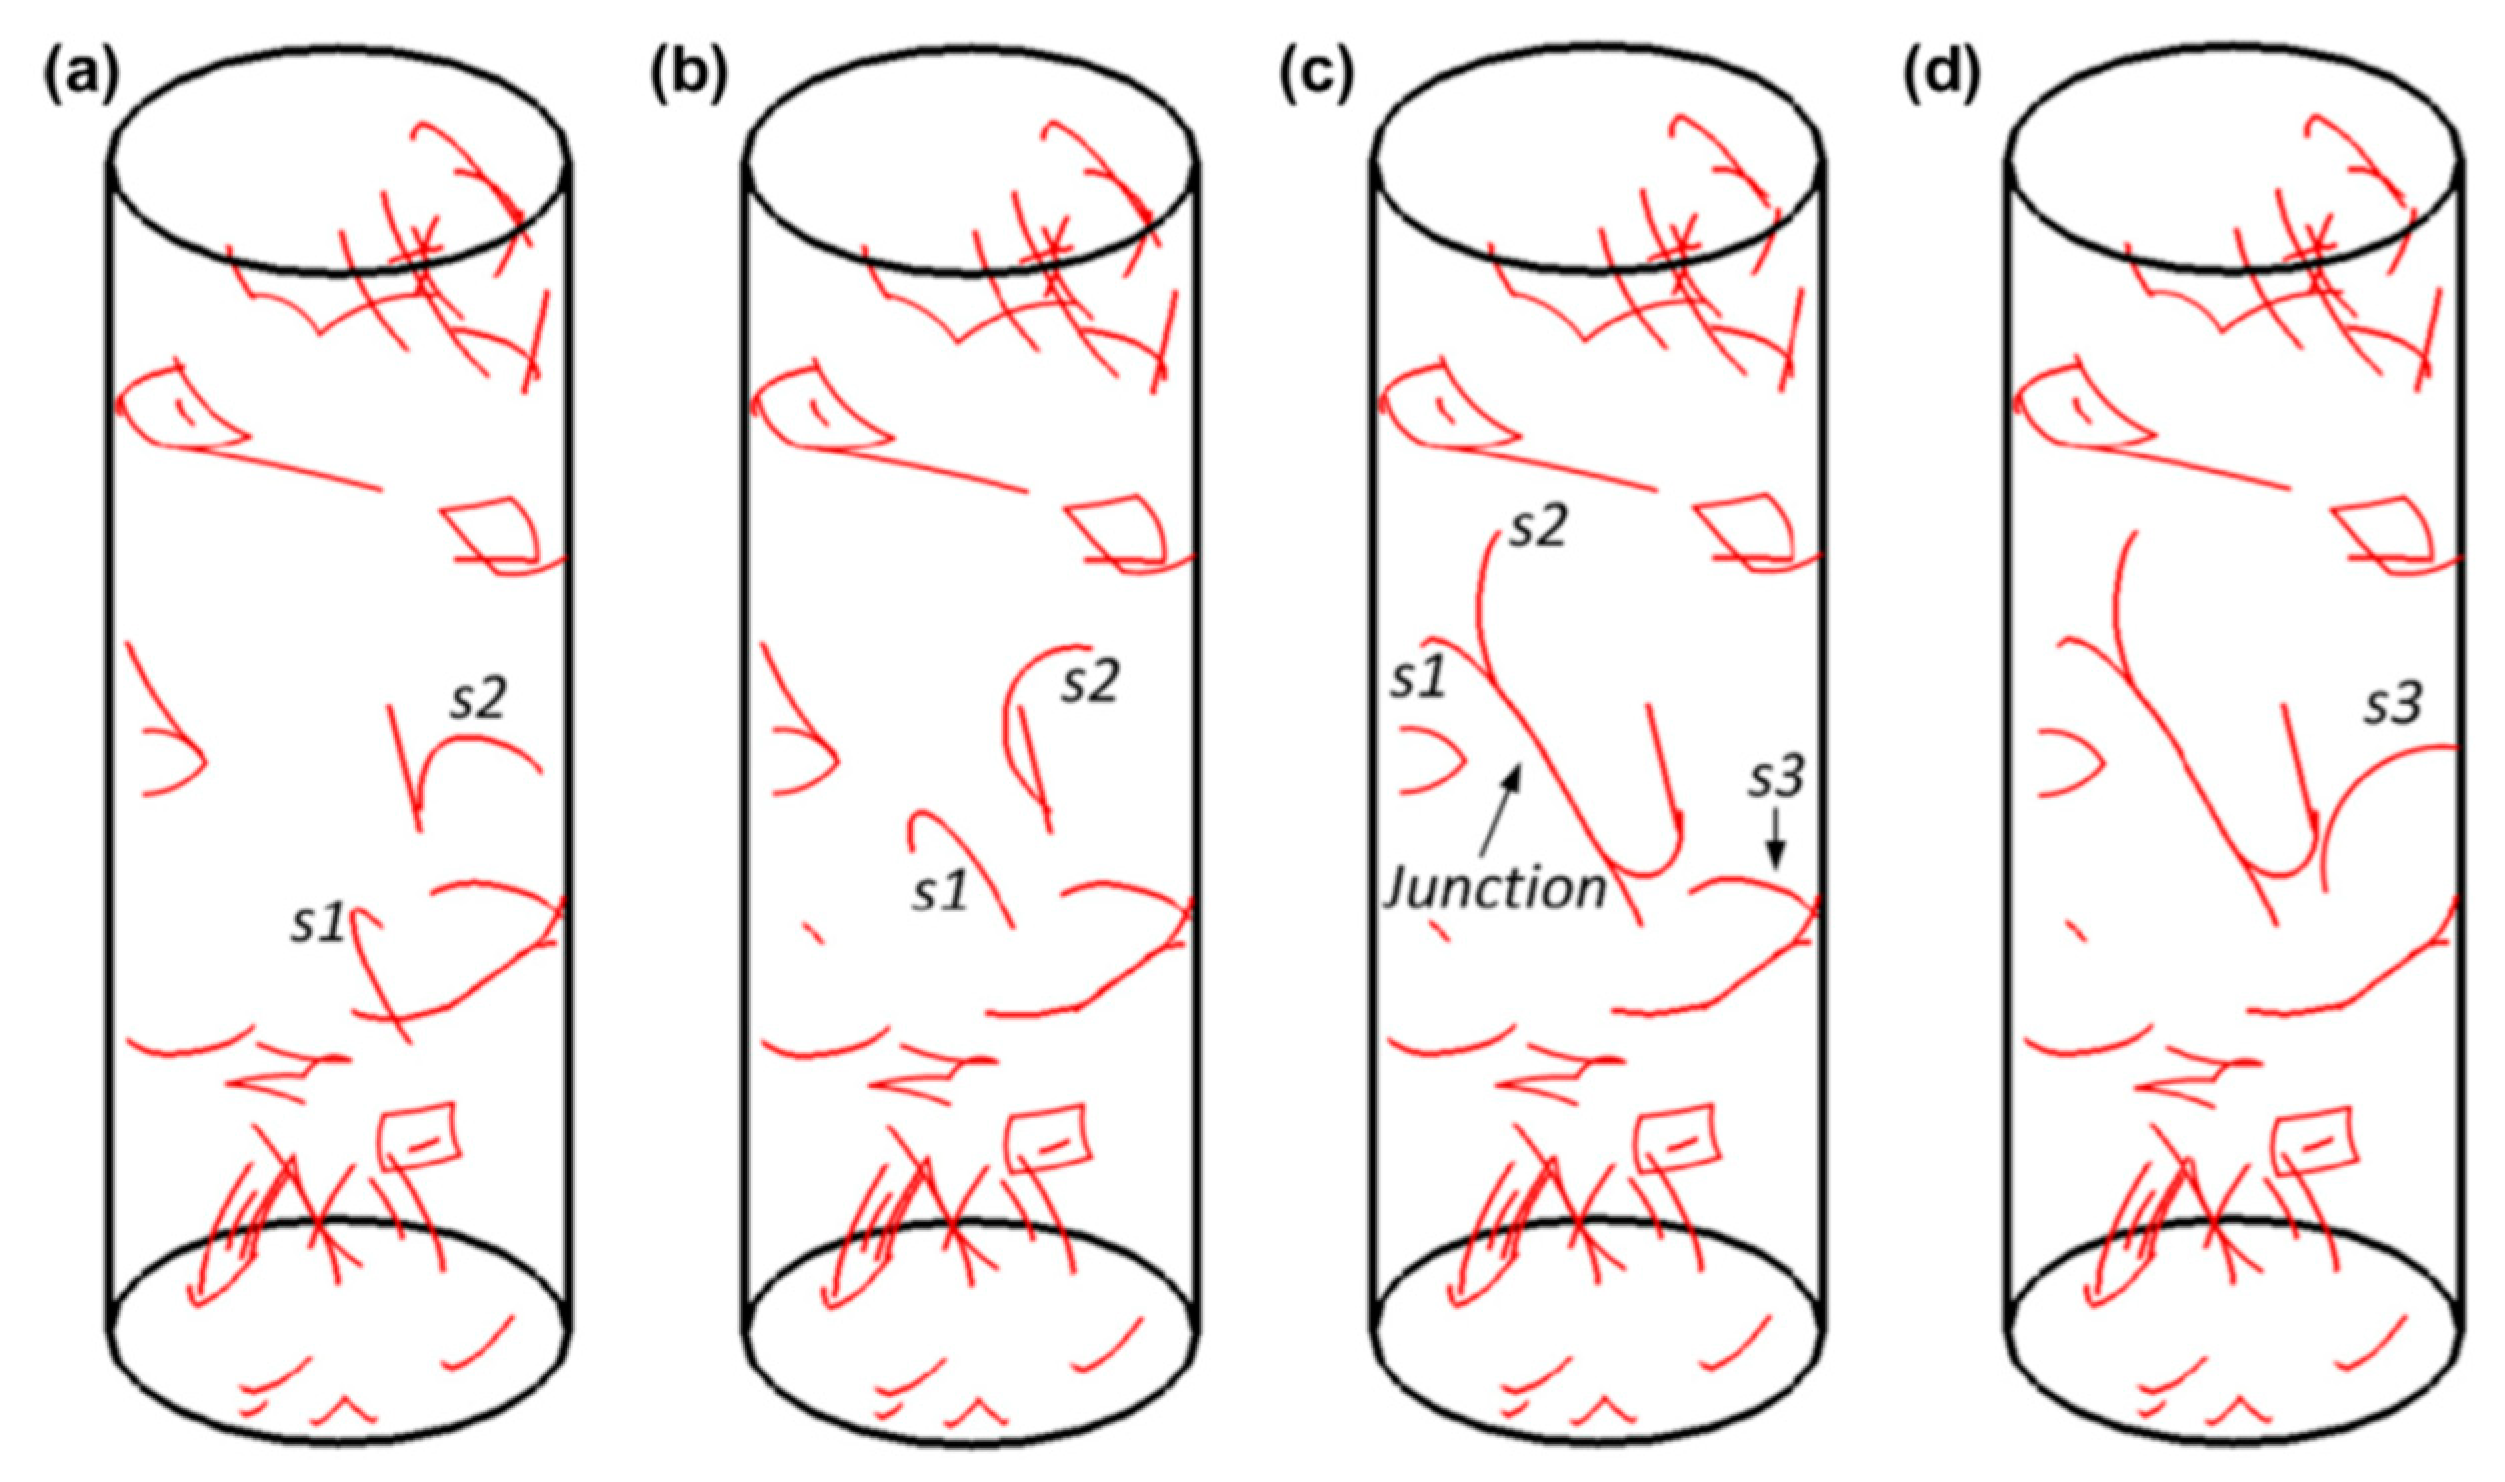
Zhou et al. [55] simulated a pillar with the diameter of 1 μm with the initial realistic dislocation density to model the exhaustion hardening. Figure 9 shows the response of the sample during the compression test. They observed an increase in the sample stress, which is shown in Figure 9 using an arrow. They related this increase in response to the exhaustion hardening. Figure 10 shows the evolution of dislocation network of the sample before, i.e., Figure 10a, and after, i.e., Figure 10d, the hardening. Figure 10 shows that two dislocation sources of S1 and S2 provide the required plastic flow until they interact, get close to each other, and form a junction, as shown in Figure 10b,c. Following that, a new dislocation source needs to be activated to sustain the applied plastic strain, as shown in Figure 10d. This requires higher applied stress, which leads to the observed hardening in Figure 9. This is the so-called exhaustion hardening, as shown by Zhou et al. [55].
3.3. Weakest Link Theory
Norfleet et al. [56] uniaxially compressed Ni pillars with diameters in the range of 1 µm to 20 µm. Moreover, they measured the density of dislocations in both intact and deformed samples. Considering both forest and source truncation hardening terms, they proposed the following equation to capture the size dependency of critical resolved shear stress, ,
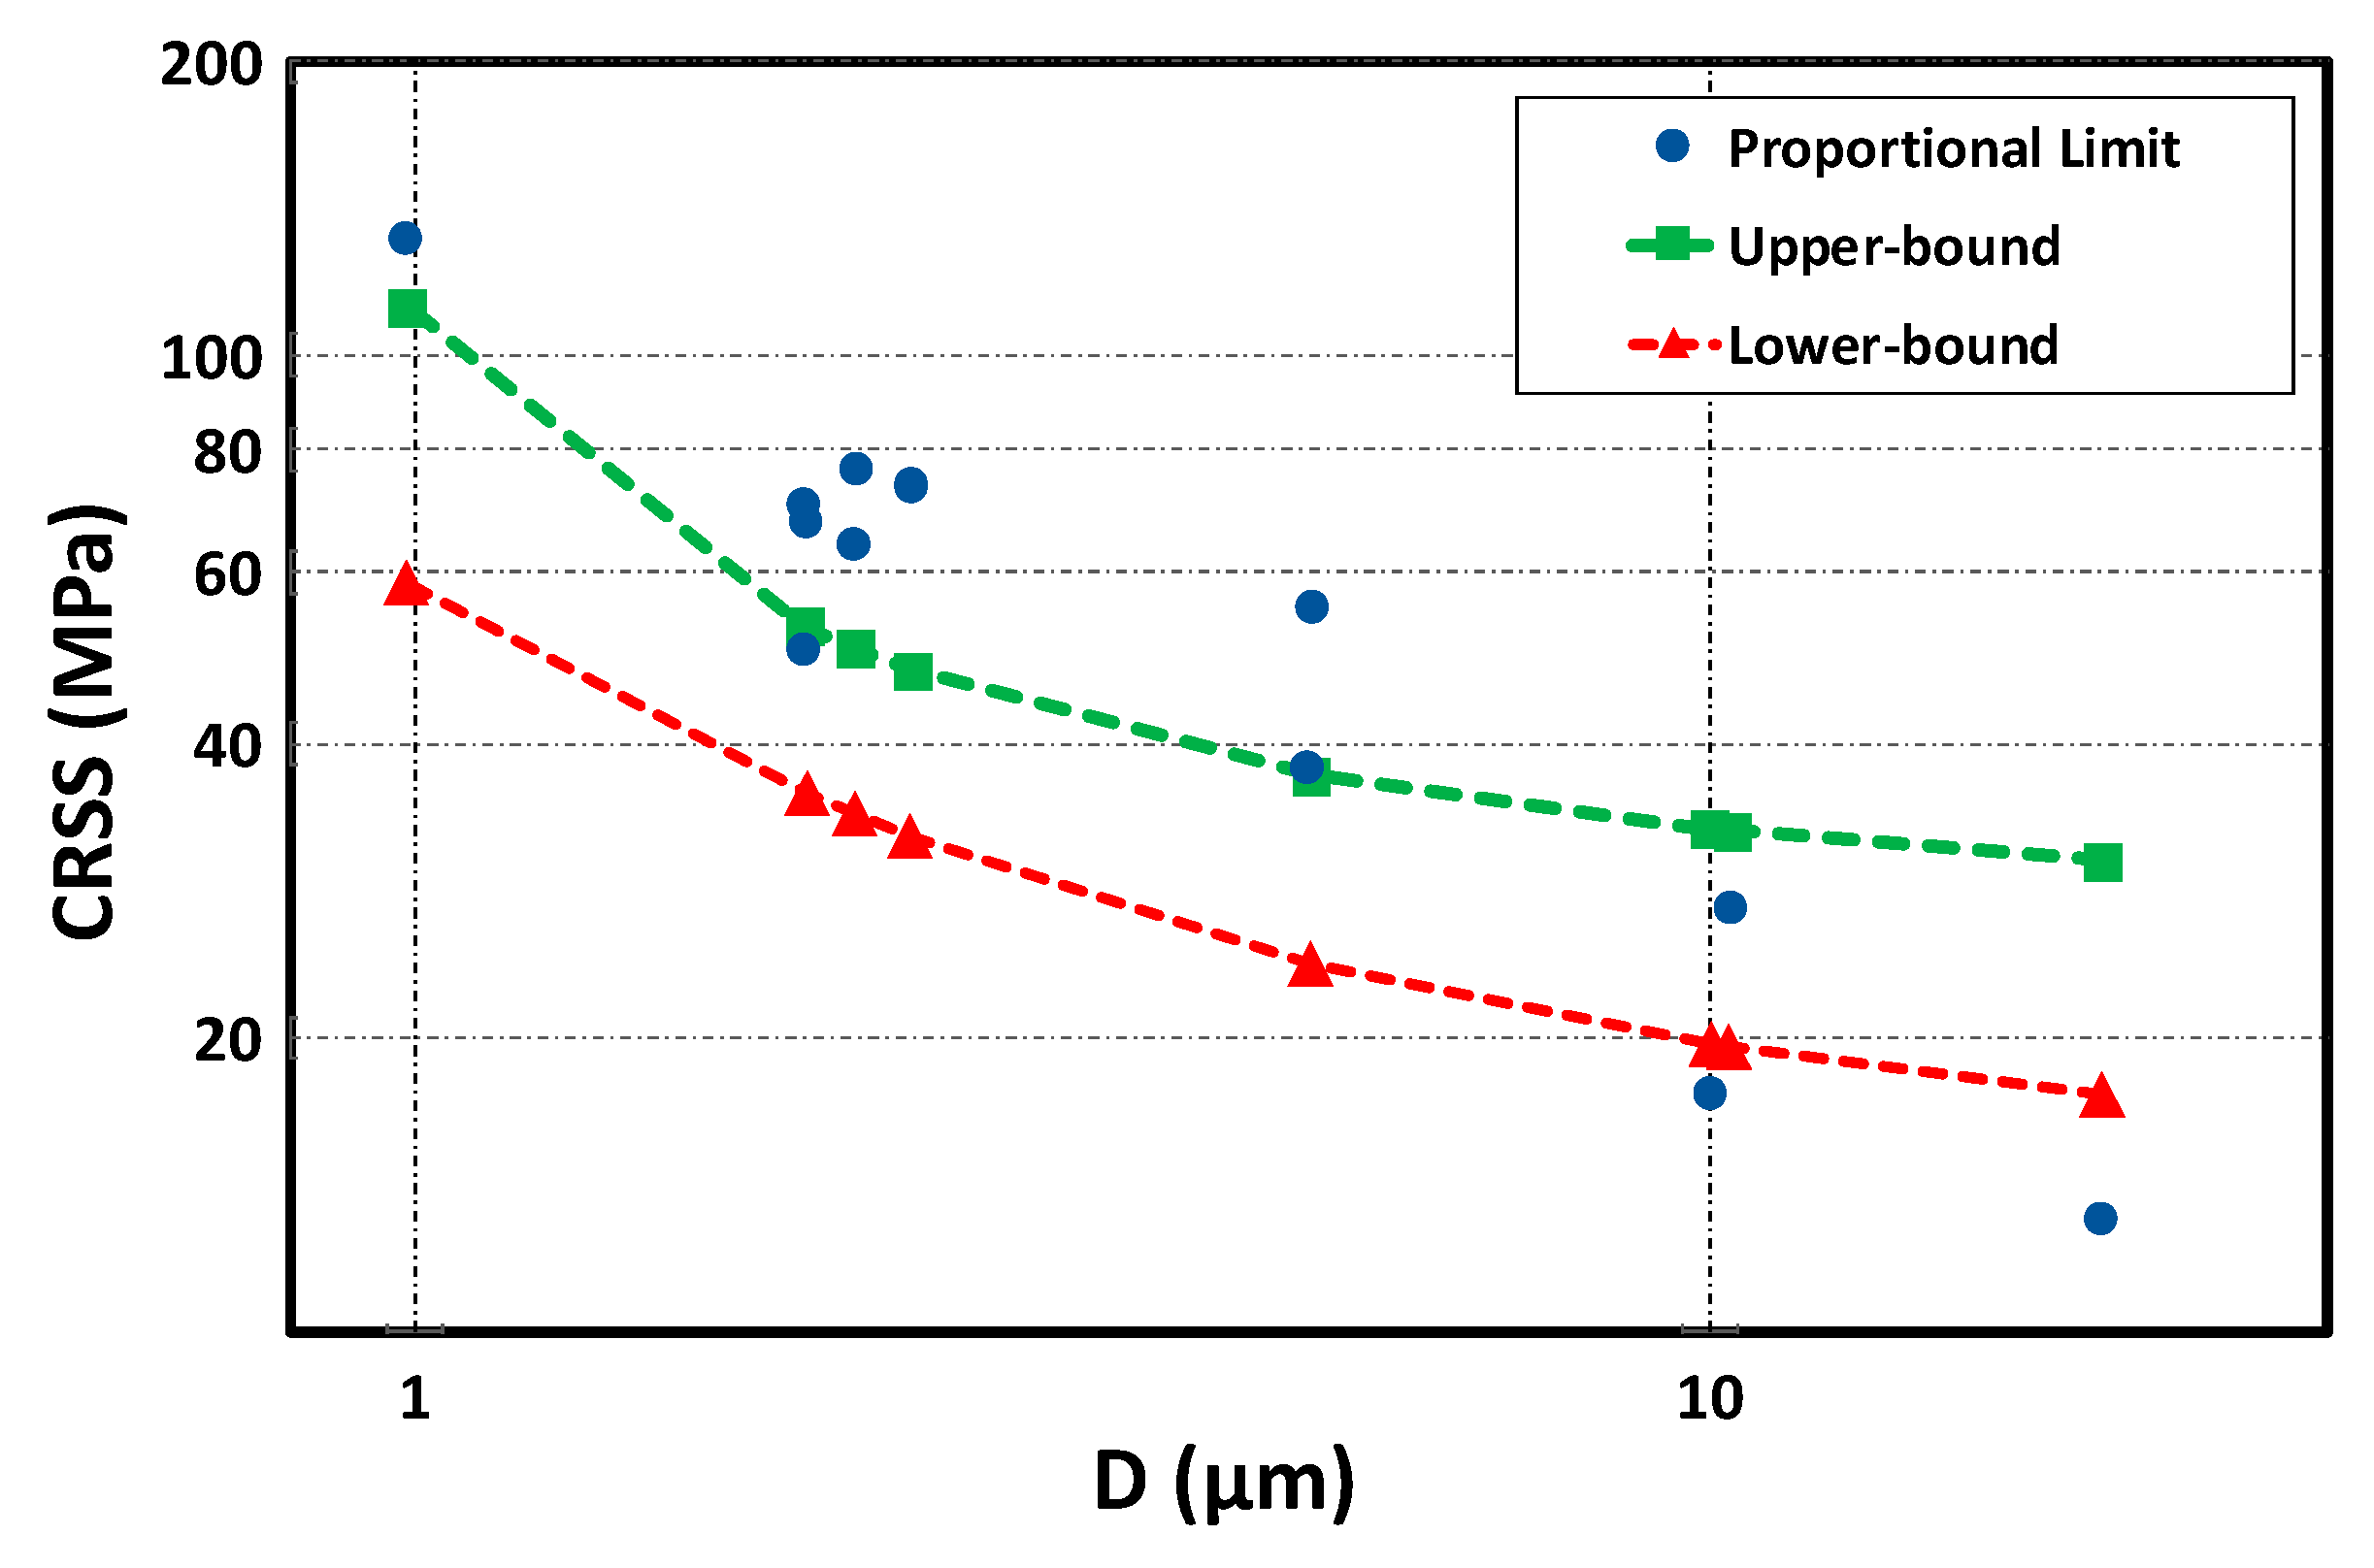
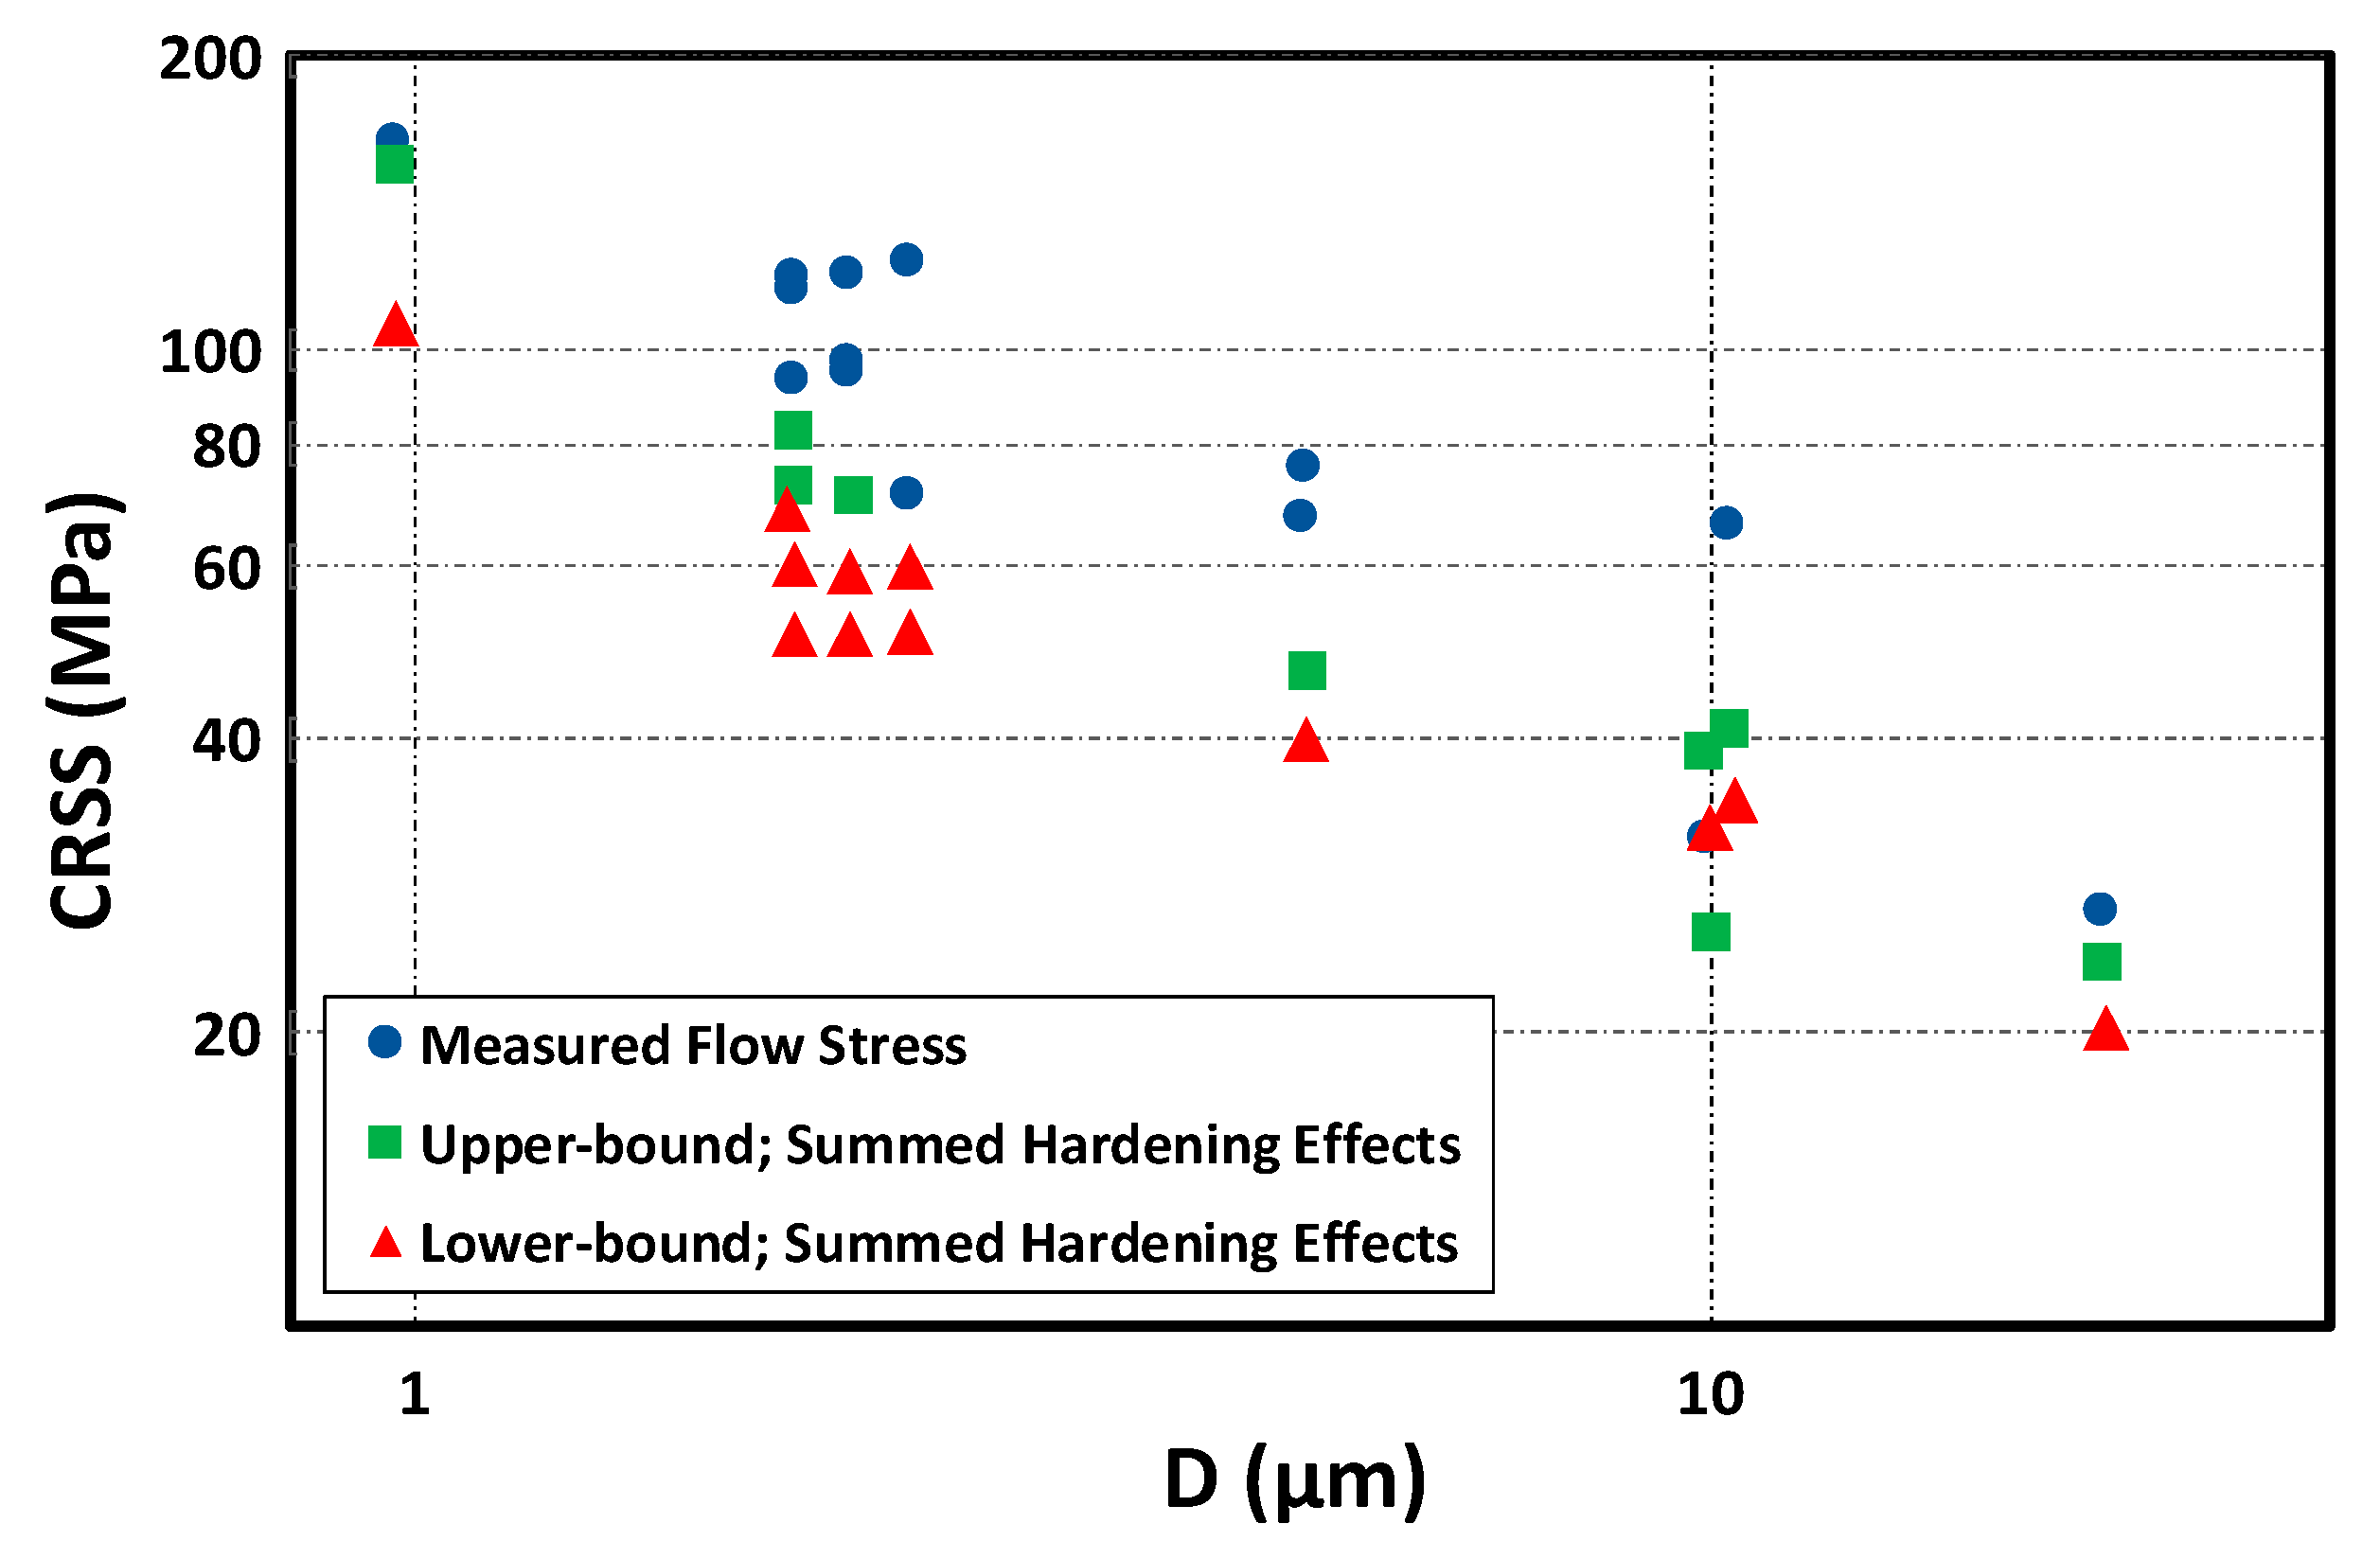
where and are the lattice-friction stress and the source hardening constant, respectively. denotes the average dislocation source length, is the average strength of the forest dislocations, and is the scalar density of the forest dislocations. Since the accurate estimation of depends on sample’s geometry and experienced strain, they used two values of 0.5 and 0.75 corresponding to the lower and upper bounds [56]. The predictions of the model and those of the experiments are presented and compared in Figure 11. As seen, although satisfactory agreements have been achieved for samples with diameter larger than about 5 µm, the model underestimates the experimental results of the smaller pillars. Part of the difference was compensated by introducing the dislocation density correction measured for smaller samples to the term of forest hardening mechanism in Equation (9) (Figure 12). However, the enhanced model also underestimates the flow stress of smaller pillars. This conflict triggered an idea in which there should be other hardening sources that are not accounted for in the primary and enhanced models. Accordingly, Norfleet et al. (2008) tried to bridge the gap by including the effect of the weakest link theory in the model. The weakest link theory states that there is a mean-field limit, , for any crystals, for which the dislocation ensemble of larger samples behave according to the conventional forest hardening mechanism. However, for samples smaller than , the mean effective dislocation source length breaks down due to the new altered distribution of dislocations as the longest dislocation sources, which are the weakest ones, are vanished leading to an enhanced contribution of the forest-hardening mechanism.
4. Atomistic Simulation of Micropillar Compression Tests
Nowadays, using molecular dynamics (MD), the mechanical response and deformation mechanisms of crystalline materials can be studied with full atomistic details. The MD simulation challenge is its limits on the simulation time and length scales. However, developing new efficient parallel algorithms and new strong supercomputers extend these limits. Atomistic simulation has successfully addressed many aspects of the crystalline materials including the role of grain boundary [57], nanoindentation size effects [58,59,60,61], effects of temperature [23], and strain rate effects [16,22,23]. Similarly, in the case of micropillar compression tests, atomistic simulation can be successfully incorporated to shed more light on underlying mechanisms of size effects. More specifically, atomistic simulation can precisely capture the role of free surfaces of pillars, which is a very important feature for modelling the micropillars deformation mechanisms. Other methods such as finite element (FE) and discrete dislocation dynamics (DDD) incorporate ad hoc models to capture the free surfaces. Furthermore, unlike the FE and DDD methods, the atomistic simulation can accurately capture the dislocation cross-slip mechanism. The new atomistic simulations have modeled samples with the length scale of 0.5 μm using powerful supercomputers (see, e.g., [22,23]), and the sizes of the simulated pillars are getting close to the experimental samples. However, the time scale limit is still not solved and the simulations cannot model the quasi-static experiments. Consequently, the atomistic simulations are mainly in the region of high rate deformations.
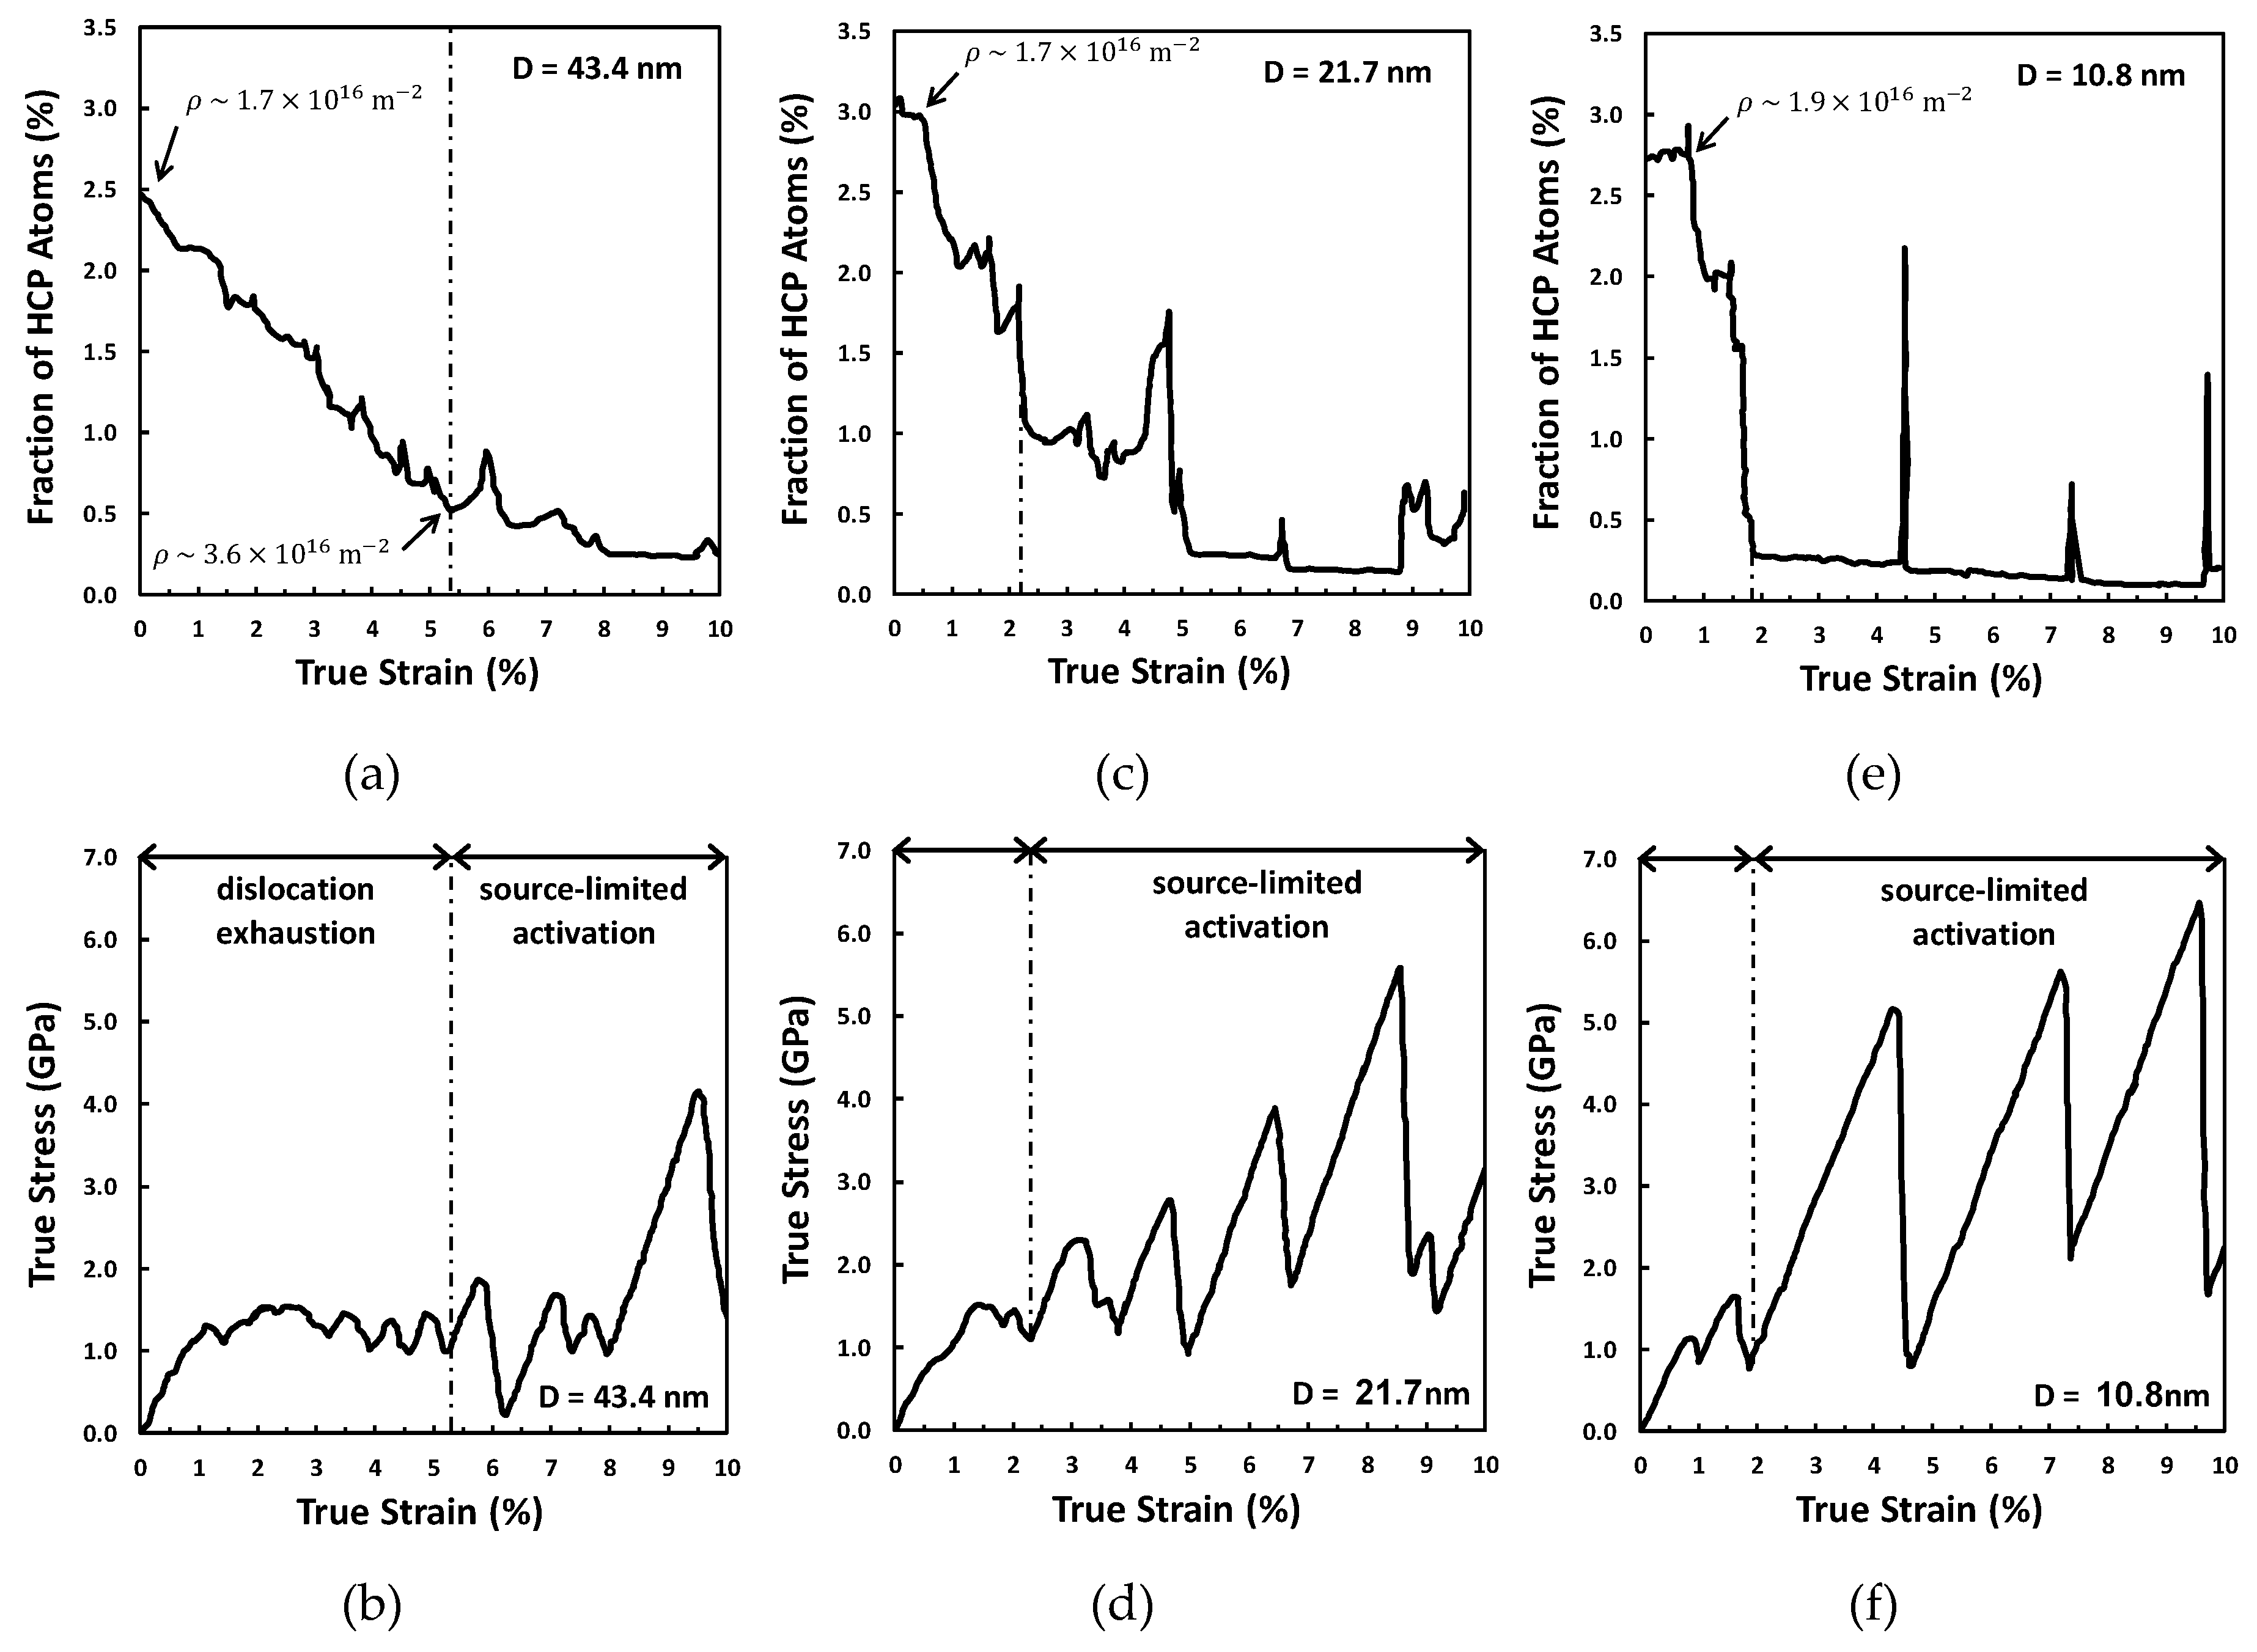
Bringa et al. [12] incorporated the atomistic simulation of large copper pillars consisting of 352 million atoms to investigate the response and governing mechanisms of deformation during high rate compression test. Diao et al. [13] investigated the effects of gold nanowire size on its yield strength using atomistic simulation. They reported the surface stress governs the nanowires strength in the region of nanowires with very small diameters. In the case of BCC metals, Weinberger and Cai [17] used the atomistic simulation and showed that the dislocation multiplication mechanism depends on the crystal structure by comparing the response of BCC Molybdenum pillar against the gold pillars during the uniaxial compression. They observed that a single dislocation multiplies itself repeatedly in BCC samples, which does not occur in FCC samples. Sansoz [14] conducted one of the most comprehensive MD studies of size effects during micropillar compression test. Sansoz [14] generated copper pillars with diameter range of 10.8 nm–72.3 nm. Instead of simulating the defect free pillars, Sansoz [14] used the high-temperature annealing and quenching technique to generate samples with physical initial dislocation density. Figure 13 shows the responses of three pillars with the diameters of D = 10.8 nm, 21.7 nm, and 43.4 nm. Evolution of dislocation density is represented by a fraction of HCP atoms. The results showed that, in the range of simulated samples, independent of pillar diameter, both dislocation exhaustion and source-limited activation mechanisms play a role in the observed size effects. However, the strain at which the transition from dislocation exhaustion to source-limited activations occurs depends on the pillar diameter. In other words, as the pillar diameter increases, the transition occurs at larger strains.
Weinberger et al. [18] used the transition state theory and excluded the effects of high strain rates from the MD results. They simulated pillars with different cross-section geometries and studied the dislocation nucleation stress and failure mechanisms. Weinberger and Tucker [19] investigated the stability of a single arm source in copper nanopillars with two diameters of 32 nm and 50 nm using the MD simulation. They focused on Lomer–Cottrell dislocations as pinning points. They observed that the dislocation arm is not stable enough to create static pinning points. Consequently, they created artificial pining points to study the size effects in pillars with a stable dislocation arm source. They observed typical size effects of smaller is stronger. Tucker et al. [15] investigated the grain boundary (GB) effects on the response of aluminum bicrystalline nanowires during uniaxial compression using MD simulation. They showed that the GB can act as a dislocation nucleation source. Xu et al. [20] used the MD simulation to study the effects of crystallographic orientation in aluminum pillars during the compression test.
Yaghoobi and Voyiadjis [21] conducted a very extensive MD study on the size effects mechanisms of FCC pillars during the high rate compression for a wide range of Ni pillar diameter. They used the parallel code LAMMPS [62] for the MD simulation of micropillar compression test. The Ni–Ni atomic interaction is modeled using the embedded-atom method (EAM) potential developed by Mishin et al. [63]. In order to study the size effects, first, Yaghoobi and Voyiadjis [21] modeled pillars with a height of H = 45 nm and different diameters of D = 22.5 nm, 45 nm, 90 nm, and 135 nm were simulated. In the next step, two pillar diameters of D = 22.5 nm and 135 nm with different heights of H = 30 nm, 45 nm, and 75 nm were simulated. In the last step, Yaghoobi and Voyiadjis [21] simulated a very large sample with the height of 0.3 μm and diameter of 0.15 μm consisting around 487 million atoms. The pillars are circular cross sections with the axis along direction.
The pillar boundary conditions are very critical to precisely mimic the micropillar compression experiment. Yaghoobi and Voyiadjis [21] set the boundary conditions at the surroundings free surfaces. Among different scenarios applicable to model the boundary conditions along the loading direction, Yaghoobi and Voyiadjis [21] stated that the variation of dislocation content should be accurately accounted for during the atomistic simulation. Accordingly, they set free the top and bottom surfaces to allow dislocations to freely leave the sample. A prescribed potential wall is used to model the substrate. A large flat indenter is then used for applying the uniaxial compression, which is modeled using a repulsive potential. The strain rate of the simulation is . The interaction between the substrate and Ni atoms is modeled using the Lennard–Jones (LJ) potential. The equations of motions are numerically integrated using the velocity Verlet algorithm. The NVT ensemble is used to model the uniaxial compression experiment. As the precise cross section is required for the correct assessment of true stress, Yaghoobi and Voyiadjis [21] used the triangulation method to calculate the contact area. Both initially defect free and pre-strained pillars were simulated to address the effect of sample initial condition on the response of the pillar during the compression test. The dislocation structures are extracted at each step utilizing the Crystal Analysis Tool developed by Stukowski and his co-workers [64,65,66]. The post-processing of dislocation network and corresponding information are performed using the software OVITO [67] and Paraview [68].
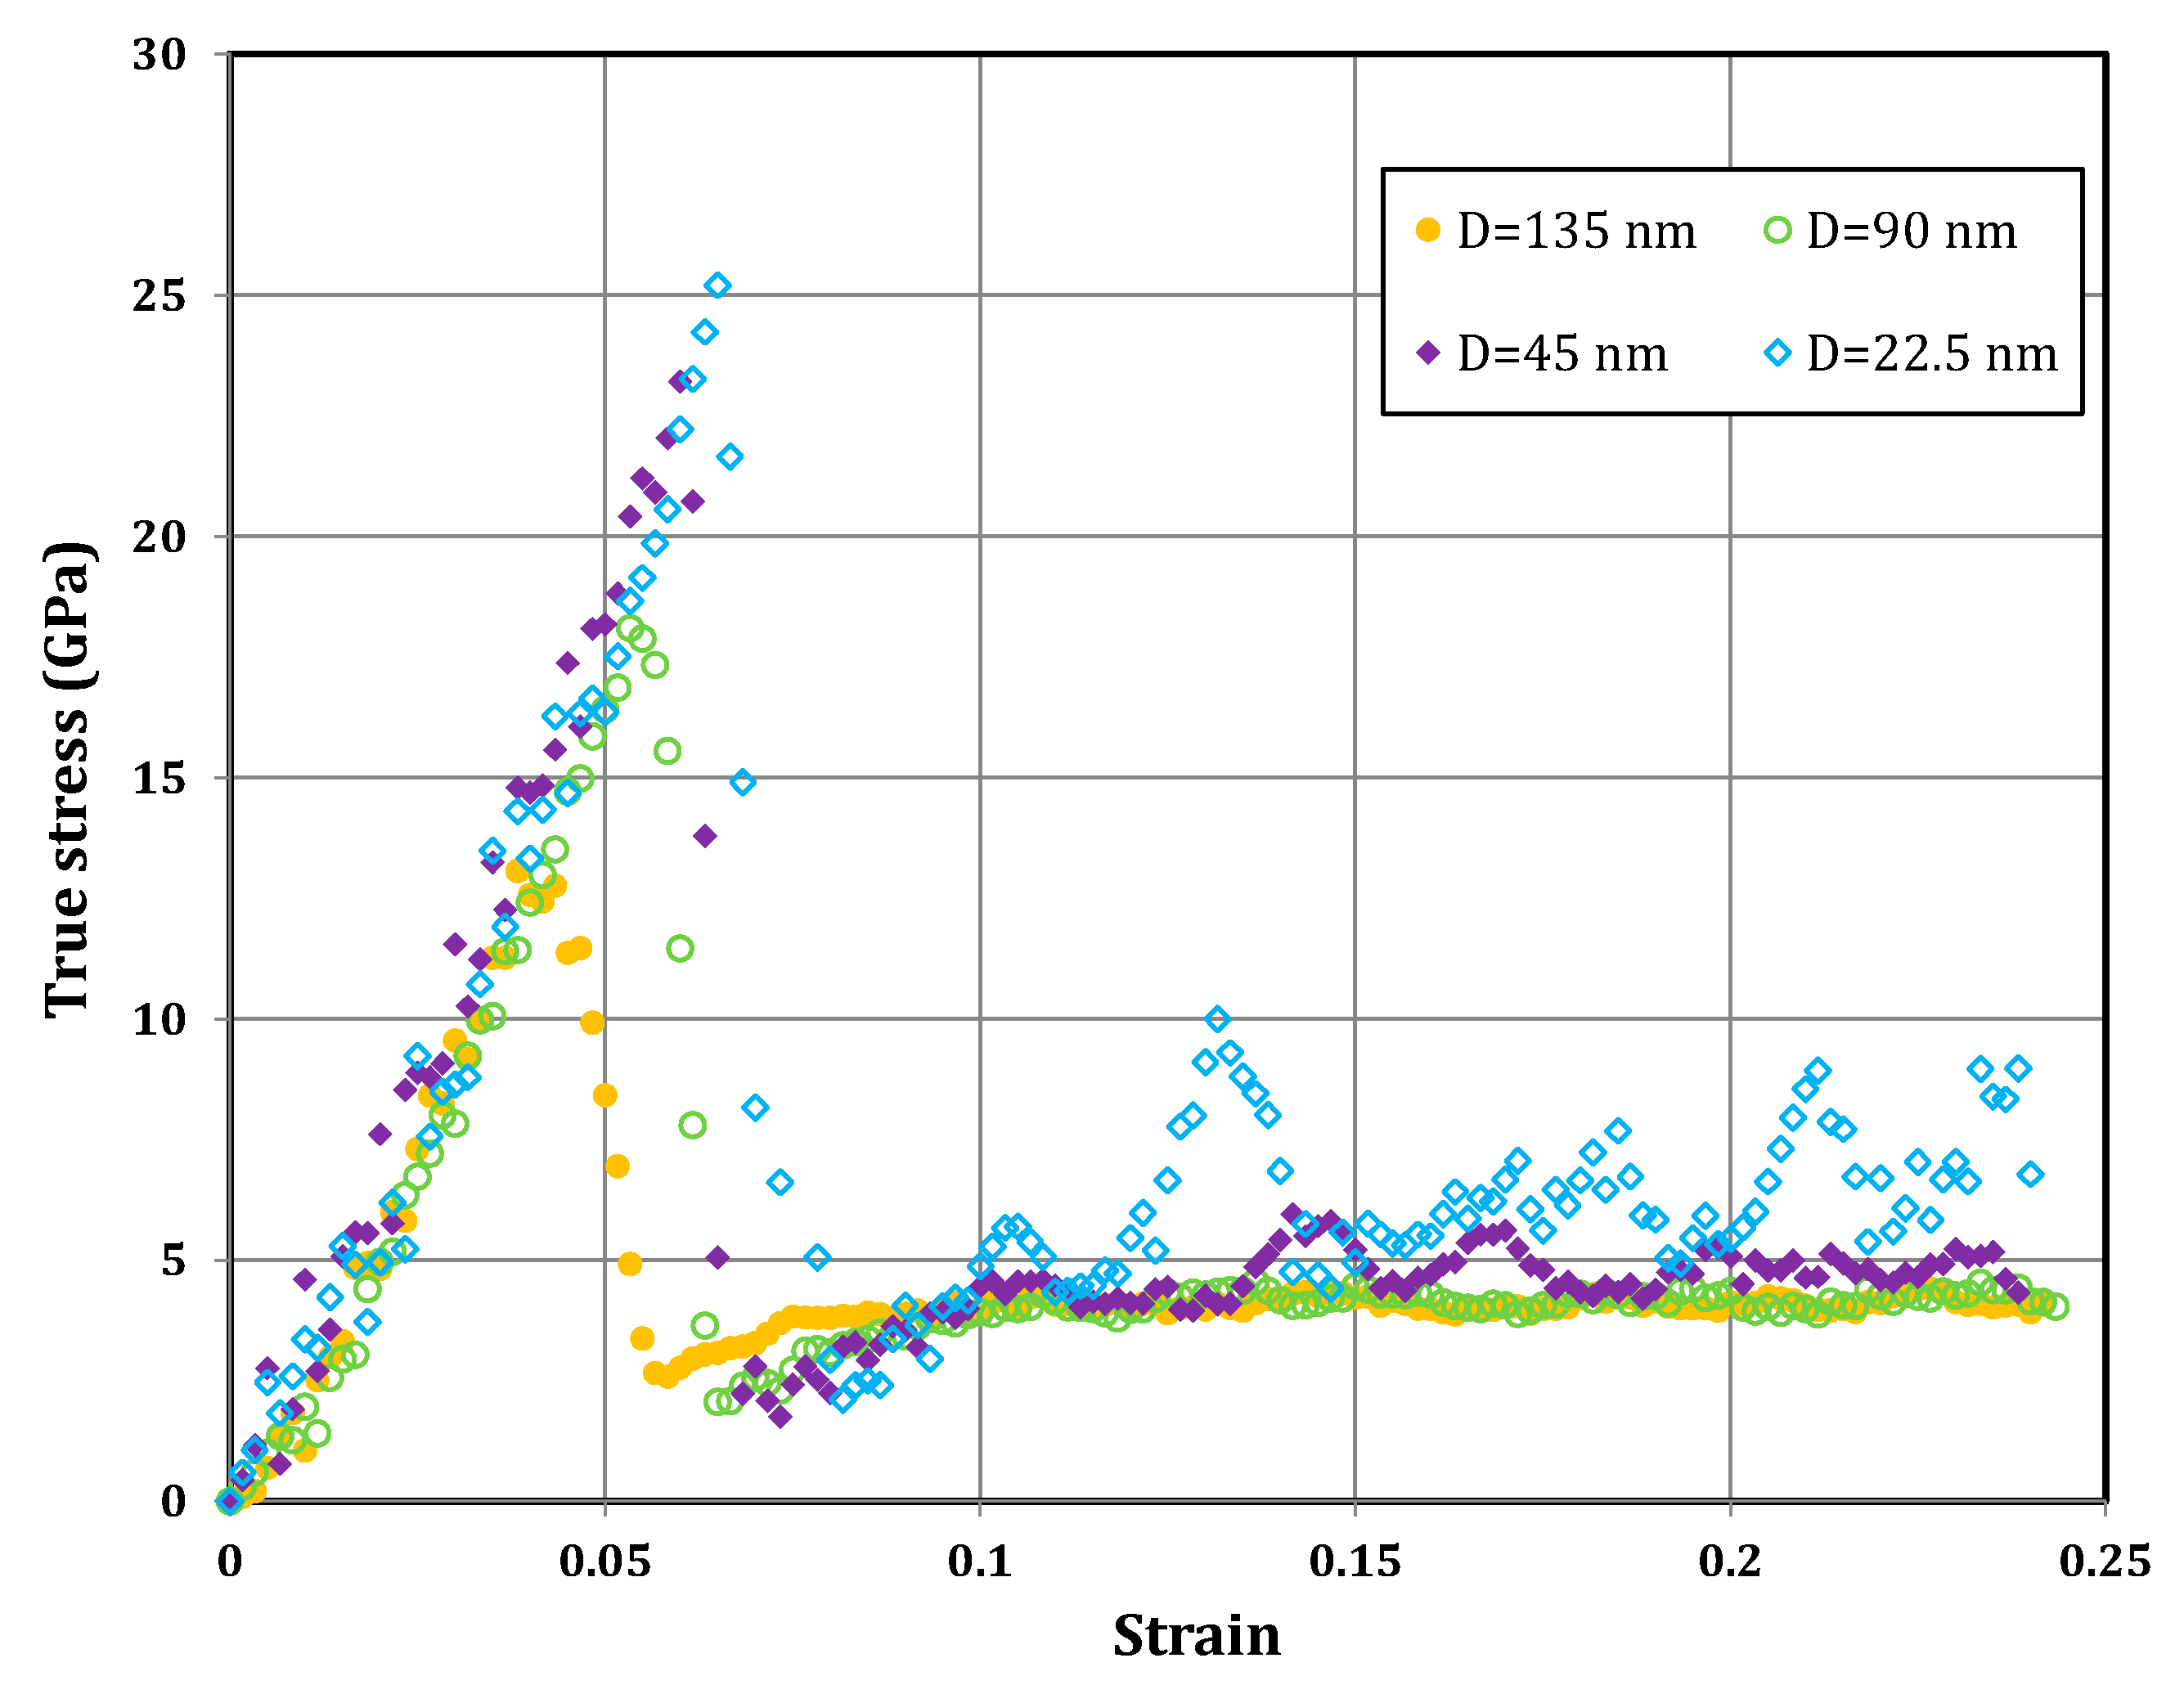
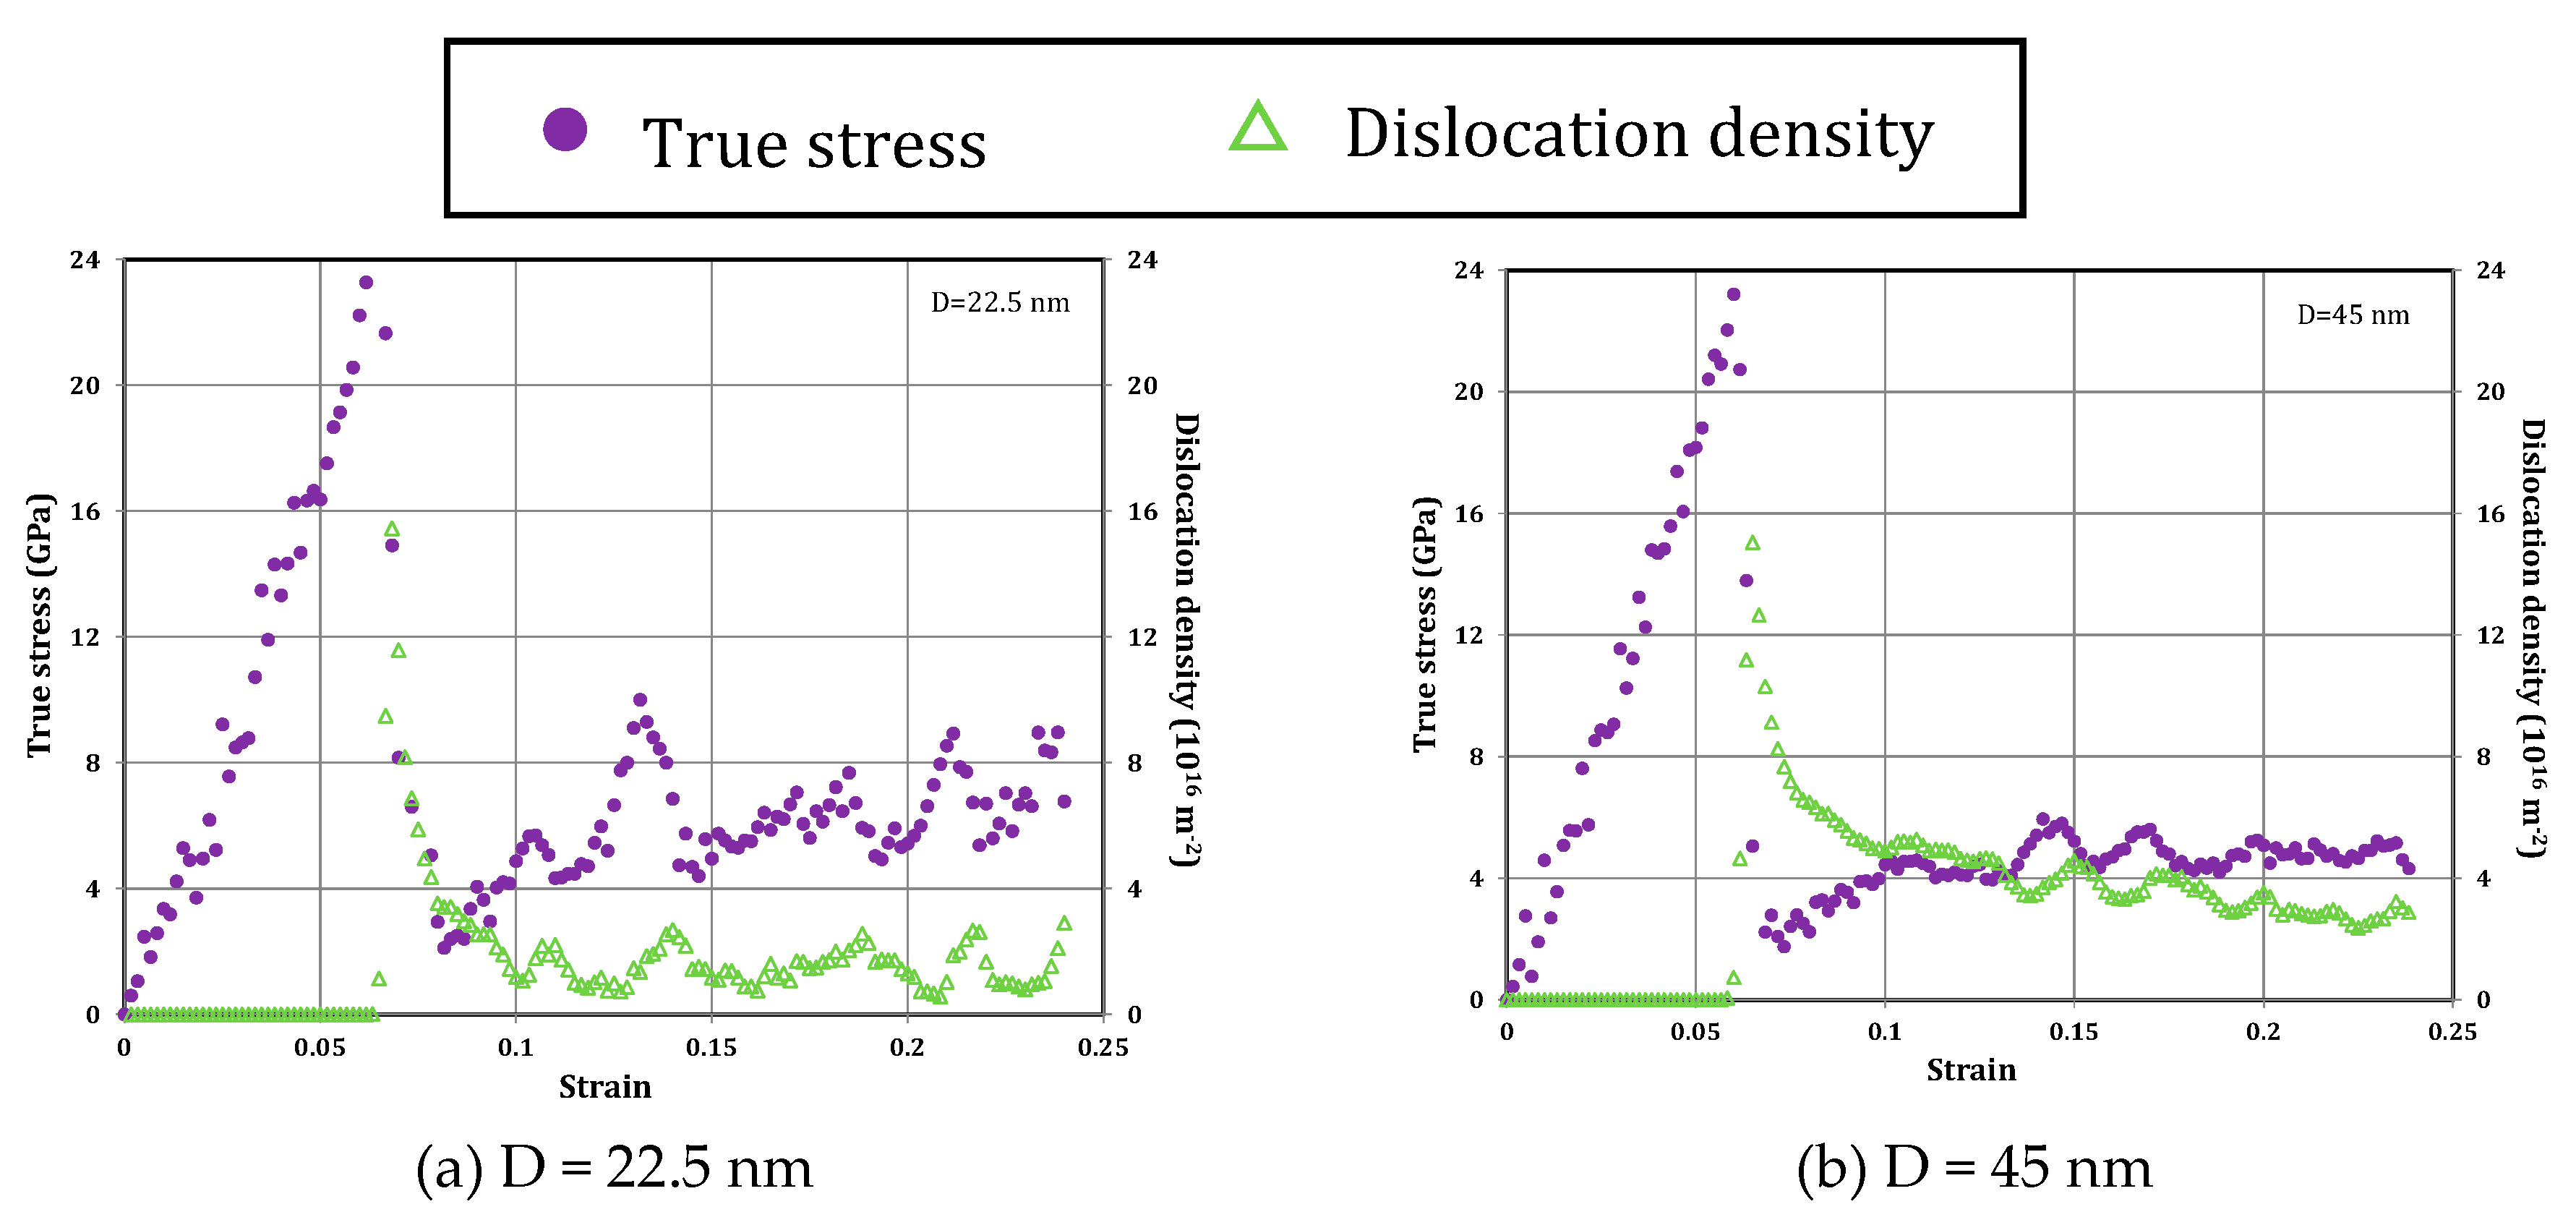
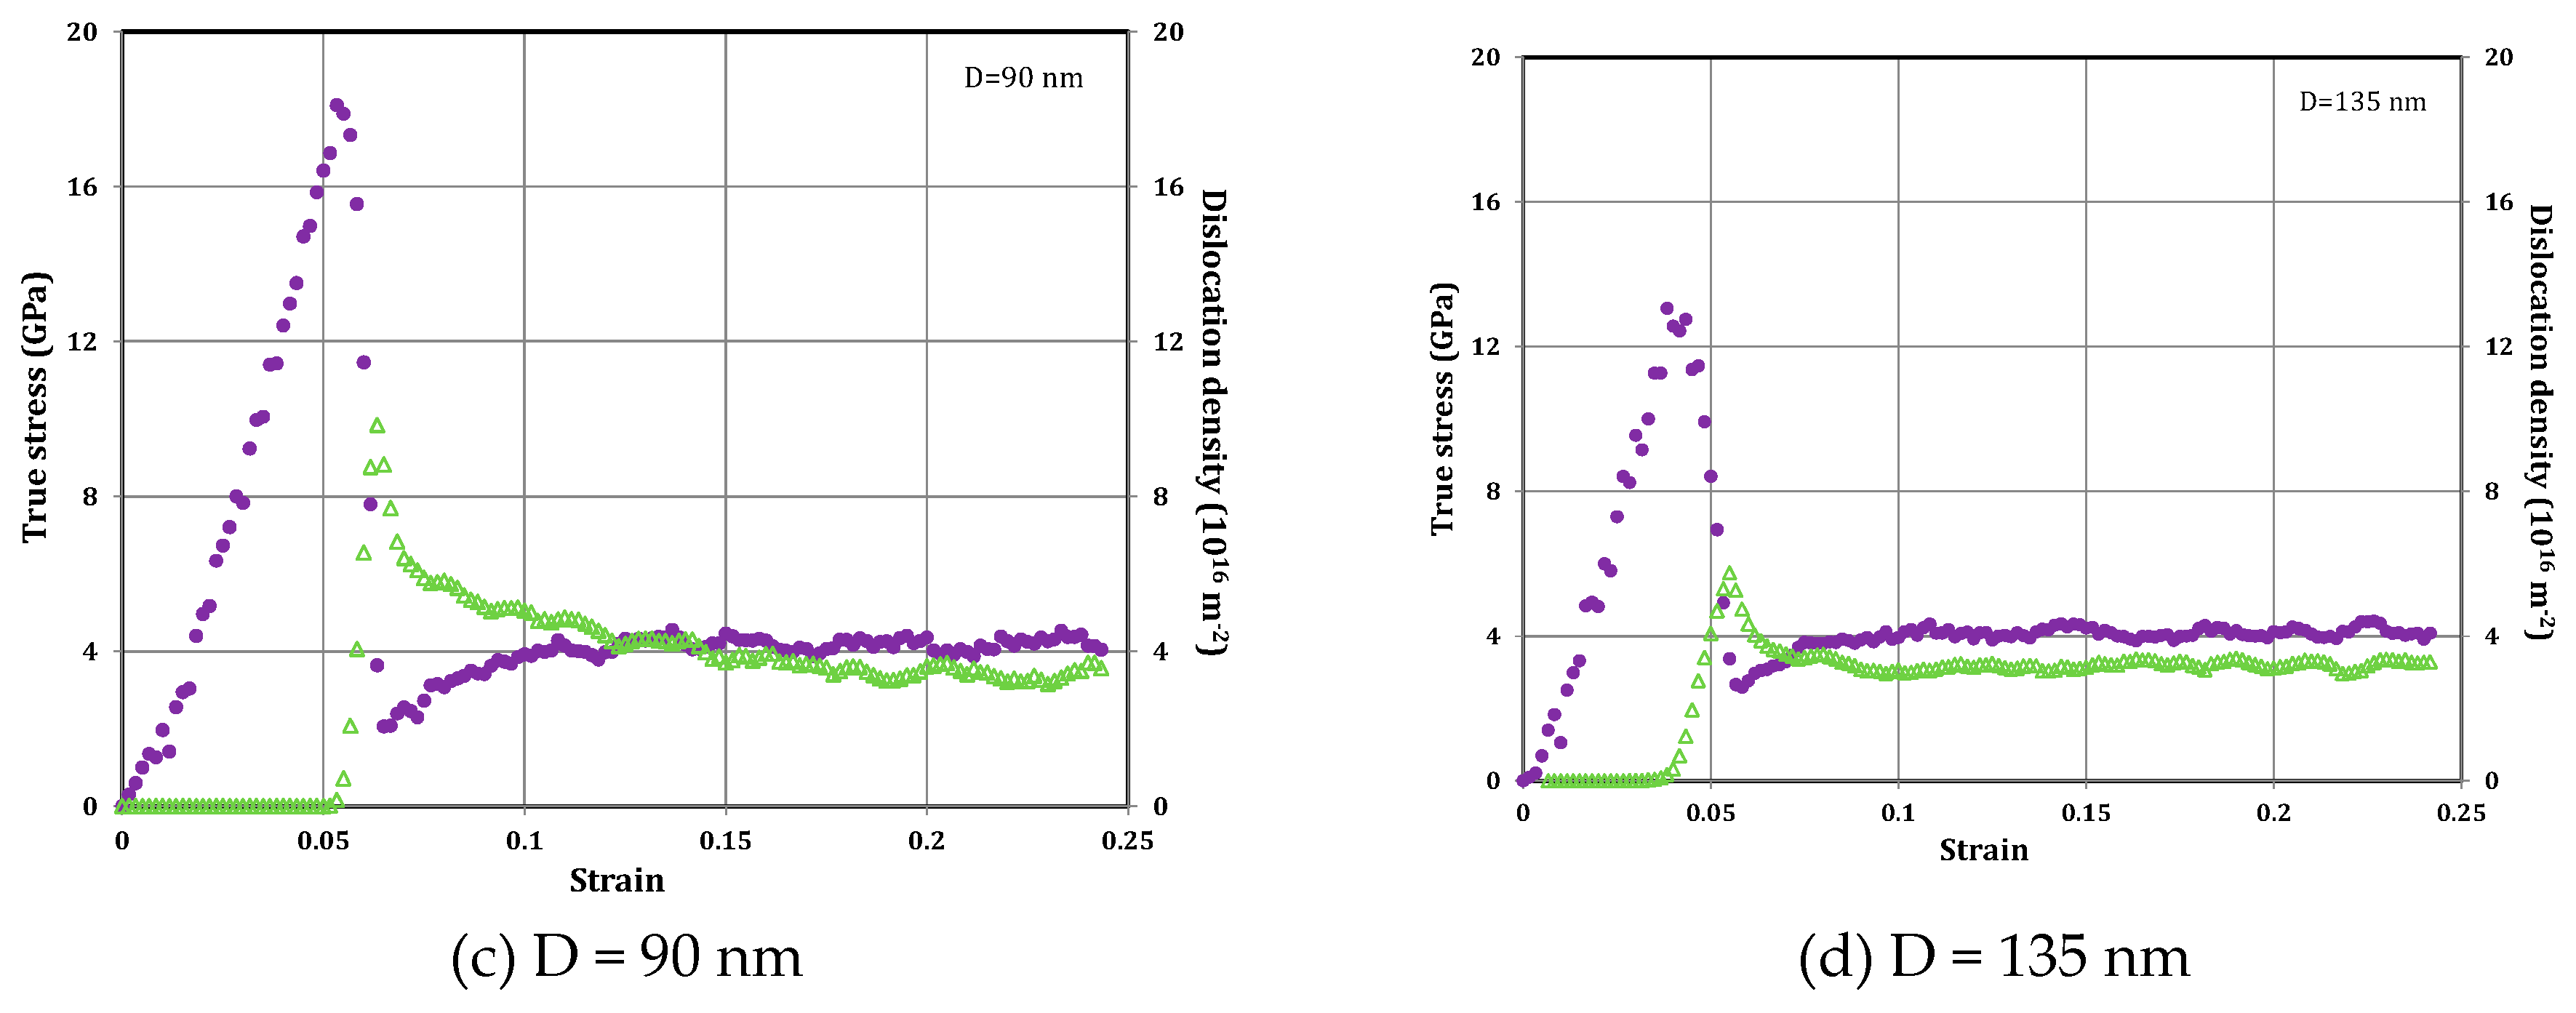
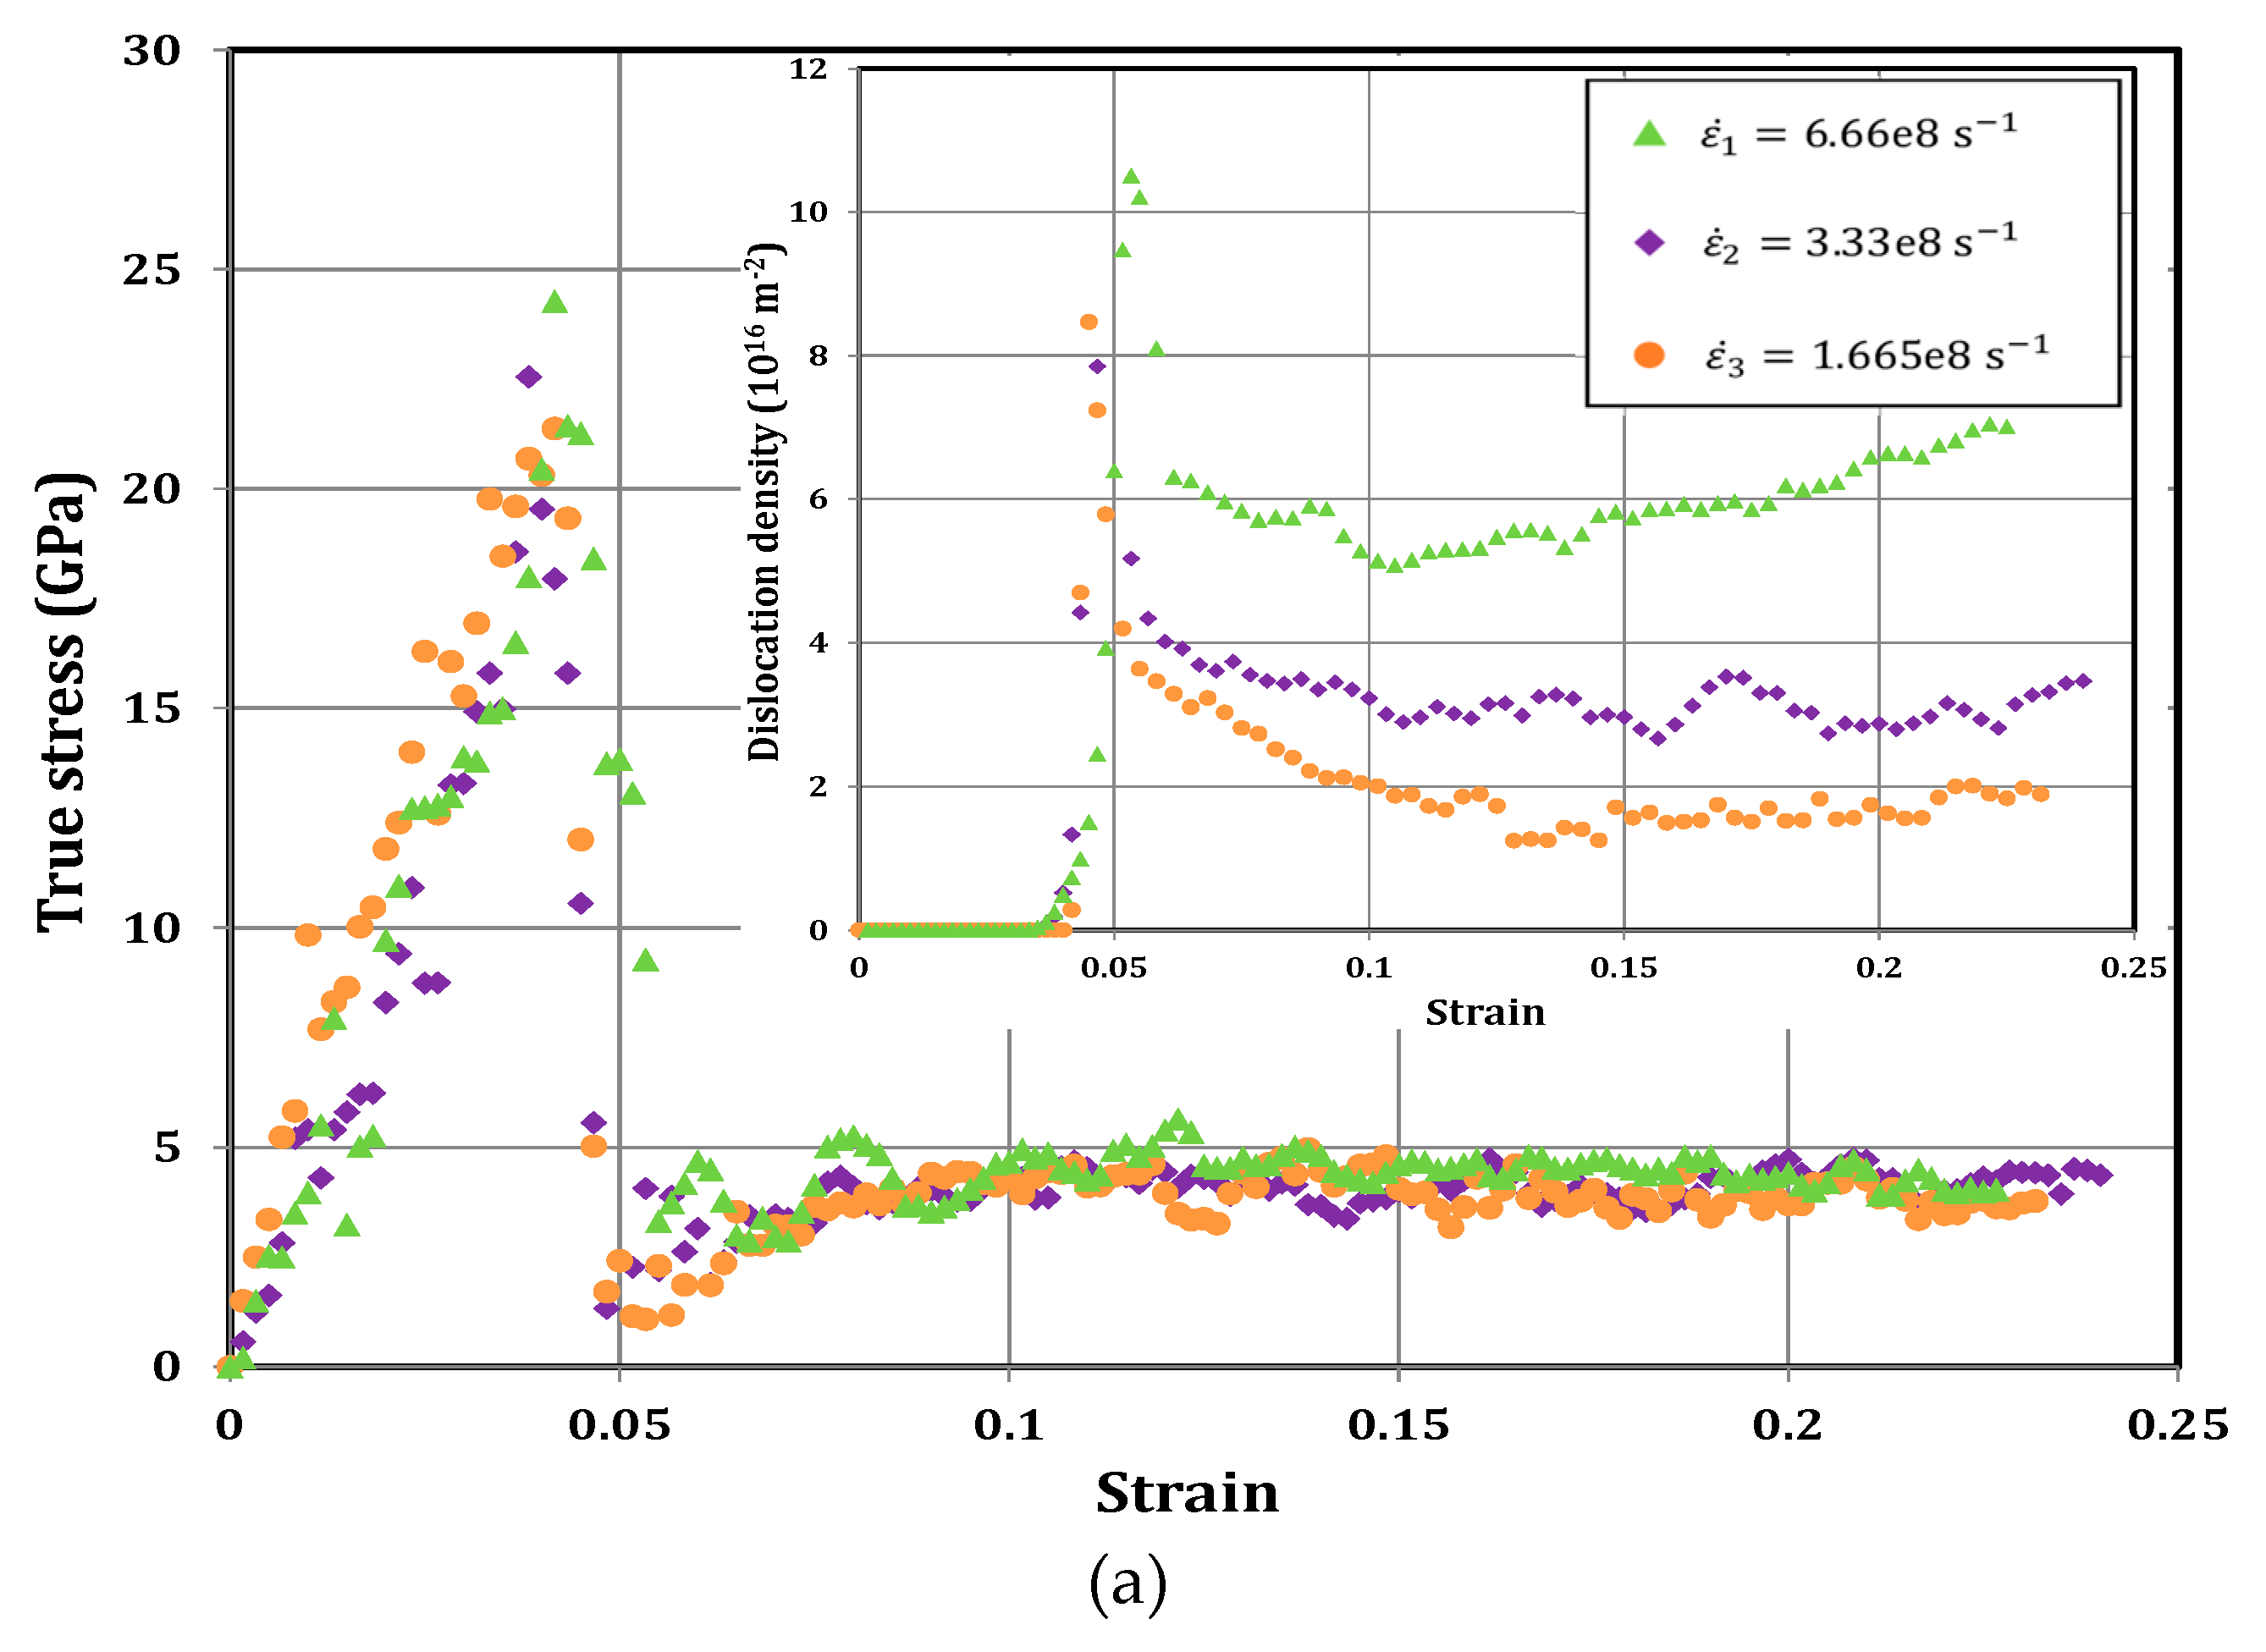
Figure 14 presents the variation of true stress versus the strain for 45 nm long pillars with diameters of D = 22.5 nm, 45 nm, 90 nm, and 135 nm. As described in Yaghoobi and Voyiadjis [21], the stress after initial dislocation nucleation is considered to study the size effects. The results show that, for pillars with diameters smaller than 90 nm, the smaller diameter is stronger. There are no size effects for pillars with diameters larger than 90 nm. In order to unravel the underlying size effects mechanisms, the variation of dislocation content is shown in Figure 15. Figure 15a shows that the source-limited activation governs the size effects for pillar with a diameter of 22.5 nm. In this case, the mobile dislocations are driven out of the sample during the loading, which locally increases the stress until another dislocation nucleation and evolution occurs leading to a stress relaxation. Figure 15b shows that the exhaustion hardening mechanism governs the size effects in the pillar with D = 45 nm. In this case, as the dislocation density decreases, the stress increases. Some small local jumps are observed in true stress, which occur because some dislocations leave the pillar from the free surfaces. However, the peaks of these local changes are smaller than those observed in the pillar with the diameter of D = 22.5 nm. The pillars with the diameters of 90 nm and 135 nm show almost the same response after the initial dislocation nucleation, as shown in Figure 15c,d. This is in contrast with the experimental results of size effects for this range of pillar diameters, which shows strong size effects for this region. It is due to the fact that the strain rate of MD simulation is several orders of magnitude larger than the quasi-static experiments.
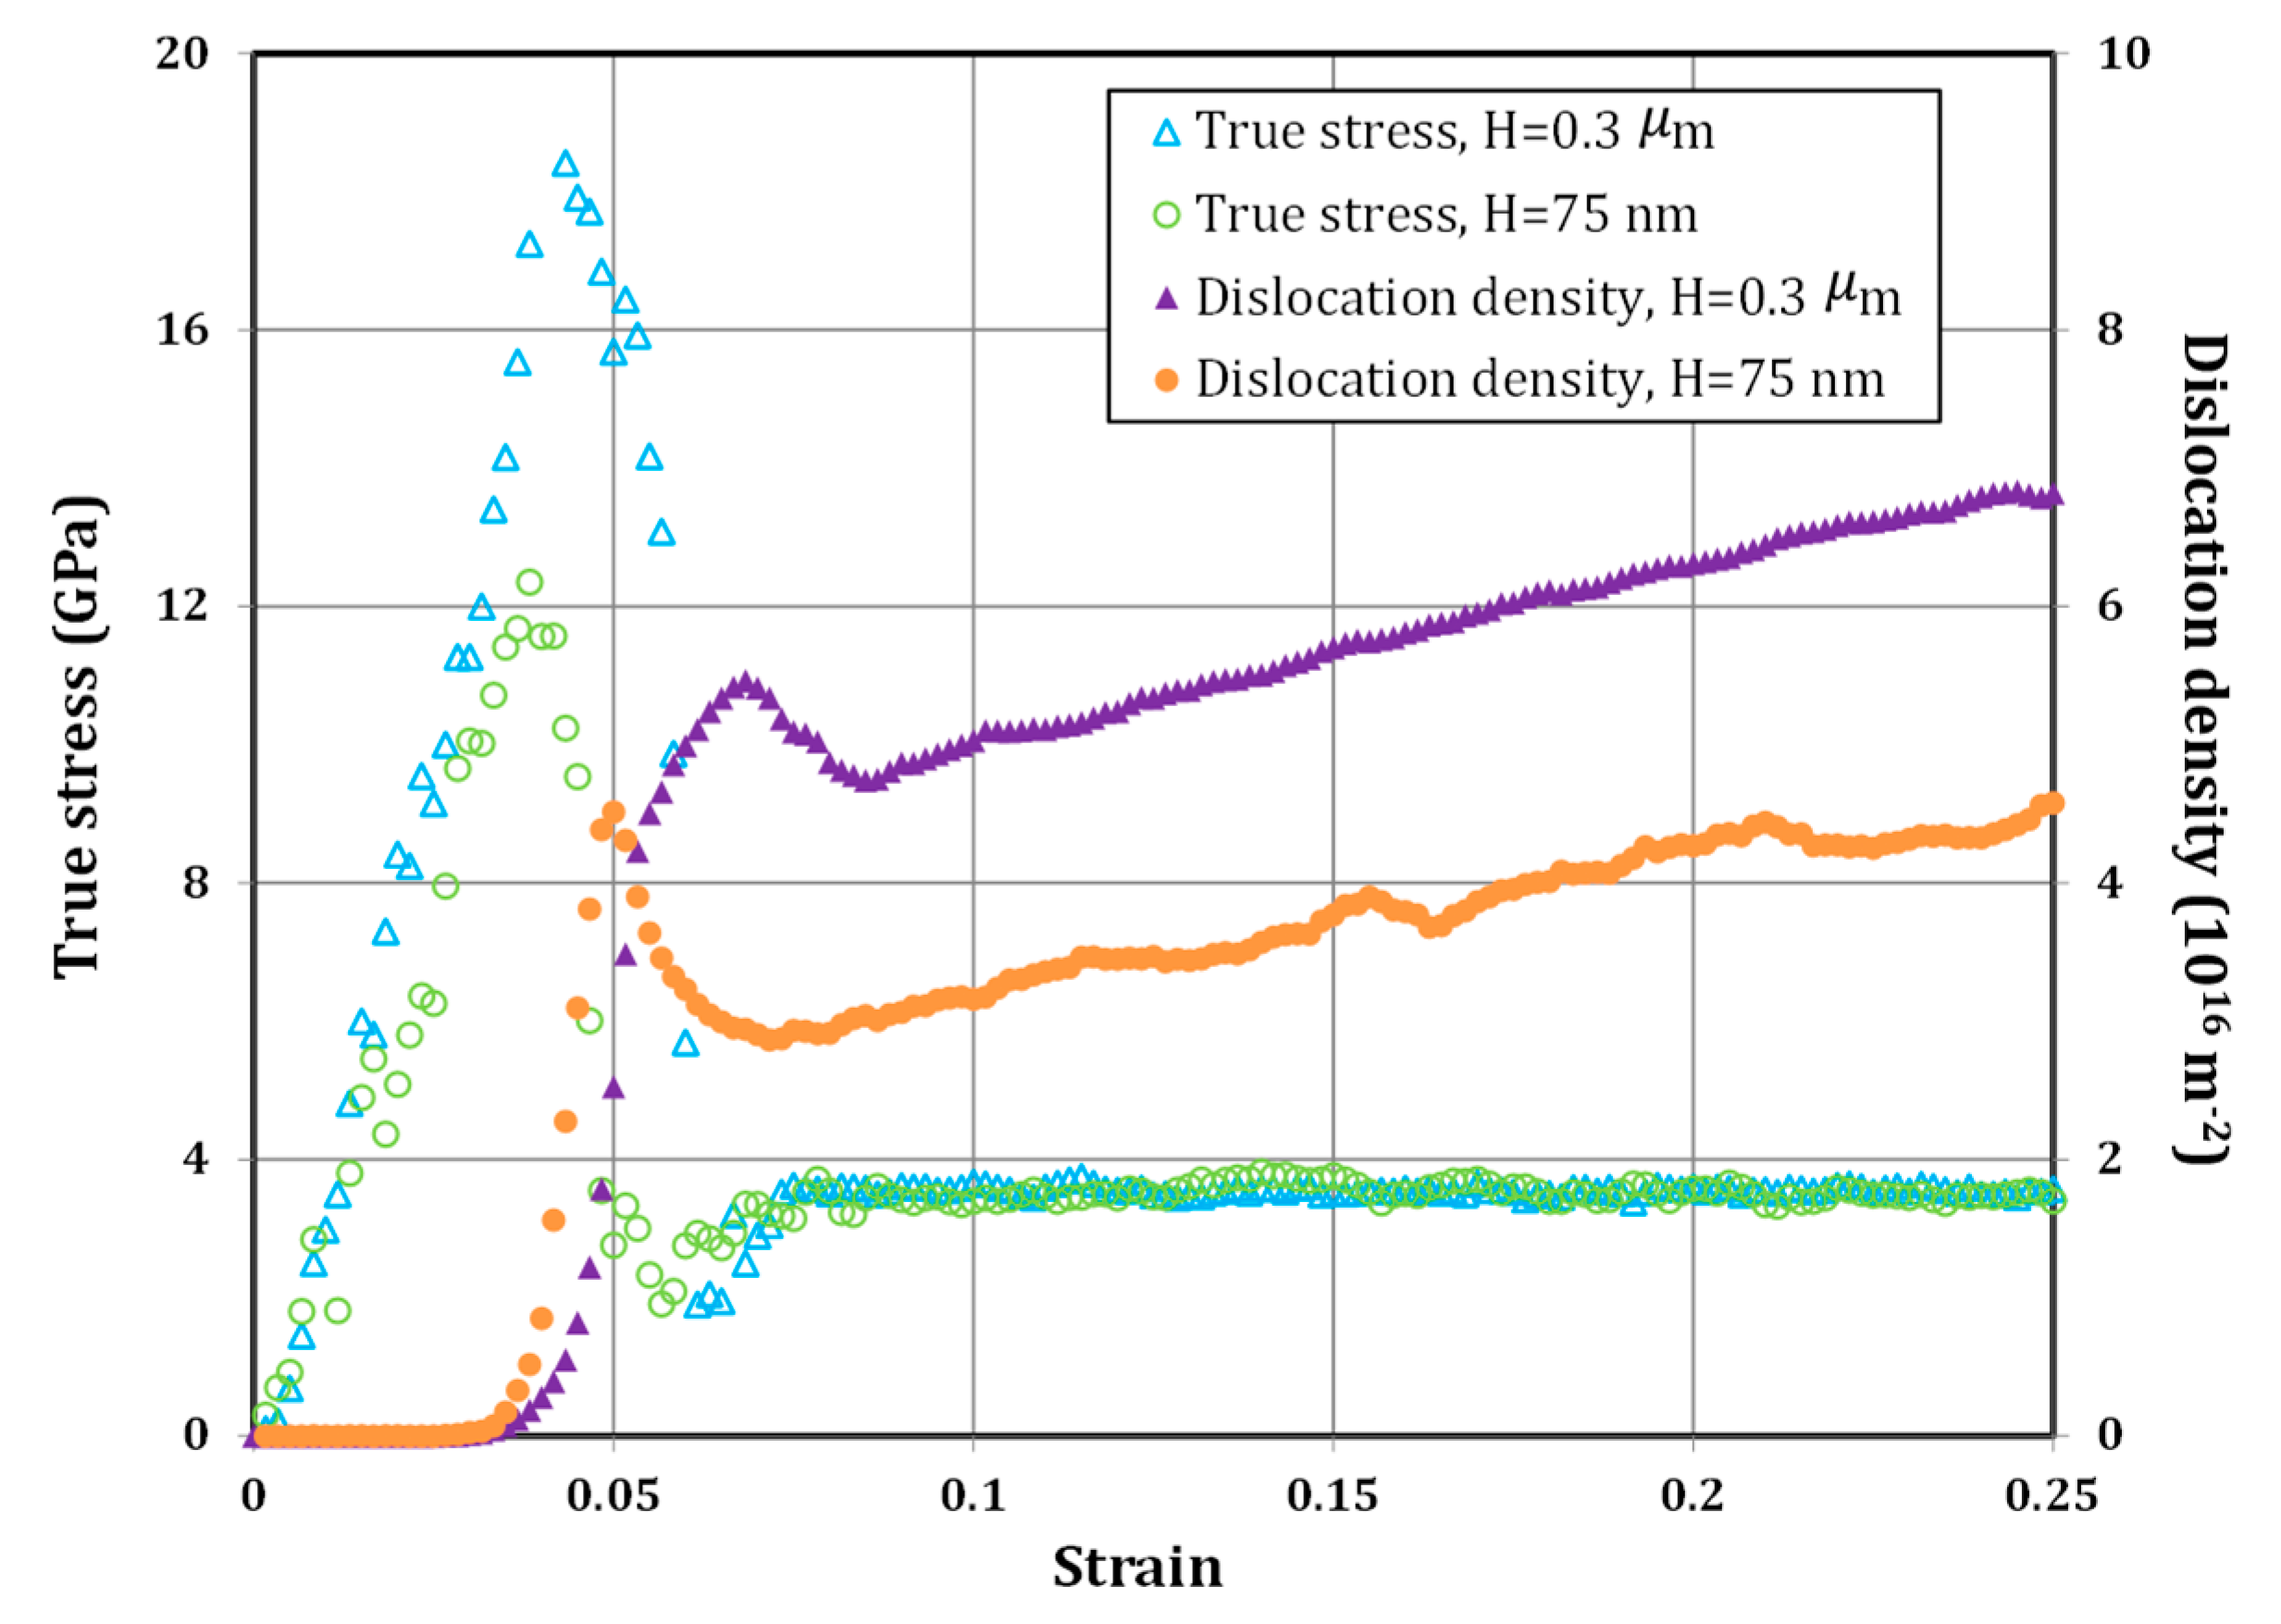
Yaghoobi and Voyiadjis [21] investigated the size effects for larger pillars. Accordingly, the response of the pillars with the diameter of D = 135 nm and height of H = 75 nm during uniaxial compression is compared with the response of a pillar with the diameter of D = 0.3 μm and height of H = 0.15 μm, as shown in Figure 16. The results show that, in spite of the difference in dislocation density, the flow stress of the two samples are the same. Yaghoobi and Voyiadjis [21] showed that, unlike the quasi-static experiments, for high rate deformations, there is no size effect during micropillar compression tests for the pristine pillars larger than the one with D = 135 nm and H = 75 nm. One should note that the reported difference in dislocation density in Figure 16 is mainly due to the difference in the aspect ratio of the two pillars. The obtained results show that increasing the strain-rate decreases the size of pillars at which there is no more size effects.
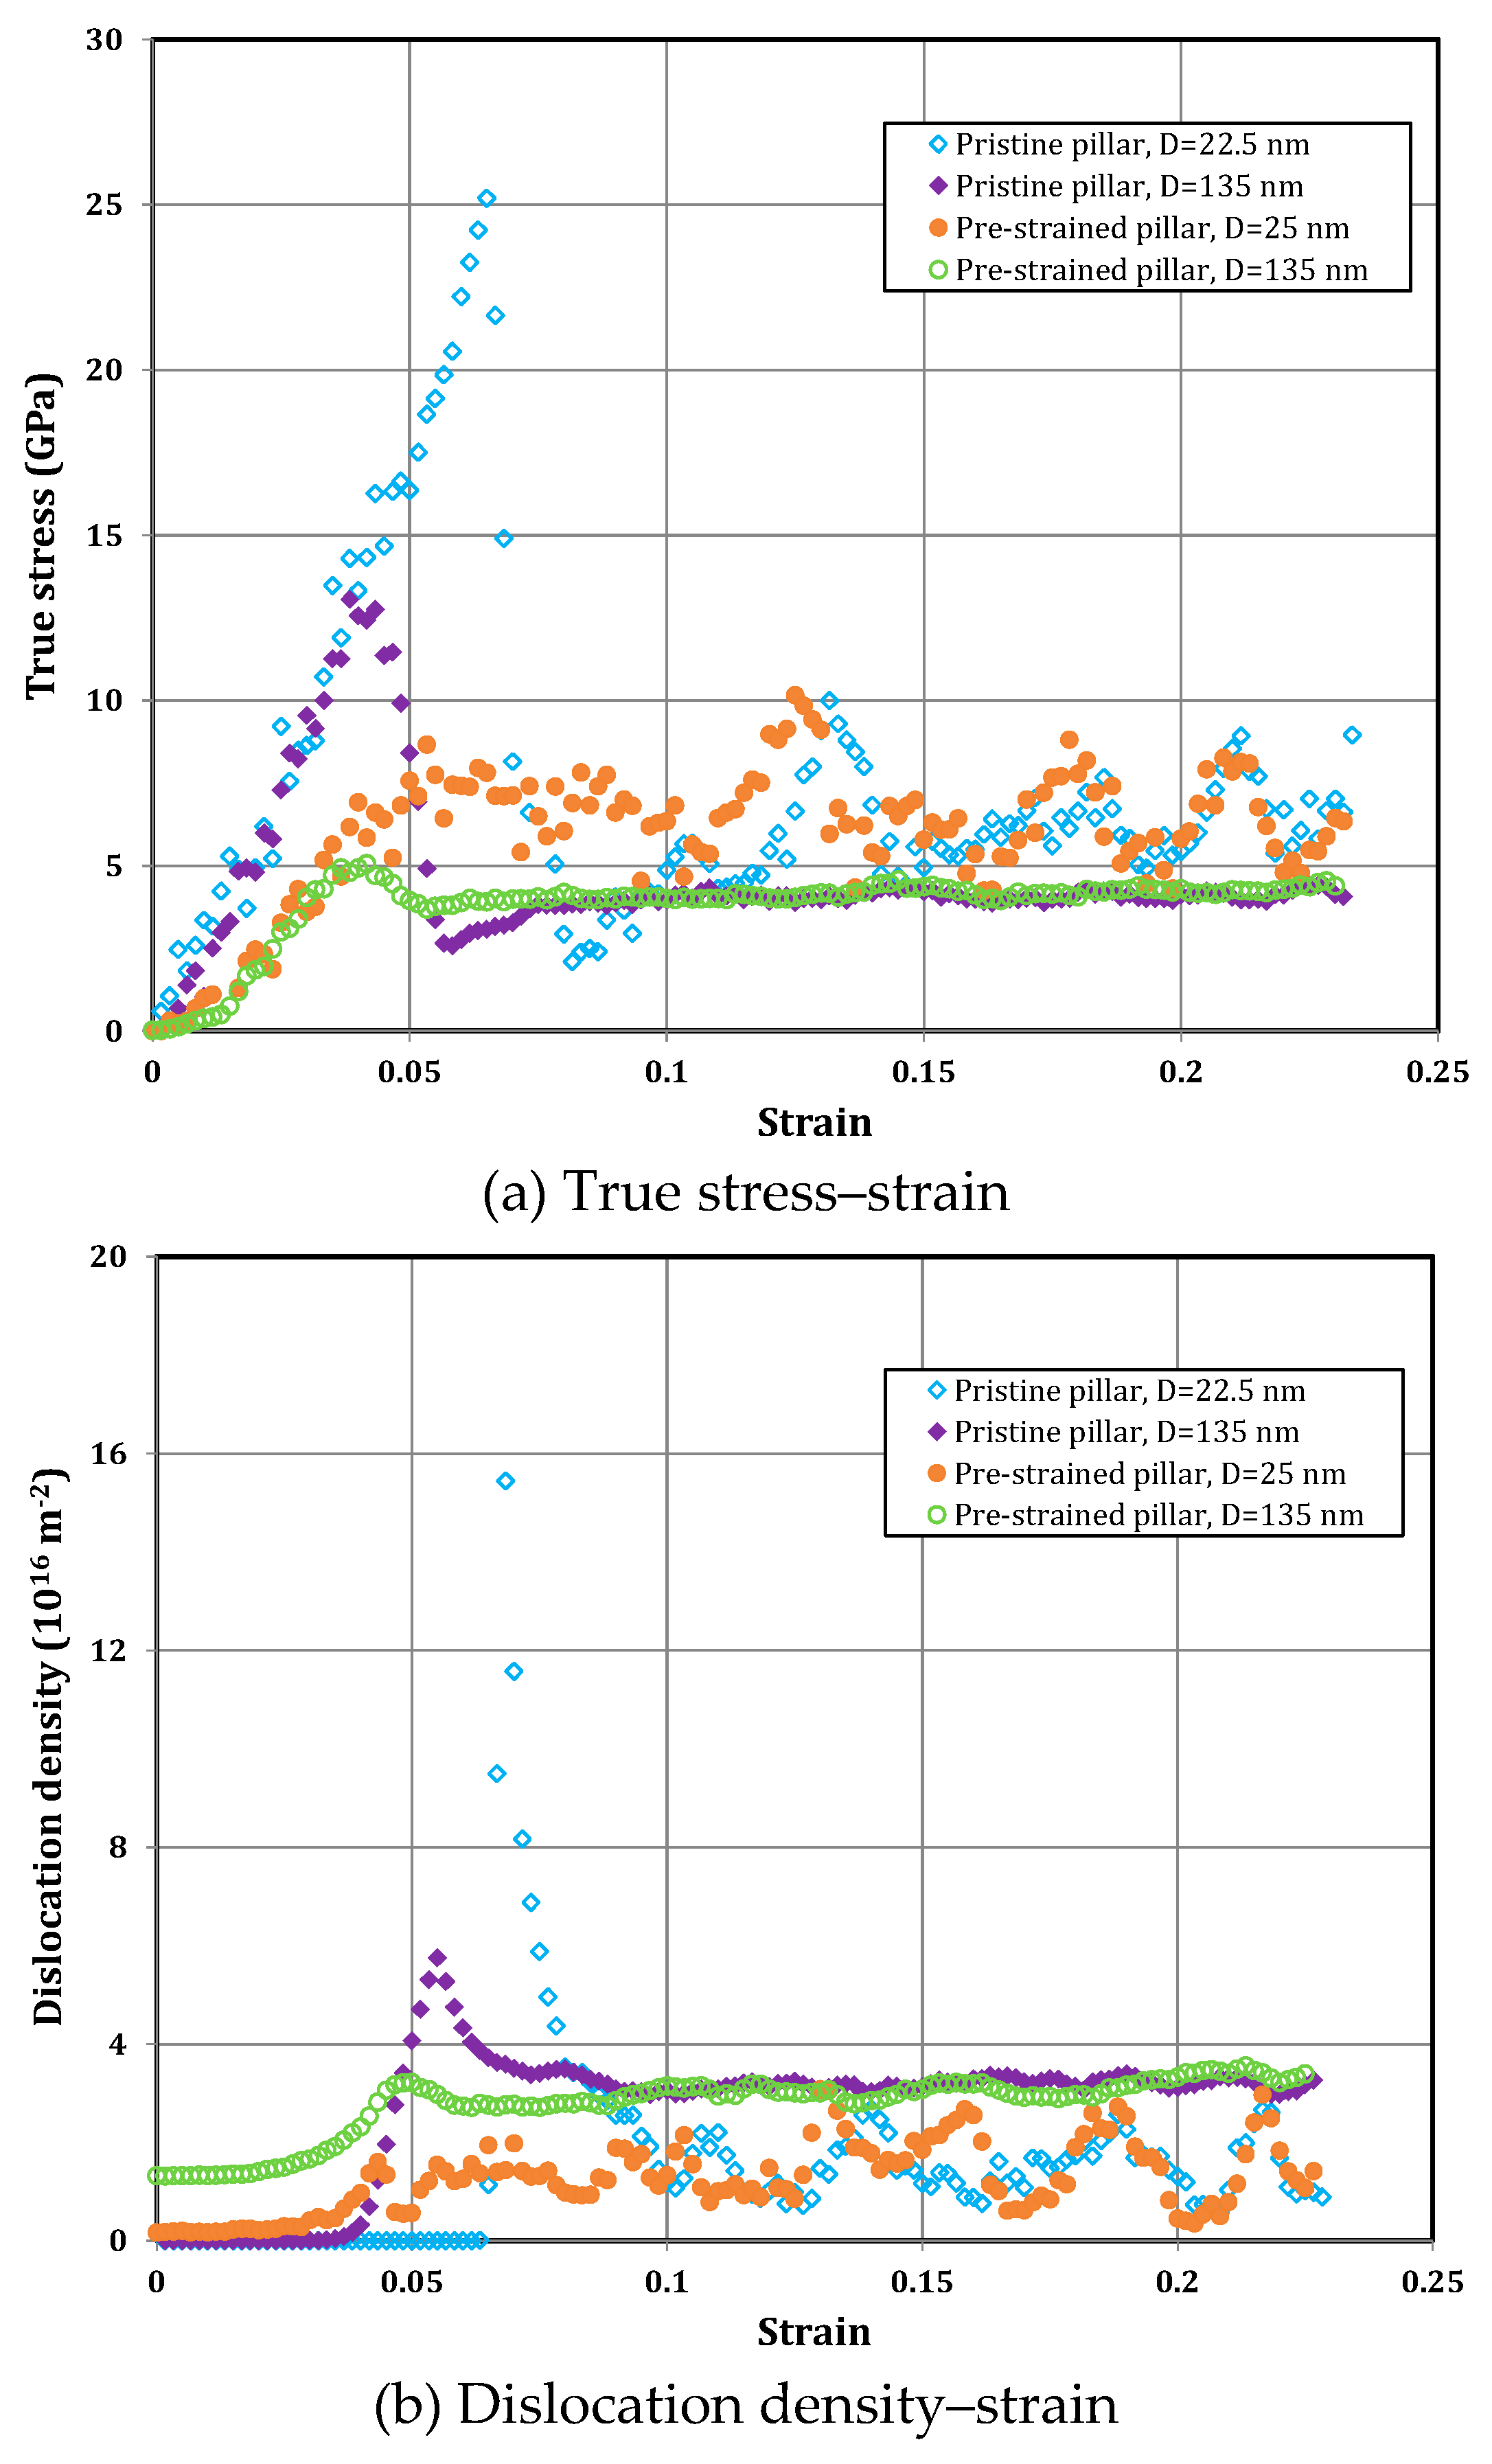
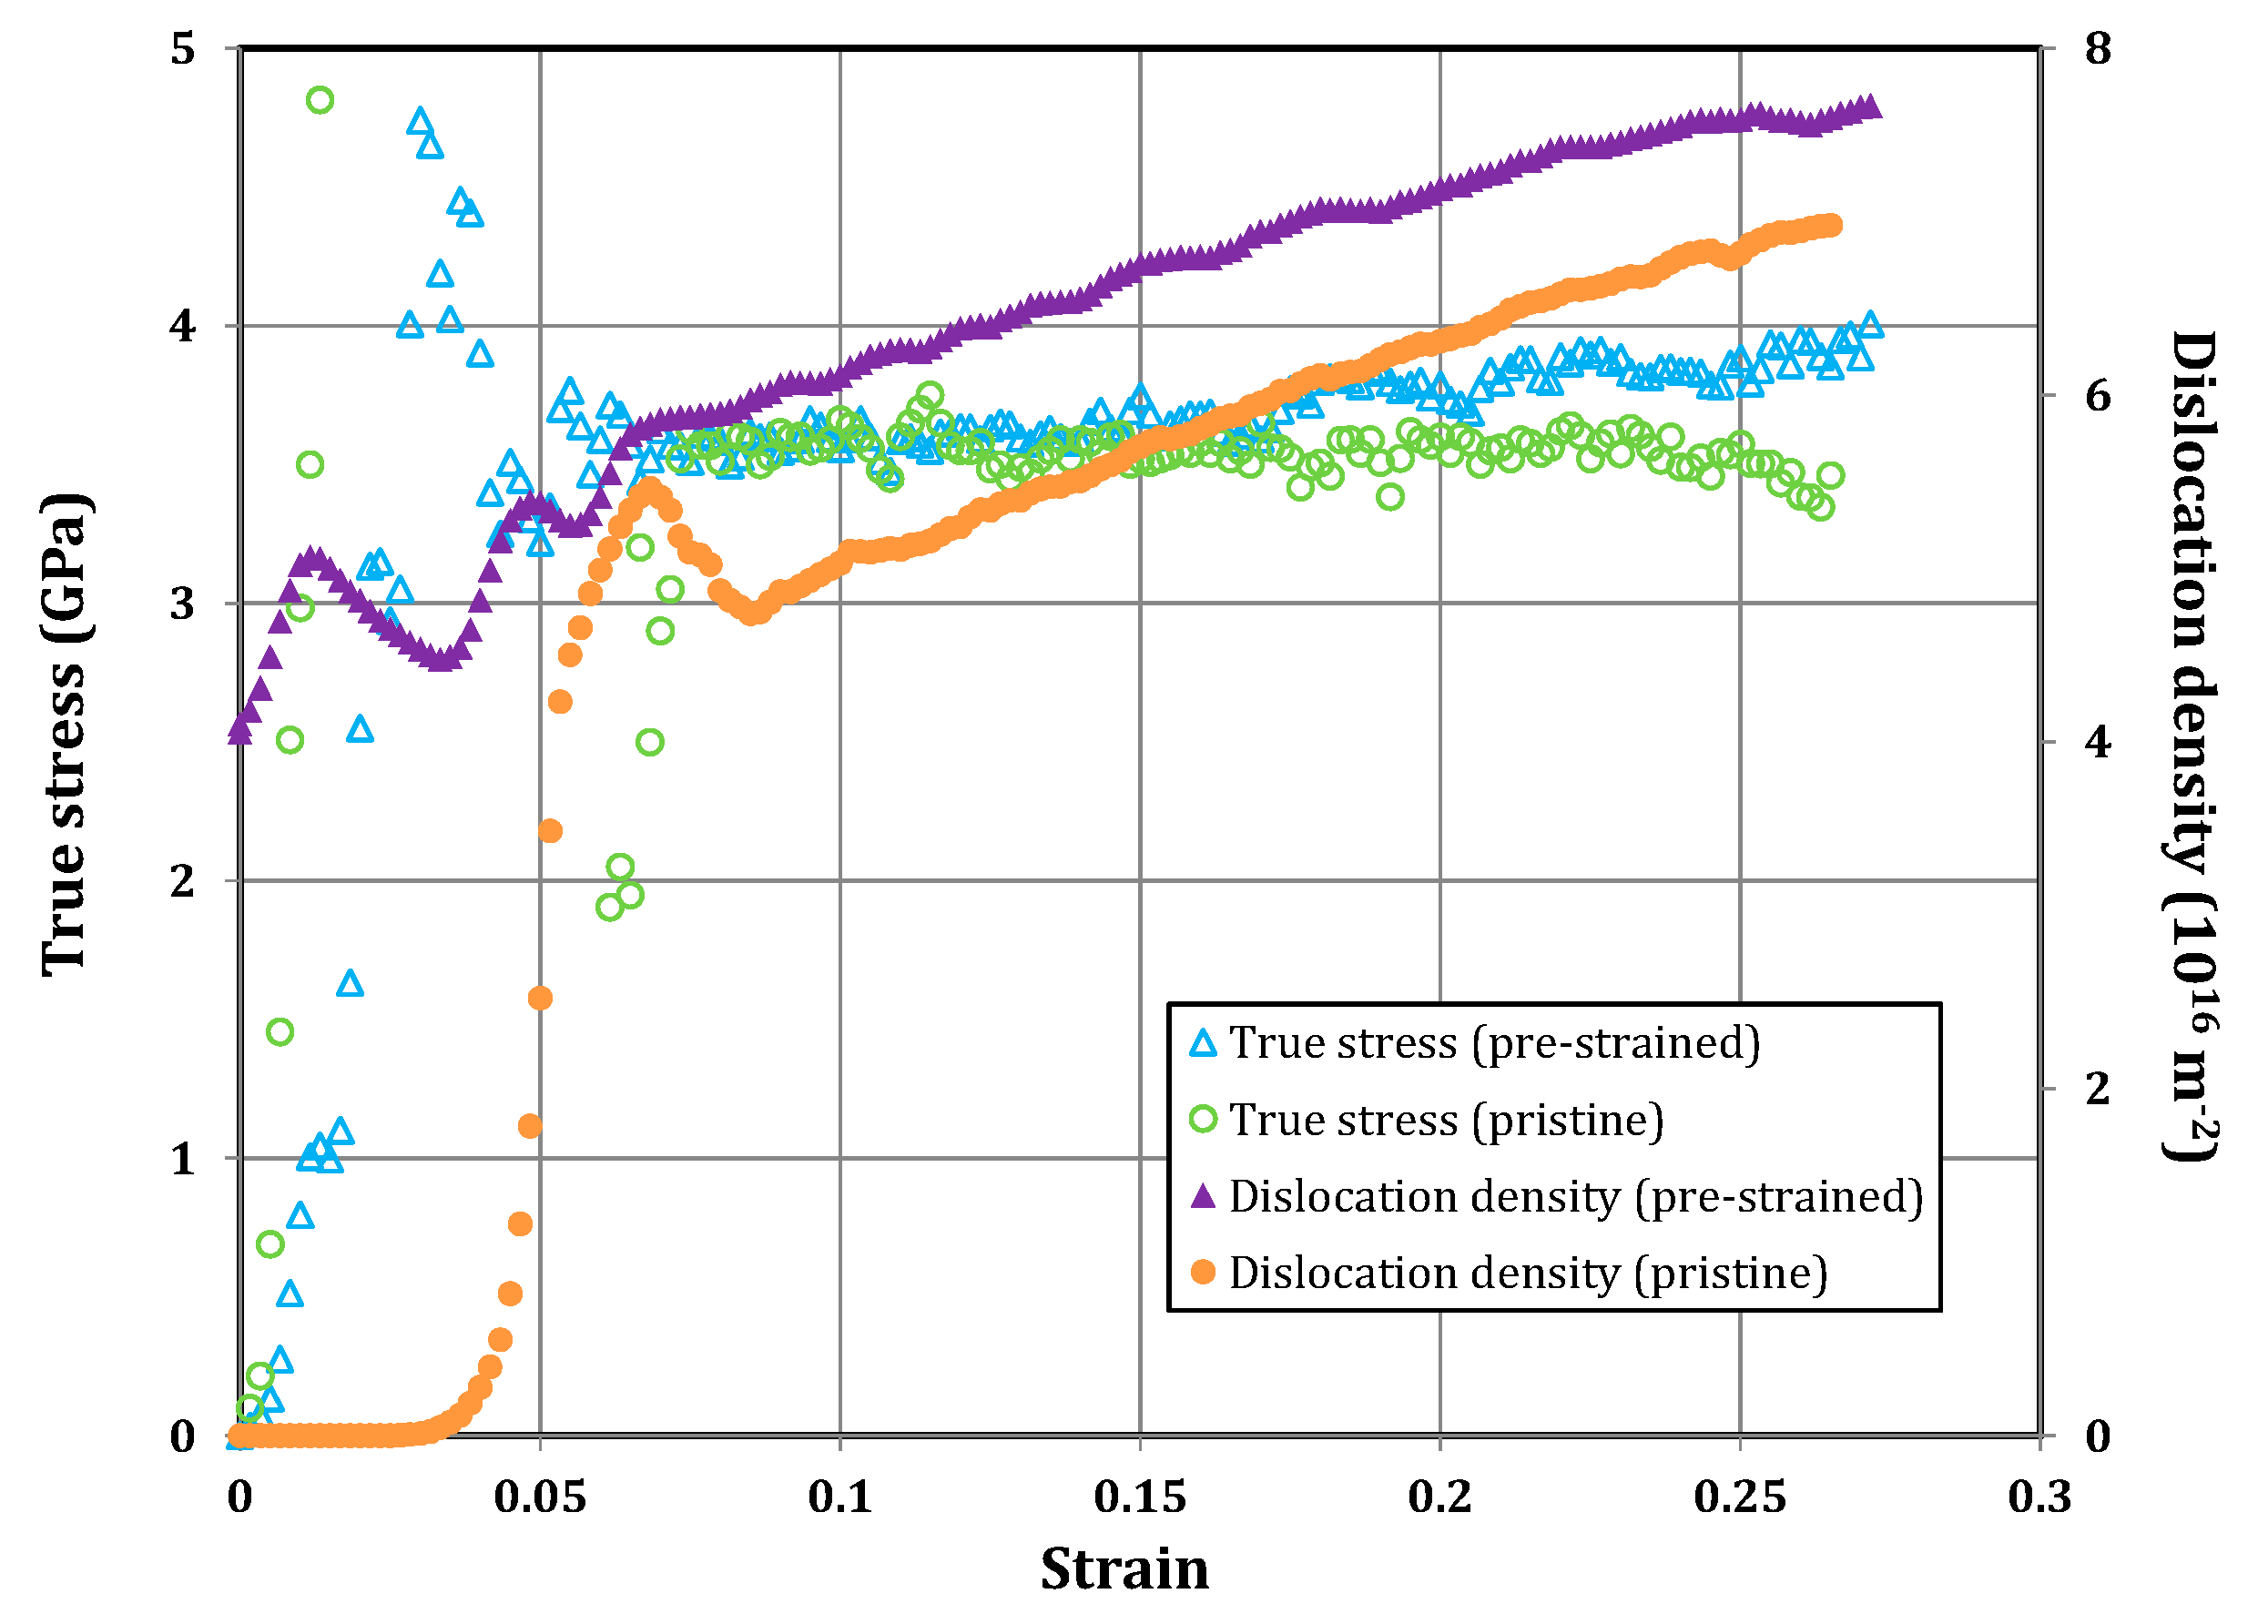
In addition to the pristine pillars, Yaghoobi and Voyiadjis [21] also investigated the size effects with initial dislocation density through pre-straining. Three different pillars were selected that have the diameters of 22.5 nm, 135 nm, and 0.15 μm and heights of 45 nm, 45 nm, and 0.3 μm, respectively. Figure 17 shows the effects of pre-straining on the response of the two smaller samples with the diameters of 22.5 nm and 135 nm and height of 45 nm. The general trend of the responses does not change due to pre-straining. Figure 18 shows the effects of pre-straining on the largest pillar with the height of 0.3 μm and diameter of 0.15 μm. In this case, the pre-straining changes the response of the samples and increases the sample strength. This is due to the fact that the forest hardening mechanism becomes activated in this sample, and pre-straining increases the dislocation density and accordingly the sample strength.
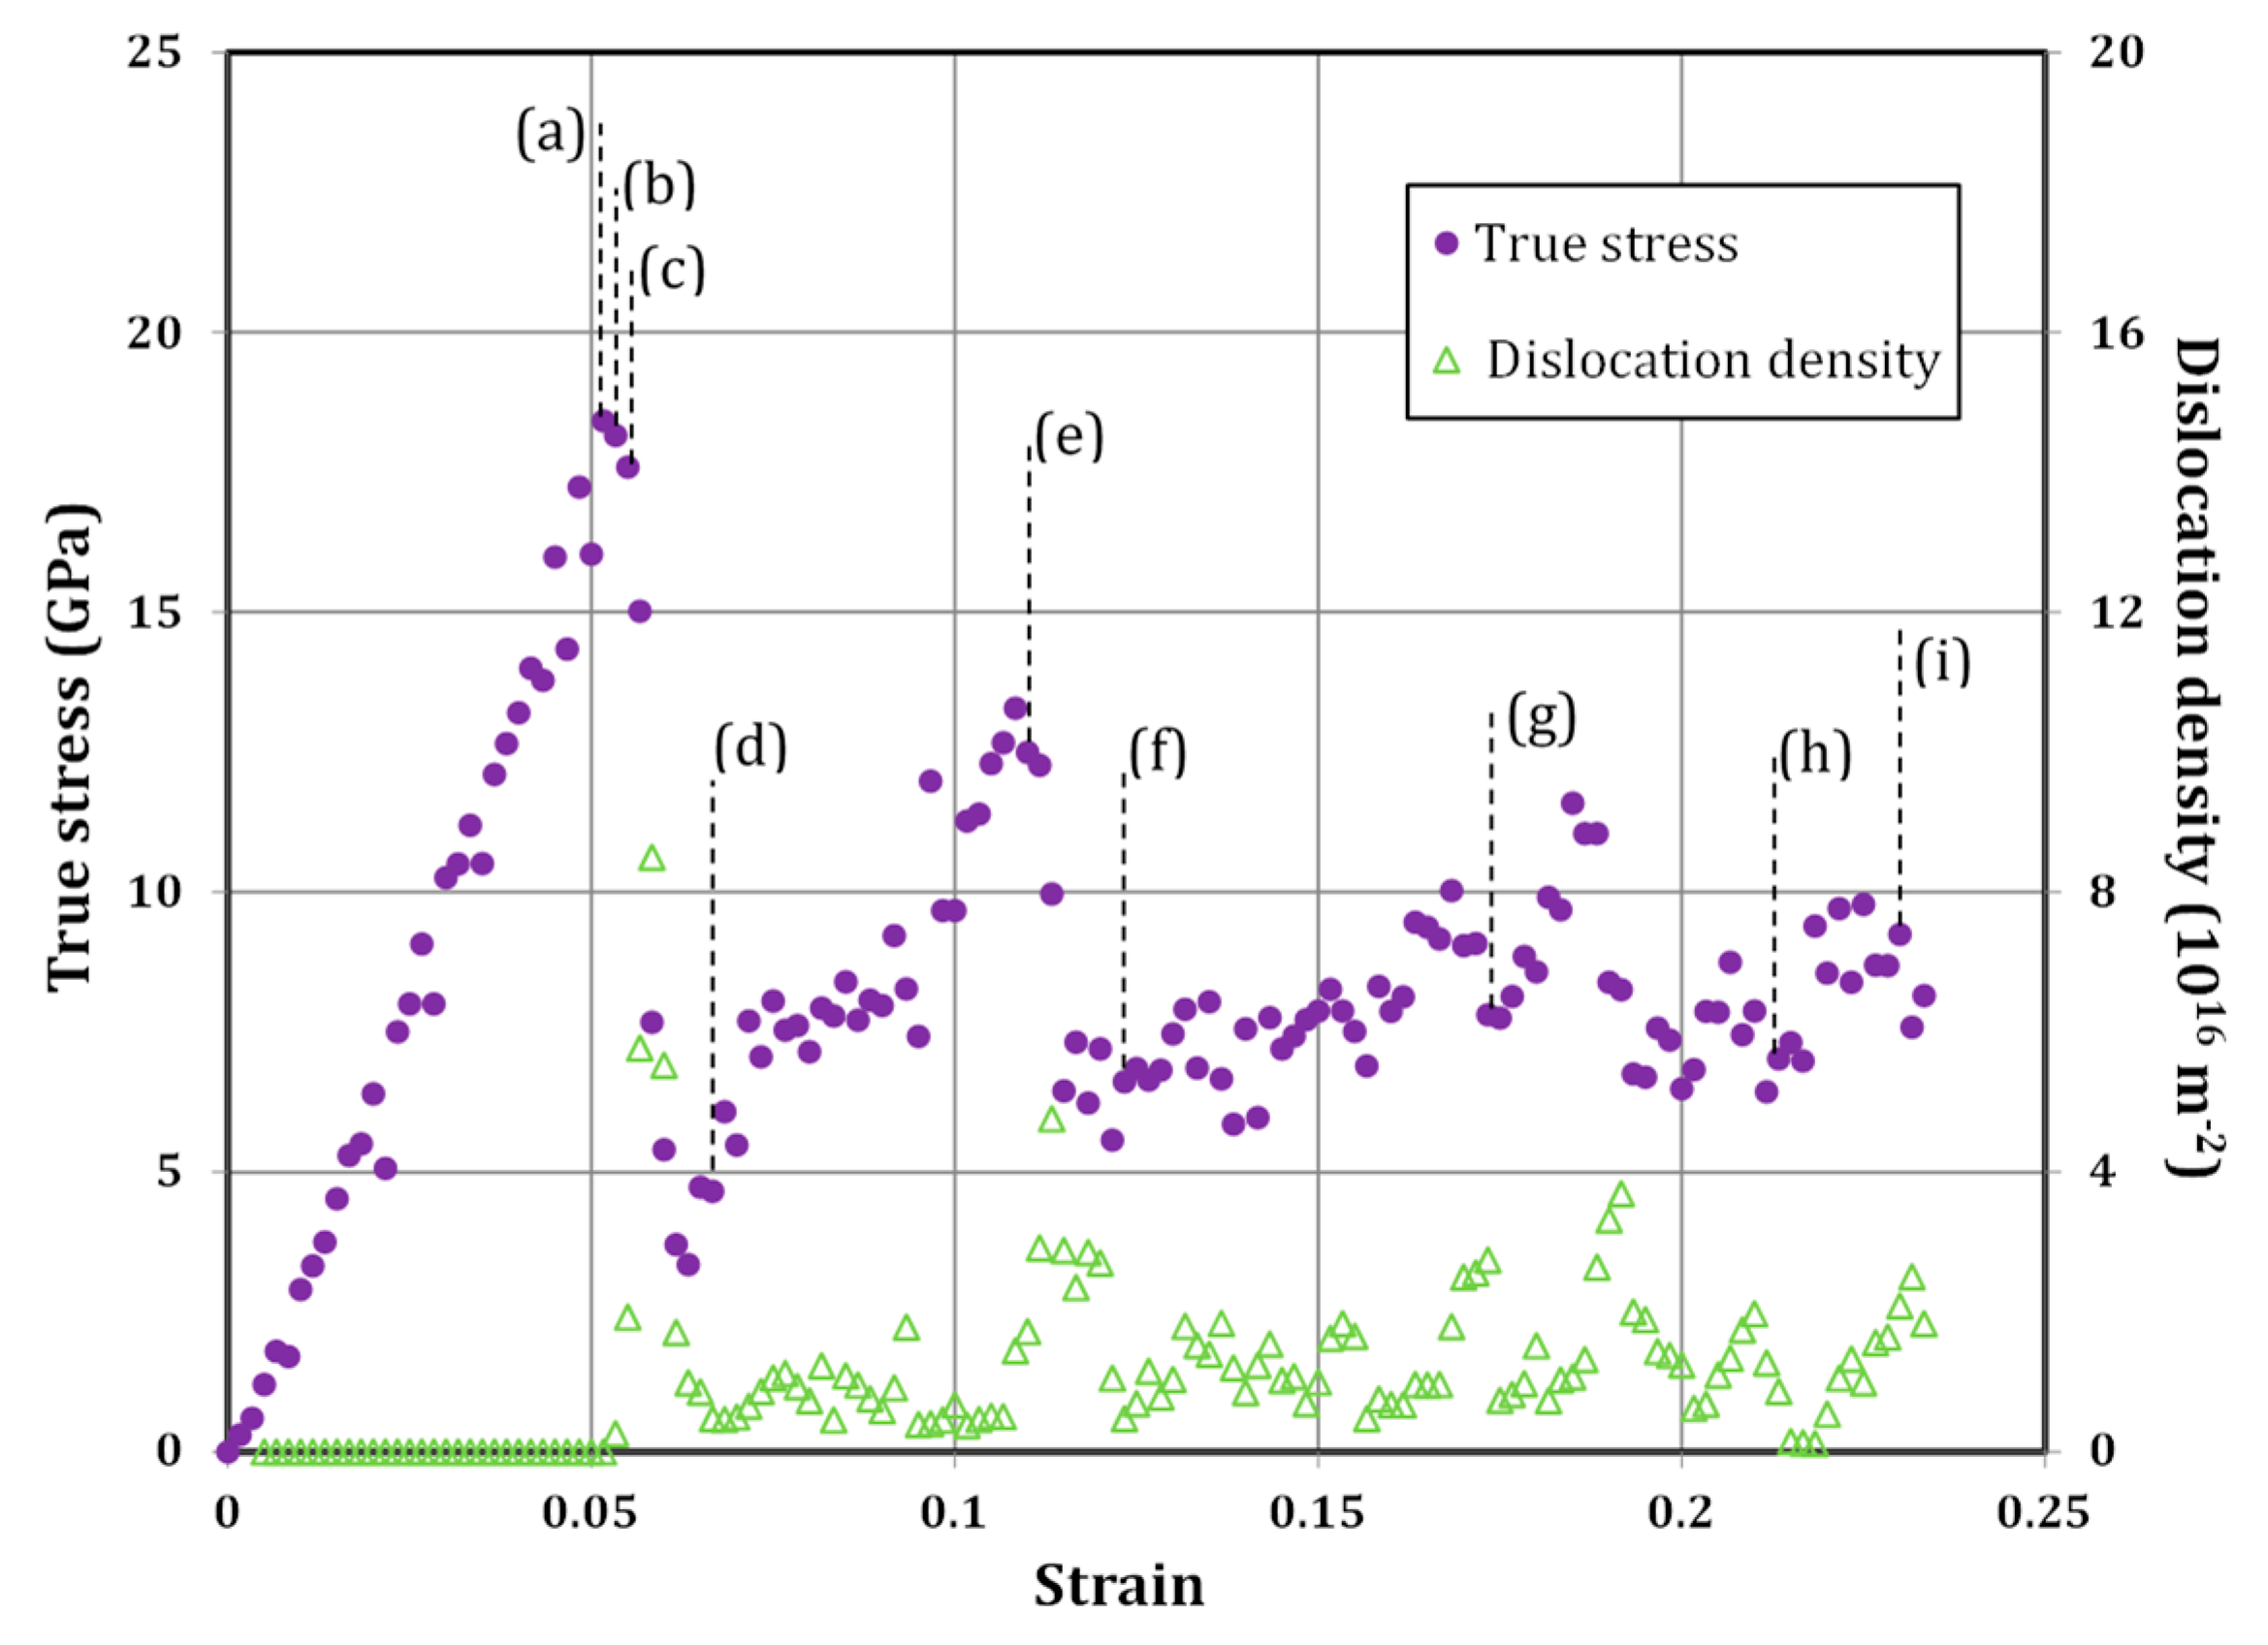
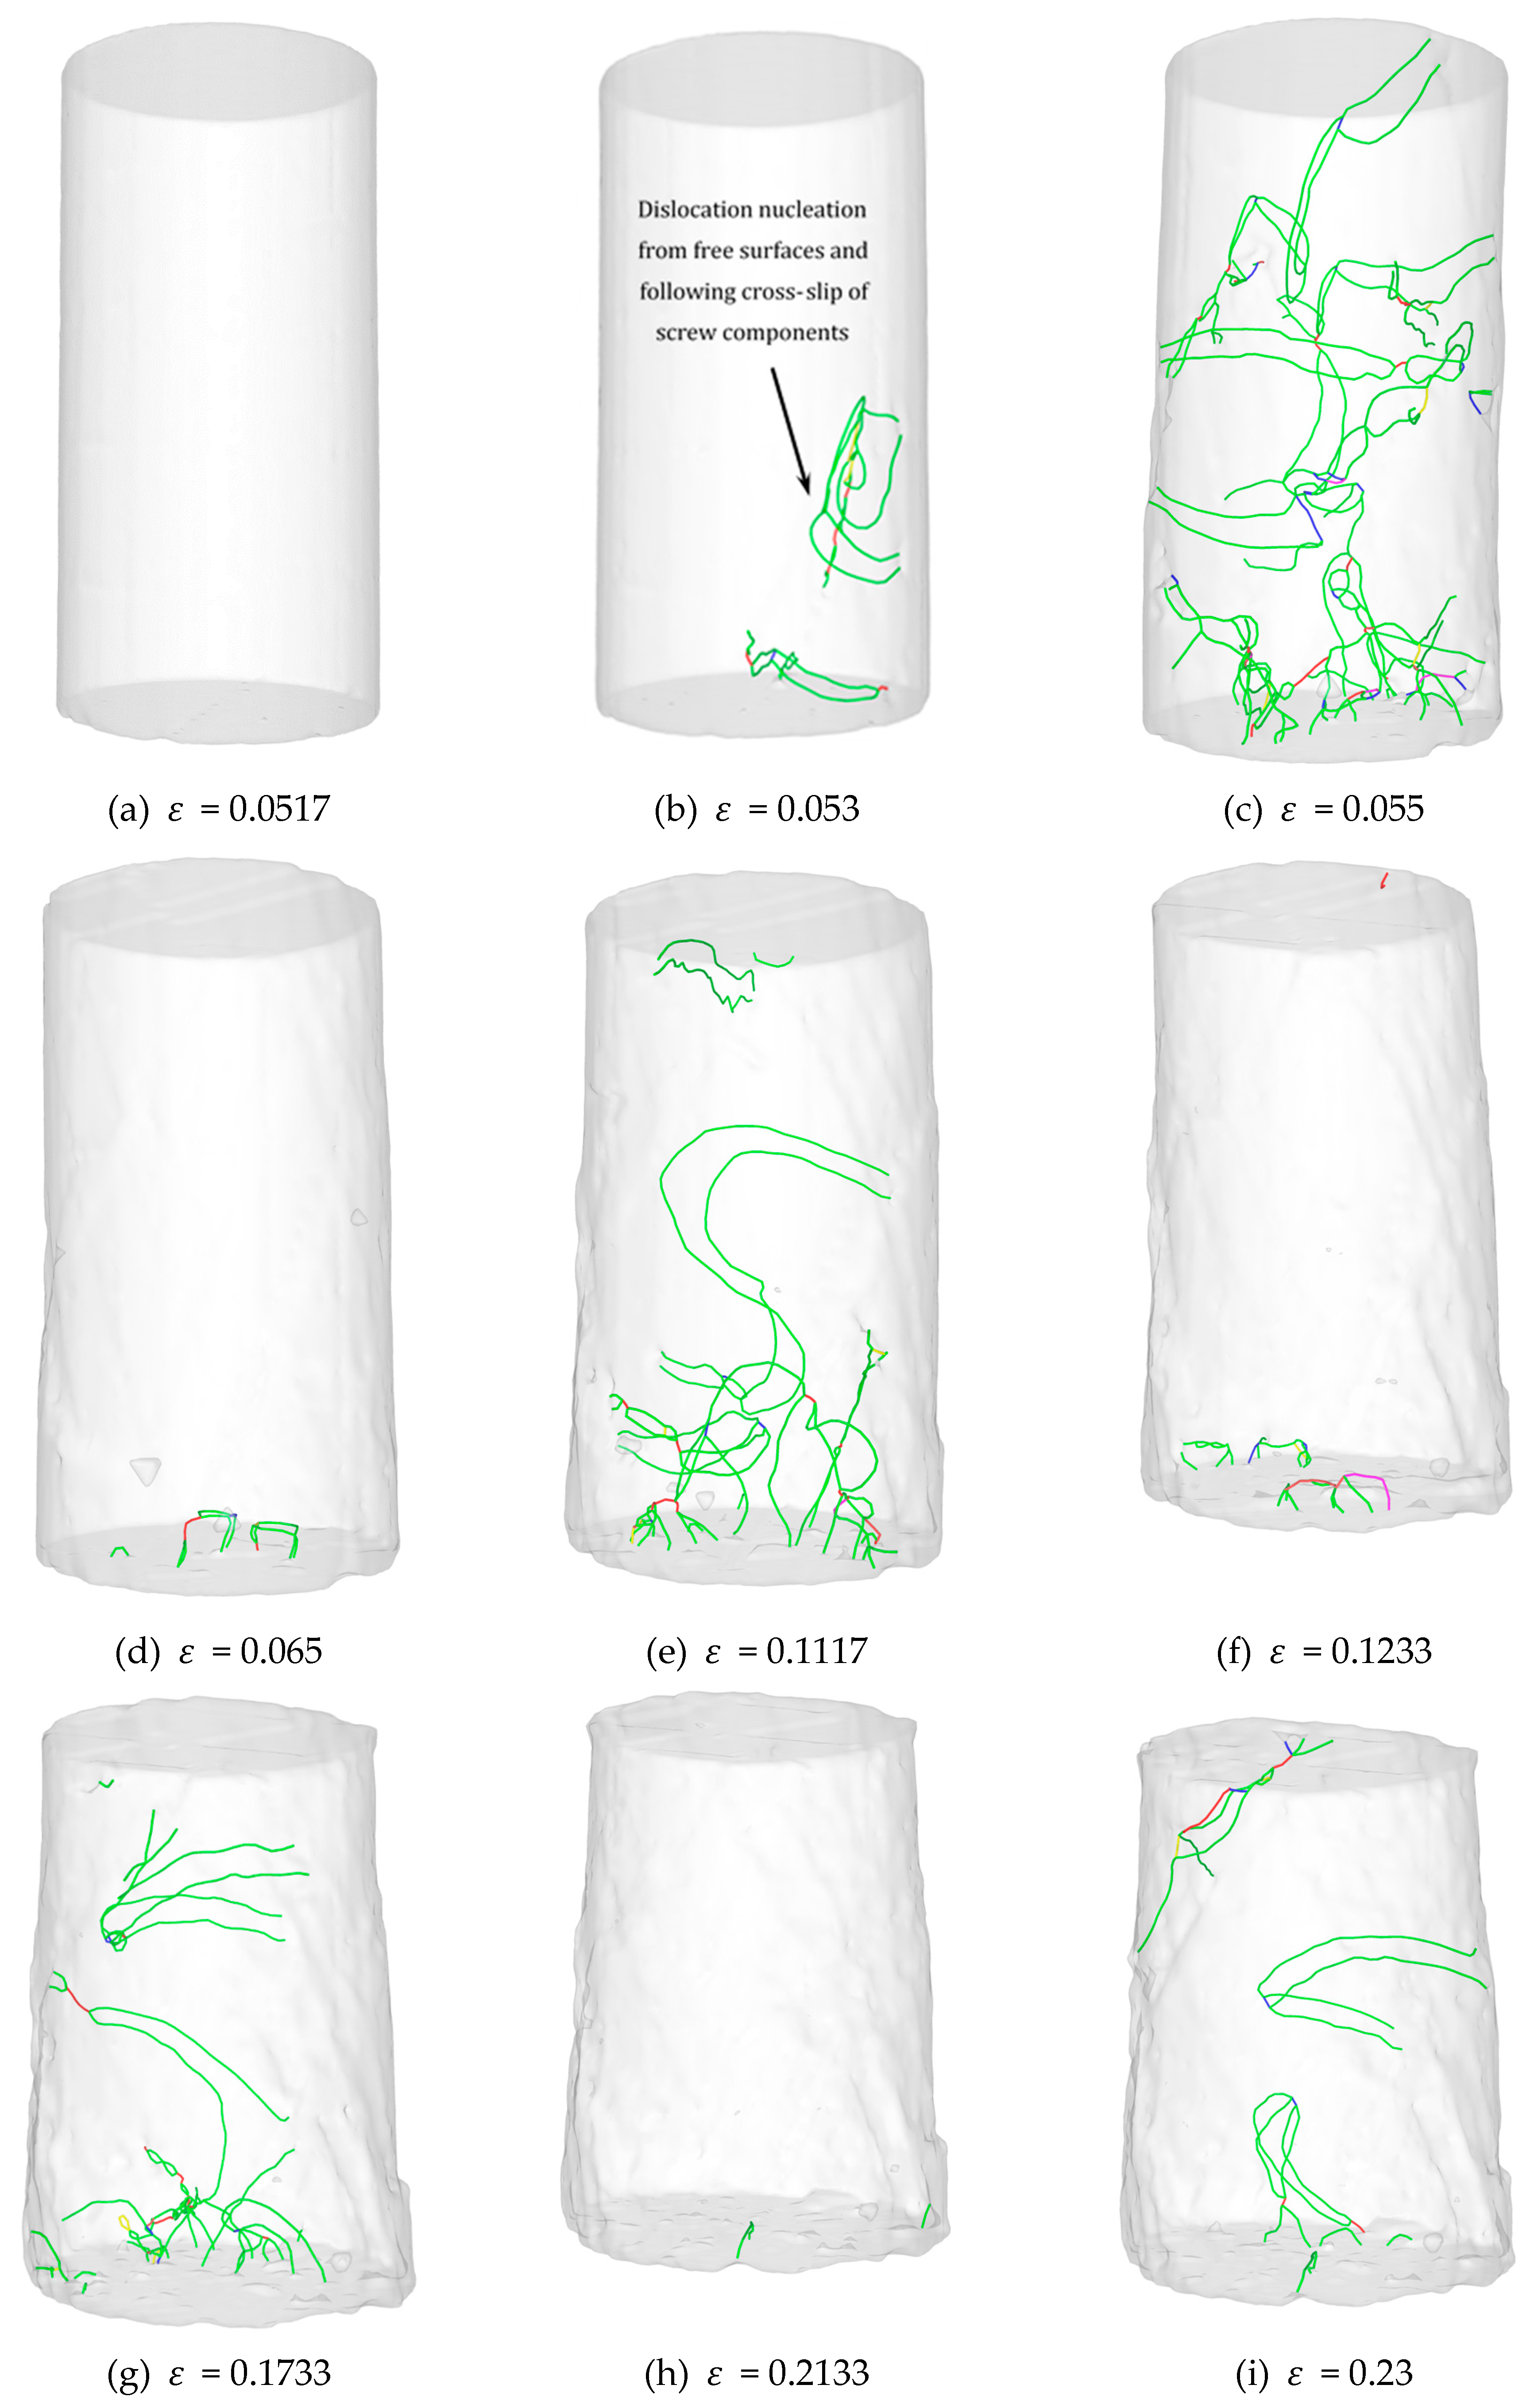
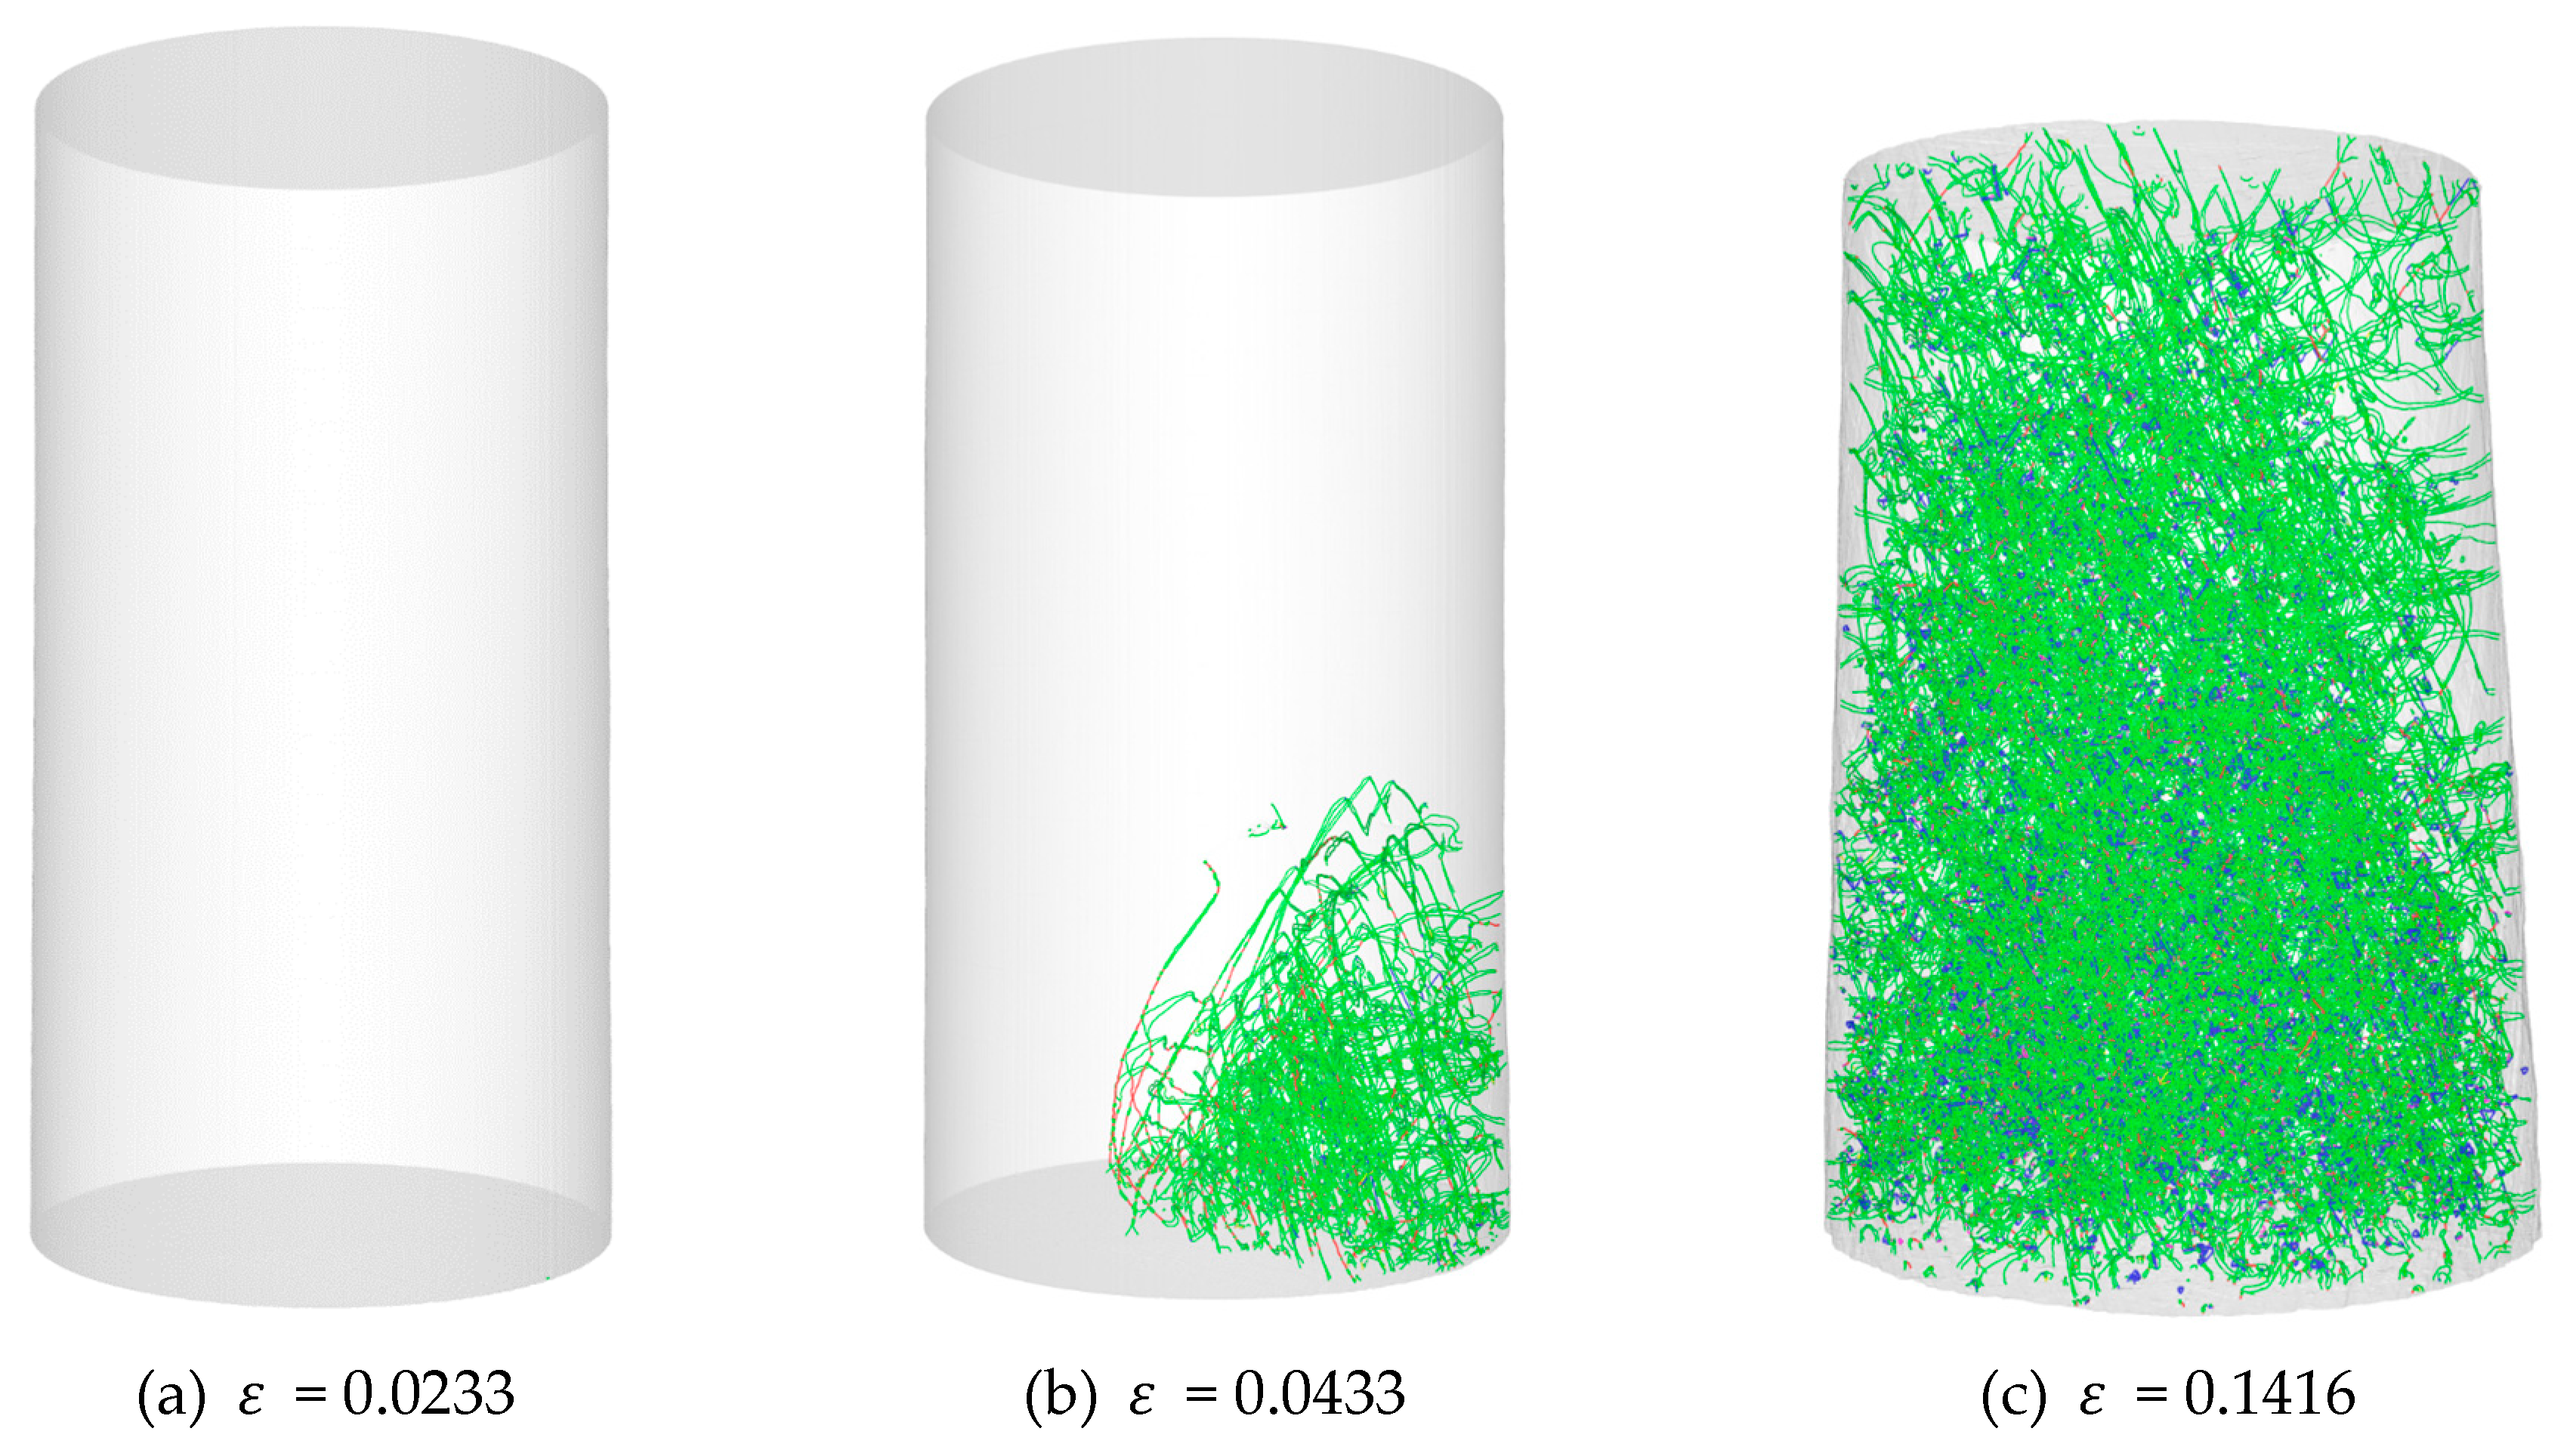
Yaghoobi and Voyiadjis [21] showed that the response of the samples during the micropillar compression test can be successfully captured by using the evolution of its microstructure. For example, the compressive response of the pillar with the heights of 30 nm and diameter of 15 nm is shown in Figure 19. At the same time, the dislocation network of the sample is also represented at various strains in Figure 20. Initial dislocation nucleation takes place at the free surfaces. The surface cross-slip is the governing dislocation multiplication mechanism that includes the dislocation nucleation from the surfaces followed by the cross-slip [69]. The same mechanism was reported by Hussein et al. [70] using 3D DDD simulation of FCC crystals. In the case of pillar with the heights of 30 nm and diameter of 15 nm, nucleated dislocations leave the sample before generation of considerable number of pinning points. Accordingly, the dislocation starvation occurs inside the sample, which leads to a jump in required stress to sustain the plastic flow. Another dislocation nucleation and elongation lead to a drop in the required stress. The drop due to nucleation is shown in Figure 20b,c,e,g,i, while the starvations are shown in Figure 20 d,f,h. These events can be related to the sample response as shown in Figure 19. Yaghoobi and Voyiadjis [21] also investigated the microstructure of the large sample with the height of 0.3 μm and diameter of 0.15 μm, as shown in Figure 21. They showed that the starvation does not occur in this sample.
Sansoz [14] predicted that both source-limited activation and mobile dislocation exhaustion occur in all nanopillars in a way that the deformation mechanism changes from the dislocation exhaustion to the source-limited activation as the strain increases (Sansoz [14]). Furthermore, the dislocation exhaustion is the deformation mechanism for all nanopillars for the region of small strains [14]. However, Yaghoobi and Voyiadjis [21] showed that the dislocation starvation, i.e., source-limited activations, is the only deformation mechanism for the smallest simulated pillar at the entire applied strain range. Furthermore, it was observed that no dislocation starvation occurs for the largest simulated pillar.
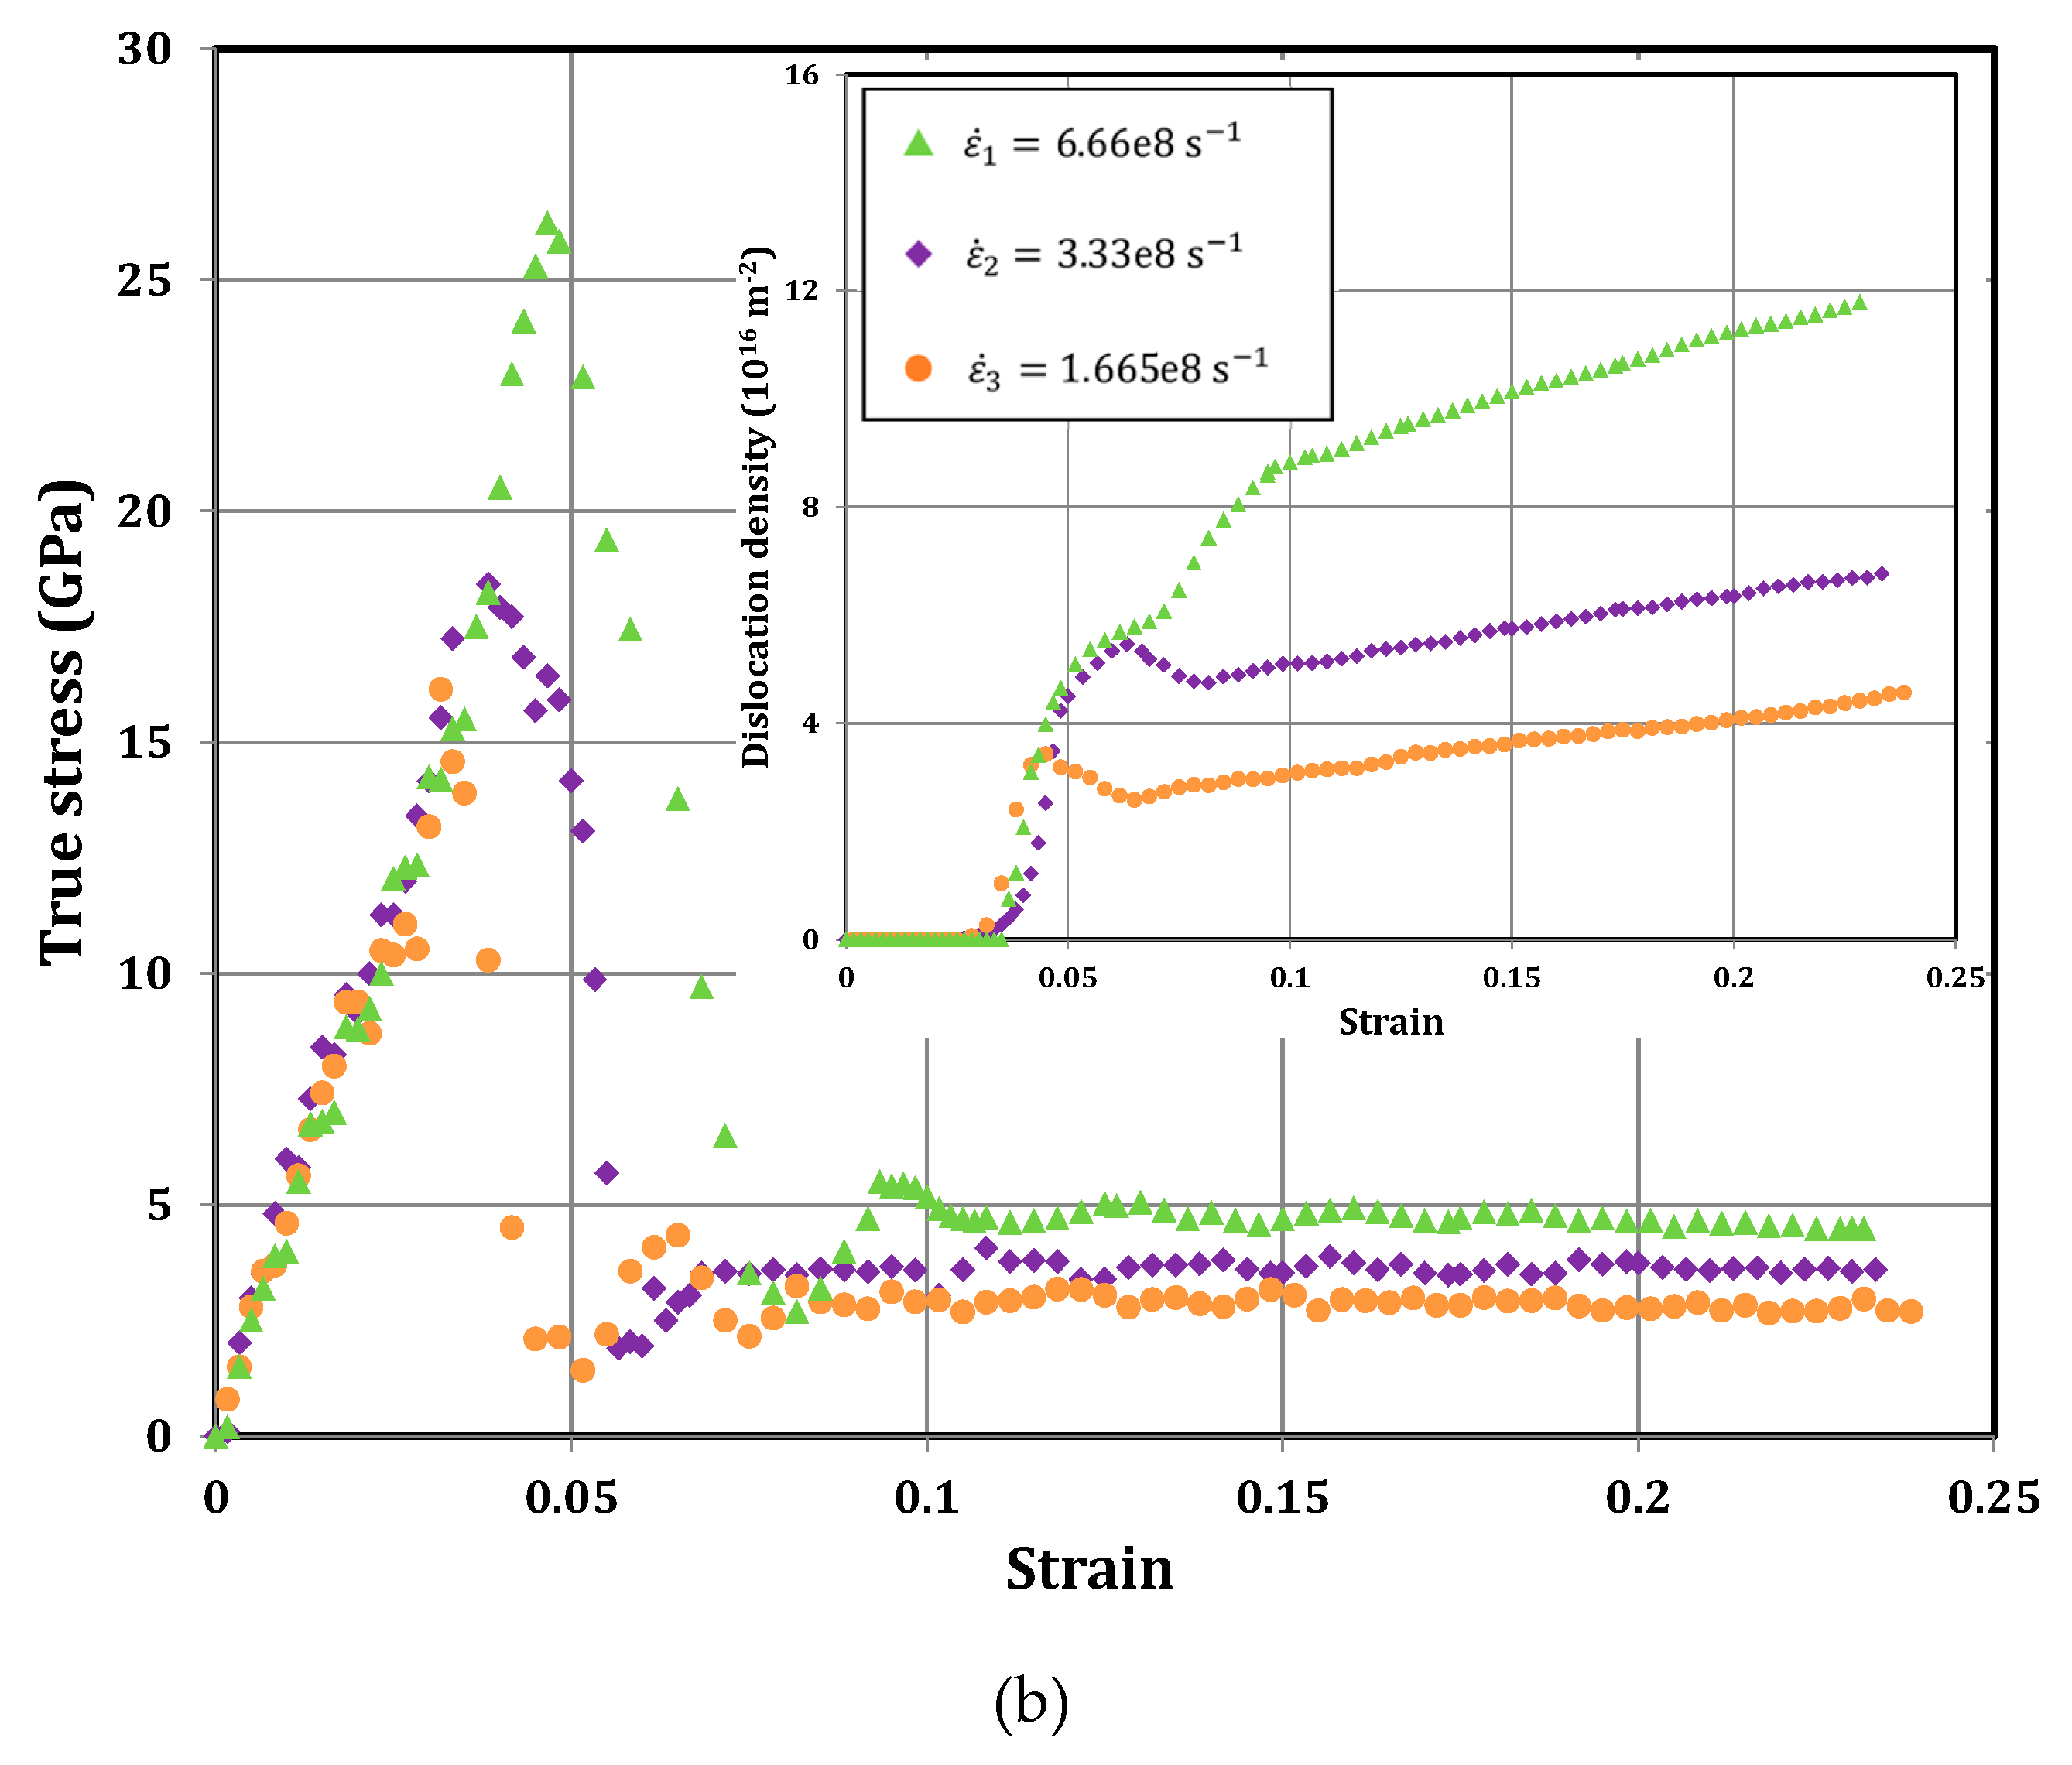
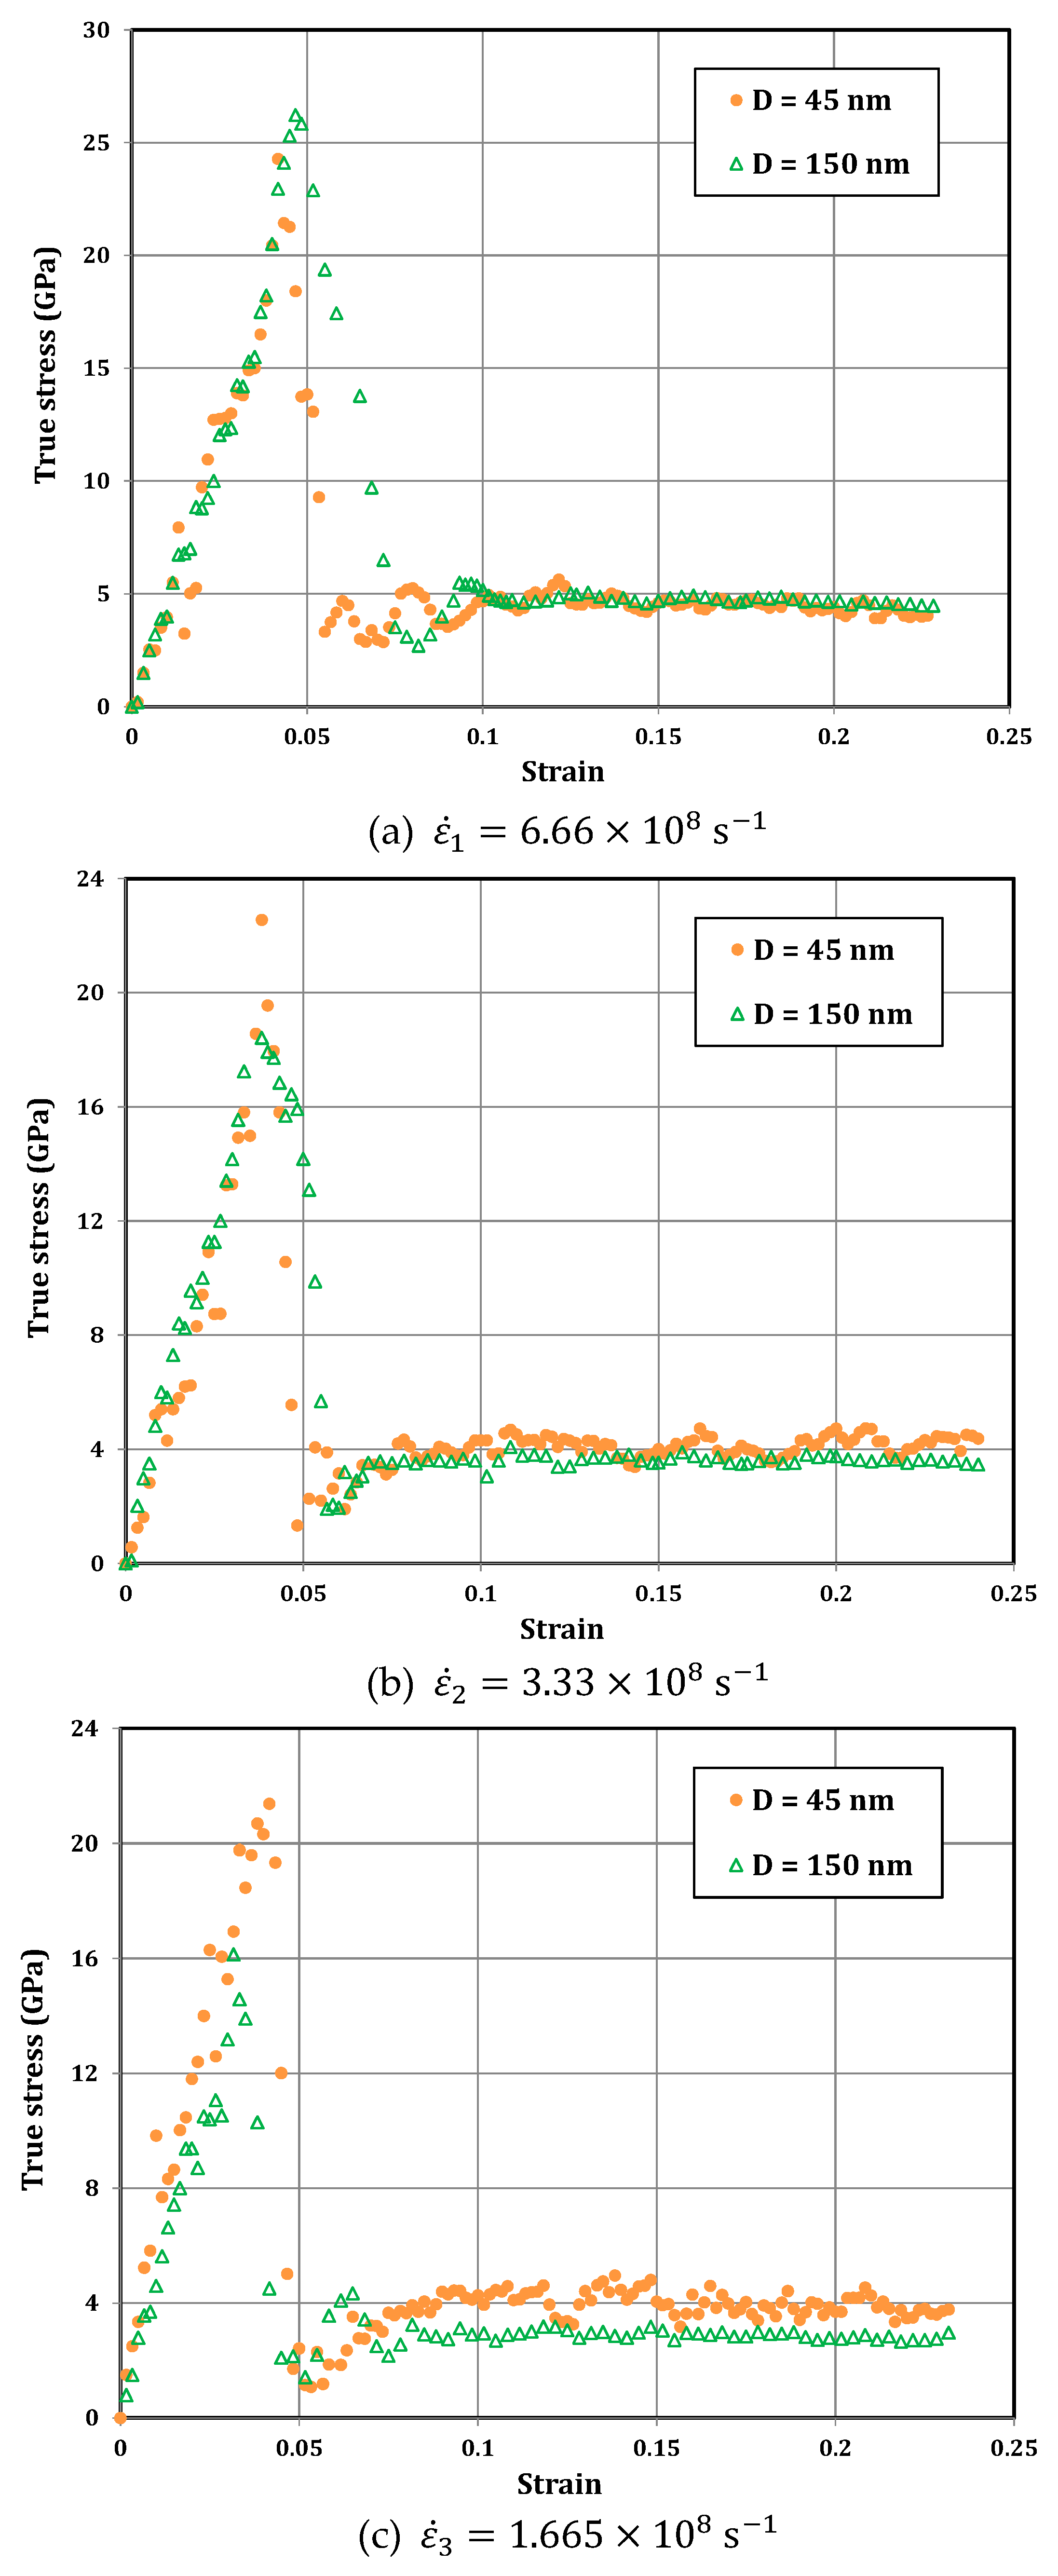
Another important aspect which can be investigated is the coupling effects of strain rate and pillar size. As mentioned before, the atomistic simulation studies are conducted at strain rates which are higher than the experimental observations. Accordingly, a systematic study is required to investigate the coupling effect of sample size and applied strain rate. Voyiadjis and Yaghoobi [16] investigated this problem in the case of FCC pillars using large scale atomistic simulation. They simulated two pillars with the heights of 90 nm and 300 nm, and diameters of 45 nm and 150 nm, respectively. They tested three different strain rates of , , and . The response of each sample at different strain rates are shown in Figure 22. In the case of the pillar with the diameters of 45 nm, although the dislocation density varies by increasing the strain rate, the samples show almost the same strength. In the case of the larger sample with the diameter of 150 nm, however, the sample shows higher strengths for higher strain rates. Another way to investigate the presented results is to show the responses of both pillars at similar strain rates, as shown in Figure 23. The results show that, as the strain rate decreases, more size effects are observed.
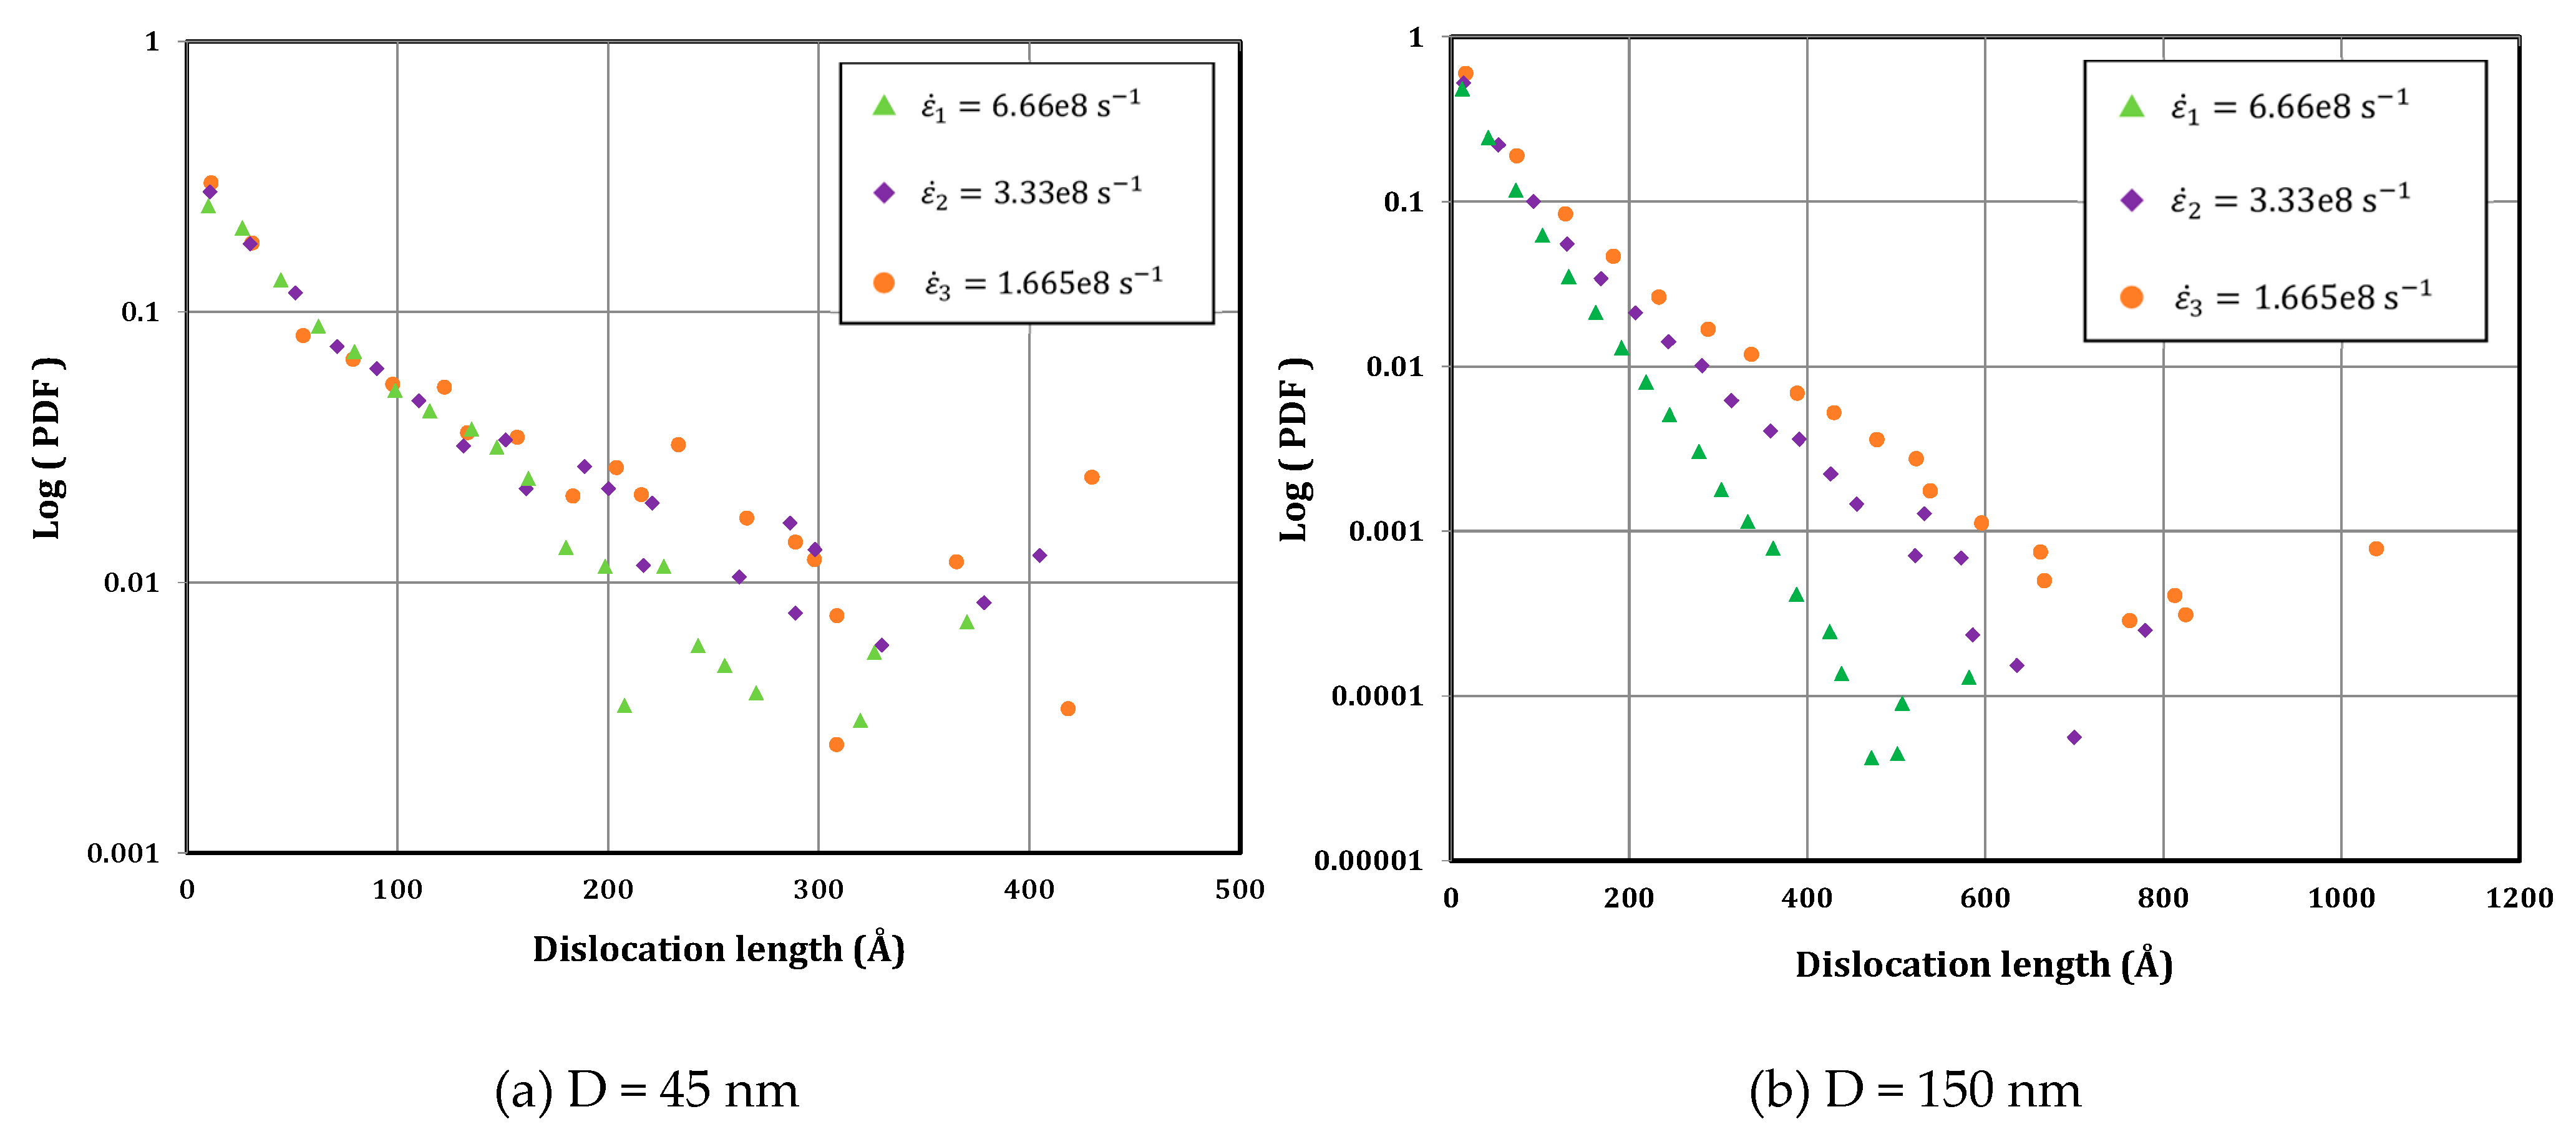
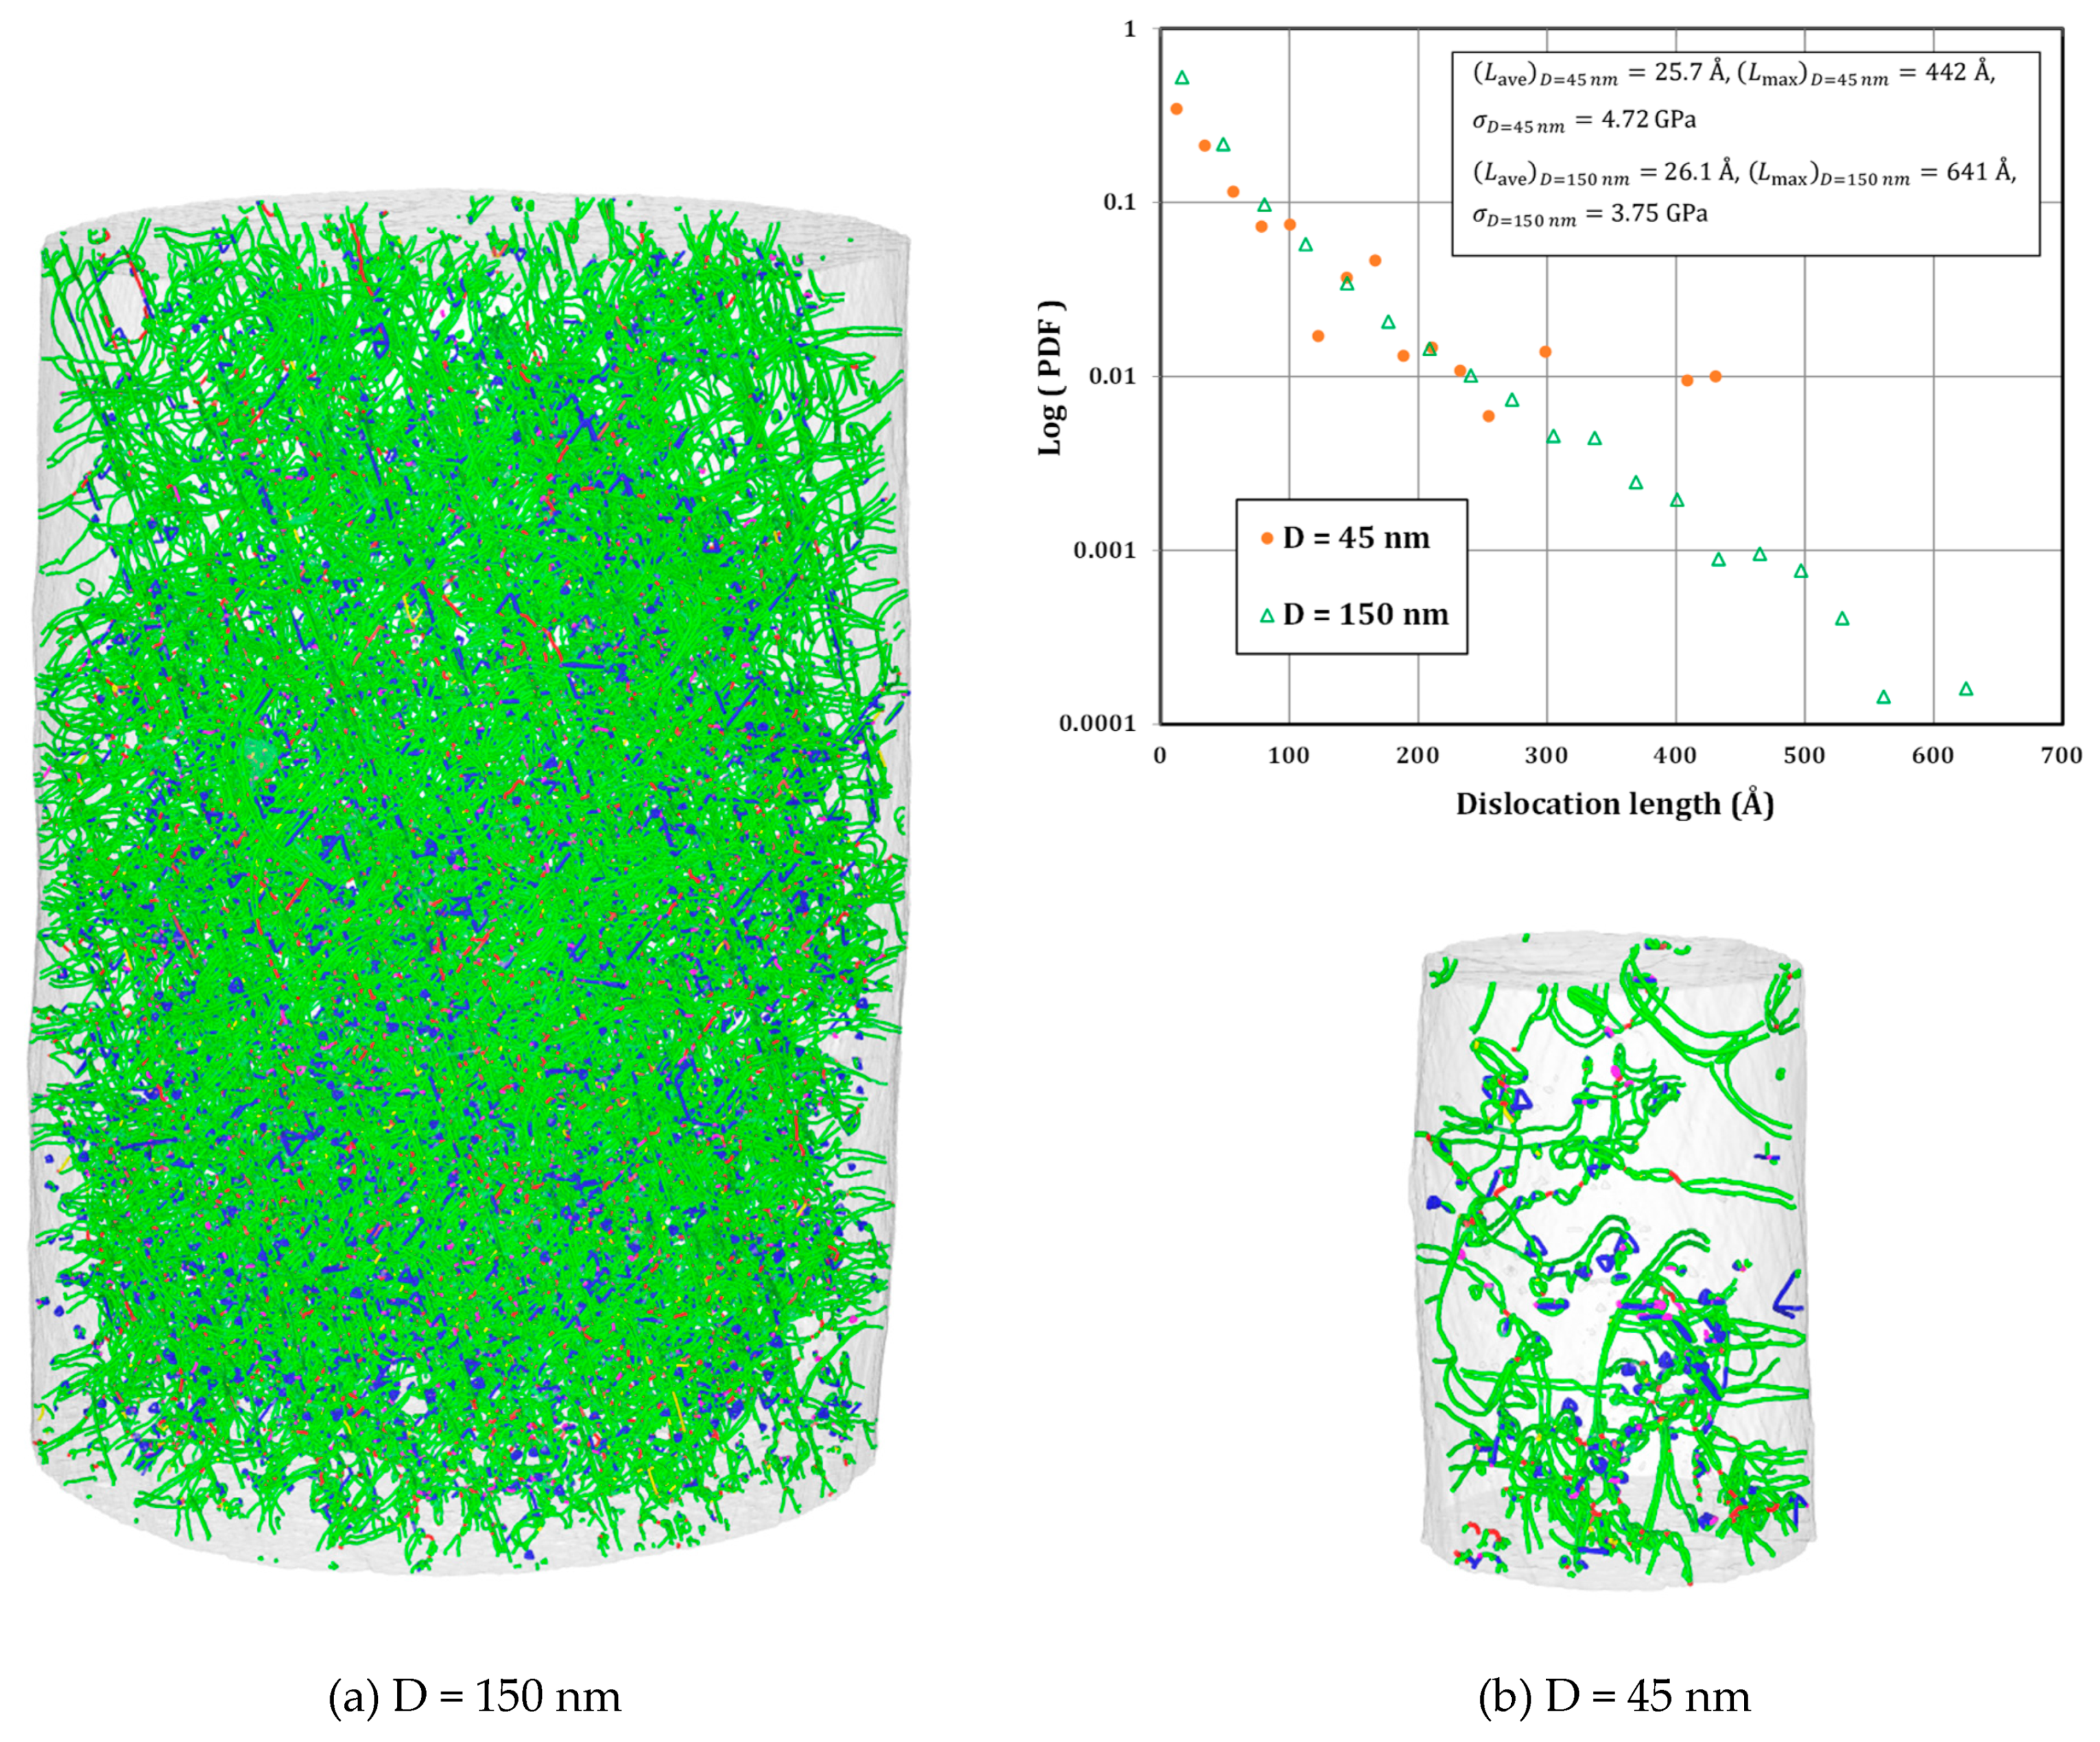
Voyiadjis and Yaghoobi [16] investigated the dislocation network to address the observed results. Accordingly, they studied the dislocation length distributions for both pillars at all simulated strain rates. In order to present the dislocation length distribution in each sample, the corresponding distribution is averaged at five strains values of 0.1, 0.125, 0.15, 0.175, and 0.2. The probability density function (PDF) of the pillar at simulated strain rates is presented in Figure 24. The maximum PDF of bulk sample belongs to the some dislocation lengths at the middle of the distribution, and the distribution can be described by a Weibull distribution function, as described by El-Awady et al. [71]. Figure 24, however, shows that most of the dislocation lengths are populated in the first length bean with the smallest length, and the maximum PDF belongs to the bean with the smallest dislocation length. This can be attributed to the cross-slip mechanism which is significant in samples with confined volumes. In order to further investigate the results, the dislocation networks of the pillars with D = 45 nm and D = 150 are presented in Figure 25 at the strain of and strain rate of . The dislocation network shows that the cross-slip is the dominant deformation mechanism, which is in line with the results presented in Figure 24. Hussein et al. [70] reported a similar pattern by using the DDD simulation.
Voyiadjis and Yaghoobi [16] successfully captured the observed coupling effects between the pillar diameter and applied strain rate by studying the largest dislocation length . They obtained the as an average of largest dislocation lengths at five strain values of 0.1, 0.125, 0.15, 0.175, and 0.2 for each pillar size and strain rate. In the case of small pillar with diameter of 22.5 nm, the values of subjected to different strain rates of , , and are 377.9 , 415 , and 432.9 , respectively. values for largest pillar with the diameter of 0.15 μm subjected to different strain rates of , , and are 605.8 , 783.4 , and 1095.6 , respectively. The ratio of in the larger sample comparted to the one in the small sample, i.e., , is evaluated for different rates of , , and are 1.6, 1.89, and 2.53, respectively. It shows that, as the strain rates increases, the value of decreases. This can elaborate the observed behavior in Figure 23, i.e., higher strain rates lead to smaller size effects.
5. Conclusions
The size effect in crystalline metals during micropillar compression tests is reviewed in the current work. The focus of this work is to investigate the governing mechanisms of size effects during the micropillar compression test. The micropillar compression test is a novel approach to study the size effects in metallic samples of confined volumes. Both experimental and atomistic simulation study of size effects during micropillar compression have been reviewed. In the case of experimental investigation of the micropillar compression test:
- The size effects in crystalline metals can be successfully captured using the following power law equation:The constants in this equation depend on the crystalline structure.
- In the case of FCC metals, the value of is obtained for the data available in the literature.
- In the case of BCC metals, the value of varies for different materials. Many factors including the residual Peierls barrier, temperature, and applied strain rate may influence the size effects in BCC pillars. For example, a higher residual Peierls stress leads to a lower power law exponent.
- In the case of HCP metals, the observed size effects depend on the activated deformation mechanism, which can be basal, prismatic, and pyramidal slip systems or twinning. For example, in the case of basal slip mode, the slope is close to FCC metals, i.e., ; however, for the prismatic slip mode, the power law exponent is about 0.44.
- Three mechanisms of source truncation, source exhaustion hardening, and weakest link theory are introduced to describe the observed size effects during micropillar compression tests.
In the case of atomistic simulation of a micropillar compression test:
- For very small samples, dislocation starvation becomes the dominant mechanism of size effect, in a way that all of the dislocations leave the sample, which leads to an elastic response until another set of dislocations are generated from the pillar surface.
- Increasing the sample length, all of the dislocations cannot escape from the sample surface and no more starvation is observed. However, general source exhaustion mechanism can still be observed in a way that, although the dislocation starvation does not occur, the dislocations are still escaping from the sample surface. If the remaining dislocation density cannot sustain the applied plastic flow, the stress should be increased, which leads to the observed size effects.
- The results show that, due to the high strain rate of atomistic simulation, the critical pillar diameter at which there is no more size effects for pillars with a larger diameter is smaller than that of the quasi-static experiment. Accordingly, the results show that higher strain rate leads to less size effects.
- The coupling effects of pillar diameter and applied strain rate are presented. The results show that, as the strain rate increases, less size effects will be observed. This can be explained using the dislocation length distribution in a way that, as the strain rate increases, the size of the maximum dislocation length decreases, irrespective of the sample size. Accordingly, the responses of the samples with different diameters will converge, and there will be no more size effects. Ultimately, in the case of quasi-static experiments with very low strain rate, the size of maximum dislocation length can be scaled by the diameter of the pillar, while, at very high strain rates, the maximum dislocation length will be almost independent of the pillar size.
Author Contributions
Conceptualization, S.S., G.Z.V., S.H.A., V.H. and M.Y.; Methodology, S.S., G.Z.V., S.H.A., V.H. and M.Y.; Formal analysis, S.S. and M.Y.; Investigation, S.S., G.Z.V., S.H.A., V.H. and M.Y.; resources, G.Z.V. and M.Y.; Data curation, S.S., S.H.A., V.H. and M.Y.; writing—original draft preparation, S.S. and M.Y.; writing—review and editing, S.S., G.Z.V., S.H.A., V.H. and M.Y.; visualization, S.S., S.H.A., V.H. and M.Y.; supervision, S.S., G.Z.V. and M.Y.; project administration, S.S., G.Z.V. and M.Y.; funding acquisition, G.Z.V. and M.Y.
Funding
The current work is partially funded by the NSF EPSCoR CIMM project under award #OIA-1541079. In addition, this work is partially supported by the U.S. Department of Energy, Office of Basic Energy Sciences, Division of Materials Sciences and Engineering under Award#DE-SC0008637 as part of the Center for Predictive Integrated Structural Materials Science (PRISMS Center) at the University of Michigan. We also acknowledge the financial cost-share support of the University of Michigan College of Engineering and Office of the Vice President for Research.
Acknowledgments
George Z. Voyiadjis acknowledges the funding from NSF EPSCoR CIMM project under award #OIA-1541079. In addition, Mohammadreza Yaghoobi acknowledges the funding from U.S. Department of Energy, Office of Basic Energy Sciences, Division of Materials Sciences and Engineering under Award#DE-SC0008637 as part of the Center for Predictive Integrated Structural Materials Science (PRISMS Center) at the University of Michigan. Mohammadreza Yaghoobi also acknowledges the financial cost-share support of the University of Michigan College of Engineering and Office of the Vice President for Research.
Conflicts of Interest
The authors declare no conflict of interest.
Nomenclature
| The measured yield or flow stress | |
| Strain | |
| Strain rate | |
| Pillar diameter | |
| Power law exponent | |
| FCC | Face Centered Cubic |
| BCC | Body Centered Cubic |
| HCP | Hexagonal close packed |
| Critical resolved shear stress | |
| Shear modulus | |
| Burgers vector | |
| Number of pins inside a pillar | |
| The maximum distance of a pin from the free surface | |
| Pillar radius | |
| Major axis of the elliptical glide plane | |
| Angle between the primary slip plane and the loading axis | |
| Mean effective dislocation source length | |
| Friction stress | |
| Dislocation density | |
| Total length of mobile dislocations | |
| Average length of dislocation segments | |
| Pillar height | |
| Stacking fault energy | |
| Dislocation loss rate | |
| Density of mobile dislocations | |
| Dislocation mean free path | |
| Initial dislocation content | |
| M | Schmid factor |
| Velocity of dislocation | |
| Plastic strain induced by the movement of mobile dislocations | |
| Source hardening constant | |
| Average dislocation source length | |
| Average strength of the forest dislocations | |
| Scalar density of the forest dislocations | |
| Mean-field limit | |
| Probability density function | |
| Largest dislocation length |
References
- Voyiadjis, G.Z.; Yaghoobi, M. Chapter 1—Introduction: Size effects in materials. In Size Effects in Plasticity; Voyiadjis, G.Z., Yaghoobi, M., Eds.; Academic Press: Oxford, UK, 2019; pp. 1–79. [Google Scholar] [CrossRef]
- Uchic, M.D.; Shade, P.A.; Dimiduk, D.M. Plasticity of micrometer-scale single crystals in compression. Ann. Rev. Mater. Res. 2009, 39, 361–386. [Google Scholar] [CrossRef]
- Greer, J.R.; De Hosson, J.T.M. Plasticity in small-sized metallic systems: Intrinsic versus extrinsic size effect. Prog. Mater. Sci. 2011, 56, 654–724. [Google Scholar] [CrossRef]
- Kraft, O.; Gruber, P.A.; Mönig, R.; Weygand, D. Plasticity in confined dimensions. Ann. Rev. Mater. Res. 2010, 40, 293–317. [Google Scholar] [CrossRef]
- Rao, S.; Hashemi Astaneh, S.; Villanueva, J.; Silva, F.; Takoudis, C.; Bijukumar, D.; Souza, J.C.M.; Mathew, M.T. Physicochemical and in-vitro biological analysis of bio-functionalized titanium samples in a protein-rich medium. J. Mech. Behav. Biomed. Mater. 2019, 96, 152–164. [Google Scholar] [CrossRef] [PubMed]
- Hashemi Astaneh, S.; Jursich, G.; Sukotjo, C.; Takoudis, C.G. Surface and subsurface film growth of titanium dioxide on polydimethylsiloxane by atomic layer deposition. Appl. Surf. Sci. 2019, 493, 779–786. [Google Scholar] [CrossRef]
- Uchic, M.D.; Dimiduk, D.M. A methodology to investigate size scale effects in crystalline plasticity using uniaxial compression testing. Mater. Sci. Eng. A 2005, 400–401, 268–278. [Google Scholar] [CrossRef]
- Uchic, M.D.; Dimiduk, D.M.; Florando, J.N.; Nix, W.D. Exploring specimen size effects in plastic deformation of Ni3(Al, Ta). MRS Proc. 2003, 753, BB1.4–BB1.4.6. [Google Scholar] [CrossRef]
- Uchic, M.D.; Dimiduk, D.M.; Florando, J.N.; Nix, W.D. Sample dimensions influence strength and crystal plasticity. Science 2004, 305, 986–989. [Google Scholar] [CrossRef]
- Voyiadjis, G.Z.; Yaghoobi, M. Review of nanoindentation size effect: Experiments and atomistic simulation. Crystals 2017, 7, 321. [Google Scholar] [CrossRef]
- Papanikolaou, S.; Cui, Y.; Ghoniem, N. Avalanches and plastic flow in crystal plasticity: An overview. Model. Simul. Mater. Sci. Eng. 2017, 26, 013001. [Google Scholar] [CrossRef]
- Bringa, E.M.; Rosolankova, K.; Rudd, R.E.; Remington, B.A.; Wark, J.S.; Duchaineau, M.; Kalantar, D.H.; Hawreliak, J.; Belak, J. Shock deformation of face-centred-cubic metals on subnanosecond timescales. Nat. Mater. 2006, 5, 805–809. [Google Scholar] [CrossRef] [PubMed]
- Diao, J.; Gall, K.; Dunn, M.L.; Zimmerman, J.A. Atomistic simulations of the yielding of gold nanowires. Acta Mater. 2006, 54, 643–653. [Google Scholar] [CrossRef]
- Sansoz, F. Atomistic processes controlling flow stress scaling during compression of nanoscale face-centered-cubic crystals. Acta Mater. 2011, 59, 3364–3372. [Google Scholar] [CrossRef]
- Tucker, G.J.; Aitken, Z.H.; Greer, J.R.; Weinberger, C.R. The mechanical behavior and deformation of bicrystalline nanowires. Model. Simul. Mater. Sci. Eng. 2013, 21, 015004. [Google Scholar] [CrossRef]
- Voyiadjis, G.Z.; Yaghoobi, M. Size and strain rate effects in metallic samples of confined volumes: Dislocation length distribution. Scr. Mater. 2017, 130, 182–186. [Google Scholar] [CrossRef]
- Weinberger, C.R.; Cai, W. Surface-controlled dislocation multiplication in metal micropillars. Proc. Natl. Acad. Sci. USA 2008, 105, 14304–14307. [Google Scholar] [CrossRef] [Green Version]
- Weinberger, C.R.; Jennings, A.T.; Kang, K.; Greer, J.R. Atomistic simulations and continuum modeling of dislocation nucleation and strength in gold nanowires. J. Mech. Phys. Solids 2012, 60, 84–103. [Google Scholar] [CrossRef]
- Weinberger, C.R.; Tucker, G.J. Atomistic simulations of dislocation pinning points in pure face-centered-cubic nanopillars. Model. Simul. Mater. Sci. Eng. 2012, 20, 075001. [Google Scholar] [CrossRef]
- Xu, S.; Guo, Y.F.; Ngan, A.H.W. A molecular dynamics study on the orientation, size, and dislocation confinement effects on the plastic deformation of Al nanopillars. Int. J. Plast. 2013, 43, 116–127. [Google Scholar] [CrossRef]
- Yaghoobi, M.; Voyiadjis, G.Z. Size effects in fcc crystals during the high rate compression test. Acta Mater. 2016, 121, 190–201. [Google Scholar] [CrossRef]
- Yaghoobi, M.; Voyiadjis, G.Z. Microstructural investigation of the hardening mechanism in fcc crystals during high rate deformations. Comput. Mater. Sci. 2017, 138, 10–15. [Google Scholar] [CrossRef]
- Yaghoobi, M.; Voyiadjis, G.Z. The effects of temperature and strain rate in fcc and bcc metals during extreme deformation rates. Acta Mater. 2018, 151, 1–10. [Google Scholar] [CrossRef]
- Voyiadjis, G.Z.; Yaghoobi, M. Chapter 5—Molecular dynamics. In Size Effects in Plasticity; Voyiadjis, G.Z., Yaghoobi, M., Eds.; Academic Press: Oxford, UK, 2019; pp. 275–355. [Google Scholar] [CrossRef]
- Dimiduk, D.M.; Uchic, M.D.; Parthasarathy, T.A. Size-affected single-slip behavior of pure nickel microcrystals. Acta Mater. 2005, 53, 4065–4077. [Google Scholar] [CrossRef]
- Greer, J.R.; Oliver, W.C.; Nix, W.D. Size dependence of mechanical properties of gold at the micron scale in the absence of strain gradients. Acta Mater. 2005, 53, 1821–1830. [Google Scholar] [CrossRef]
- Greer, J.R.; Nix, W.D. Nanoscale gold pillars strengthened through dislocation starvation. Phys. Rev. B 2006, 73, 245410. [Google Scholar] [CrossRef] [Green Version]
- Volkert, C.A.; Lilleodden, E.T. Size effects in the deformation of sub-micron Au columns. Philos. Mag. 2006, 86, 5567–5579. [Google Scholar] [CrossRef]
- Kiener, D.; Motz, C.; Schöberl, T.; Jenko, M.; Dehm, G. Determination of mechanical properties of copper at the micron scale. Adv. Eng. Mater. 2006, 8, 1119–1125. [Google Scholar] [CrossRef]
- Kraft, O.; Volkert, C.A. Size Effects on Deformation and Fatigue of Thin Films and Small Structures; CAMTEC Cambridge University: Cambridge, UK, 2006. [Google Scholar]
- Frick, C.P.; Clark, B.G.; Orso, S.; Schneider, A.S.; Arzt, E. Size effect on strength and strain hardening of small-scale [1 1 1] nickel compression pillars. Mater. Sci Eng. A 2008, 489, 319–329. [Google Scholar] [CrossRef]
- Ng, K.S.; Ngan, A.H.W. Stochastic nature of plasticity of aluminum micro-pillars. Acta Mater. 2008, 56, 1712–1720. [Google Scholar] [CrossRef]
- Lee, S.-W.; Han, S.M.; Nix, W.D. Uniaxial compression of fcc Au nanopillars on an MgO substrate: The effects of prestraining and annealing. Acta Mater. 2009, 57, 4404–4415. [Google Scholar] [CrossRef]
- Jennings, A.T.; Burek, M.J.; Greer, J.R. Microstructure versus size: Mechanical properties of electroplated single crystalline Cu nanopillars. Phys. Rev. Lett. 2010, 104, 135503. [Google Scholar] [CrossRef] [PubMed]
- Kiener, D.; Minor, A.M. Source-controlled yield and hardening of Cu (1 0 0) studied by in situ transmission electron microscopy. Acta Mater. 2011, 59, 1328–1337. [Google Scholar] [CrossRef]
- Jennings, A.T.; Li, J.; Greer, J.R. Emergence of strain-rate sensitivity in Cu nanopillars: Transition from dislocation multiplication to dislocation nucleation. Acta Mater. 2011, 59, 5627–5637. [Google Scholar] [CrossRef]
- Kunz, A.; Pathak, S.; Greer, J.R. Size effects in Al nanopillars: Single crystalline vs. bicrystalline. Acta Mater. 2011, 59, 4416–4424. [Google Scholar] [CrossRef]
- Gu, R.; Ngan, A.H.W. Dislocation arrangement in small crystal volumes determines power-law size dependence of yield strength. J. Mech. Phys. Solids 2013, 61, 1531–1542. [Google Scholar] [CrossRef] [Green Version]
- Schneider, A.S.; Kaufmann, D.; Clark, B.G.; Frick, C.P.; Gruber, P.A.; Mönig, R.; Kraft, O.; Arzt, E. Correlation between critical temperature and strength of small-scale bcc pillars. Phys. Rev. Lett. 2009, 103, 105501. [Google Scholar] [CrossRef]
- Kim, J.-Y.; Jang, D.; Greer, J.R. Tensile and compressive behavior of tungsten, molybdenum, tantalum and niobium at the nanoscale. Acta Mater. 2010, 58, 2355–2363. [Google Scholar] [CrossRef]
- Han, S.M.; Bozorg-Grayeli, T.; Groves, J.R.; Nix, W.D. Size effects on strength and plasticity of vanadium nanopillars. Scr. Mater. 2010, 63, 1153–1156. [Google Scholar] [CrossRef]
- Rogne, B.R.S.; Thaulow, C. Strengthening mechanisms of iron micropillars. Philos. Mag. 2015, 95, 1814–1828. [Google Scholar] [CrossRef]
- Huang, R.; Li, Q.-J.; Wang, Z.-J.; Huang, L.; Li, J.; Ma, E.; Shan, Z.-W. Flow stress in submicron BCC iron single crystals: Sample-size-dependent strain-rate sensitivity and rate-dependent size strengthening. Mater. Res. Lett. 2015, 3, 121–127. [Google Scholar] [CrossRef]
- Yilmaz, H. Mechanical Properties of Body-Centred Cubic Nanopillars. Ph.D. Thesis, University of Manchester, Manchester, UK, 2018. [Google Scholar]
- Sun, Q.; Guo, Q.; Yao, X.; Xiao, L.; Greer, J.R.; Sun, J. Size effects in strength and plasticity of single-crystalline titanium micropillars with prismatic slip orientation. Scr. Mater. 2011, 65, 473–476. [Google Scholar] [CrossRef]
- Lilleodden, E. Microcompression study of Mg (0 0 0 1) single crystal. Scr. Mater. 2010, 62, 532–535. [Google Scholar] [CrossRef]
- Byer, C.M.; Li, B.; Cao, B.; Ramesh, K.T. Microcompression of single-crystal magnesium. Scr. Mater. 2010, 62, 536–539. [Google Scholar] [CrossRef]
- Ye, J.; Mishra, R.K.; Sachdev, A.K.; Minor, A.M. In situ TEM compression testing of Mg and Mg–0.2wt.% Ce single crystals. Scr. Mater. 2011, 64, 292–295. [Google Scholar] [CrossRef]
- Yu, Q.; Shan, Z.-W.; Li, J.; Huang, X.; Xiao, L.; Sun, J.; Ma, E. Strong crystal size effect on deformation twinning. Nature 2010, 463, 335–338. [Google Scholar] [CrossRef]
- Kim, G.S. Small Volume Investigation of Slip and Twinning in Magnesium Single Crystals. Ph.D. Thesis, Universite DE Grenoble, Saint-Martin-d’Hères, France, 2011. [Google Scholar]
- Sim, G.-D.; Kim, G.; Lavenstein, S.; Hamza, M.H.; Fan, H.; El-Awady, J.A. Anomalous hardening in magnesium driven by a size-dependent transition in deformation modes. Acta Mater. 2018, 144, 11–20. [Google Scholar] [CrossRef] [Green Version]
- Parthasarathy, T.A.; Rao, S.I.; Dimiduk, D.M.; Uchic, M.D.; Trinkle, D.R. Contribution to size effect of yield strength from the stochastics of dislocation source lengths in finite samples. Scr. Mater. 2007, 56, 313–316. [Google Scholar] [CrossRef]
- Rao, S.I.; Dimiduk, D.M.; Tang, M.; Parthasarathy, T.A.; Uchic, M.D.; Woodward, C. Estimating the strength of single-ended dislocation sources in micron-sized single crystals. Philos. Mag. 2007, 87, 4777–4794. [Google Scholar] [CrossRef]
- Rao, S.I.; Dimiduk, D.M.; Parthasarathy, T.A.; Uchic, M.D.; Tang, M.; Woodward, C. Athermal mechanisms of size-dependent crystal flow gleaned from three-dimensional discrete dislocation simulations. Acta Mater. 2008, 56, 3245–3259. [Google Scholar] [CrossRef]
- Zhou, C.; Beyerlein, I.J.; Lesar, R. Plastic deformation mechanisms of fcc single crystals at small scales. Acta Mater. 2011, 59, 7673–7682. [Google Scholar] [CrossRef]
- Norfleet, D.M.; Dimiduk, D.M.; Polasik, S.J.; Uchic, M.D.; Mills, M.J. Dislocation structures and their relationship to strength in deformed nickel microcrystals. Acta Mater. 2008, 56, 2988–3001. [Google Scholar] [CrossRef]
- Voyiadjis, G.Z.; Yaghoobi, M. Role of grain boundary on the sources of size effects. Comput. Mater. Sci. 2016, 117, 315–329. [Google Scholar] [CrossRef] [Green Version]
- Voyiadjis, G.Z.; Yaghoobi, M. Large scale atomistic simulation of size effects during nanoindentation: Dislocation length and hardness. Mater. Sci. Eng. A 2015, 634, 20–31. [Google Scholar] [CrossRef]
- Yaghoobi, M.; Voyiadjis, G.Z. Effect of boundary conditions on the MD simulation of nanoindentation. Comput. Mater. Sci. 2014, 95, 626–636. [Google Scholar] [CrossRef]
- Yaghoobi, M.; Voyiadjis, G.Z. Atomistic simulation of size effects in single-crystalline metals of confined volumes during nanoindentation. Comput. Mater. Sci. 2016, 111, 64–73. [Google Scholar] [CrossRef]
- Voyiadjis, G.Z.; Yaghoobi, M. Size Effects During Nanoindentation: Molecular Dynamics Simulation. In Handbook of Nonlocal Continuum Mechanics for Materials and Structures; Voyiadjis, G.Z., Ed.; Springer: Cham, Switzerland, 2019; pp. 39–76. [Google Scholar]
- Plimpton, S. Fast parallel algorithms for short-range molecular dynamics. J. Comput. Phys. 1995, 117, 1–19. [Google Scholar] [CrossRef]
- Mishin, Y.; Farkas, D.; Mehl, M.J.; Papaconstantopoulos, D.A. Interatomic potentials for monoatomic metals from experimental data and ab initio calculations. Phys. Rev. B Condens. Matter Mater. Phys. 1999, 59, 3393–3407. [Google Scholar] [CrossRef]
- Stukowski, A. Structure identification methods for atomistic simulations of crystalline materials. Model. Simul. Mater. Sci. Eng. 2012, 20, 045021. [Google Scholar] [CrossRef]
- Stukowski, A.; Albe, K. Extracting dislocations and non-dislocation crystal defects from atomistic simulation data. Model. Simul. Mater. Sci. Eng. 2010, 18, 085001. [Google Scholar] [CrossRef]
- Stukowski, A.; Bulatov, V.V.; Arsenlis, A. Automated identification and indexing of dislocations in crystal interfaces. Model. Simul. Mater. Sci. Eng. 2012, 20, 085007. [Google Scholar] [CrossRef]
- Stukowski, A. Visualization and Analysis of Atomistic Simulation Data with OVITO-the Open Visualization Tool. Model. Simul. Mater. Sci. Eng. 2010, 18, 015012. [Google Scholar] [CrossRef]
- Henderson, A. Paraview Guide, A Parallel Visualization Application; Kitware Inc.: Clifton Park, NY, USA, 2007. [Google Scholar]
- Rao, S.I.; Dimiduk, D.M.; Parthasarathy, T.A.; Uchic, M.D.; Woodward, C. Atomistic simulations of surface cross-slip nucleation in face-centered cubic nickel and copper. Acta Mater. 2013, 61, 2500–2508. [Google Scholar] [CrossRef]
- Hussein, A.M.; Rao, S.I.; Uchic, M.D.; Dimiduk, D.M.; El-Awady, J.A. Microstructurally based cross-slip mechanisms and their effects on dislocation microstructure evolution in fcc crystals. Acta Mater. 2015, 85, 180–190. [Google Scholar] [CrossRef]
- El-Awady, J.A.; Wen, M.; Ghoniem, N.M. The role of the weakest-link mechanism in controlling the plasticity of micropillars. J. Mech. Phy. Solids 2009, 57, 32–50. [Google Scholar] [CrossRef]
Figure 1.
The images of Ni super alloy pillars prepared by focused-ion-beam milling: (a) A Ni3(Al, Hf) single crystal pillar with the diameter of 43 μm; (b) a single-crystal Ni super alloy (UM-F19) pillar with the diameter of 2.3 μm (after Uchic et al. [7]).
Figure 1.
The images of Ni super alloy pillars prepared by focused-ion-beam milling: (a) A Ni3(Al, Hf) single crystal pillar with the diameter of 43 μm; (b) a single-crystal Ni super alloy (UM-F19) pillar with the diameter of 2.3 μm (after Uchic et al. [7]).

Figure 2.
Stress–strain curves of bulk and micron sized Ni3Al-Ta pillars under uniaxial compression at room temperature (after Uchic et al. [9]).
Figure 2.
Stress–strain curves of bulk and micron sized Ni3Al-Ta pillars under uniaxial compression at room temperature (after Uchic et al. [9]).

Figure 3.
Variation of the critical resolved shear stress normalized by the shear modulus versus the sample diameter normalized by the Burgers vector in FCC metals. The original experimental data have been reported by Dimiduk et al. [25], Greer et al. [26], Greer and Nix [27], Volkert and Lilleodden [28], Kiener et al. [29], Kraft and Volkert [30], Frick et al. [31], Ng and Ngan [32], Lee et al. [33], Jennings et al. [34], Kiener and Minor [35], Jennings et al. [36], Kunz et al. [37], and Gu and Ngan [38].

Figure 4.
Variation of the critical resolved shear stress normalized by the shear modulus versus the sample diameter normalized by the Burgers vector in BCC metals. The original experimental data is reported by Schneider et al. [39], Kim et al. [40], Han et al. [41], Rogne and Thaulow [42], Huang et al. [43], and Yilmaz [44].

Figure 5.
Comparison of power law exponents versus residual Peierls barrier at room temperature in BCC metals (after Greer and De Hosson [3]).
Figure 5.
Comparison of power law exponents versus residual Peierls barrier at room temperature in BCC metals (after Greer and De Hosson [3]).

Figure 6.
Variation of the critical resolved shear stress normalized by the shear modulus versus the sample diameter normalized by the Burgers vector in HCP metals. The original experimental data are reported by Byer et al. [47], Yu et al. [49], Lilleodden [46], Ye et al. [48], Sun et al. [45], Kim [50], and Sim et al. [51].

Figure 7.
Size effects in pillars with different sizes for: (a) Ni; (b) Au. The original experimental data has been reported by Uchic et al. [7], Dimiduk et al. [25], Greer et al. [26], and Volkert and Lilleodden [28] (after Parthasarathy et al. [52]).

Figure 8.
Numerically predicted evolution of engineering stress and dislocation density versus total strain in a series of single crystal Ni micropillars of different diameters (after Zhou et al. [55]).
Figure 8.
Numerically predicted evolution of engineering stress and dislocation density versus total strain in a series of single crystal Ni micropillars of different diameters (after Zhou et al. [55]).

Figure 9.
Evolution of engineering stress and dislocation density versus total strain in a Ni pillar with the diameter of 1 μm during compression simulated using 3D discrete dislocation dynamics (after Zhou et al. [55]).
Figure 9.
Evolution of engineering stress and dislocation density versus total strain in a Ni pillar with the diameter of 1 μm during compression simulated using 3D discrete dislocation dynamics (after Zhou et al. [55]).

Figure 10.
The dislocation network before and after the exhaustion hardening (after Zhou et al. [55]).
Figure 10.
The dislocation network before and after the exhaustion hardening (after Zhou et al. [55]).

Figure 11.
A comparison between the lower and upper bounds of Equation (9) with the experimentally measured proportional limits of Ni micropillars (after Norfleet et al. [56]).
Figure 11.
A comparison between the lower and upper bounds of Equation (9) with the experimentally measured proportional limits of Ni micropillars (after Norfleet et al. [56]).

Figure 12.
A comparison between the lower and upper bounds of Equation (9) corrected by increasing the dislocation density at smaller samples with the experimentally measured proportional limits of Ni micropillars (after Norfleet et al. [56]).
Figure 12.
A comparison between the lower and upper bounds of Equation (9) corrected by increasing the dislocation density at smaller samples with the experimentally measured proportional limits of Ni micropillars (after Norfleet et al. [56]).

Figure 13.
The responses of copper pillars with diameters of 10.8 nm, 21.7 nm, and 43.4 nm during uniaxial compression. Evolution of dislocation density is represented by a fraction of HCP atoms. (a,c,e) Variation of the fraction of HCP atoms versus the true strain. (b,d,f) Variation of true stress versus true strain (after Sansoz [14]).

Figure 14.
The responses of samples during micropillar compression test in the cases of pillars with H = 45 nm and different diameters of D = 22.5 nm, 45 nm, 90 nm, and 135 nm (after Yaghoobi and Voyiadjis [21]).
Figure 14.
The responses of samples during micropillar compression test in the cases of pillars with H = 45 nm and different diameters of D = 22.5 nm, 45 nm, 90 nm, and 135 nm (after Yaghoobi and Voyiadjis [21]).

Figure 15.
The responses of samples during micropillar compression test in the cases of pillars with H = 45 nm and different diameters of: (a) D = 22.5 nm; (b) D = 45 nm; (c) D = 90 nm; (d) D = 135 nm (after Yaghoobi and Voyiadjis and [21]).
Figure 15.
The responses of samples during micropillar compression test in the cases of pillars with H = 45 nm and different diameters of: (a) D = 22.5 nm; (b) D = 45 nm; (c) D = 90 nm; (d) D = 135 nm (after Yaghoobi and Voyiadjis and [21]).


Figure 16.
The comparison between the responses of the pillar with H = 75 nm and D = 135 nm versus the pillar with H = 0.3 μm and D = 0.15 μm during micropillar compression test (after Yaghoobi and Voyiadjis and [21]).
Figure 16.
The comparison between the responses of the pillar with H = 75 nm and D = 135 nm versus the pillar with H = 0.3 μm and D = 0.15 μm during micropillar compression test (after Yaghoobi and Voyiadjis and [21]).

Figure 17.
The responses of pristine and pre-strained samples during micropillar compression test in the cases of pillar with H = 45 nm and different diameters of 22.5 nm and 135 nm: (a) true stress–strain; (b) dislocation density–strain (after Yaghoobi and Voyiadjis [21]).
Figure 17.
The responses of pristine and pre-strained samples during micropillar compression test in the cases of pillar with H = 45 nm and different diameters of 22.5 nm and 135 nm: (a) true stress–strain; (b) dislocation density–strain (after Yaghoobi and Voyiadjis [21]).

Figure 18.
The responses of pristine and pre-strained samples during micropillar compression test for the pillar with H = 0.3 μm and D = 0.15 μm (after Yaghoobi and Voyiadjis [21]).
Figure 18.
The responses of pristine and pre-strained samples during micropillar compression test for the pillar with H = 0.3 μm and D = 0.15 μm (after Yaghoobi and Voyiadjis [21]).

Figure 19.
The response of the pillar with D = 15 nm and H = 30 nm during micropillar compression test (after Yaghoobi and Voyiadjis [21]).
Figure 19.
The response of the pillar with D = 15 nm and H = 30 nm during micropillar compression test (after Yaghoobi and Voyiadjis [21]).

Figure 20.
The dislocation network of the pillar with D = 15 nm and H = 30 nm during micropillar compression test at different strains of: (a) ε = 0.0517; (b) ε = 0.053; (c) ε = 0.055; (d) ε = 0.065; (e) ε = 0.1117; (f) ε = 0.1233; (g) ε = 0.1733; (h) ε = 0.2133; (i) ε = 0.23 (after Yaghoobi and Voyiadjis [21]).

Figure 21.
The dislocation network of the pillar with D = 0.15 μm and H = 0.3 μm during micropillar compression test at different strains of: (a) ε = 0.0233; (b) ε = 0.0433; (c) ε = 0.1416 (after Yaghoobi and Voyiadjis [21]).
Figure 21.
The dislocation network of the pillar with D = 0.15 μm and H = 0.3 μm during micropillar compression test at different strains of: (a) ε = 0.0233; (b) ε = 0.0433; (c) ε = 0.1416 (after Yaghoobi and Voyiadjis [21]).

Figure 22.
The responses of the samples during micropillar compression test with different strain rates of , , and in the cases of pillars with the diameters of: (a) D = 45 nm; (b) D = 150 nm (after Voyiadjis and Yaghoobi [16]).
Figure 22.
The responses of the samples during micropillar compression test with different strain rates of , , and in the cases of pillars with the diameters of: (a) D = 45 nm; (b) D = 150 nm (after Voyiadjis and Yaghoobi [16]).


Figure 23.
The responses of pillars with D = 45 nm and D = 150 nm during micropillar compression test with different strain rates of: (a) ; (b) ; (c) (after Voyiadjis and Yaghoobi [16]).
Figure 23.
The responses of pillars with D = 45 nm and D = 150 nm during micropillar compression test with different strain rates of: (a) ; (b) ; (c) (after Voyiadjis and Yaghoobi [16]).

Figure 24.
Probability distribution function of dislocation length at different strain rates and pillars with the diameters of: (a) D = 45 nm; (b) D = 150 nm (after Voyiadjis and Yaghoobi [16]).
Figure 24.
Probability distribution function of dislocation length at different strain rates and pillars with the diameters of: (a) D = 45 nm; (b) D = 150 nm (after Voyiadjis and Yaghoobi [16]).

Figure 25.
The dislocation network at the strain of subjected to the strain rate of and pillar diameters of: (a) D = 150 nm; (b) D = 45 nm (after Voyiadjis and Yaghoobi [16]).
Figure 25.
The dislocation network at the strain of subjected to the strain rate of and pillar diameters of: (a) D = 150 nm; (b) D = 45 nm (after Voyiadjis and Yaghoobi [16]).

© 2019 by the authors. Licensee MDPI, Basel, Switzerland. This article is an open access article distributed under the terms and conditions of the Creative Commons Attribution (CC BY) license (http://creativecommons.org/licenses/by/4.0/).
Share and Cite
MDPI and ACS Style
Shahbeyk, S.; Voyiadjis, G.Z.; Habibi, V.; Astaneh, S.H.; Yaghoobi, M. Review of Size Effects during Micropillar Compression Test: Experiments and Atomistic Simulations. Crystals 2019, 9, 591. https://doi.org/10.3390/cryst9110591
AMA Style
Shahbeyk S, Voyiadjis GZ, Habibi V, Astaneh SH, Yaghoobi M. Review of Size Effects during Micropillar Compression Test: Experiments and Atomistic Simulations. Crystals. 2019; 9(11):591. https://doi.org/10.3390/cryst9110591
Chicago/Turabian StyleShahbeyk, Sharif, George Z. Voyiadjis, Vahid Habibi, Sarah Hashemi Astaneh, and Mohammadreza Yaghoobi. 2019. "Review of Size Effects during Micropillar Compression Test: Experiments and Atomistic Simulations" Crystals 9, no. 11: 591. https://doi.org/10.3390/cryst9110591
Note that from the first issue of 2016, this journal uses article numbers instead of page numbers. See further details here.