Surface Integrities of Different Trajectories in Belt Grinding for Pure Iron Functional Performance Test Pieces


The State Key Laboratory of Mechanical Transmissions, Chongqing University, No. 174, Shazhengjie, Shapingba, Chongqing 400044, China
*
Author to whom correspondence should be addressed.
Crystals 2019, 9(3), 123; https://doi.org/10.3390/cryst9030123
Submission received: 21 January 2019
/
Revised: 19 February 2019
/
Accepted: 22 February 2019
/
Published: 27 February 2019
Abstract
:In order to reduce the influence of surface burns and other defects in the processing of pure iron parts for a functional properties test, and to improve the accuracy and usability of the test results, abrasive belt grinding is used for surface grinding. Because of the long circumference of the belt, and the long cooling time of the abrasive particles, cold grinding can be achieved, so that the incidence of surface burns, machining hardening, and other defects can be reduced. An experimental platform for belt grinding of pure iron parts for a functional properties test was built, and corresponding belt grinding experiments were carried out. The influences of grinding parameters, such as belt velocity, feed velocity, the grinding track on the microcosmic morphology, surface roughness, surface residual stress, and micro-hardness were studied. The results showed that belt grinding improved the surface integrity, the surface roughness was less than Ra 0.4 μm, the surface residual stress ranged from −253.84 MPa to −164.14 MPa, and the micro-hardness ranged from 118 HV to 170 HV. Furthermore, to get the workpiece surface to mostly suit the functional performance test, a high abrasive belt linear speed, a low grinding depth, and a feed speed should be selected, and the processing should be conducted with a circular trajectory.
1. Introduction
Industrial pure iron is a kind of steel with a carbon content of 0.02~0.04%, where the content of the other elements is best when the carbon content is less. Industrial pure iron is soft, ductile, and it has good electromagnetic properties. For one thing, it can be used as a deep-drawing material. Due to its good plasticity and toughness, it can be pressed into various complex shapes. Moreover, good electromagnetic properties can be used to make all kinds of relays in the core, armature yoke iron, and magnetic shield. Therefore, industrial pure iron has been widely used in aerospace, defense science and technology, power electronics, energy, and other fields. However, in industrial applications, because of the soft texture of pure iron material, it can be seriously deformed during processing, and a large amount of heat accumulation leads to oxidative burns, which seriously affects the surface quality, and at the same time intensifies the adhesion between the tool and the workpiece, therefore shortening the life of the tool [1].
Therefore, the in-depth study on the functional properties and surface integrity of industrial pure iron materials after processing, and the experimental data of the accurate testing of its functional properties, can guide parameter selection and related designs for the processing of pure iron parts. It is of great importance to reduce processing loss, increase productivity, and improve the surface quality of industrially pure iron parts. Surface integrity is a very important concept in manufacturing. Surface integrity after any manufacturing process is taken into account for both the geometric and physicochemical properties of the manufactured pieces. The concept of surface integrity was first proposed by Filed and Kahles in 1964 [2]. They defined it as a non-damaged surface morphology, or an enhanced processed surface formed by the control of the manufacturing process. Filed proposed three series of parameters, including both geometric and physicochemical properties [3,4]. In order to test the functional properties of industrial pure iron accurately, the surface integrity requirement of industrial pure iron test pieces used for functional performance tests is very high. If the surface integrity parameters are not up to standard, this has a great influence on the functional performance of the test piece. For example, high surface roughness will lead to high stress concentration, which will reduce the fatigue limit. If the surface residual stress is too high, the strength limit of the specimen will be reduced [5]. Therefore, it is necessary to adopt an advanced high surface integrity processing method for industrially pure iron functional performance test pieces for processing, to achieve a surface that is mostly conducive to the accuracy of the results of the functional performance test.
As a typical difficult-to-machine material, optimizing the high surface integrity machining method of pure iron parts has always been an important direction in the research on these kinds of materials [6]. Scholars have done a lot of research in this field. In the industrial field, the surface processing methods of pure iron parts mainly include high-speed turning, high-speed milling, shot blasting, and belt grinding.
Abrasive belt grinding is a kind of processing method that uses a high-speed moving abrasive belt to grind the workpiece surface under the corresponding contact conditions. This grinding method has high productivity with good flexibility, and the grinding and polishing effect is excellent. Due to the long circumference of the abrasive belt, it can quickly take away heat, which can achieve the effects of cold grinding [7,8]. The problems of oxidation and burns caused by bad heat dissipation can be effectively alleviated by grinding the industrial pure iron parts with a belt [9].
As a kind of high efficiency and high quality surface machining method, the coupling relationship between the machining parameter setting and the surface integrity has been studied by many scholars.
Chen proposed that the belt grinding of a titanium alloy workpiece should be performed in the prestressed state. That is, a tensile stress within an elastic range should be applied to the workpiece before grinding, because, in such a state, grinding can effectively improve the fatigue strength and corrosion resistance of the workpiece. The basic theory of and experiments on prestressed belt grinding of a titanium alloy have also been studied [10]. Fei and Huang, on the basis of Chen’s research, conducted an experimental study on the surface integrity of a titanium alloy after prestressed grinding proving that prestressed abrasive belt grinding could improve surface integrity effectively [9]. Gao and Wang studied the relationship between grinding efficiency and linear velocity, grinding pressure, and the feeding speed of the abrasive belt when grinding alumina ceramics with an electroplated diamond abrasive belt by performing a single-factor experiment and orthogonal experiment [11]. Sun and Zhang used a constant pressure accumulation abrasive belt to grind the nickel-based superalloy GH4169, achieving pressure control over the process and reducing the impact on the grinding characteristics caused by the change of the cutting force [12]. Wang and Huang of Chongqing University studied the modeling of the surface profile of abrasive belt grinding, and discussed its application range [13]. Liu and He of Beijing Jiaotong University, and the China Railway Group, experimented on the behavior of a steel specimen with belt grinding, and studied the relationship between factors like grinding speed, grinding grain size, and the parameters of material removal efficiency, surface hardness, and surface roughness [14]. Yang and Huang investigated the grinding process test of the high-temperature nickel-based alloy GH4169 of refractory materials, discussed the advantages and disadvantages of different abrasive belts for the process, and optimized the technological parameters [15].
As surface integrity has a great influence on the fatigue life of a piece [16], it has attracted the wide attention of researchers in the field.
Jourani studied the relationship between abrasive belt structure and its surface quality, analyzed the physical mechanism of belt polishing, and established a mathematical model for the removal process of the surface materials of parts [17]. Bigerelle put forward methods for characterizing the surface roughness in the process of machining tool wear, and through a series of process parameters, characterized the roughness surface integrity, machining dynamics, and mechanical properties. In addition, they established a polishing fractal model and the wear process of an abrasive belt polishing process model [18]. Axinte studied the surface integrity of a nickel-based alloy obtained by powder metallurgy. The surface texture and the white layer, which was hundreds of nanometers deep on the surface of the nickel-based alloy workpiece, were respectively characterized to study the surface integrity and the residual stress distribution [19].
In view of the above analysis, due to the cold grinding characteristics of abrasive belt grinding, the surface burning from the grinding of industrial pure iron functional performance test pieces could be reduced, reaching a high level of surface integrity.
Therefore, this article selected belt grinding of pure iron functional performance test pieces as the research object, analyzed the processed surface morphology and roughness, the residual stress and micro-hardness, revealed the relationship between the surface integrity of pieces after belt grinding, and parameters such as grinding trajectory, belt velocity, feed velocity, and the amount that the Z-axis moved down from the grinding head. We then worked out the requirements of the belt grinding parameters, and used this conclusion to guide high surface integrity machining of functional property test pieces.
2. Experimental Design of the Measurement Method
2.1. Trajectory Planning
In the belt grinding process, aside from the parameters of the abrasive belt model, abrasive belt linear speed, and feed speed, the track of the grinding head will also have a great influence on the surface integrity of the workpiece. Therefore, the grinding path was divided into straight type, Z type, and circular type, and experimental research was carried out according to this plan.
The straight-line grinding track is the most basic and simple grinding track, which is widely used, easy to operate and program, and can be used in various surfaces.
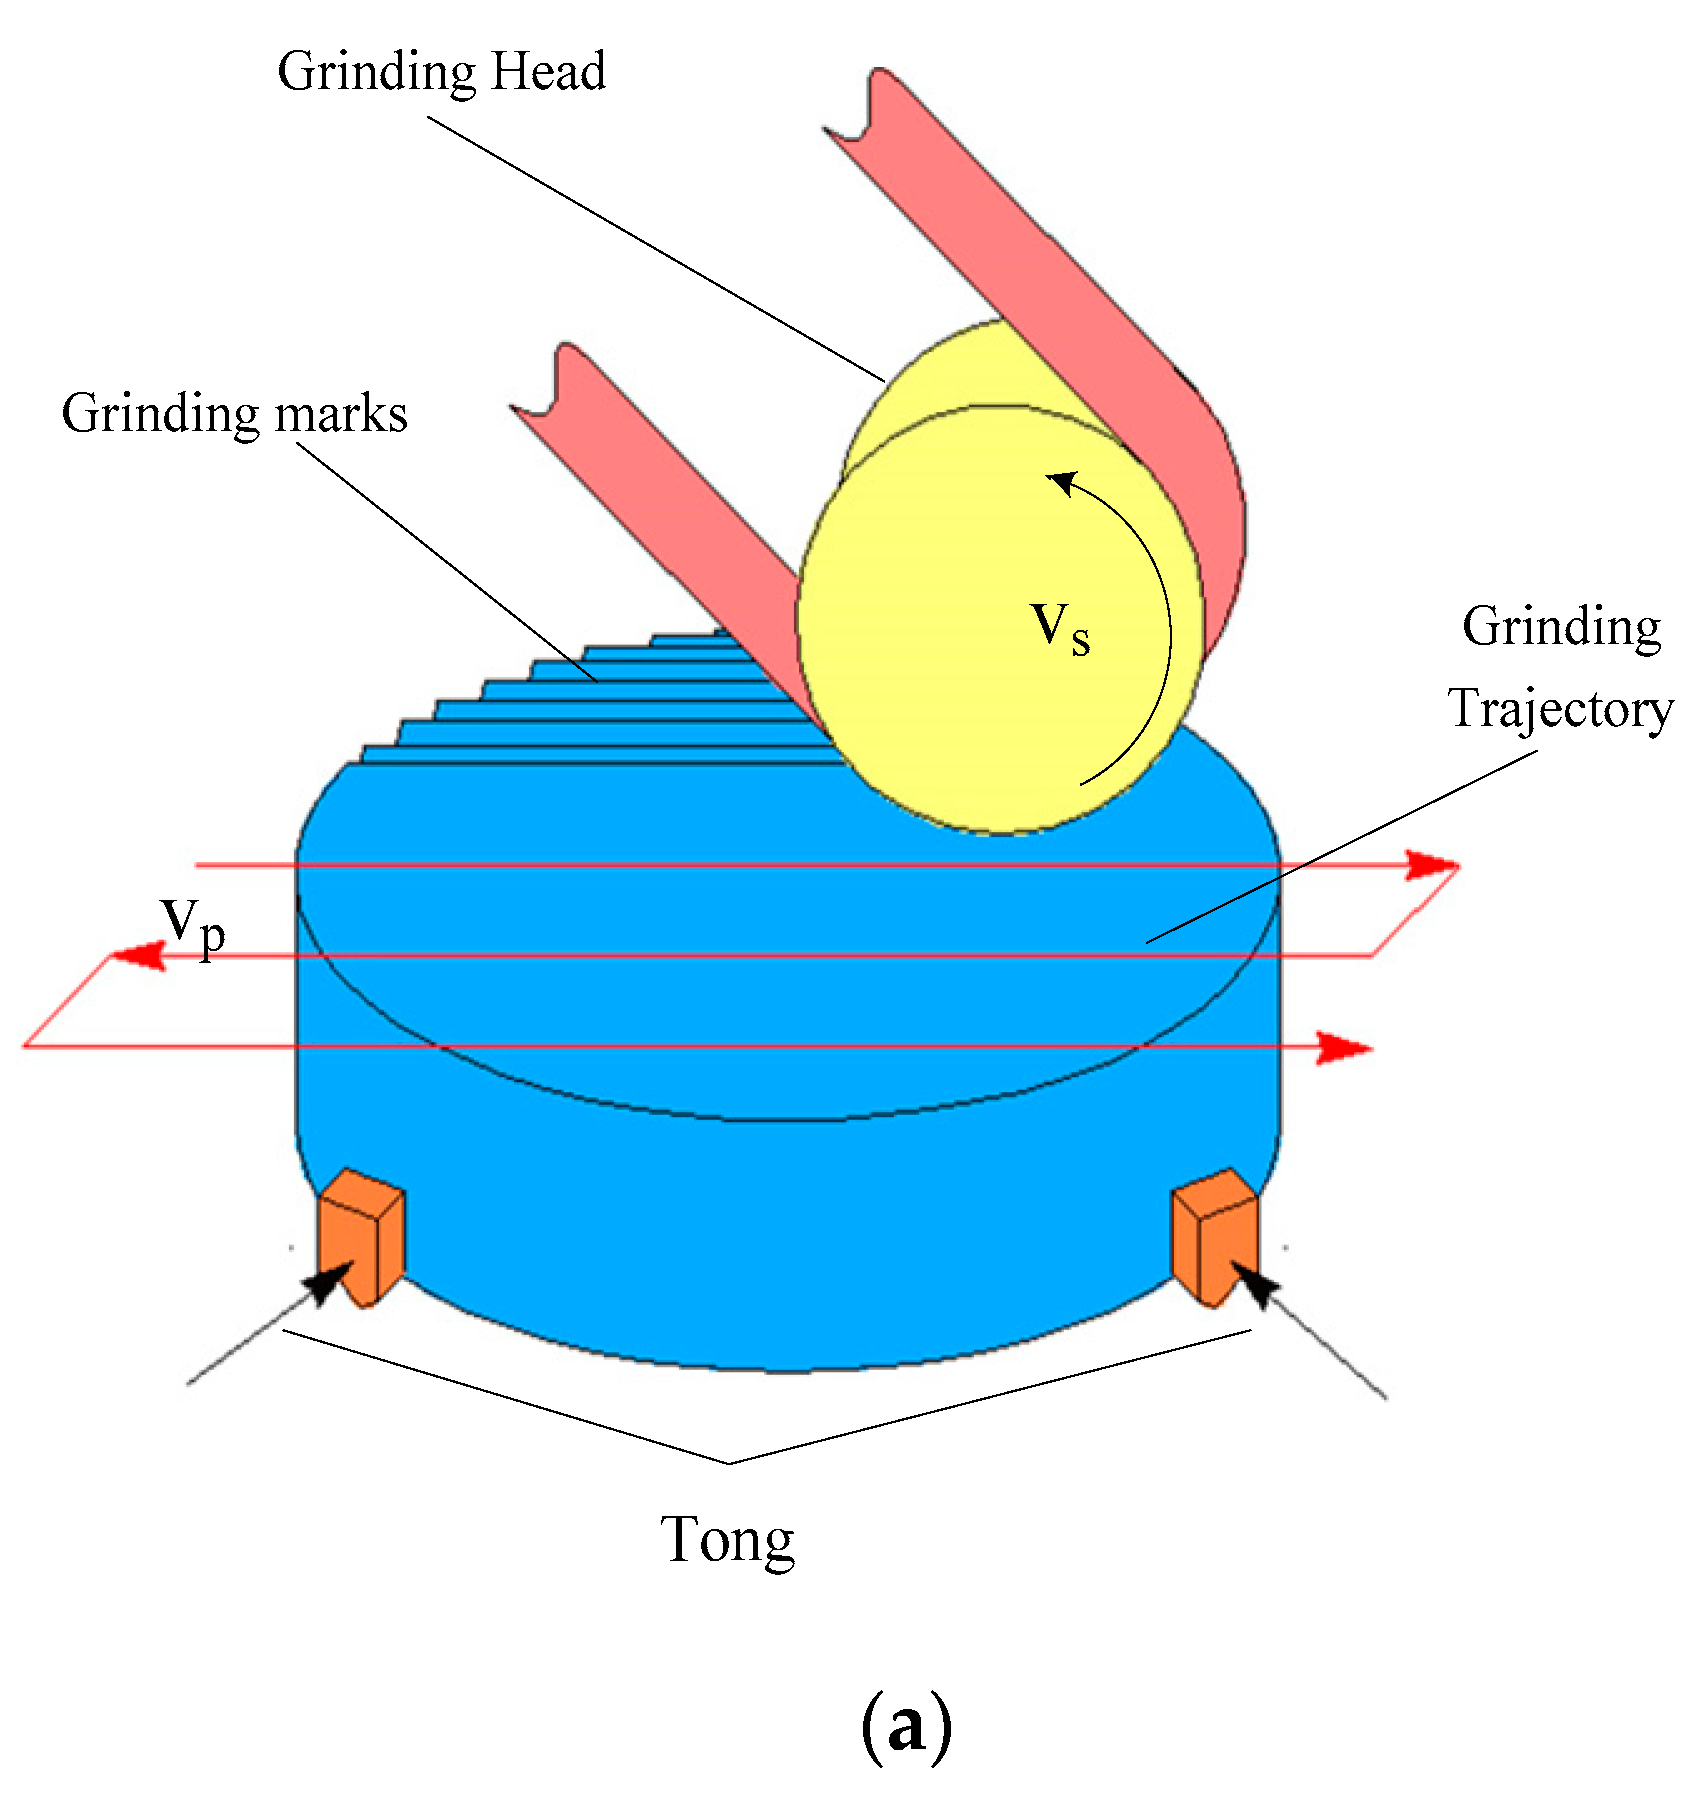
Figure 1 shows the leaner grinding trajectory and its main parameters.
As shown in Figure 1, the center of the upper surface of the test piece was set as the origin, and the plane-coordinate system was established. The coordinates (−9, −7) were chosen as the grinding starting point, and the mathematical expression of the grinding trajectory could be obtained as follows:
When the grinding head moves longitudinally:
In the equation, x, y is the position of the grinding head during grinding; is the grinding head feed speed; ti is the time for grinding the ith lateral trajectory, ; tj is the time for grinding the jth lateral trajectory, .
Since the specimen is round, transverse grinding tracks of different lengths could be used to fit the shape of the workpiece into the actual processing workflow, making the machining more efficient. However, in this experiment, for the sake of programming simplicity, a uniform horizontal track length was adopted.
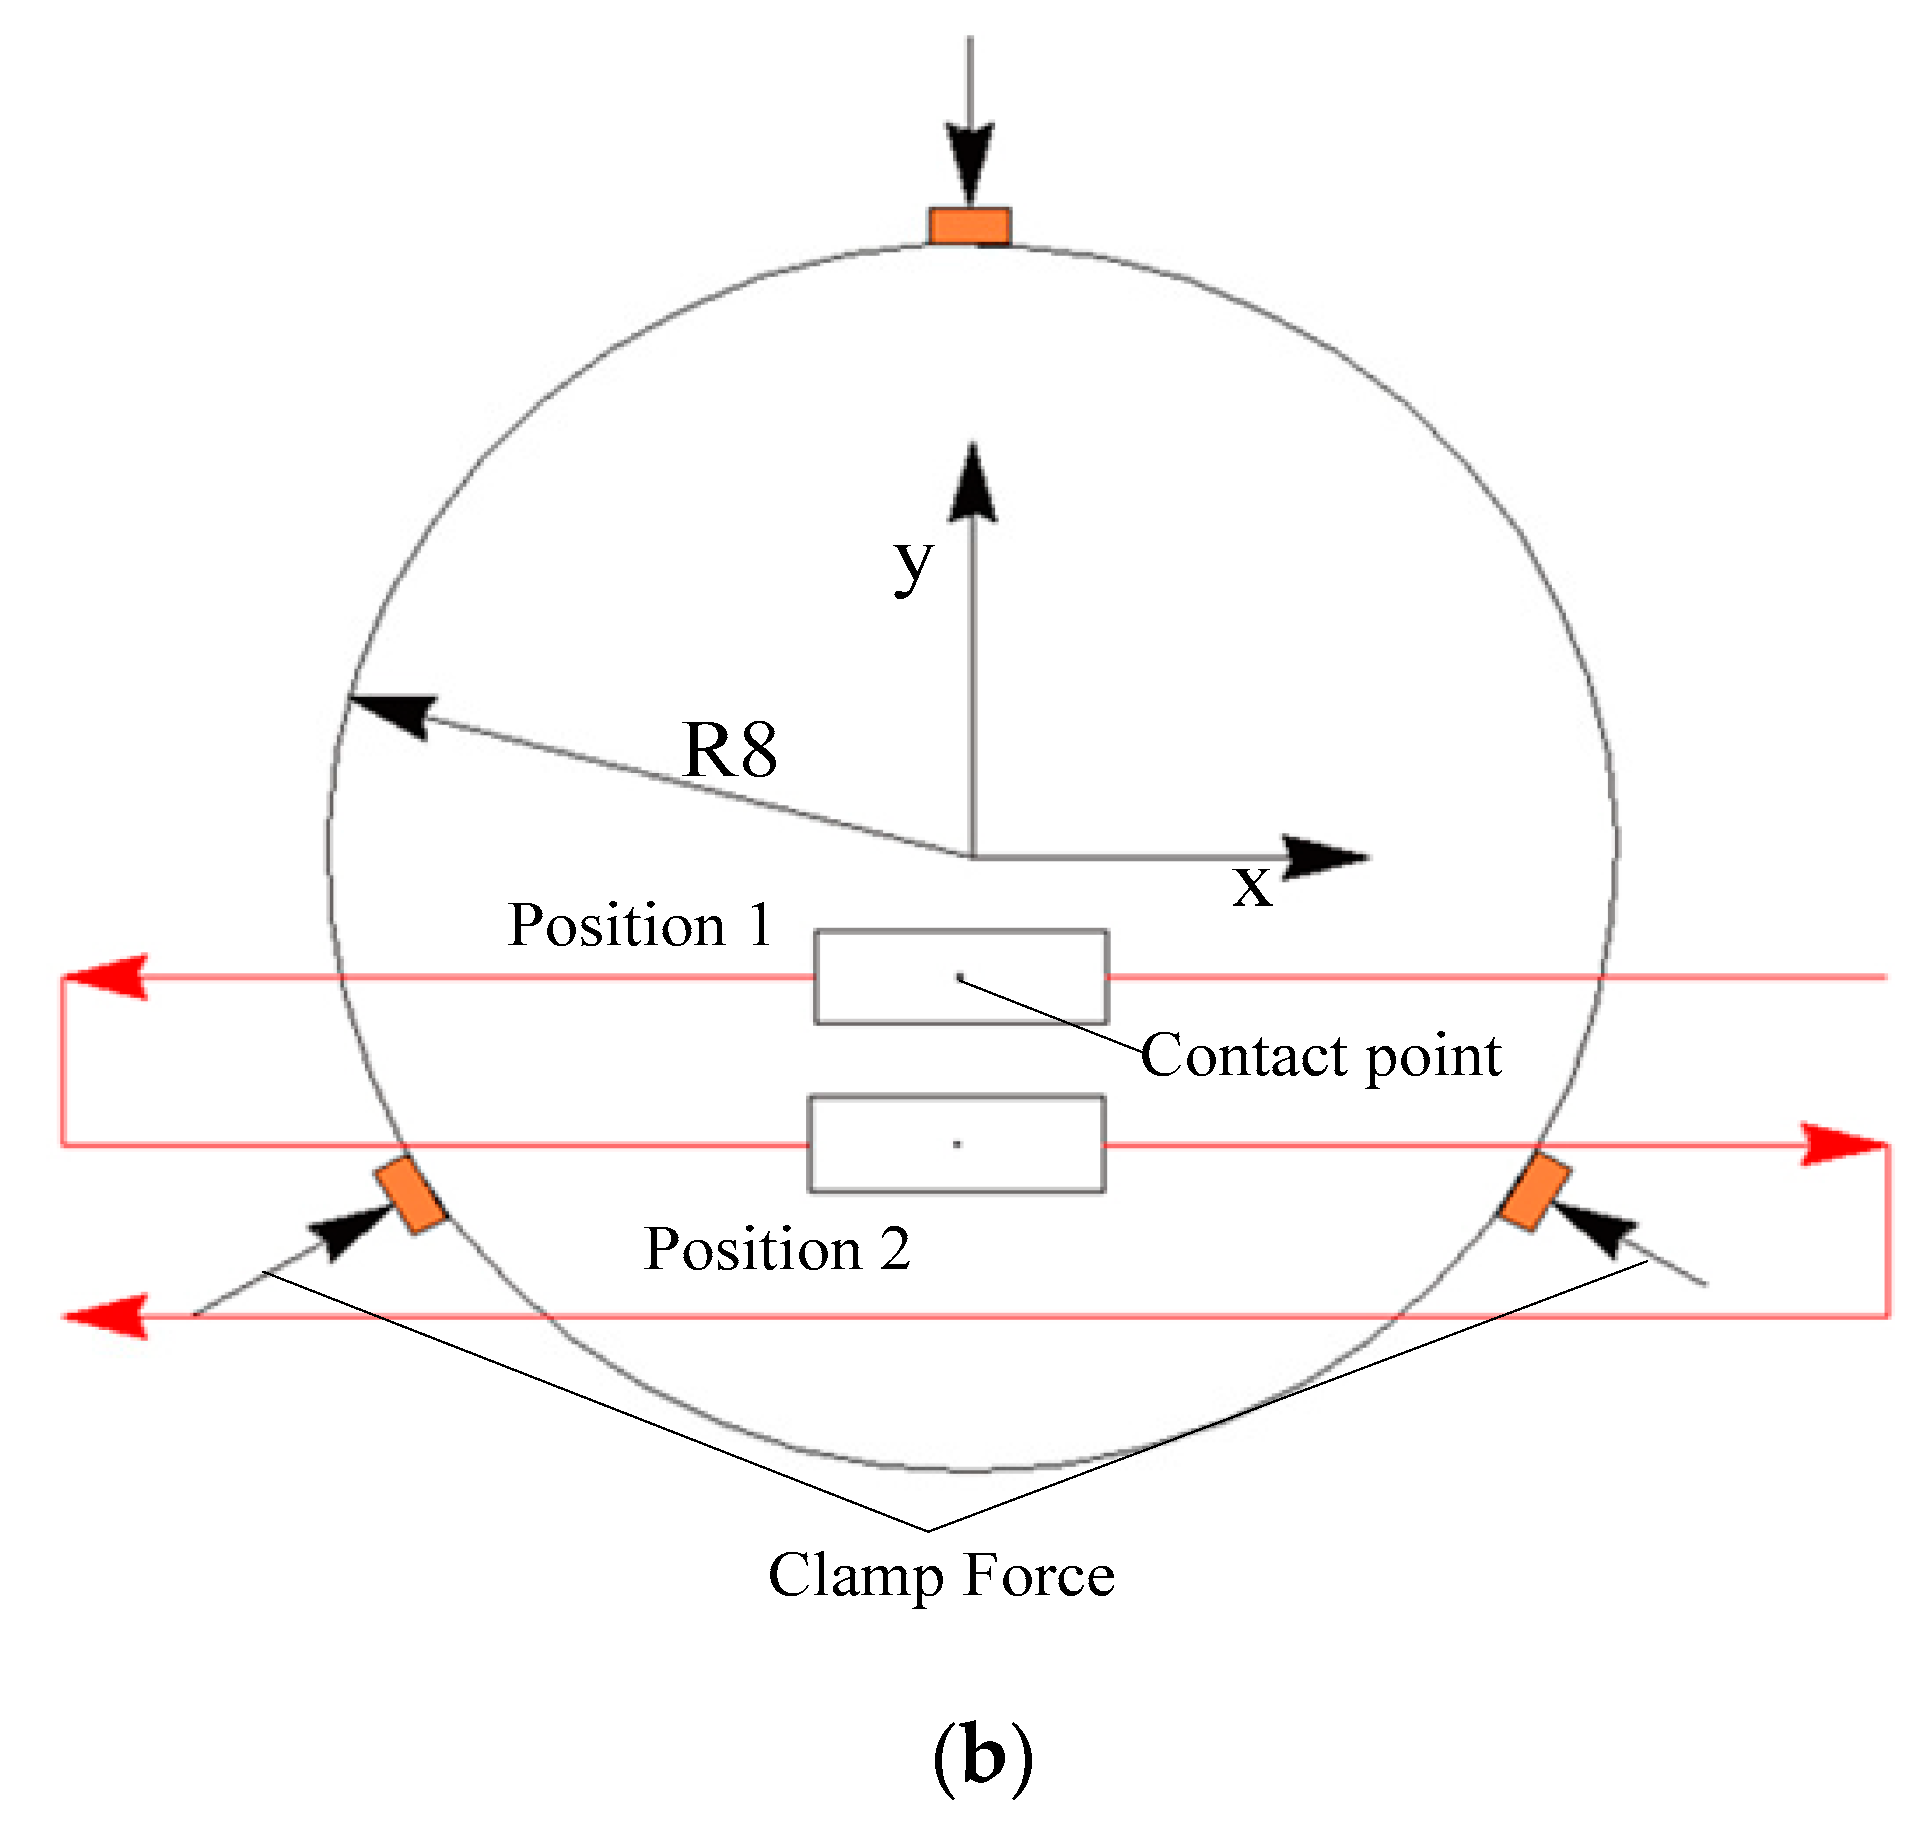
Considering that outer ring-to-inner ring tool path milling can obtain a better surface integrity [20], a circular-type trajectory was therefore designed for the circular functional performance test piece in this experiment. In the process, under this grinding trajectory, the grinding head ground according to the curvature of the workpiece. At the end of each tool walk, the grinding head moved a small distance to the inside, in order to enter the next tool walk. Figure 2 shows the circular grinding trajectory and its main parameters.
As shown in Figure 2, the center of the upper surface of the test piece was set as the origin, and the plane-coordinate system was established. The coordinates (−7, 0) were chosen as the grinding starting point, and the mathematical expression of the grinding trajectory could be obtained as follows:
In the equation, x, y is the position of the grinding head during grinding; is the grinding head feed speed; ti is the time of grinding the ith circular trajectory, ; α is the rotated angle of the grinding head.
In the process of grinding, the direction of the abrasive belt linear velocity was the same as the direction of the grinding head feeding through the linkage between the machine tool’s A-axis, as well as the X- and Y-axes.
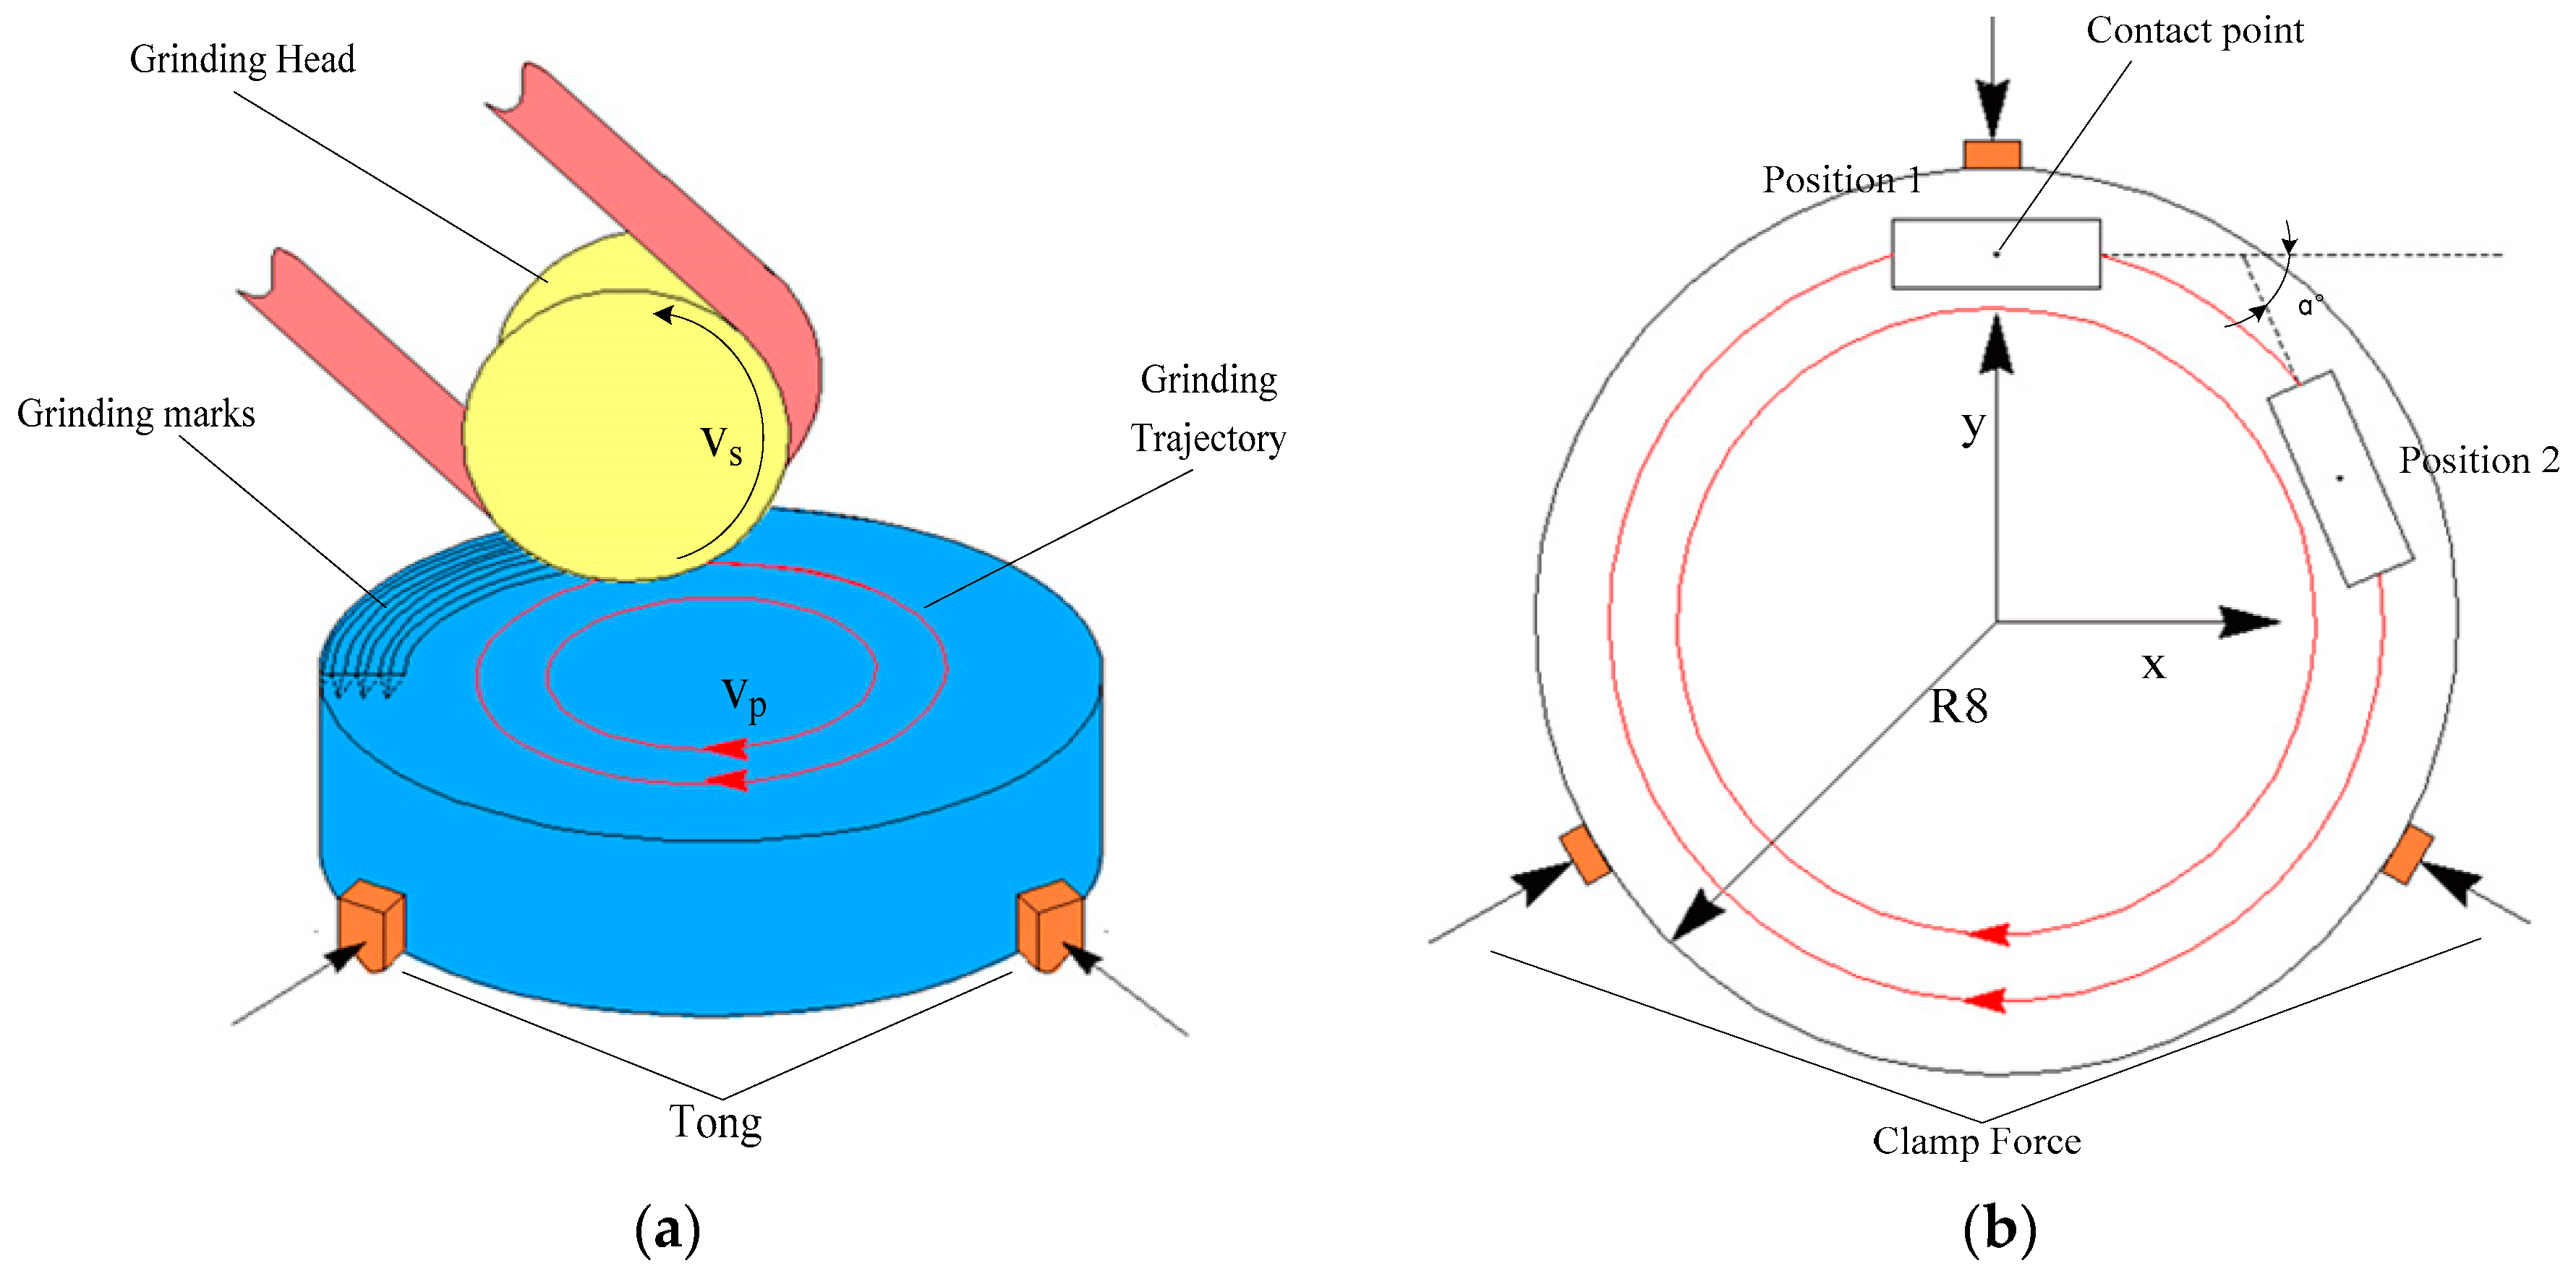
The moving path of the Z-type grinding track is similar to that of the linear track, but it saves time by using a straight line, rather than the broken line of the linear track, to connect the two walks. Compared with the linear track, the Z-grinding track has a higher production efficiency, and it is more suitable for large-scale production. Figure 3 shows the Z-grinding trajectory and its main parameters.
As shown in Figure 3, the center of the upper surface of the test piece was set as the origin, and the plane-coordinate system was established. The coordinates (−9, −7) were chosen as the grinding starting point, and the mathematical expression of a grinding trajectory could be obtained as follows.
When grinding in a transverse trajectory:
When grinding in an inclined direction trajectory:
In the equation, x, y is the position of the grinding head during grinding; is the grinding head feed speed; ti is the time for grinding the ith lateral trajectory, ; tj is the time for grinding the jth inclined direction trajectory ; β is the angle between a transverse trajectory and an oblique on; according to the given parameters, we know that:
In this experiment, the horizontal grinding track was simplified in a similar way to that of Track 1. At the same time, the linkage between axis A, axis X, and axis Y ensured that the linear velocity direction of the abrasive belt was the same as the feed direction of the grinding head when grinding in an inclined direction trajectory.
2.2. Experimental Equipment and Specimens
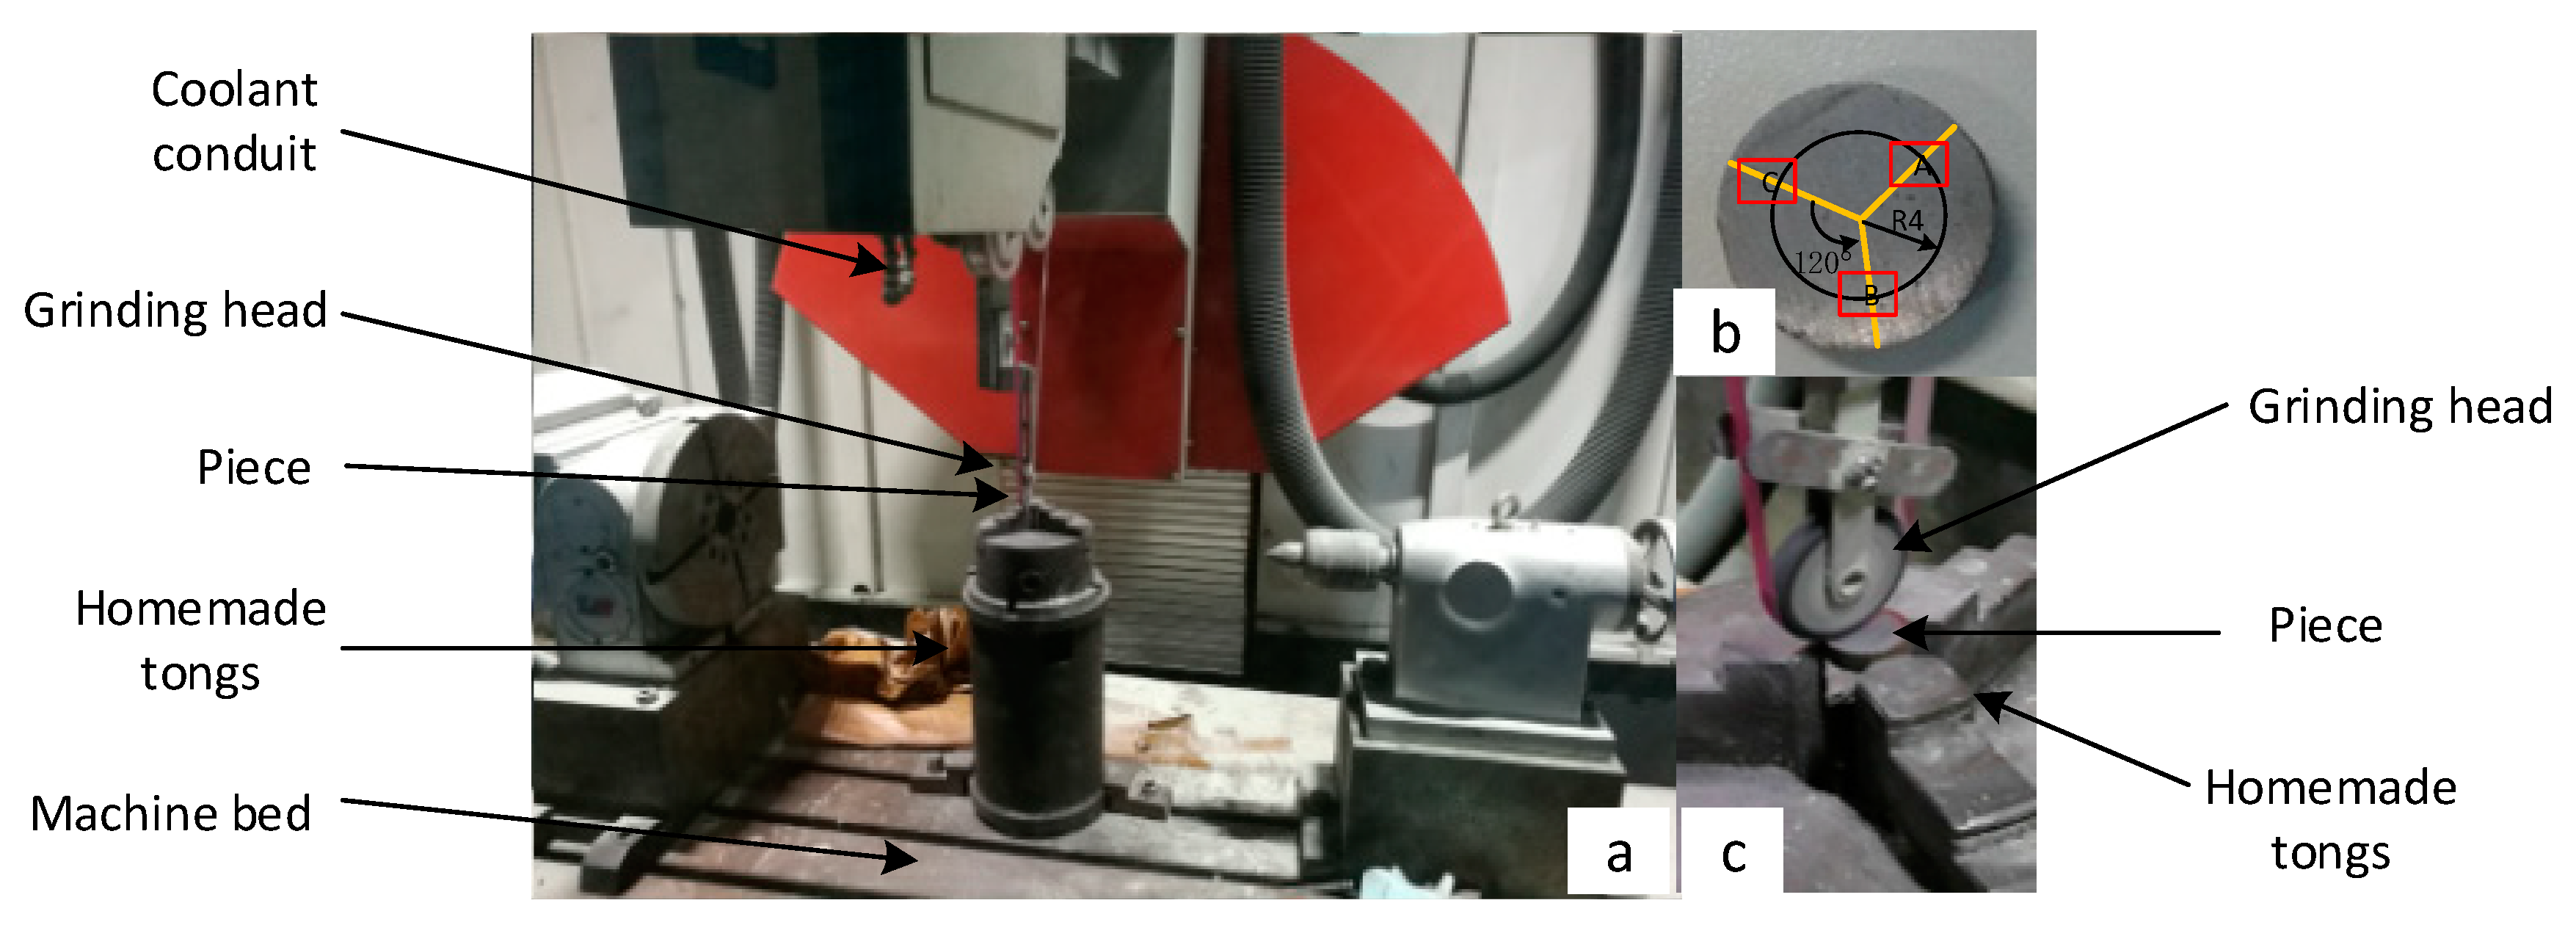
This experiment was carried out on a seven-axes and six-linkage adaptive CNC (Computer Numerical Control) abrasive belt grinding machine tool that was jointly developed by Chongqing University and Chongqing Samhida Grinding Machine Co., Ltd (Chongqing, China). The machine tool is based on the Siemens numerical control system, and it is mainly used for machining complex surface parts, such as blades. It features high efficiency, stable grinding speed, high grinding precision, and low grinding cost. Table 1 shows the axis accuracy of the grinding center. Figure 4a shows the CNC (Computer Numerical Control) device, Figure 4b shows the piece and the detecting point, and Figure 4c shows the grinding process for the piece.
2.3. Measurement Methods and Setting of Experimental Parameters
In order to measure the parameters for the surface integrity of the specimen in this experiment accurately, we used the TESCAN VEGA 3 LMH SEM (Chongqing University, Chongqing, China) to test the workpiece surface topography, the Times TR200 Roughness Tester to detect the horizontal and longitudinal roughness on the surface of the test specimen, the Proto Canada iXRD X-ray diffraction stress gauge (Chongqing University, Chongqing, China) to test the surface residual stresses of the specimens, and the HVS-1000 to test specimen surface hardness. Table 4 shows the parameter settings of the main testing equipment.
As shown in Figure 4b, three measuring points, A, B, and C, were selected on the workpiece surface to reduce the influence of random errors. The three points were located on a circle with a radius of 4 mm focused on the workpiece center, and at an angle of 120°. The average of the measured values at these three points was taken as the experimental result.
In surface roughness measurements, the sampling length of the transverse roughness was 1 mm, and that of the longitudinal roughness was 1.5 mm. The average value from the three measuring points was taken as the measurement result after the Ra value was measured. In residual stress measuring, the residual stress of each measuring point at a depth of 20 μm from the surface was measured by an iXRD X-ray diffraction stress tester, and the mean value of the measured value was calculated as the residual stress value of the specimen. For surface micro-hardness measurements, the 401MVDTM Digital Vickers Hardness Tester was used, and the micro-hardness of the specimen at a depth of 20 μm from the surface was measured. After each experiment, the hardness of the measuring points was measured, and then averaged as the surface micro-hardness of the test piece.
The abrasive belt model selected was a 3M aluminum oxide P240# abrasive belt, with a size of 2450 × 5 mm2. According to the manufacturer’s labeling, the grain size of the abrasive belt was P240.
Three different processing trajectories were set up in the experiment, and orthogonal tests of three factors and three levels were set for each processing run. The parameters were the linear velocity of the abrasive belt, the feed speed, and the Z-axis displacement of the grinding head. The specific parameter settings are shown in Table 5.
The linear speed of the abrasive belt can be set by setting the spindle speed, using the following formula:
In the formula, D is the diameter (unit: mm) of the spindle abrasive belt wheel, and r is the spindle speed (unit: r/min).
Control of the Z-axis movement of the grinding head and the feed speed of the grinding head could be realized by setting the programmed parameters of the CNC (Computer Numerical Control) machine tool.
3. Results and Discussion
3.1. Surface Morphology
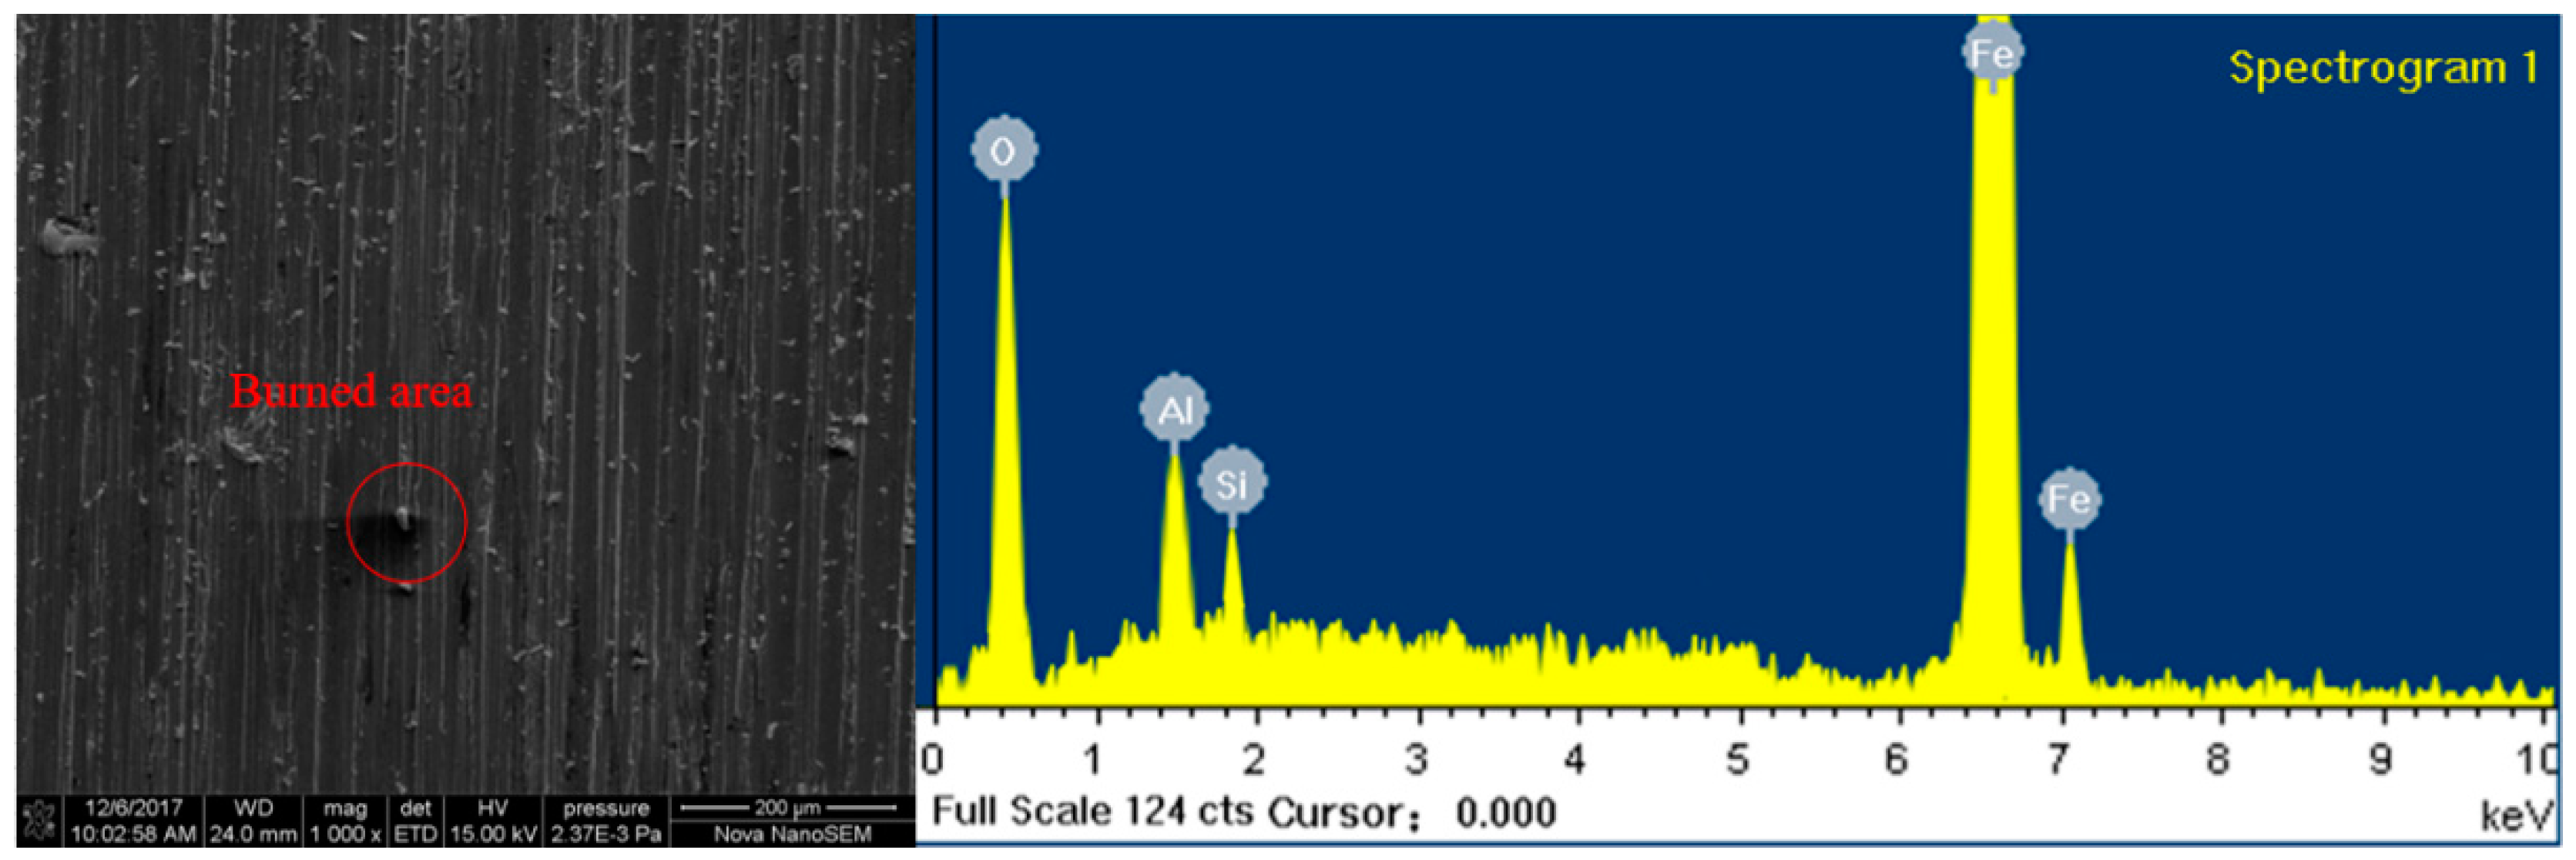
In the orthogonal experiment of abrasive belt grinding on this functional performance test piece, SEM was used to take surface electron microscope images of several typical samples, and for the EDS (Energy Dispersive Spectrocopy) study, the results are shown in Figure 5. The following conclusions can be obtained by comparing and observing each of the photos from SEM.
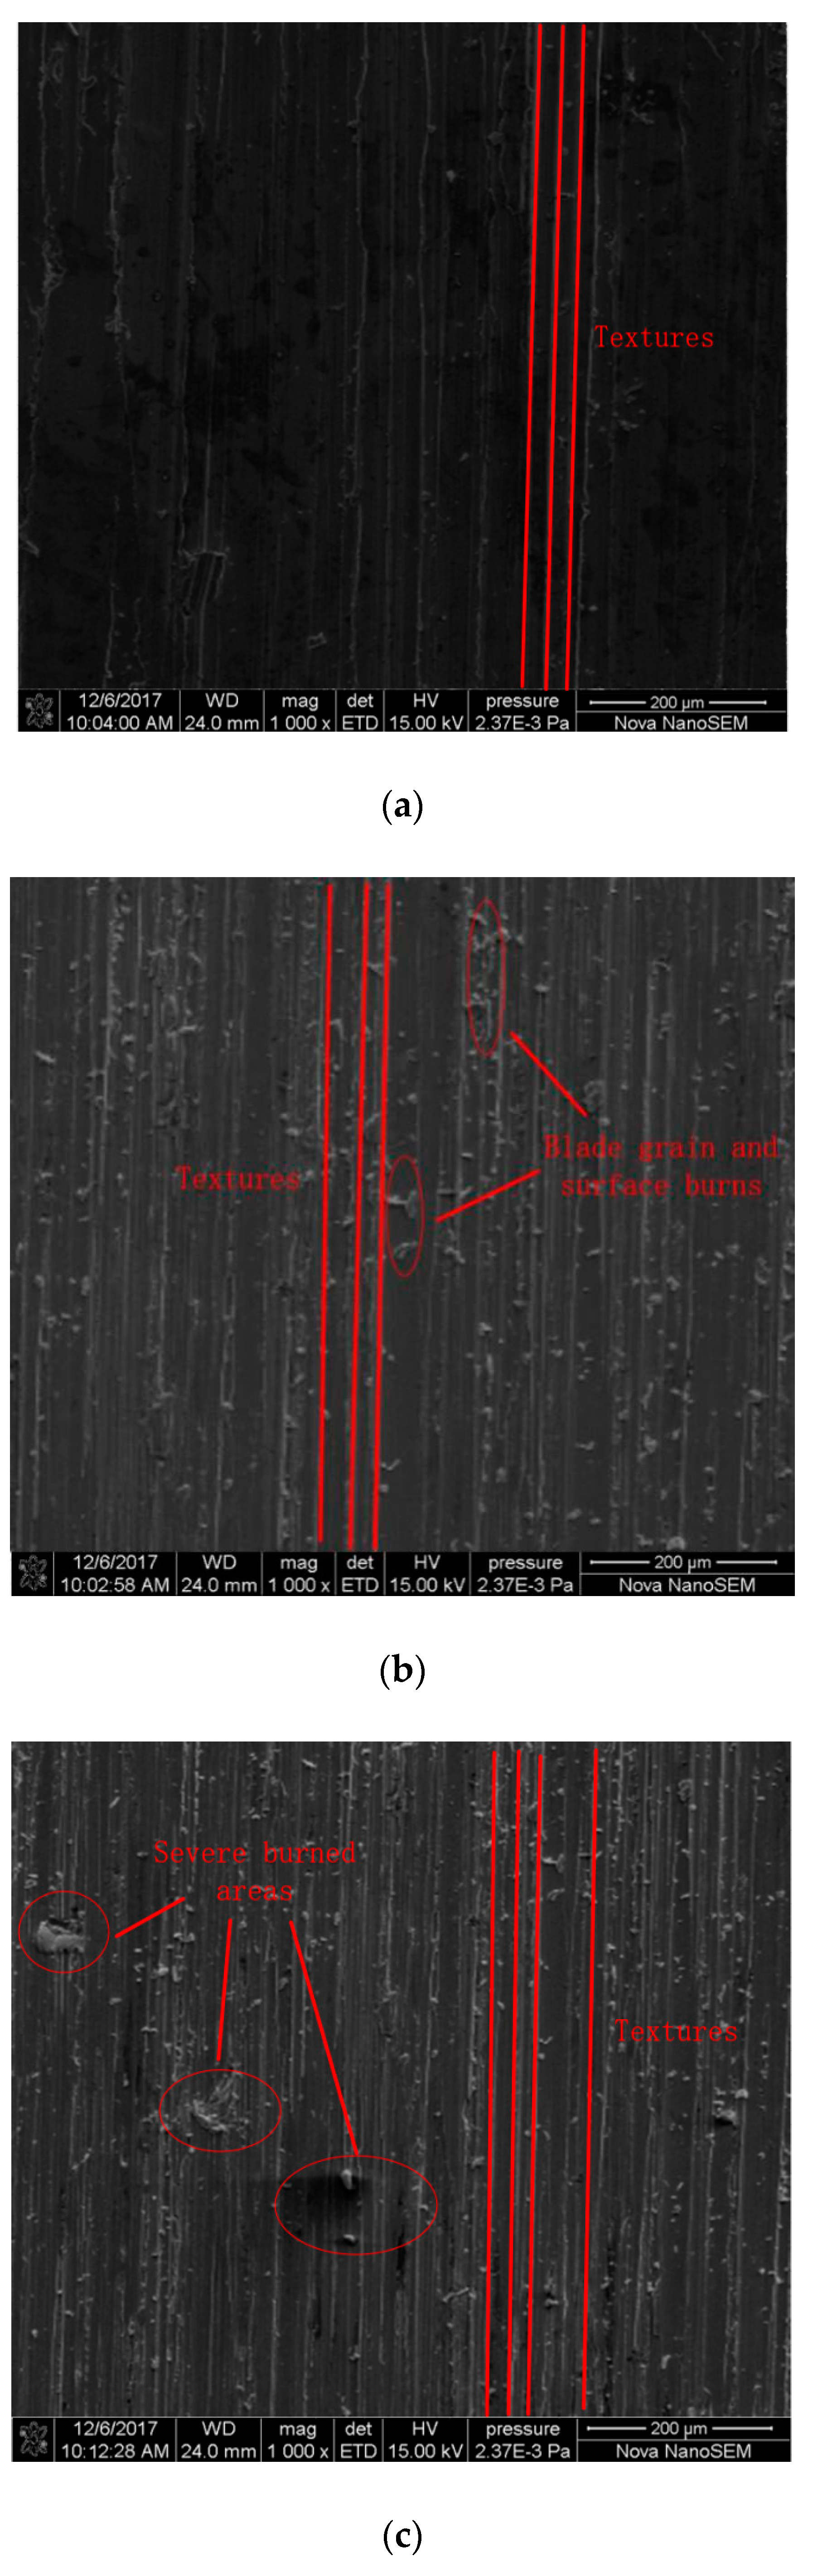
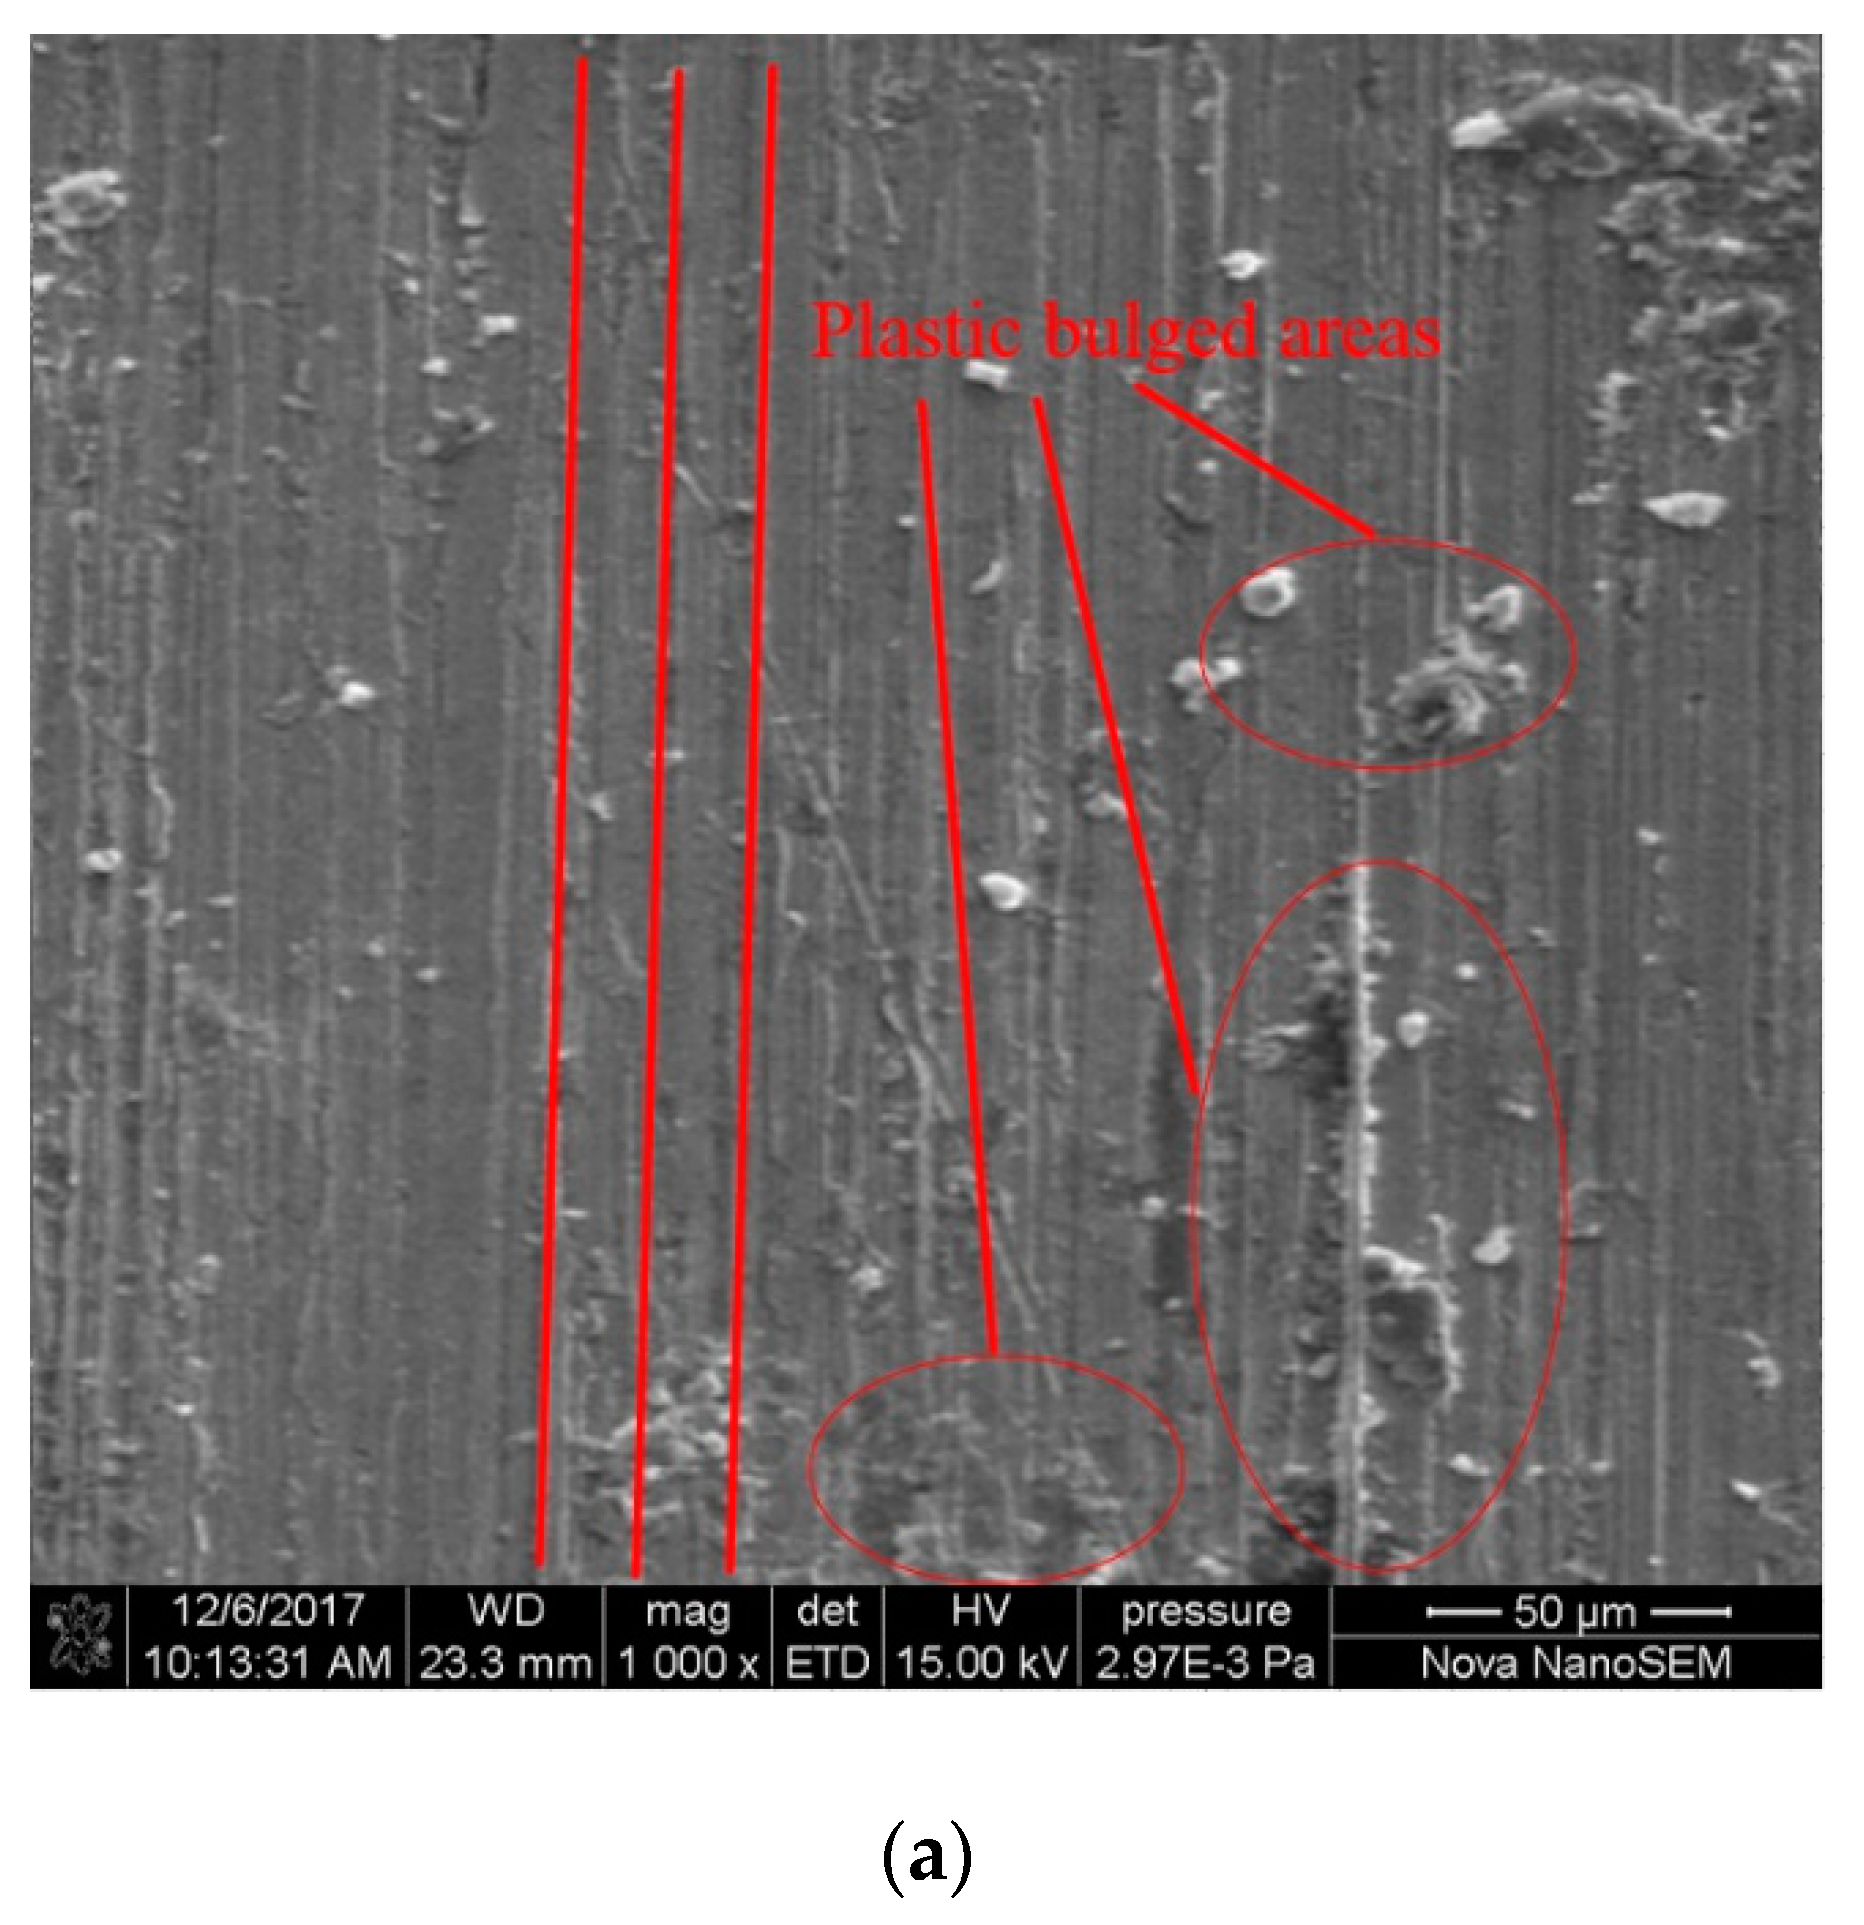
Figure 5 is the EDS image of the burned zone, Figure 6 compares the three pieces and illustrates the relationship between the surface morphology and the grinding parameters, and Figure 7 shows the different surface morphologies from the different grinding trajectories.
The EDS showed the high levels of oxygen and iron in the burned area, indicating that the area oxidized by this area was severe. At the same time, the burn area also contained more aluminum, which mainly came from the sand belt wear.
As shown in Figure 6, in the straight track grinding experiment, the surface of Experiment 1 had the best shape, good texture consistency, no obvious plastic bulges, and no obvious surface defects, such as burns. In Experiment 6, there were certain defects in the surface morphology, a deep blade, and a large number of burrs in the grinding texture. In Experiment 7, the surface appearance was the worst, and there was a large and concentrated area of severe surface oxidation burns, which seriously affected the surface quality of the specimen.
In comparison with pictures from the metallurgical microscope and the experimental parameters of each experiment, it was found that the oxidative burn condition of the test piece was more serious when the sand-wire speed and the amounts ground by the grinding wheel were larger. This is because, with the increased velocity of the abrasive belt and the increased amount of wheel ground down, the material removal rate rises, causing heat accumulation that is difficult to quickly discharge, causing surface burns and an increase in the oxidation zone. At the same time, the larger abrasive belt linear velocity will increase the number of abrasive particles that touch the grinding surface per unit time, and this increases the heat flow in the grinding area. On the other hand, increasing the feed speed of the grinding head will reduce the contact time between the surface and the abrasive belt, which is conducive to heat dissipation and reduces the degree of burns. However, too fast a feed speed for the grinding head will lead to a reduction of the grinding effect, resulting in burrs and other surface defects.
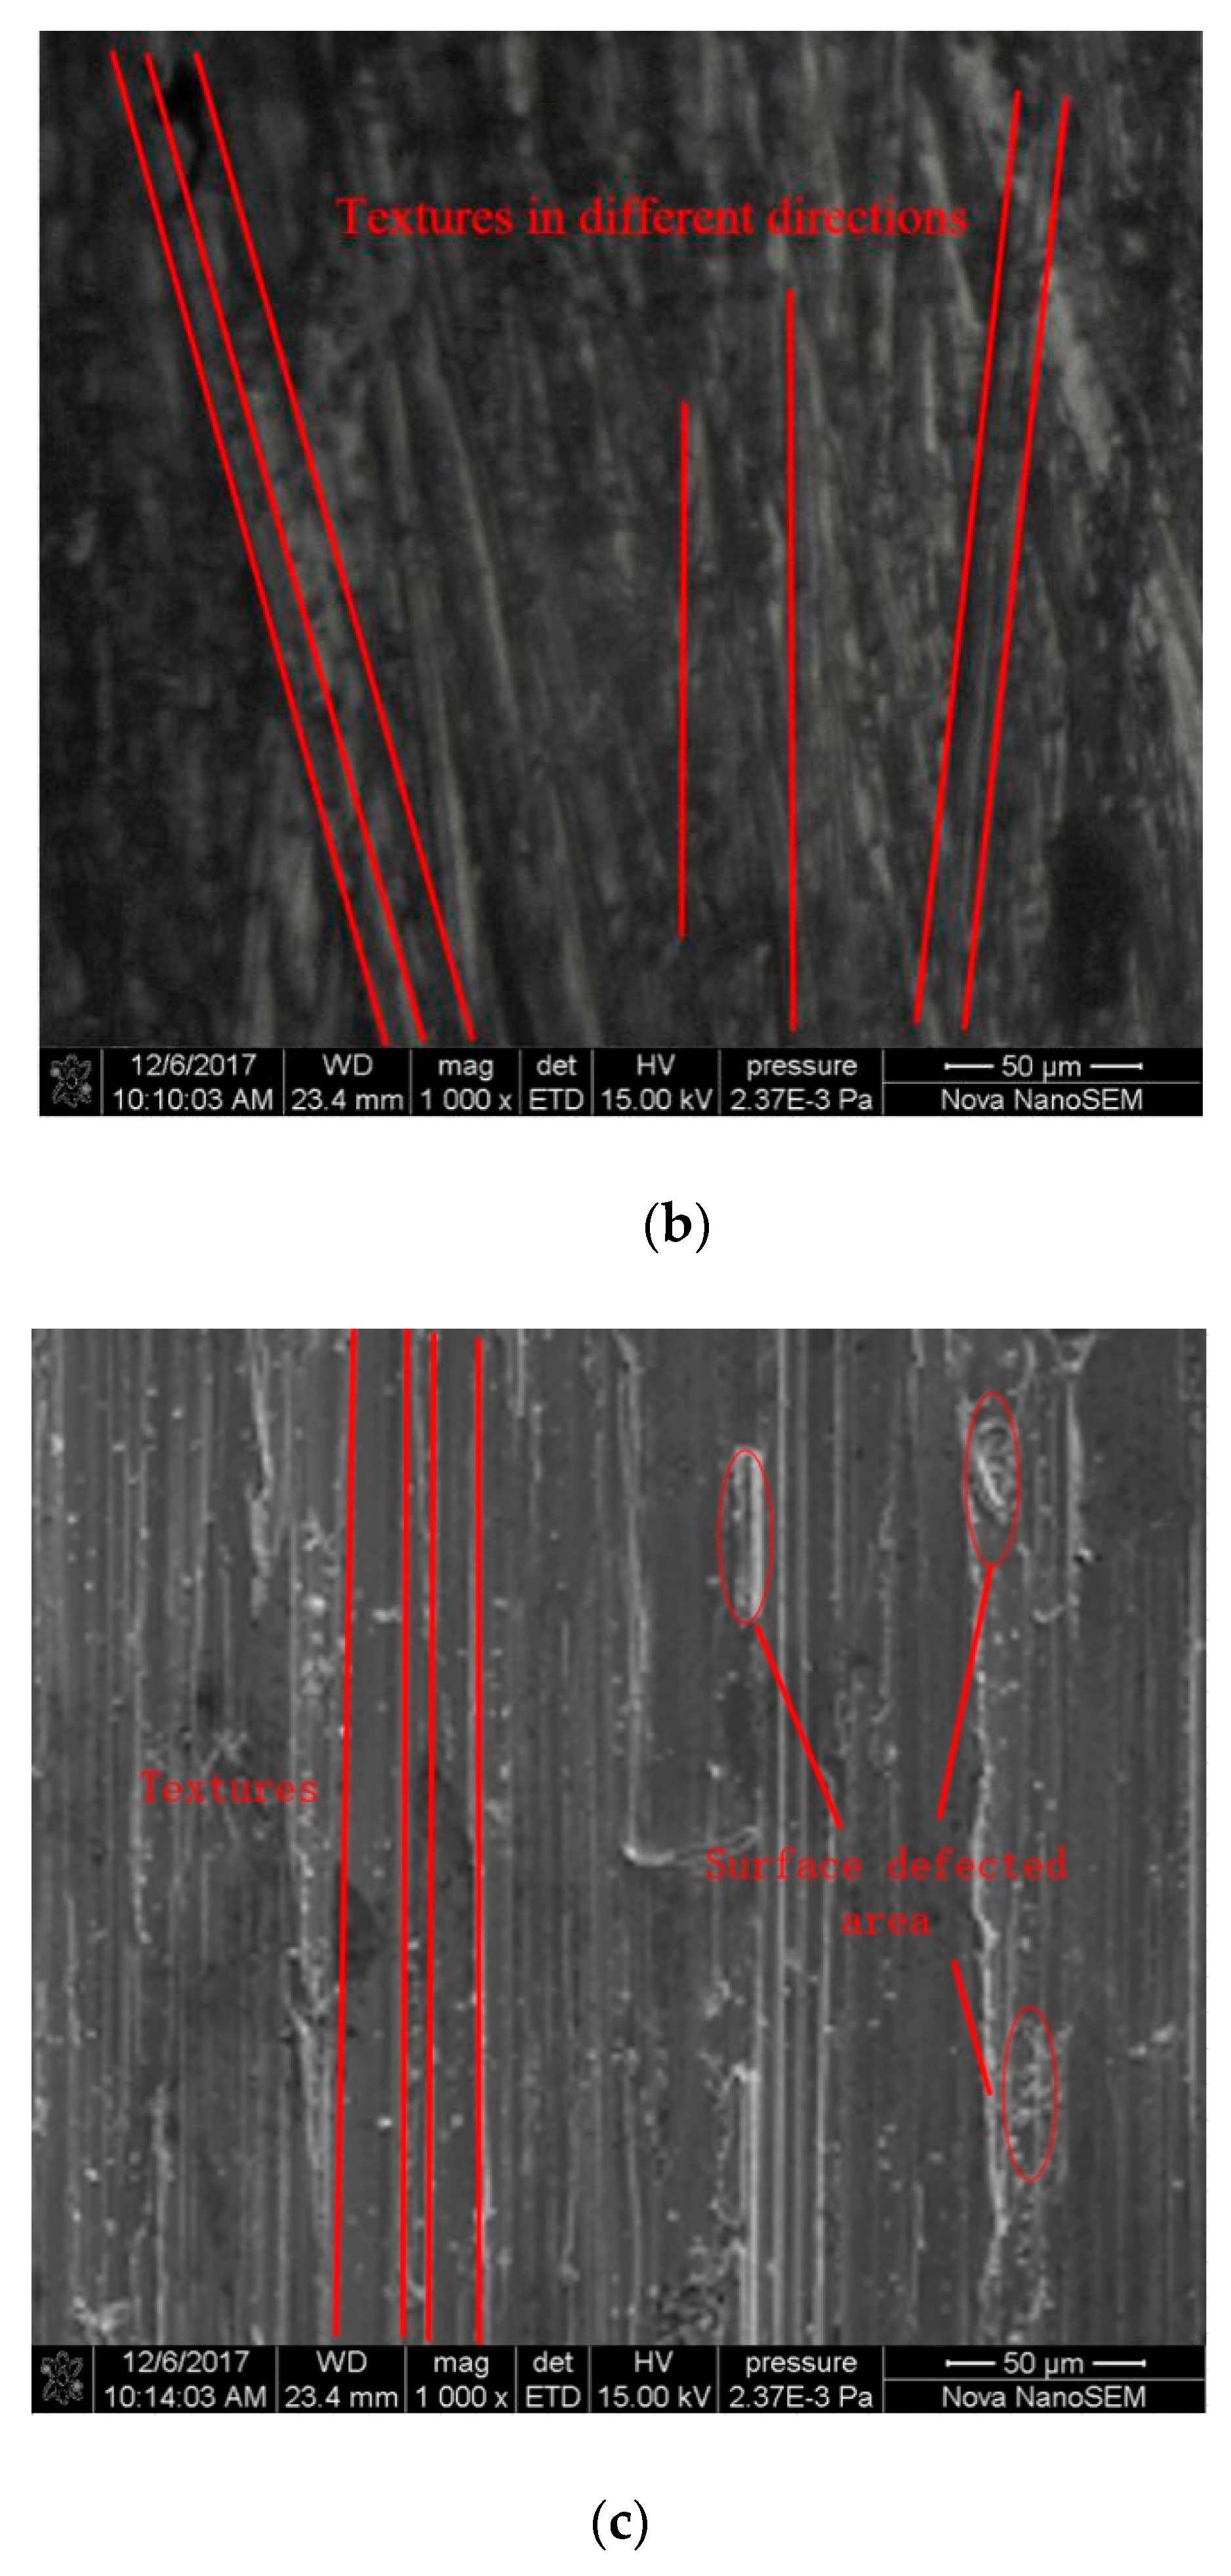
As shown in Figure 7, under three different kinds of grinding trajectories, although the texture of the linear trajectory consistency was the highest and the texture was the most neat, it had relatively poor surface integrity, and its surface had certain defects, such as plastic bulges and burrs. When tracking the grinding of the circular-form surface, the surface integrity was better when compared to the linear trajectory for grinding, and it had almost no defects such as burrs, but its grinding grain was messy, with relatively poor consistency. There was also a small number of burrs on the ground surface of the Z-shaped track, whose surface integrity was between that of the two previous cases.
It could be that this was caused by the dulling of the abrasive particles. In the process of grinding, especially under the pressure of a large grinding head, the abrasive particles were easy to blunt. In straight trajectory grinding, only two abrasive directions are involved in grinding. The grinding blunt abrasive cannot be replaced, which results in dulling of the grits and scraps that are unable to be removed from the material surface completely, thus producing grinding defects. Additionally, in circular trajectory, due to the motion direction and the abrasive belt grinding head in the direction of the feed, there was a change of direction angle, and the dulling grits could be replaced in a timely manner to ensure a cutting effect and high surface integrity. However, as the cutting direction of the circular track grinding changed, its texture direction also changed, which was messy and inconsistent. As for the texture consistency and the surface defects of Z-shaped track grinding, it was between the other two types, because there was a certain angle change in the grinding of the Z-shaped track, and blunt abrasive particles were replaced to a certain extent to alleviate the occurrence of grinding defects, but at the same time, the texture consistency was reduced.
3.2. Surface Roughness
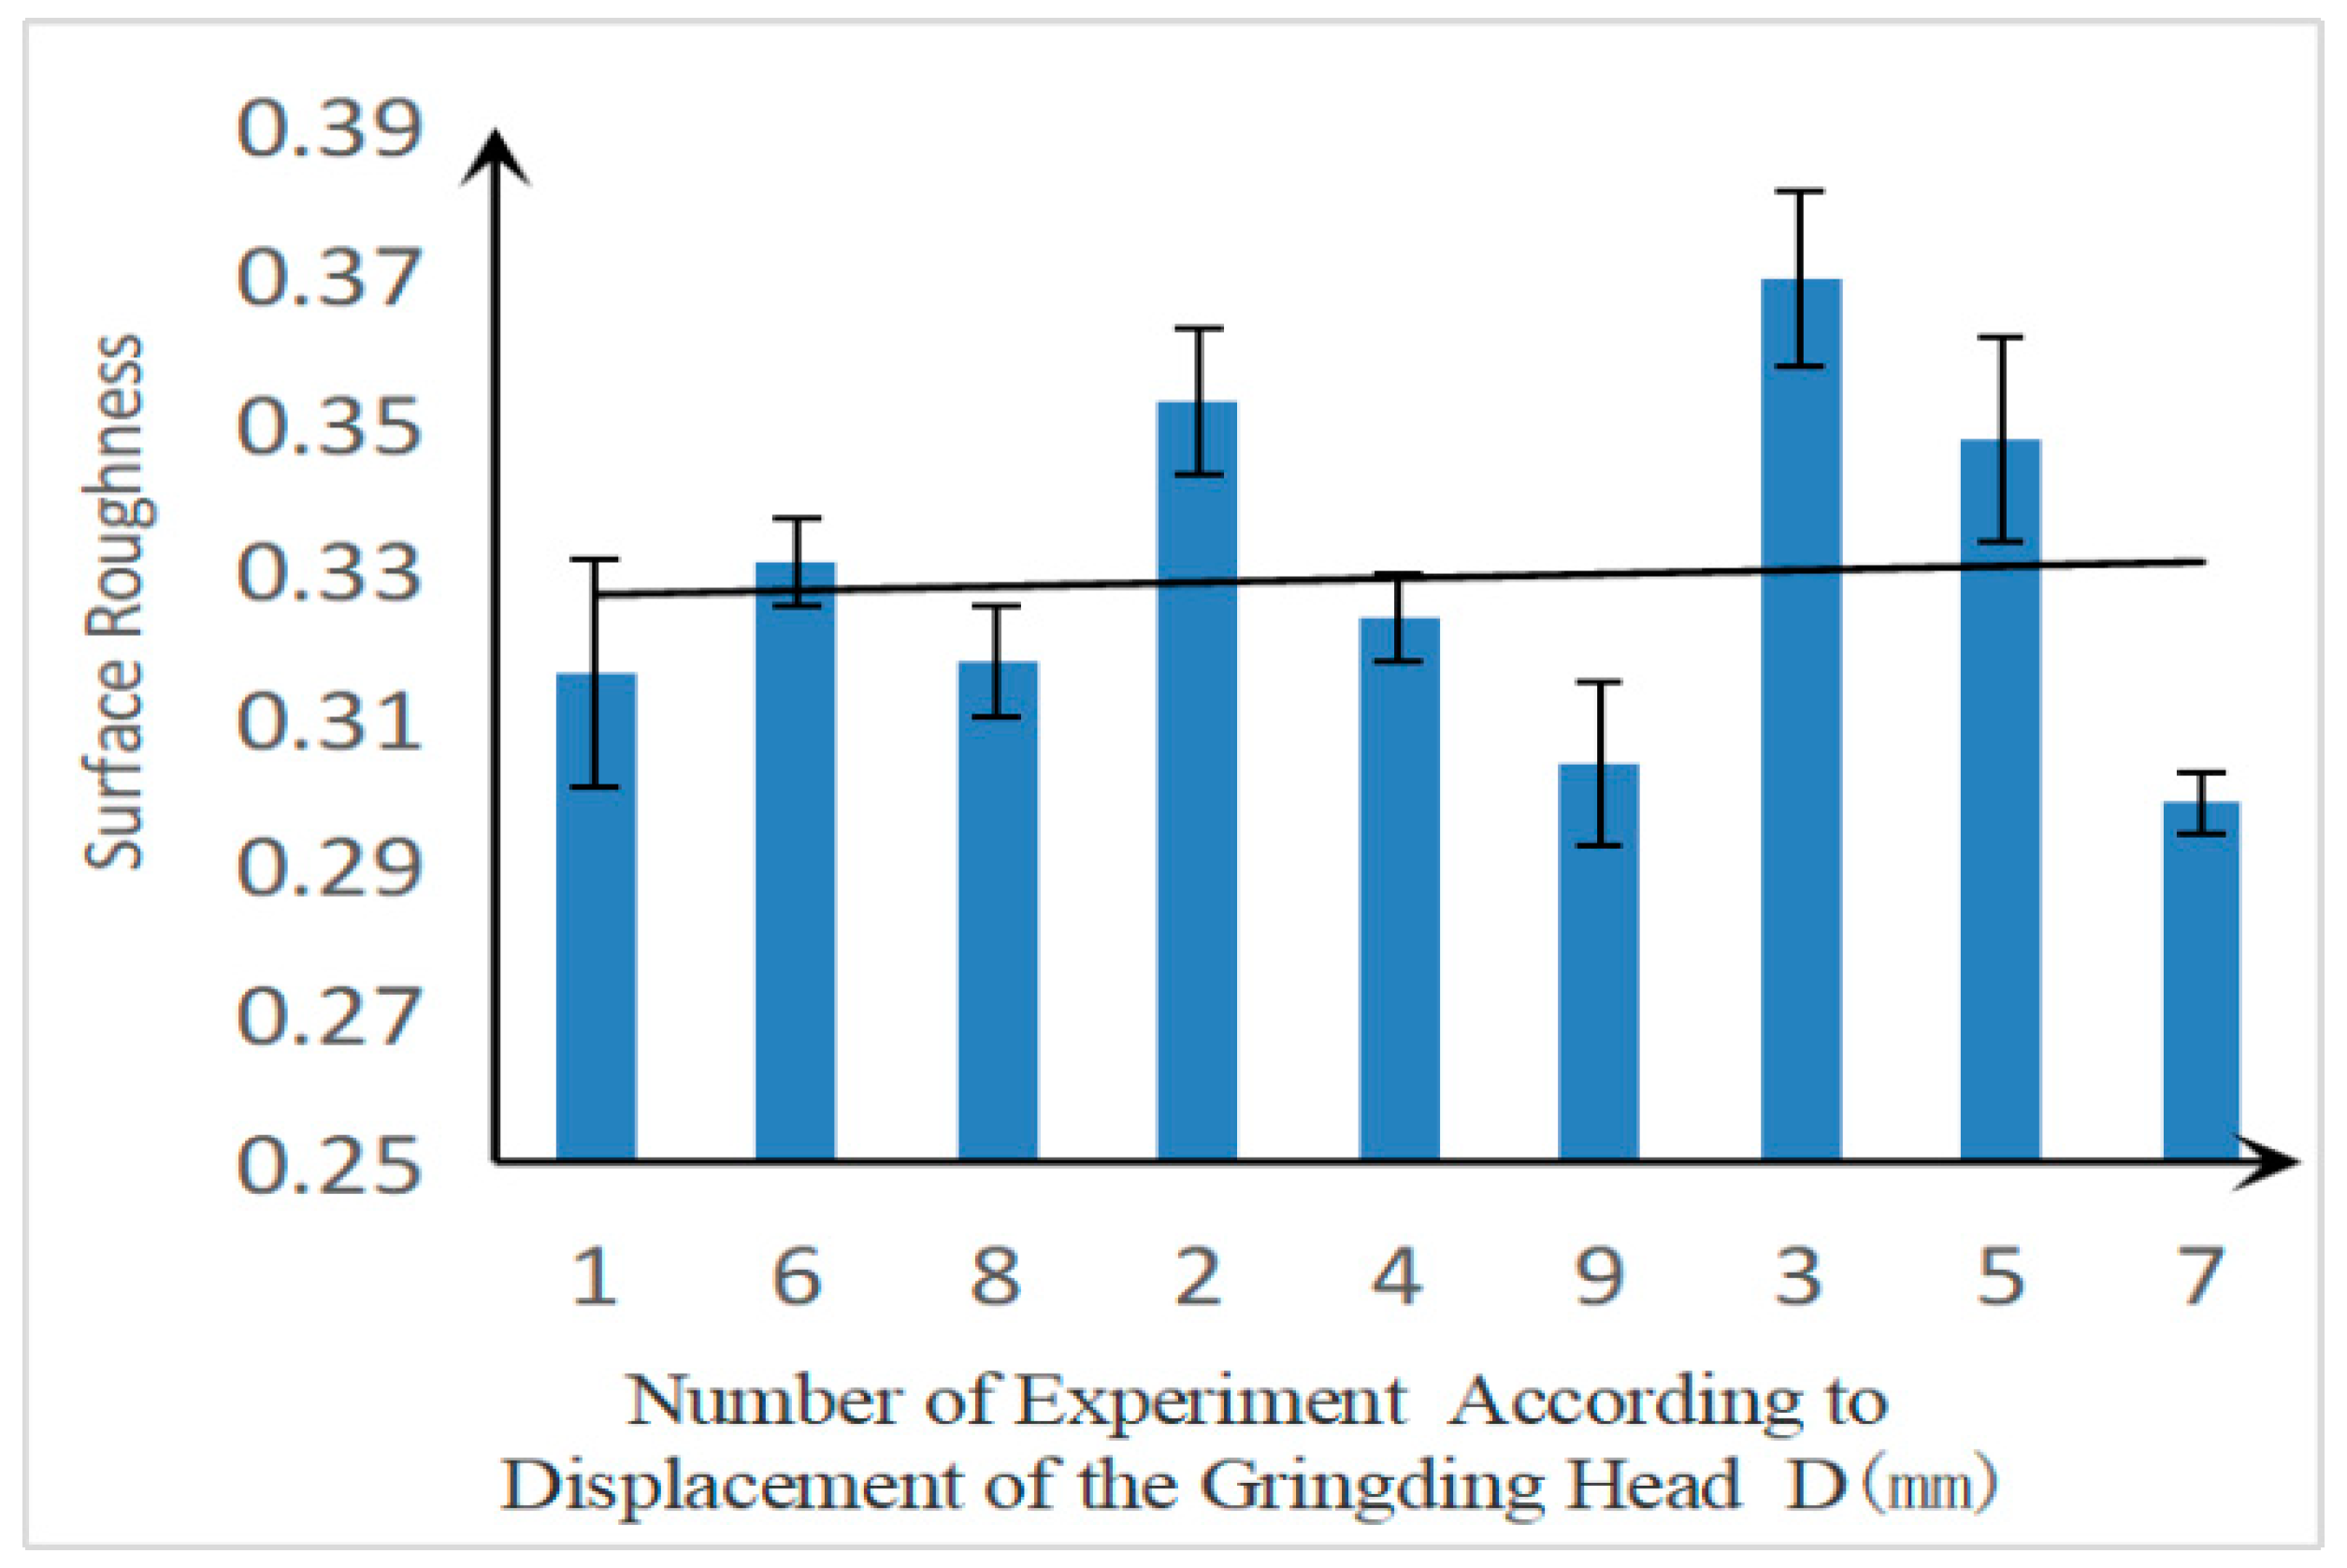
In order to obtain surface roughness information for the test piece, we used a surface roughness tester to detect the surface roughness value and profile of the specimen. The measurement results are shown in Figure 8, Figure 9, Figure 10, Figure 11, Figure 12 and Figure 13. Figure 8 shows the contrast between the pre-grinding contour and the post-grinding contour. Figure 9, Figure 10 and Figure 11 arrange the number of experiments according to polishing speed, feeding speed, and the displacement of grinding head, and then the trendline is used to illustrate the relation between the grinding parameters and the surface roughness. Figure 12 and Figure 13 make comparisons among the three trajectories in transverse and longitudinal surface roughnesses.
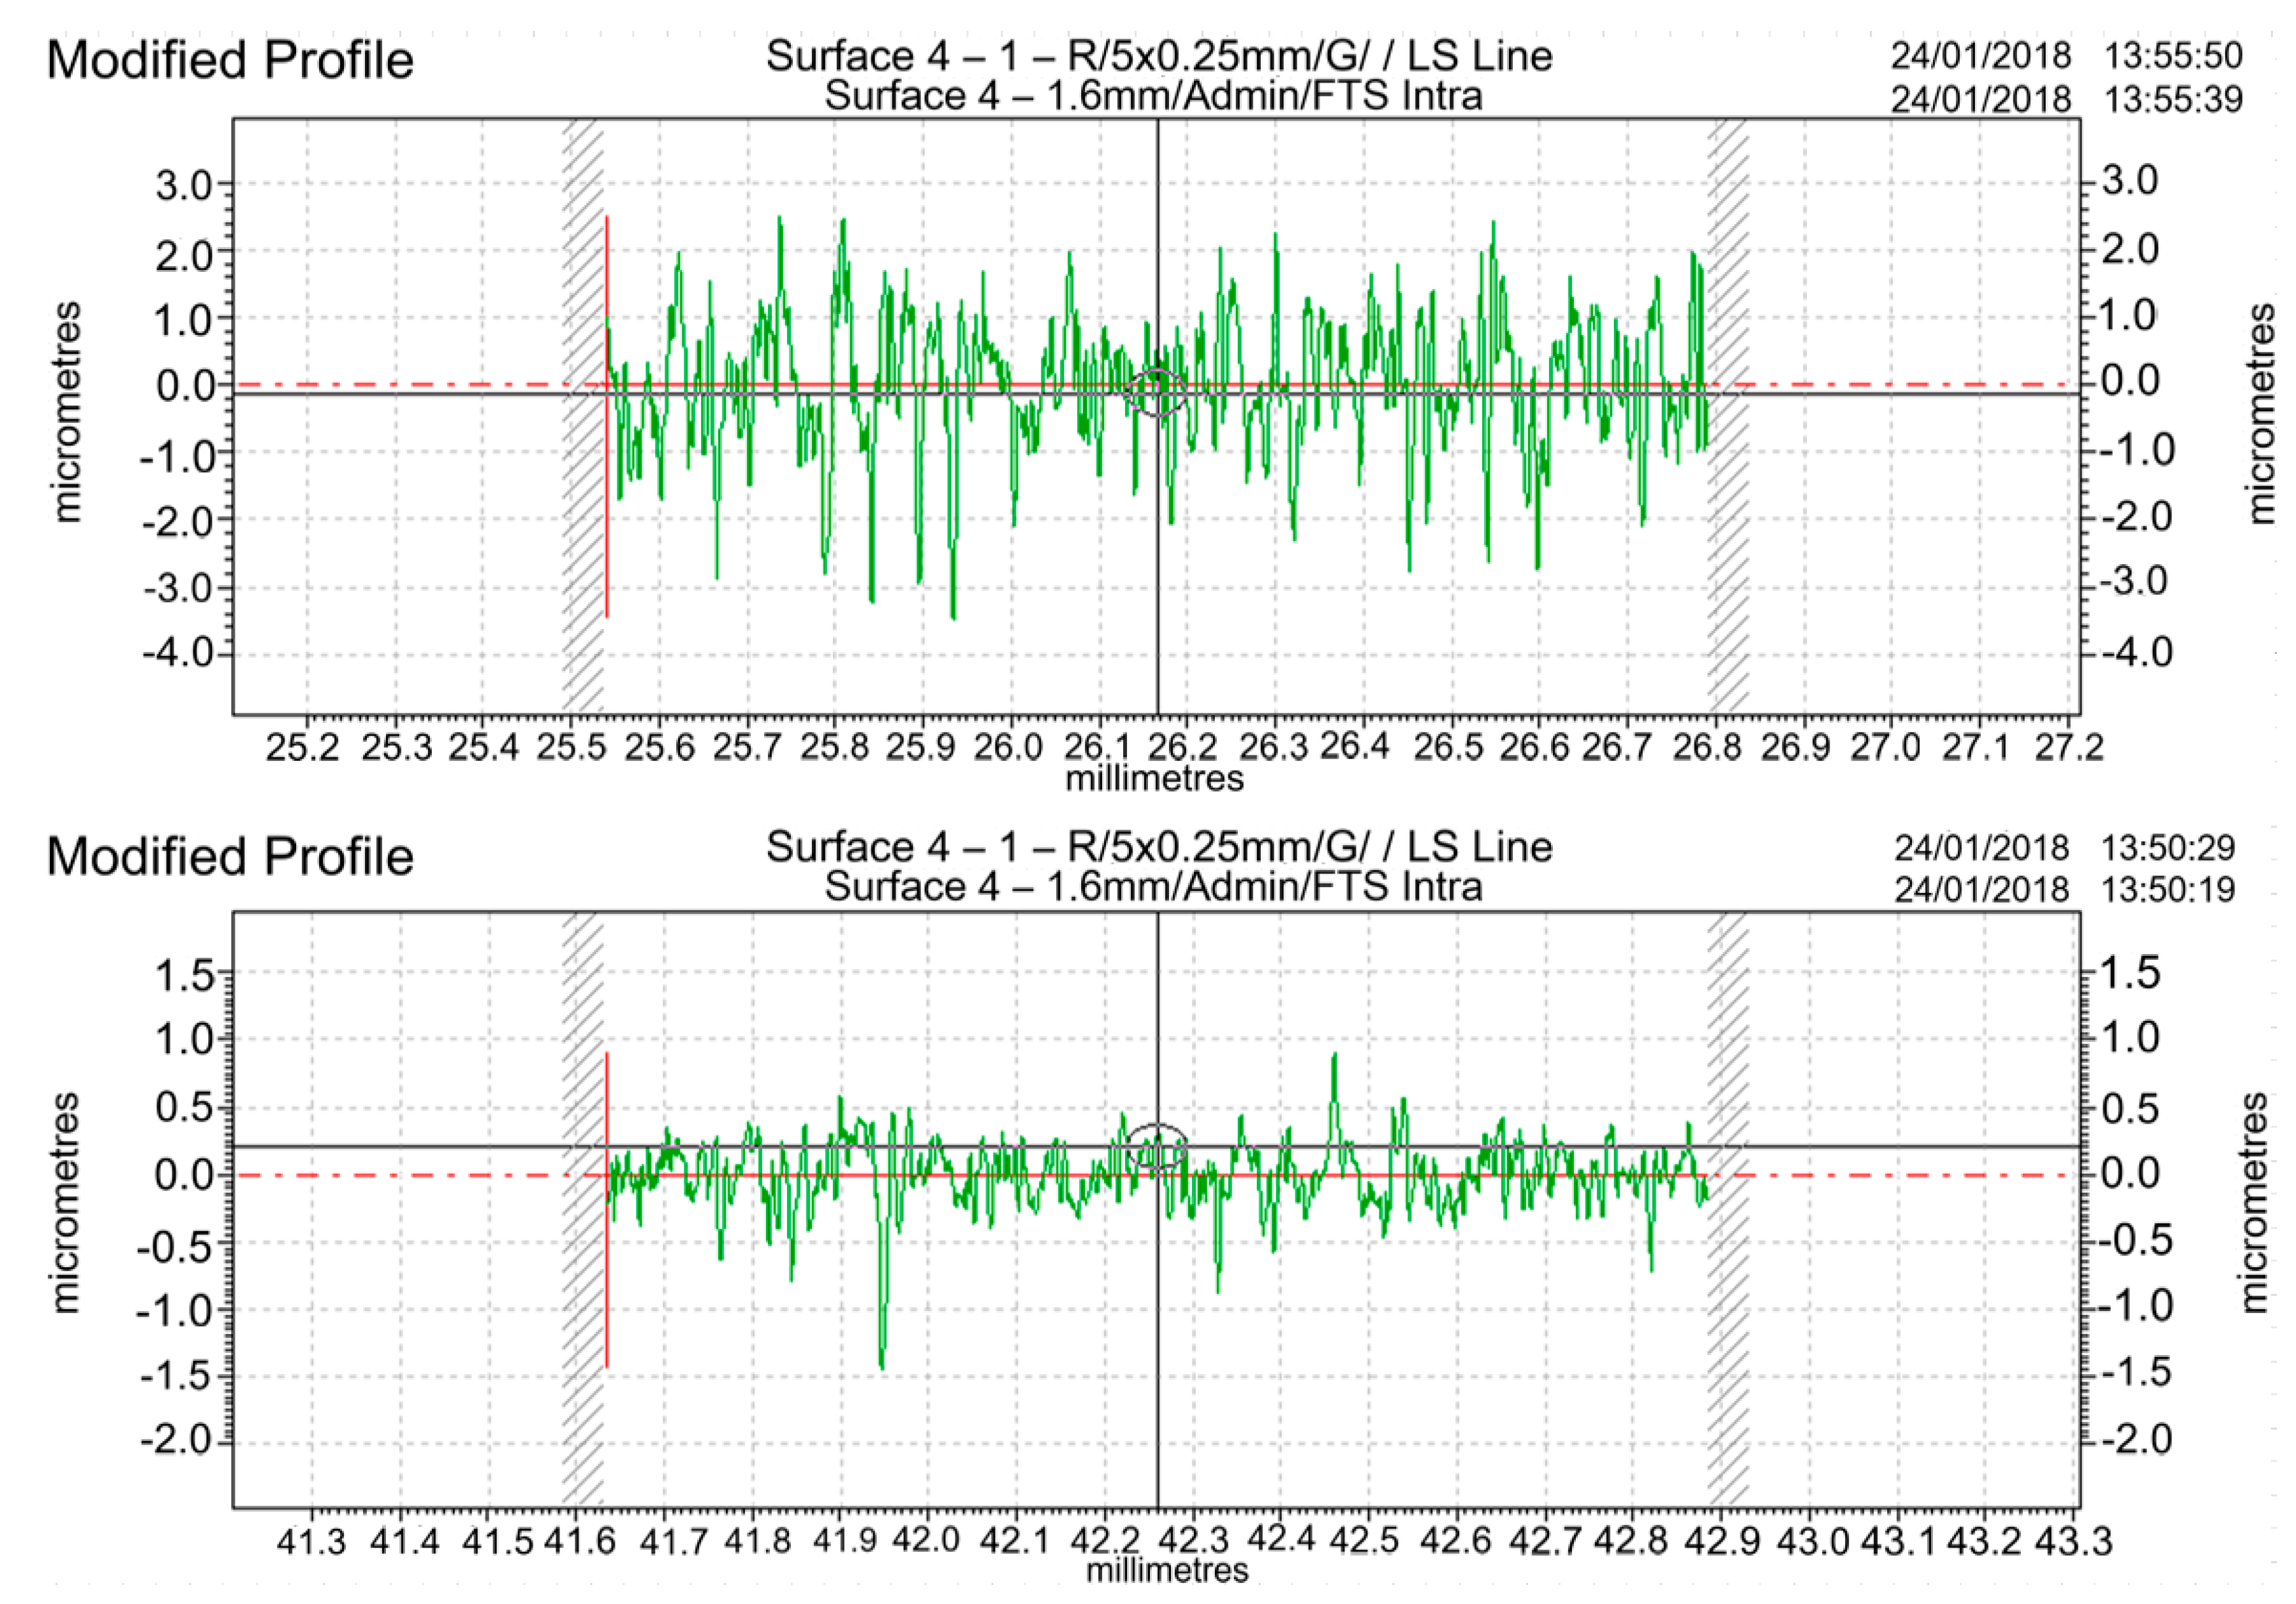
As can be seen from Figure 8, before grinding and polishing, the surface contour fluctuated greatly, and its roughness value was far greater than Ra 0.4 μm. After grinding and polishing, the crest and trough of the surface contour were smoothed, and the roughness value of each point on the surface was less than Ra 0.4 μm, and the minimum longitudinal roughness was Ra 0.4 μm, which was far lower than the requirements of international standards for surface roughness below Ra 0.4 μm. Compared with the Ra values of Ra 0.8 μm which were approximately reached through milling [22] and wheel grinding [23], under approximate conditions, it was obvious that belt grinding has great advantages in improving surface roughness.
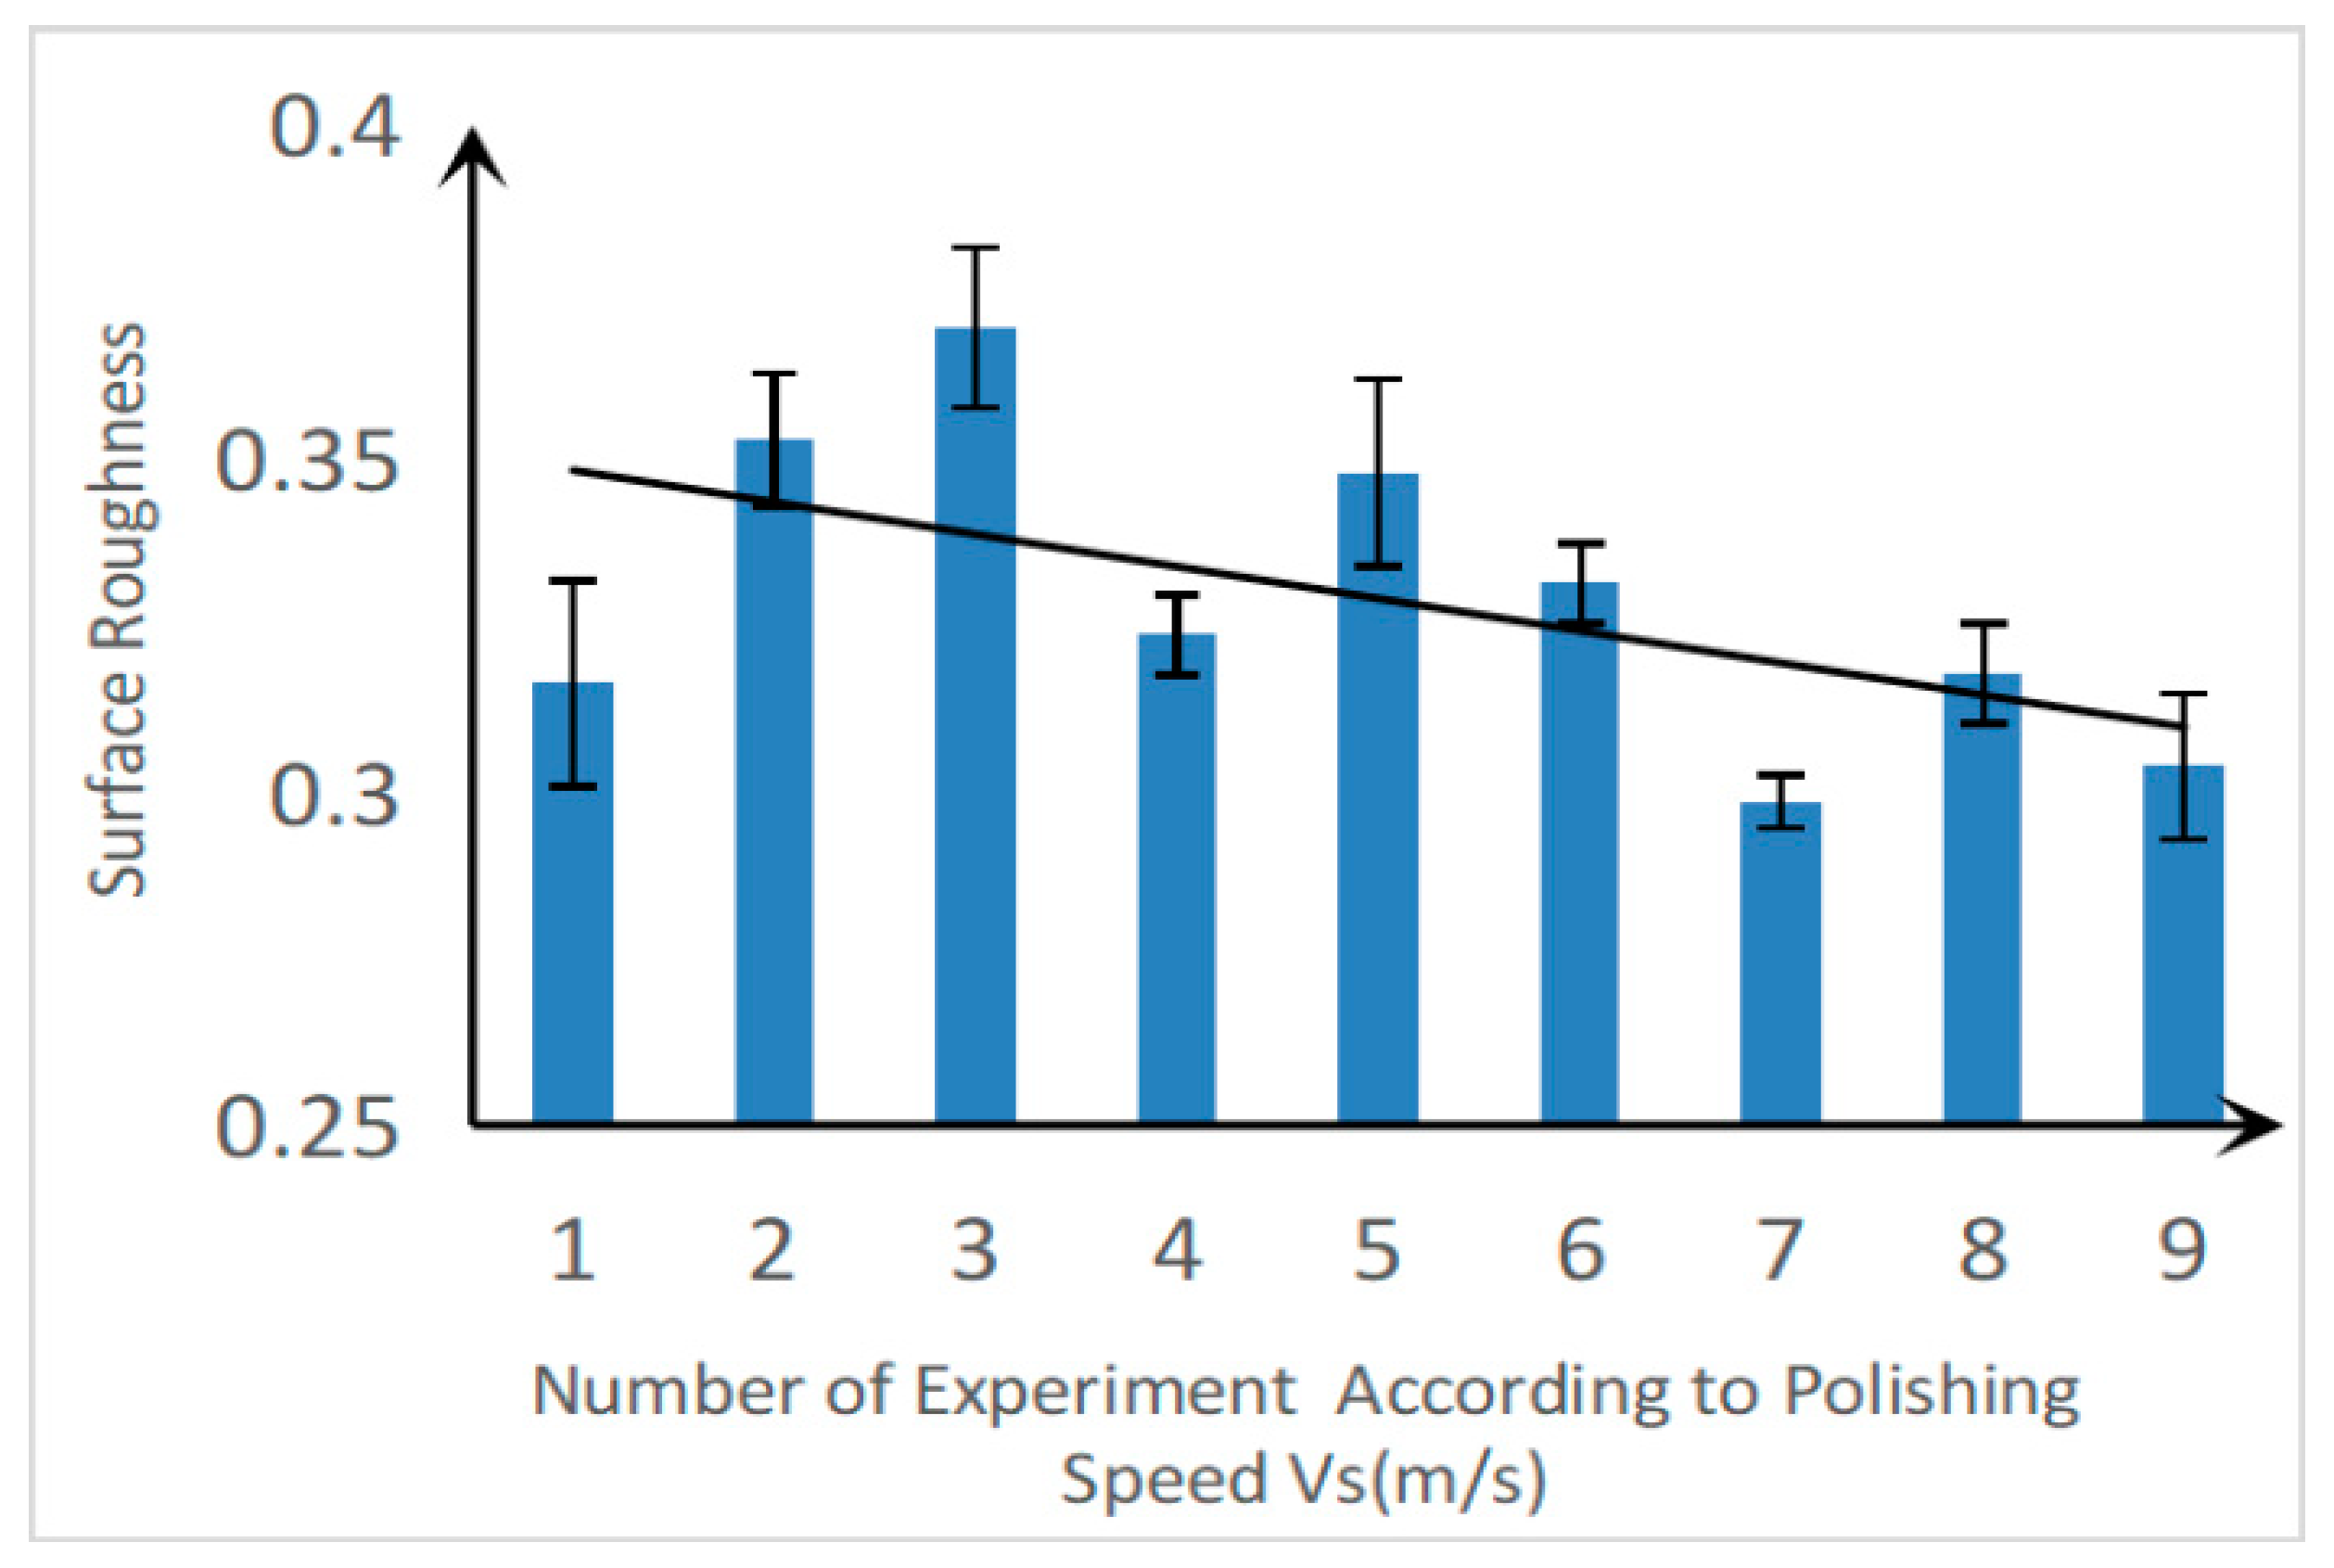
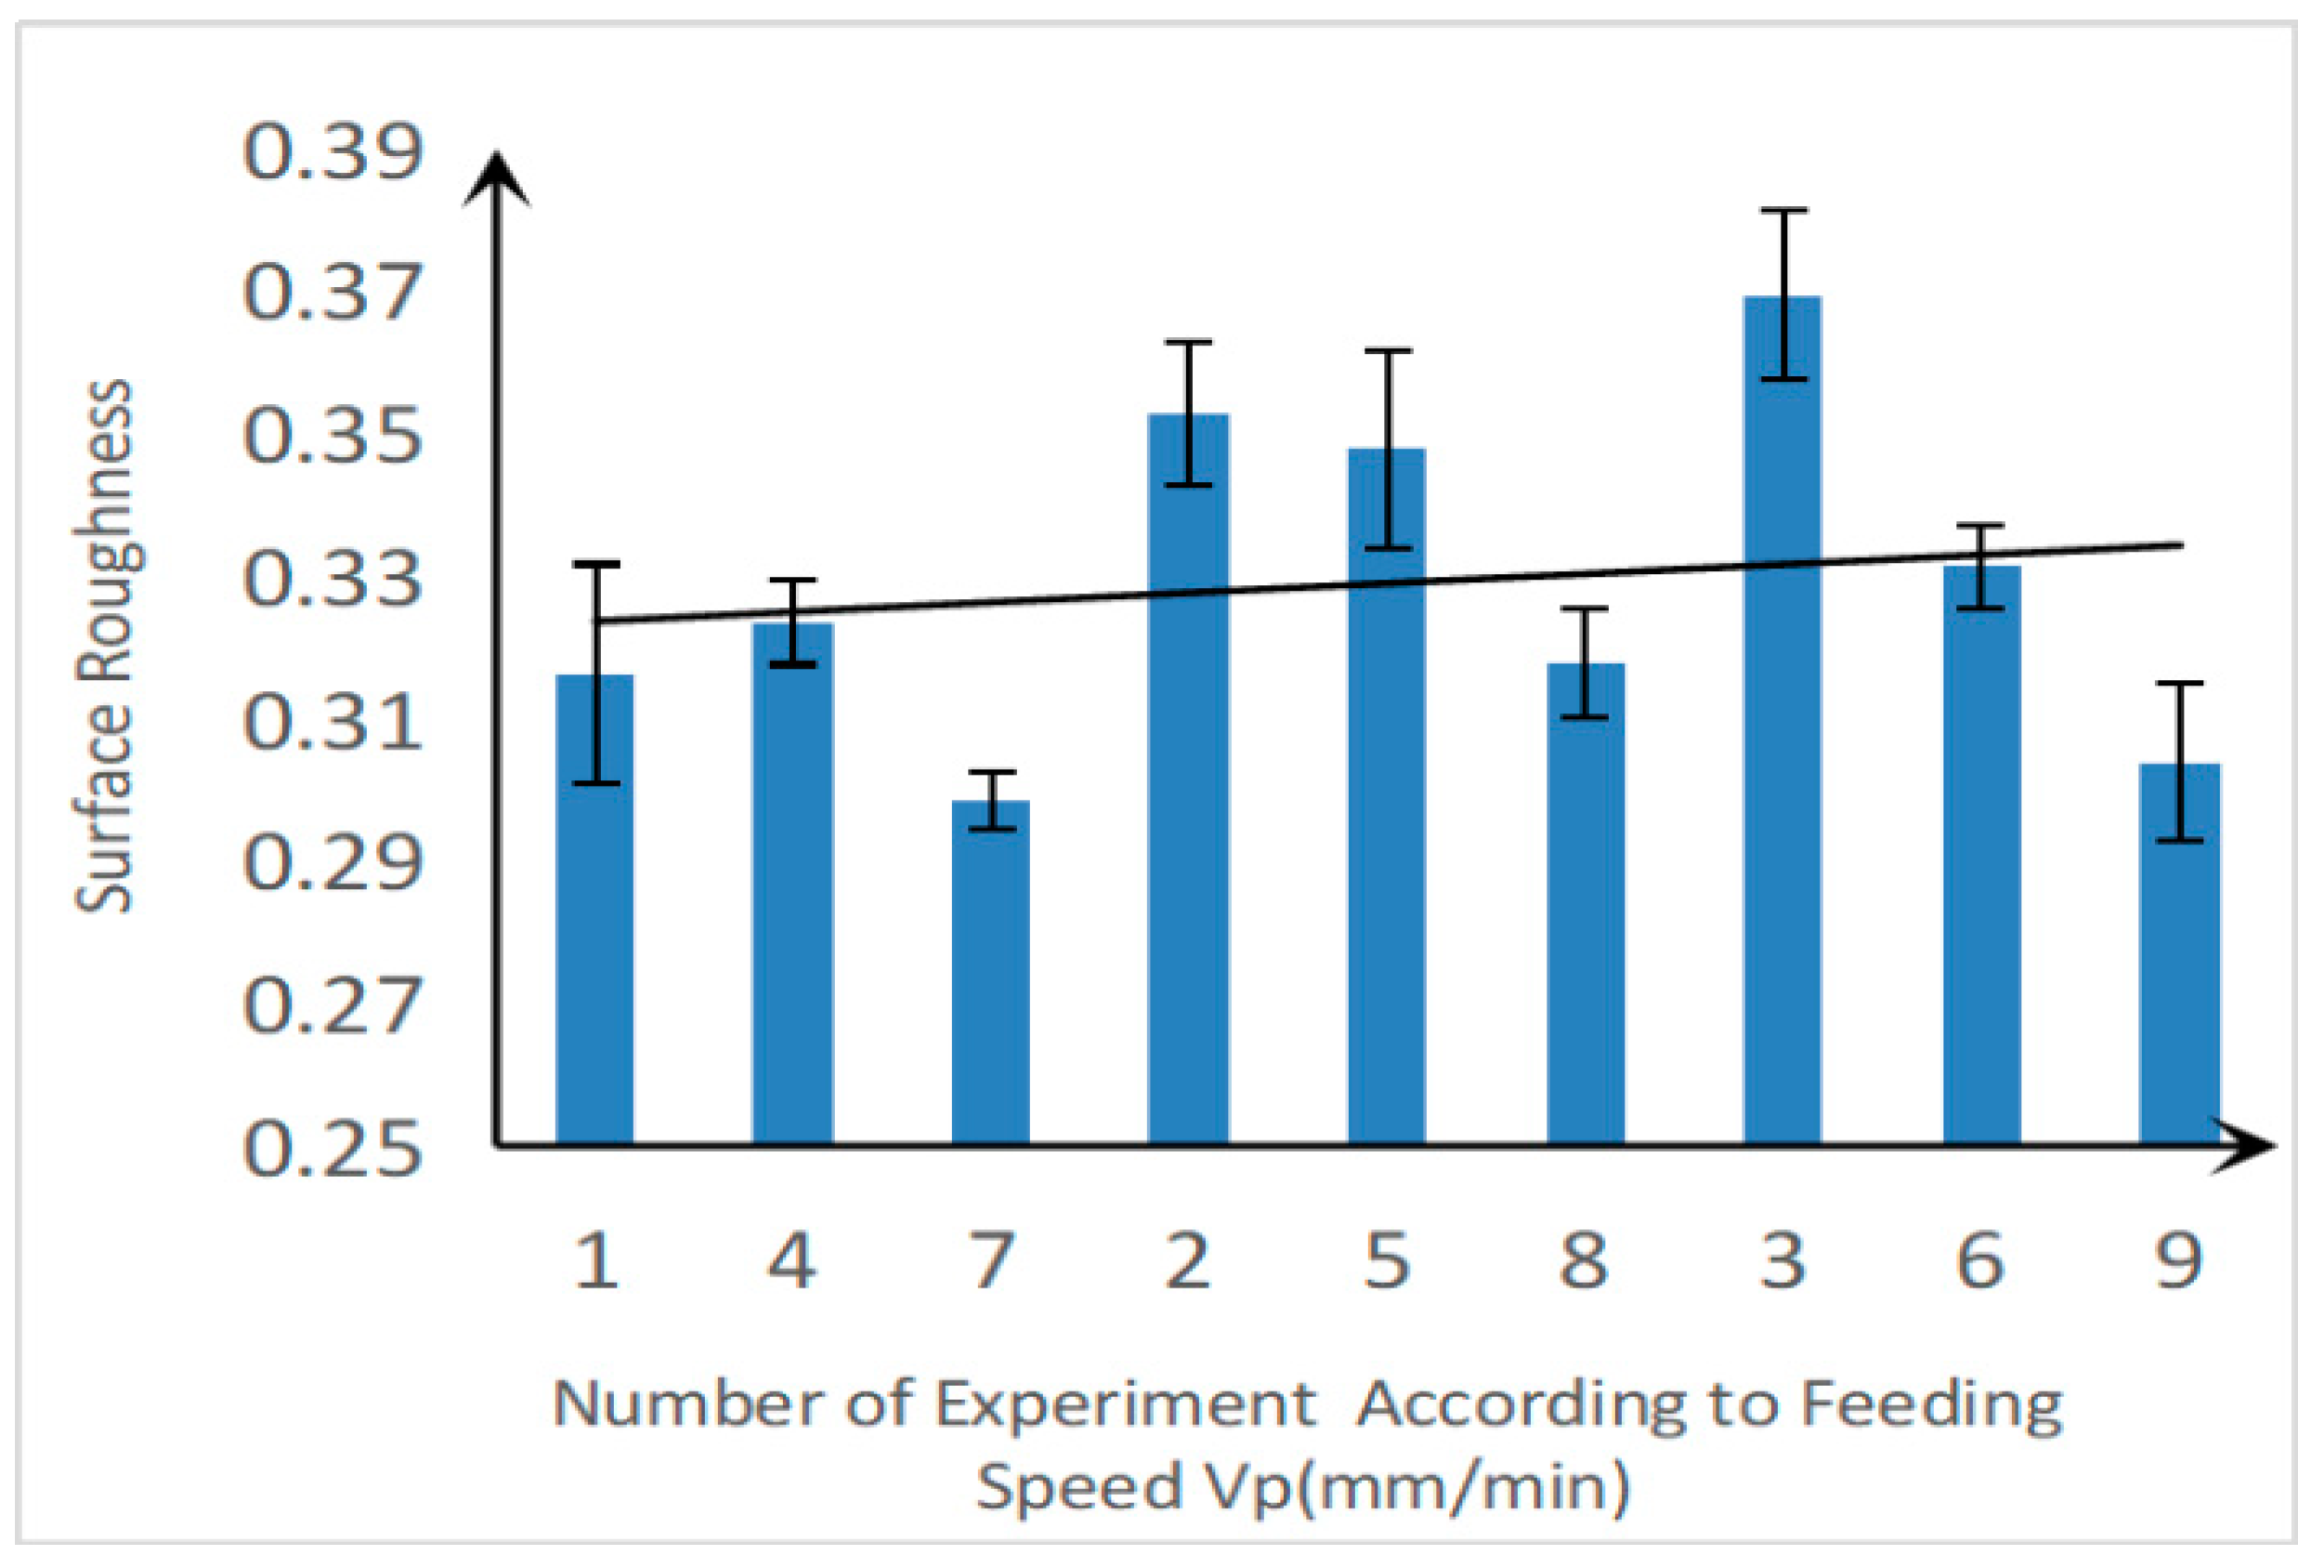
From Figure 9, Figure 10 and Figure 11, it can be seen that with the increase of the line speed of the belt, the Ra value showed a decreasing trend. With the increase of the grinding head’s feeding speed and the amount of downward movement, the Ra value of the surface of the specimen increased. The reasons are as follows:
(1) As the speed of the belt increases, the number of abrasive grains entering the grinding zone per unit time increases, the depth of the single abrasive grain decreases, and the metal surface deforms less. At the same time, the contact time between the workpiece and the abrasive particles is shortened, the bulging height of the metal due to the abrasive plough and the thermoplastic deformation are reduced, and so the roughness value is reduced.
(2) As the feed rate increases, the area of the material cut by the abrasive grains per unit time increases, the chips become thicker, the material removal rate increases, and the grinding groove marks become deep, so that the roughness increases. At the same time, the system vibration increases with the increase of the feed rate, and the processing instability increases, which also leads to an increase of the surface roughness of the machined surface.
(3) The amount of downward movement of the grinding head directly affects the grinding depth of the belt grinding. After the amount of downward movement increases, the depth of the sand cutting into the workpiece surface increases, the thickness of the chips becomes thicker, the texture groove becomes deeper, and the surface roughness is increased. At the same time, an increase in the depth of grinding will result in increased wear of the abrasive belt, a decrease in the grinding ability, and thus, vibrations in the system, as well as an increase in the Ra value.
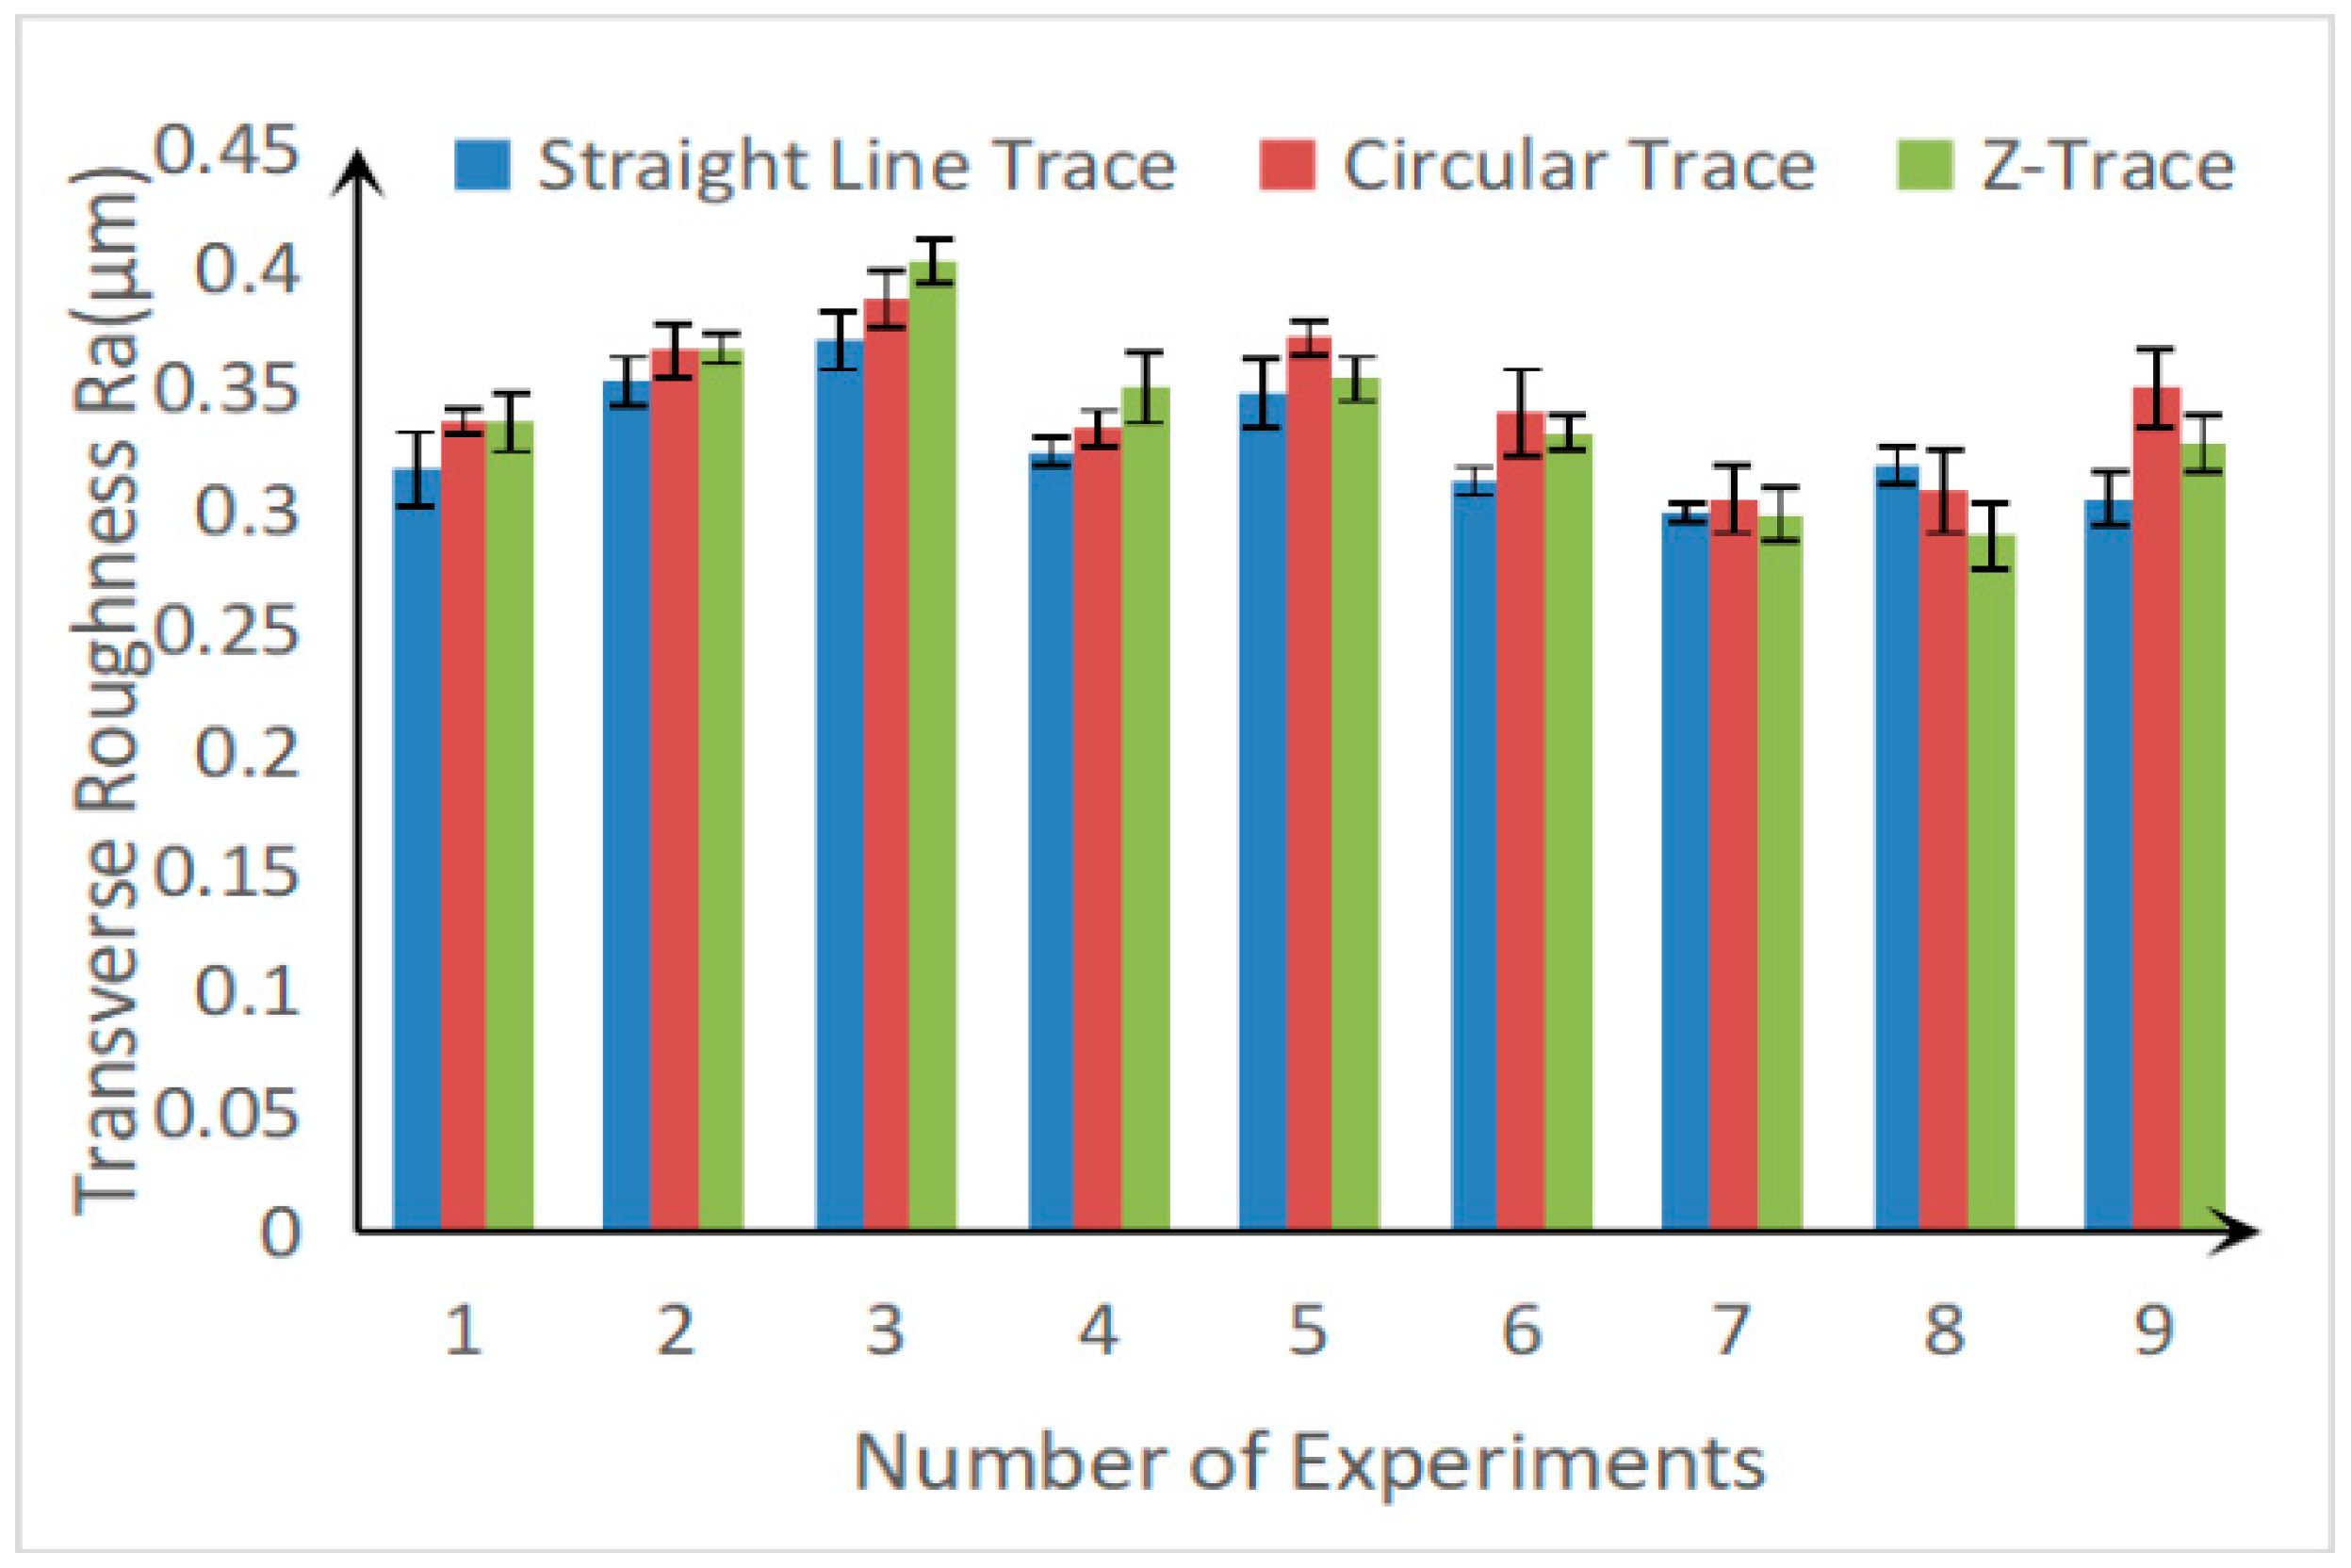
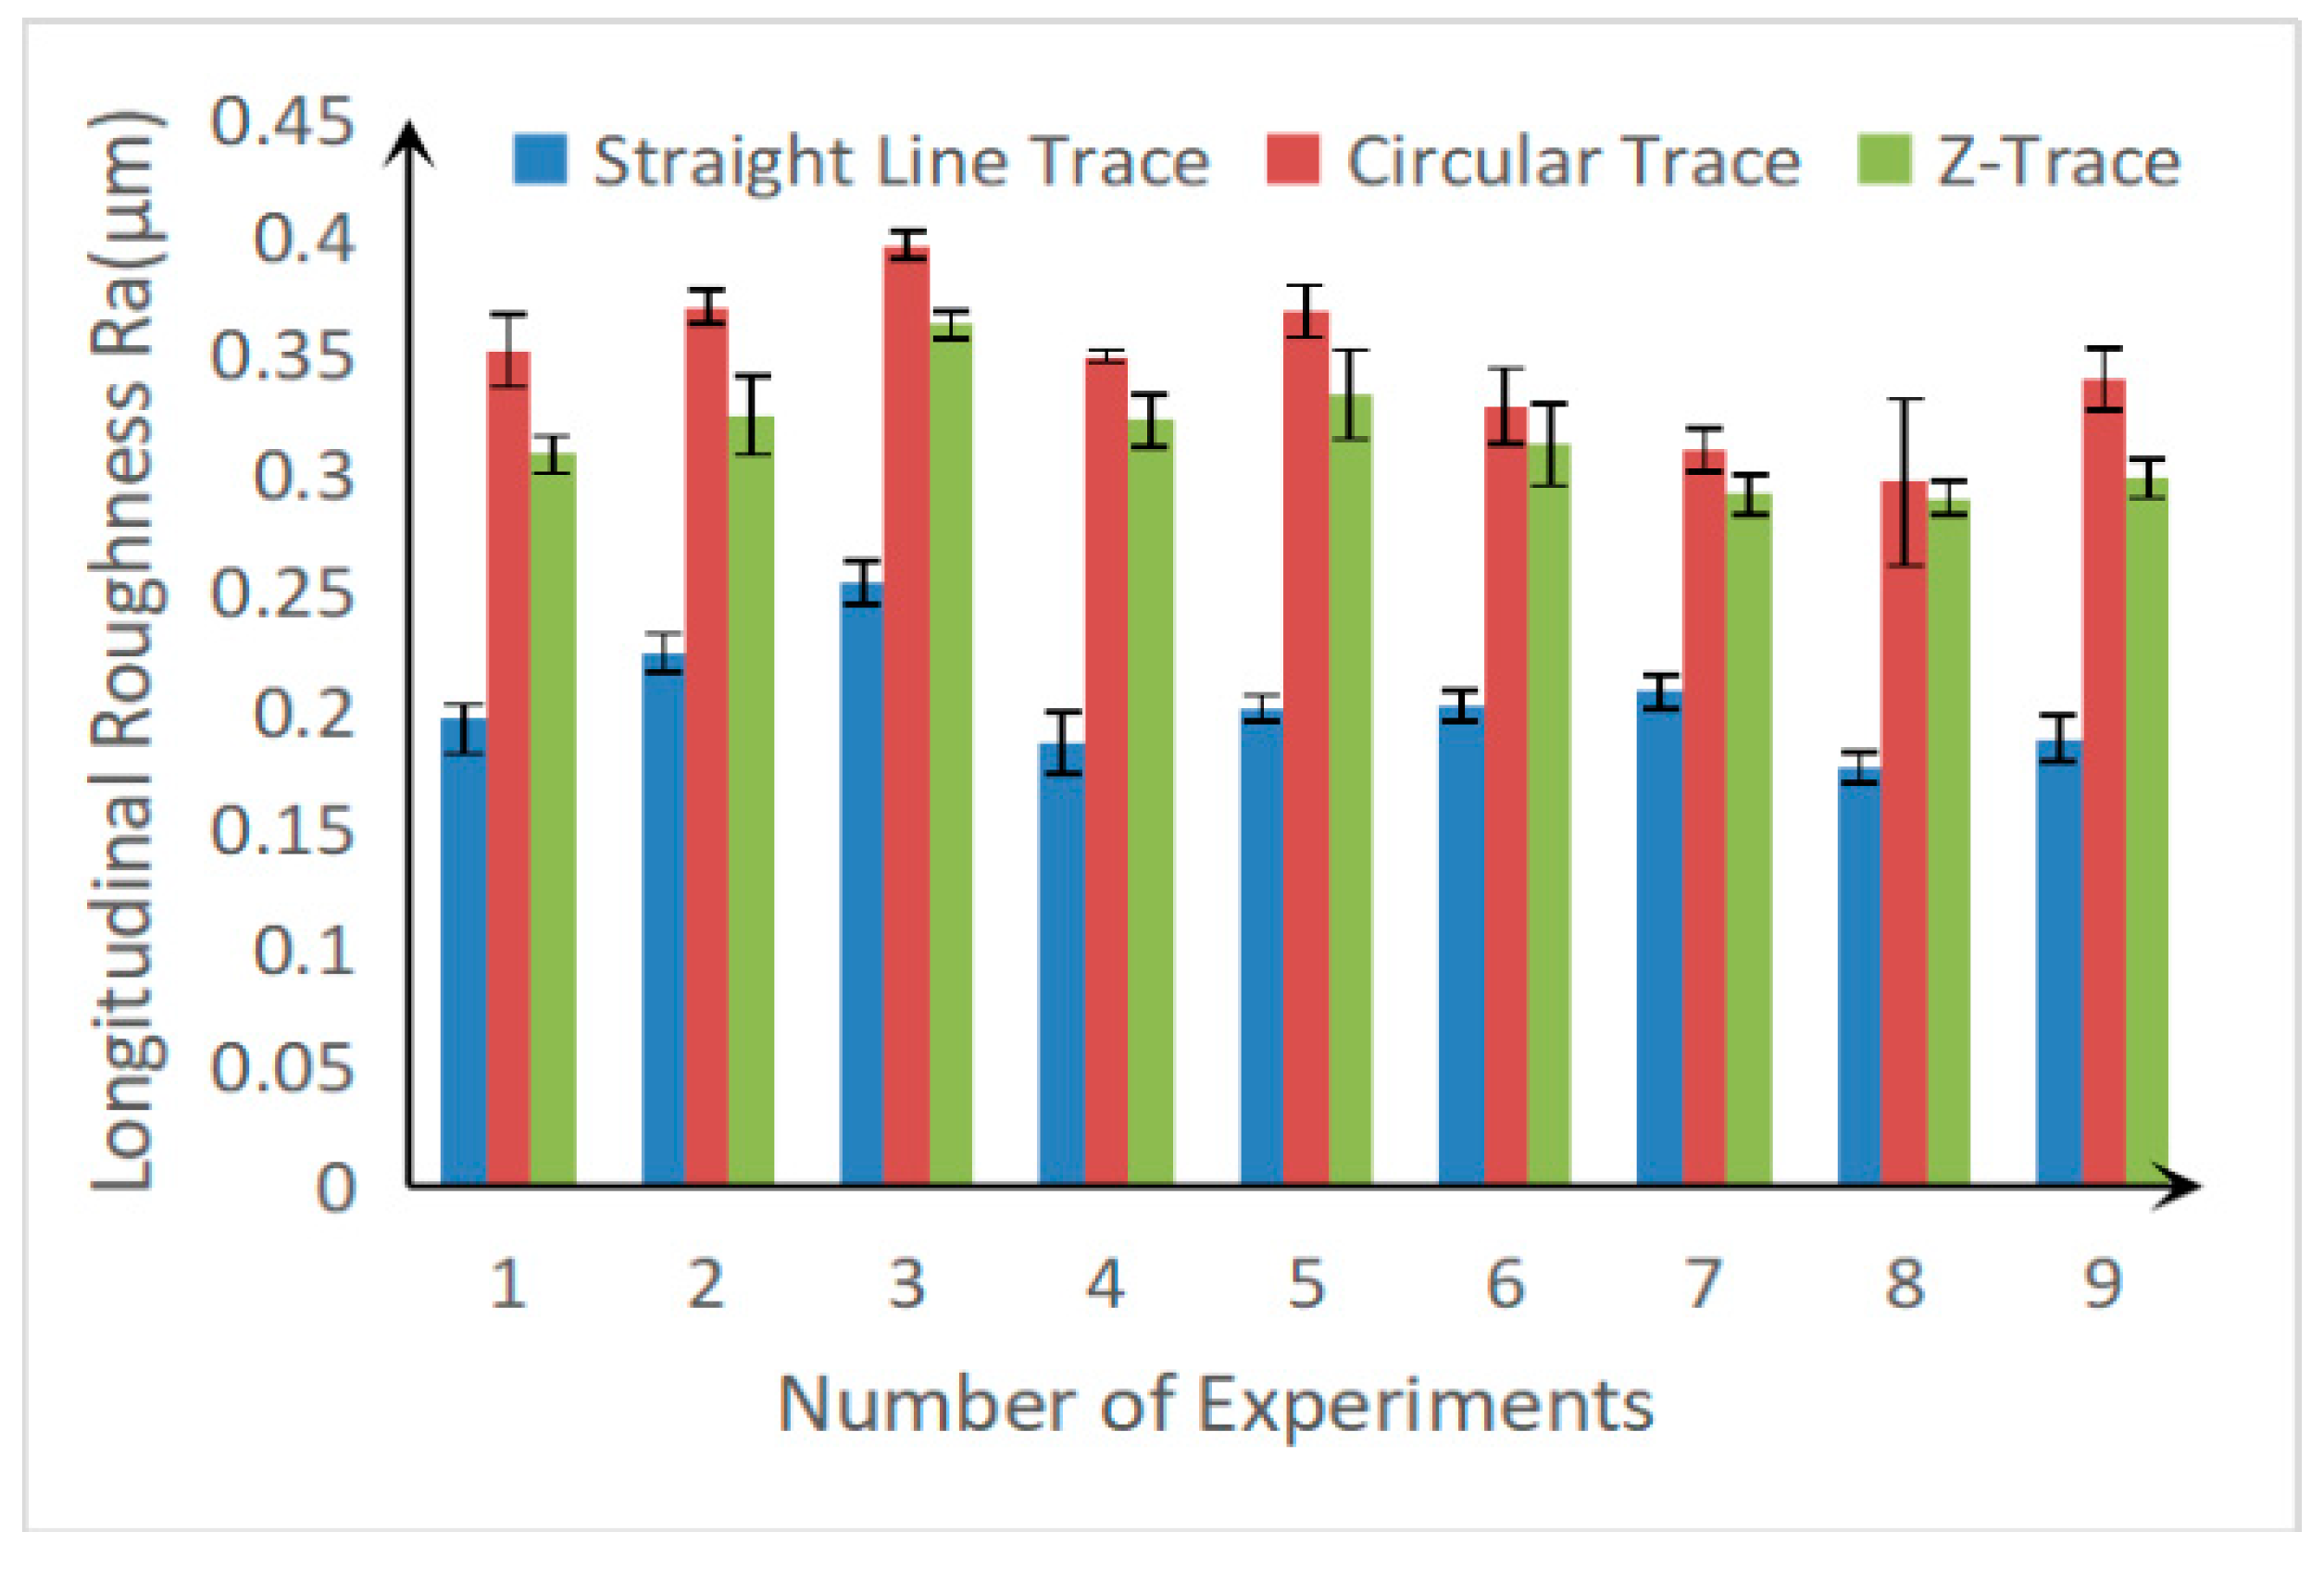
Comparing Figure 12 to Figure 13, we can see that in the serially numbered linear trajectory grinding test, the longitudinal roughness in the parallel grinding direction was always much smaller than the transverse roughness in the vertical grinding direction. This was due to the better consistency of the microtexture on the belt. Therefore, when the roughness test was performed, the roughness of the roughness probe was smaller when the probe moved in the feed direction, that is, in the grain direction compared to the vertical feed direction, and thus, the average roughness value was smaller than the roughness horizontal Ra value.
In the circular trajectory grinding experiment, there was no significant difference between the lateral and longitudinal Ra values, and the longitudinal Ra value was significantly larger than that of the other two grinding trajectories. The reason for this result is that the direction of the belt speed was different from the belt feeding direction, and there was a certain included angle. At the same time, the direction of the feed speed of the belt was constantly changing, which led to the fact that the actual movement direction of the abrasive grains on the belt was constantly changing. Thus, the actual grinding texture was a curve. Therefore, whether it was a lateral measurement or a longitudinal measurement, the effect measured along the grain direction could not be achieved, resulting in an increase in the longitudinal Ra value.
In the serial Z-shaped trajectory grinding test, the transverse Ra value was greater than the longitudinal Ra value, and its transverse and longitudinal Ra values were larger than those obtained by the straight path trajectory grinding test, but they were smaller than the data obtained from the second set of experiments. In the grinding process of the zigzag trajectory, two directions of texture were generated. One was the same as the straight grinding direction, and it was parallel to the Y-axis. The other was an oblique direction that was not parallel to the Y-axis. When the horizontal and vertical Ra values were detected, data similar to the first set of experiments were found at the texture of the parallel Y-axis, but the data measured at the oblique textures on the non-parallel Y-axis were similar to the second set. Therefore, the Ra value obtained after the average calculation was between the values of the first group and the second group of experiments.
3.3. Surface Residual Stress
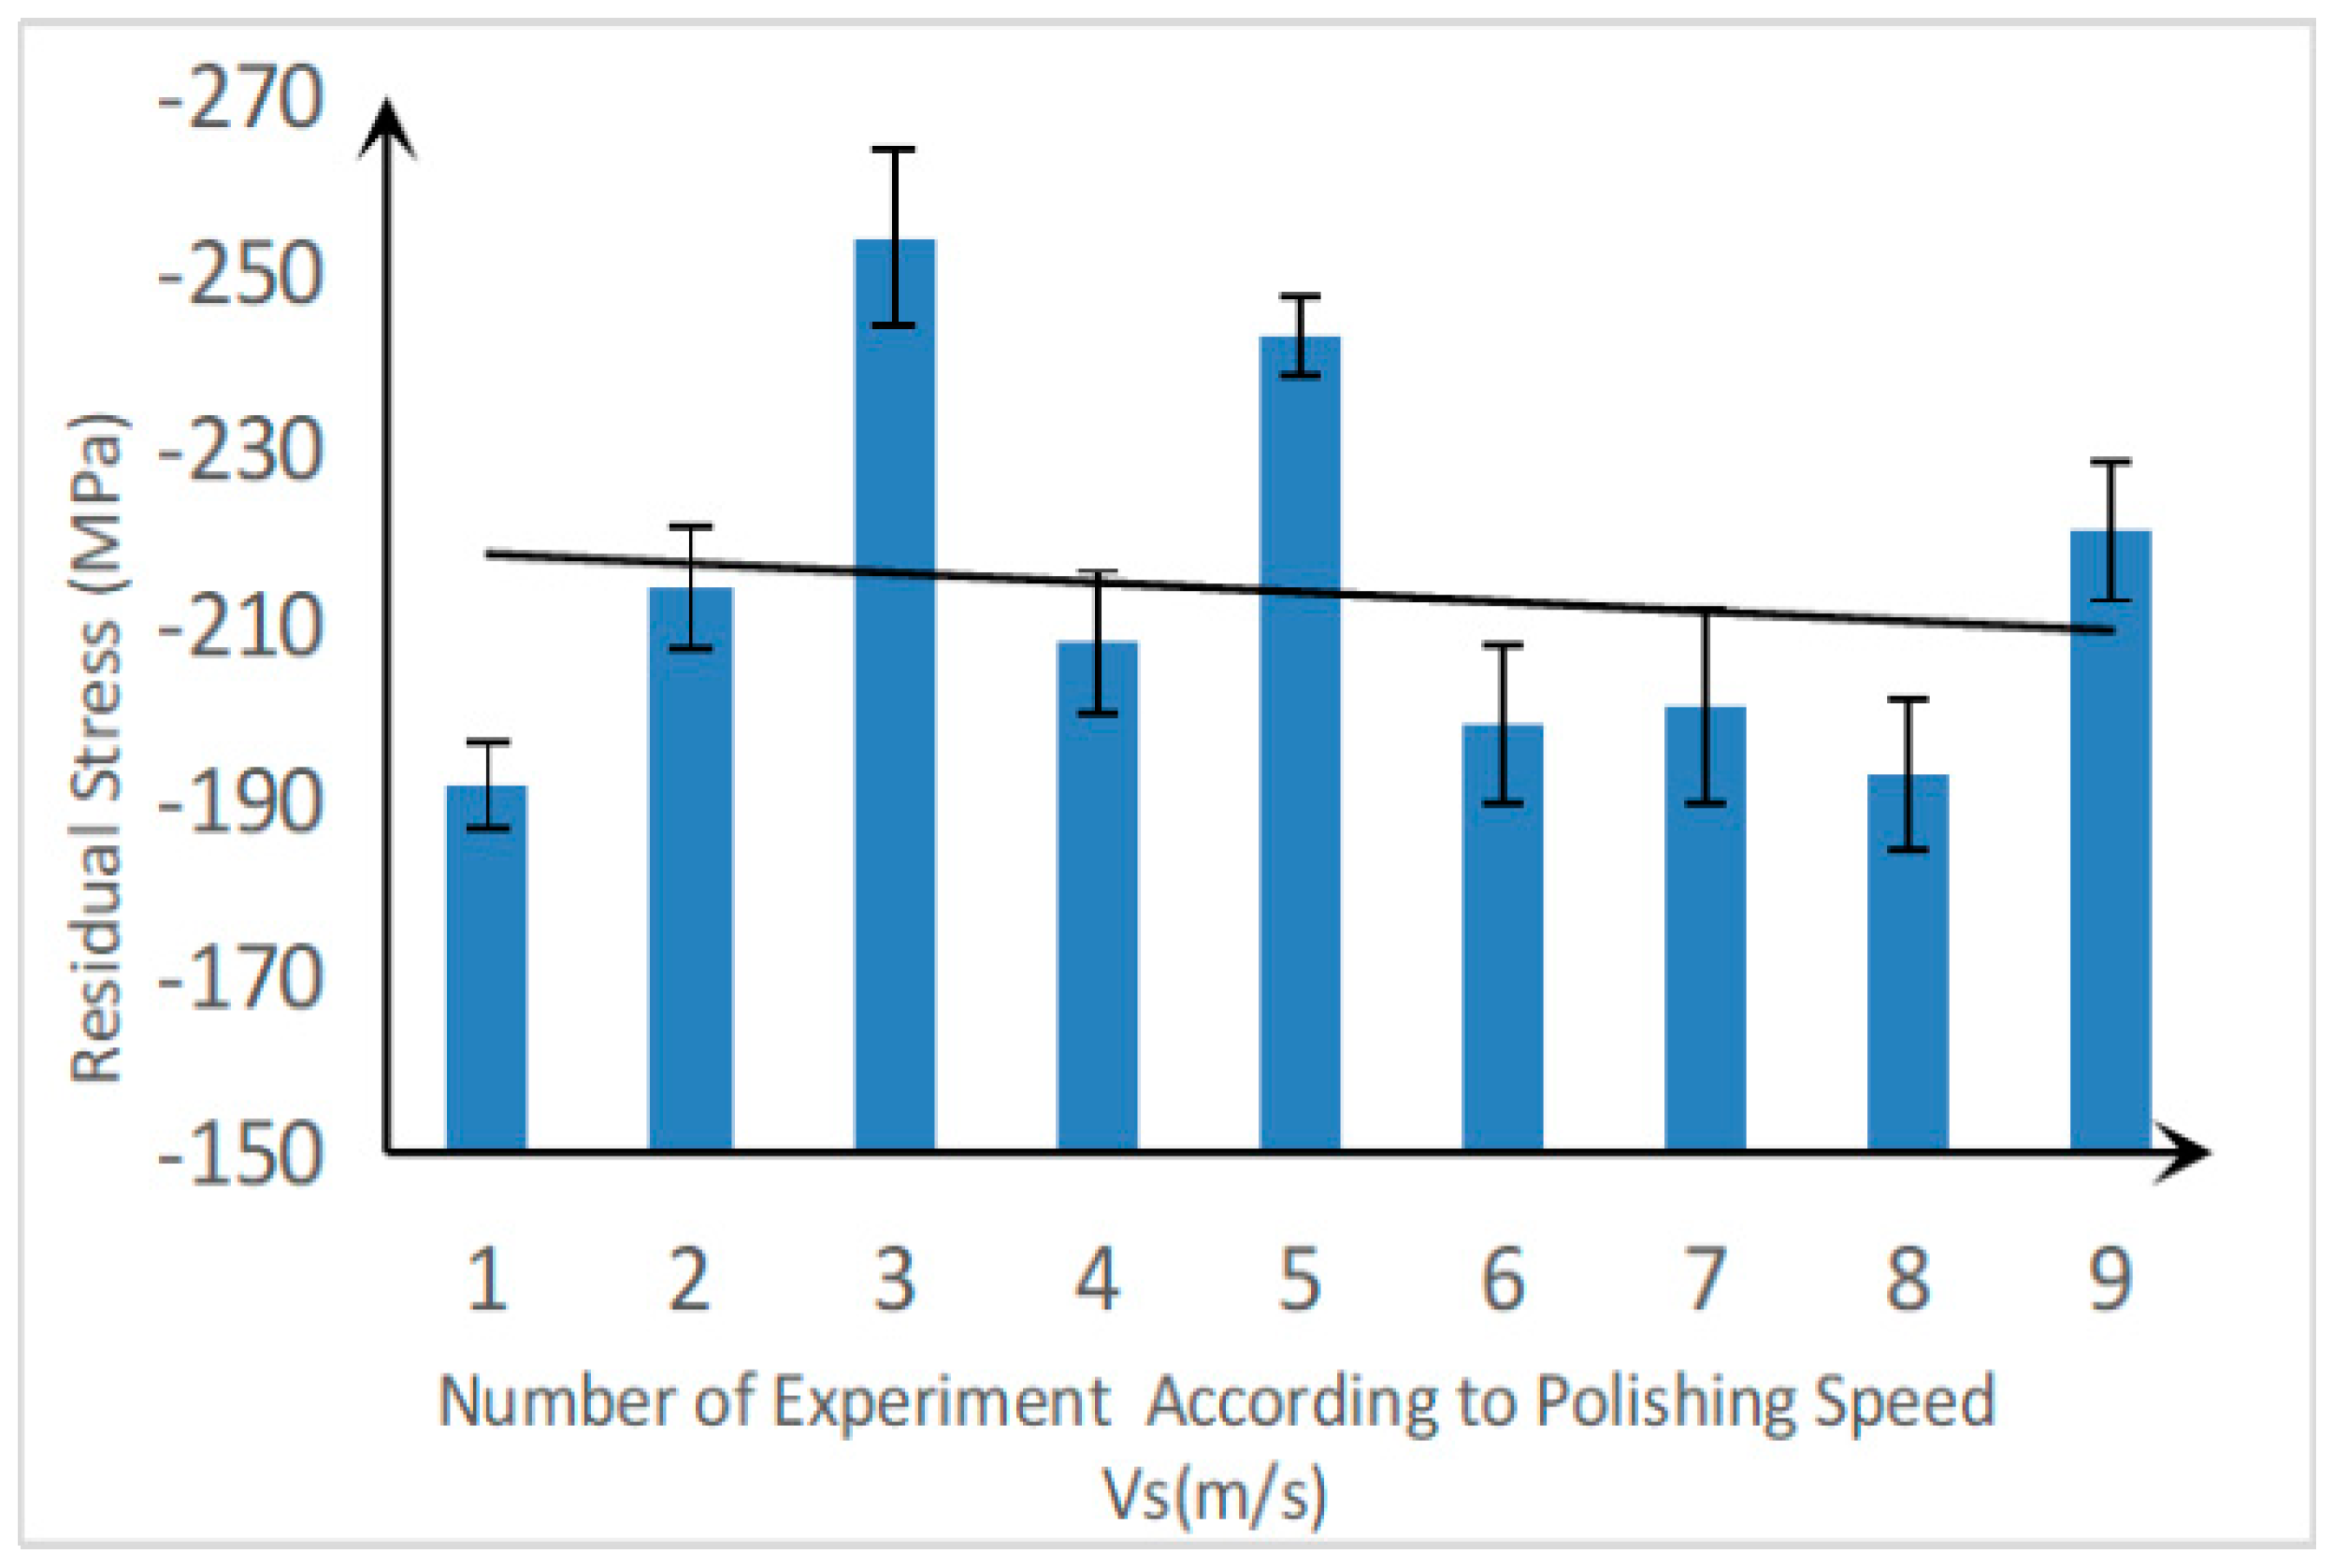
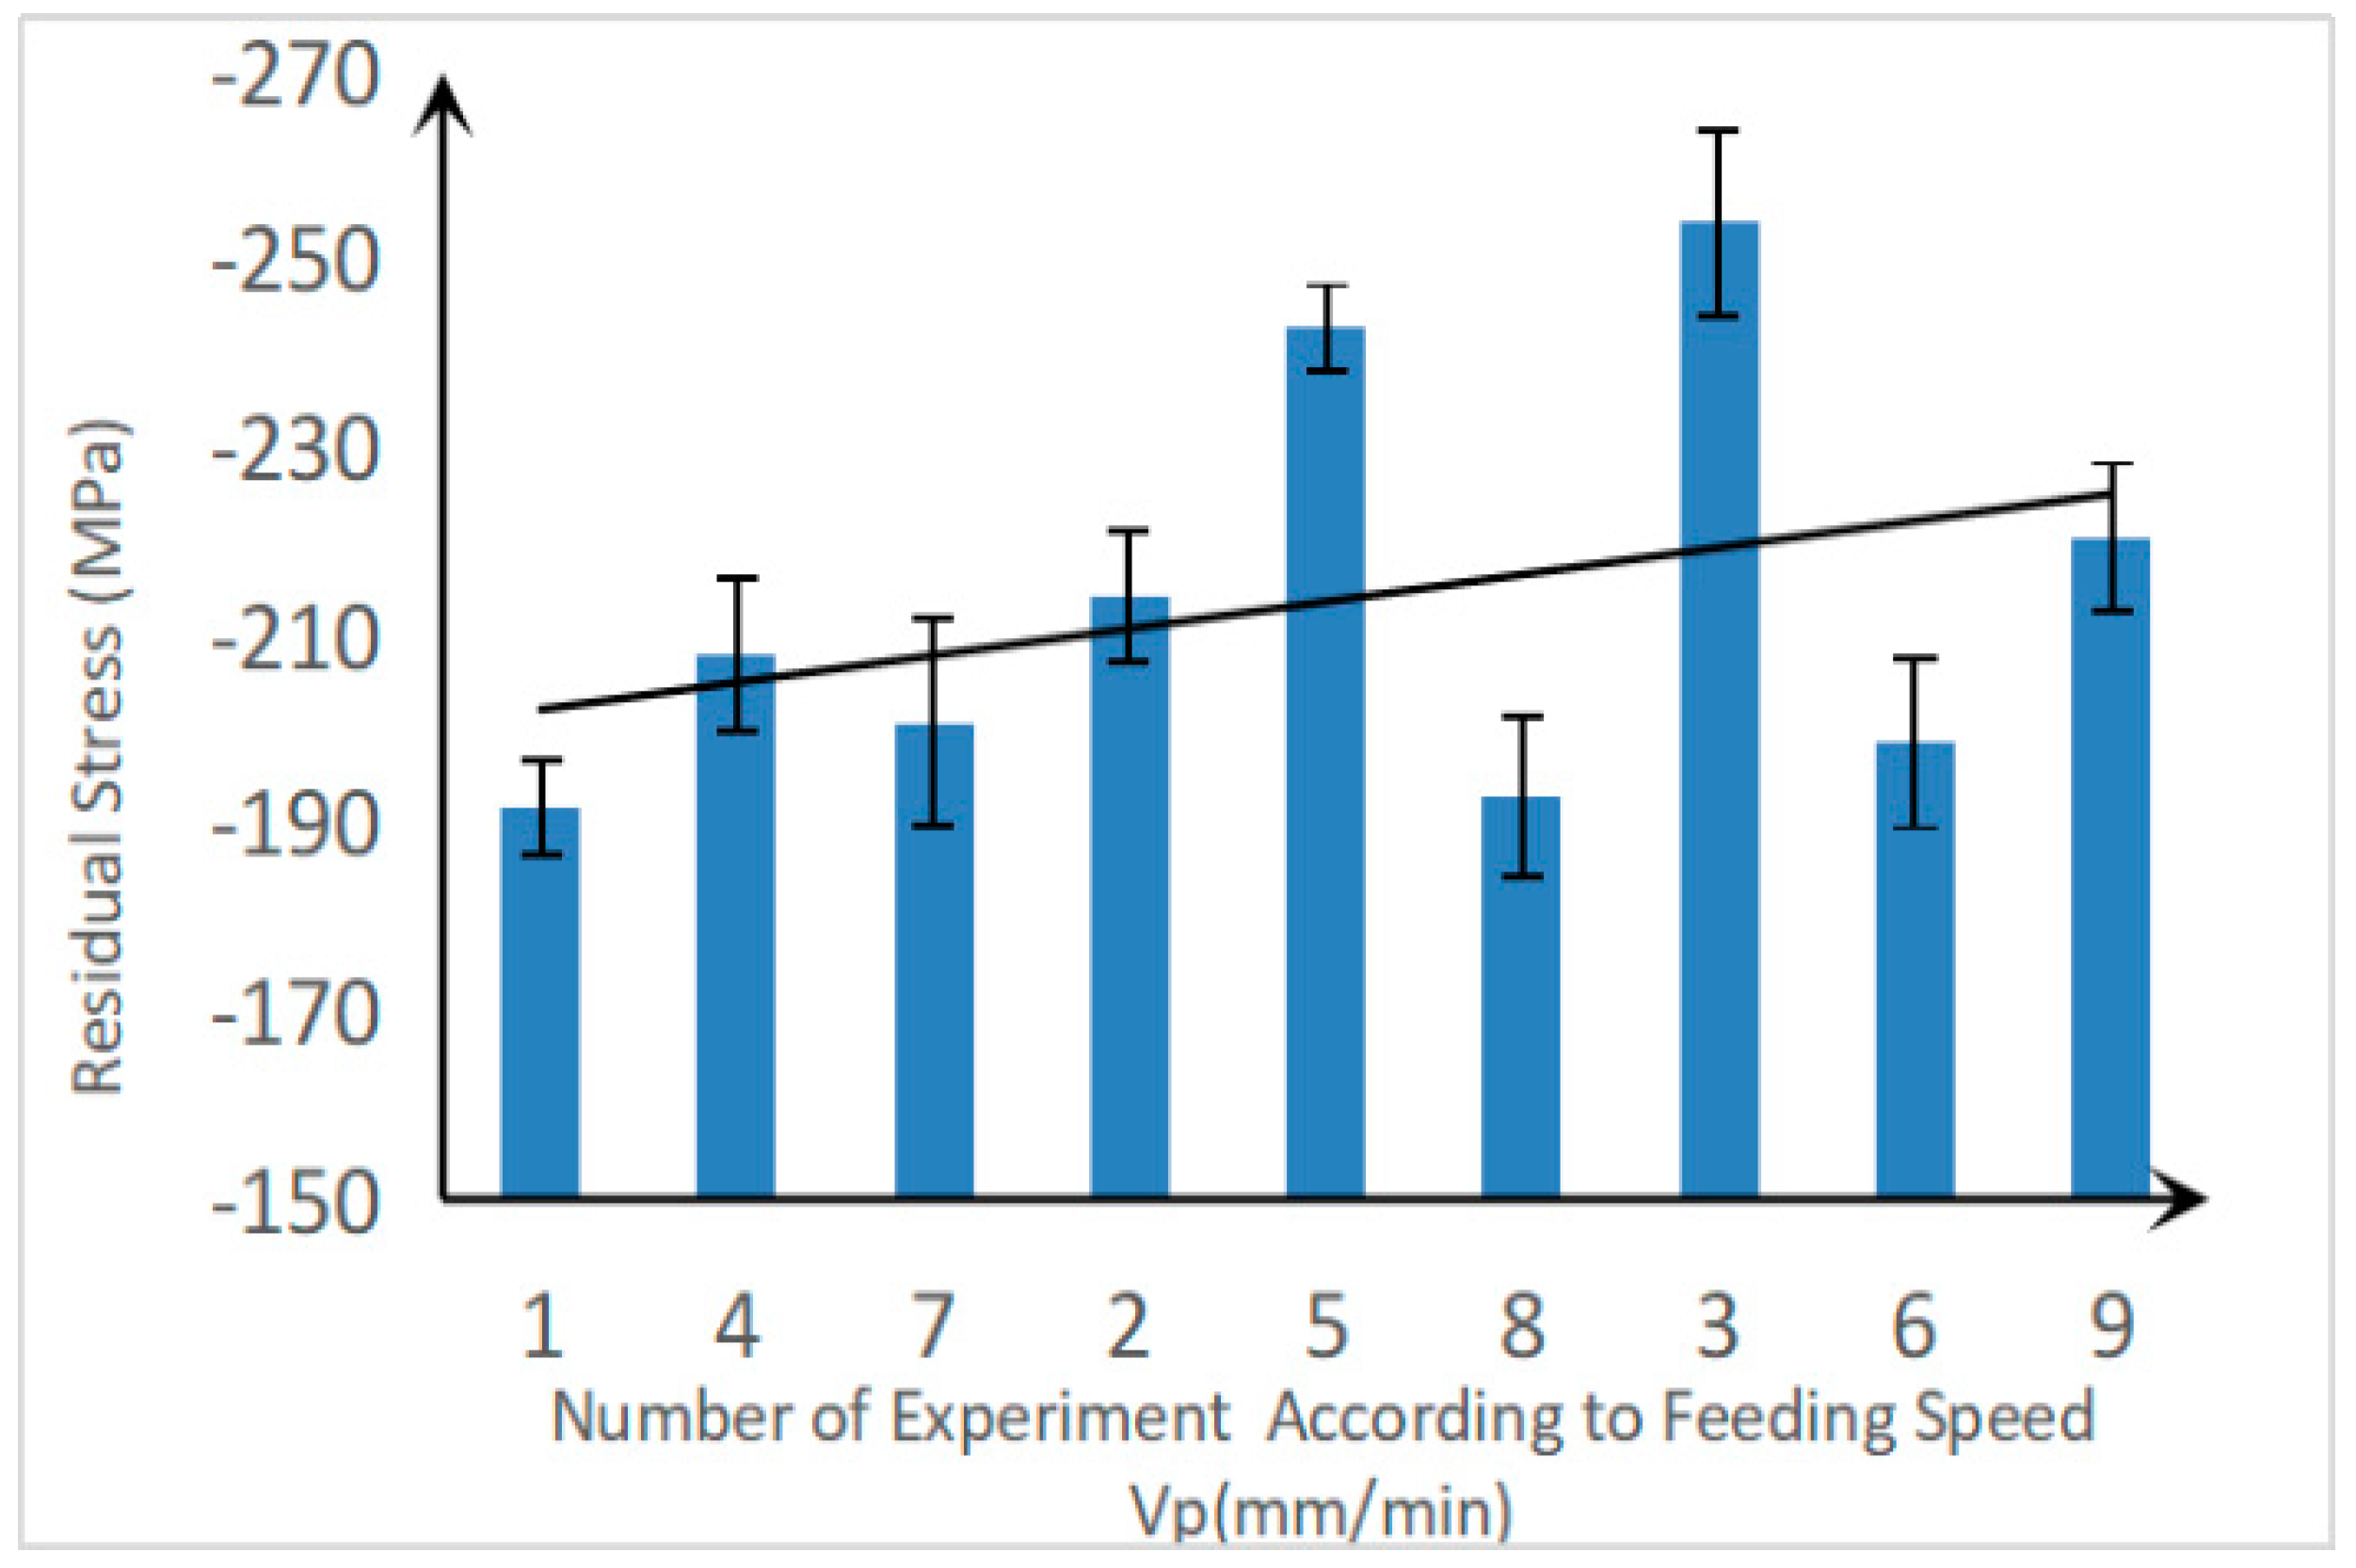
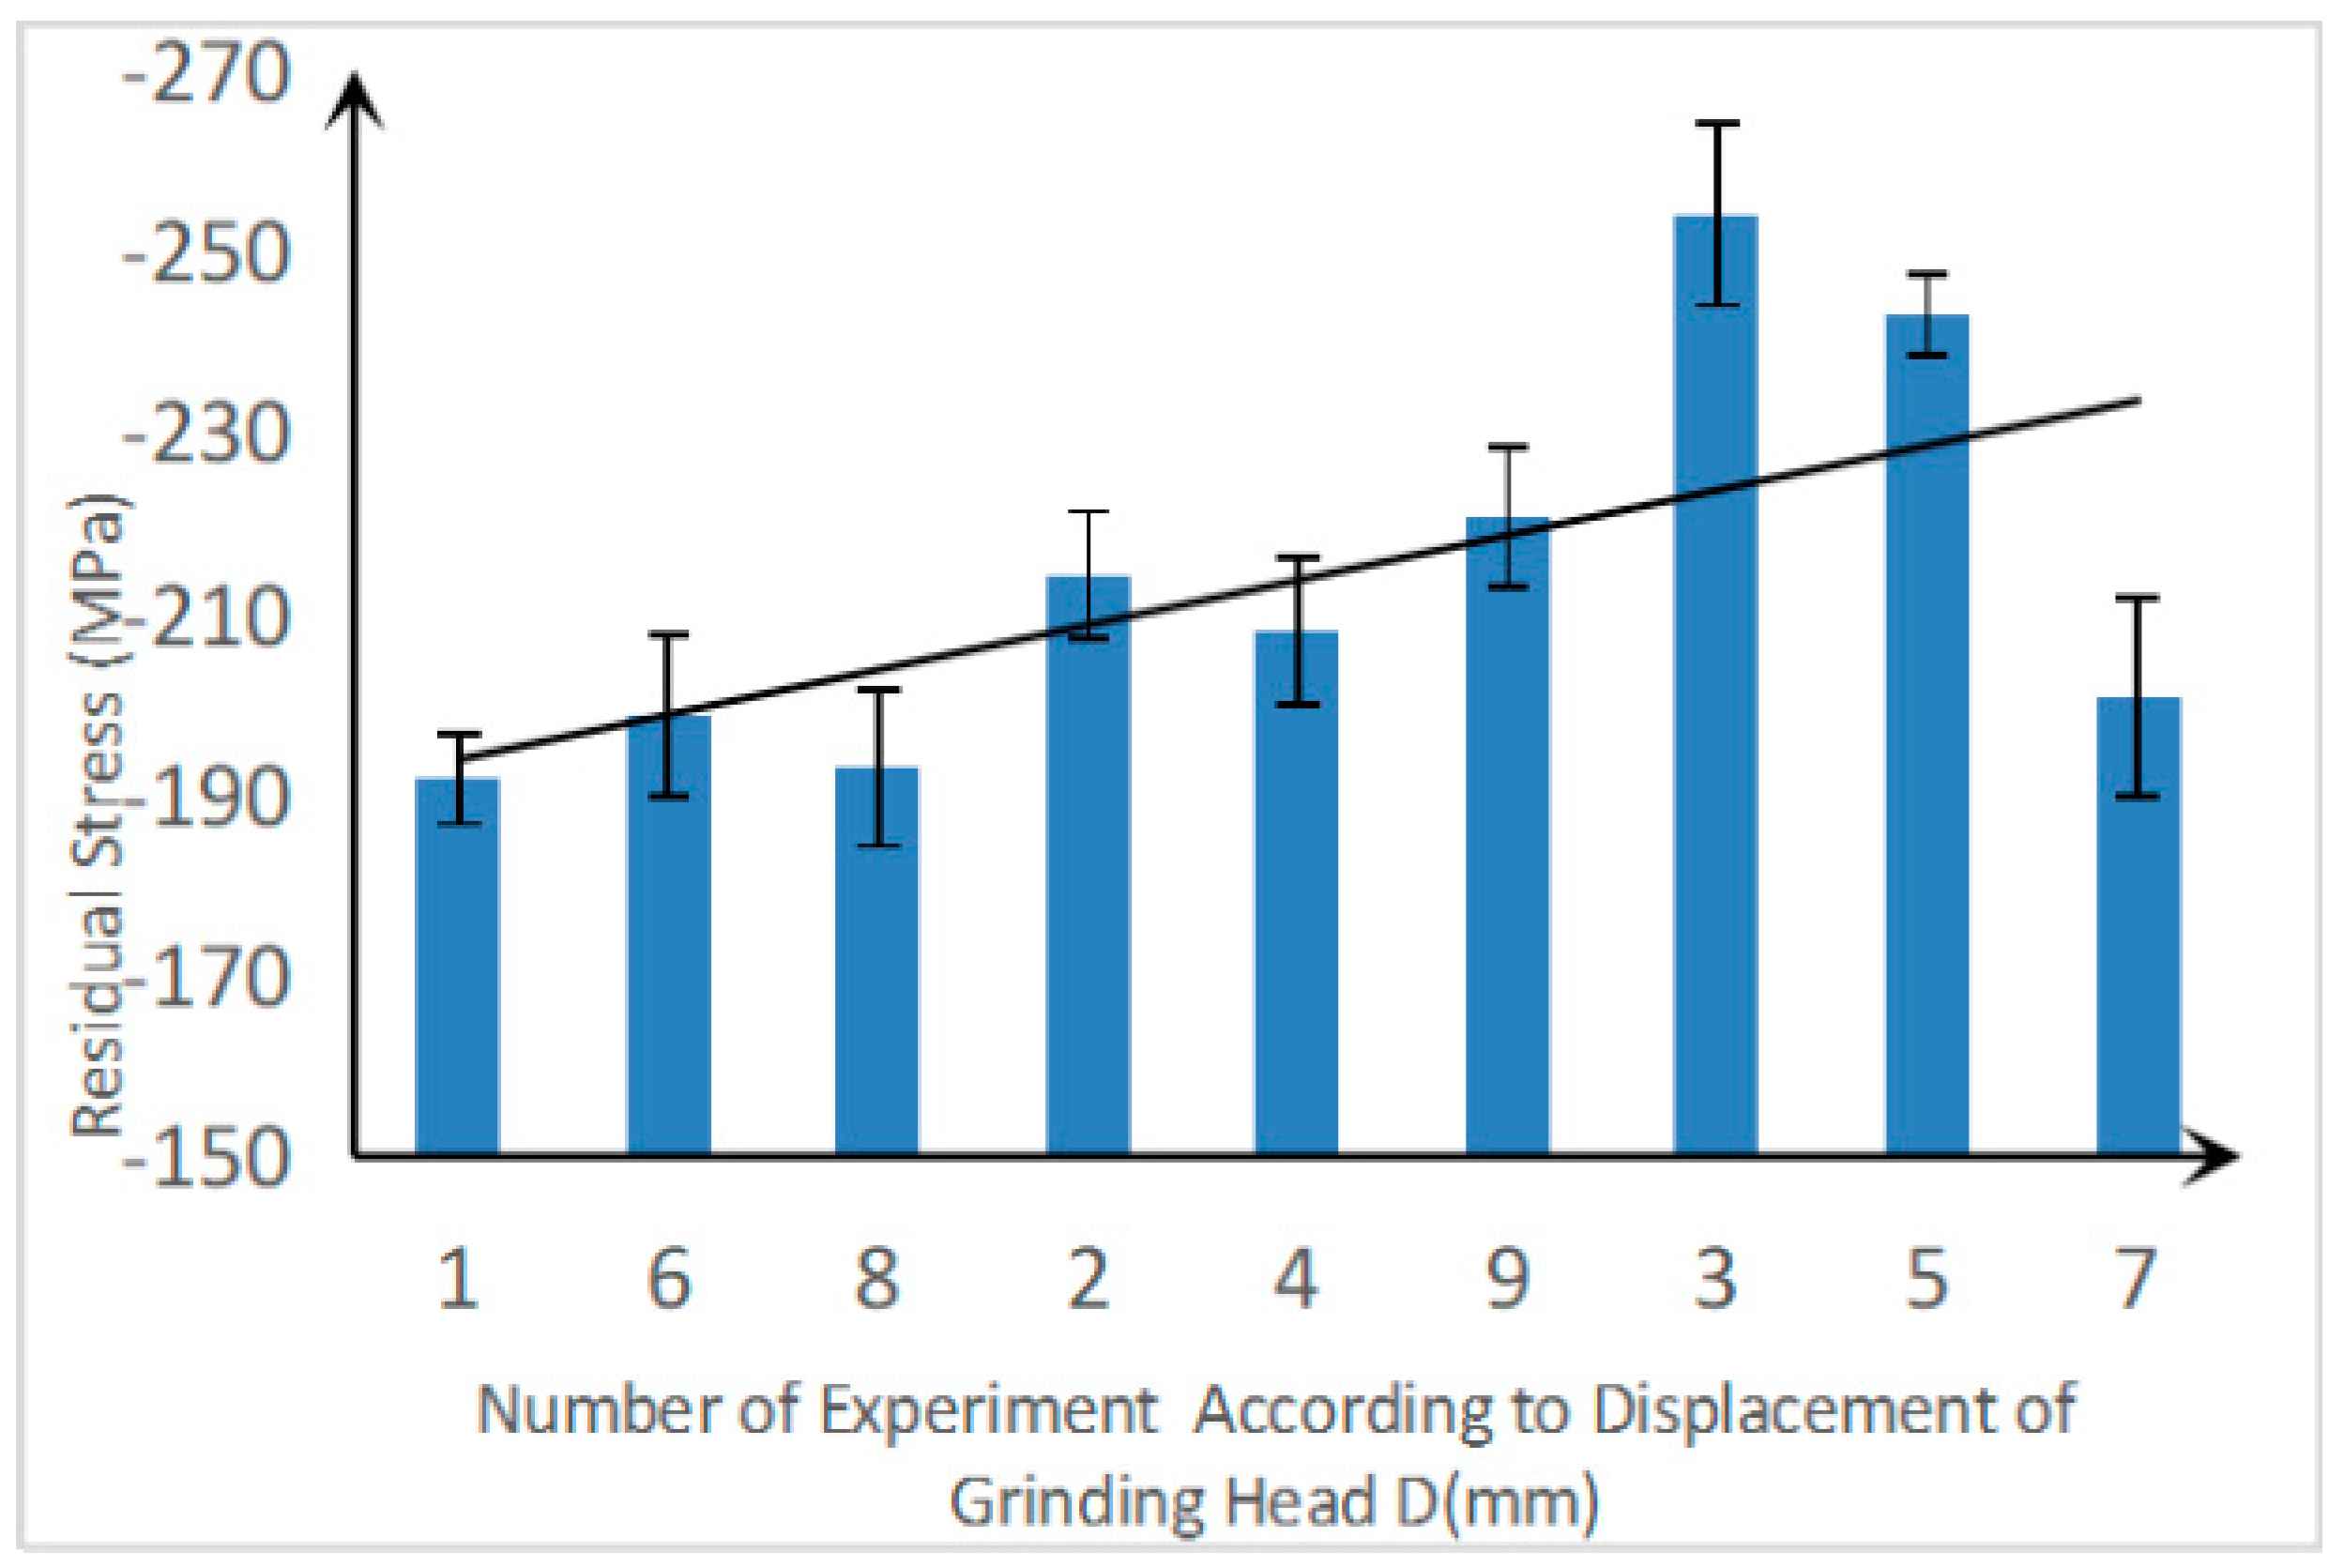
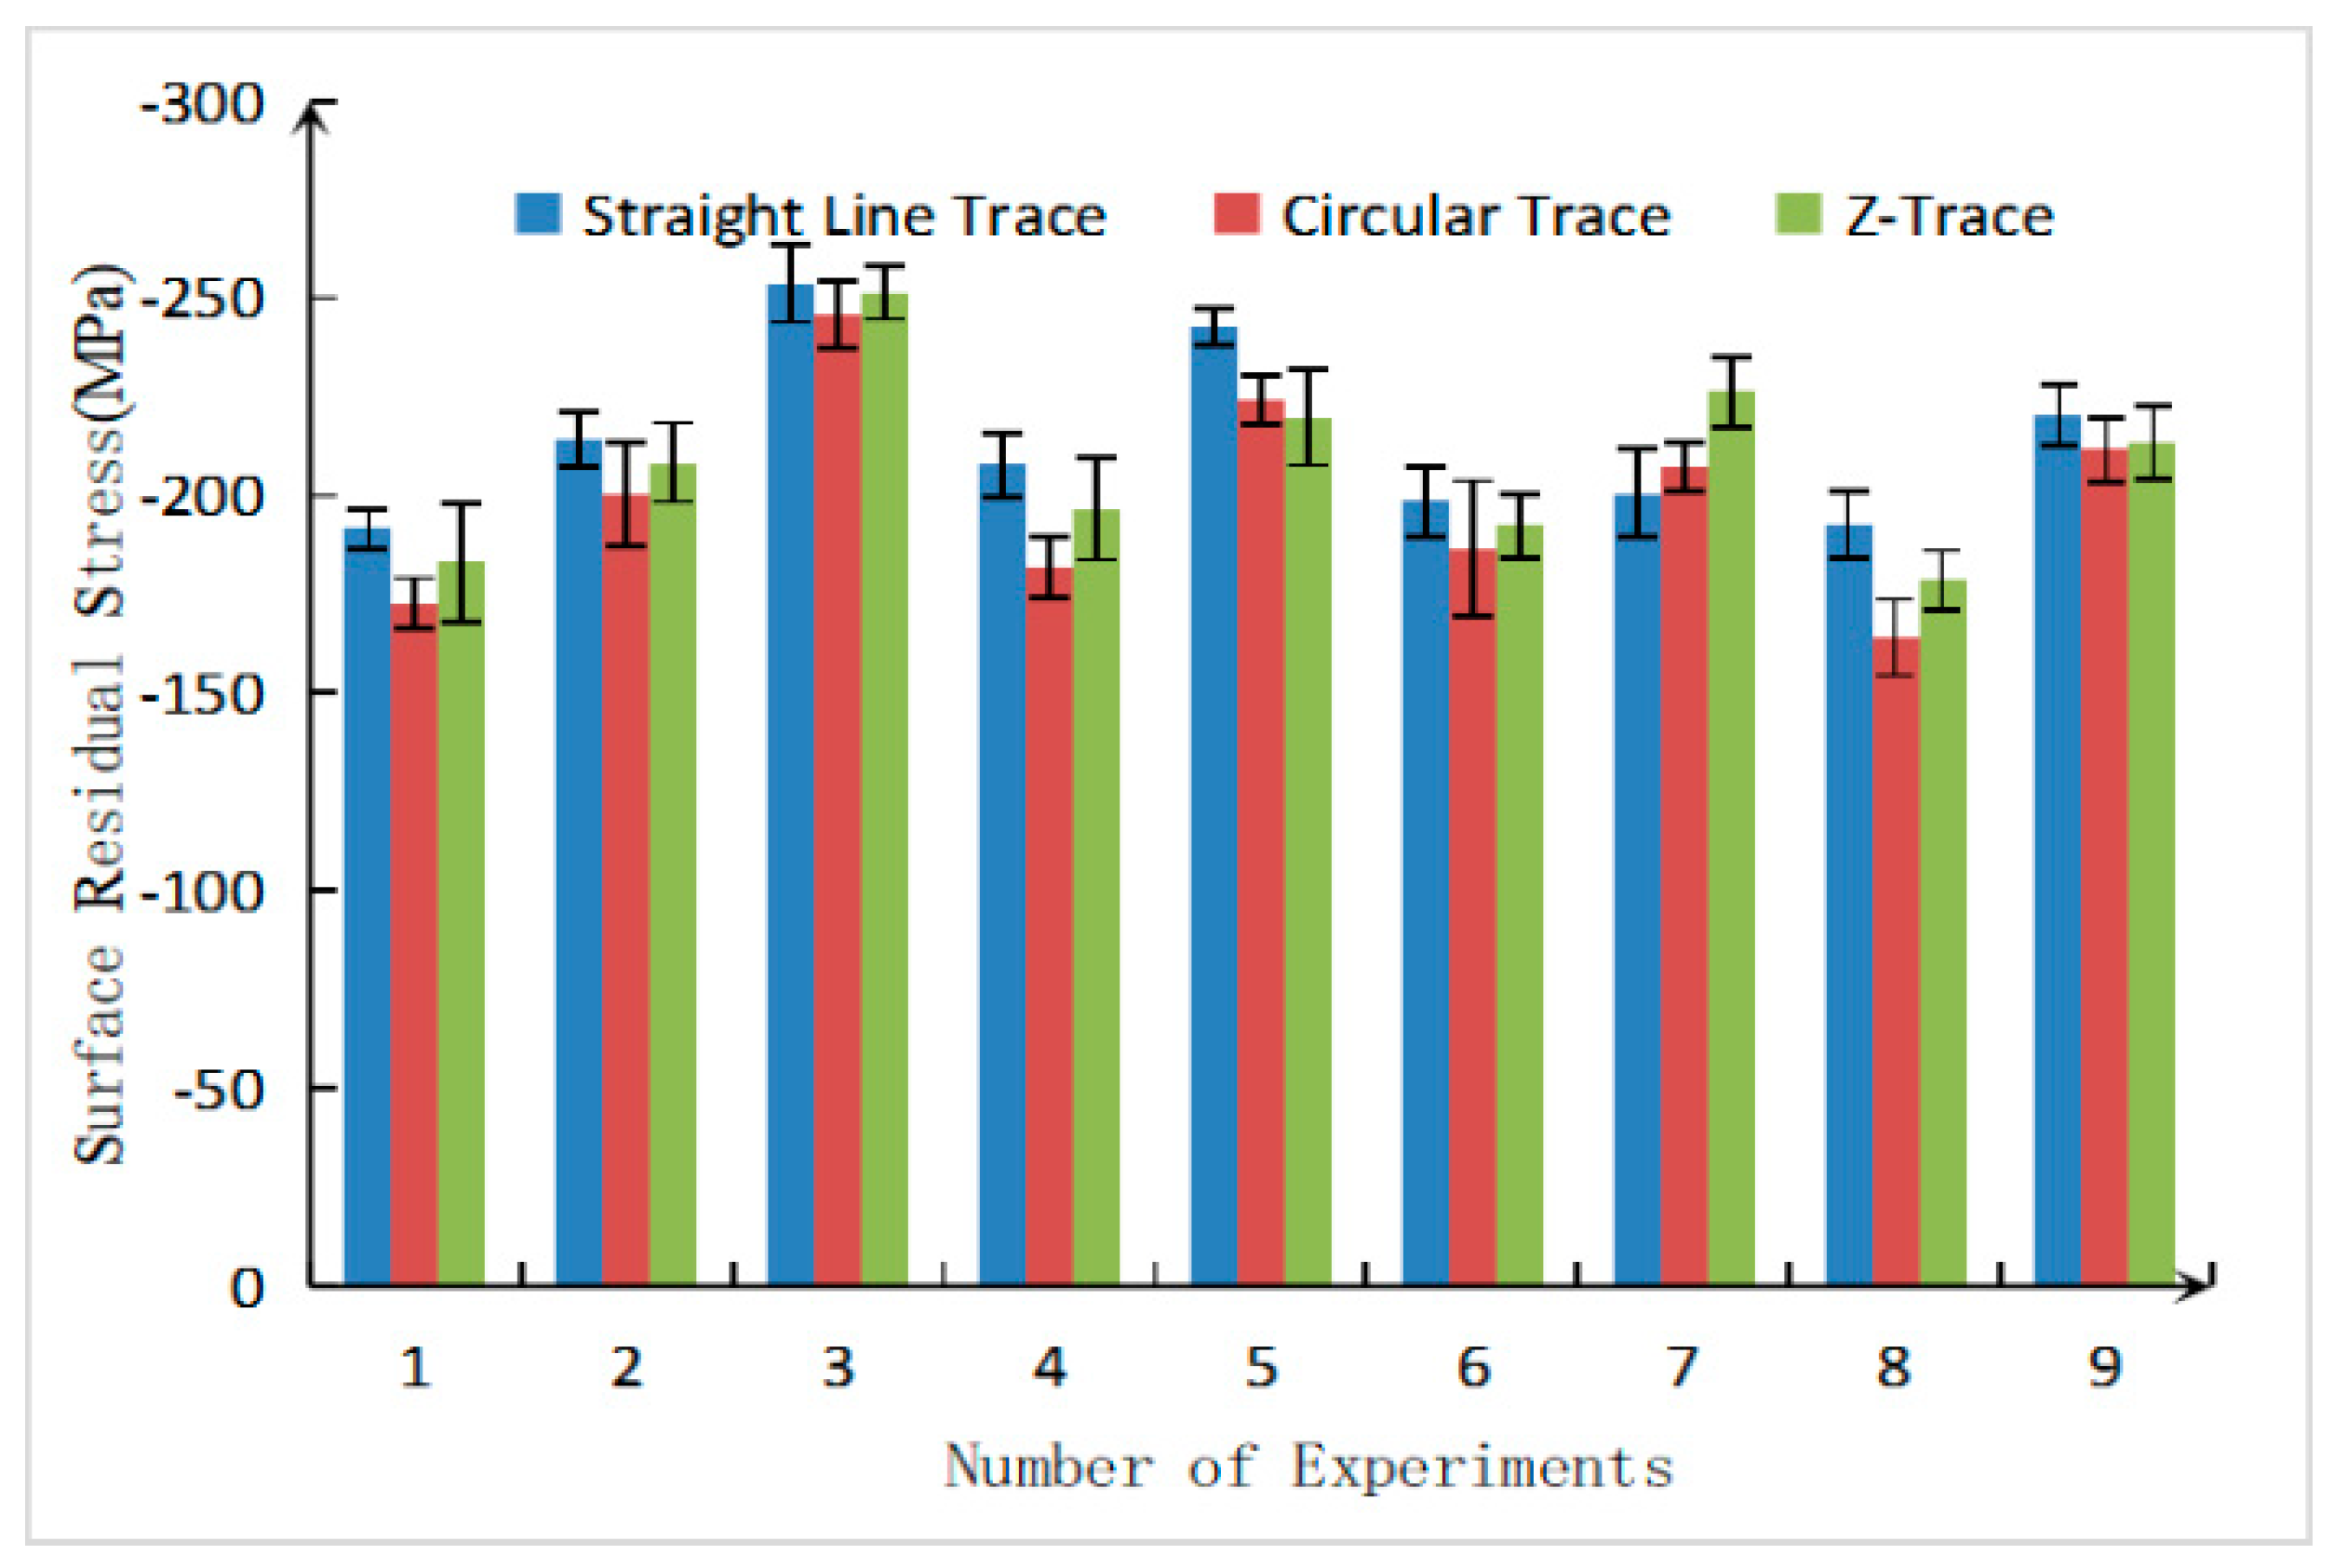
In this experiment, the state of the surface residual stress at each test point is shown in Figure 14, Figure 15, Figure 16 and Figure 17. Figure 14, Figure 15 and Figure 16 arrange the number of experiments according to polishing speed, feeding speed, and the displacement of the grinding head, and then the trendline is used to illustrate the relation between the grinding parameters and the surface residual stress. Figure 17 makes comparisons among the three trajectories for surface residual stress.
It can be seen from the figures that the residual stress, that is, the compressive stress, on the surface of the functional property test piece after grinding by the abrasive belt was negative. Meanwhile, the following observations can be seen from comprehensive analysis of the surface residual stress values for each experiment.
With the increase of grinding depth, the surface residual stress of the specimen gradually increased. The reason for this is that as the grinding depth increases, the grinding force increases, and the grinding temperature also increases. However, since the grinding belts had the feature of “cold grinding”, the grinding temperature did not increase much. Therefore, the tensile stress caused by high-temperature grinding was smaller than the compressive stress generated by mechanical extrusion. The greater the selected depth of grinding, the more obvious this phenomenon was. Furthermore, its surface residual stress was about −200 MPa. Compared with a surface residual stress of up to −2000 MPa from the grinding wheel under similar conditions [24], abrasive belt grinding has obvious advantages for the control of the surface residual stress of specimens.
As the line speed of the belt increases, the surface residual stress of the test piece after grinding is gradually reduced. Due to the increase of the line speed of the belt, the number of abrasive grains participating in the grinding per unit time increases, and the total heat flow intensity in the grinding area increases, resulting in a higher grinding temperature and a greater tensile stress. Therefore, the compressive stress generated by mechanical extrusion of part of the abrasive grains and the test piece surface was canceled, and the surface residual stress was reduced. With the increase in the grinding head feed rate, the surface residual stress value showed an increasing trend. The principle was contrary to the former, and the larger feed rate reduced the contact time of a single abrasive particle, resulting in less heat build-up and an increase in surface residual stress.
It can be seen from the comparison of the residual stresses of the three different grinding trajectories that the linear surface grinding trajectory had the largest surface residual stress under the same grinding parameters, and the residual stress produced by the circular grinding trajectory was the smallest. As the abrasive grains involved in grinding could not be replaced after being bluntly ground in the linear grinding trajectory, the mechanical action of the abrasive belt grinding process took a dominant position, resulting in greater compressive stress. In the circular grinding trajectory, the blunt abrasive grains could be replaced, the grinding effect was stronger, more heat was generated, larger tensile stress was caused, and part of the compressive stress was offset. In the grinding process of the Z-shaped trajectory, the number of abrasive grains in different directions participating in the grinding process was between the other two. The resulting grinding heat was also between the two types, so there was also a surface residual stress between the two.
3.4. Surface Micro-Hardness
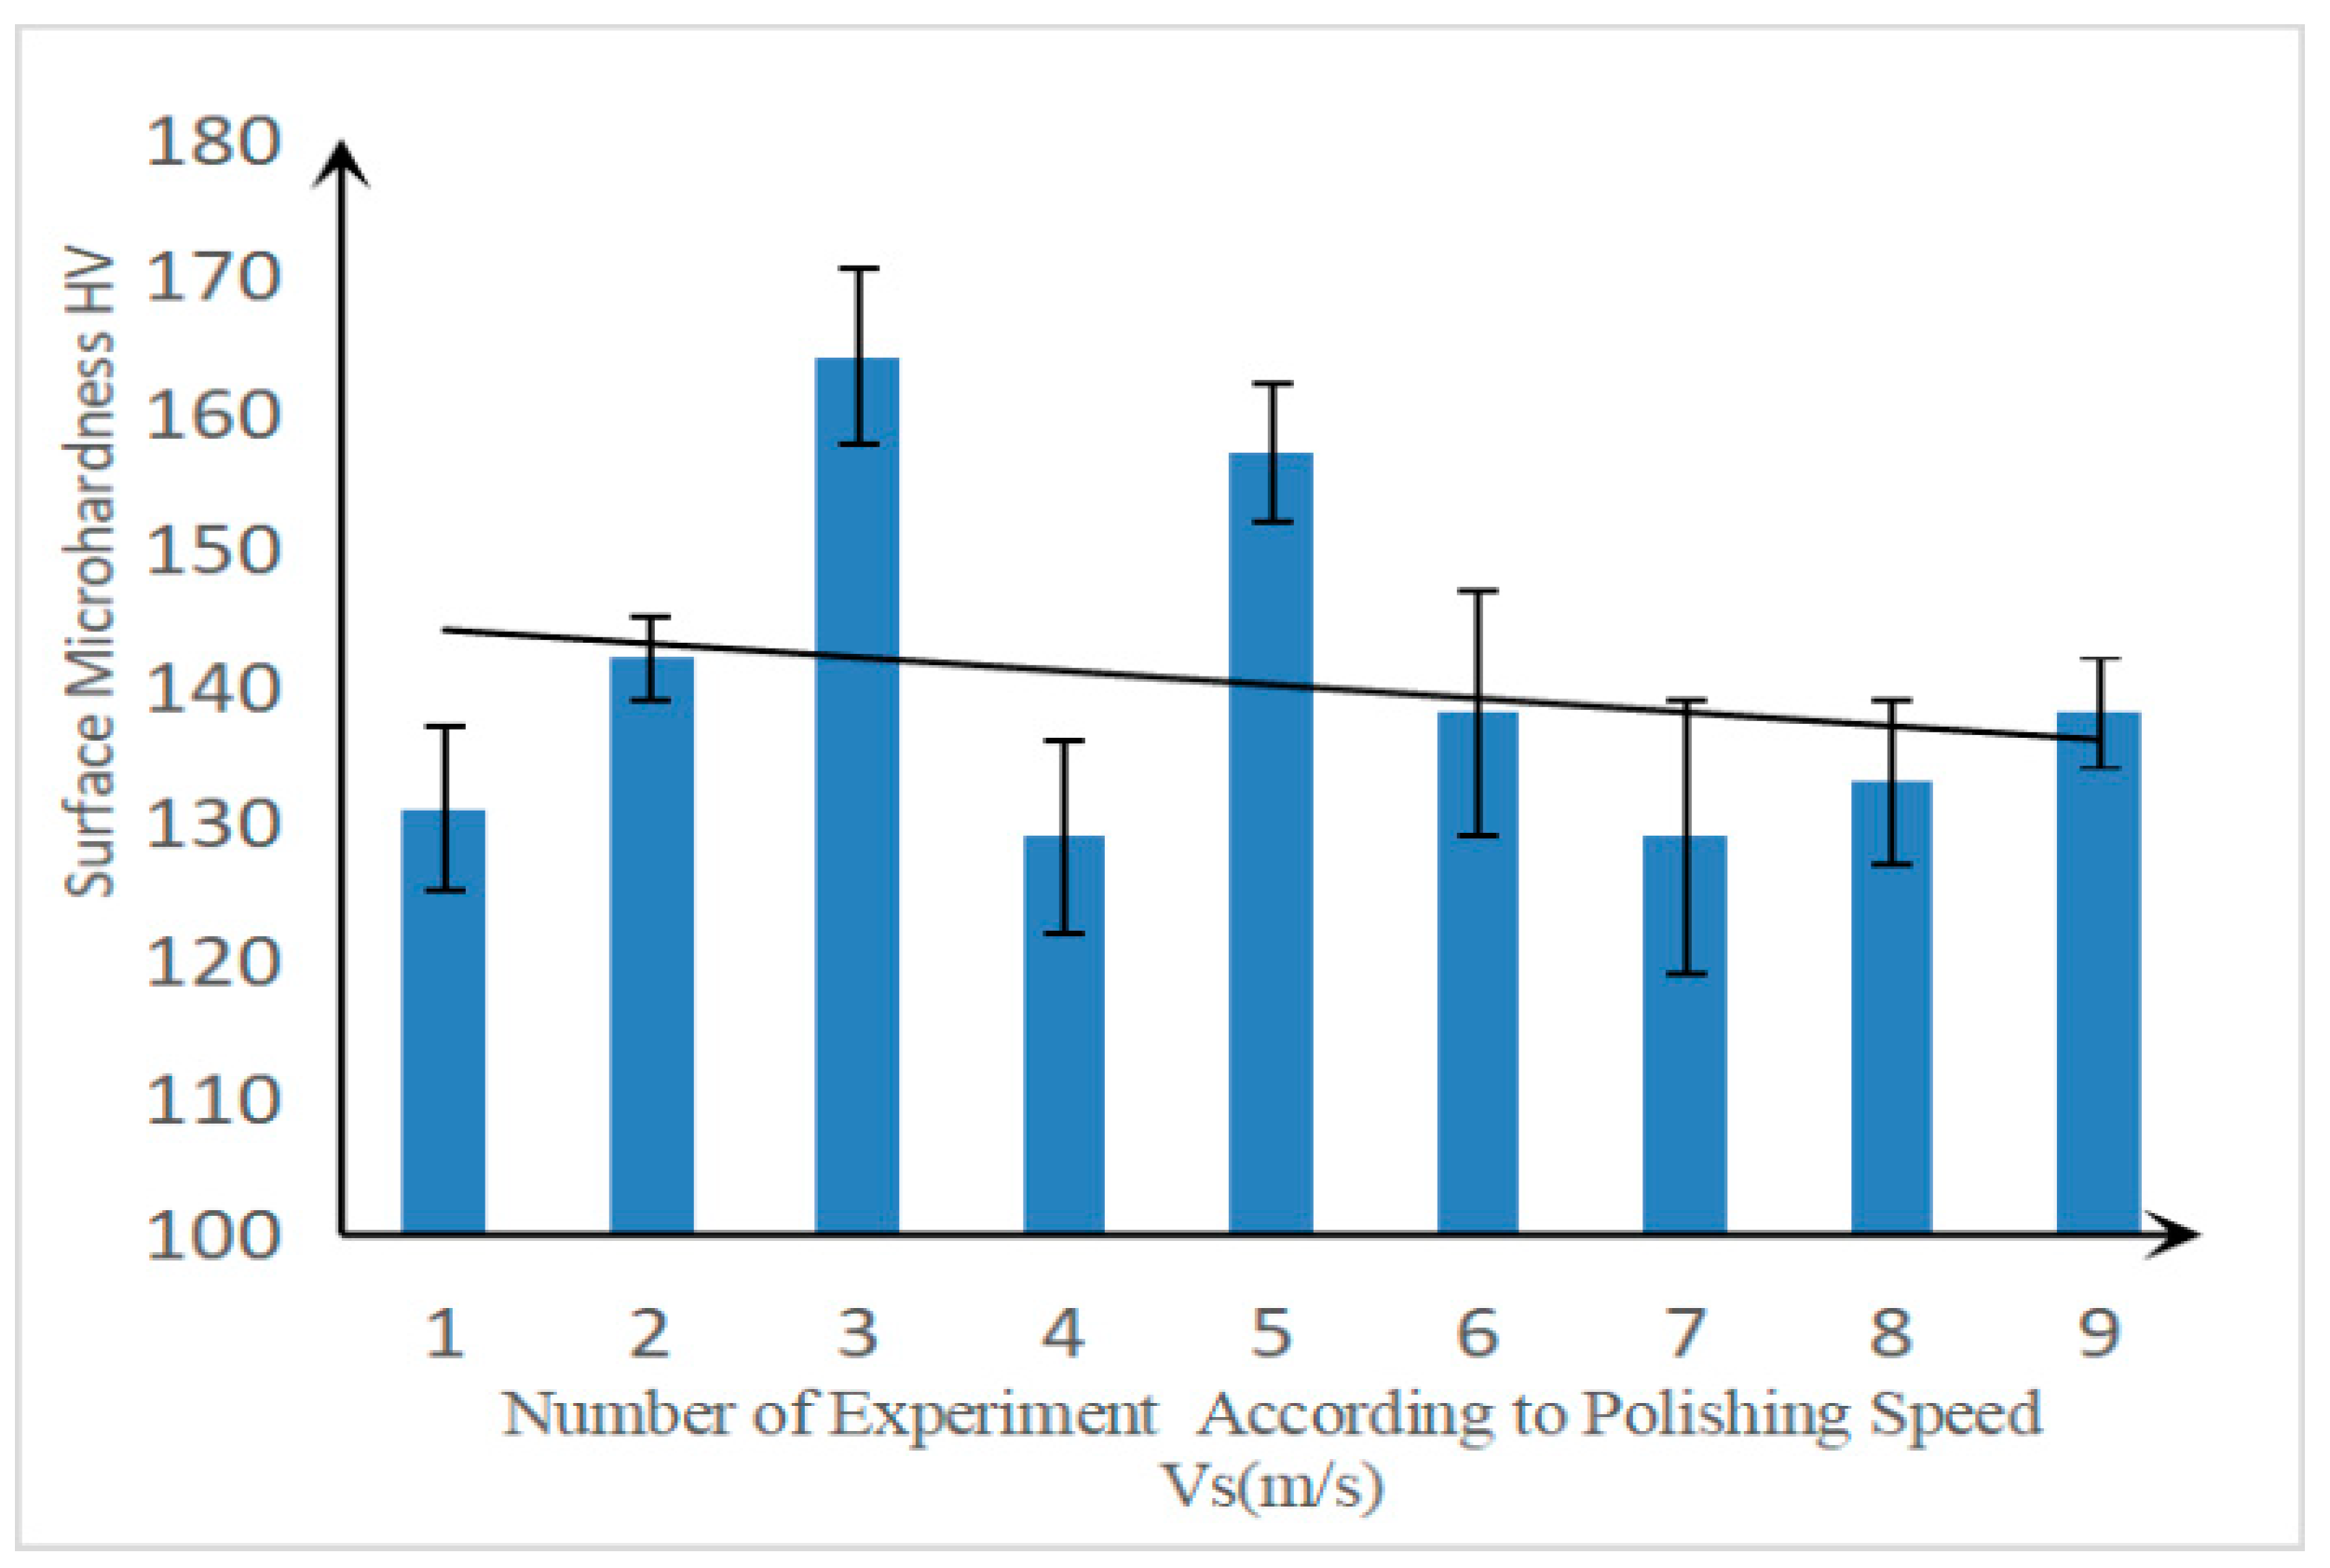
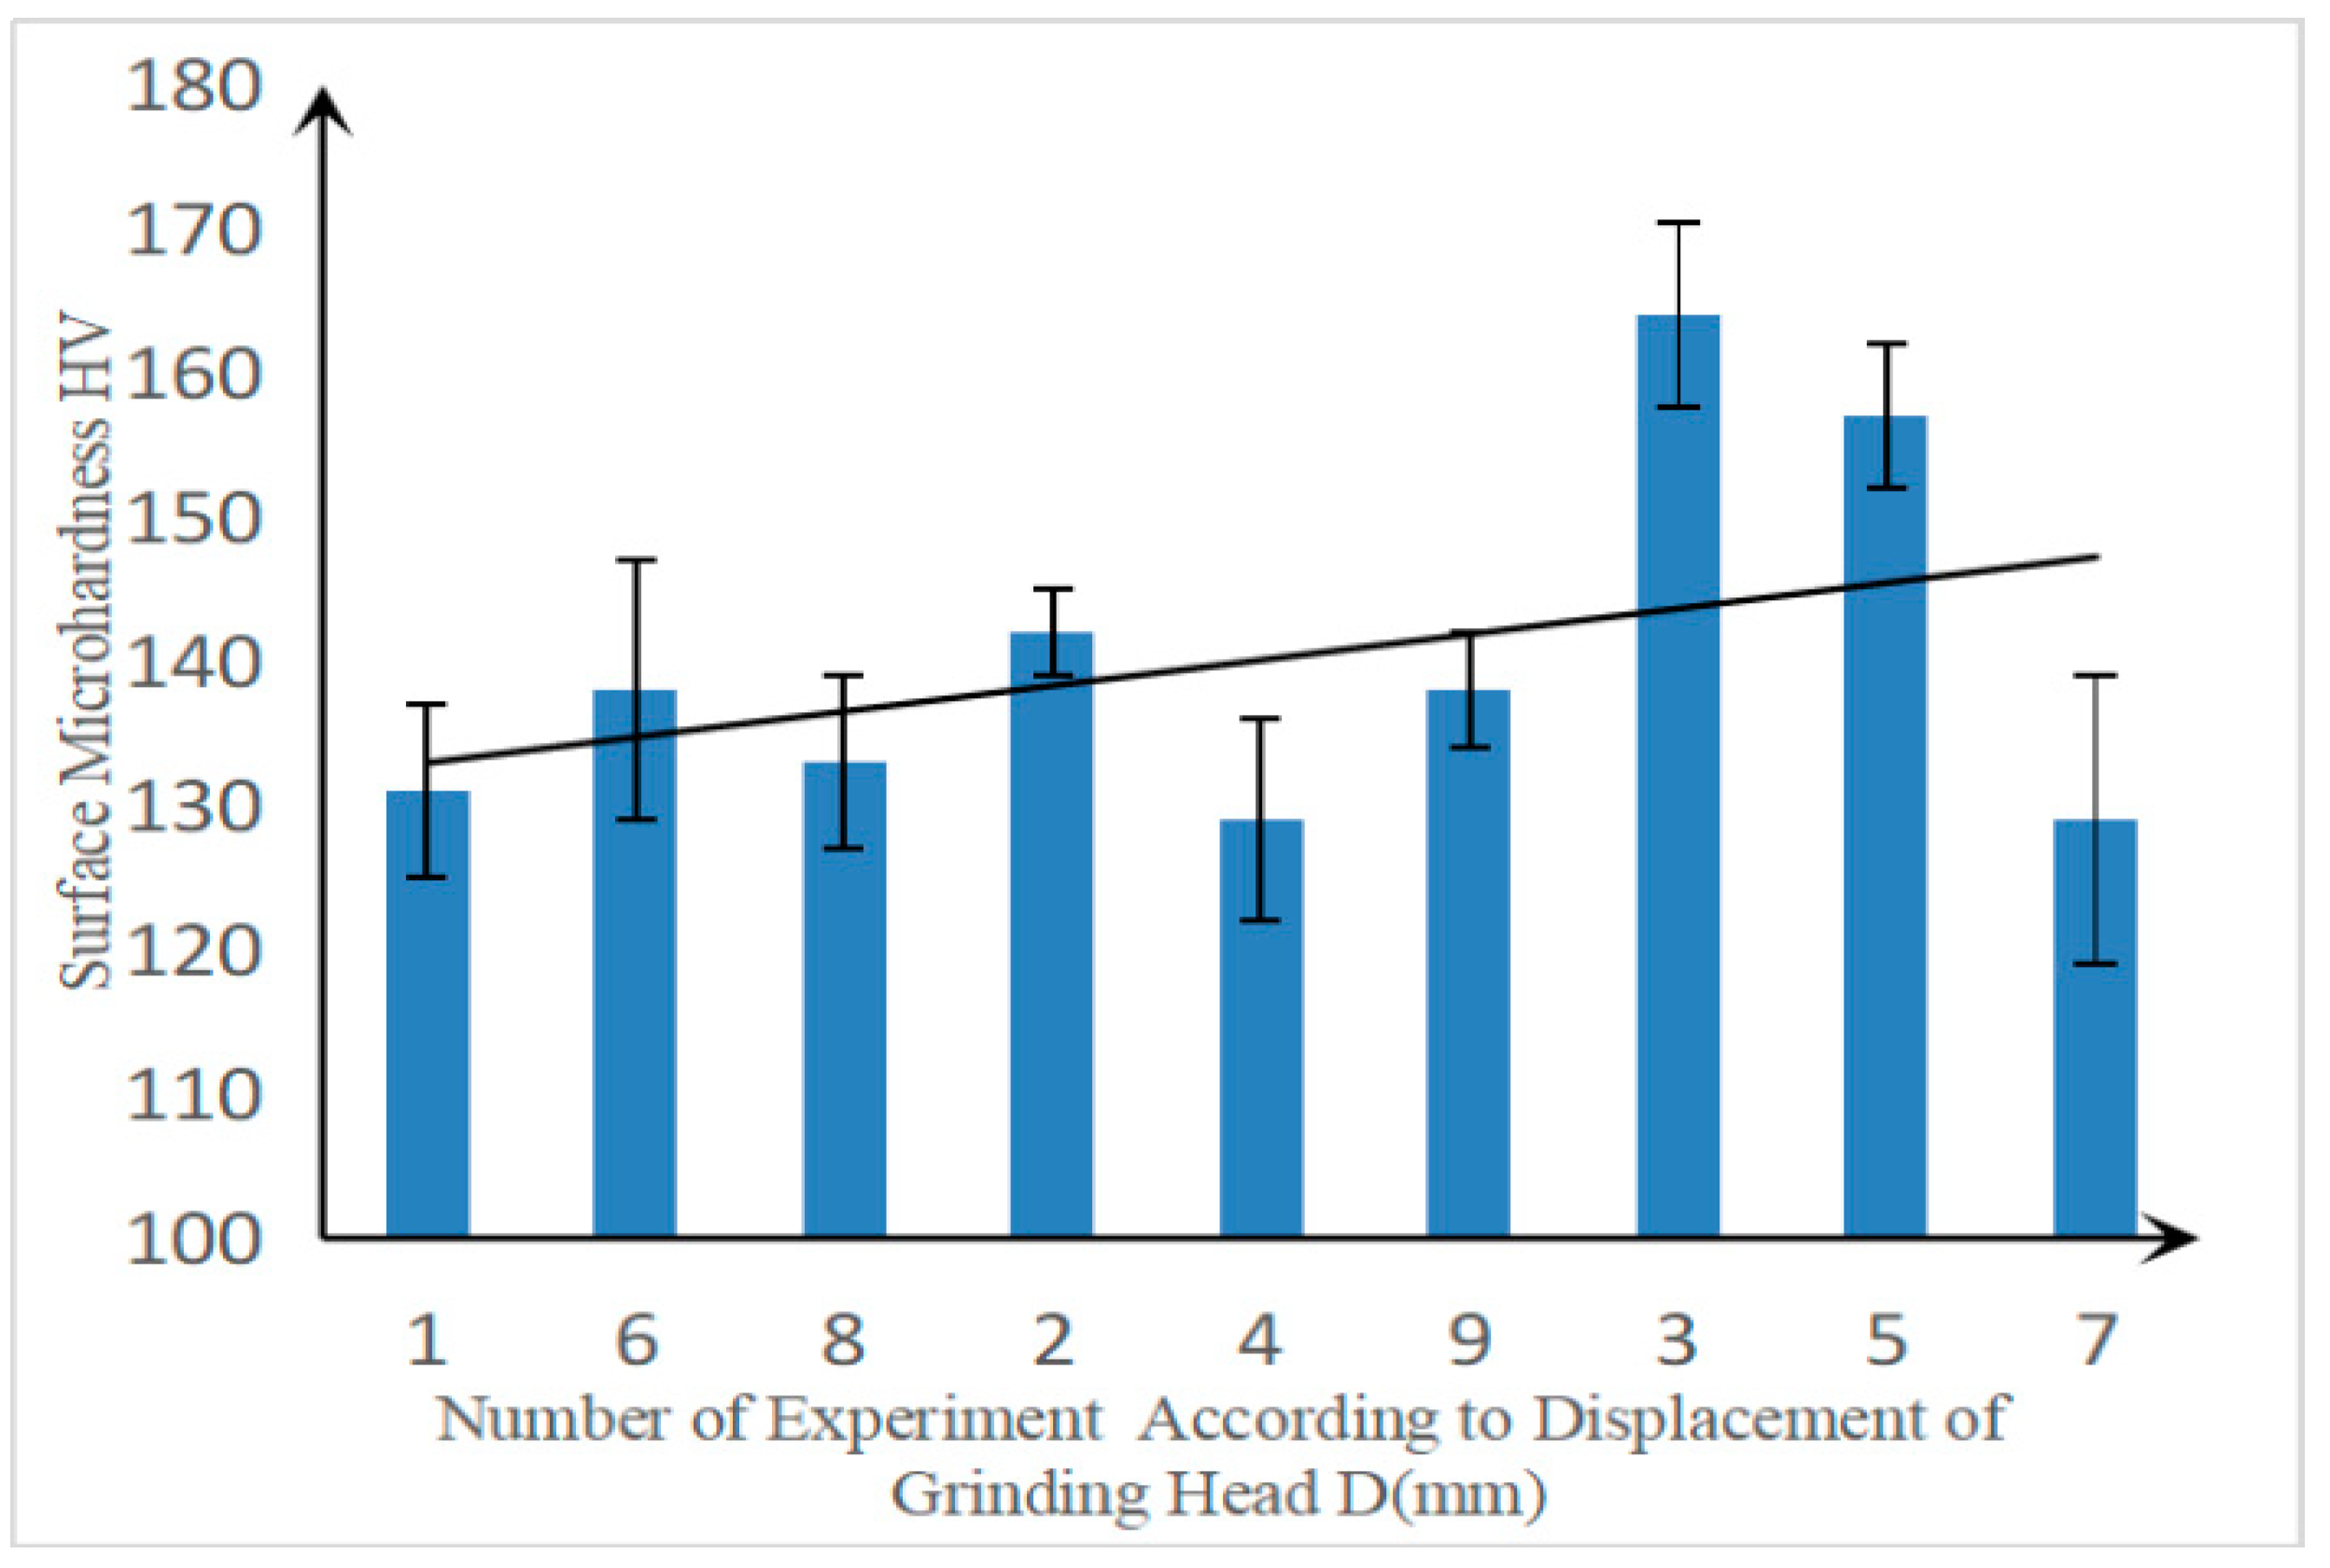
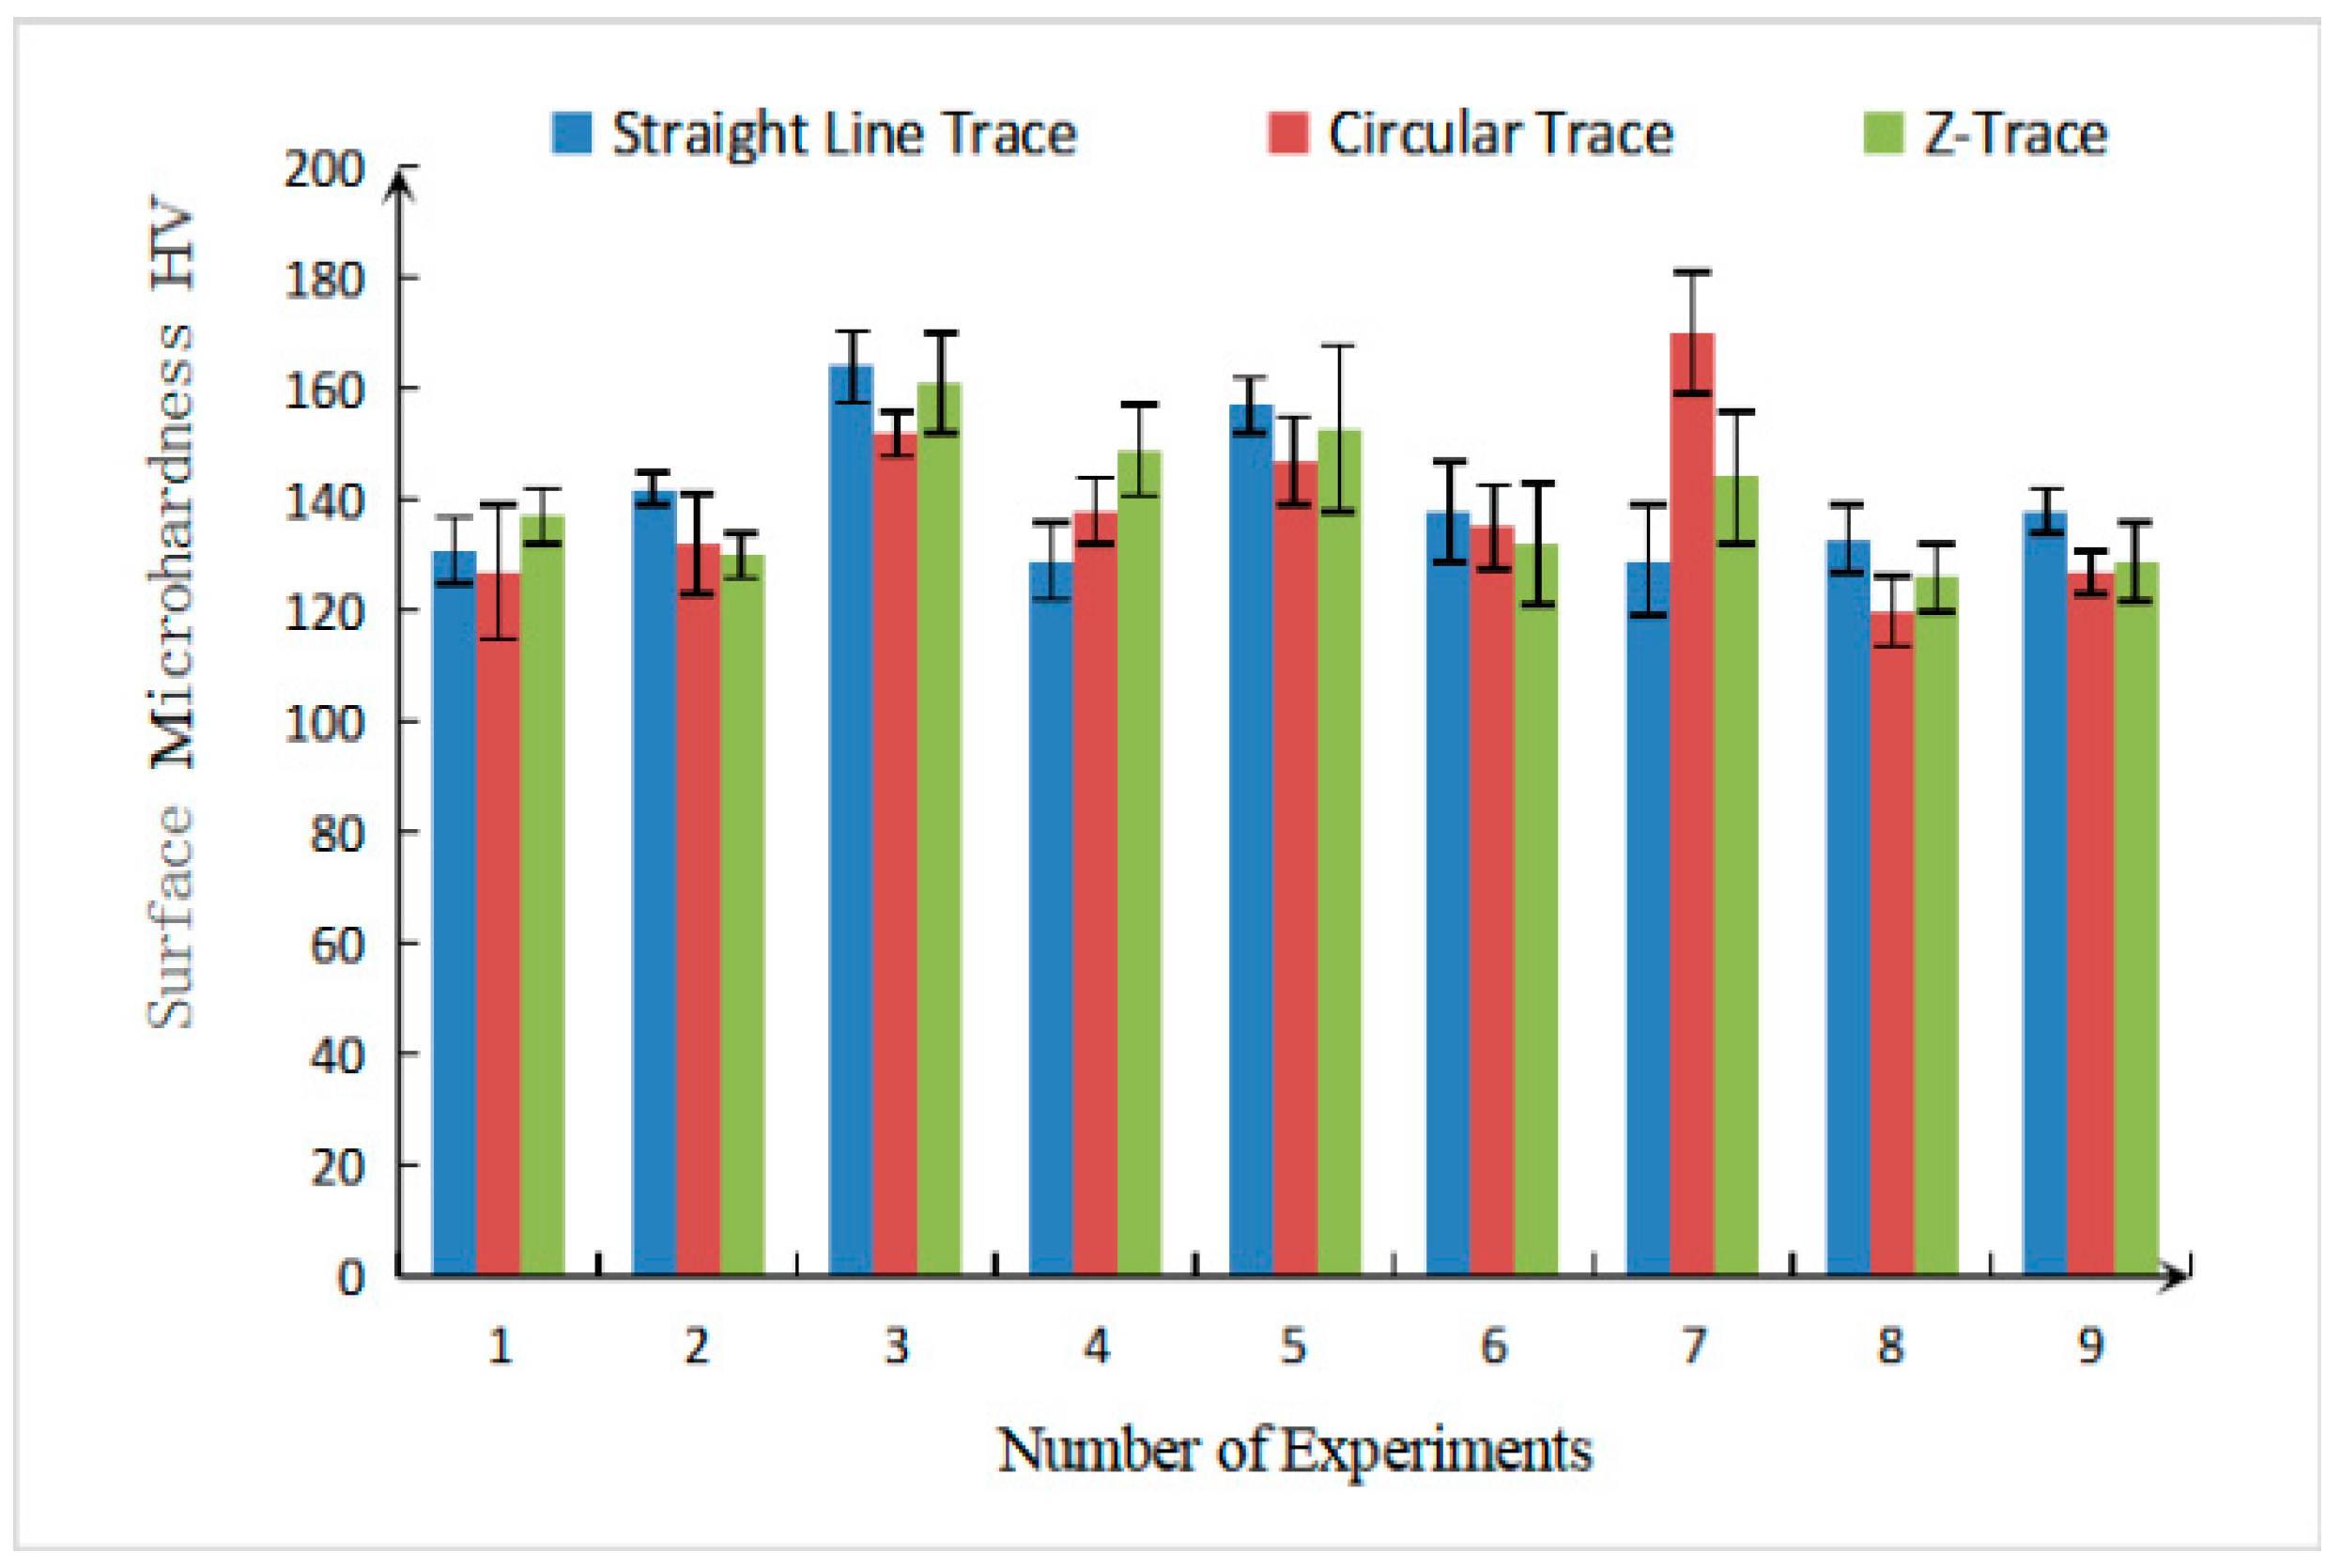
The result of surface micro-hardness measurements is shown in Figure 18, Figure 19, Figure 20 and Figure 21. Figure 18, Figure 19 and Figure 20 arrange the number of experiments according to the polishing speed, feeding speed, and the displacement of the grinding head, and then the trendline is used to illustrate the relation between the grinding parameters and the surface micro-hardness. Figure 21 makes comparisons among the three trajectories for surface micro-hardness.
According to the data sheet, the micro-hardness of the industrial pure iron was about 85 HV, and the micro-hardness of the surface layer before grinding was detected as being 116 HV. The surface micro-hardness measured in the experiment was greater than 116 HV. This was caused by the work hardening that occurred during the grinding process.
Work hardening of the material surface in the grinding process is mainly the result of a combination of plastic deformation caused by the grinding pressure, and the softening process caused by the grinding heat. However, due to the “cold grinding” characteristics of the abrasive belt grinding, the generation of the grinding heat was relatively small, the softening effect of processing was weak, and the micro-hardness of the surface layer was not greatly affected. From Figure 17 and Figure 18, it can be seen that the micro-hardness of the surface layer changed little with the change of the line speed of the belt, and the feed rate of the grinding head. As these two factors were mainly included to change the amount of abrasive particles involved in grinding per unit time, or to increase or decrease the heat generation, and to produce or reduce the degree of softening, they affected the micro-hardness of the surface layer. However, the amount of heat generated was not much, relative to the phase transition, and so the effect on the micro-hardness was small.
From the observations of Figure 20, it was found that the micro-hardness of the surface layer was most greatly affected by the amount of downward movement by the grinding head. As the extent of the grinding head’s lowering will cause the grinding pressure to increase, the cutting force of the single abrasive grain material increases, stress on the workpiece surface increases, the plastic deformation increases, the dislocation density increases, and the surface hardness of the workpiece increases. Moreover, as the grinding pressure increases, the surface hardening degree of the workpiece increases.
On the other hand, in the grinding process of the grinding wheel, the grinding depth is negatively correlated with the surface micro-hardness [25]. As the cooling function of the grinding wheel is weak, excessive grinding depth will lead to a large amount of heat accumulation. When the surface is burned, the hardness increase caused by the plastic deformation of the surface will also be offset, resulting in a decrease in hardness.
4. Conclusions
Belt grinding on the surface of pure iron pieces for functional property tests can reduce the surface roughness of the specimen to less than Ra 0.4 μm, and effectively improve the surface integrity of the specimen. Table 6 shows the coupling relationship between the surface integrity parameters and the grinding parameters:
According to the test results and analysis, it can be seen that the downward movement of the grinding head had the greatest impact on the surface integrity of the workpiece. Excessive downward movement of the grinding head will cause serious surface burns and plastic deformation, and damage the surface integrity. The increase in the linear velocity of the abrasive belt will also lead to a certain temperature rise at the grinding site, but the degree of the rise is relatively small, as is the damage to the surface. Furthermore, surface residual stress can be reduced because of this temperature rise.
Among the micro-morphologies of the test pieces with functional properties processed under several different grinding trajectories, the texture consistency of the surface from linear trajectory grinding was the best, and that of circular trajectory grinding was the worst, and a disordered microtexture will lead to better isotropic features. At the same time, the residual compressive stress of the surface after grinding of the circular track was relatively small, and the roughness had better isotropic characteristics, which was more suitable for the functional performance test.
Based on the above observations, it can be concluded that in the process of using grinding belts on the surface of pure iron pieces for functional performance tests, higher belt line speeds and lower grinding depths and feed rates should be selected. Circular trajectory grinding should also be selected, so that the processed specimen can achieve the best performance.
Author Contributions
Conceptualization, W.D. and G.X.; Methodology, Y.L. and G.X.; Validation, W.D., G.X. and Y.H.; Investigation, W.D., G.X. and Y.H.; Resources, Y.L. and G.X.; Data Curation, G.X. and W.D.; Writing—Original Draft Preparation, W.D. and G.X.; Writing—Review & Editing, G.X. and Y.H.; Supervision, Y.L. and G.X.; Project Administration, G.X.; Funding Acquisition, G.X. and Y.H.
Funding
This work was supported by the National Natural Science Foundation of China (51875064), the Technological Innovation and Application Demonstration of Chongqing (cstc2018jszx-cyzdX0761), the major projects of aero engines and gas turbines (2017-VII-0002-0095), and the Fundamental Research Funds for the Central Universities (2018CDQYCD0038).
Conflicts of Interest
The authors declare no conflict of interest.
References
- Shi, L.; Gong, Y.; Jiang, Z. Tool life test analysis of cemented carbide in orthogonal turn-milling TC4 titanium alloy. Manuf. Technol. Mach. Tool 2015, 94–96. [Google Scholar]
- He, B.; Deng, H. Research status development trend of surface integrity. J. Surf. 2015, 44, 140–146. [Google Scholar]
- Field, M.; Kahles, J.F. Review of surface integrity of machined components. Ann. CIRP 1971, 20, 153–163. [Google Scholar]
- Field, M.; Kahles, J.F.; Cammett, J.T. A review of measuring methods for surface integrity. Ann. CIRP 1972, 21, 219–238. [Google Scholar]
- Liu, L. Experimental Study on Residual Stress Control of Grinding Surface and Surface Integrity of Parts; Northeastern University: Shenyang, China, 2012. [Google Scholar]
- Kong, J.; Hu, K.; Xia, Z.; Li, L. Effect of tool wear on surface integrity in pure iron turning. J. South China Univ. Technol. (Nat. Sci. Ed.) 2016, 44, 74–80. [Google Scholar]
- Ren, S. Study on Abrasive Belt Grinding of Titanium Alloy; Nanjing University of Aeronautics and Astronautics: Nanjing, China, 2007. [Google Scholar]
- Huang, Y.; Wang, F.; Xu, Q.; Zhou, W. Present state of research and application about heavy belt grinding. Abras. News 2007, 4, 8–10. [Google Scholar]
- Fei, Y.; Huang, Y.; Zou, L.; Chen, Y. Experimental study on surface integrity of titanium alloy grinding after prestressed abrasive belt. Mech. Sci. Technol. 2017, 36, 1063–1067. [Google Scholar]
- Chen, Y. Basic Theory and Experimental Study on the Prestressed Belt Grinding of Titanium Alloy; Chongqing University: Chongqing, China, 2016. [Google Scholar]
- Gao, C.; Wang, S.; Wu, G.; Wang, H. Experimental study on grinding alumina ceramics by diamond sand strip electroplating. Tool Eng. 2017, 51, 40–43. [Google Scholar]
- Sun, C.; Zhang, G.; Yin, J. Analysis on surface integrity of GH4169 nickel-based superalloy ground with belt. Diam. Abras. Eng. 2016, 36, 74–78. (In Chinese) [Google Scholar]
- Wang, Y.J.; Huang, Y.; Chen, Y.X.; Yang, Z.S. Model of an abrasive belt grinding surface removal contour and its application. Int. J. Adv. Manuf. Technol. 2013, 6, 2113–2122. [Google Scholar] [CrossRef]
- Liu, Y.; He, Z.; Wang, R.; Li, J. Experimental investigation on grinding behavior of abrasive belt for rail specimen. J. Basic Sci. Eng. 2017, 25, 419–426. [Google Scholar]
- Yang, Y.; Huang, Y.; Wang, Y.; Xiao, G.; Wei, H. Test and analysis of abrasive belt grinding process of high temperature nickel base alloy GH4169. Mech. Sci. Technol. 2015, 34, 1365–1369. [Google Scholar]
- Lu, G. Rolling Contact Fatigue Life Prediction Based on the Surface Integrity Induced by Grinding Process; Shanghai Jiaotong University: Shanghai, China, 2009. [Google Scholar]
- Jourani, A.; Dursapt, M.; Hamdi, H.; Rech, J.; Zahouani, H. Effect of the belt grinding on the surface texture: Modeling of the contact and abrasive wear. Wear 2005, 259, 1137–1143. [Google Scholar] [CrossRef]
- Bigerelle, M.; Gautier, A.; Hagege, B. Roughness characteristic length scales of belt finished surface. J. Mater. Process. Technol. 2009, 209, 6103–6116. [Google Scholar] [CrossRef]
- Bigerelle, M.; Gautier, A.; Hagege, B. Mechanical modelling of micro-scale abrasion in superfinish belt grinding. Tribol. Int. 2008, 41, 992–1001. [Google Scholar] [CrossRef]
- Zhang, D.; Luo, L.; Zhang, Z. The impact of vertical milling tool-path on the integrity of work piece surface. Modul. Mach. Tool Autom. Manuf. Tech. 2015, 24–27. [Google Scholar]
- Zhang, W.; Liang, X.; Jia, J.; Yu, F. Latest developments on technology for making ingot iron and superpurity iron. J. Angang Technol. 2015, 6–11. [Google Scholar]
- Liu, W.; Li, F.; Ren, J.; Yu, Y. Research on surface roughness based on SPSO in high speed milling of GH4169. China Mech. Eng. 2011, 22, 2654–2657, 2771. [Google Scholar]
- Liu, W.; Deng, C.; Huang, Y. Experimental on surface integrity of titanium alloy TC4 by high speed cylindrical grinding. Aerosp. Mater. Technol. 2017, 66–70. [Google Scholar]
- Yu, M. Simulation and Study on Residual Stress of Polycrystalline Magnesium Fluoride Ultra-Precision Grinding Surface; Harbin Institute of Technology: Harbin, China, 2017. [Google Scholar]
- Yang, H.; Dai, Q. Experimental study on grinding S136 steel by two kinds of grinding wheels. Diam. Abras. Eng. 2011, 31, 63–68. [Google Scholar]
Figure 1.
Linear track grinding. (a) Sketch of linear grinding; (b) Diagrammatic drawing of linear track.
Figure 1.
Linear track grinding. (a) Sketch of linear grinding; (b) Diagrammatic drawing of linear track.


Figure 2.
Circular track grinding. (a) Sketch of circular grinding; (b) Diagrammatic drawing of circular track.
Figure 2.
Circular track grinding. (a) Sketch of circular grinding; (b) Diagrammatic drawing of circular track.

Figure 3.
Z-track grinding. (a) Sketch of Z-track grinding; (b) Diagrammatic drawing of Z-track.

Figure 4.
Seven-axes and six-linkage adaptive CNC (Computer Numerical Control) abrasive belt grinding center and the specimen. (a) The CNC (Computer Numerical Control) abrasive belt grinding center; (b) The specimen and distribution of measuring points; (c) The grinding process.
Figure 4.
Seven-axes and six-linkage adaptive CNC (Computer Numerical Control) abrasive belt grinding center and the specimen. (a) The CNC (Computer Numerical Control) abrasive belt grinding center; (b) The specimen and distribution of measuring points; (c) The grinding process.

Figure 5.
EDS (Energy Dispersive Spectrocopy) result of the burned zone.

Figure 6.
Electron microscope image of linear track grinding. (a): Test 1; (b): Test 6; (c): Test 7.
Figure 6.
Electron microscope image of linear track grinding. (a): Test 1; (b): Test 6; (c): Test 7.

Figure 7.
Electron microscope photographs of three different grinding trajectories. (a): Line type; (b): Circular type; (c): Z-type.
Figure 7.
Electron microscope photographs of three different grinding trajectories. (a): Line type; (b): Circular type; (c): Z-type.


Figure 8.
The contrast between the pre-grinding contour (top) and the post-grinding contour (bottom).
Figure 8.
The contrast between the pre-grinding contour (top) and the post-grinding contour (bottom).

Figure 9.
Relationship between the surface roughness and the belt line speed.

Figure 10.
Relationship between the surface roughness and the feed rate of the grinding head.

Figure 11.
Relationship between the surface roughness and the amount of downward movement of the grinding head.
Figure 11.
Relationship between the surface roughness and the amount of downward movement of the grinding head.

Figure 12.
Comparison of lateral Ra values in the three different grinding tracks.

Figure 13.
Comparison of longitudinal Ra values in the three different grinding tracks.

Figure 14.
Relationship between the surface residual stress and the belt line speed.

Figure 15.
Relationship between the surface residual stress and the feed rate of the grinding head.

Figure 16.
Relationship between the surface residual stress and the amount of downward movement of the grinding head.
Figure 16.
Relationship between the surface residual stress and the amount of downward movement of the grinding head.

Figure 17.
Residual stress for the three different grinding trajectories.

Figure 18.
Relationship between the surface micro-hardness and the belt line speed.

Figure 19.
Relationship between the surface micro-hardness and the feed rate of the grinding head.

Figure 20.
Relationship between the micro-hardness of the surface and the amount of downward movement of the grinding head.
Figure 20.
Relationship between the micro-hardness of the surface and the amount of downward movement of the grinding head.

Figure 21.
Surface micro-hardness of the three different grinding tracks.


Table 1.
Axis accuracy of the machining tool.
| Items | Parameters |
|---|---|
| X/Y/Z positioning accuracy | 0.012 mm/0.01 mm/0.01 mm |
| X/Y/Z repeatability accuracy | 0.008 mm/0.005 mm/0.005 mm |
| X/Y/Z feeding speed | 0~15 m/min |
| A feeding speed | 0–20 rpm |
Table 2.
Sample parameters.
| Material | Dimensions | Heat Treatment |
|---|---|---|
| Pure iron | φ 16 × 5 mm | No heat treatment |
Table 3.
Main functional performance parameters of the specimens.
| Functional Performance | Numerical Value |
|---|---|
| Tensile strength | 270 MPa |
| Yield strength | 160 MPa |
| Reduction of section | 70% |
| Elongation rate | 30% |
Table 4.
Parameter settings of the main testing equipment.
| Unit Type | Parameter Setting | |
|---|---|---|
| Item | Parameter Value | |
| TESCAN VEGA 3 LMH SEM | Acceleration Voltage (kV) | 12 |
| Probe Current (pA) | 25 | |
| Magnification Times | 1000× | |
| Times TR200 Roughness Tester | Transverse Sampling Length (mm) | 1 |
| Longitudinal Sampling Length (mm) | 1.5 | |
| Proto Canada iXRD | Testing Voltage (kV) | 20 |
| Test Current (mA) | 8 | |
| Time of Exposure (s) | 0.1 | |
| 401MVDTM Digital Vickers Hardness Tester | Test force (gf) | 100 |
| Load holding time (s) | 5 | |
Table 5.
Specific parameters of each group of experiments.
| Test Serial Number | Abrasive Belt Linear Velocity vs (m/s) | Grinding Head Feed Rate vp (mm/min) | The Down Distance of the Grinding Head (mm) |
|---|---|---|---|
| 1 | 8 | 20 | 0.2 |
| 2 | 8 | 40 | 0.4 |
| 3 | 8 | 60 | 0.6 |
| 4 | 16 | 20 | 0.4 |
| 5 | 16 | 40 | 0.6 |
| 6 | 16 | 60 | 0.2 |
| 7 | 24 | 20 | 0.6 |
| 8 | 24 | 40 | 0.2 |
| 9 | 24 | 60 | 0.4 |
Table 6.
Coupling relationship between the surface integrity parameters and the grinding parameters.
Table 6.
Coupling relationship between the surface integrity parameters and the grinding parameters.
| Surface Integrity Parameters | Surface Morphology | Surface Roughness | Residual Stress | Surface Hardness | ||
|---|---|---|---|---|---|---|
| Grinding Parameters | Transverse | Longitudinal | ||||
| Grinding trajectory | Linear trajectory: consistent; Circular trajectory: messy; Z-trajectory: general. | Linear trajectory: low impact; Circular trajectory: low impact; Z-trajectory: general. | Linear trajectory: much less than transverse roughness; Circular trajectory: low impact; Z-trajectory: slightly less than transverse roughness. | Linear trajectory: large; Circular trajectory: little; Z-trajectory: general. | Little difference in grinding trajectory influence on surface hardness. | |
| Abrasive belt linear velocity | Faster grinding speeds lead to more surface burns, impacting the morphology. | Decreases as the belt linear velocity increases. | Decreases as the belt linear velocity increases. | Decreases as the belt linear velocity increases. | Low impact. | |
| Feeding speed | Faster feeding speed helps to reduce surface burning, but may cause machining defects like burrs. | Increases as the feeding speed increases. | Increases as the feeding speed increases. | Increases as the feeding speed increases. | Low impact. | |
| Displacement of grinding head | Too much displacement will lead to surface burning. | Increases as the displacement increases. | Increases as the displacement increases. | Increases as the displacement increases. | Increases as the displacement increases. | |
© 2019 by the authors. Licensee MDPI, Basel, Switzerland. This article is an open access article distributed under the terms and conditions of the Creative Commons Attribution (CC BY) license (http://creativecommons.org/licenses/by/4.0/).
Share and Cite
MDPI and ACS Style
Liu, Y.; Dai, W.; Xiao, G.; Huang, Y. Surface Integrities of Different Trajectories in Belt Grinding for Pure Iron Functional Performance Test Pieces. Crystals 2019, 9, 123. https://doi.org/10.3390/cryst9030123
AMA Style
Liu Y, Dai W, Xiao G, Huang Y. Surface Integrities of Different Trajectories in Belt Grinding for Pure Iron Functional Performance Test Pieces. Crystals. 2019; 9(3):123. https://doi.org/10.3390/cryst9030123
Chicago/Turabian StyleLiu, Ying, Wentao Dai, Guijian Xiao, and Yun Huang. 2019. "Surface Integrities of Different Trajectories in Belt Grinding for Pure Iron Functional Performance Test Pieces" Crystals 9, no. 3: 123. https://doi.org/10.3390/cryst9030123
Note that from the first issue of 2016, this journal uses article numbers instead of page numbers. See further details here.