Article

The Preparation, Morphological Characterization and Possible Electroanalytical Application of a Hydroxyapatite-Modified Glassy Carbon Electrode

by
Ivana Škugor Rončević
1,
Marijo Buzuk
1,
Maša Buljac
2 and
Nives Vladislavić
1,*
1
Department of General and Inorganic Chemistry, Faculty of Chemistry and Technology, University of Split, 21000 Split, Croatia
2
Department of Environmental Chemistry, Faculty of Chemistry and Technology, University of Split, 21000 Split, Croatia
*
Author to whom correspondence should be addressed.
Crystals 2021, 11(7), 772; https://doi.org/10.3390/cryst11070772
Submission received: 31 May 2021 / Revised: 21 June 2021 / Accepted: 26 June 2021 / Published: 1 July 2021
(This article belongs to the Special Issue Coordination Polymers)

Abstract

:
By simple modification of a GC electrode with biofunctional material, hydroxyapatite (HAp), an efficient electroanalytical tool, was designed and constructed. Modification of the GC surface includes two steps in synthesis: electrochemical deposition and chemical conversion. The properties, structure, and morphology of a nanosized material formed on a surface and absorbability were studied by electrochemical impedance spectroscopy, Fourier-transform infrared spectroscopy and scanning electron microscopy with energy-dispersive spectroscopy analysis. Numerous methods in this work confirmed that the developed method for controlled HAp deposition results in a HAp open structure and uniform morphology, which is capable of the selective absorption of the target species. The main goal of this study was the possibility of using a HAp-modified electrode for the fast screening of copper, cadmium, and lead content in honey and sugar samples. The electrochemical behavior and potential of the electroanalytical determination of heavy metals using the HAp/GC electrode were studied using cyclic voltammetry and square wave anodic stripping voltammetry. The HAp/GC electrode exhibited great performance in the determination of heavy metals, based on the reduction of target metals, because of the high absorbability of the HAp film and the electroanalytical properties of GC. A linear response between 10 and 1000 μg/L for Cu and Pb and 1 and 100 μg/L for Cd, with an estimated detection limit of 2.0, 10.0, and 0.9 μg/L, respectively, was obtained.

Graphical Abstract

1. Introduction

Environmental contamination is one of the main health problems in industrial countries [1]. Metal pollution has become an increasingly important ecological problem in developed and developing countries. Metal and metalloid pollution in the air, soil, and water comes from mining activities; industrial production; industrial wastes and wastewater; the engines of passenger cars, trucks, and off-road vehicles; areas used for the illegal disposal of hazardous waste; the burning of leaded gasoline, chemicals, and manure-based fertilizers; some pesticides; geological processes; plastic films containing metals, etc. Heavy metals in dust and gases can also enter soil and water by natural sedimentation, rainfall, or infiltration when released into the air [2]. Toxic metals can easily enter the food chain if contaminated water, soils, air, or plants are used for food production.
The term “heavy metals” refers to a metallic element that has a relatively high density and is toxic or poisonous even at low concentrations. Heavy metals include elements such as lead (Pb), cadmium (Cd), nickel (Ni), iron (Fe), zinc (Zn), chromium (Cr), and copper (Cu). Some of them, such as Cd, are exclusively toxic, whereas some are biogenic, such as Cu [3]. There are different sources of heavy metals in the environment such as natural, agricultural, industrial, domestic effluent, and atmospheric sources, as well as other sources. They are stable in the environment, difficult to eliminate, and cause irreversible damage to the survival, feeding, growth, and behavior of organisms. Activities such as mining and smelting operations and agriculture have contaminated extensive areas of the world, mostly by heavy metals such as Cd, Cu, and Zn [4]. Several authors have indicated that honeybees and honey can serve as environmental bioindicators for metal pollution, as biomarkers for the identification of botanical and geographical origins represent a honey fingerprint [5,6,7].
Honey bees can be exposed to heavy metals when foraging contaminated honey and pollen resources and, in some cases, by airborne exposure. Traditional analytical methods have been proposed for the detection and quantification of heavy metals in honey samples [8] such as flame atomic absorption spectrometry (FAAS) for Ca, Mg, and Zn [9]; atomic absorption spectrometry for Pb, Cd, and Cu [8,10]; or inductively coupled plasma mass spectrometry to uncover metal content in honey samples [11,12,13]. However, some of the above-mentioned methods are nonspecific and laborious and needed harmful and expensive substances, which, in combination with a long sample preparation time and well-trained operators, drastically increased the time and cost of analysis. Thus, the development of different electroanalytical methodologies has been applied to explore metal contamination. Stripping voltammetric techniques are powerful analytical tools that are becoming widely used in various chemical analyses of food contaminants or essential elements, additive dyes, and other organic compounds of biological significance [14] such as anodic stripping voltammetry at Hg microelectrodes for the determination of Cu, Pb, Cd, and Zn [15]; Cd and Pb at bismuth-film-modified glassy carbon electrodes using square wave anodic stripping voltammetry [16]; or Zn, Cd, Pb, and Cu in raw propolis samples at pencil lead–bismuth film electrodes [17,18]. These are successively applied for the analysis of metals in honey samples.
In our previous research, we reported on the preparation of hydroxyapatite (HAp) coatings on a glass carbon electrode by electrochemical deposition combined with the chemical precipitation of Ca/P phases and subsequent treatment in alkaline (NaOH) solution (physical and chemical process). Thin HAP coatings formed on the surface of GC electrodes have excellent electroanalytical performance [19]. Hydroxyapatite (Ca10(PO4)6(OH)2, HAp) is a new type of bioceramic with great bioactivity and particular multiadsorbing sites analogous to the mineral components of bone and teeth. Due to its “open structure”, great varieties of cationic and anionic substitutions in HAp are possible, including its application for electroanalytical purposes. Many different applications are reported in the literature, mostly in bioscience, because of its acid–base properties, ion-exchange ability, biocompatibility, and adsorption capacity [20,21,22,23].
The morphology of HAp coatings has been studied using Fourier-transform infrared spectroscopy (FTIR), scanning electron microscopy (SEM), and atomic force microscopy (AFM). The prepared film electrode has been used as a sensing material for the detection of heavy metals in honey and sugar. Additionally, for the preparation of real samples, a method for preparing natural organic materials has been developed.
Different approaches for the synthesis of Ca/P phases are presented in the literature, including physical techniques (different performances of spraying, sputtering, evaporation, or deposition) and chemical methods (sol–gel, immersion coating, hot-isostatic pressing, electrophoretic deposition, electrochemical deposition, (micro)emulsion routes, dip coating, or sintering) [24,25,26,27]. Different ratios of the crystalline/amorphous phase of HAp coatings can be achieved due to the different methods of synthesis employed in the synthesis of HAp [28,29]. The chemical composition, structure, and property of the amorphous phase are dependent on the structure of its clusters. The formation of amorphous calcium phosphate and its subsequent transition to crystalline hydroxyapatite lead to the formation of a cluster structure [30] and the possible formation of a coordination complex of HAp and heavy metals.
Electrochemical deposition, an environmentally friendly method for coating formation, represents an ecologically clean and safe approach with unique advantages due to its ability to create a uniform coating on curved surfaces and other complex geometries. Additionally, the process is economically acceptable and simple, as it can be performed at room temperature, and the morphology of the coating can be easily controlled by changing the time and potential of precipitation, concentration, and pH of the electrolyte or by adding a growth guide [31,32].
The analytical performances of the electrochemical methods depending on the sensor’s construction and some numerical data of the selected metals at HAp-modified electrodes are presented in Table 1. From the presented results for the detection limit, it can be seen that the electrochemical determination of heavy metals is comparable to the results achieved with flame atomic absorption spectroscopy (FAAS).

2. Materials and Methods

Chemicals, Solutions, and Apparatus All used reagents were of analytical reagent grade. All of the solutions were prepared with double-distilled water. The Sigradur® glassy carbon was supplied from Hochtemperatur-Werkstoffe GmbH, Thierhaupten, Germany.
Preparation of the GC Electrode Before use, the glassy carbon (GC) electrodes (5 mm in diameter), which served as substrate electrodes in all experiments, were mechanically polished with emery paper (2000 grit), followed by polishing with alumina powder down to 0.05 μm. After polishing, the electrodes were treated ultrasonically in redistilled water, rinsed with ethanol, and finally rinsed with redistilled water.
In order to achieve a reproducible and active electrode surface, the electrodes were activated in 0.5 mol dm−3 HNO3, as noted in our previous study [32].
Preparation of HAp/GC Electrode The Ca/P-phase electrodeposition solution was prepared by mixing 50 cm3 of 0.05 mol dm−3 Ca(NO3)2 · 4H2O and 50 cm3 of 0.04 mol dm−3 (NH4)2HPO4. The pH of the solution was adjusted to 5.0 by adding 0.5 mol dm−3 HNO3. Electrodeposition was performed at a potential of −850 mV for 60 min at room temperature. The electrolyte was stirred with a magnetic stirrer at a constant speed. In that way, the concentration of Ca2+ and HPO42− ions was constant during electrodeposition.
Alkaline treatment was performed in a bath with 1.0 mol dm−3 NaOH at 80 °C for 60 min after electrodeposition. Between each step, the electrode was cleansed with redistilled water.
As a result of the preparation procedure, a HAp/GC electrode was obtained.
Instruments All experiments were carried out at 25 °C.
The surface morphology was studied using a FEG–SEM Thermo Scientific™ Quattro ESEM scanning electron microscope (SEM). Obtained images were quantified using ImageJ software (Rasband, U.S. NIH, Bethesda, MD, USA). Preliminary examination of the sample surface was conducted using a metallographic microscope (MMT 800BT, Mikrolab, Warsaw, Poland), and the surface topography of the samples was evaluated using an atomic force microscope (AFM, Dimension Icon, Bruker, Santa Barbara, CA, USA) in tapping mode using a standard silicon probe model TESPA-V2 (Bruker, Santa Barbara, CA, USA). Achieved images were quantified with ImageJ software (Rasband, U.S. NIH, Bethesda, MD, USA). Electrochemical impedance measurements were made using Solartron SI 1287 and SI 1255 HF frequency response analyzer (FRA) instruments. The Solartron instruments were controlled using Zplot and CorrWare computer software, while ZView and CorrView software packages were used as tools for data analysis. For electrochemical voltammetric measurements, a three-electrode cell was used with Ag/AgCl/3M KCl as the reference electrode, a platinum electrode as the counter electrode, and GC or HAp/GC as the working electrode with a potentiostat (AutoLab PGSTAT 302N) connected to a PC and driven by GPES4.9 software (Eco Chemie).
Preparations of Sugar and Honey Samples A representative sample (sample of sugar purchased from a local store and two samples of honey purchased from a local beekeeper from two localities: mountainous and coastal) of up to 2.0 g was digested in concentrated nitric acid, and the mixture was left in the digester for 24 h. The mixture was transferred to porcelain pots, which were annealed at 160 °C for 30 min. After cooling, 8 mL of H2O2 and 2 mL of HNO3 were added. The resulting solution was completely clarified. A 10 mL volume of aliquots of the prepared samples (pH = 4, adjusted with HNO3) was transferred to a 100 mL flask and filled with 0.2 mol dm−3 solution of KNO3.

3. Results

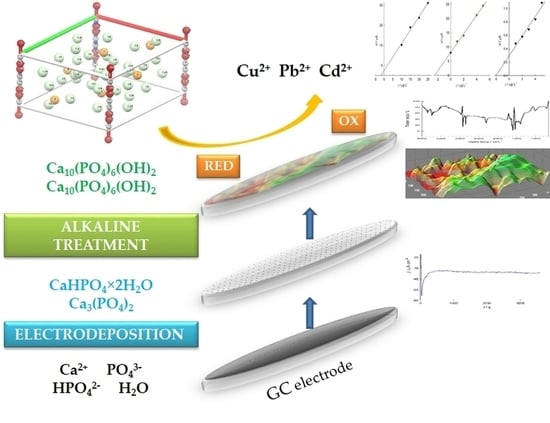
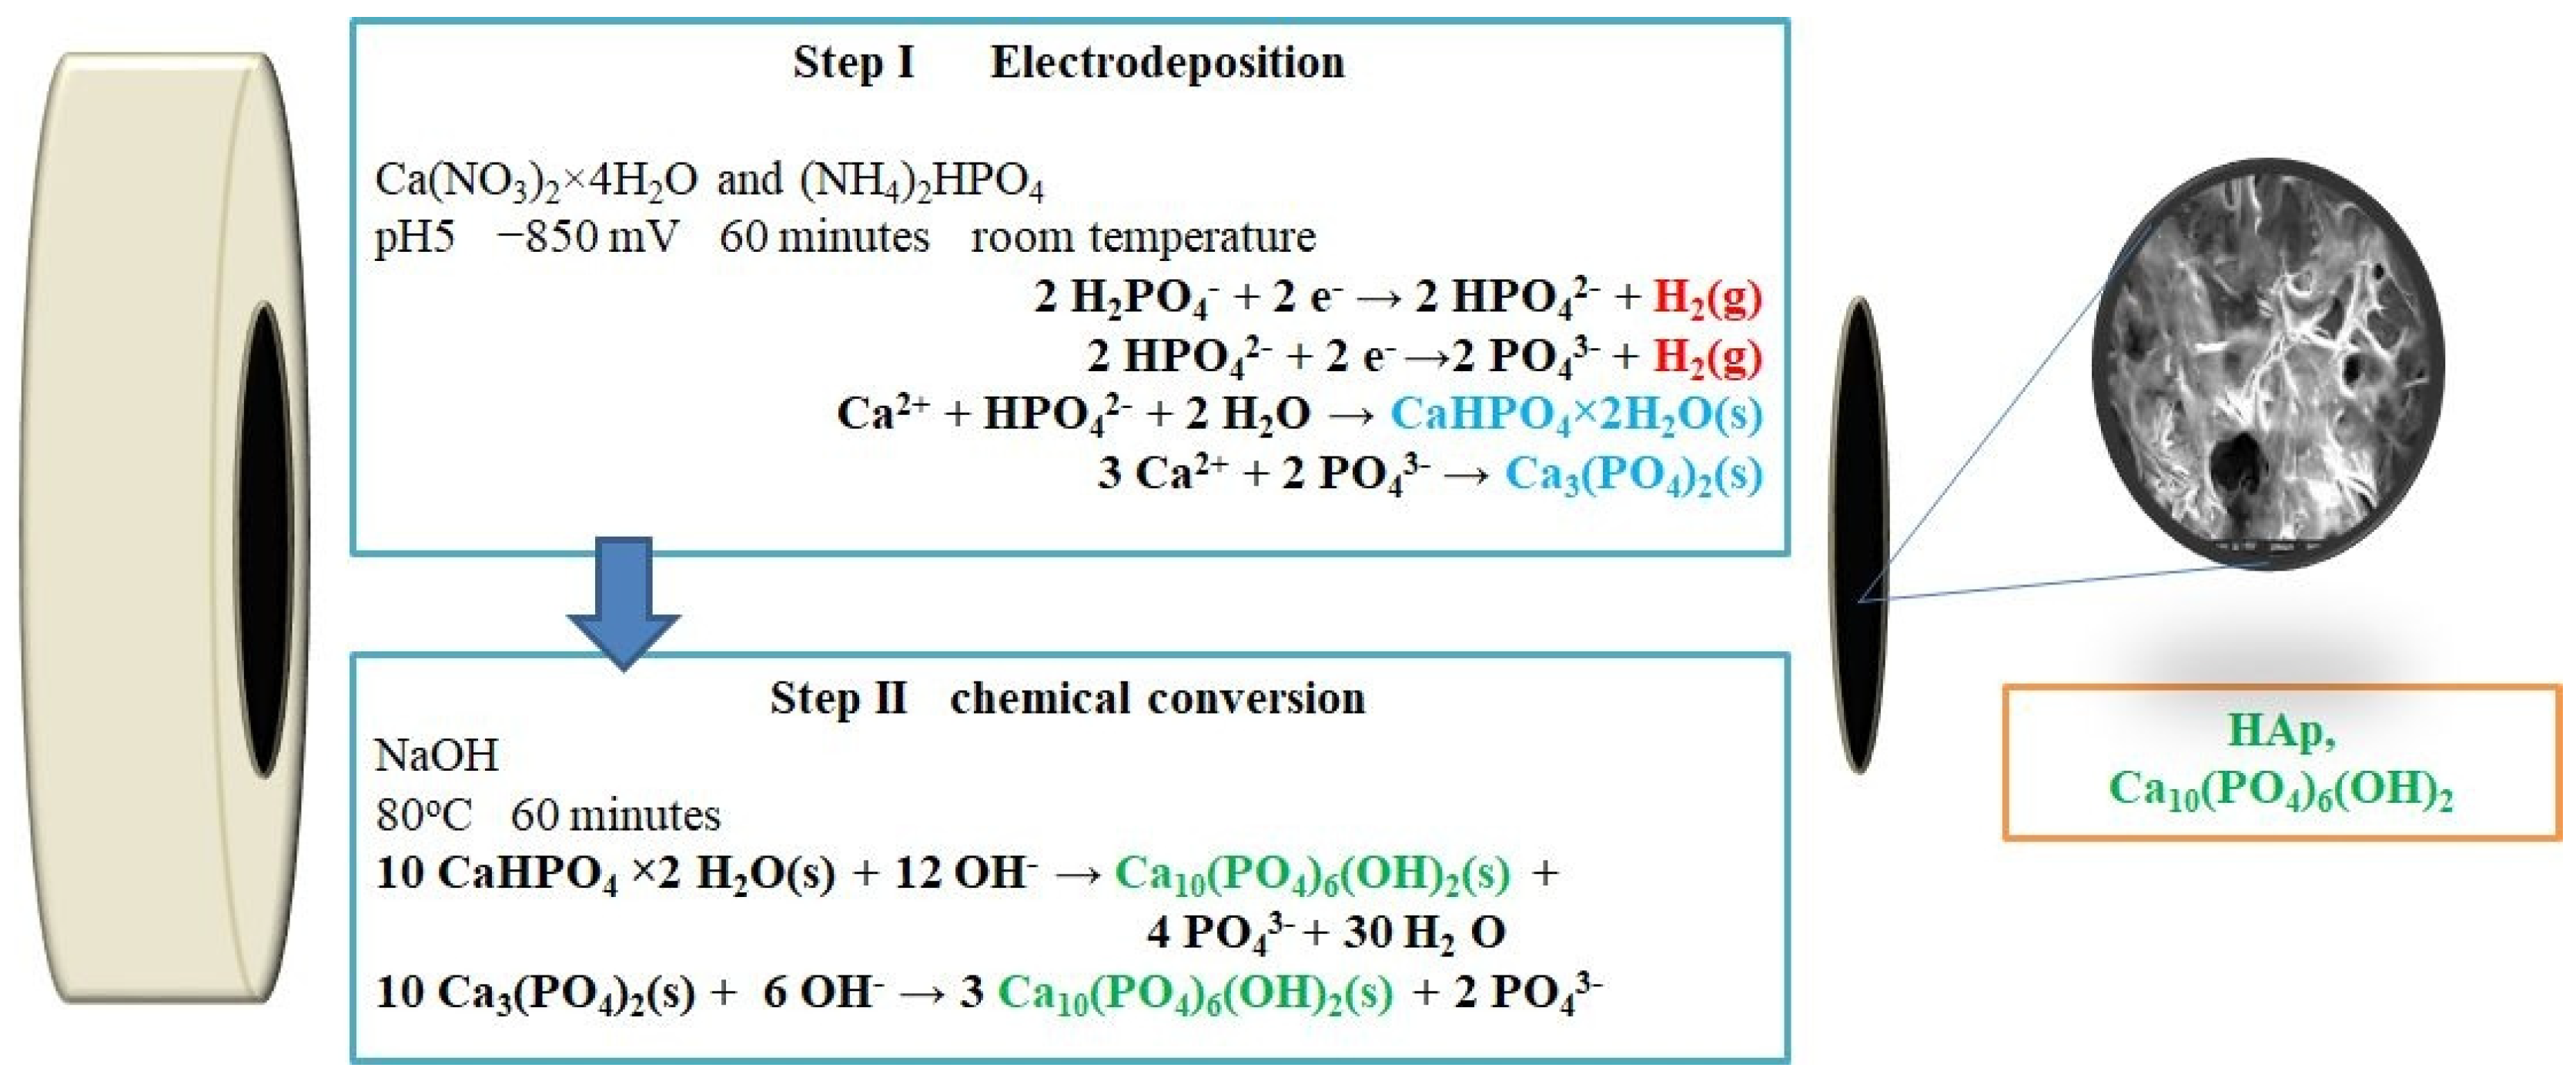
3.1. Electrodeposition of Ca/P Phases on the GC Electrode and Surface Morphology of the HAp Coating on the GC Electrode

3.1.1. Deposition

For the surface modification of the HAp coating on the GC electrode, a two-part method was performed [19]. The first part comprised the electrochemical and chemical reactions. Electrodeposition was performed at a potential of −850 mV at room temperature for 60 min. Electrochemical reactions involve the reduction of hydrogen (electrochemical reaction) and the spontaneous deposition of Ca/P phases (chemical reaction) when the Ca2+ ion reacts with HPO42− and PO43− and forms CaHPO4 × 2H2O (brushite, calcium hydrogen phosphate dihydrate) and Ca3(PO4)2 (calcium phosphate, β-TCP). Brushite and β-TCP are precursors to the formation of stable-phase HAp and Ca10(PO4)6(OH)2. The second part is chemical conversation via reactions that convert deposited Ca/P phases into hydroxyapatite (HAp) through alkaline treatment. Scheme 1 presents the process of deposition under the given experimental conditions.

3.1.2. Atomic Force Microscopy (AFM)

An example optical microscopy image of the surface of each sample and AFM images of the scanning areas of 10 × 10 µm are shown below in Figure 1. The optical microscopy images indicate that the surfaces of the tested samples are heterogeneous and not totally covered. From the microscopic images, it is possible to conclude that part of the GC surface is unmodified carbon, an uncovered surface, or microcracks with carbon in a small gap, probably due to a nonformed nucleus during the electrodeposition step. The formed film was evaluated with ImageJ software. A cross-sectional view is generated from the optical image and presented as the ZY or ZX planes. The obtained AFM images characterize the surface locally, and scans at different locations show noticeable differences in surface roughness. According to the AFM images, the mean image data plane (Rq) calculated on 100 μm2 regions for two different positions on the surface varies from 107.3 down to 35.5 nm for different film thicknesses (900.8 and 280.8 nm; Figure 1C,D).

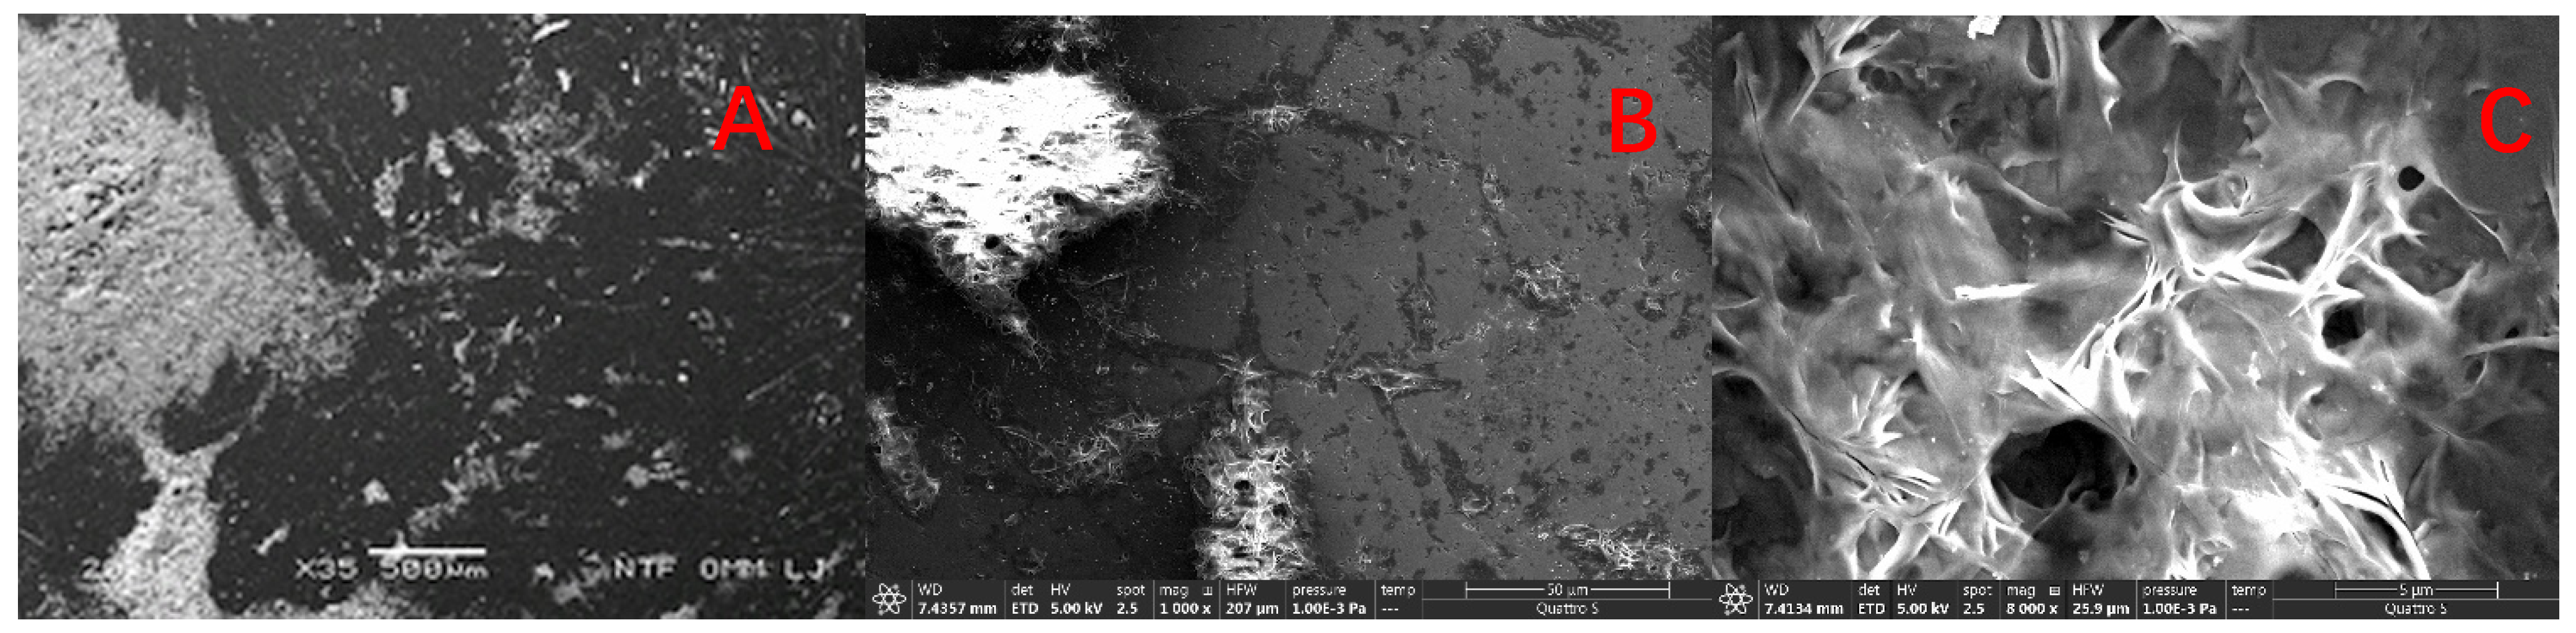
3.1.3. Scanning Electron Microscopy (SEM)

Figure 2 shows the surface morphologies of HAp on the GC surface with different magnifications: 35× (Figure 2A), 1000× (Figure 2B), and 8000× (Figure 2C). For the HAp coating with a magnification of 8000× (Figure 2C), it can be seen that a porous structure formed on the GC surface with HAp, with a macropore diameter between 0.5 and 3 μm. The macropores led to the development of a large specific surface area and an “open structure”, which is of great importance for good electroanalytical performance.
In our previous study [19], we reported that this method of modifying results in a relatively uniform topology and almost completely covered surfaces with an average content of elements derived by energy-dispersive spectroscopy (EDS) analysis corresponds to the formation of a P-deficient topology (Ca-fortified apatite), with a Ca/P ratio of 2.12, which was not found to be a biologically relevant Ca/P form. In the natural bone, the Ca/P ratio is close to 1.67 with an oxygen atomic content of ~62% [24].

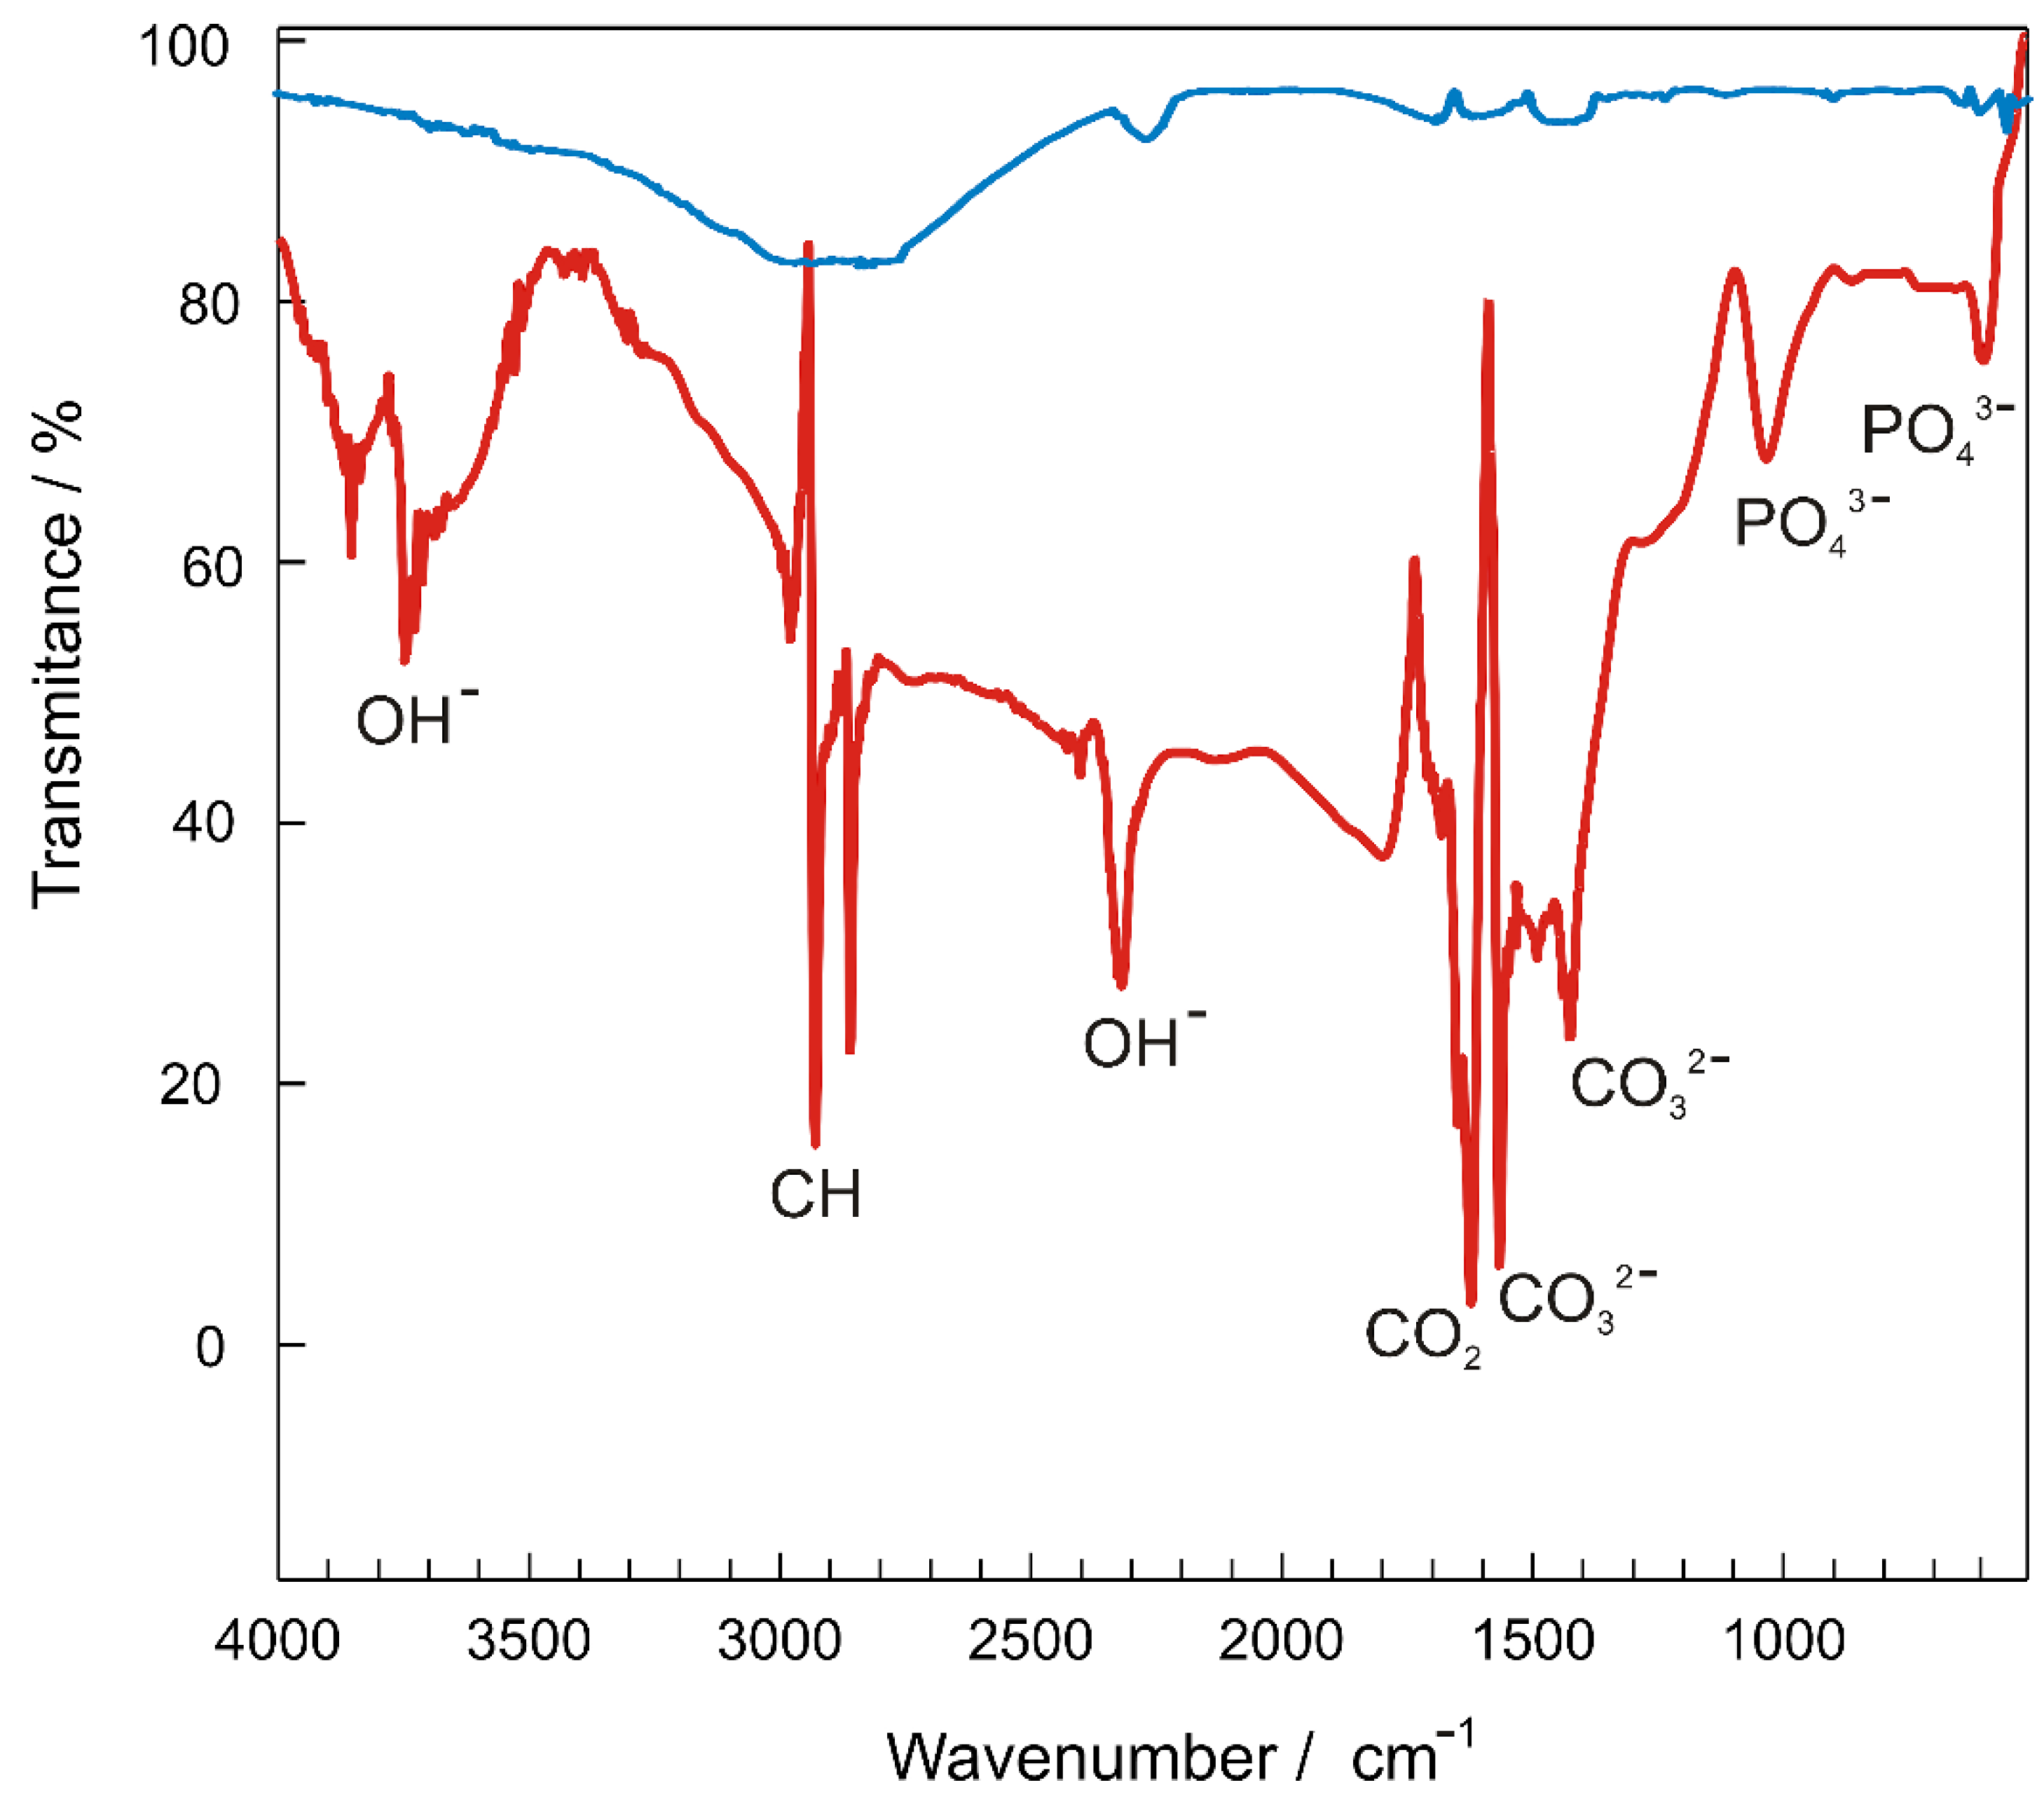
3.1.4. Fourier-Transform Infrared Spectroscopy (FTIR)

FTIR spectroscopy is a useful method to verify the presence of functional groups in synthesized compounds or materials in a wide wavenumber region. Figure 3 shows the FTIR spectra of the bare (blue line) and HAp-modified (red line) GC electrodes prepared as described in the Materials and Methods section (Section 2).
The observed peaks on the bare GC electrode are identified as follows. One strong shoulder peak observed between 2830 and 3050 cm−1 can be connected to the absorption of C–H stretching that corresponds to the frequency of asymmetric (2919 cm−1) and symmetric (2848 cm−1) stretching of the C–H bond from the methyl moiety (−CH2), which originated from organic impurities. The peak at 2330 cm−1 is due to O−H stretching, and the peaks at 1472 and 1400 cm−1 can be associated with the vibration of the traces of organic substances on the surface, or the vibration of a CO32− group, formed as a consequence of anodic or cathodic pretreatment in nitric acid. After modification, FTIR of the HAp/GC electrode shows some peaks characteristic of HAp [19,35].
The surface of HAp on the GC electrode showed some characteristic peaks [19,39]:
(1).
The strong characteristic band in the 3400–3900 cm−1 frequency range and at 2310 cm−1 is assigned to O−H stretching.
(2).
The peaks at 2848 and 2919 cm−1 of C–H stretching from the methyl moiety (−CH2), which originated from organic impurities, suggest a noncovered GC surface.
(3).
The peak at 1623 cm−1 was due to adsorbed atmospheric CO2, and the peaks at 1540 and 1380 cm−1 can be attributed to the vibration of traces of organic substances on the surface or the vibration of a CO32− group.
(4).
The most prominent peaks at 1015 cm−1 are due to the asymmetrical P−O stretching mode of HAp in phosphate.
(5).
The slight shoulders at 961 and 560 cm−1 and the peak at 604 cm−1 are ascribed to the P−O bending mode from phosphate.
The FTIR results confirm the presence of a HAp film on the GC surface.

3.1.5. Electrochemical Impedance Spectroscopy (EIS) Studies of HAp/GC

Interference properties, as well as the surfaces of modified and nonmodified electrodes and the absorption of an optimized HAp film on the GC electrode surface, were investigated using electrochemical impedance spectroscopy (EIS) in 0.2 M KNO3 (pH = 4). Figure 4 shows the impedance data as Nyquist plots, obtained for bare GC and modified HAp/GC via the electrodeposition process, as described in the Materials and Methods section (Section 2). Impedance data were fitted by a suitable electrical equivalent circuit (EEC) model, employing the complex nonlinear least-squares fit analysis [40] offered by Solartron ZView® software. The fitting quality was evaluated by the chi-squared and relative error values, which were of the order of 10−3–10−4 and below 5%, respectively, indicating that the agreement between the proposed EEC model and the experimental data was good. The total impedance, Z of the investigated electrochemical system is the sum of the ohmic resistance and the impedance of the electrochemical interface (Zel + ZHF + ZLF) and is described by the transfer function in Equation (1).
The Nyquist plots suggest the presence of the diffusion process. EIS data were modeled by the electrical equivalent circuit (EEC) with three time constants, as shown in the inset in Figure 4. In the EEC, constant phase element CPE1 is attributed to the double layer capacitance, R1 to the charge transfer resistance, CPE2 to the capacitance of the species traveling through the film, and CPE3 to the diffusion processes [41]. The numerical values of the EEC elements were obtained by the fitting procedure. The presented recorded plots reveal the diffusion-controlled processes that took place at the HAp/GC interface. The electrolyte resistance was 6.1 Ω cm2. The numerical values of the EEC elements obtained by the fitting procedure indicate an increase in charge transfer resistance in the case of the modified electrode, suggesting that the adsorbed layer inhibits charge transfer (from 47 to 113 Ω cm2). The EIS results are in agreement with the FTIR results.
Z T O T A L ( j ω ) = R e l + { Q 1 ( j ω ) n 1 + { R 1 + [ Q 2 ( j ω ) n 2 + Q 3 ( j ω ) n 3 ] 1 } 1 } 1

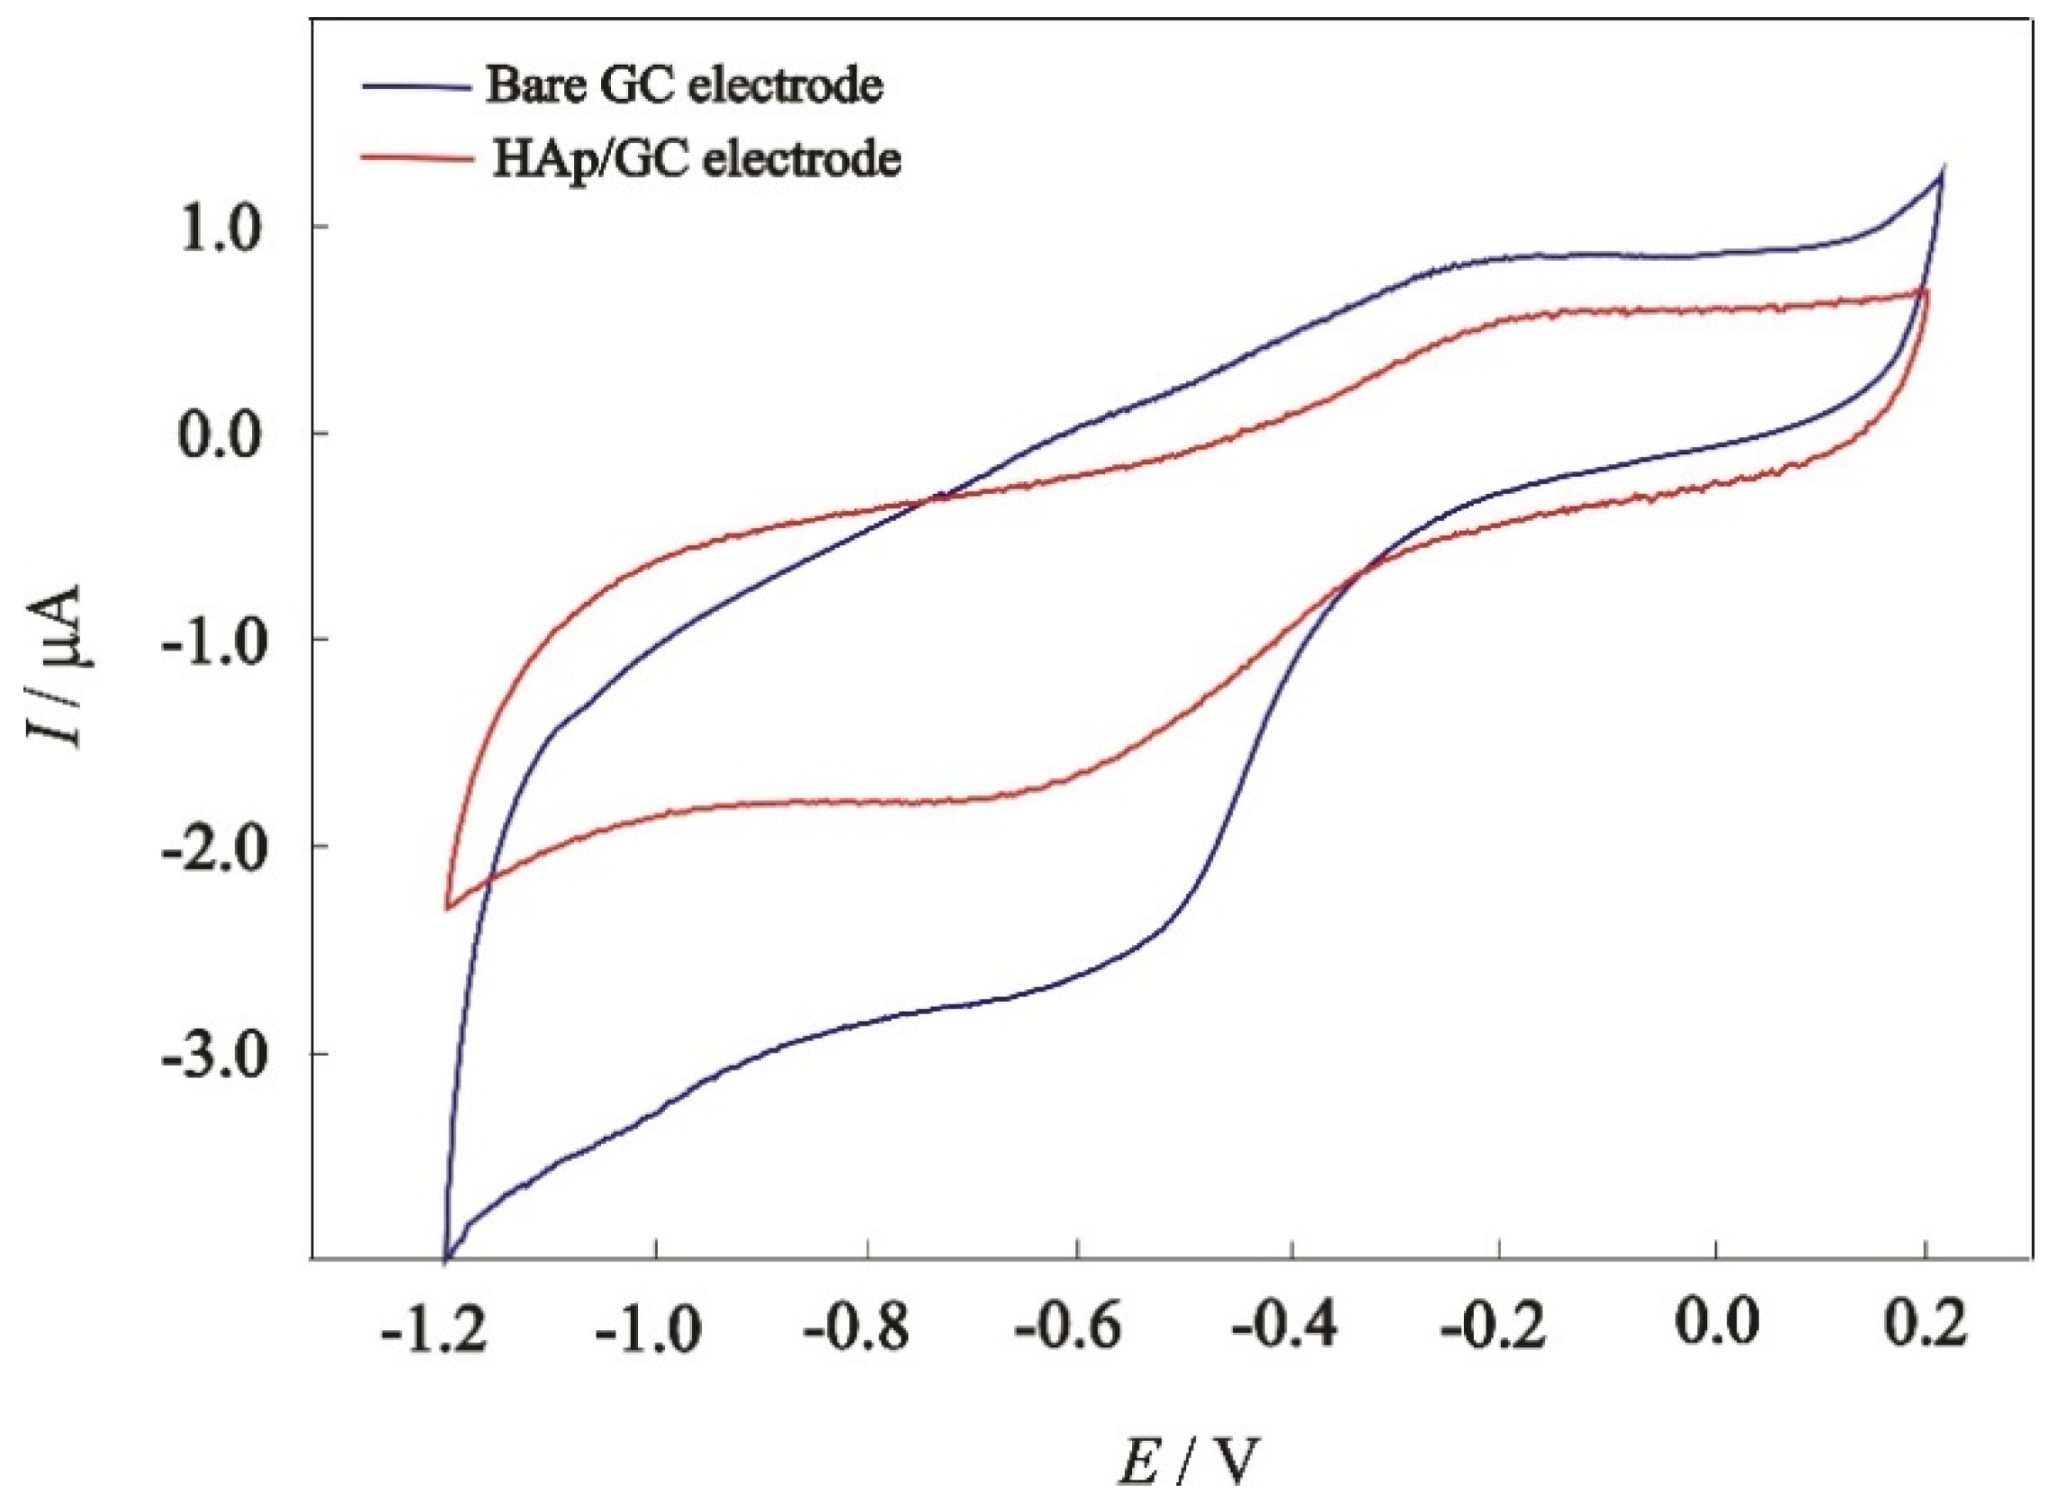
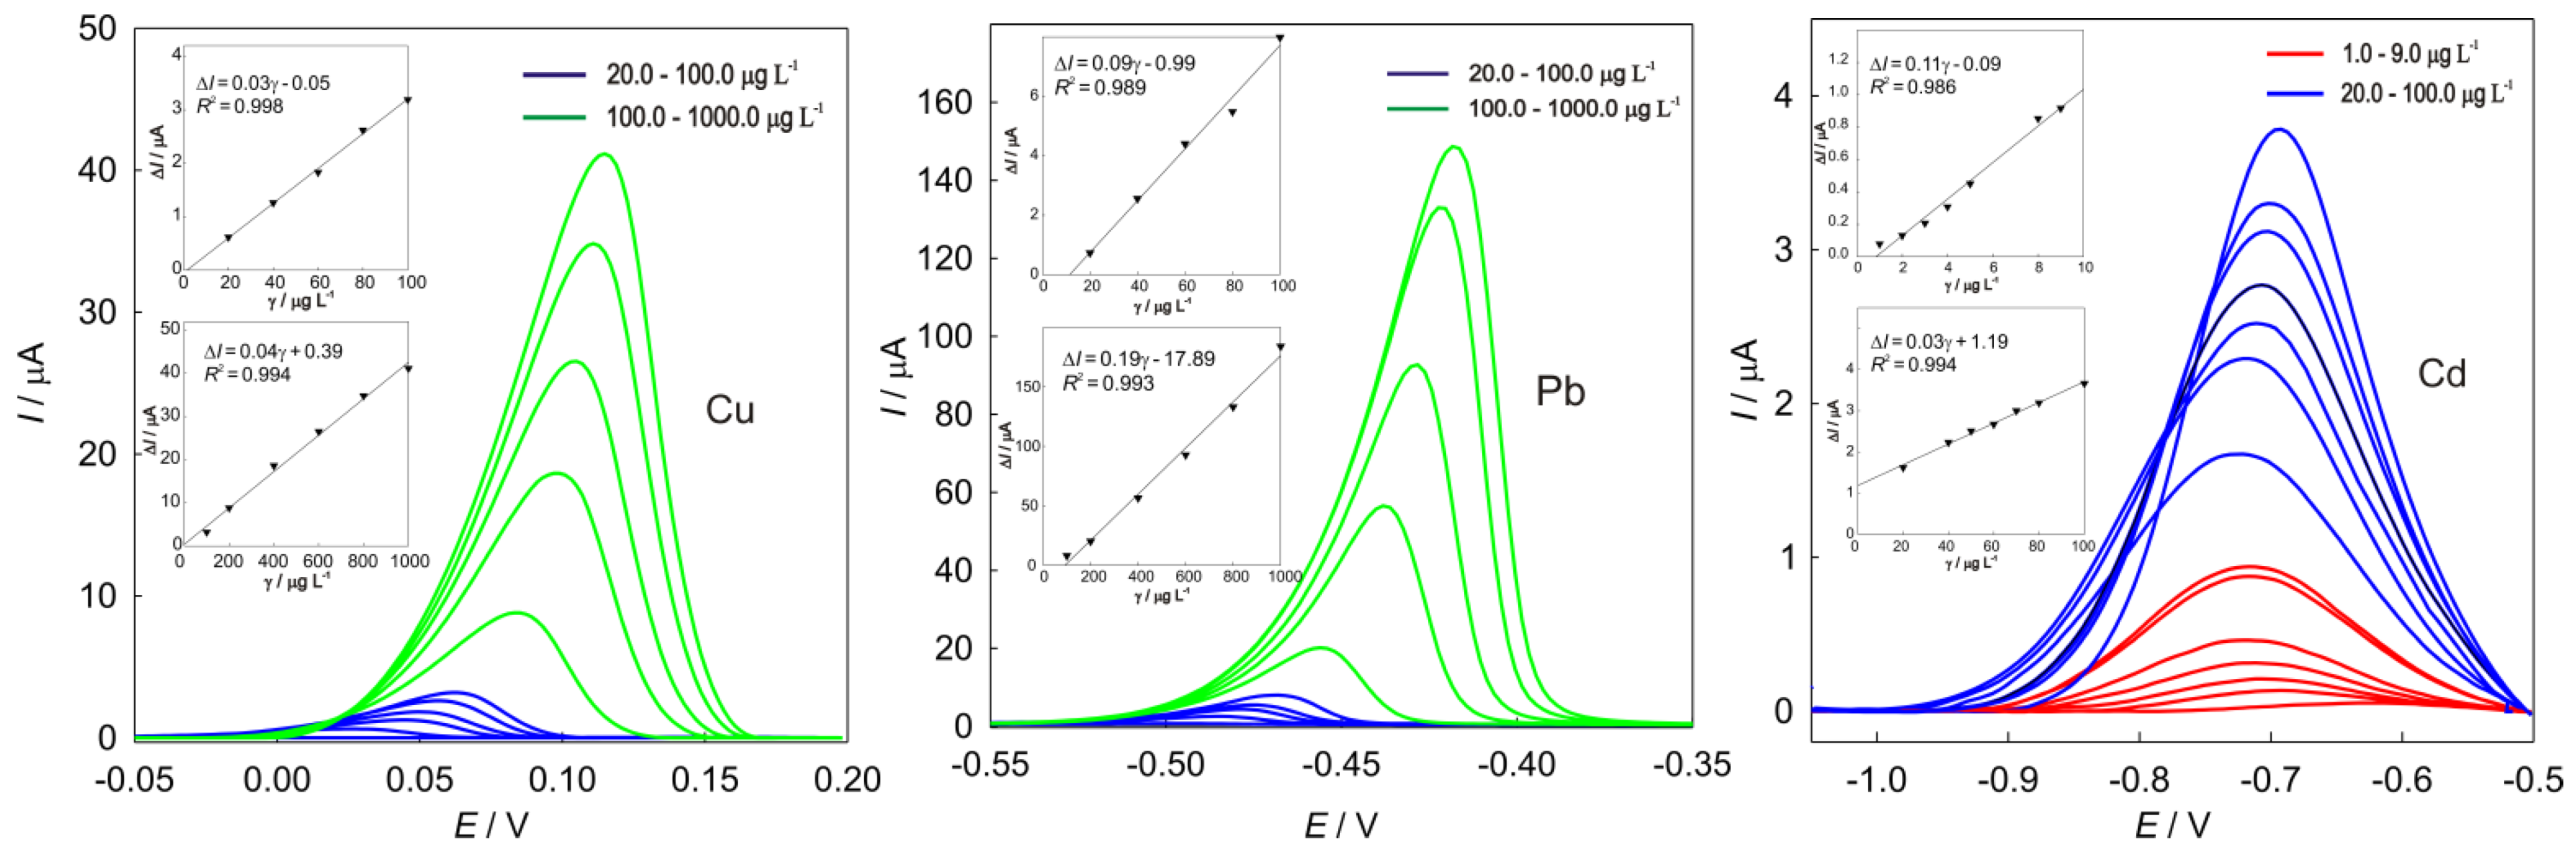
3.1.6. Electrochemical Methods

As the main inorganic constituents of biological hard tissues such as bones or teeth, HAp has a hexagonal structure, which can be self-polymerized during alkaline treatment. The sorption mechanisms of the heavy metals on HAp are diverse and mainly include ion exchange, dissolution/precipitation, and the spontaneous formation of surface complexes due to its unique channel structure [38]. The possible exchange of calcium ions with the target metal can be present as follows (Scheme 2).
Prior to the investigation of the possibilities for the application of a prepared HAp/GC electrode for an electroanalytical purpose, the electrochemical properties of the prepared HAp/GC electrode were examined. Cyclic voltammograms obtained at the HAp/GC electrode are presented in Figure 5.
These measurements were carried out without oxygen removed from the solution. The overpotential of hydrogen reduction on the HAp/GC electrode was very low. The presence of O2 affects the background. The obtained voltammograms revealed an intensive reduction signal at −0.5 V and an oxidation signal at −0.2 V, corresponding to the full reduction of oxygen. The oxygen reduction reaction ideally takes the four-electron pathway (O2 + 4H+ + 4e ↔ 2H2O). The potential of this reaction is similar to that reported for the oxygen reduction reaction at a bare glassy carbon electrode [42]. Afterward, the modification of the electrode reduction/oxidation peak that corresponds to oxygen is significantly reduced, which suggests a low sensitivity of the electrode to the oxygen present in the solution. The overpotential of hydrogen reduction at the HAp/GC electrode was very low. The presence of dissolved O2 could also reduce the potential window of the bare GC electrode, but the modified electrode could be used in a wider potential window with regard to the bare GC electrode.

4. Discussion

4.1. Analytical Applicability

A methodology for the determination of Cu, Pb, and Cd by square wave anodic stripping voltammetry (SWASV) at proposed electrodes in honey and sugar samples was proposed.
Such modified electrodes were subsequently used for the determination of heavy metal cations individually with optimized parameters. The SWCSV procedure was established by monitoring the influence of the applied potential increment (∆Es), frequency (f), pulse height (∆Ep), accumulation potential (Eacc), and accumulation time (tacc) on peak currents (Ip), and the obtained results are shown in Table 2. The SWCS voltammograms were obtained by the standard addition method (Figure 6). The calibration plots of the HAp/GC electrode towards copper, lead, and cadmium were derived from the obtained voltammograms, and the results are shown as insets of Figure 6.
During accumulation, selected potential from the adsorbed metal–apatite-targeting metal ion is reduced and then “stripped” from the surface. The change in slope, with linearity preserved, can be attributed to the increased amount of target metal accumulated at the electrode surface, resulting in saturation of the electrode surface. However, this will not take effect on the analytical performances of the modified electrode, as these ranges are well defined and reproducible. For higher metal concentrations, some authors suggest a shorter accumulation time.

4.2. Analytical Application of HAp/GC Electrode in Real Samples

In order to evaluate the analytical applicability of the prepared modified electrode, the proposed method was applied for the detection of Cu, Pb, and Cd in the real sample (honey and sugar) purchased from a local store, and the results are presented in Table 3, with examples of the SWCSVs of the prepared real sample showed presented in Figure 7. The concentrations of metals were obtained using the standard addition method. Besides being able to overcome the sample’s matrix interference, this method can also be used to determine low concentrations of analytes with excellent linearity. The results of the proposed method were compared with the results obtained by the standard analytical method (not shown). The method showed good agreement for copper and cadmium. Large deviations appear in the case of lead, suggestive of potential metal interferences in the determination of lead. For lead determination in sugar, another method must be performed.

5. Conclusions

In the current work, a chronoamperometric procedure for the preparation of the open-channel structure of HAp was presented, and a possible coordination structure (HAp/GC electrode) with heavy metals was introduced.
High porosity, a film with an open structure, good mechanical characteristics, and reproducibility in terms of the deposited film are achieved with the combined electrochemical and chemical steps for deposition and conversion. The FTIR study confirmed the existence of functional groups, characteristics of the HAp film, and the possibility of the adsorption/accumulation of heavy metals on the electrode surface. The developed method for controlled HAp deposition results in the HAp morphology of a nanosized material with a uniform pore size distribution, which was confirmed with numerous methods for surface analysis, suitable for selective adsorption.
Under the optimized conditions, a linear response between 10 and 1000 μg/L for Cu and Pb and 1 and 100 μg/L for Cd with an estimated detection limit of 2.0, 10.0 and 0.9 μg/L, respectively, were obtained. The development method was applied in complex matrices such as honey and sugar samples. In conclusion, commercial honey and sugar are safe as the amount of daily allowance without any harmful contamination of heavy metals.
Surface modification of the GC electrode with the HAp film significantly increased its sensitivity toward metal determination. However, the future prospects of this preparation and procedure can provide easy-to-handle, rapid, low-cost, highly sensitive, stable, and, with appropriate modification, even highly selective biosensors.

Author Contributions

Conceptualization, I.Š.R.; and N.V.; methodology, N.V.; validation, I.Š.R.; and N.V., formal analysis, M.B. (Marijo Buzuk); investigation, M.B. (Maša Buljac); resources, N.V.; data curation, N.V.; writing—original draft preparation, N.V.; writing—review and editing, I.Š.R.; visualization, I.Š.R.; supervision, M.B. (Marijo Buzuk). All authors have read and agreed to the published version of the manuscript.

Funding

This research received no external funding.

Data Availability Statement

Not applicable.

Acknowledgments

The authors gratefully acknowledge contribution of Samo Smolej from for the Department of Materials and Metallurgy, University of Ljubljana, Faculty of Natural Sciences and Engineering, Slovenia and Andrzej Leniart Department of Inorganic and Analytical Chemistry University of Lodz, Faculty of Chemistry, Poland for their contribution to obtain SEM-EDS and AFM images.

Conflicts of Interest

The authors declare no conflict of interest.

References

  1. Di, N.; Zhang, K.; Hladun, K.R.; Rust, M.; Chen, Y.-F.; Zhu, Z.-Y.; Liu, T.X.; Trumble, J.T. Joint effects of cadmium and copper on Apis mellifera foragers and larvae. Comp. Biochem. Physiol. Part C Toxicol. Pharmacol. 2020, 237, 108839. [Google Scholar] [CrossRef]
  2. Sousa, M.; Benson, B.; Welty, C.; Price, D.; Thirkill, R.; Erickson, W.; Cummings, M.; Dunnivant, F. Atmospheric deposition of coal-related pollutants in the Pacific Northwest of the United States from 1950 to 2016. Environ. Tox. Chem. 2019, 39, 335–342. [Google Scholar] [CrossRef]
  3. Zhou, Q. Interactions between heavy metals and nitrogen fertilizers applied to soil-vegetable systems. Bull. Environ. Contam. Tox. 2003, 71, 338–344. [Google Scholar] [CrossRef]
  4. Herawati, N.; Suzuki, S.; Hayashi, K.; Rivai, I.F.; Koyama, H. Cadmium, Copper, and Zinc Levels in Rice and Soil of Japan, Indonesia, and China by Soil Type. Bull. Environ. Contam. Toxicol. 2000, 64, 33–39. [Google Scholar] [CrossRef]
  5. Herrero-Latorre, C.; Barciela-García, J.; García-Martín, S.; Peña-Crecente, R.M. The use of honeybees and honey as environmental bioindicators for metals and radionuclides: A review. Environ. Rev. 2017, 25, 463–480. [Google Scholar] [CrossRef]
  6. Conti, M.E.; Botrè, F. Honeybees and Their Products as Potential Bioindicators of Heavy Metals Contamination. Environ. Monit. Assess 2001, 69, 267–282. [Google Scholar] [CrossRef]
  7. Soares, S.; Amaral, J.S.; Oliveira, M.B.P.P.; Mafra, I. A Comprehensive Review on the Main Honey Authentication Issues: Production and Origin. Compr. Rev. Food Sci. Saf. 2017, 16, 1072–1100. [Google Scholar] [CrossRef] [Green Version]
  8. Shah, A.; Sikandar, F.; Ullah, I.; Shah, A.; Ud-Din Khan, S.; Ali Rana, U.; McCoy, T. Spectrophotometric Determination of Trace Elements in various Honey Samples, Collected from different Environments. Food. Nutr. Res. 2014, 2, 532–538. [Google Scholar] [CrossRef] [Green Version]
  9. López-García, I.; Viñas, P.; Blanco, C.; Hernández-Córdoba, M. Fast determination of calcium, magnesium and zinc in honey using continuous flow flame atomic absorption spectrometry. Talanta 1999, 49, 597–602. [Google Scholar] [CrossRef]
  10. Hassan, A.; Mahmoud, A.A.; Ghandour, A.A.M.M.; Mahran, H.A. Evaluation of lead, cadmium and copper concentrations in bee honey. Am. J. Appl. Sci. 2010, 7, 315–322. [Google Scholar] [CrossRef]
  11. Chen, L.Z.; Rui, Y.K.; Zhao, J.; Ye, Z.H.; Xue, X.F.; Wang, P. Application of ICP-MS to detection of trace elements and heavy metals in different kinds of honey. Guang Pu Xue Yu Guang Pu Fen Xi/Spectrosc. Spect. Anal. 2008, 28, 1403–1405. [Google Scholar]
  12. Ioannidou, M.D.; Zachariadis, G.A.; Anthemidis, A.N.; Stratis, J.A. Direct determination of toxic metals in honey and sugar using ICP-AES. Talanta 2005, 65, 92–97. [Google Scholar] [CrossRef] [PubMed]
  13. Tiwari, P.; Naithani, P.; Tiwari, J.K. Determination of Heavy Metals in Honey Samples from Sub—Montane and Montane Zones of Garhwal Himalaya (India). World J. Pharm. Pharm. Sci. 2016, 5, 812–819. [Google Scholar] [CrossRef]
  14. Alghamdi, A.H. Applications of stripping voltammetric techniques in food analysis. Arab. J. Chem. 2010, 3, 1–7. [Google Scholar] [CrossRef] [Green Version]
  15. Sanna, G.; Pilo, I.M.; Piu, P.C.; Tapparo, A.; Seeber, R. Determination of heavy metals in honey by anodic stripping voltammetry at microelectrodes. Anal. Chim. Acta 2000, 415, 165–173. [Google Scholar] [CrossRef]
  16. Sochr, J.; Machková, M.; Machyňák, Ľ.; Čacho, F.; Švorc, Ľ. Heavy metals determination using various bismuth film modified carbon-based electrodes. Acta Chim. Slov. 2016, 9, 28–35. [Google Scholar] [CrossRef] [Green Version]
  17. Pierini, G.D.; Pistonesi, M.F.; Di Nezio, M.S.; Centurión, M.E. A pencil-lead bismuth film electrode and chemometric tools for simultaneous determination of heavy metals in propolis samples. Microchem. J. 2016, 125, 266–272. [Google Scholar] [CrossRef]
  18. Santos Nascimento, A.; Marchini, L.; Carvalho, C.; Araújo, D.; Silveira, T.; Olinda, R. Determining the Levels of Trace Elements Cd, Cu, Pb and Zn in Honey of Stingless Bee (Hymenoptera: Apidae ) Using Voltammetry. Food Nutr. Sci. 2015, 6, 591–596. [Google Scholar] [CrossRef] [Green Version]
  19. Vladislavić, N.; Rončević, I.Š.; Buzuk, M.; Buljac, M.; Drventić, I. Electrochemical/chemical synthesis of hydroxyapatite on glassy carbon electrode for electroanalytical determination of cysteine. J. Solid State Electrochem. 2021, 25, 841–857. [Google Scholar] [CrossRef]
  20. Malmberg, P.; Bigdeli, N.; Jensen, J.; Nygren, H. Formation of hydroxyapatite on titanium implants in vivo precedes bone-formation during healing. Biointerphases 2017, 12, 041002. [Google Scholar] [CrossRef] [Green Version]
  21. Nygren, H.; Bigdeli, N.; Ilver, L.; Malmberg, P. Mg-corrosion, hydroxyapatite, and bone healing. Biointerphases 2017, 12, 02C407. [Google Scholar] [CrossRef] [Green Version]
  22. Skwarek, E.; Janusz, W.; Sternik, D. The influence of the hydroxyapatite synthesis method on the electrochemical, surface and adsorption properties of hydroxyapatite. Adsorp. Sci. Technol. 2017, 35, 507–518. [Google Scholar] [CrossRef] [Green Version]
  23. Kanchana, P.; Sekar, C. Development of electrochemical folic acid sensor based on hydroxyapatite nanoparticles. Spectrochim. Acta Part A Mol. Biomol. Spectrosc. 2015, 137, 58–65. [Google Scholar] [CrossRef] [PubMed]
  24. Koch, C.F.; Johnson, S.; Kumar, D.; Jelinek, M.; Chrisey, D.B.; Doraiswamy, A.; Jin, C.; Narayan, R.J.; Mihailescu, I.N. Pulsed laser deposition of hydroxyapatite thin films’. Mater. Sci. Eng. C 2007, 27, 484–494. [Google Scholar] [CrossRef]
  25. Sun, L.M.; Berndt, C.C.; Gross, K.A.; Kucuk, A. Material fundamentals and clinical performance of plasma-sprayed hydroxyapatite coatings: A review. J. Biomed. Mater. Res. 2001, 58, 570. [Google Scholar] [CrossRef]
  26. Hamdi, M.; Hakamata, S.; Ektessabi, A.M. Coating of hydroxyapatite thin film by simultaneous vapor deposition. Thin Solid Films 2000, 377–378, 484. [Google Scholar] [CrossRef]
  27. Sun, L.M.; Berndt, C.C.; Khor, K.A.; Cheang, H.N.; Gross, K.A. Surface characteristics and dissolution behavior of plasma-sprayed hydroxyapatite coating. J. Biomed. Mater. Res. 2002, 62, 228. [Google Scholar] [CrossRef]
  28. Jin, B.; Shao, C.; Wang, Y.; Mu, Z.; Liu, Z.; Tang, R. Anisotropic Epitaxial Behavior in the Amorphous Phase-Mediated Hydroxyapatite Crystallization Process: A New Understanding of Orientation Control. J. Phys. Chem. Lett. 2019, 10, 7611–7616. [Google Scholar] [CrossRef]
  29. Ramesh, S.; Tan, C.Y.; Hamdi, M.; Sopyan, I.; Teng, W.D. The influence of Ca/P ratio on the properties of hydroxyapatite bioceramics. In Proceedings Volume 6423, International Conference on Smart Materials and Nanotechnology in Engineering; International Society for Optics and Photonics: Bellingham, WA, USA, 2007; p. 64233A. [Google Scholar] [CrossRef]
  30. Du, L.-W.; Bian, S.; Gou, B.-D.; Jiang, Y.; Huang, J.; Gao, Y.-X.; Zhao, Y.-D.; Wen, W.; Zhang, T.-L.; Wang, K. Structure of Clusters and Formation of Amorphous Calcium Phosphate and Hydroxyapatite: From the Perspective of Coordination Chemistry. Cryst. Growth Des. 2013, 13, 3103–3109. [Google Scholar] [CrossRef]
  31. Rončević, I.Š.; Grubač, Z.; Metikoš-Huković, M. Electrodeposition of hydroxyapatite coating on AZ91D magnesium alloy for biomaterial application. Int. J. Electrochem. Sci. 2014, 9, 5907–5923. [Google Scholar]
  32. Vladislavić, N.; Buzuk, M.; Brinić, S.; Buljac, M.; Bralić, M. Morphological characterization of ex situ prepared bismuth film electrodes and their application in electroanalytical determination of the biomolecules. J. Solid State Electrochem. 2016, 20, 2241–2250. [Google Scholar] [CrossRef]
  33. Li, Y.; Liu, X.; Zeng, X.; Liu, Y.; Liu, X.; Wei, W.; Luo, S. Simultaneous determination of ultra-trace lead and cadmium at a hydroxyapatite-modified carbon ionic liquid electrode by square-wave stripping voltammetry. Sens. Actuators B Chem. 2009, 139, 604–610. [Google Scholar] [CrossRef]
  34. Pan, D.; Wang, Y.; Chen, Z.; Lou, T.; Qin, W. Nanomaterial/Ionophore-Based Electrode for Anodic Stripping Voltammetric Determination of Lead:An Electrochemical Sensing Platform toward Heavy Metals. Anal. Chem. 2009, 81, 5088–5094. [Google Scholar] [CrossRef] [PubMed]
  35. Pan, D.; Wang, Y.; Chen, Z.; Yin, T.; Qin, W. Fabrication and characterization of carbon nanotube-hydroxyapatite nanocomposite: Application to anodic stripping voltammetric determination of cadmium. Electroanalysis 2009, 21, 944–952. [Google Scholar] [CrossRef]
  36. Khan, A.A.A.; Abdullah, M.A. Bismuth-modified hydroxyapatite carbon electrode for simultaneous in-situ cadmium and lead analysis. Int. J. Electrochem. Sci. 2013, 8, 195–203. [Google Scholar]
  37. El Mhammedi, M.A.; Achak, M.; Bakasse, M. Evaluation of a platinum electrode modified with hydroxyapatite in the lead(II) determination in a square wave voltammetric procedure. Arabian J. Chem. 2013, 6, 299–305. [Google Scholar] [CrossRef] [Green Version]
  38. Mortada, W.I.; Kenawy, I.M.M.; Abdelghany, A.M.; Ismail, A.M.; Donia, A.F.; Nabieh, K.A. Determination of Cu2+, Zn2+ and Pb2+ in biological and food samples by FAAS after preconcentration with hydroxyapatite nanorods originated from eggshell. Mater. Sci. Eng. C 2015, 52, 288–296. [Google Scholar] [CrossRef]
  39. Raizda, P.; Gautam, S.; Priya, B.; Singh, P. Preparation and photocatalytic activity of hydroxyapatite supported BiOCl nanocomposite for oxytetracyline removal. Adv. Mater. Lett. 2016, 7, 312–318. [Google Scholar] [CrossRef]
  40. Boukamp, B.A. A Nonlinear least squares fit procedure for analysis of immittance data of electrochemical systems. Solid State Ion. 1986, 20, 31–44. [Google Scholar] [CrossRef] [Green Version]
  41. Macdonald, J.R. Impedance Spectroscopy: Emphasizing, Solid Materials and Systems; John Wiley & Sons Inc.: New York, NY, USA, 1987; p. 301. ISBN 10:0471831220. [Google Scholar]
  42. Shimizu, K.; Sepunaru, L.; Compton, R.G. Innovative catalyst design for the oxygen reduction reaction for fuel cells. Chem. Sci. 2016, 7, 3364–3369. [Google Scholar] [CrossRef] [Green Version]
Scheme 1. Process of deposition under the given experimental conditions.
Crystals 11 00772 sch001
Figure 1. Optical image of the HAp film at 500× magnification: (A) cross-sectional view generated from the optical image (B) and film thickness measurements using AFM (C,D).
Crystals 11 00772 g001
Figure 2. SEM results with three different magnifications of the electrode surface: (A) 35× (B) 1000× (C) 8000×; film was electrodeposited on a polished glassy carbon electrode (Edep = −0.850 V; tdep = 60 min).
Crystals 11 00772 g002
Figure 3. FTIR spectra of the bare (blue line) and HAp-modified GC electrodes (red line).
Crystals 11 00772 g003
Figure 4. Nyquist plot of the unmodified and modified GC electrodes recorded at EOCP in 0.2 M KNO3 (pH = 4) solution. Inset: The EEC used to fit the EIS data (EOCP for bare the GC electrode = 0.0505 V and for the HAp/GC electrode = 0.0727 V).
Crystals 11 00772 g004
Scheme 2. Spontaneous formation of surface complexes due to its unique open-channel structure.
Crystals 11 00772 sch002
Figure 5. Cyclic voltammograms obtained on a bare GC electrode and a HAp/GC electrode in 0.2 M KNO3 (pH = 4) with a scan rate of 25 mV/s, going from 0.0 V to the cathodic direction.
Crystals 11 00772 g005
Figure 6. SWCSVs (baseline corrected), recorded at the HAp/GC electrode in 0.2 M KNO3 (pH = 4), with corresponding calibration plots derived by subtracting the background current from the corresponding voltammograms of copper, lead, and cadmium.
Crystals 11 00772 g006
Figure 7. Examples of the SWCSVs of the prepared real sample (baseline corrected), recorded at the HAp/GC electrode in 0.2 M KNO3 solution (pH = 4) together with the background response: lead in Honey 1, cadmium in Honey 2, and copper in sugar. The insets show the corresponding calibration plots.
Crystals 11 00772 g007
Table 1. Electroanalytical and analytical performances reported for the electrochemical determination of selected heavy metals at the HAp-modified electrode.
Electrode Modification/SubstrateElectroanalytical MethodsAnalytesLinear Range (µg/L)Analyzed SamplesLOD (µg/L)Ref.
HAp–CILE/CP 1CV
SWASV
Pb
Cd
0.11–0.121Wastewater sample0.041
0.056
2009 [33]
nHAp/ionophore/Nafion/GCE 2CV
ASDPV
Pb1 to 166Real water sample0.212009 [34]
CNT–HAp/GCE 3CV
DPV
Cd2.25–33,723Real tap water sample0.45 2009 [35]
Bi/HAp–CME 4CV
SWASV
Pb
Cd
Up to 150Spiked lake water sample5
5
2013 [36]
HAp/Pt 5CV
SWASV
Pb4.14–2277River water samples4.22013 [37]
FAAS 6FAASCu
Zn
Pb
0.72
0.55
0.512
2015 [38]
HAp/GCE 7CV
SWASV
Cu
Pb
Cd
10–1000
10–1000
1–100
Real sugar and honey samples2.0
10.0
0.9
2021
This work
1 HAp-modified carbon ionic liquid electrode (HAp–CILE): ionic liquid N-octylpyridium hexafluorophosphate (OPPF(6)) with a ratio of 50/50 (w/w = mixing the graphite powder with HAp to give an appropriate ratio of HAp/CP) and heating for 2 min at >65 °C. 2 Mixture of lead ionophore (IV) (4-tert-butylcalix[4]arene-tet-rakis(N,N-dimethylthioacetamide)) with nanosized hydroxyapatite (nHAp) prepared by one-step sonication for 20 min (from Ca(NO3)2 and (NH4)2HPO4; the molar ratio of Ca and P was equal to 1.67) and Nafion dropwise on the GCE. 3 One-step sonication: CNTs dispersed in solution with the aid of ultrasonication for 20 min with Ca(NO3)2 and (NH4)2HPO4; the molar ratio of Ca and P was equal to 1.67; 10 mL of 1 mg/mL carbon nanotube–HAp ethanol solution was added on the surface of the GCE and dried under an IR lamp. 4 Bismuth (in situ)-modified HAp carbon-modified electrode by adding different content ratios of HAp and graphite to the formation. 5 Electrodeposition of HAp on the surface of a bare platinum electrode. 6 After preconcentration with hydroxyapatite nanorods originating from an eggshell. 7 Electrodeposition of HAp on the surface of a glassy carbon electrode via the electrochemical deposition of and chemical conversation to HAp.
Table 2. Optimization parameters for the individual determination of copper, lead, and cadmium.
Cu2+Pb2+Cd2+
Supporting electrolyte0.2 M KNO30.2 M KNO30.2 M KNO3
pH444
Accumulation potential−500 mV−1000 mV−1200 mV
Accumulation time300 s240 s120 s
Frequency50 Hz50 Hz50 Hz
Potential increment5 mV5 mV5 mV
Pulse height50 mV50 mV20 mV
Stripping potential~100 mV~400 mV~700 mV
Concentration region with linear responses10 µg L−1–100 µg
100–1000 µg L−1
10 µg L−1–100 µg
100–1000 µg L−1
1.0 µg L−1–10 µg
10–100 µg L−1
Correlation coefficient, R20.998
0.994
0.989
0.993
0.986
0.994
Sensitivity0.03 µA µg L−1
0.04 µA µg L−1
0.09 µA µg L−1 
0.19 µA µg L−1
0.11 µA µg L−1 
0.03 µA µg L−1
Table 3. Obtained concentrations of Cu, Pb, and Cd in sweeteners (honey and sugar).
Real SampleHoney 1Honey 2Sugar
CuPbCdCuPbCdCuPbCd
µg kg−11775 ± 47587.5 ± 22.164.3 ± 1.7373.0 ± 12.04410 ± 66287.4 ± 12.6693.7 ± 23.5823.7 ± 13.5360.0 ± 2.7
Maximum Qty Allowed200030030020003003001000500500
Publisher’s Note: MDPI stays neutral with regard to jurisdictional claims in published maps and institutional affiliations.

