
Oxidation of Cr(III) to Cr(VI) and Production of Mn(II) by Synthetic Manganese(IV) Oxide

Department of Chemistry and Biochemistry, San Francisco State University, San Francisco, CA 94132, USA
*
Author to whom correspondence should be addressed.
Crystals 2021, 11(4), 443; https://doi.org/10.3390/cryst11040443
Submission received: 29 March 2021
/
Revised: 12 April 2021
/
Accepted: 13 April 2021
/
Published: 19 April 2021
(This article belongs to the Special Issue Sustainable Composites with Solid Waste Materials)
Abstract
:The heterogeneous oxidation of Cr(III) to Cr(VI), a toxic inorganic anion, by a synthetic birnessite (δ-MnO2) was investigated in batch reactions using a combination of analytical techniques including UV–Vis spectrophotometry, microwave plasma–atomic emission spectrometry, X-ray diffraction (XRD), X-ray photoelectron spectroscopy (XPS), and Fourier transform infrared spectroscopy (FTIR), to evaluate both the solution speciation of Cr(III)/Cr(VI) and the surface of the reacted δ-MnO2. The formation of dissolved Mn(II) was determined during the batch reactions to evaluate the extent and stoichiometry of the Cr(III) oxidation reaction. A stoichiometric 3:2 Mn(II):Cr(VI) molar relationship was observed in the reaction products. The reductive dissolution of the δ-MnO2 by Cr(III) resulted in a surface alteration from the conversion of Mn(IV) oxide to reduced Mn(II) and Mn(III) hydroxides. The results of this investigation show that naturally occurring Cr(III) will readily oxidize to Cr(VI) when it comes in contact with MnO2, forming a highly mobile and toxic groundwater contaminant.
1. Introduction
Chromium (Cr), a common soil and groundwater contaminant, exists in several oxidation states ranging from −2 to +6. Trivalent chromium (Cr(III)) and hexavalent chromium (Cr(VI)) are the most common and stable states of Cr in soils [1,2,3]. The Cr(III) species is less toxic and less mobile than the Cr(VI) species due to the solubility control imposed by the precipitation of Cr(OH)3 in the neutral-alkaline pH found in many soils [4]. Oxidation of Cr(III) to Cr(VI) increases the risk of human exposure to Cr and contributes to elevated Cr(VI) in groundwater. Exposure to Cr(VI) compounds can cause allergic reactions, skin irritation, respiratory irritation, asthma, and lung cancer [5,6]. The occurrence of Cr in soil and groundwater can be from both anthropogenic sources, such as chrome alloy production, chrome electroplating, ceramics manufacturing, and chromite ore processing [7], as well as natural sources, which are primarily Cr(III)-bearing minerals in ultramafic rocks [8,9]. The slow, long-term leaching of Cr-rich minerals can release dissolved Cr(III), which then can react with soil mineral surfaces or precipitate as Cr(OH)3 [4].
Manganese(IV) oxides (MnO2) are natural, oxidizing soil minerals that are part of an important pathway for the heterogeneous oxidation of reduced species in soil pore waters [4,10]. A variety of MnO2 polymorphs exist with different structural frameworks consisting of chains of Mn(IV) ions in MnO6 octahedral units shared by corners and/or edges [11]. Crystalline and poorly crystalline MnO2 minerals exist in several forms such as pyrolusite (MnO2), tunneled MnO2 (α-MnO2), rutile (β-MnO2), and birnessite (δ-MnO2). All of these MnO2 minerals are capable of oxidizing a wide variety of soil contaminants, including organic compounds such as phenol [12] and amine compounds [13,14]. Several inorganic contaminants including silver nanoparticles [15], Cr(III) [16] and As(III) [17] are also oxidized by MnO2.
Though previous studies have shown that the oxidation of dissolved species by MnO2 exists as a known pathway in geologic materials, the work presented here uses a unique combination of solution- and solid-phase analysis to provide a complete picture of the specific Cr(III) oxidation reaction. The objectives of this work are to (1) investigate Cr(III) oxidation to Cr(VI) by the synthetic mineral birnessite (δ-MnO2), (2) elucidate the stoichiometry of the Cr(III) oxidation reaction by analysis of the dissolved Mn, and (3) investigate the effects of Cr(III) oxidation on the solid MnO2 surface using surface-sensitive X-ray photoelectron spectroscopy (XPS) and bulk Fourier transform infrared spectroscopy (FTIR).
2. Materials and Methods
2.1. Materials and Synthesis of δ-MnO2
All chemicals used in this study (KMnO4, HCl, CrCl3, Na2CrO4, MnCl2) were reagent grade and were used as received. Ultra-pure deionized (DI) water (>18.2 MΩ·cm) was used throughout this study. Synthetic potassium birnessite (δ-MnO2, hereafter MnO2) was synthesized according to previous investigations [15]. Briefly, 1 L of heated (60 °C) 0.4 M KMnO4 was reacted with 0.5 L heated (60 °C), concentrated HCl followed by storage in dialysis tubing immersed in DI water for 14 d until the K+ concentration in the dialyzing solution decreased to <0.005 mM K. The MnO2 solids were air-dried for 48 h under nitrogen and gently crushed and sieved to a <150 μm particle size.
2.2. Characterization of δ-MnO2
The synthetic MnO2 was characterized by several methods including the determination of the K content of the solid MnO2 by X-ray fluorescence (XRF) spectrometry with an Olympus-Innov-X Delta hand-held XRF analyzer, X-ray diffraction (XRD) with a Bruker D8 Advance powder XRD (Cu Kα) equipped with an energy dispersive detector, and scanning electron microscopy (SEM) with a Zeiss Ultra 55 SEM equipped with a Gemini field emission column. The MnO2 samples were mounted on aluminum stubs with carbon paint and heated at 80 °C for 20 min prior to SEM imaging. The images were collected with a secondary electron in-lens detector. The MnO2-specific surface area was determined by single-point Brunauer–Emmett–Teller (BET) N2 adsorption using a Quantisorb Jr. flow-through surface area analyzer (Quantichrome Corp., Boynton Beach, FL, USA).
2.3. Reaction of Cr(III) with Synthetic MnO2
Batch reactions containing Cr(III) (as CrCl3) or Cr(VI) (as Na2CrO4) and solid MnO2 were performed with Cr(III) and Cr(VI) solutions prepared in either 0.1 mM HCl or DI water. The Cr treatment concentrations ranged between 0.10 and 1.0 mM Cr (5.40–54.0 ppm), which is a range well above most naturally occurring Cr(III) and Cr(VI) found in groundwaters [1]. The dissolved Cr–MnO2 suspensions were created by weighing 0.050 g MnO2 and adding 20.0 mL of a Cr(III)- or Cr(VI)-containing solution in round-bottom 40.0 mL polycarbonate Oak Ridge-type centrifuge tubes. The suspensions were shaken (120 rpm) and allowed to react for 48 h followed by centrifugation (5000 rpm, 10 min), filtering (0.2 μm), and a pH measurement with a Mettler Toledo SevenCompact pH/ion meter S220 prior to UV–Vis spectrophotometric analysis. All samples were measured by UV–Vis spectrophotometry followed by pH adjustments to >7.5 with 1.0 M NaOH as later described.
2.4. Determination of Dissolved Cr(III), Cr(VI), and Mn(II)
The analysis and speciation of Cr(III)/Cr(VI) were performed by combining the selective determination of Cr(VI) by UV–Vis spectrophotometry with the analysis of the total Cr (Cr(III) + Cr(VI)) by microwave plasma–atomic emission spectrometry (MP–AES). All UV–Vis spectrophotometric measurements were performed with a Cary 60 single-beam UV–Vis spectrometer equipped with a xenon flash lamp using 4-sided, 1 cm quartz cuvettes. The UV–Vis spectrophotometric measurements were then followed by an analysis of the total dissolved Cr and Mn with an Agilent 4200 MP–AES using the 357.68 and 403.075 nm wavelengths for Cr and Mn, respectively.
2.5. Analysis of MnO2 Solids by XPS and FTIR
Cr-treated samples analyzed by XPS and FTIR spectroscopy included 0.50 g MnO2 reacted with 20 mL of 10 mM Cr(III) or Cr(VI) for 48 h, followed by 5 cycles of rinsing with DI water. The samples were dried for 24 h at 80 °C and stored under N2 in a desiccator until analysis (within 1 day). X-ray photoelectron spectroscopy (XPS) was used to analyze pristine (unreacted) and Cr-treated MnO2 solid samples mounted on double-sided Cu tape. The XPS analyses were performed with a Physical Electronics PHI5400 X-ray photoelectron spectrometer with a Mg Kα X-ray source (20 mA and 15 kV) equipped with an ultra-high vacuum chamber operating below 1×10⁻⁸ Torr. The X-ray beam was incident normal to the sample and the hemispherical detector was oriented at 45° to the sample stage. High-resolution C 1s, O 1s, Cr 2p, and Mn 2p line scans involved the collection of 80 sweeps per element at a 0.1 eV/step energy resolution. Experimental binding energies (BEs) were corrected for surface charging by the comparison of the experimental C 1s main peak centroids to the theoretical C 1s line energy of 285.0 eV [18]. Binding energies and XPS peak assignments were made on the C 1s corrected data with Gaussian–Lorentzian curve fitting using AugerScan 3.0 software. A Thermo Nicolet NEXUS 470 FTIR spectrometer was used to collect infrared absorption spectra. The dried, solid MnO2 (pristine and Cr-treated) samples were mixed with dried KBr to achieve a solid concentration of 1% w/w and pressed into semitransparent pellets with a stainless-steel pellet press.
3. Results and Discussion
3.1. Characterization of MnO2
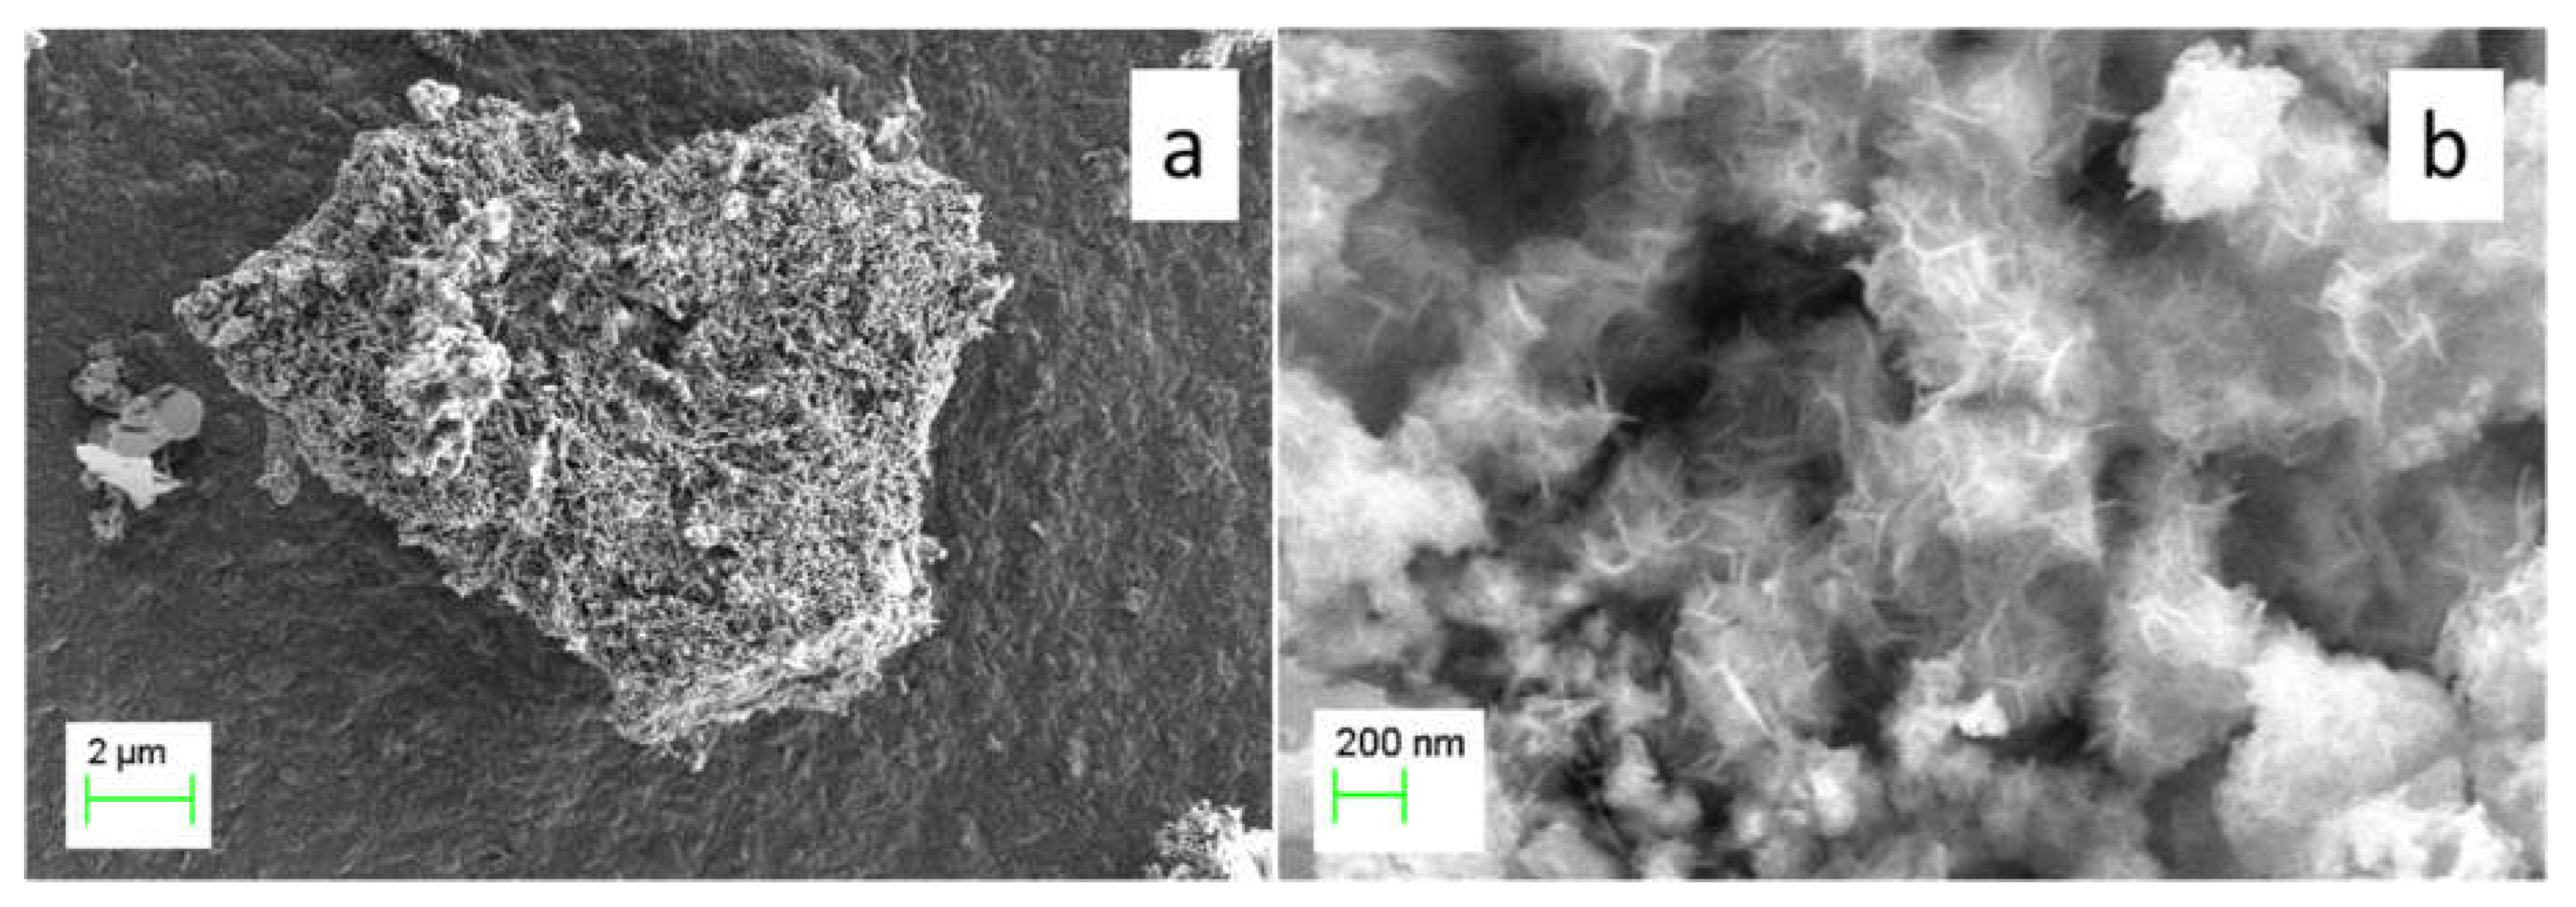
The synthetic MnO2 prepared in this study consisted of a dark, blackish powder similar to the “black birnessite” described previously [19]. Figure 1a shows a representative example of a large ~8 μm MnO2 particle with a complex surface roughness. A higher magnification image of this particle (Figure 1b) shows nanoscale plate-like structures similar to images of synthetic birnessite in previous studies [20,21]. Previous synthesis of potassium birnessite (KMnO2) has shown similar morphologies that consist of mostly irregular, plate-shaped (100–200 nm) crystallites [22].
The XRD pattern of synthetic MnO2 (Figure 2a) is consistent with a monoclinic birnessite crystal structure (JCPDS 43-1456) with a C2/m space group. The XRD peaks at 2θ = 12.3° (7.19 Å), 24.8° (3.59 Å), and 37.1° (2.40 Å) are characteristic features of birnessite materials with layered structures containing sheets of edge-sharing MnO6 octahedra with an approximate interplane repeat distance of 7 Å [23,24]. The low intensity and broadening of the XRD peaks are features of a poorly ordered MnO2 material and are similar to most natural birnessite minerals [11]. Approximately one out of six Mn4+ octahedral sites are unoccupied, creating Oh holes in the structure where Mn2+ and Mn3+ ions are positioned above each unoccupied octahedral site [25]. A characteristic feature of the layered structure of birnessite (δ-MnO2) is the cation and water exchange properties. The measured K+ ion content of MnO2 analyzed by XRF (Figure 2b) was 0.60 mmol g−1 (2.5% w/w), yielding a molecular formula of K0.09MnO2.H2O. The specific surface area of the MnO2 was 32.0 m2 g−1, which compared favorably to a previous study of MnO2 prepared from the same KMnO4/HCl method [26].
3.2. UV–Vis Spectrophotometric Analysis of Cr(III) and Cr(VI)
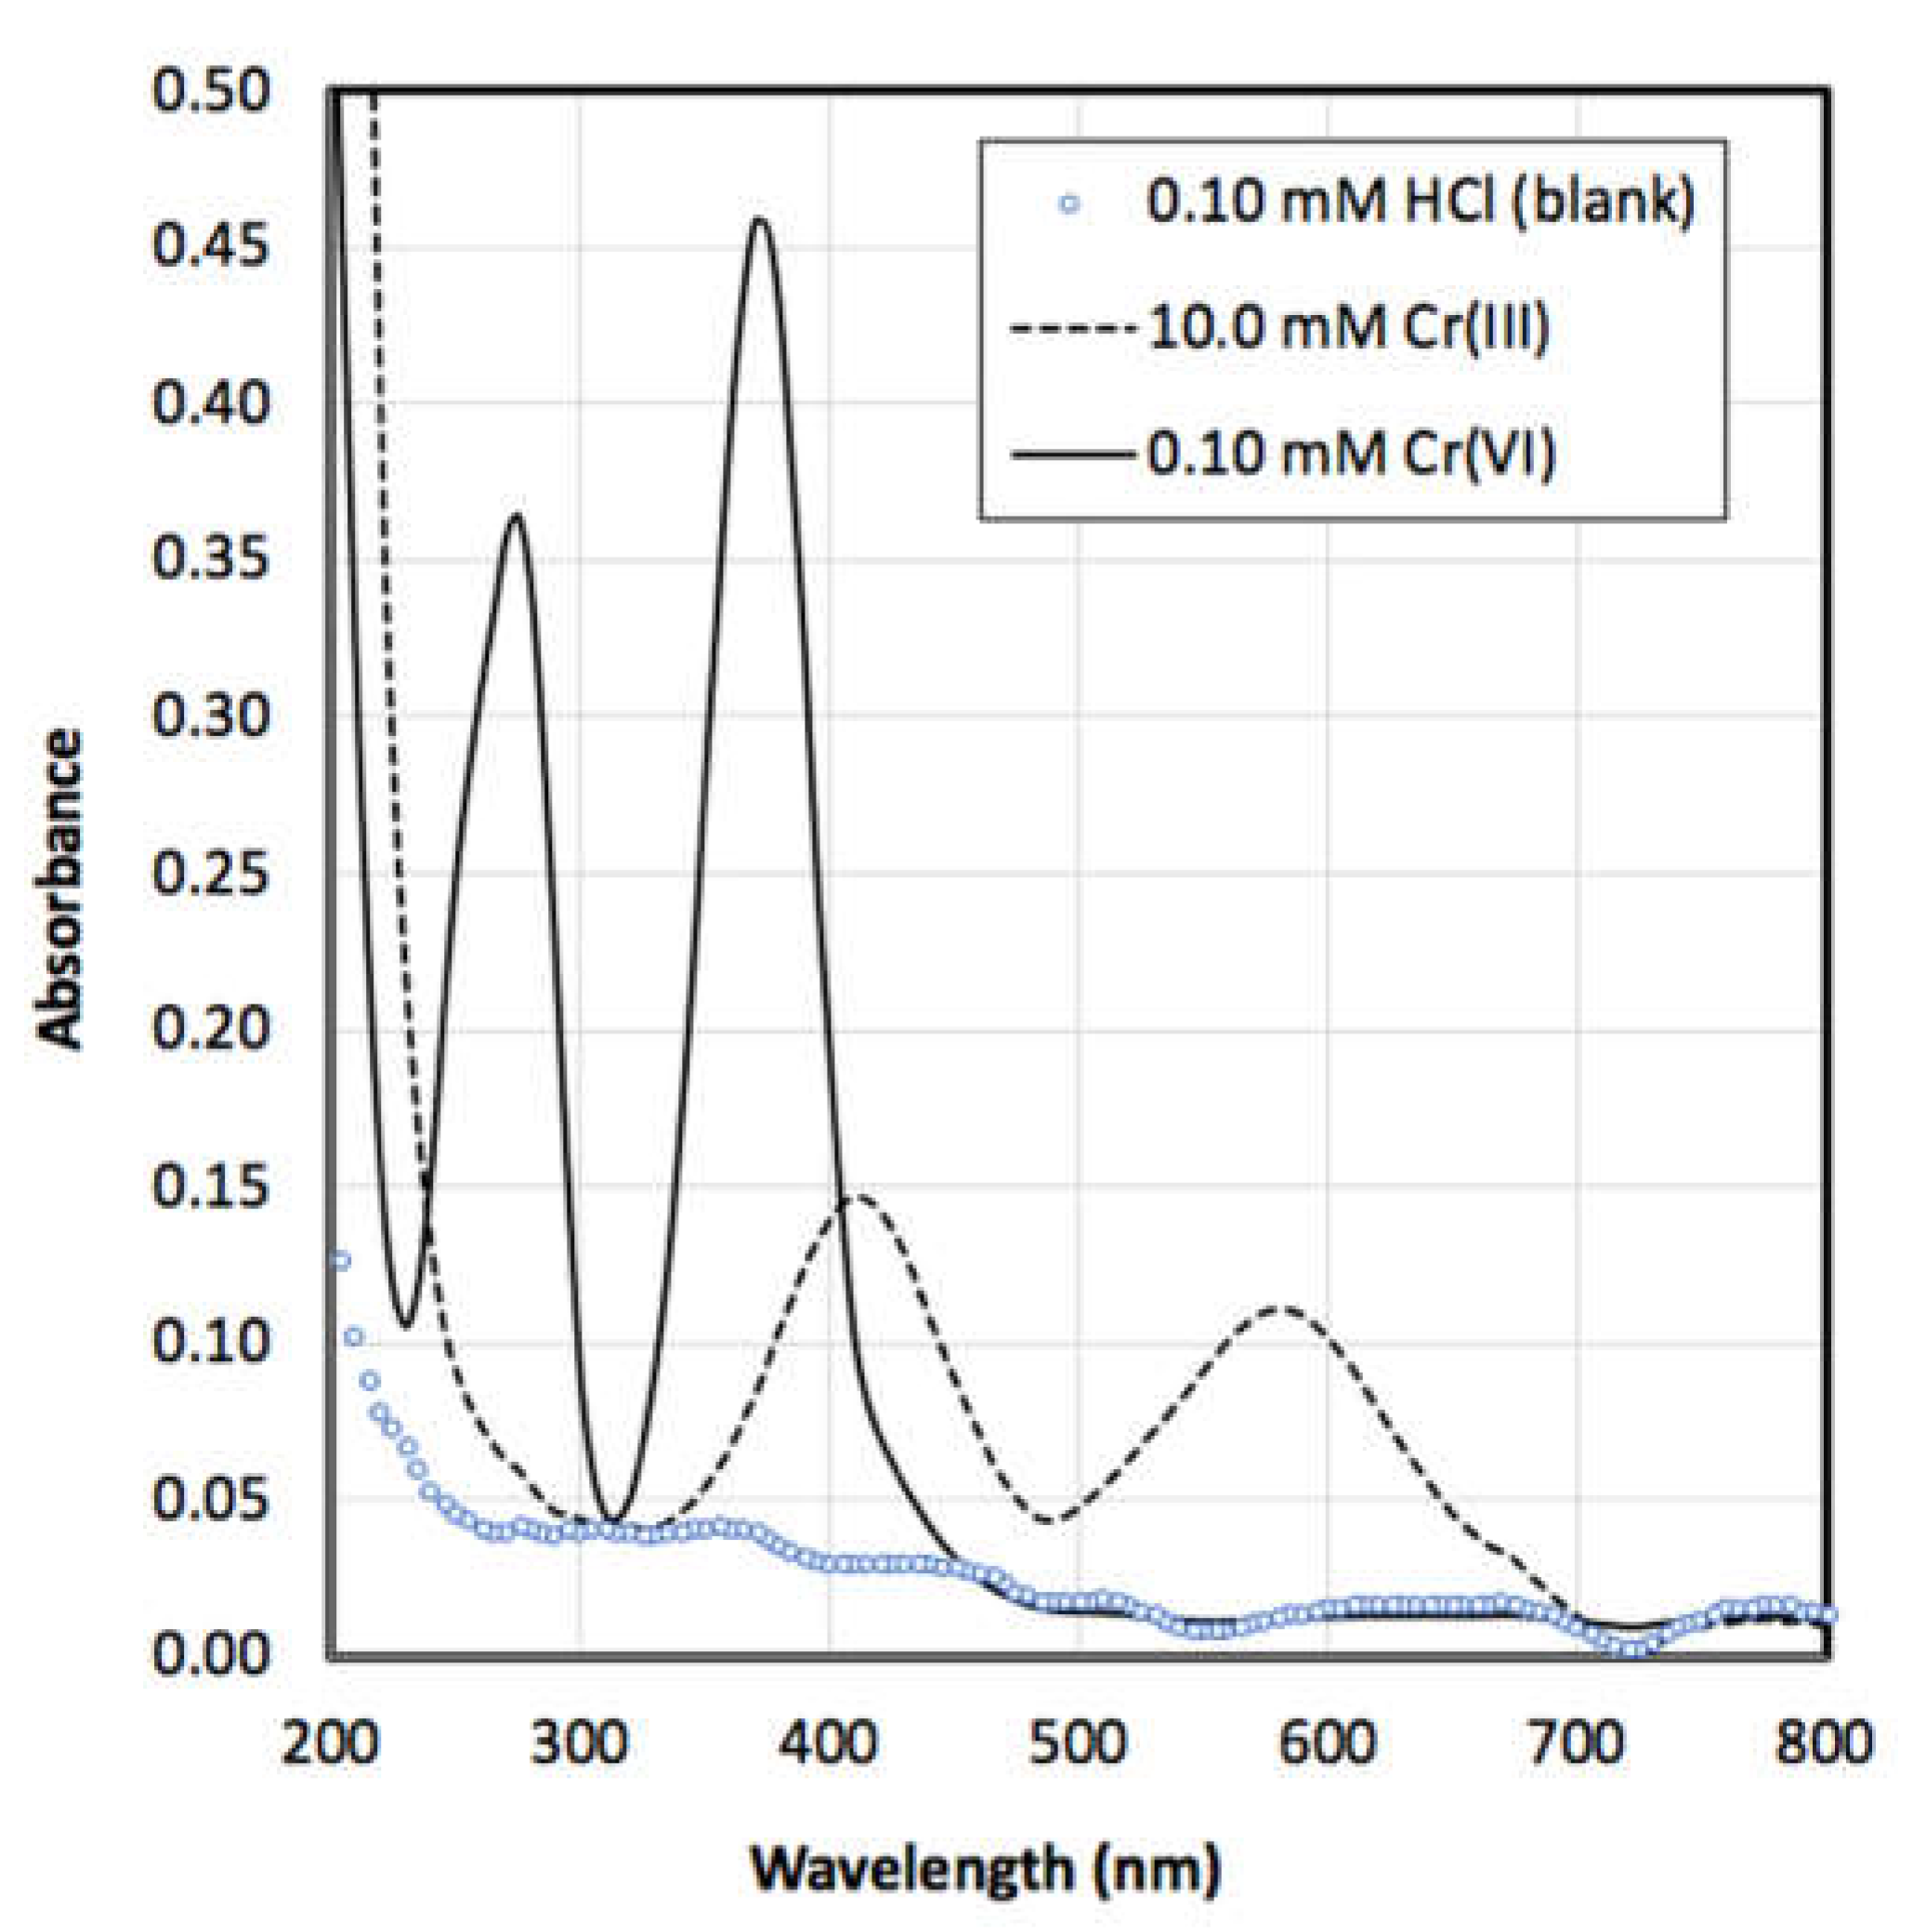
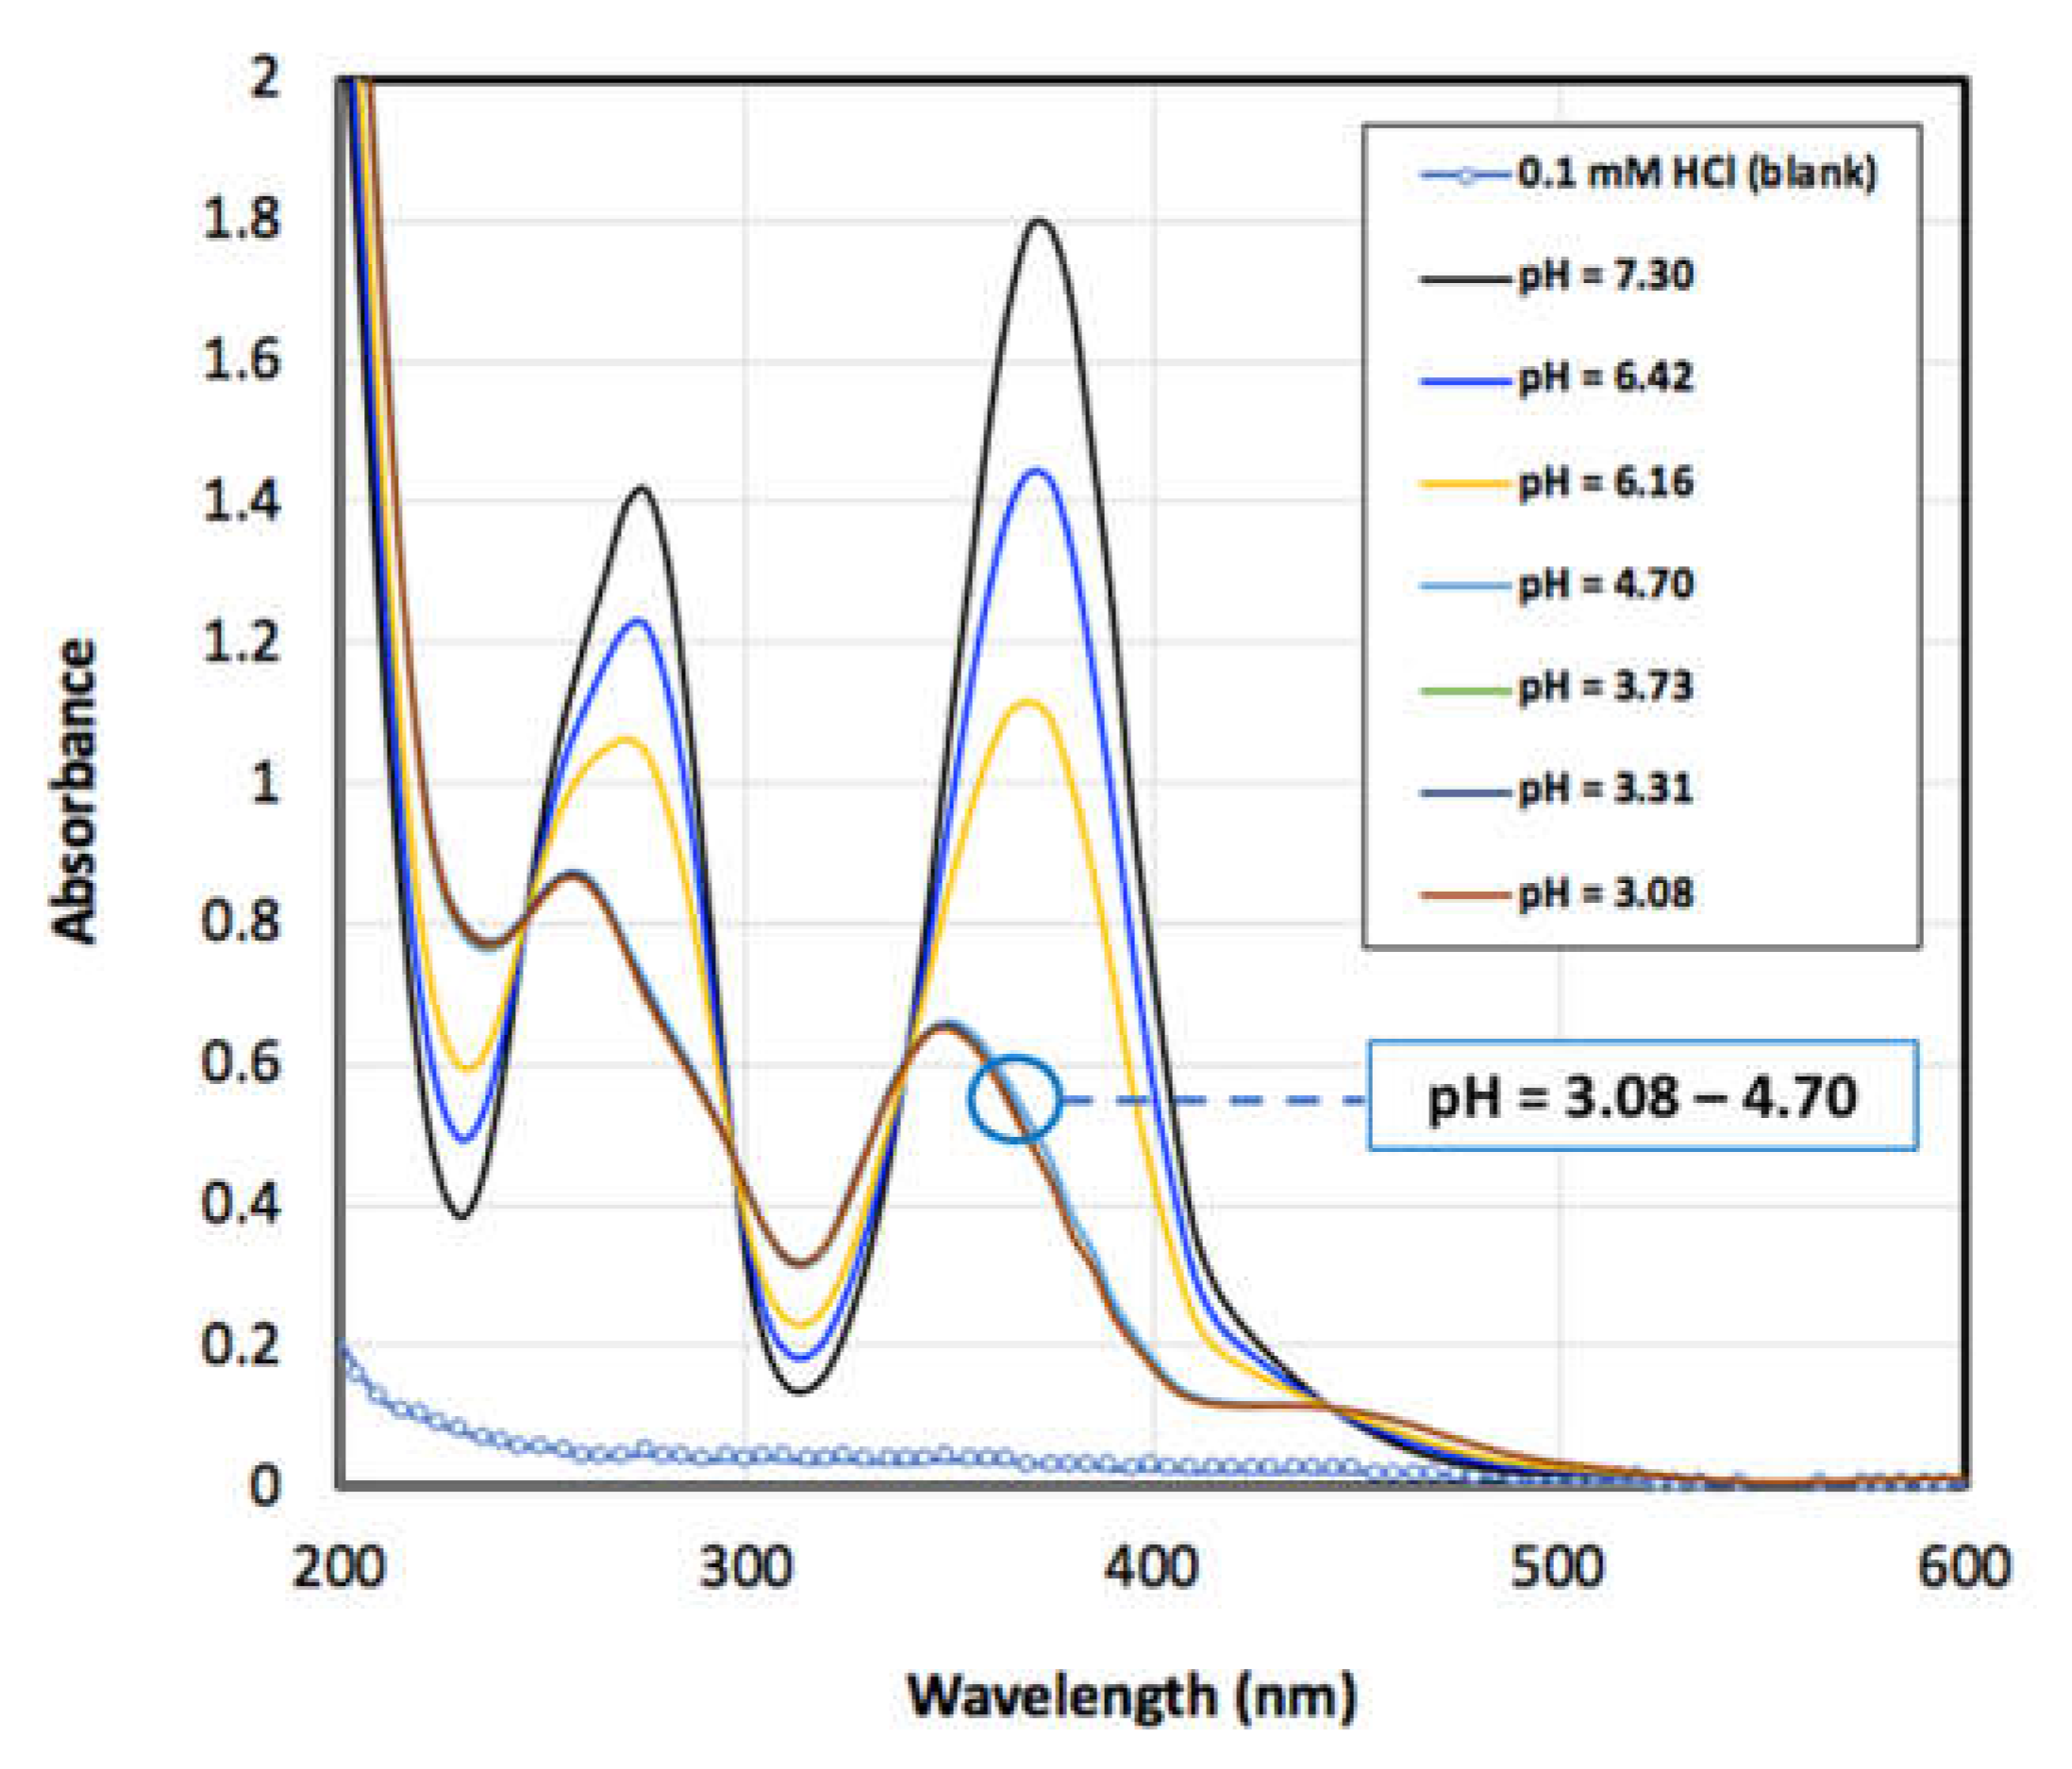
The analysis and speciation of Cr(III) and Cr(VI) were carried out by UV–Vis spectrophotometry and the representative spectra are shown in Figure 3. The Cr(III) species shows two broad UV–Vis absorbance peaks centered at 405 and 584 nm. The Cr(VI) (as Na2CrO4) absorbance spectrum features two narrower peaks at 275 and 375 nm that are distinct from Cr(III) due to their wavelength shift and narrow peak shape [27]. The behavior of Cr(III) in aqueous solution is strongly affected by pH, temperature, and complexing agents [28]. The pH of the solution is a critical parameter for both the qualitative and quantitative analysis of Cr(III) and Cr(VI). The Cr(III) solutions contained 0.1 mM HCl as a supporting electrolyte to maintain the Cr(III) species as a mixture of soluble hexaaqua/pentaaqua ions ([Cr(H2O)6]3+ + [Cr(H2O)5OH]2+) with a pKa = 4. The pronounced difference in the sensitivity between Cr(III) and Cr(VI) is evident with Cr(VI) having a 300x greater molar absorptivity than Cr(III). The effect of pH on the Cr(VI) UV–Vis peak is shown in Figure 4. Lowering the pH of the Cr(VI) solution from 7.30 to 3.08 causes a pronounced decrease in the absorbance intensity as well as wavelength shifts from 275 to 260 nm and 375 to 355 nm in the Cr(VI) spectrum.
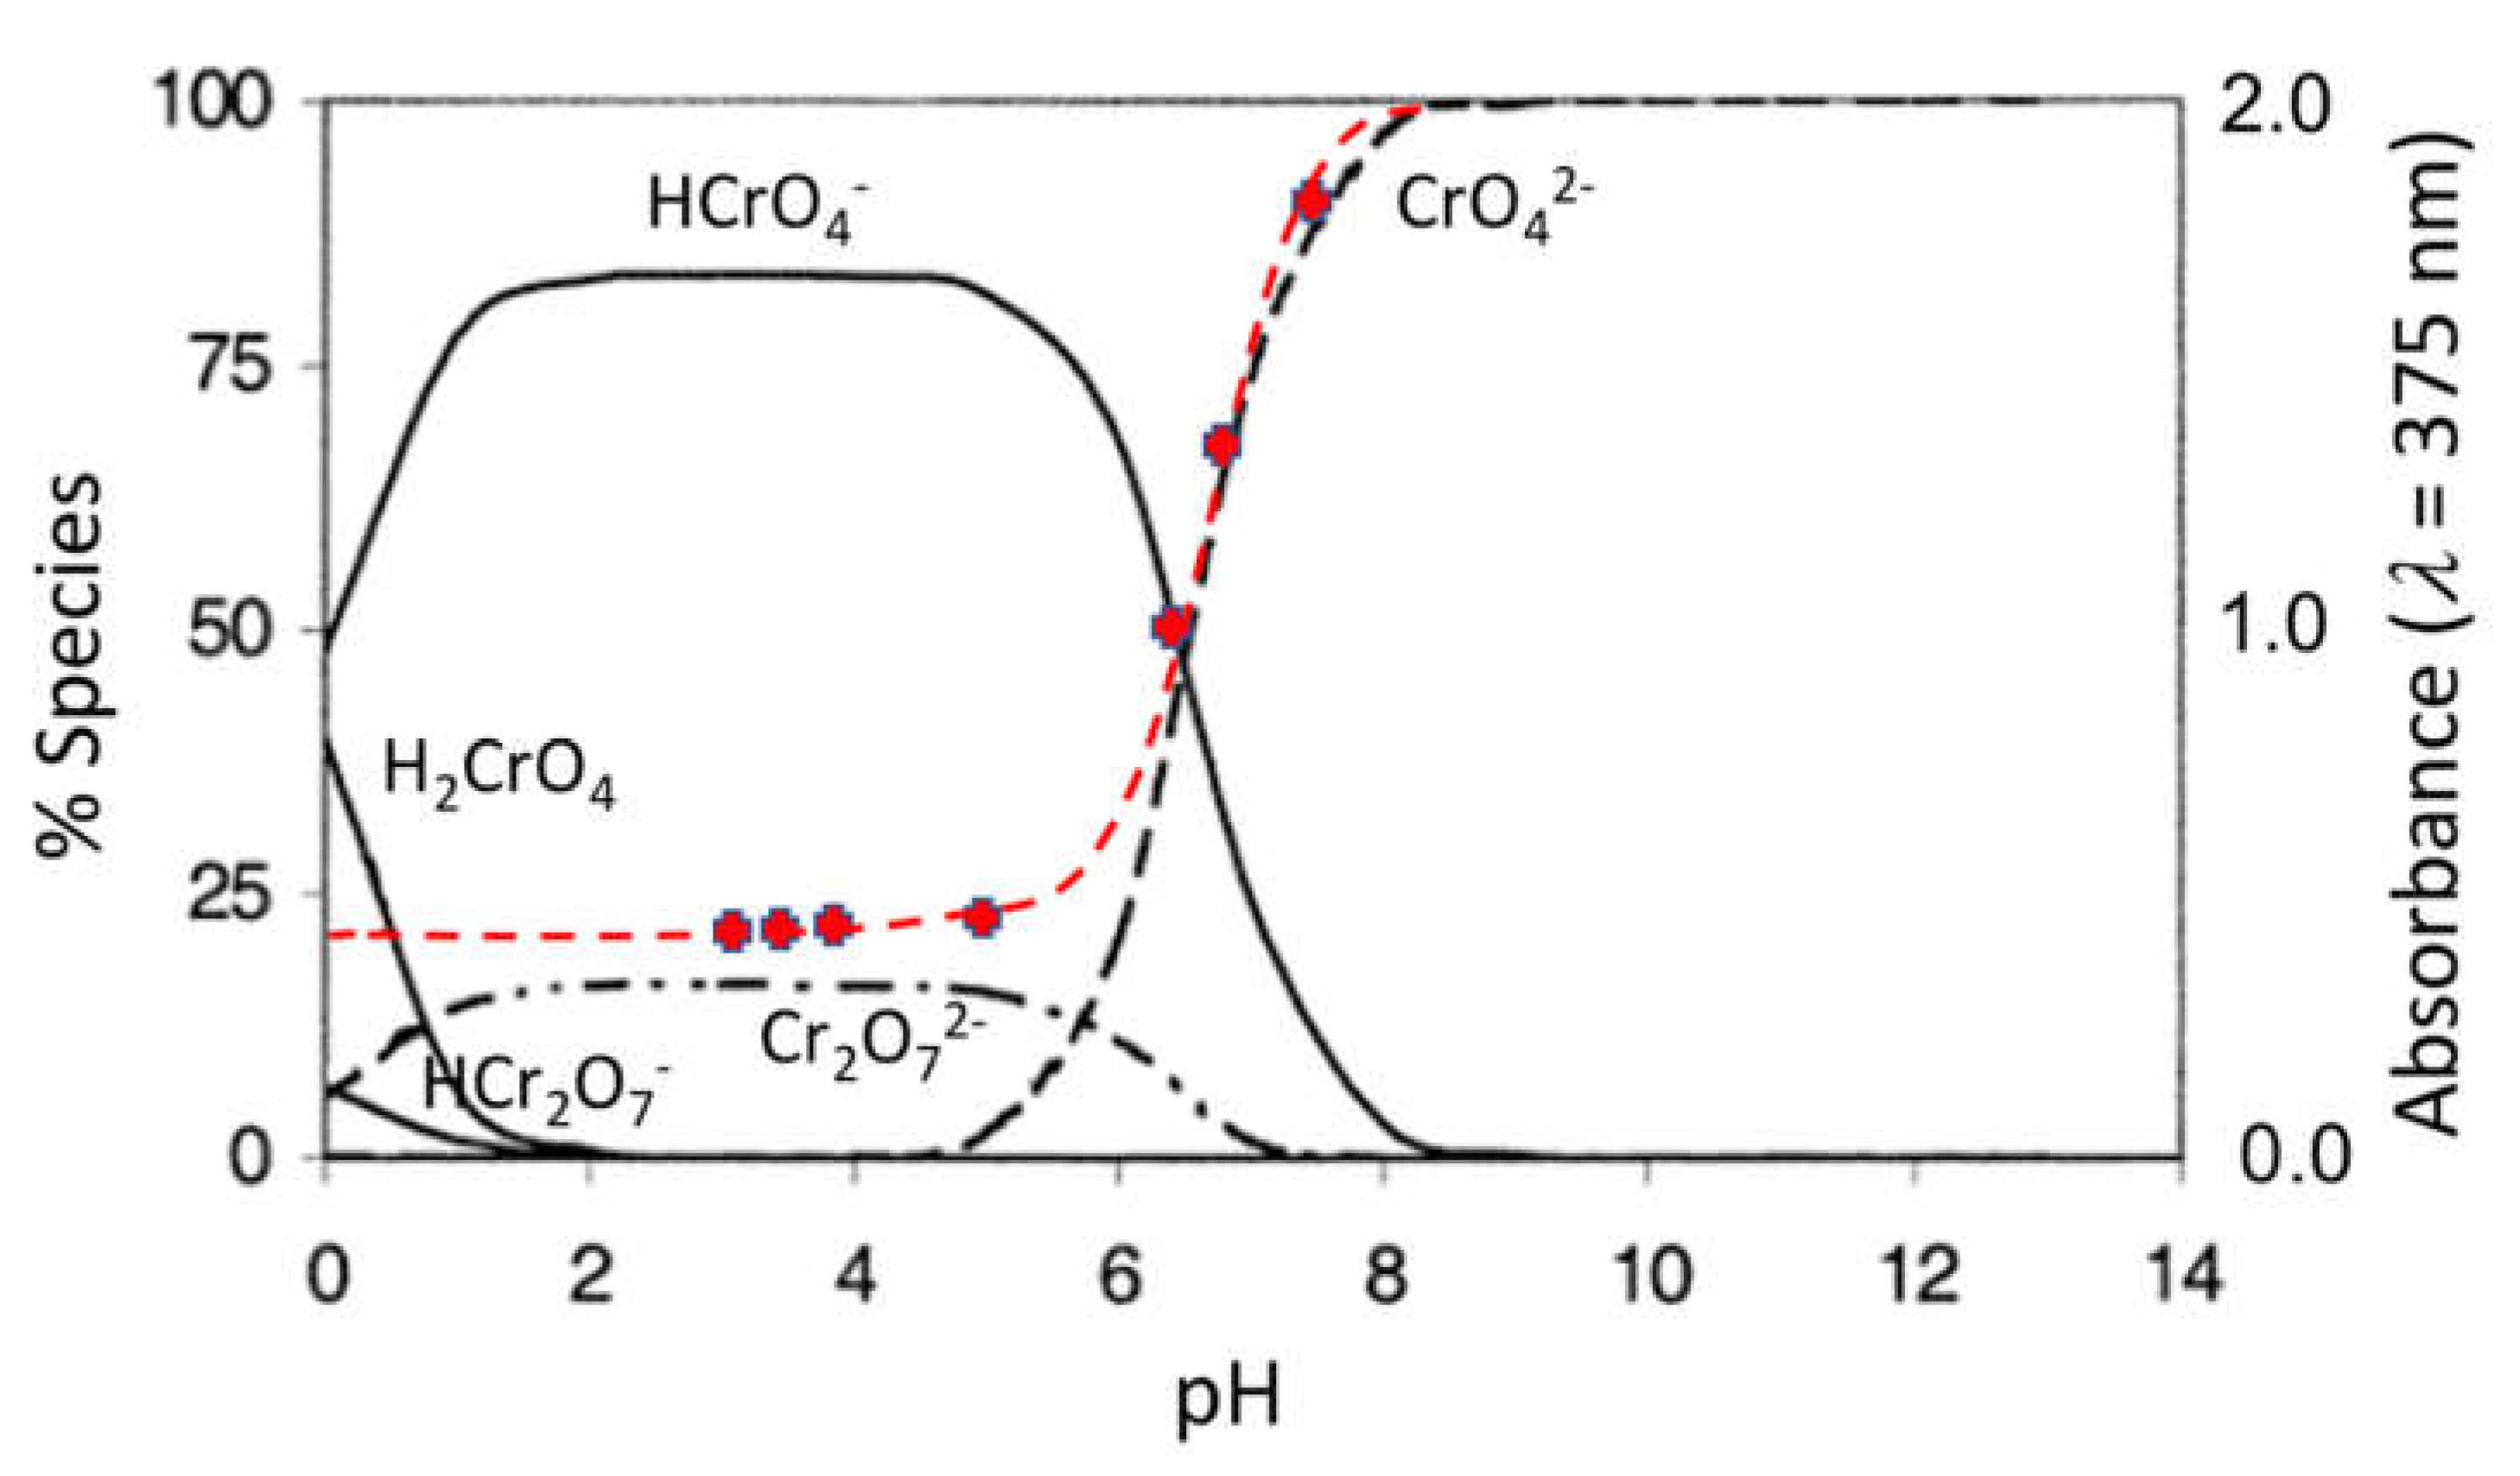
A plot of the absorbance change vs. pH overlaid on the pH-predominance diagram for Cr(VI) (Figure 5) indicates a close relationship with the HCrO4-/CrO4 2− aqueous speciation and the importance of maintaining the CrO42− form in solution. For maximum sensitivity and reliability of the Cr(VI) UV–Vis spectrophotometric measurement, a solution of pH >7.5 must be maintained [27]. Thus all extracts were measured once by UV–Vis spectrophotometry, followed by an adjustment of the pH to >7.5 with 1.0 M NaOH and a second UV–Vis spectrophotometry measurement to confirm the Cr(VI) concentration.
3.3. Reaction of Cr(III) with Synthetic MnO2
Experiments on the oxidation of Cr(III) to Cr(VI) by MnO2 were accompanied by a decrease in pH due to the following heterogeneous redox reaction [4]:
Cr3+ + 1.5 MnO2(s) + H2O → HCrO4- + 1.5 Mn2+ + H+
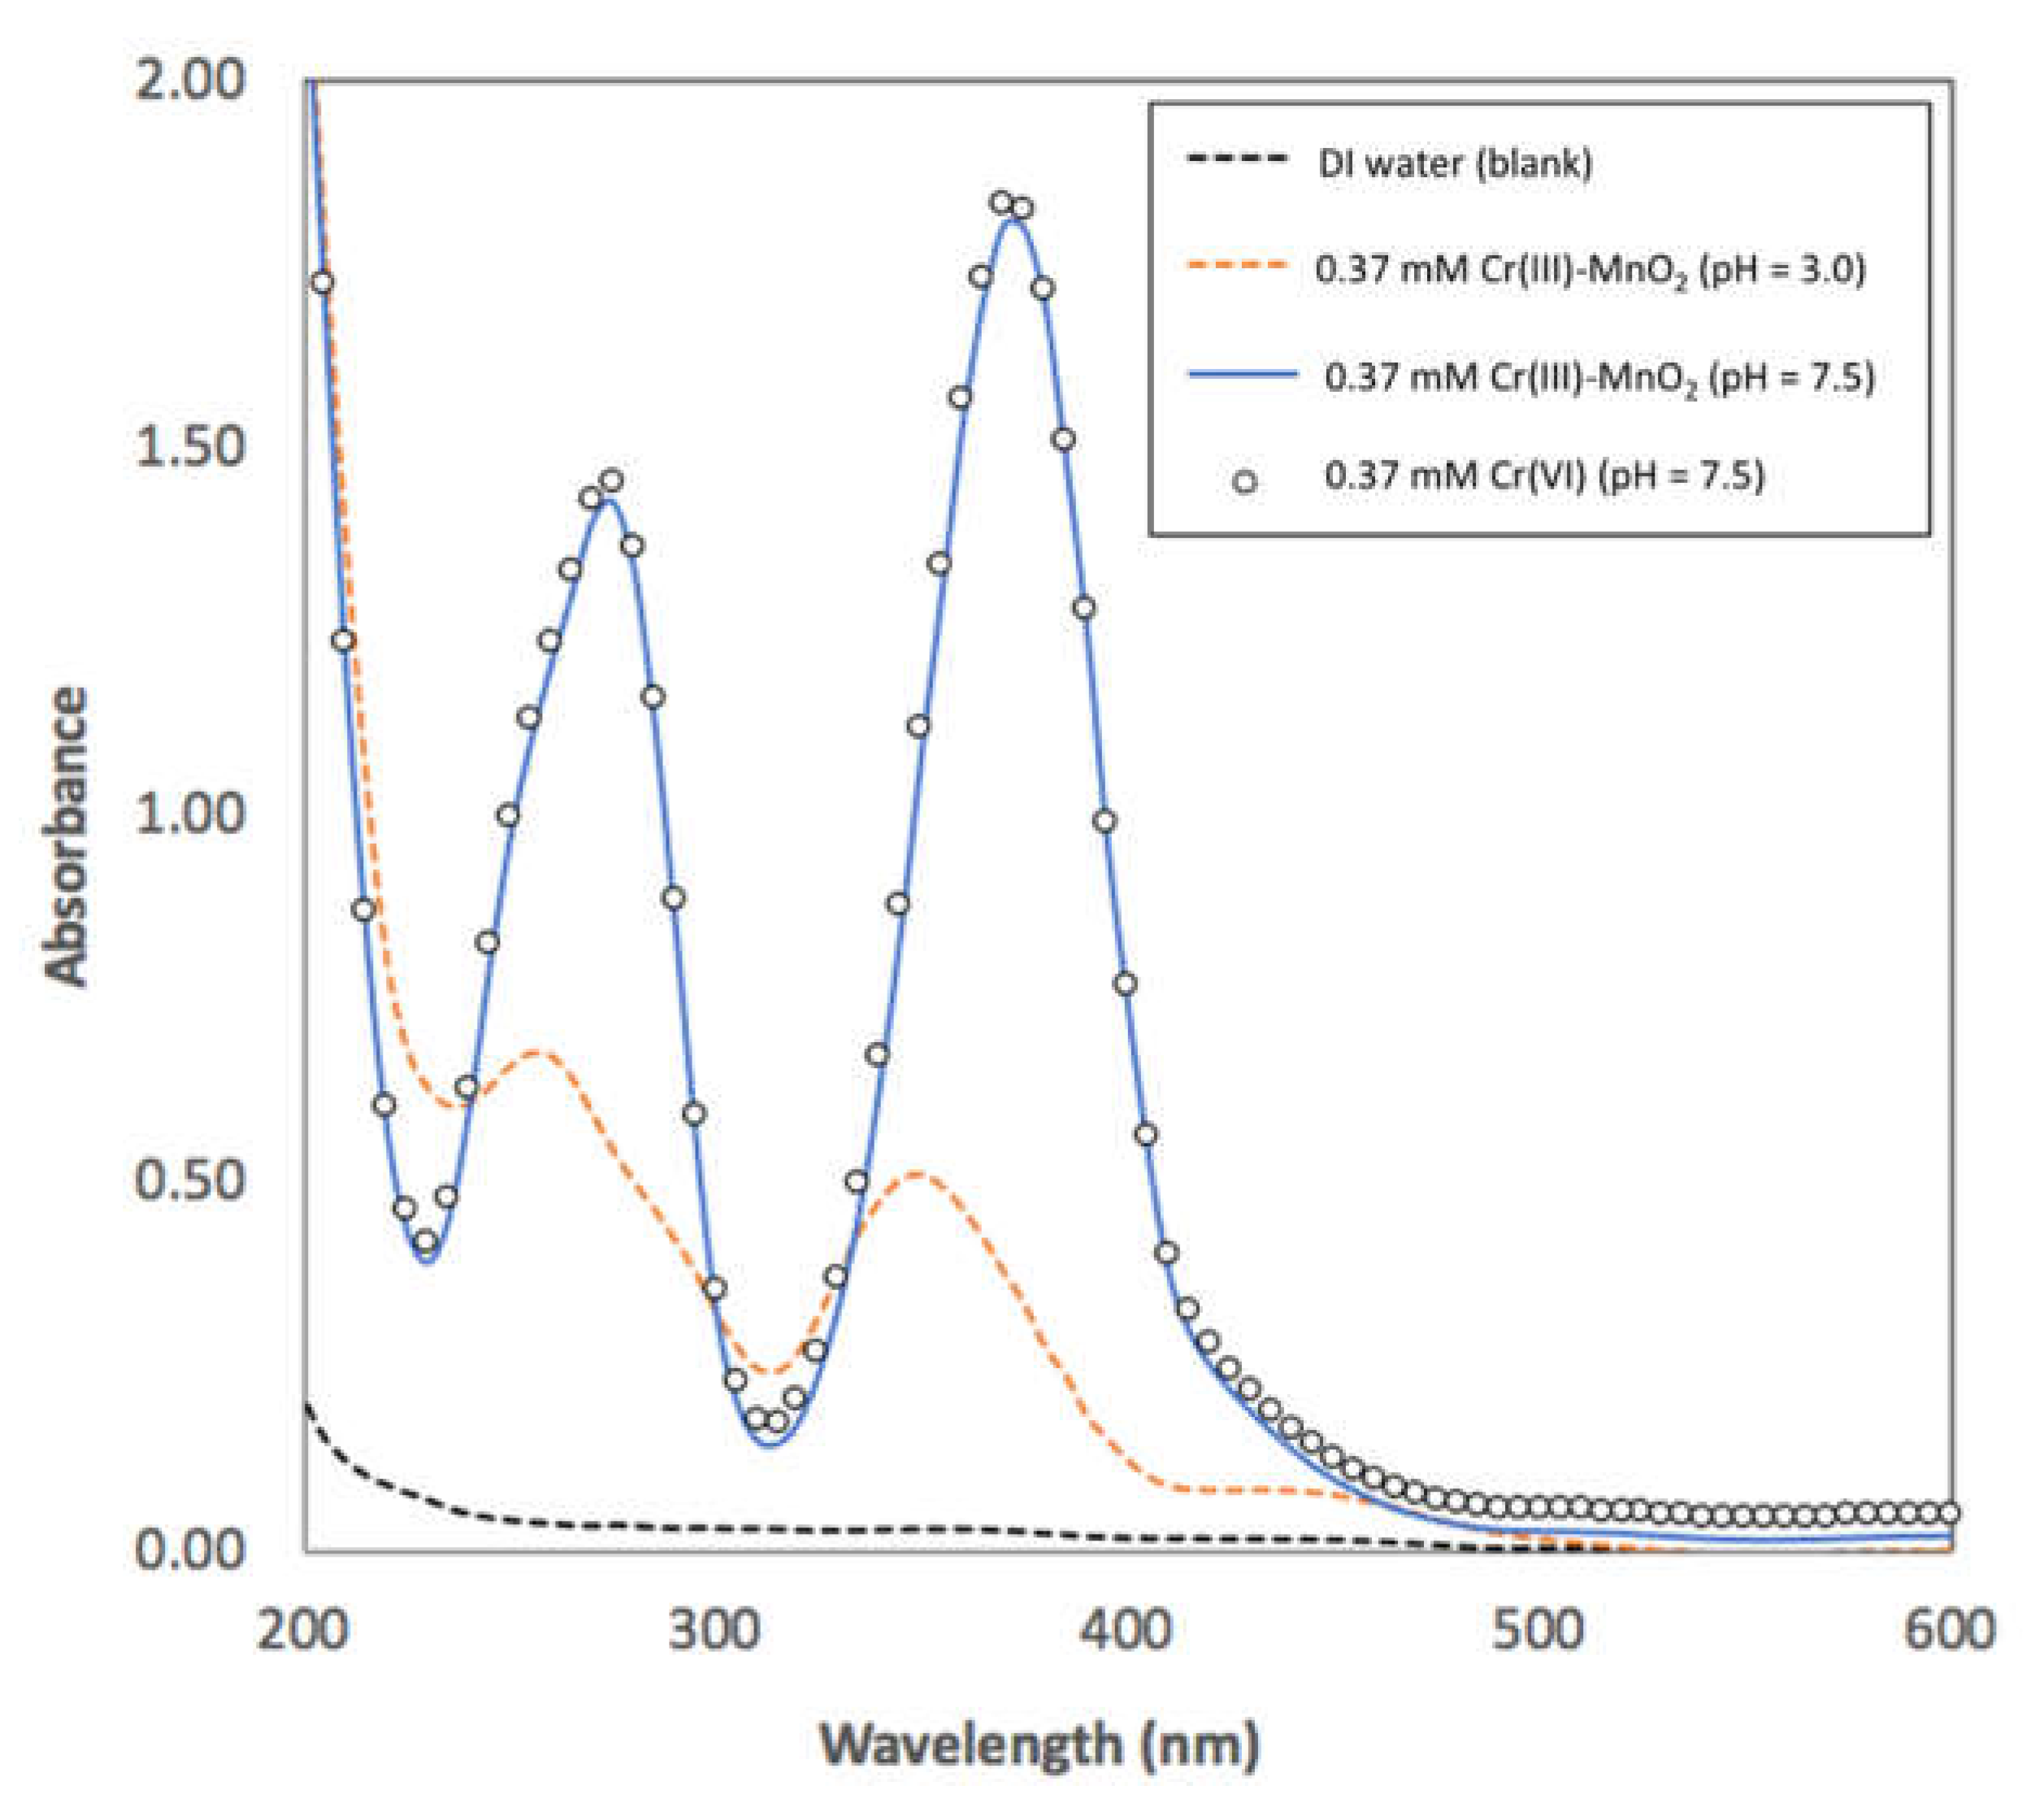
Evidence of the reaction in Equation (1) can be found from the release of dissolved Mn2+ from the reductive dissolution of MnO2 and a corresponding pH decrease. An example spectrum showing the UV–Vis absorbance spectrum of 0.37 mM Cr(III) reacted with MnO2 is shown in Figure 6, with a final reaction pH = 3.0, displaying the characteristic wavelength shift and intensity decrease of the Cr(VI) spectrum as shown in Figure 5. Following centrifugation and filtering, the 0.37 mM Cr(III) + MnO2 reaction solution was treated with milliliter quantities of 1.0 M NaOH to increase the pH to 7.5 and the resulting Cr(VI) spectrum showed a close agreement with a 0.37 mM Cr(VI) standard (Figure 6). This method was also employed for all Cr(III)– and Cr(VI)–MnO2 reactions in the 0.10–1.0 mM Cr(III) treatment range. It was confirmed that quantitative oxidation of Cr(III) and recovery of Cr(VI) was achieved in all Cr(III) treatments.
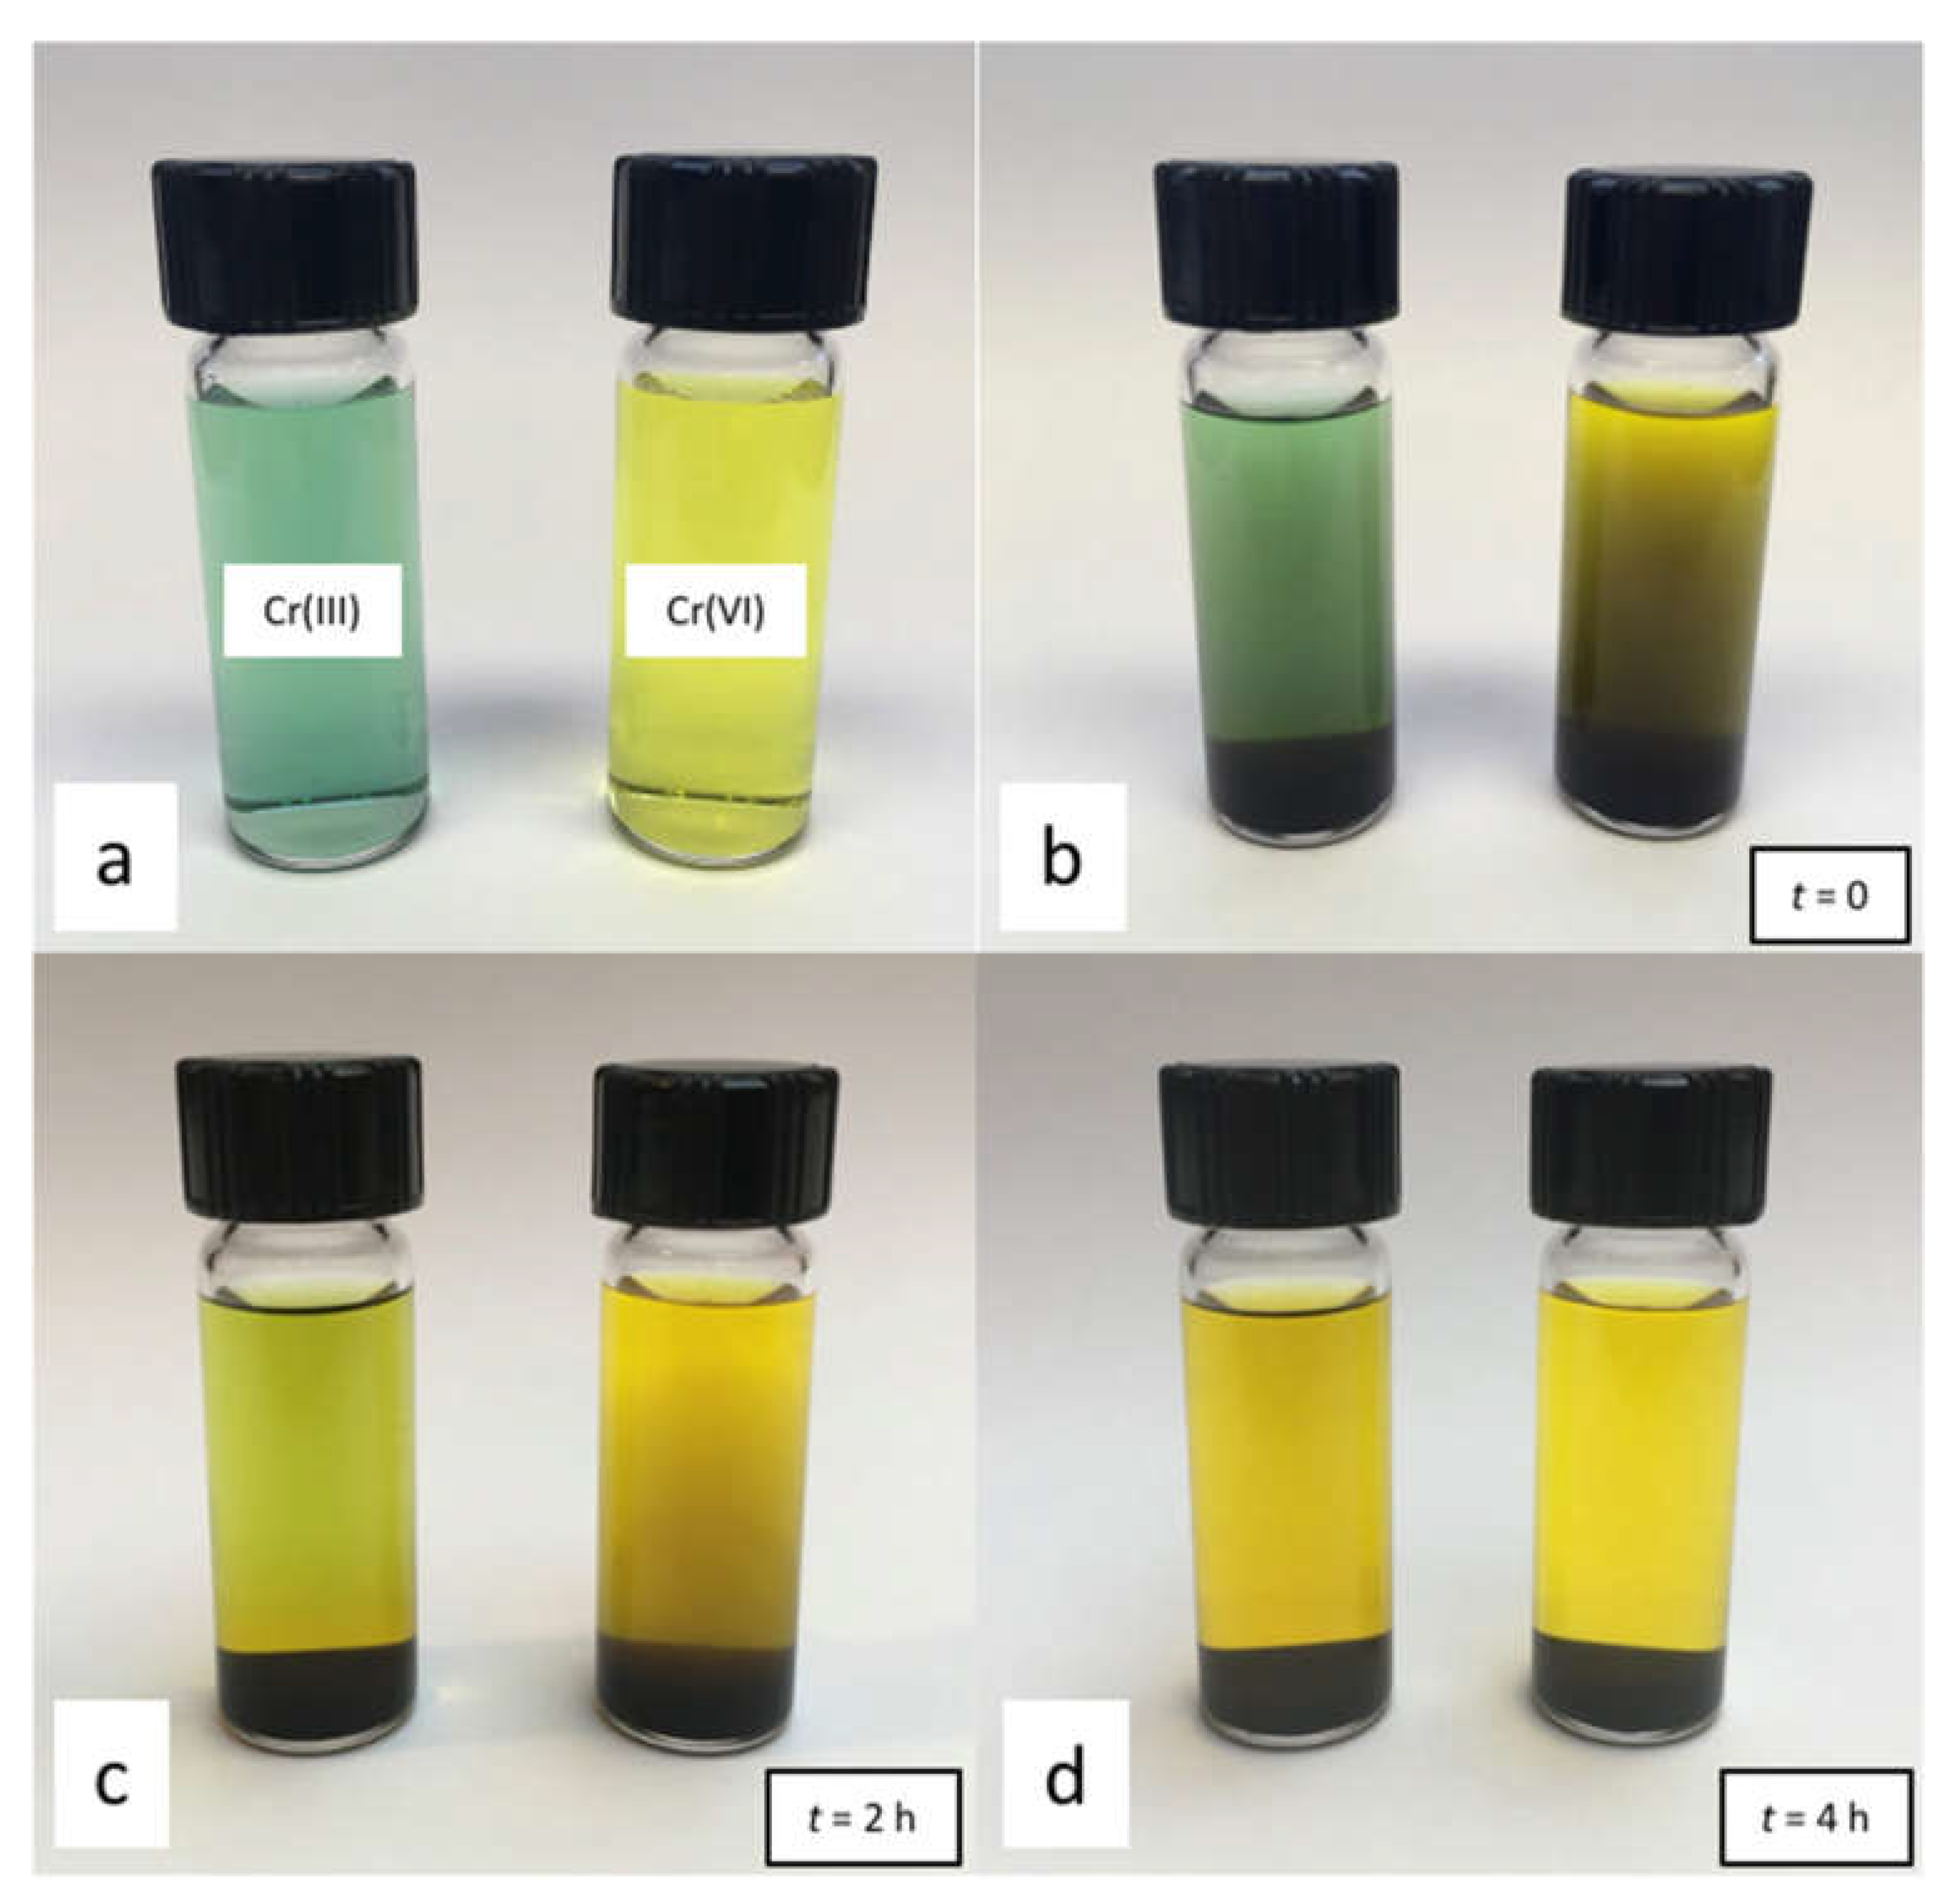
To visualize the Cr(III) oxidation reaction and provide an approximate time course measurement, a set of samples containing 0.50 g MnO2 and 20 mM Cr(III) or Cr(VI) were reacted in 5 mL glass vials for 4 h. Figure 7 shows the changes in the suspension during the Cr(III) oxidation reaction and the similarities in the final mixtures. In Figure 7a, the unreacted Cr(III) and Cr(VI) solutions are shown, followed by the addition of MnO2 at t = 0 (Figure 7b). After 2 h (Figure 7c), the solution is a mixture of approximately 30% Cr(III) and 70% Cr(VI). After 4 h (Figure 7d), the Cr(III) oxidation is complete and 100% Cr(VI) is recovered in solution.
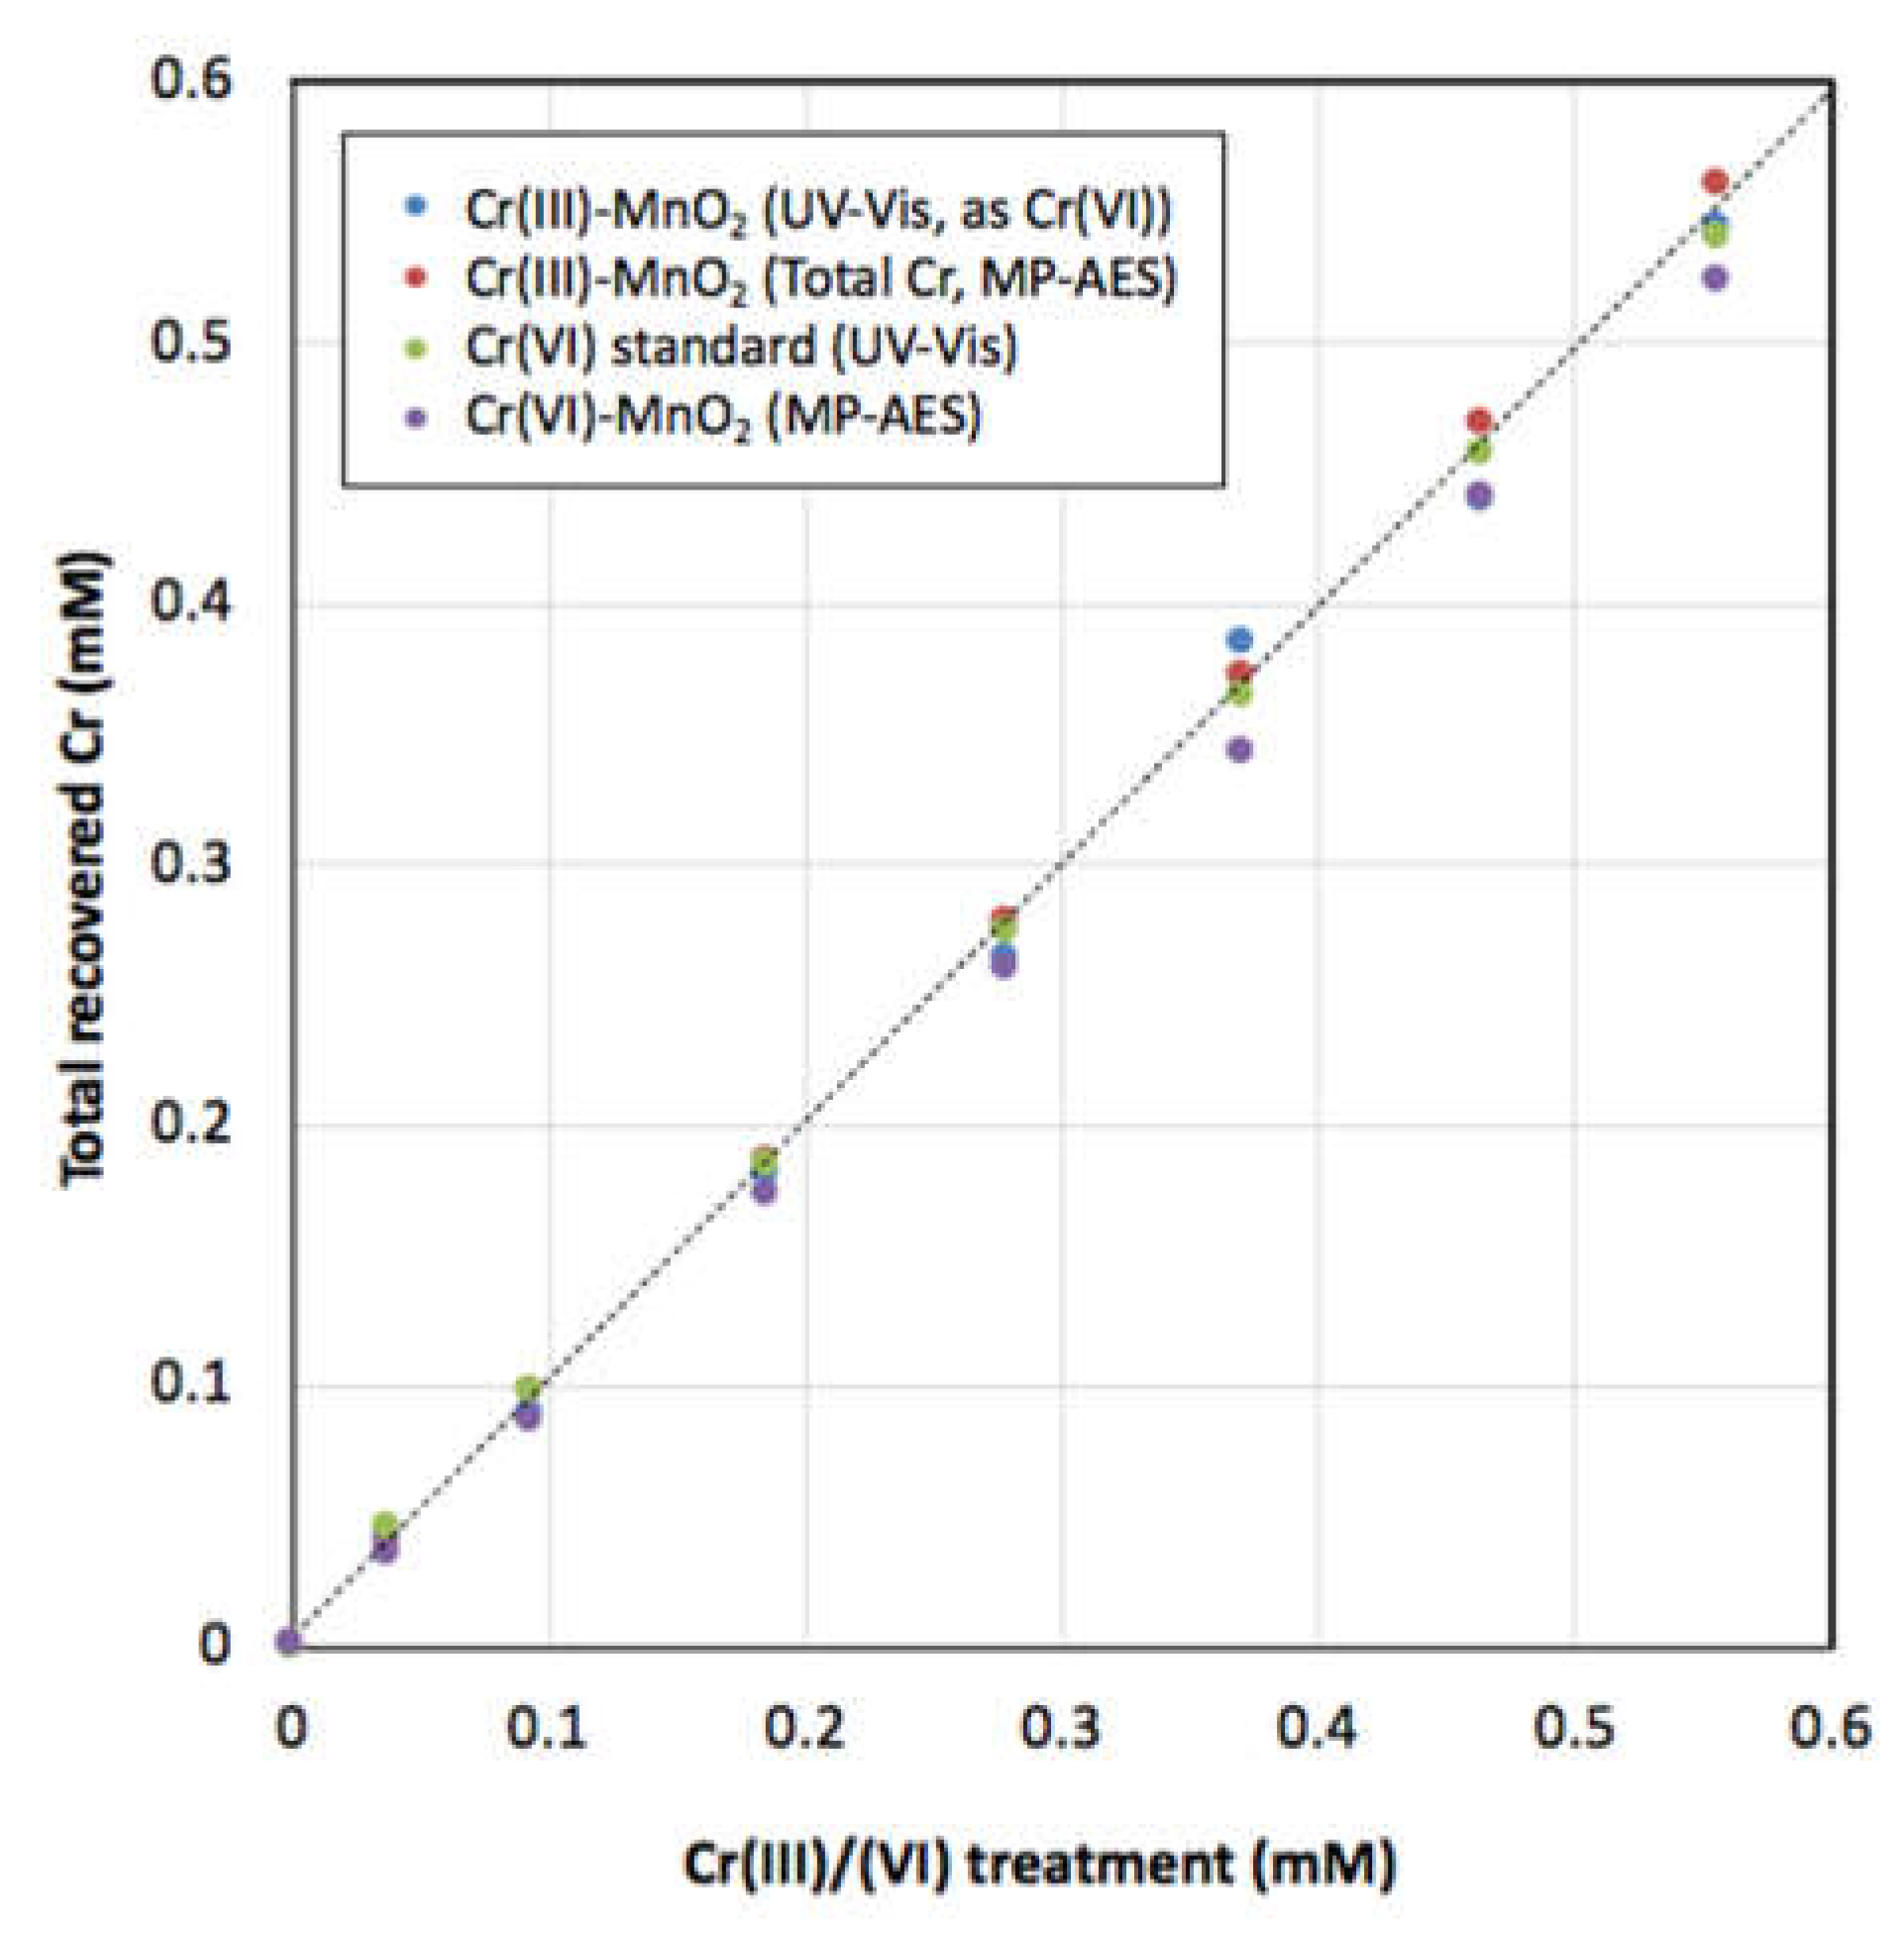
The total dissolved Cr was determined by MP–AES to confirm the quantitative recovery of Cr in all the experimental solutions. A comparison of the results of the total dissolved Cr by MP–AES and Cr(VI) by UV–Vis spectrophotometry is shown in Figure 8. It is shown that Cr(VI) adsorption on MnO2 after the Cr(III) oxidation reaction was negligible or undetectable. In control experiments where Cr(VI) was added directly to MnO2 suspensions over the same treatment range as Cr(III), a detectable amount of Cr(VI) adsorption occurred yielding Cr(VI) surface loading of 0.70–0.78 μmol g−1. These results agree with previous work on Cr(VI) adsorption showing a weakly adsorbed, outer-sphere Cr(VI) adsorption mechanism on birnessite using extended X-ray absorption fine structure (EXAFS) spectroscopy [16].
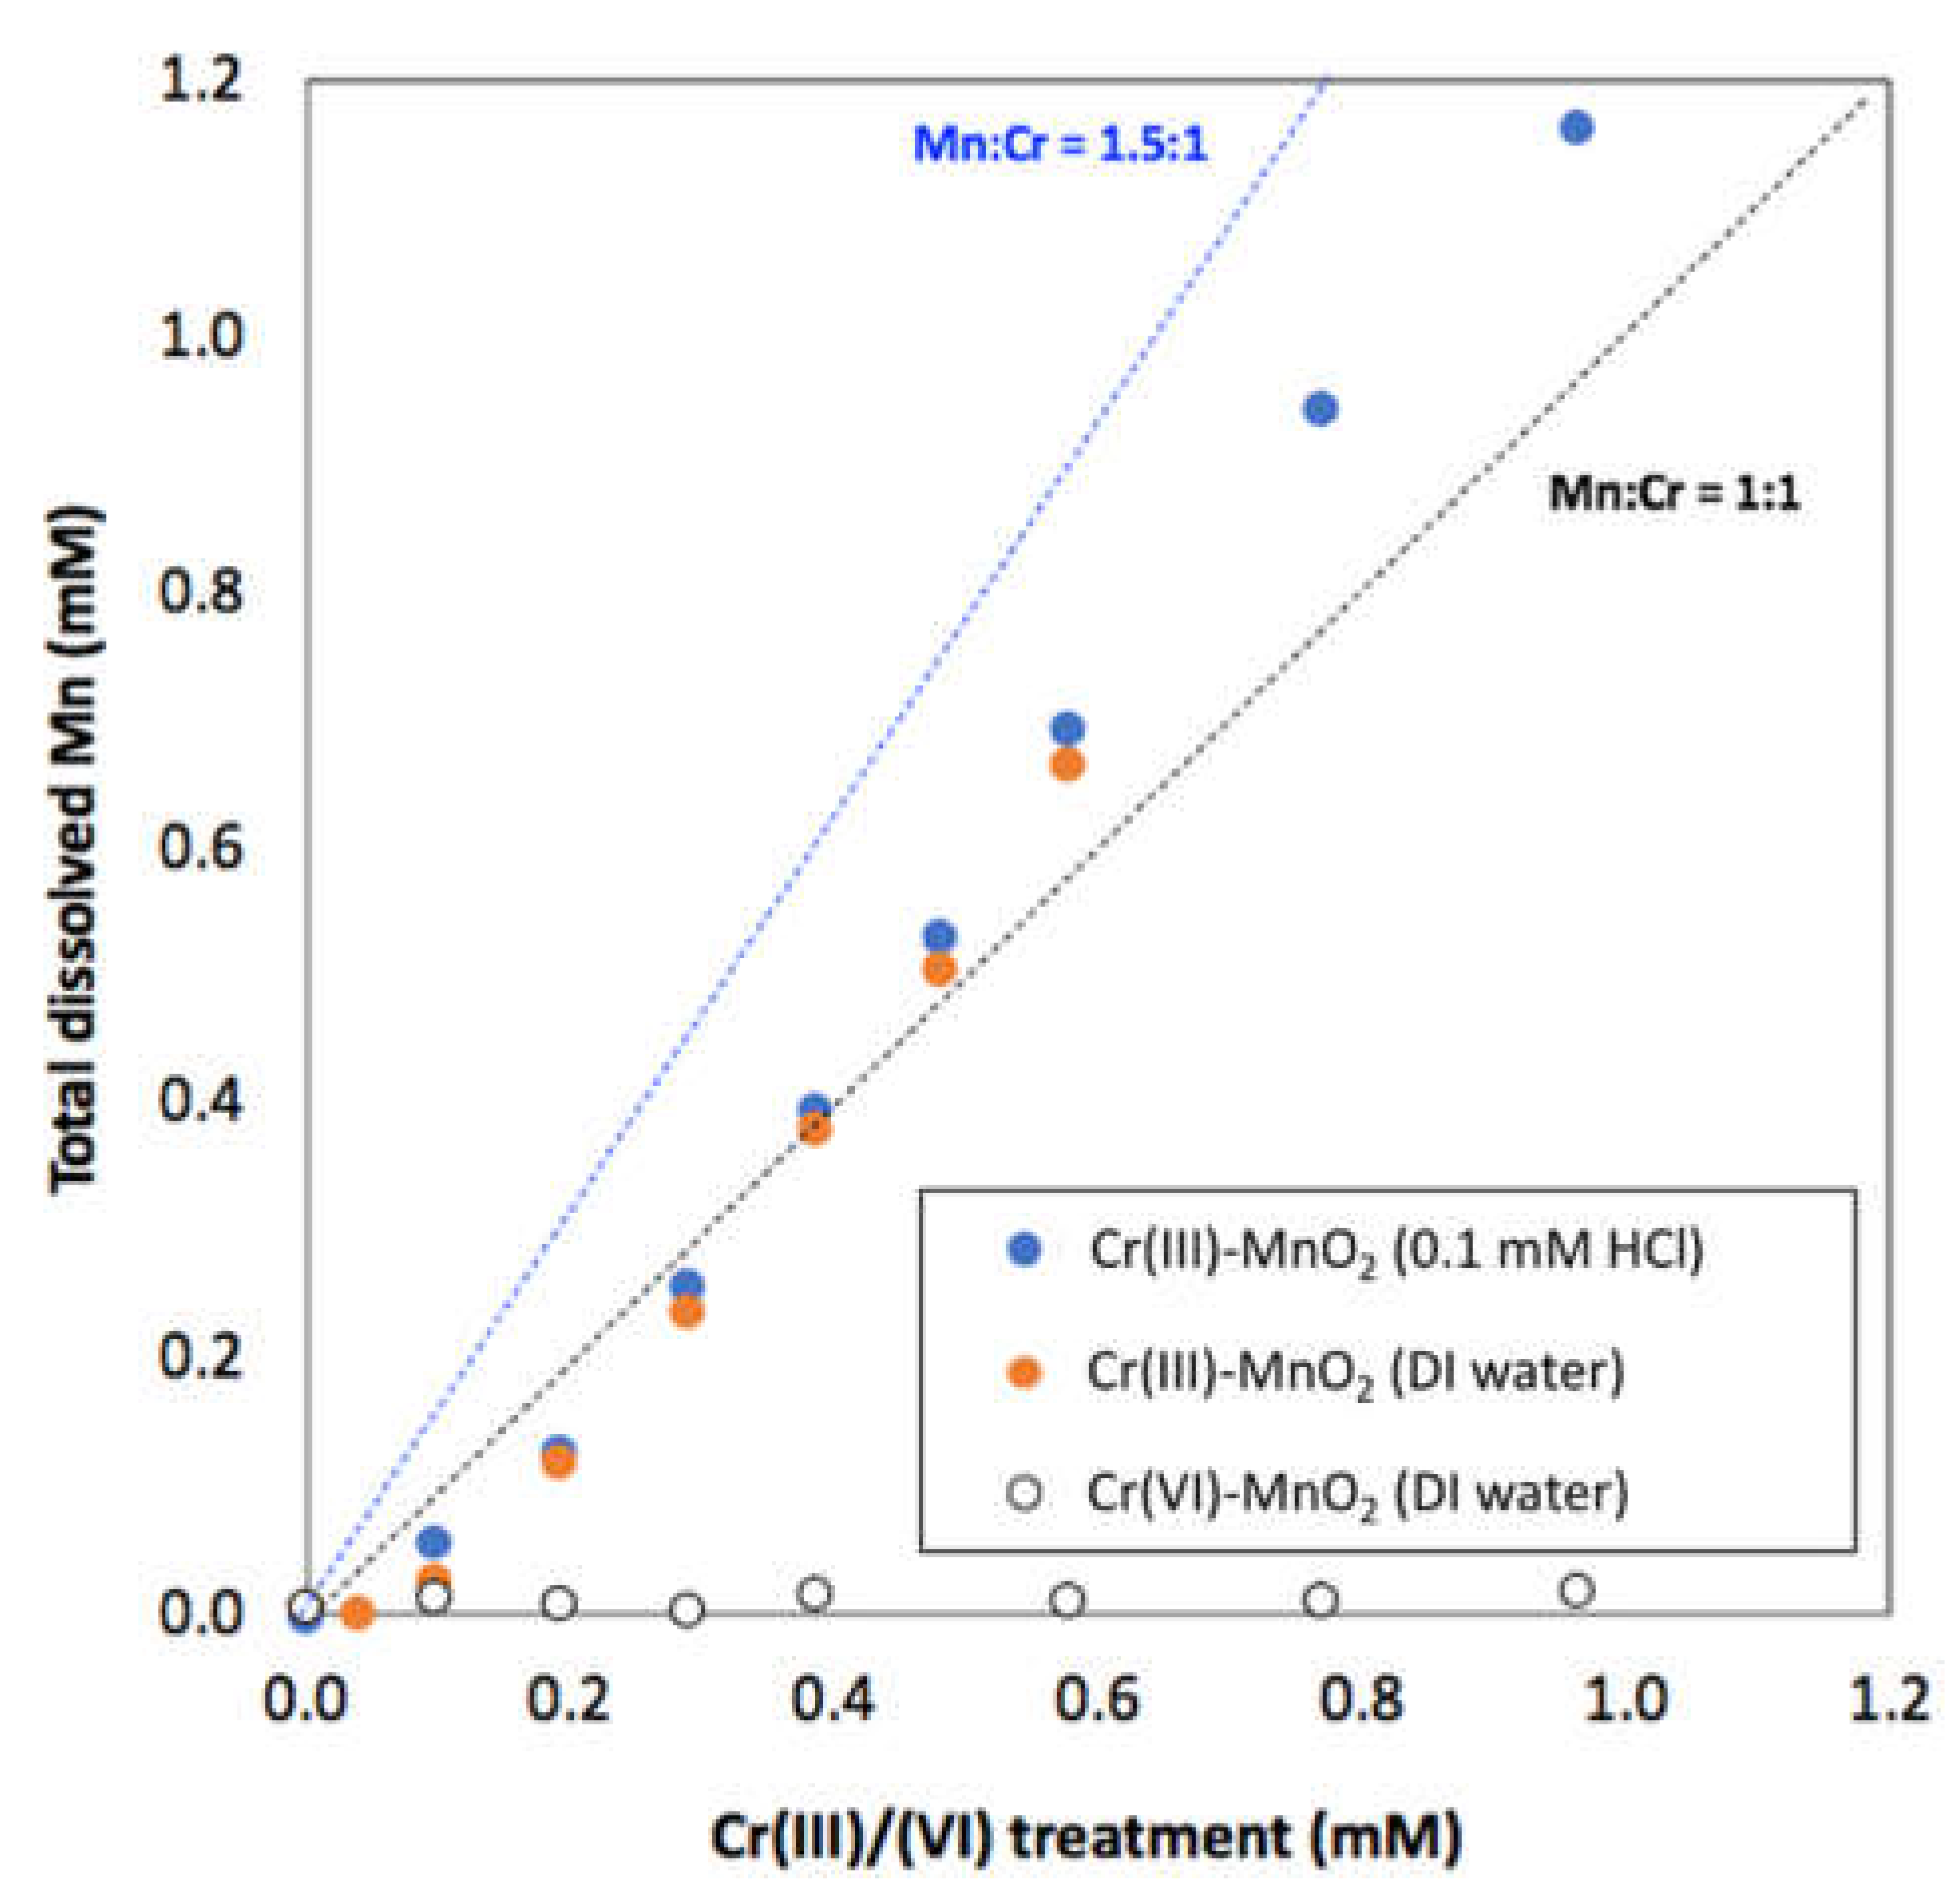
The dissolved Mn(II) was analyzed to determine the agreement with the reaction stoichiometry in Equation (1). Figure 9 provides the results of the recovery of total dissolved Mn (as Mn(II)) by MP–AES over the Cr(III) treatment range. The dashed lines provide the expected recovery of Mn(II) related to 1:1 and 1.5:1 Mn:Cr mol ratios. The upper dashed line is the stoichiometric agreement with Equation (1) and the results suggest partial Mn2+ ion adsorption on the reacted MnO2 surface. Assuming the stoichiometry given in Equation (1), the estimated Mn2+ adsorption on the MnO2 surface is between 80 and 85 μmol g−1. The reactions in both 0.1 mM HCl and DI water were analyzed to determine the effects of background electrolyte matrices, and a small, detectable increase in recovered Mn(II) can be seen in the 0.1 mM HCl solutions. A Cr(VI)–MnO2 control experiment revealed that negligible dissolved Mn arose from the Cr(VI) addition. This provides direct evidence that the source of Mn(II) is the reductive dissolution of MnO2 surfaces coupled with Cr(III) oxidation to Cr(VI).
3.4. XPS and FTIR Analysis of Cr(III)-Treated MnO2
XPS is a surface-sensitive technique for the determination of the elemental composition and electronic states of solid materials. The C 1s, O 1s, Cr 2p, and Mn 2p lines were run in high-resolution mode, and it was determined that Cr was not detectable in either the Cr(VI)- or Cr(III)-treated MnO2 samples. In addition, the Cr(VI)-treated MnO2 sample did not yield results that were significantly different from pristine MnO2, and the results are not shown here.
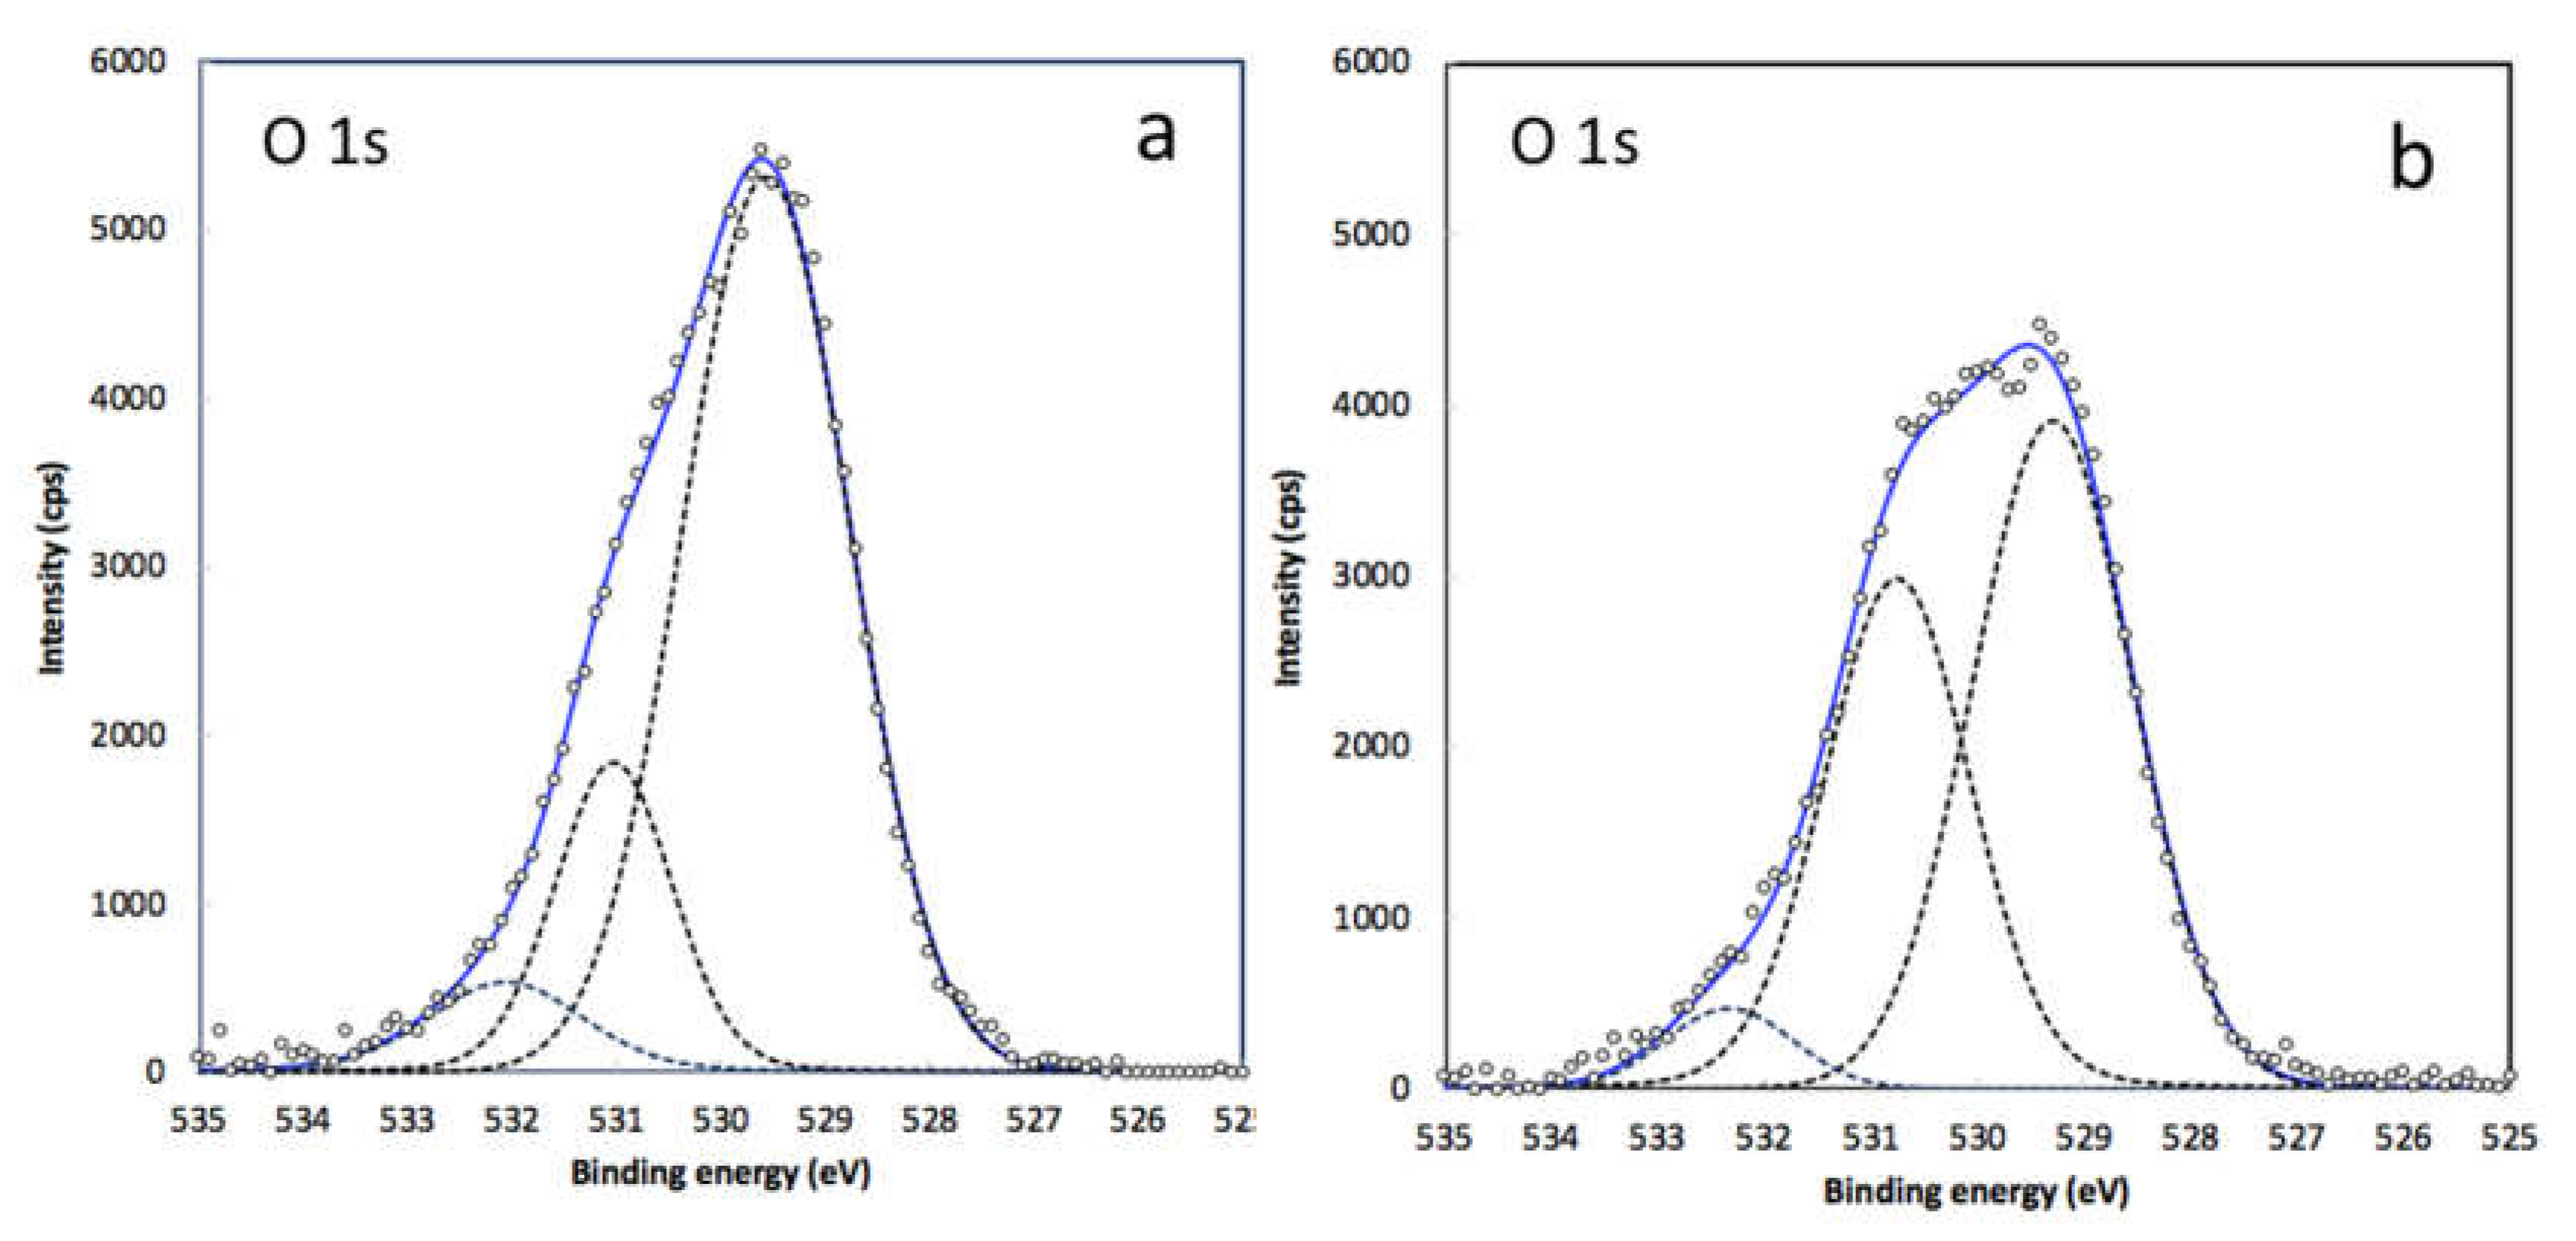
The theoretical 285.0 eV C 1s line was used for absolute eV correction and a −3.0 eV shift was applied to all the experimental lines in each scan. The C 1s-corrected O 1s core-level spectra of unreacted (pristine) MnO2 and Cr(III)–MnO2 are shown in Figure 10. A Gaussian–Lorentzian curve-fitting procedure was applied using a previously described O species in birnessite [29] that includes structural oxide (Mn−O−Mn) at 530.1 ± 0.2 eV, surface hydroxyl (Mn−OH) at 531.6 ± 0.2 eV, and adsorbed water (H2O) at 532.3 ± 0.1 eV similar to previous investigations of synthetic MnO2 [18,29,30]. The results of XPS O 1s and Mn 2p3/2 are provided in Table 1. All peak widths at full width half maximum (FWHM) were constrained to 1.5–2.0 eV during the fit procedure.
The O 1s XPS spectra confirm that an alteration in the surface O speciation occurred due to the reductive dissolution of the MnO2 surface. The “Area %” values in Table 1 provide a quantitative analysis restricted to the surface region of MnO2. A distinct decrease in the predominantly Mn−O−Mn structural O peak in unreacted MnO2 centered at 529.6 eV in Figure 10a can be seen in the Cr(III)-treated MnO2 spectrum in Figure 10b. The decrease in the proportion of the Mn−O−Mn structural O peak from 68.6 to 57.2% is associated with a concurrent increase in Mn−OH surface hydroxyl from 28.5 to 39.4%, whereas the adsorbed H2O peak was constant at ~3% between the two samples. These results are consistent with previous studies on the stepwise reduction of MnO2 that yields an MnOOH species [4]
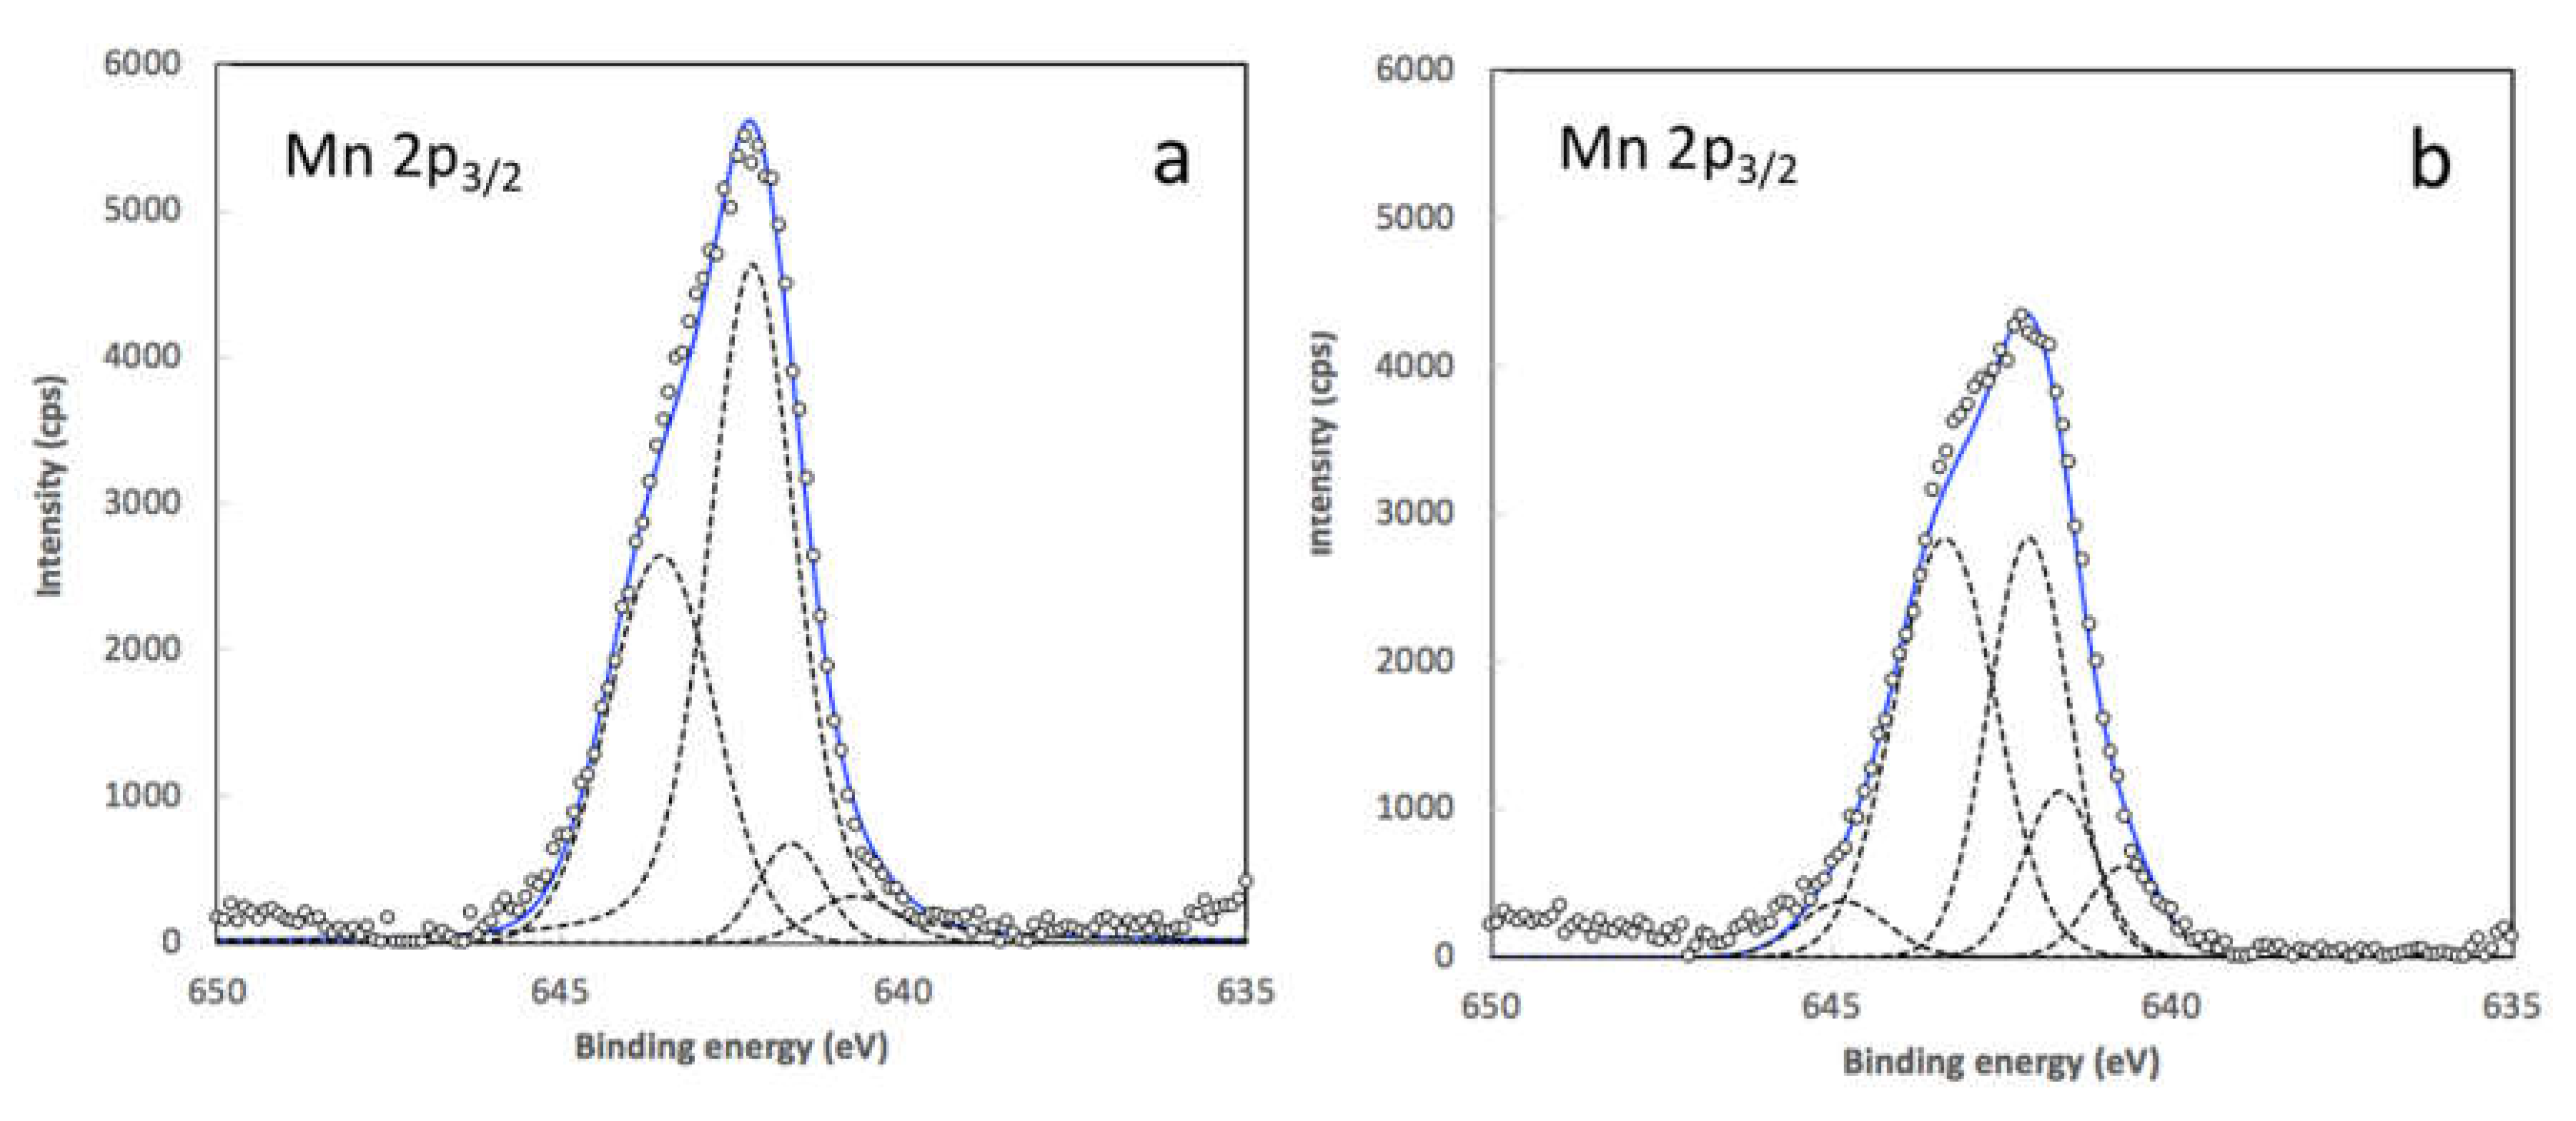
Mn 2p3/2 XPS peaks were Gaussian–Lorentzian curve-fit by constraining the binding energies of the Mn(II), Mn(III), and Mn(IV) species to 640.4, 641.5, and 642.1 eV, respectively (Figure 11). These binding energies are consistent with previous work on synthetic MnO2 [29] and MnOx catalysts [31]. The unreacted MnO2 Mn 2p3/2 XPS spectrum in Figure 11a is predominantly composed of the Mn(IV) species (57%), with smaller amounts of 3.2 and 5.4% Mn(II) and Mn(III), respectively (Table 1). Additional Mn(IV)-fitted peaks were added to account for a higher binding energy region associated with MnO2 Mn 2p3/2 XPS spectra. After reaction with Cr(III), the pronounced change in the Mn 2p3/2 XPS spectrum (Figure 11b) is due to a decrease in the intensity of the Mn(IV) species with increases in Mn(II) and Mn(III) (Table 1). This is consistent with a surface alteration where Mn(II) and Mn(III) are produced during the reductive dissolution of Mn(IV) and become part of the surface structures of Cr(III)-treated MnO2. The Mn2+ ion is restricted to the MnO2 surface region [29] due to its relatively large ionic radius (0.81 Å, low spin) compared with Mn4+ (0.67 Å).
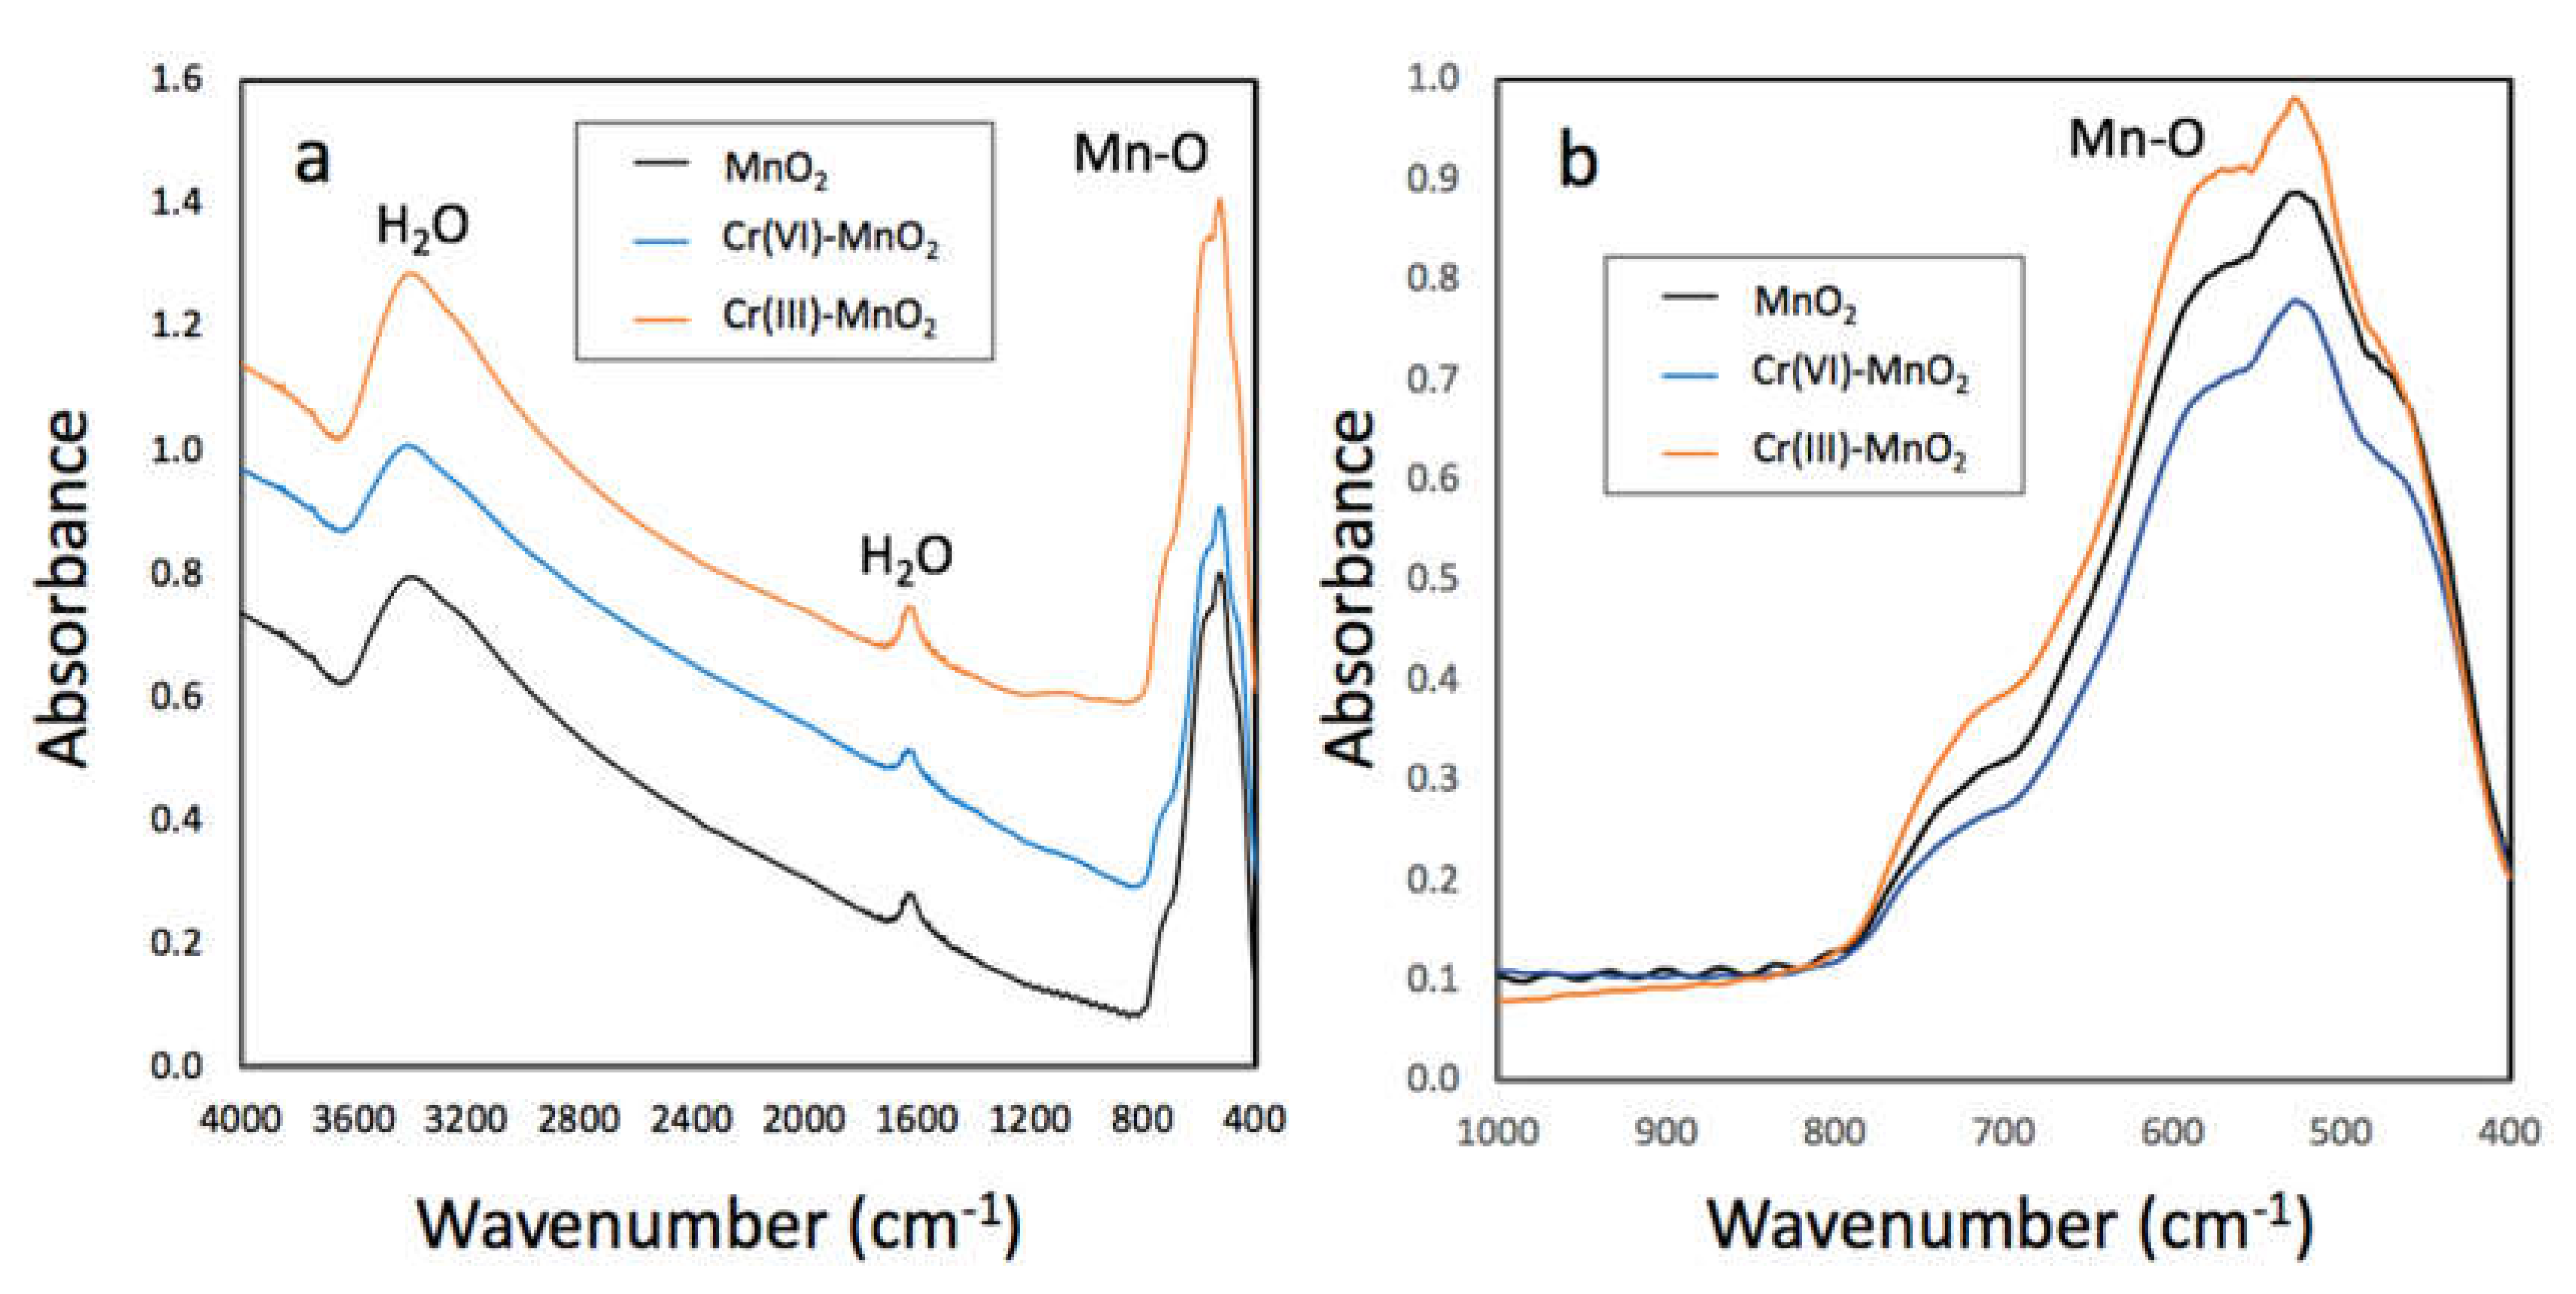
The results of FTIR analysis of the Cr-treated MnO2 solids over the entire 400–4000 cm−1 spectral range are shown in Figure 12a. All three samples show a strong band around 3450 cm−1 from interlayer hydrates and hydroxyl bound directly to interlayer metal ions [32]. This peak is the strongest in the Cr(III)-treated MnO2 samples, suggesting a greater degree of interlayer hydration due to the Mn(IV) reduction and Mn(II)/Mn(III) formation at the surface.
The peak near the 1636 cm−1 band is attributed to O–H bending vibrations and the strong band between 400 and 700 cm−1 is attributed to the Mn–O lattice vibrations [33,34]. An expanded view of the 503 cm−1 Mn–O vibrational band was created by baseline correction and normalizing the spectra to the baseline region at 800 cm−1 (Figure 12b). The pristine MnO2 and Cr(VI)-treated MnO2 have nearly identical spectra, except for a lower intensity in the Cr(VI)–MnO2 sample band. The Cr(III)-treated MnO2 sample displays a slight increase in the top region of the Mn–O vibrational band near 565 cm−1, suggesting a portion of the structural Mn–O near the MnO2 surface was altered by reductive dissolution along with an increased occupancy of Mn2+ and possibly Mn3+ in the surface region. Overall, these spectroscopic results are consistent with a Mn(IV) oxide reductive dissolution reaction occurring at the MnO2–water interface forming highly soluble Cr(VI) and a stoichiometric amount of Mn(II) that is weakly adsorbed on the MnO2 surface.
4. Conclusions
In summary, the heterogeneous oxidation of Cr(III) to Cr(VI) by a synthetic birnessite was studied using a direct speciation method combining UV–Vis spectrophotometry and MP–AES. The reaction was characterized by both the Cr(III)/(VI) speciation and the formation of dissolved Mn(II). The reaction very closely followed a stoichiometric 3:2 MnO2:Cr(III) molar relationship, causing a production of both Mn2+ and H+ in the reaction solution. The reaction was accompanied by a significant surface alteration of the MnO2 solid due to the reduction of Mn(IV) and the formation of reduced Mn(II) and Mn(III) that are associated with the MnO2 surface as an altered layer. An important result of this study was the finding that a negligible adsorption of the Cr(VI) product on the synthetic MnO2 solids occurred. However, Mn(IV) oxides exist in several polymorphs and morphologies, and thus other forms of MnO2 may sequester some Cr(VI). The formation of Cr(VI) in natural environments from Cr(III) oxidation by MnO2 will likely result in mobile Cr(VI) that will be transported in groundwater and may adsorb on other soil minerals, such as Fe and Al oxides.
Author Contributions
Conceptualization, K.C. and B.M.; methodology; K.C. and B.M.; validation and formal analysis, B.M.; investigation, K.C., L.B., B.M.; supervision and project administration, B.M. All authors have read and agreed to the published version of the manuscript.
Funding
This research received no external funding.
Institutional Review Board Statement
Not applicable.
Informed Consent Statement
Not applicable.
Data Availability Statement
The data presented in this study are available within the article.
Conflicts of Interest
The authors declare no conflict of interest.
References
- Manning, A.H.; Mills, C.; Morrison, J.M.; Ball, L.B. Insights into controls on hexavalent chromium in groundwater provided by environmental tracers, Sacramento Valley, California, USA. Appl. Geochem. 2015, 62, 186–199. [Google Scholar] [CrossRef]
- Trebien, D.O.P.; Bortolon, L.; Tedesco, M.J.; Bissani, C.A.; Camargo, F.A.O. Environmental factors affecting chromium-manganese oxidation-reduction reactions in soil. Pedosphere 2011, 21, 84–89. [Google Scholar] [CrossRef]
- Tokunaga, T.K.; Wan, J.; Lanzirotti, A.; Sutton, S.R.; Newville, M.; Rao, W. Long-term stability of organic carbon-stimulated chromate reduction in contaminated soils and its relation to manganese redox status. Environ. Sci. Technol. 2007, 41, 4326–4331. [Google Scholar] [CrossRef] [Green Version]
- Liang, J.; Huang, X.; Yan, J.; Li, Y.; Zhao, Z.; Liu, Y.; Ye, J.; Wei, Y. A review of the formation of Cr(VI) via Cr(III) oxidation in soils and groundwater. Sci. Total Envion. 2021, 774, 145762. [Google Scholar] [CrossRef]
- Oliveira, H. Chromium as an environmental pollutant: Insights on induced plant toxicity. J. Bot. 2012, 2012, 1–8. [Google Scholar] [CrossRef]
- Dayan, A.D.; Paine, A.J. Mechanisms of chromium toxicity, carcinogenicity and allergenicity: Review of the literature from 1985 to 2000. Hum. Exp. Toxicol. 2001, 20, 439–451. [Google Scholar] [CrossRef]
- Bhattacharya, M.; Shriwastav, A.; Bhole, S.; Silori, R.; Mansfeldt, T.; Kretzschmar, R.; Singh, A. Processes governing chromium contamination of groundwater and soil from a chromium waste source. Acs Earth Space Chem. 2020, 4, 35–49. [Google Scholar] [CrossRef]
- Garnier, J.; Quantin, C.; Guimarães, E.M.; Vantelon, D.; Montargès-Pelletier, E.; Becquer, T. Cr(VI) genesis and dynamics in Ferralsols developed from ultramafic rocks: The case of Niquelândia, Brazil. Geoderma 2013, 193, 256–264. [Google Scholar] [CrossRef]
- Fandeur, D.; Juillot, F.; Morin, G.; Olivi, L.; Cognigni, A.; Webb, S.M.; Ambrosi, J.-P.; Fritsch, E.; Guyot, F.; Brown, G.E., Jr. XANES evidence for oxidation of Cr(III) to Cr(VI) by Mn-oxides in a lateritic regolith developed on serpentinized ultramafic rocks of New Caledonia. Environ. Sci. Technol. 2009, 43, 7384–7390. [Google Scholar] [CrossRef] [PubMed]
- Chacon, S.S.; Reardon, P.N.; Burgess, C.J.; Purvine, S.; Chu, R.K.; Clauss, T.R.; Walter, E.; Myrold, D.D.; Washton, N.; Kleber, M. Mineral surfaces as agents of environmental proteolysis: Mechanisms and controls. Environ. Sci. Technol. 2019, 53, 3018–3026. [Google Scholar] [CrossRef] [PubMed]
- Post, J.E. Manganese oxide minerals: Crystal structures and economic and environmental significance. Proc. Natl. Acad. Sci. USA 1999, 96, 3447–3454. [Google Scholar] [CrossRef] [Green Version]
- Ukrainczyk, L.; McBride, M.B. Oxidation and dechlorination of chlorophenols in dilute aqueous suspensions of manganese oxides: Reaction products. Environ. Toxicol. Chem. 1993, 12, 2015–2022. [Google Scholar] [CrossRef]
- Klausen, J.; Haderlein, S.B.; Schwarzenbach, R.P. Oxidation of substituted anilines by aqueous MnO2: Effect of cosolutes on initial and quasi-steady-state kinetics. Environ. Sci. Technol. 1997, 31, 2642–2649. [Google Scholar] [CrossRef]
- Wang, D.; Shin, J.Y.; Cheney, M.A.; Sposito, G.; Spiro, T.G. Manganese dioxide as a catalyst for oxygen-independent atrazine dealkylation. Environ. Sci. Technol. 1999, 33, 3160–3165. [Google Scholar] [CrossRef]
- Manning, B.A.; Kanel, S.R.; Guzman, E.; Brittle, S.W.; Pavel, I.E. Oxidative dissolution of silver nanoparticles by synthetic manganese dioxide investigated by synchrotron X-ray absorption spectroscopy. J. Nanopart. Res. 2019, 21, 213. [Google Scholar] [CrossRef]
- Landrot, G.; Ginder-Vogel, M.; Livi, K.; Fitts, J.P.; Sparks, D.L. Chromium(III) oxidation by three poorly-crystalline manganese(IV) oxides. 1. Chromium(III)-oxidizing capacity. Environ. Sci. Technol. 2012, 46, 11594–11600. [Google Scholar] [CrossRef] [PubMed]
- Feng, X.; Wang, P.; Shi, Z.; Kwon, K.; Zhao, H.; Yin, H.; Lin, Z.; Zhu, M.; Liang, X.; Liu, F.; et al. A quantitative model for the coupled kinetics of arsenic adsorption/desorption and oxidation on manganese oxides. Environ. Sci. Technol. Lett. 2018, 5, 175–180. [Google Scholar] [CrossRef]
- Biesinger, M.C.; Brown, C.; Mycroft, J.R.; Davidson, R.D.; McIntyre, N.S. X-ray photoelectron spectroscopy studies of chromium compounds. Surf. Interface Anal. 2004, 36, 1550–1563. [Google Scholar] [CrossRef]
- Victor, R.P.D.; Fontess, L.L.; Neves, A.A.; de Queiroz, M.E.L.R.; de Oliveira, A.F.; Miranda, D.L. Removal of Orange G Dye by manganese oxide nanostructures. J. Braz. Chem. Soc. 2019, 30, 1769–1778. [Google Scholar] [CrossRef]
- Liang, M.; Guo, H.; Xiu, W. Arsenite oxidation and arsenic adsorption on birnessite in the absence and the presence of citrate or EDTA. Environ. Sci. Pollut. Res. 2020, 27, 43769–43785. [Google Scholar] [CrossRef]
- Zhang, X.; Miao, W.; Li, C.; Sun, X.; Wang, K.; Yanwei, M. Microwave-assisted rapid synthesis of birnessite-type MnO2 nanoparticles for high performance supercapacitor applications. Mater. Res. Bull. 2015, 71, 111–115. [Google Scholar] [CrossRef]
- Cui, H.; Qiu, G.; Feng, X.; Tan, W.; Liu, F. Birnessites with different average manganese oxidation states synthesized, characterized, and transformed to todorokite at atmospheric pressure. Clays Clay Min. 2009, 57, 715–724. [Google Scholar] [CrossRef]
- Liu, M.; Lv, G.; Mei, L.; Wang, X.; Xing, X.; Liao, L. Degradation of tetracycline by birnessite under microwave irradiation. Adv. Mater. Sci. Eng. 2014, 2014, 5. [Google Scholar] [CrossRef] [Green Version]
- Johnson, E.A.; Post, J.E. Water in the interlayer region of birnessite: Importance in cation exchange and structural stability. Am. Mineral. 2006, 91, 609–618. [Google Scholar] [CrossRef]
- Drits, V.A.; Silvester, E.; Gorshkov, A.; Manceau, A. Structure of synthetic monoclinic Na-rich birnessite and hexagonal birnessite: II. Results from chemical studies and EXAFS spectroscopy. Am. Mineral. 1997, 82, 962–978. [Google Scholar] [CrossRef]
- Gao, T.; Shen, Y.; Jia, Z.; Qiu, G.; Liu, F.; Zhang, Y.; Feng, X.; Cai, C. Interaction mechanisms and kinetics of ferrous ion and hexagonal birnessite in aqueous systems. Geochem. Trans. 2015, 16, 16. [Google Scholar] [CrossRef] [PubMed] [Green Version]
- Xia, L.; Akiyama, E.; Frankel, G.; McCreery, R. Storage and release of soluble hexavalente chromium from chromate conversion coatings. Equilibrium aspects of Cr(VI) concentration. J. Electrochem. Soc. 2000, 147, 2556–2562. [Google Scholar] [CrossRef]
- Phuong, N.V.; Kwon, S.C.; Lee, J.Y.; Lee, J.H.; Lee, K.H. The effects of pH and polyethylene glycol on the Cr(III) solution chemistry and electrodeposition of chromium. Surf. Coatings Technol. 2012, 206, 4349–4355. [Google Scholar] [CrossRef]
- Nesbitt, H.W.; Banerjee, D. Interpretation of XPS Mn(2p) spectra of Mn oxyhydroxides and constraints on the mechanism of MnO2 precipitation. Am. Miner. 1998, 83, 305–315. [Google Scholar] [CrossRef]
- Astrup, T.; Stipp, S.L.S.; Christensen, T.H. Immobilization of chromate from coal fly ash leachate using an attenuating barrier containing zero-valent iron. Environ. Sci. Technol. 2000, 34, 4163–4168. [Google Scholar] [CrossRef]
- Chen, Z.; Yang, Q.; Li, H.; Li, X.; Wang, L.; Tsang, S.C. Cr–MnOx mixed-oxide catalysts for selective catalytic reduction of NOx with NH3 at low temperature. J. Catal. 2010, 276, 56–65. [Google Scholar] [CrossRef]
- Luo, J.; Huang, A.; Park, S.H.; Suib, S.L.; O’Young, C.-L. Crystallization of sodium−birnessite and accompanied phase transformation. Chem. Mater. 1998, 10, 1561–1568. [Google Scholar] [CrossRef]
- Kang, L.; Zhang, M.; Liu, Z.-H.; Ooi, K. IR spectra of manganese oxides with either layered or tunnel structures. Spectrochim. Acta Part A 2007, 67, 864–869. [Google Scholar] [CrossRef] [PubMed]
- Yuan, L.; Wan, C.; Zhao, L. Facial in-situ synthesis of MnO2/PPy composite for supercapacitor. Int. J. Electrochem. Sci. 2015, 10, 9456–9465. [Google Scholar]
Figure 1.
Scanning electron microscopy (SEM) images of synthetic MnO2 at (a) 8310× magnification and (b) 50,000× magnification.
Figure 1.
Scanning electron microscopy (SEM) images of synthetic MnO2 at (a) 8310× magnification and (b) 50,000× magnification.

Figure 2.
Solid phase analysis of synthetic MnO2 showing the (a) X-ray diffraction (XRD) pattern and (b) X-ray fluorescence (XRF) spectrum.
Figure 2.
Solid phase analysis of synthetic MnO2 showing the (a) X-ray diffraction (XRD) pattern and (b) X-ray fluorescence (XRF) spectrum.

Figure 3.
UV–Vis spectra of 0.10 mM HCl, 10.0 mM Cr(III) (as CrCl3 in 0.10 mM HCl), and 0.10 mM Cr(VI) (as Na2CrO4).
Figure 3.
UV–Vis spectra of 0.10 mM HCl, 10.0 mM Cr(III) (as CrCl3 in 0.10 mM HCl), and 0.10 mM Cr(VI) (as Na2CrO4).

Figure 4.
Effect of solution pH on the UV–Vis spectrum of a 0.37 mM Cr(VI) standard solution (as Na2CrO4). Samples in the pH 3.08–4.70 range have overlapping UV–Vis spectra.
Figure 4.
Effect of solution pH on the UV–Vis spectrum of a 0.37 mM Cr(VI) standard solution (as Na2CrO4). Samples in the pH 3.08–4.70 range have overlapping UV–Vis spectra.

Figure 5.
pH-predominance diagram of Cr(VI) species and the measured relationship of the pH dependence of Cr(VI) on its UV–Vis absorbance at 375 nm (red points and line).
Figure 5.
pH-predominance diagram of Cr(VI) species and the measured relationship of the pH dependence of Cr(VI) on its UV–Vis absorbance at 375 nm (red points and line).

Figure 6.
UV–Vis spectra of the Cr(III)–MnO2 reaction solution (pH = 3.0) and the same solution adjusted to pH = 7.5 with NaOH. A 0.37 mM Cr(VI) standard prepared at pH = 7.5 is also shown.
Figure 6.
UV–Vis spectra of the Cr(III)–MnO2 reaction solution (pH = 3.0) and the same solution adjusted to pH = 7.5 with NaOH. A 0.37 mM Cr(VI) standard prepared at pH = 7.5 is also shown.

Figure 7.
Images of the reaction of Cr(III) and Cr(VI) with MnO2, showing (a) 20 mM Cr(III) and Cr(VI), (b) the addition of 0.50 g MnO2 at (t = 0), and the reaction mixtures after (c) 2 h and (d) 4 h.
Figure 7.
Images of the reaction of Cr(III) and Cr(VI) with MnO2, showing (a) 20 mM Cr(III) and Cr(VI), (b) the addition of 0.50 g MnO2 at (t = 0), and the reaction mixtures after (c) 2 h and (d) 4 h.

Figure 8.
Recovery of Cr as Cr(VI) (UV–Vis spectrophotometry) and total Cr (microwave plasma–atomic emission spectrometry (MP–AES)) under the treatment conditions employed in this study. The dashed line represents the 1:1 relationship or 100% recovery.
Figure 8.
Recovery of Cr as Cr(VI) (UV–Vis spectrophotometry) and total Cr (microwave plasma–atomic emission spectrometry (MP–AES)) under the treatment conditions employed in this study. The dashed line represents the 1:1 relationship or 100% recovery.

Figure 9.
Recovery of dissolved Mn measured as total Mn by MP–AES under the Cr(III) treatment range employed in this study. The dashed lines represent the 1:1 and 1.5:1 Mn:Cr (mol:mol) relationship.
Figure 9.
Recovery of dissolved Mn measured as total Mn by MP–AES under the Cr(III) treatment range employed in this study. The dashed lines represent the 1:1 and 1.5:1 Mn:Cr (mol:mol) relationship.

Figure 10.
Oxygen (O 1s) XPS spectra of (a) unreacted MnO2 and (b) Cr(III)-treated MnO2. Dashed lines are the Gaussian–Lorentzian fit peaks described in Table 1, and the solid line is the sum-fit line.
Figure 10.
Oxygen (O 1s) XPS spectra of (a) unreacted MnO2 and (b) Cr(III)-treated MnO2. Dashed lines are the Gaussian–Lorentzian fit peaks described in Table 1, and the solid line is the sum-fit line.

Figure 11.
Manganese (Mn 2p3/2) XPS spectra of (a) unreacted MnO2 and (b) Cr(III)-treated MnO2. Dashed lines are the Gaussian–Lorentzian fit peaks described in Table 1 and the solid line is the sum-fit line.
Figure 11.
Manganese (Mn 2p3/2) XPS spectra of (a) unreacted MnO2 and (b) Cr(III)-treated MnO2. Dashed lines are the Gaussian–Lorentzian fit peaks described in Table 1 and the solid line is the sum-fit line.

Figure 12.
FTIR absorbance spectra of unreacted MnO2, Cr(VI)-treated MnO2, and Cr(III)-treated MnO2 showing (a) the entire 400–4000 cm−1 spectral range and (b) a magnified view of the Mn–O peak region (400–1000 cm−1) showing the effects of Cr(III) and Cr(VI) treatment. The data in (b) were baseline-corrected and normalized to the spectral region at 800 cm−1.


Table 1.
O 1s and Mn 2p3/2 X-ray photoelectron spectroscopy (XPS) peak-fit results for MnO2 and Cr(III)-treated MnO2.
Table 1.
O 1s and Mn 2p3/2 X-ray photoelectron spectroscopy (XPS) peak-fit results for MnO2 and Cr(III)-treated MnO2.
| O 1s Fits | ||||||
| Sample | O species | eV | Intensity | FWHM | Area | Area % |
| MnO2 | Structural O2− | 529.6 | 2468 | 1.89 | 4961 | 68.6 |
| Surface OH | 530.9 | 1024 | 1.82 | 2059 | 28.5 | |
| Adsorbed H2O | 532.3 | 134 | 1.44 | 215 | 3.00 | |
| Cr(III) + MnO2 | Structural O2− | 529.6 | 2047 | 1.77 | 4040 | 57.2 |
| Surface OH | 530.9 | 1501 | 1.66 | 2778 | 39.4 | |
| Adsorbed H2O | 532.3 | 144 | 1.5 | 241 | 3.4 | |
| Mn 2p3/2 Fits | ||||||
| Sample | Mn species | eV | Intensity | FWHM | Area | Area % |
| MnO2 | Mn(II) | 640.2 | 155 | 1.47 | 242 | 3.2 |
| Mn(III) | 641.5 | 340 | 1.13 | 409 | 5.4 | |
| Mn(IV) | 642.1 | 2316 | 1.49 | 4295 | 57.0 | |
| Mn(IV) | 643.4 | 1324 | 1.84 | 2593 | 34.4 | |
| Cr(III) + MnO2 | Mn(II) | 640.2 | 365 | 1.23 | 478 | 6.5 |
| Mn(III) | 641.5 | 662 | 1.26 | 888 | 12.0 | |
| Mn(IV) | 642.1 | 1691 | 1.39 | 2502 | 33.9 | |
| Mn(IV) | 643.4 | 1684 | 1.76 | 3155 | 42.7 | |
| Mn(IV) | 644.7 | 225 | 1.5 | 359 | 4.9 |
Publisher’s Note: MDPI stays neutral with regard to jurisdictional claims in published maps and institutional affiliations. |
© 2021 by the authors. Licensee MDPI, Basel, Switzerland. This article is an open access article distributed under the terms and conditions of the Creative Commons Attribution (CC BY) license (https://creativecommons.org/licenses/by/4.0/).
Share and Cite
MDPI and ACS Style
Chen, K.; Bocknek, L.; Manning, B. Oxidation of Cr(III) to Cr(VI) and Production of Mn(II) by Synthetic Manganese(IV) Oxide. Crystals 2021, 11, 443. https://doi.org/10.3390/cryst11040443
AMA Style
Chen K, Bocknek L, Manning B. Oxidation of Cr(III) to Cr(VI) and Production of Mn(II) by Synthetic Manganese(IV) Oxide. Crystals. 2021; 11(4):443. https://doi.org/10.3390/cryst11040443
Chicago/Turabian StyleChen, Kaiyin, Lauren Bocknek, and Bruce Manning. 2021. "Oxidation of Cr(III) to Cr(VI) and Production of Mn(II) by Synthetic Manganese(IV) Oxide" Crystals 11, no. 4: 443. https://doi.org/10.3390/cryst11040443
Note that from the first issue of 2016, this journal uses article numbers instead of page numbers. See further details here.