Dual-Energy X-ray Medical Imaging with Inverse Compton Sources: A Simulation Study


1
Dip. Fisica e Scienze della Terra, Università di Ferrara, via Saragat 1, I-44122 Ferrara, Italy
2
INFN–Sez. di Ferrara, Università di Ferrara, via Saragat 1, I-44122 Ferrara, Italy
*
Author to whom correspondence should be addressed.
Crystals 2020, 10(9), 834; https://doi.org/10.3390/cryst10090834
Submission received: 6 August 2020
/
Revised: 11 September 2020
/
Accepted: 15 September 2020
/
Published: 18 September 2020
(This article belongs to the Special Issue Development and Application of Novel Dual Energy X-ray Imaging Methods)
Abstract
:It has been long recognized that dual-energy imaging could help to enhance the detectability of lesions in diagnostic radiology, by removing the contrast of surrounding tissues. Furthermore, X-ray attenuation is material specific and information about the object constituents can be extracted for tissue characterisation, i.e., to assess whether lesions represent a malignant or benign process. However, a true separation between the low and high energy components is not possible with conventional sources because of their broad X-ray spectrum, and the artifacts produced in the subtracted image can be only partially removed. Finally, dose issues have also prevented so far the application of dual-energy techniques within the clinical context. Very recently, a new intense and monochromatic X-ray source was proposed to fill the gap between a synchrotron radiation facility and the standard X-ray tube. Indeed, inverse Compton scattering (ICS) sources, which are based on the interaction of a powerful laser beam and a bright beam of relativistic electrons, are among the most promising innovative sources of monochromatic X and gamma radiation. In this contribution, we review the main features that allow an ICS source to meet the requirements of a medical imaging application. Specific examples of K-edge subtraction are then provided, to show the potential of ICS in clinical applications that require intravenous injection of a contrast medium.
1. Introduction
Conventional X-ray imaging is implemented using polychromatic spectra and energy-integrating detectors, which measure the integral of the energy released by the incident X-ray photons on each pixel, losing all the information about the energy spectrum of the transmitted radiation. This approach is sufficient for most traditional clinical applications, but has limitations especially in the case of low contrast details. Many soft tissues have similar effective atomic number and electron densities, so that the contrast of details of interest is masked by the signal due to the anatomical background, which ultimately limits its detectability. Dual-energy imaging, proposed originally in 1976 by Alvarez and Macovski [1], is an image acquisition modality that uses two different X-ray energy measurements. From the images acquired with two X-ray spectra, information about the energy-dependent attenuation can be used to discriminate different materials. In recent years, dual-energy computed tomography (DECT) demonstrated the potential to become a well-established diagnostic tool in clinical routine [2]. Also, other dual-energy applications relying on two-dimensional projection data, such as dual-energy X-ray absorptiometry for bone mineral densitometry [3] and dual-energy subtraction radiography [4] are commonly used in the clinical environment. One of the most straightforward and effective applications of dual-energy is K-edge digital subtraction (KES) imaging, which can be used for contrast enhancement by the administration of a contrast agent, as proposed by Jacobson in 1953 [5]. This technique is based on the discontinuity with energy of the photoelectric absorption coefficients (the K-edge) of a suitable element, which can be used as a contrast agent when perfused in the tissues to be visualized. KES can be performed by using two monochromatic beams with energies bracketing the K-edge of the element used as contrast agent. A subtraction algorithm allows obtaining an image of the contrast agent distribution, suppressing anatomical noise and contrast of other features and enhancing the detectability of the features of interest.
The subtraction technique works assuming perfectly monochromatic X-ray beams. The implementation of KES is possible with two X-ray beams with different mean energy and a narrow bandwidth. Many experimental tests of K-edge subtraction imaging in the field of biomedical research, and their potential clinical applications were carried out by using synchrotron radiation [6]. A widespread implementation of synchrotron radiation for clinical routine is not feasible, due to the size and financial effort required for a synchrotron facility. Alternative solutions were experimented with by using conventional X-ray tube or compact X-ray sources [7,8,9], but none of the proposed methods could provide a sufficient intensity and/or an appropriate bandwidth for an effective clinical translation. A different approach consists of using the energy discrimination capability of multi-threshold photon-counting detectors combined with polychromatic X-rays emitted by conventional sources. This is a very active research field, in particular in the case of computed tomography techniques [10,11].
Contrast-enhanced dual-energy mammography (CEDEM) is the only KES technique successfully implemented in clinics by using conventional X-ray tubes and energy integrating detectors. This is emerging as a valid method for the characterization of pathologies in breast tissue, such as tumours, through the detection of the signal due to the formation of new blood vessels surrounding the lesion (angiogenesis) [12]. Nonetheless, CEDEM still suffers the limitation of the use of polychromatic X-ray beams from traditional X-ray tube [13] and could benefit from the availability of a monochromatic X-ray beam.
Coronary angiography is in widespread use to assess the presence and extent of obstructive lesions (stenosis) in coronary arteries and identifies patients who may benefit from revascularisation. In clinics, the contrast agent is injected through arterial catheterisation. This fact and the required dose of the contrast agent represent a source of risks in susceptible patients [14]. The intravenous injection of the contrast agent, enabled by the high sensitivity of the KES technique performed with two intense monochromatic X-ray beams, could significantly reduce the risks [6].
To date, synchrotron radiation has been the only source providing sufficiently intense monochromatic X-ray beams for KES implementation. Inverse Compton interaction, i.e., the scattering of laser light by relativistic electrons, is among the most promising solutions to generate intense tunable quasi-monochromatic radiation by means of a compact source. Many research institutions and laboratories worldwide are operating or proposing scientific programs aimed at developing and commissioning facilities based on inverse Compton scattering (ICS).
In this contribution, we will review the main features that allow an ICS source to meet the requirements of a medical imaging application. Specific examples of K-edge subtraction will be provided to show the potential of ICS in clinical applications. In particular, two imaging tasks will be considered: CEDEM and coronary angiography. It will be shown that imaging is promising and that the features of the most advanced ICS sources currently working or in a proposal stage match the requirements to actually implement the KES techniques.
2. K-Edge Subtraction Imaging
The KES algorithm, based on a generalization of the dual-energy method [1,15], consists of the decomposition of a sample in two suitable basis materials: a contrast element (e.g., iodine) and a soft tissue. The decomposition can be obtained from two images acquired with two monochromatic beams at energies and , bracketing the K-edge of the contrast element. In fact, for a sample made of the two basis materials, the negative logarithm of the total attenuation is [6,16]
where the subscript X specifies the contrast element and T the soft tissue. For each material, , and t are the mass attenuation coefficient, the density and the thickness, respectively. The superscripts ± show that the values are intended either for the high-energy (), or the low-energy (). Therefore, the relations in (1) represent a system of two independent equations (one for each energy), which can be solved to calculate the values of the mass thicknesses and as:
where
Equations (2) and (3), evaluated for each pixel, form the and image, respectively. In the case of a sample composed exclusively of the same two materials used as basis, the contrast image will contain the isolated contribution of the contrast element, while the tissue image will represent the contribution due to soft tissue component. When the sample includes a third material, with significantly different composition and attenuation properties from the soft tissue (such as bone), the decomposition of the total absorption should, in principle, include the contribution of this material and a three energies analysis would be required to solve the three equations and obtain a three basis decomposition. Nonetheless, a dual-energy analysis can still be performed and the third material will be then decomposed in a combination of the two basis materials. As a consequence, the mass thickness evaluated in contrast image is affected from a spurious signal resulting from the bone structures. This effect can be made explicit by using Equation (2) with , namely Equation (1) modified to take into account the actual contrast agent mass thickness and include also the attenuation term due to the bone . The estimated contrast medium mass thickness results
where the first term is the actual contrast medium mass thickness, while the second term represents the bone spurious signal, which can be minimized by using a small energy separation [8].
Dual-energy equations can be easily solved for perfectly monochromatic, or at least narrow-bandwidth, X-ray beams. Although using non-linear models and specific algorithms, it is possible to implement within certain limits the KES technique with polychromatic beams, by performing experimental calibrations and beam hardening corrections [1,13,15].
3. X-ray Imaging with Inverse Compton Scattering Sources
3.1. Inverse Compton Scattering
Inverse Compton scattering sources are based on the interaction of a laser beam with an electron beam accelerated at relativistic energies. A complete treatment of the physics principles of ICS can be found in specialised articles [17,18,19,20,21]. Here we provide a brief review of the X-ray emission features that are relevant for the discussion of the possible applications in radiology and, in particular, in KES imaging.
For a laser photon with energy colliding with a single electron, the energy of the back-scattered photon E can be written as
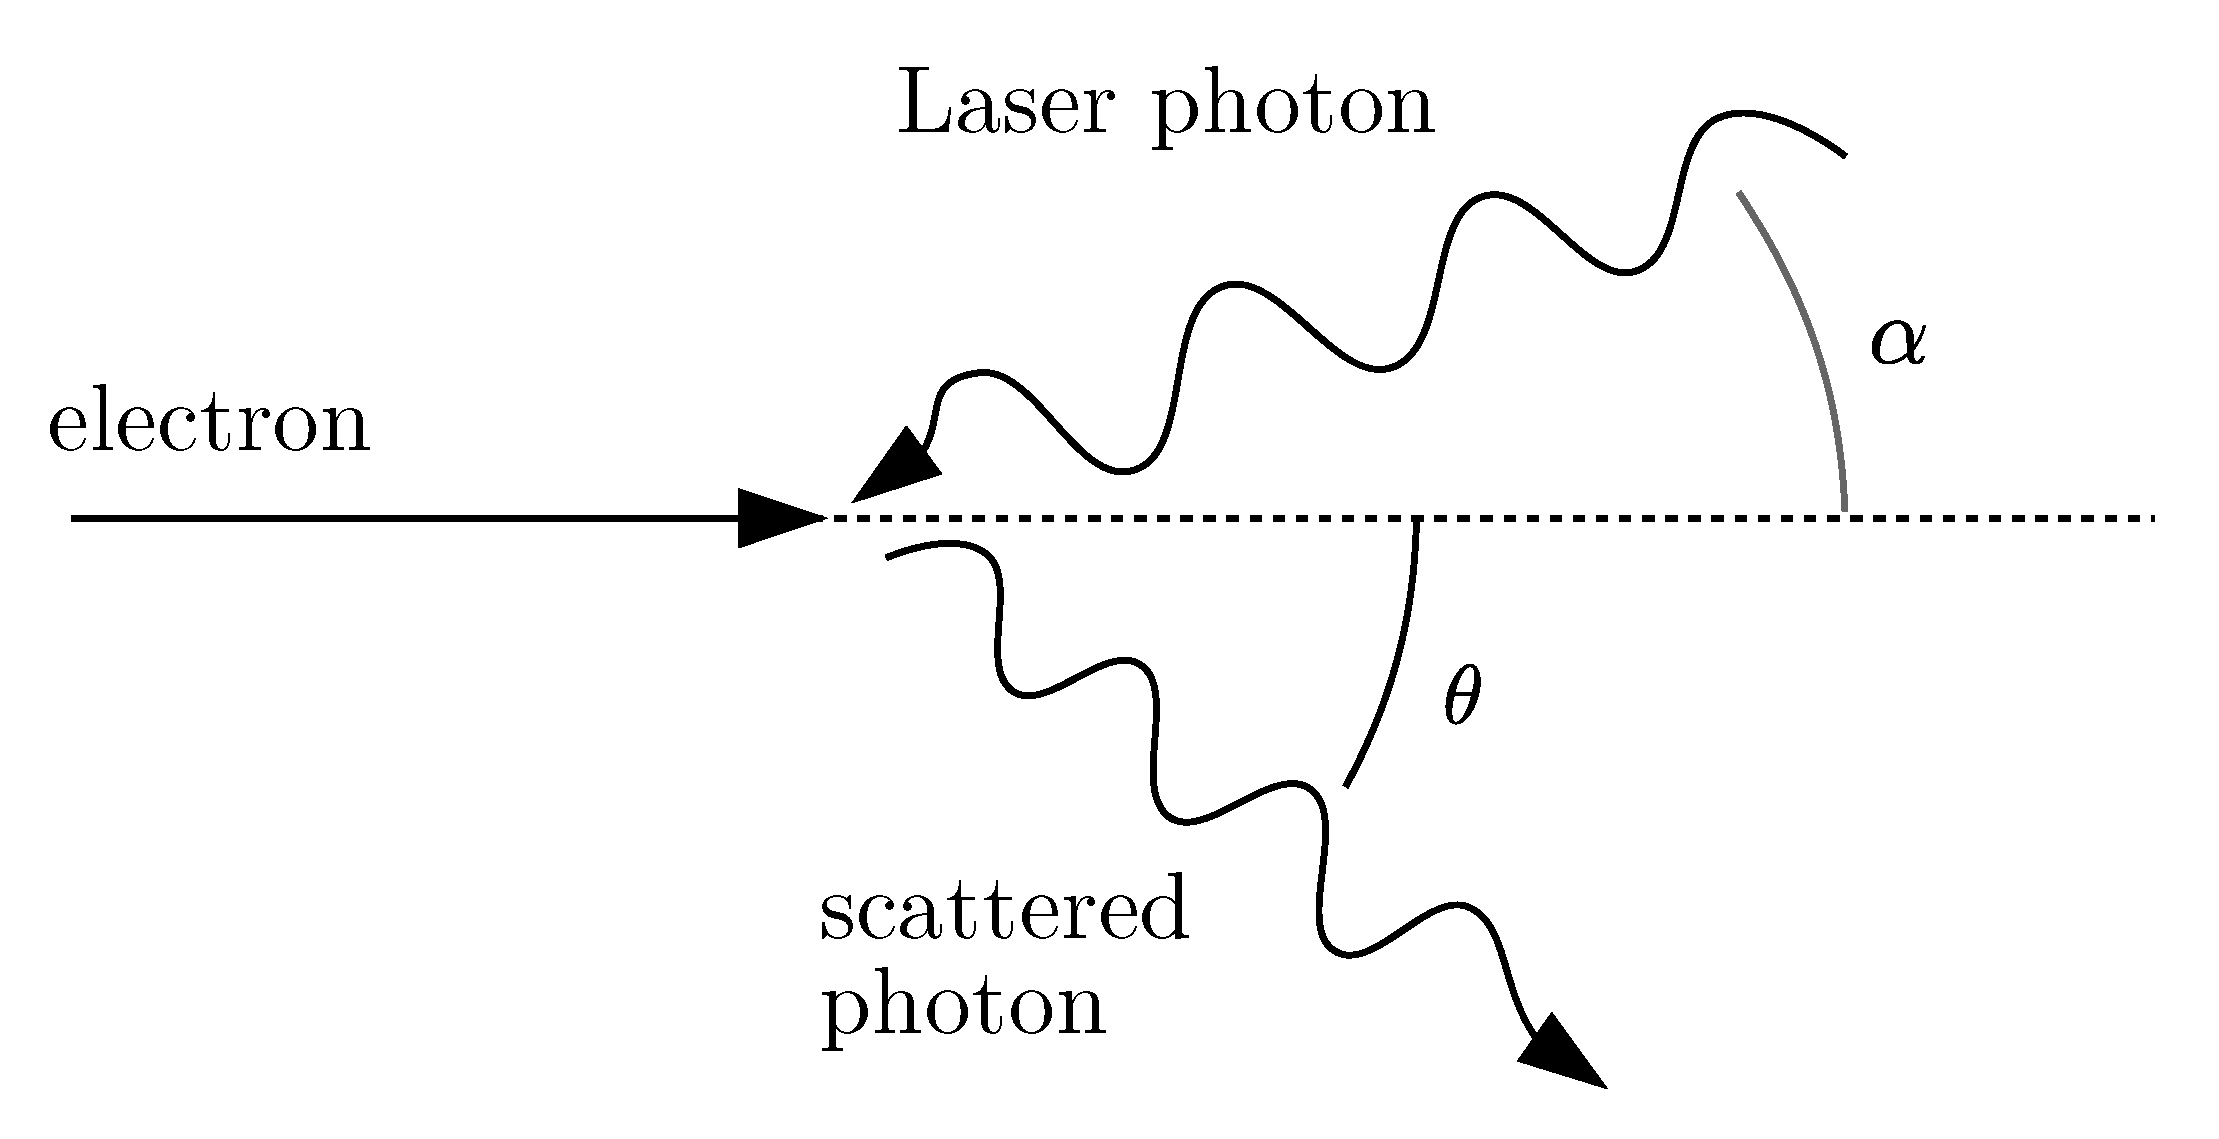
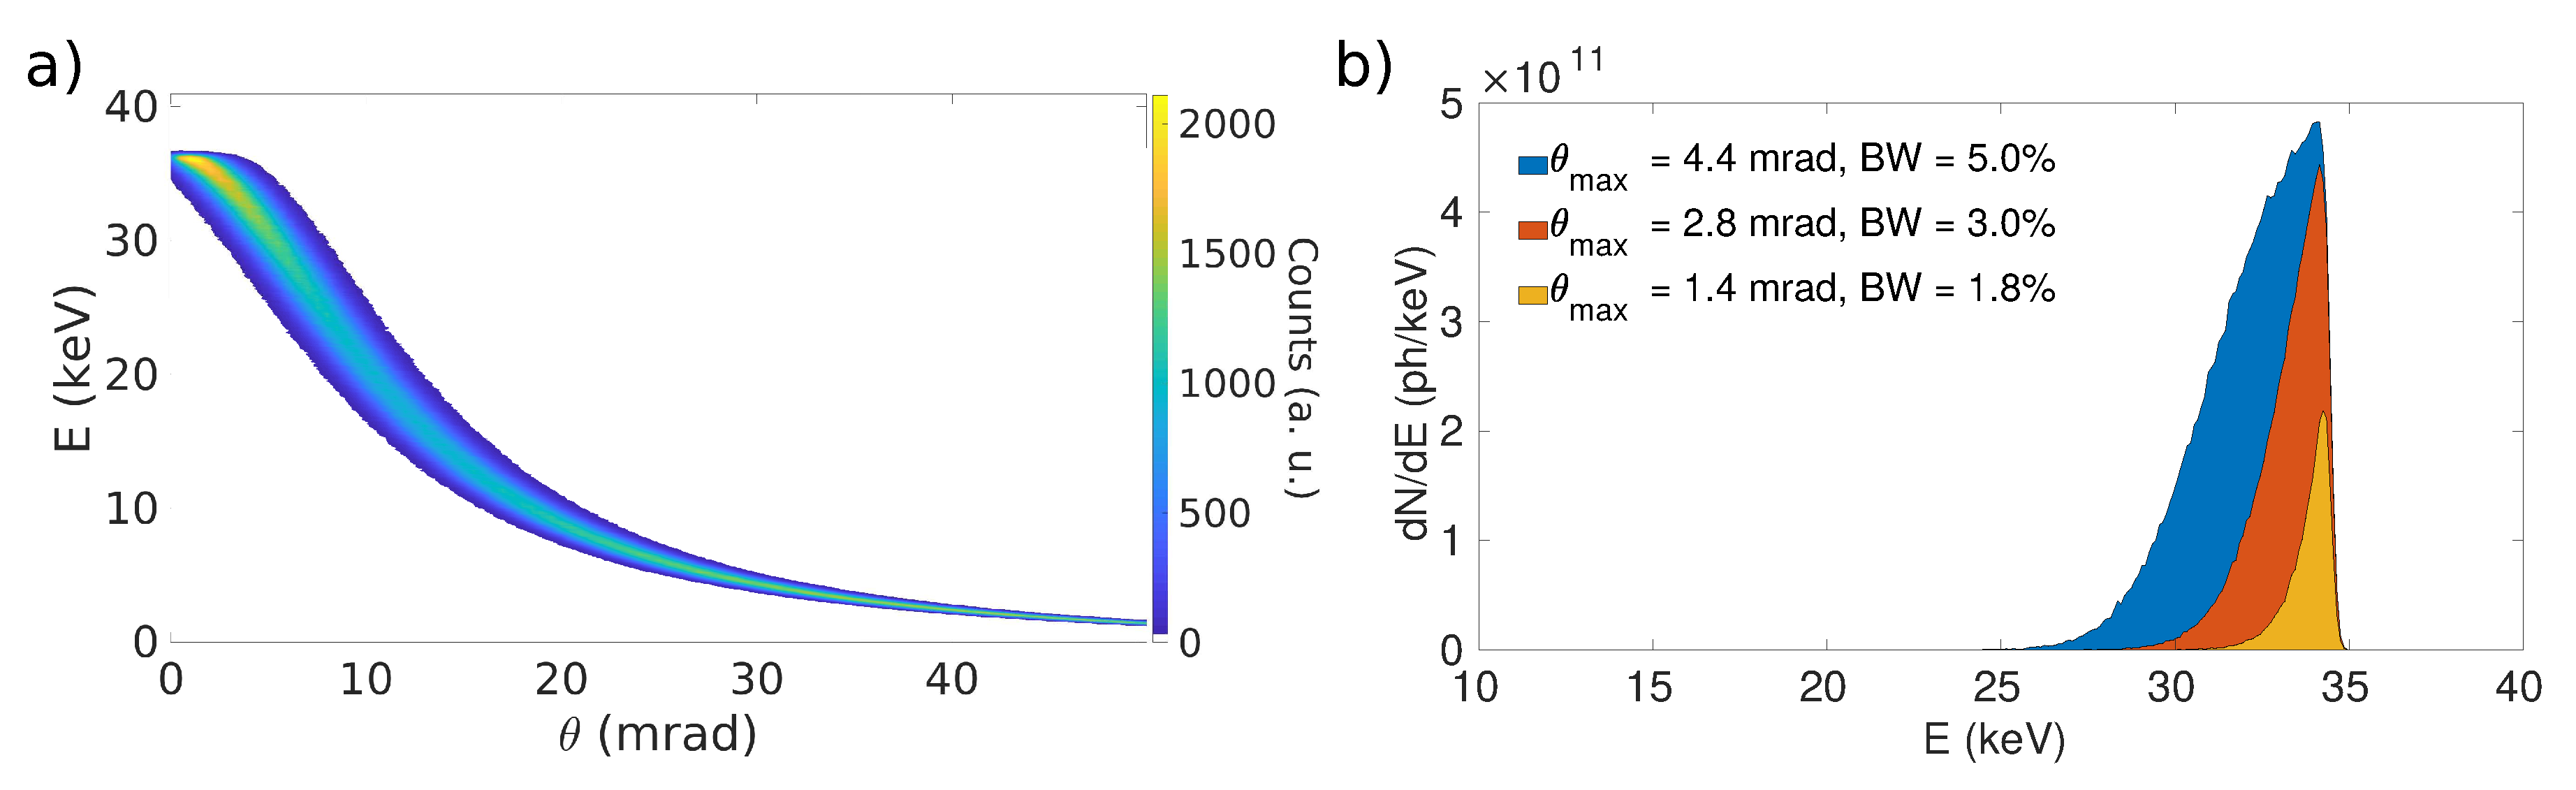
where is the relativistic Lorentz factor of the electrons, is the polar scattering angle and is the interaction angle, as shown in Figure 1. Equation (6) is valid in the low laser intensity regime and for a negligible electron recoil, which is typically satisfied in the case of X-ray imaging applications (<100 keV) [19,21]. As suggested by Equation (6) and shown in Figure 2a, the scattered radiation is not monochromatic but there is a correlation between the photon energy and the emission angle, with the most energetic photons emitted on axis (back-scattered) and the photon energy decreasing as the scattering angle increases. The spectrum of the scattered radiation extends in energy from to . The energy-angle correlation allows one to control the energy bandwidth by inserting irides or collimators along the path of the radiation, thus selecting only the photons within a given collimation angle [22]. Thus, the energy bandwidth is related to the selected divergence of the X-ray beam. Indeed, the collimation angle defines the maximum divergence of a photon beam emitted by a source based on ICS. Considering that most of the available lasers emit in the near-infrared, the energy of the laser photons E is of the order of 1 eV and thus, a = 87 is required to obtain X-ray photons at 30 keV. As a consequence, the X-ray beam divergence for an energy bandwidth of a few percent is of the order of a few mrads (see Figure 2b). The intensity of the emitted radiation is also dependent on the scattering angle, the emission is peaked on the backscattering direction () and decreases as the angle increases (see Figure 2a). Due to the relativistic nature of the process, about half of the photons are emitted within a cone with aperture [23]. This results in a non-uniform radiation field at a certain distance from the interaction point (IP), with a gradient along the radial direction from the backscattering one. Nonetheless, for divergences corresponding to energy BW less than 10%, which is the one of interest for radiography applications, the effect can be easily compensated by a flat-field equalization. The size of the obtainable radiation beam is determined by the maximum angular divergence selected, which is typically of the order of a few mrads. Since the transversal dimensions of the colliding beams are typically small (tens or hundreds of m), the source can be considered to be point-like. The photon fluence (ph mm) available at a certain distance then scales as the square of the distance from the IP.
When a laser beam composed of several photons interacts with the electron bunches obtained from an accelerator, the statistical distributions of the particles in the interacting beams must be considered. The energy spread and finite emittance of the electron beam imply that the photons scattered at a given angle present an energy distribution with mean value given by Equation (6) and a spread (called local energy spread or local bandwidth in the following) which is determined by the characteristics of the colliding beams. The realistic features of the scattered photon beam can be obtained by using specific Monte Carlo codes able to simulate the inverse scattering process, starting from the specifications of the laser pulses and the phase-space of the electron beam. As an example, Figure 2 shows the results obtained through CAIN simulation code [24,25] for the BriXS source [26], which is currently in the proposal stage (see below).
3.2. Inverse Compton Scattering Sources
Several research institutions and laboratories worldwide are operating or proposing scientific programs aimed at developing or commissioning X-ray sources based on ICS. Different types of architecture for the construction of these sources are considered, mainly using accelerated electrons from linear accelerators or storage ring, interacting with high-power pulsed lasers or lasers stored in Fabry-Perót cavities [27]. Also, all-optical sources, relying on the electron acceleration by means of lasers instead of conventional particle accelerator are being investigated [28]. These are interesting for very compact source implementation, but further significant technological development is required to achieve the performance necessary for radiography application.
Currently, in Europe, two user facilities are under commissioning: STAR (University of Calabria, Cosenza, Italy) [29,30] and ThomX (LAL, Orsay, France) [31]. Another facility is operational since 2015 at Technical University of Munich, Germany: the Munich Compact Light Source (MuCLS) [32,33]. Also, a source based on high-repetition rate energy-recovery superconductive linac was recently proposed in Italy [34,35]. In Table 1 a list of the main characteristics of the European (operating or proposed) ICS sources is reported.
Dual-Energy Imaging Implementation with Inverse Compton Scattering Sources
Dual-energy applications require a tunable average energy of the X-ray beam. To adjust the maximum energy of the X-ray emitted, Equation (6) shows that it is possible to act on three parameters: the electron energy, the laser wavelength, and the collision angle.
For a continuously tunable X-ray energy, the typical approach used on the existing ICS sources, is to adjust the electron energy. The time required to modify the electron energy and reach a stable and optimized working point may be of the order of tens of minutes or hours, which might be compatible with ex-vivo or test objects but is longer than that required in X-ray medical imaging.
An alternative approach was tested, by applying a filtration of the same material used as contrast agent. In this case, the X-ray energy of the source is not changed, but the energy distribution extends below and above the K-edge energy. The insertion of a filter containing the same material used as contrast agent absorbs the part of the spectrum above the K-edge and shifts the mean energy of the remaining spectrum to lower energies. A dedicated algorithm of reconstruction is then applied to retrieve the contrast image [37,38].
Other solutions, such as that proposed for BriXS source, could allow the switch between two X-ray beams, with two different mean energies, in a short time (≤100 ms), opening the way to in vivo imaging applications. In this case, the electron beam can interact with two laser beams with the same wavelength, but at two different collision angles [39,40]. The switch between the two energies can be made by changing the interaction laser. Furthermore, with this configuration, the laser beams can simultaneously interact, resulting in an energy distribution peaked at two different energy values. This could be used for a single-shot KES imaging, provided that a detector with energy discrimination capabilities and suitable energy resolution will become available.
3.3. K-Edge Subtraction Imaging with Inverse Compton Sources
In recent years, several preliminary experiments for a proof of principle of ICS sources, including radiographic imaging, were carried out by various research groups [33,41,42,43].
Experiments on X-ray imaging with ICS sources involving contrast agents with (quasi-) monochromatic beam at an energy above the K-edge were reported [44,45,46,47], as well as, subtraction imaging with quasi-monochromatic beam and subsequent added filtration of the same material used as contrast medium [37,38]. Nonetheless, dual-energy KES experiments with ICS have never been reported so far, due to the lack of an effective implementation of a fast dual-energy switch, which might become possible in the future with newly proposed ICS source facilities [35].
Even if synchrotrons still provide the most intense and monochromatic X-ray beams, ICS sources present some advantages. First, size of the accelerator, shielding, operational cost and dedicated staff are significantly reduced. Indeed, with an ICS source the electron energy required to produce X-rays with energy of interest for medical imaging (10–100 keV) is about two orders of magnitude less than that required by using a typical synchrotron insertion device (1–10 GeV). Furthermore, the quasi-monochromatic X-rays (bandwidth 1–10%) emitted by an ICS have a larger divergence with respect to synchrotron radiation (a few mrad against hundreds of microrad). As a consequence, irradiation fields with a size of the order of 10 × 10 cm can be obtained at a distance from the interaction point below 50 m. This feature is very important in most of medical imaging applications, where a broad and uniform two-dimensional irradiation field allows acquiring radiographs without scanning the patient or the beam.
The peculiar correlation between energy and angle of the emission implies that, for an imaging application requiring narrow energy bandwidths, there is a trade-off between energy spread of the beam on one side and the beam fluence on the other side. A small acceptance angle reduces the energy spread of the X-ray beam. Conversely, a large acceptance angle leads to wide irradiation fields at shorter distances from the IP and then more photons per unit area available for imaging.
Even if X-ray beams with a relative bandwidth of a few percent can be considered to be monochromatic in most of the medical imaging applications, this is not the case of KES imaging. In fact, it is important to evaluate the possible overlap of the two energy spectra bracketing the K-edge of the contrast medium and the contribution of the fraction of each spectrum that crosses the K-edge. Furthermore, the spatial variation of the mean energy, local energy spread and beam intensity must be taken into account.
All these issues were addressed in our work as described in the following sections, where we discuss the potential of the KES method applied to specific medical imaging tasks, using X-rays emitted from an ICS source. In particular, we focused on mammography and coronary angiography, since they are among the examinations that most benefit from the application of the KES technique to suppress the anatomical background and enhance the blood vessels perfused with a contrast agent [6], which in our case is iodine.
4. Materials and Methods
In order to investigate the potential of CEDEM and KES coronary angiography performed with inverse Compton X-rays, we adopted an analytical approach. In particular, we developed a simulation tool that allowed us to identify the best irradiation conditions and estimate the performance of the KES algorithm in the two considered case studies. The code was implemented in Matlab language [48] to simulate the irradiation of mathematical phantoms with significant features for the imaging tasks under analysis. The code manages 2.5D voxelized phantoms, which can encompass a variety of materials. Namely, the thickness of the voxels is equal to the phantom thickness and the phantom composition is set by simply defining a series of matrices with the mass thickness distribution of each material. X-rays impinge normally on the surface of the phantom and their energy spectrum can be of various types. Indeed, it is possible to consider monochromatic or Gaussian spectra and it is also possible to import a general spectrum from a text file. The latter option can be exploited to import the spectra obtained through specific Monte Carlo simulations of the ICS process. In addition, a custom function conceived to approximate a realistic ICS spectrum can be used. X-ray spectra are normalized with respect to the total integrated area. The desired number of photons per spectrum is introduced by simply multiplying it to normalized spectra. The developed code implements the Lambert–Beer’s law adopting a discrete approach, namely the spectrum of impinging X-rays is binned and for each bin the exponential attenuation of each voxel of the phantom is calculated. The statistical nature of the considered processes is taken into account by considering the number of impinging photons and the number of unabsorbed photons as random variables distributed according to Poisson’s law. Matlab computing environment was chosen mainly for its ease and efficiency in handling matrices and multidimensional arrays. We maintained our analysis as simple as possible, neglecting a series of effects of secondary importance for our purpose, namely assessing the potential of the KES method performed with inverse Compton X-rays. In particular, the code manages parallel beams and neglects scatter. Indeed, each photon interacting with the phantom is assumed to be removed from the transmitted beam, since it could be absorbed within the phantom itself or could be scattered away from the detector. The latter is assumed to be an ideal photon-counting sensor positioned at a distance from the phantom sufficient to reduce the scatter contribution, but not big enough to produce significant magnification effects. For this reason, there is a trivial correspondence between the pixels of the detector and the voxels of the phantom.
4.1. Phantoms
The features of the phantoms used in our study are reported in Table 2. The transversal (with respect to X-rays direction) size of the phantom itself, the iodinated details and the bone structures are indicated as , , and , respectively, while , , and indicate the thickness of soft and bone tissue details, respectively. All the variables were chosen accordingly to typical sizes of the structures they represent. Density and atomic composition of the considered materials were taken from ICRU report 46 [49]. The mass attenuation coefficients were calculated through a weighted combination of the atomic attenuation coefficients extracted from available database [50,51]. The phantoms suitable for the CEDEM encompass only two materials, namely the iodine solution for the details to detect and the soft tissue for the anatomical background. Indeed, the tissues actually present in a breast are characterized by very similar elemental compositions, densities and effective atomic numbers. Thus, we made the assumption that all these tissues can be replaced by a single soft tissue with average features. The same concept holds also for coronary angiography. However, this case requires the definition of a third material, i.e., the bone, to take into account the rib cage attenuation.
4.2. X-Ray Beams
Regarding the X-ray beams impinging of the phantom, Gaussian spectra can be easily generated and handled, thus they represent a good first approximation of ICS spectra, especially for beams with small energy bandwidth. However, a more accurate approach requires to take into account the asymmetry of an ICS spectrum (see Figure 2b). For this purpose, we introduced the following function
where and are two fitting parameters. This function, obtained by connecting a Gaussian with a logistic function, permits to easily control peak, bandwidth and shape of the spectrum. Thus, it is very useful for carrying out a systematic analysis. However, it is important to point out that function is conceived to approximate ICS spectra with narrow bandwidth (up to 5% RMS).
Table 3 reports the features of some X-ray energy spectra obtained with this approach and used in our study. The parameters and were determined by fitting the spectra obtained with CAIN simulation code for BriXS source [26]. As an example, Figure 3 shows the spectra used in the mammography case. The spectra bracket the iodine K-edge and feature the same relative bandwidth (3% RMS) and integral (1.0). For this reason, the high energy (HE beam), with a mean energy above the K-edge, has a slightly lower peak and larger spread than the low energy beam (LE beam), with a mean energy below the iodine K-edge.
A further step toward the simulation of more realistic ICS beams consists in taking into account the spatial variation of the mean energy, the local energy spread and the intensity as a function of the emission angle and thus the impact point of X-rays on the phantom. In order to have tools which are easy to handle, we parameterized the variation of mean energy , relative local bandwidth and intensity as follows
In our code, these functions are evaluated for each voxel, which is identified through the angle . The corresponding impinging spectrum is then calculated through Equation (7) by setting and the parameters and so as to obtain a peak with a relative bandwidth equal to . It is worth noting that, Equation (8) is a simplified form of Equation (6) and corresponds to the collimation angle of the source. In particular, , , , , and depend on the particular ICS spectrum considered. In turn, the features of an ICS spectrum are all interconnected and strongly depend on the colliding beams, as explained in the previous section. In our case, we used = 84.15, = 0.015, = 10.0 rad, = 0.3, and = 0.0028 rad. The choice of these specific values was made using BriXS colliding beams as a reference. For other ICS sources, these set of parameters might be still a good starting point, but a fine tuning is necessary to better adapt the resulting spectra to each actual case. A simplified approach consists in considering the variation of the mean beam energy with the emission angle only and neglecting the variation of the beam intensity and the local energy spread ( = 0, = 0). The factor (electron energy) varies very little from a source to another. The acceptance angle to obtain a given bandwidth of the beam () and the number of photons emitted per second within a solid angle with an aperture equal to can be calculated through the analytical expressions reported in the literature [52]. From the value of and the size of the phantom, it is possible to calculate the required source-to-phantom distance and the impinging photon flux.
4.3. Figures of Merit
By irradiating the phantom with two beams bracketing the contrast medium K-edge and applying the KES algorithm, the contrast and the tissue images can be simulated with our code. In the case of polychromatic beams, the mean values of the energy spectra are used to calculate the mass attenuation coefficients and insert them in the KES equations, while variables are evaluated taking into account the actual spectral distribution of the impinging beams. A spurious component could affect the reconstructed mass thickness of the iodinated structures, due to the water present in the iodinated solution, which represents indeed a third material apart from iodine and soft tissue [53]. This contribution can be extracted from regions of the contrast image characterized by background structures only. An important figure of merit is indeed the signal S, defined as
where and are the mass thicknesses evaluated in the iodinated detail and background region of the contrast image, respectively. Another important figure of merit is the signal-to-noise ratio () defined as the ratio between the signal and the noise of the image , namely
, can be calculated analytically or can be derived from the simulated contrast image of a suitable phantom. In the latter case, the mean value of the mass thickness in the iodinated detail of interest is taken as , while is obtained by sampling many times the mass thickness in background regions with the same size of the detail and taking the mean value. The standard deviation of these samples is .
The noise of the image can be also evaluated analytically for monochromatic X-rays, assuming that the only contribution to signal fluctuations is due to Poisson statistics. In fact, by propagating the error in Equation (2), the noise per pixel results
where the counts on the background pixel can be calculated as
and indicate the linear attenuation coefficient and the thickness of a material, respectively. The notation is used to indicate in a concise way that the sum extends to all materials but the contrast medium (). In the case of polychromatic beams, Equations (13) and (14) can be still used considering the mean value of the energy spectra. The resulting error is negligible for beams with narrow bandwidth (up to 10%), since the attenuation coefficients of background materials changes very little. Actually, is the mean value of a random variable. If we sample n times the mass thickness value in a background region and take the standard deviation, we obtain a value that tends to . This operation is equivalent to calculate the noise of the image in regions encompassing n voxels as describe before. Therefore,
thus, the signal-to-noise ratio can be expressed as
where is the signal-to-noise ratio per pixel. Equations (13) and (16) provide a simple but effective approximate method for estimating important figures of merit of the contrast image. We used them in the initial phase of our investigation; however the direct statistical analysis of the simulated contrast image is a more accurate approach and the results reported in next section were obtained following this method.
5. Results
In order to select the features of the ICS beams that best fit the requirements of the analysed imaging tasks, we first focused on CEDEM, which is the simplest case since it involves phantoms composed of two materials only. Conversely, coronary angiography is a more complicated task to face, due to the presence of the bone. Indeed, the signal of the bone competes with the signal of the small blood vessels perfused with the contrast medium. Furthermore, coronary angiography is much more demanding in terms of X-ray beam intensities, due to the significant attenuation of surrounding tissues in the chest [54]. A careful setting of the ICS X-ray beams is mandatory to obtain a correct reconstruction of the mass thickness of the iodinated structures, a sufficient in the contrast image and a good rejection of the bone signal (coronary angiography). In this section, we show the simulated images and the relative figures of merit as a function of the bandwidth and the peak energy of the two beams bracketing the iodine K-edge.
5.1. Contrast-Enhanced Dual-Energy Mammography (CEDEM)
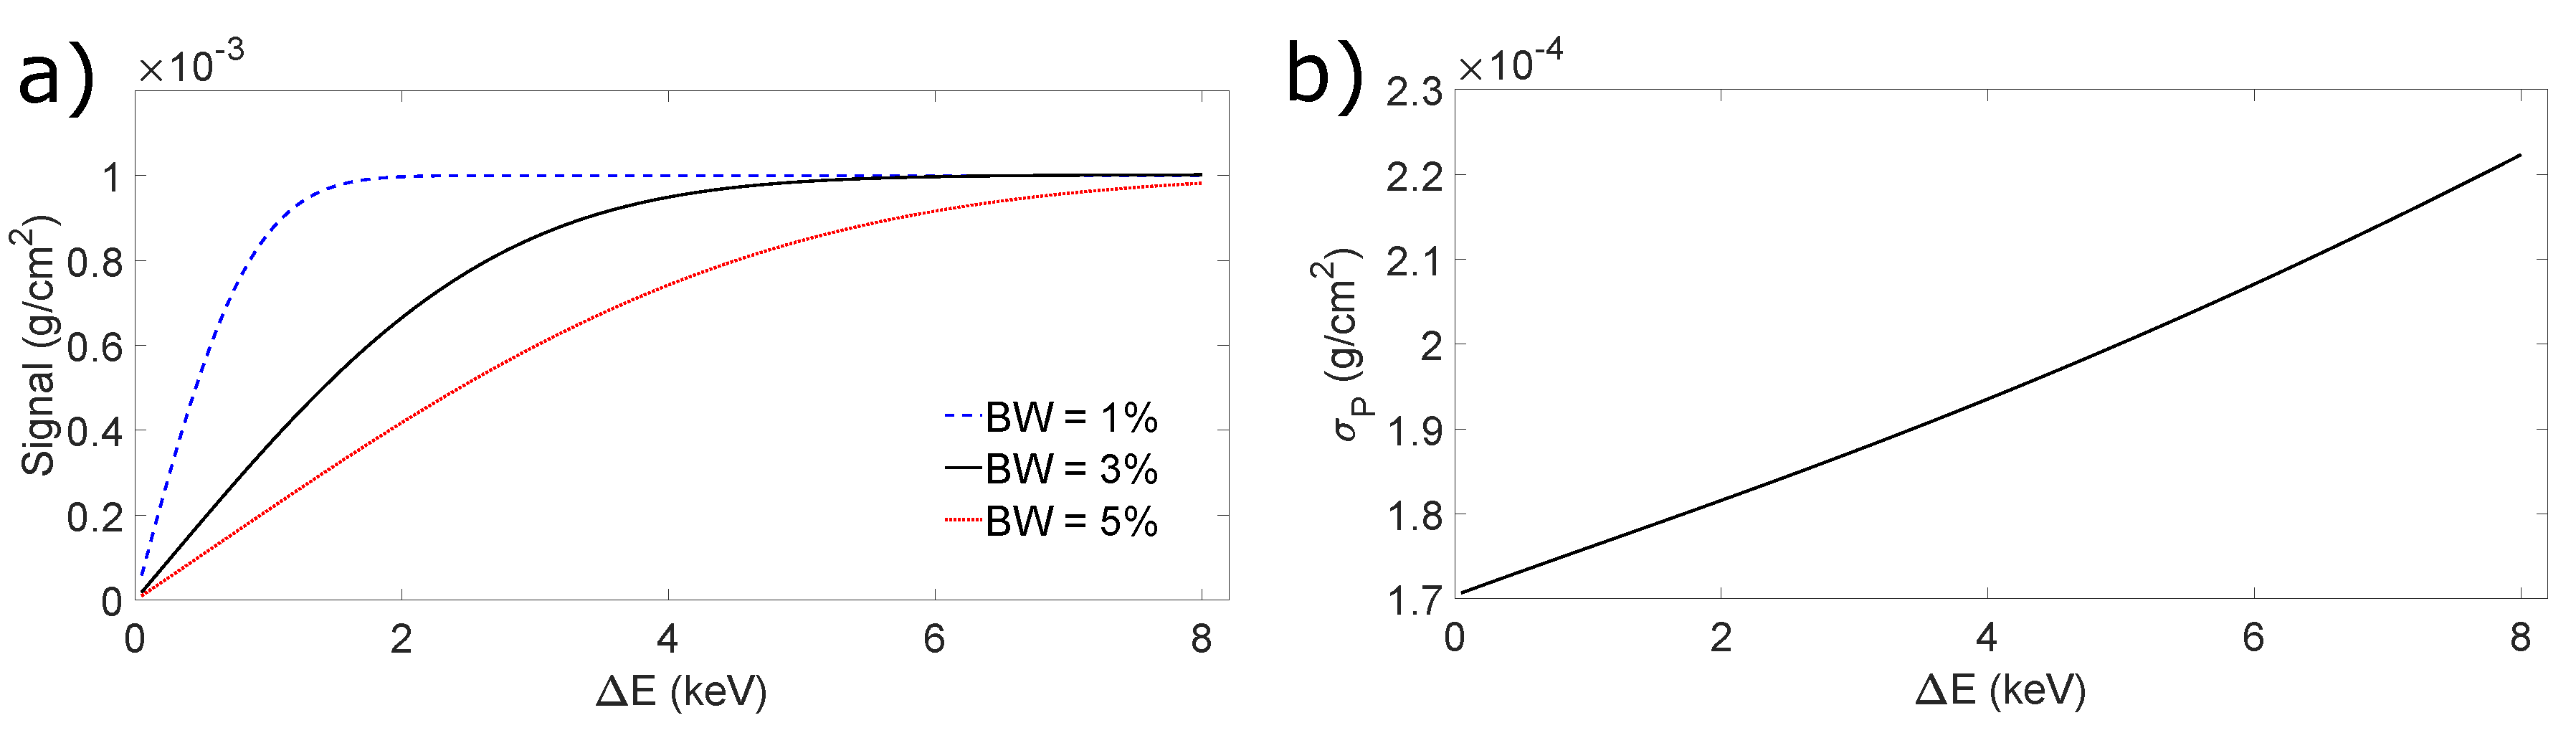
As previously pointed out, when dealing with the X-rays emitted from an ICS source, it is desirable to set a wide collimation angle, in order to maximize the beam intensity and the size of the radiation field at a given distance from the interaction point, but this leads also to a larger energy bandwidth. As shown in Figure 4a, if the bandwidth of the photon beams increases, the separation between the two peaks has to be increased in order to correctly estimate the contrast medium signal with the KES technique. For a given value of , that is symmetric with respect to the contrast medium K-edge, a better estimation of the signal is instead obtained by choosing beams with narrow bandwidth. This effect is due to the overlap of the two spectra, namely due to the fact that even if there are photons with energy higher (lower) than the K-edge in the LE (HE) image, they are treated as their energy was lower (higher), since we simply apply the KES algorithm using the mean energy of the X-ray beams. One might think then to keep the beams well separated by setting, for instance, = 8 keV to increase the relative energy bandwidth up to 5% RMS. Unfortunately, the noise in the contrast image increases monotonically if the peak separation increases. This effect is shown is Figure 4b, which reports the results of a calculation carried out using Equations (13) and (14), where = 4.5 .
The effects described above were obtained with Gaussian beams, but they hold true also for ICS beams. However, ICS spectra feature a peculiar asymmetric shape with a rapid fall-off at energies higher than the peak value and a longer tail at lower energies. This suggests that a symmetric separation of the peaks with respect to the contrast medium K-edge may not be the optimal choice. As a consequence, the most appropriate approach to identify the most convenient irradiation conditions consists in setting a-priori a desired bandwidth and calculating the figures of merit, in particular the , for different couples of peak energies (, ). Figure 5 shows the values of the signal-to-noise ratio per pixel for a iodinated detail irradiated with the ICS beams whose specifications are listed in Table 3. In particular, we considered a bandwidth of 3% RMS, which is small enough to not cause significant distortions in the signal reconstruction and at the same time is wide enough to have a maximum beam divergence that guarantees a sufficient beam intensity and radiation field.
Such figure suggests that the couple of beams with the peak energy of 32 keV and 36 keV, respectively, is an optimal choice to maximize the signal-to-noise ratio of the details. As expected, the optimal peak energies are not equally spaced with respect to iodine K-edge. In particular, the HE spectrum is more distant, to avoid that its tail crosses the K-edge.
Here, we reported the case of a detail with a thickness of 5 mm filled with 2 mg mL of iodine, namely a single value of mass thickness. For different mass thicknesses, the figures of merit change, in particular the signal scales linearly with both and . Nonetheless, the optimal couple of peak energies does not depend on these variables. The same concept holds true also for the detail transversal size (number of pixel n) and the number of impinging photons (). Indeed, the of a given detail scales with the square root of both n and ; however the optimal couple of peak energies does not change.
Once we defined the bandwidth and the peak value of the ICS spectra, we simulated the irradiation of a phantom with the significant features in a CEDEM examination, namely details of various size embedded in bulk of variable thickness to simulate the anatomical background. The mean thickness of the bulk was set to 5 cm as in the previous calculations, while the thickness fluctuation was obtained by subdividing the bulk in horizontal (x) stripes with random vertical (y) size and thickness (t). The features of the phantom are reported in Table 2, where the number after the symbol ± in the column indicates the standard deviation of the random variables used to simulate the anatomical background. We considered 9 details placed as a 3 by 3 matrix. The details share the same thickness in the horizontal direction and the same transversal size in the vertical one. Each detail represents the vascular bed of a small tumoral mass.
To make our simulation more realistic, we considered the spatial variation of the mean energy, the local bandwidth and the beam intensity, as described in Section 4.2. Since the divergence angle was = 2.8 mrad, the source-to-phantom distance was set to 20.2 m to irradiate the whole phantom. We simulated 5 photons, namely a fluence of about 5 ph mm impinging on the phantom subdivided in voxels with a transversal size of 300 × 300 m. Therefore, the mean number of photons per voxel was 4.5 , as in the previous calculations. By using the normalized glandular dose coefficients calculated by Boone [55], it is possible to calculate that the considered fluence (LE + HE exposure) would correspond to a mean glandular dose (MGD) of 0.5 mGy in a 5 cm-thick breast with a glaundularity of 50%.
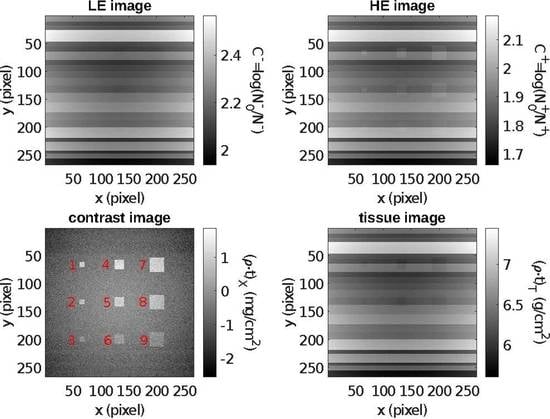
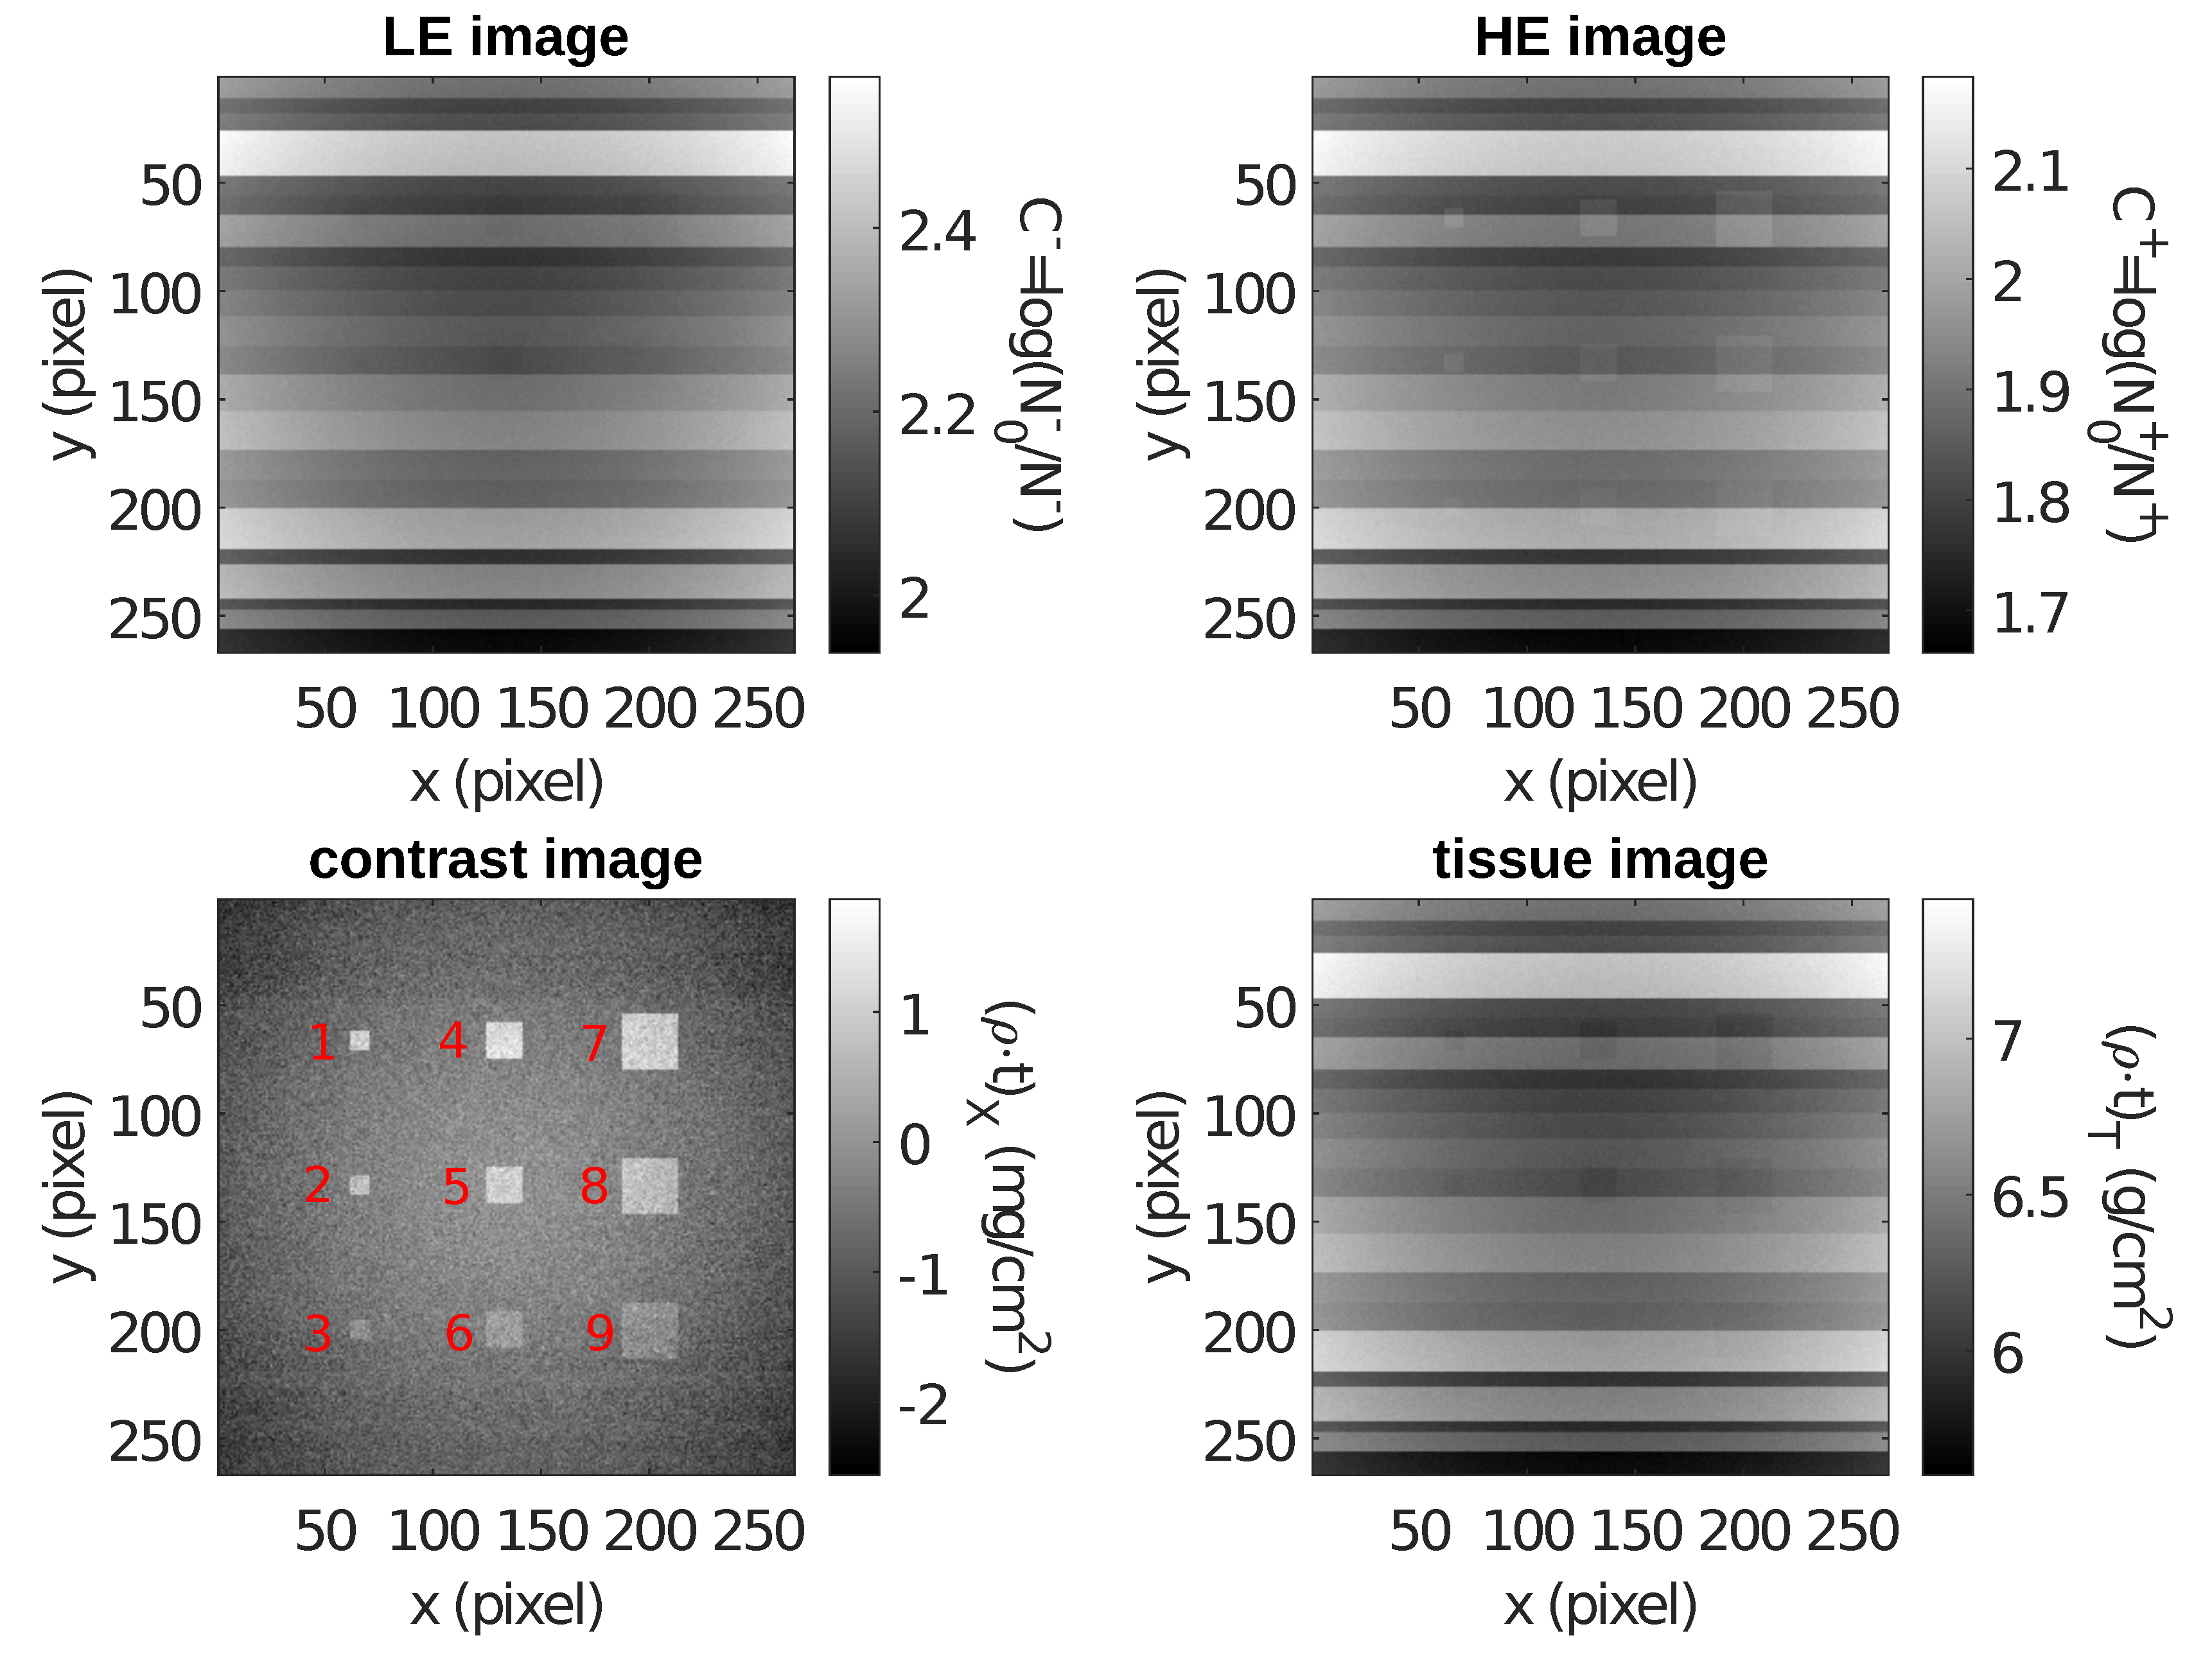
Figure 6 shows the image obtained irradiating the phantom with the beam peaking at 32 keV (LE image), the one obtained with the beam peaking at 36 keV (HE image), the contrast image and the tissue image. In the LE image none of the details is visible. In the HE image, the details of larger size are visible, while the detectability of smaller details is limited by the striped structure, namely the random thickness of the soft tissue bulk. The structure mimicking the anatomical background is present in the tissue image but disappears in the contrast image, which shows the iodinated structures only, even if the noise is higher than the LE and HE images.
Table 4 reports the figures of merit calculated for the contrast image. The mass thickness value reconstructed from the contrast image is, in general, affected by the mean energy and the bandwidth of the two X-ray beams. Negative values of reconstructed mass thickness could be obtained for thinner iodinated details or in the background, as described in [53]. For ICS beams, the mean energy and the local energy spread vary as a function of the emission angle, hence pixel-by-pixel in the image. Conversely, the energies used for the reconstruction are fixed. As a consequence, the iodine mass thickness reconstruction for pixels that are more distant from the centre of the image is less accurate. This explains the values of and reported in Table 4. Nonetheless, the signal is in good agreement (within 10%) with the actual iodine mass thickness of each detail. Moreover, the values of confirm the expectation, i.e., larger details feature higher values of .
5.2. Coronary Angiography
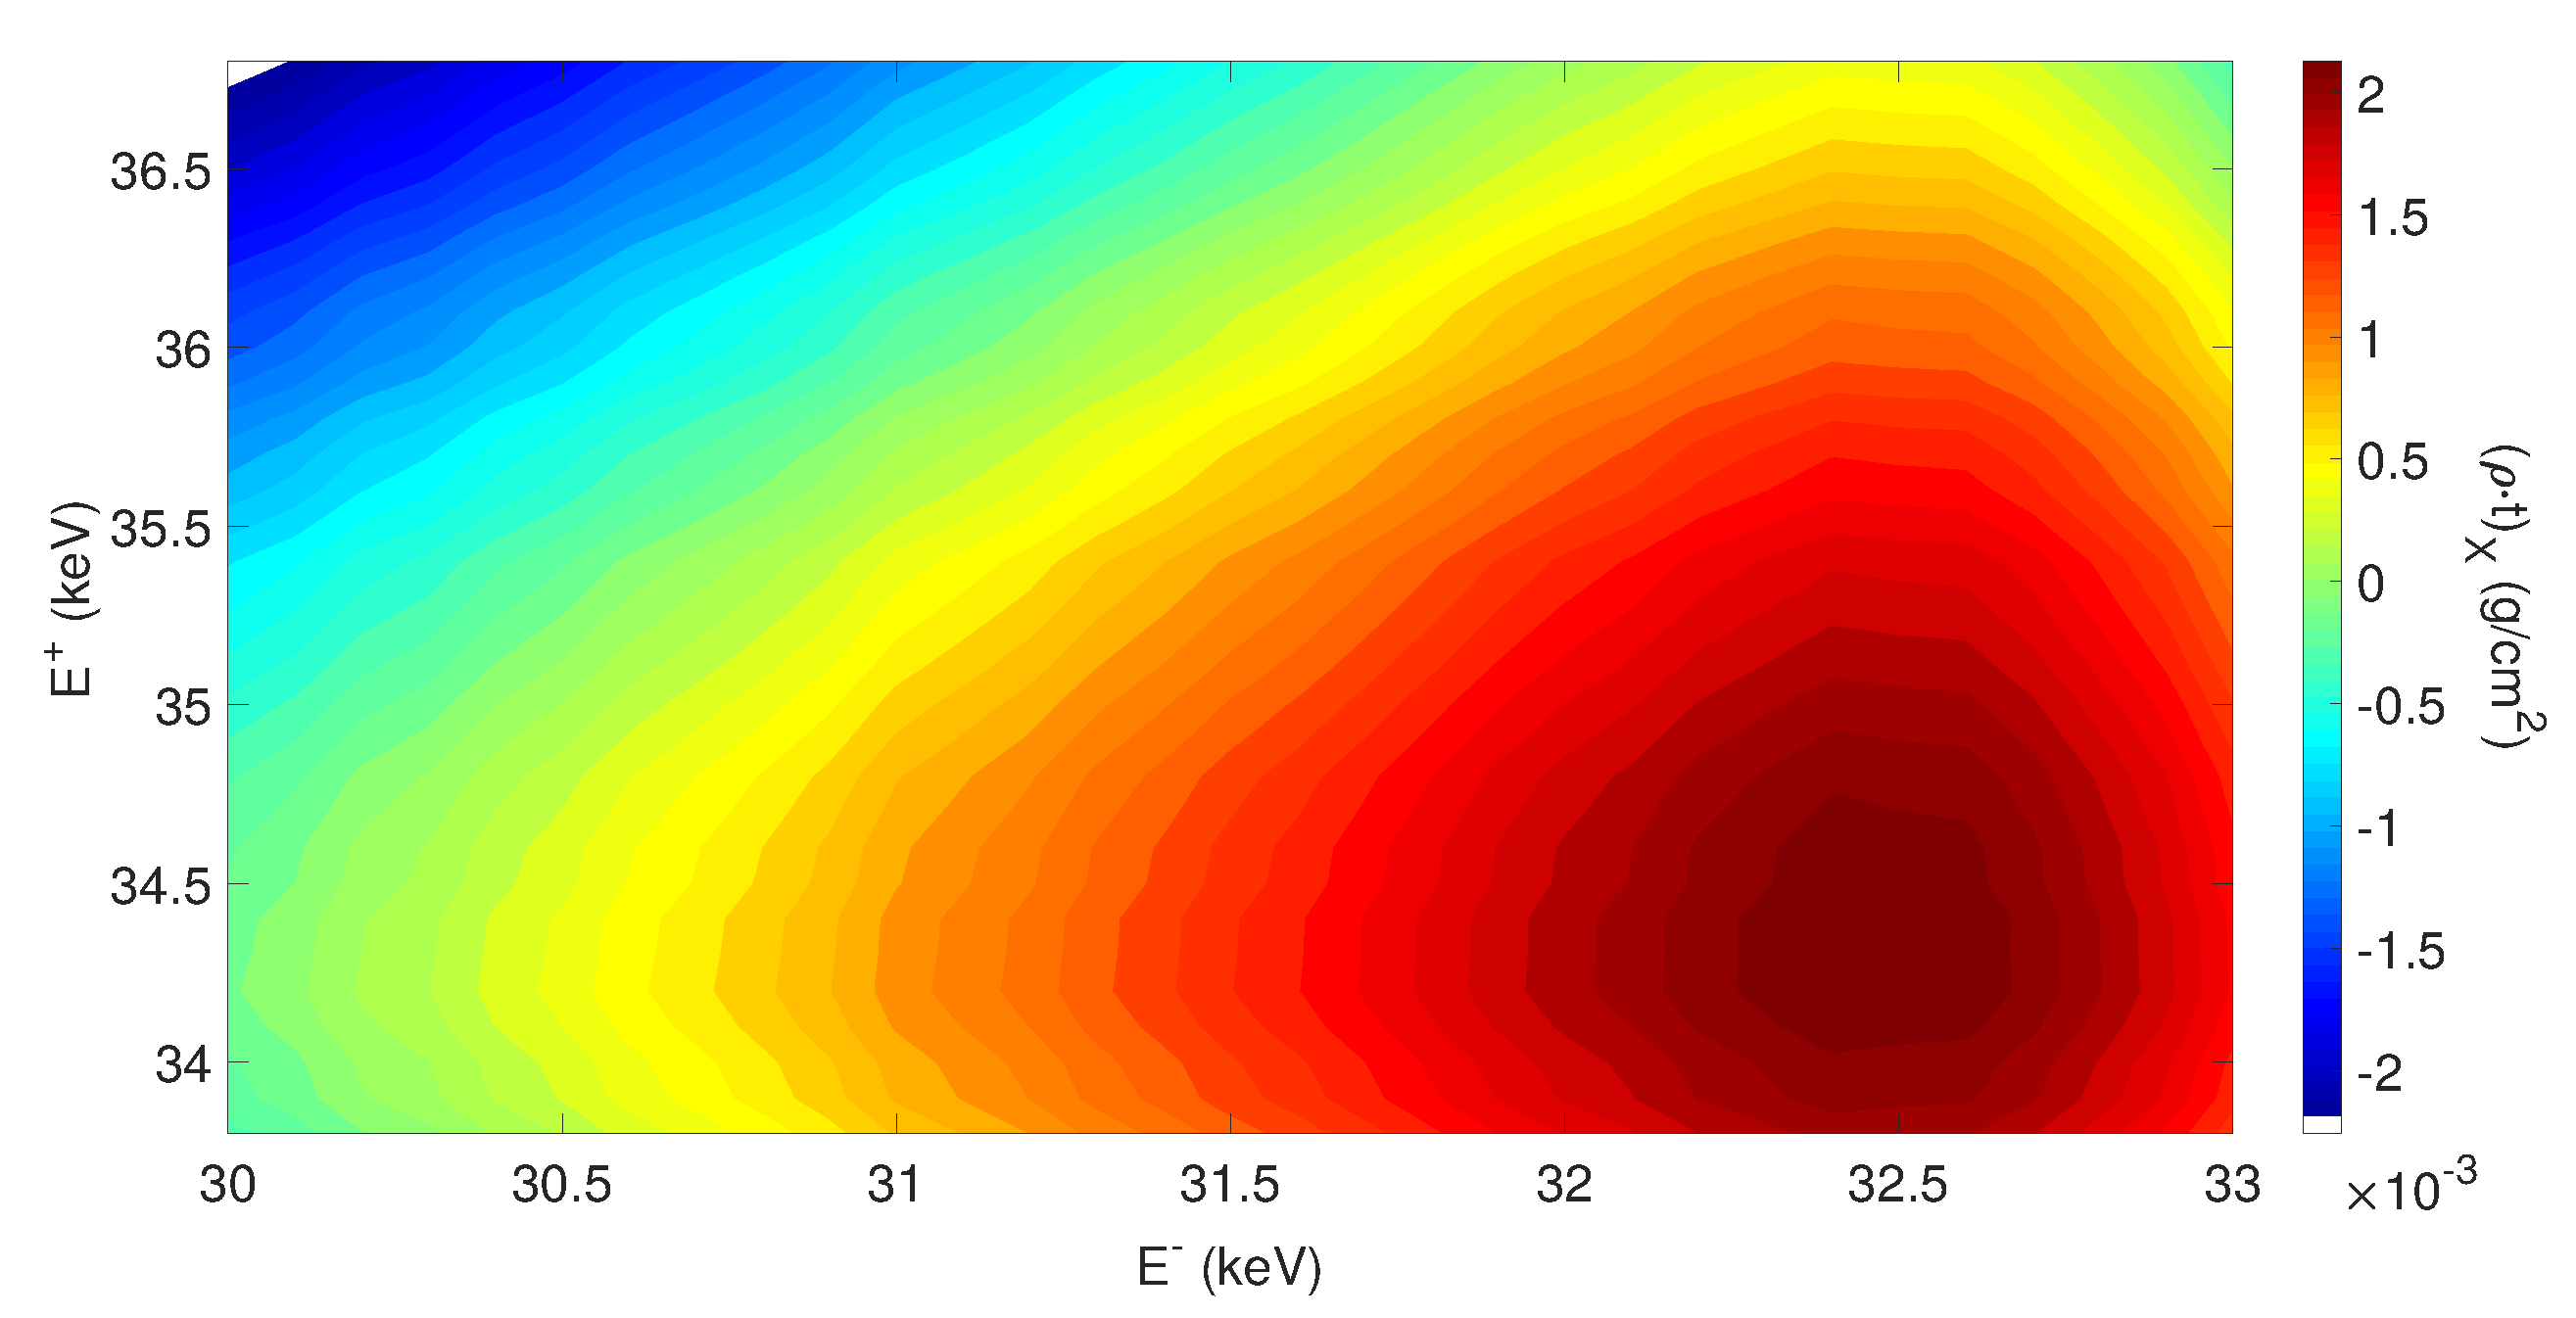
In the case of coronary angiography, the presence of the bone and the goal of minimizing its visibility in the contrast image impose to follow a slightly different approach than the case of mammography. Since the contrast image will encompass regions where the vessels filled of iodinated solution cross the bone structures and regions where they do not, a more appropriate figure of merit to consider for the selection of the optimal couple of peak energies is the mass thickness of the reconstructed detail . Figure 7 shows the values of for a vessel irradiated with the ICS beams whose specifications are listed in Table 3. The vessel thickness was 5 mm and the iodine concentration was 10 mg mL, thus the actual value of mass thickness of the detail was 5 g cm. However, through the application of the KES method for monochromatic beams with a two-material basis, the reconstructed values of are significantly smaller than the expected one due to the masking effect of the third material. Indeed, the spurious term due to the bone in Equation (5) is negative in the energy range of interest and its absolute value increases with . For high values of , this term can overcome the contribution of the iodine actually present in the detail so as that the estimated results negative.
Nonetheless, Figure 7 suggests that the optimal couple of peak energies is about = 32.5 keV and 34.5 keV. These energy values are closer to the iodine K-edge with respect to the previous case. This is consistent with the result obtained with monochromatic beams, which give best results when using energies as close as possible to the K-edge [6]. Obviously, it is not possible to fulfil this requirement when spectra with finite bandwidth are used, to avoid their overlap.
As in the previous case, once we defined the peak values of the ICS spectra, we simulated the irradiation of a proper phantom. The phantom was composed of 3 vessels of different diameter/thickness filled with contrast medium and embedded in a 20 cm-thick bulk of soft tissue. In the central region, the vessels crossed a slab of bone. Furthermore, 3 mm of the central vessel featured a 50% stenosis. The anatomical background was simulated as before. It is worth noting that the overall size of considered phantom is very small if compared to the actual chest region of interest for coronary angiography. The phantom size was limited to avoid to simulate an excessive number of photons. Indeed, we simulated 1.94 × 10 photons which led to a fluence of 1 ph mm on the phantom positioned at a distance of 8.8 m. The considered fluence (LE + HE exposure) leads to skin dose of about 1.3 mGy, evaluated according to Sarnelli et al. [16]. The nominal numbers of photons impinging per voxel (transversal size 300 × 300 m) was then 9.07 , namely about twice than the CEDEM case, where phantom attenuation was smaller. As in the CEDEM case, we considered the spatial variation of the features of the X-ray beams.
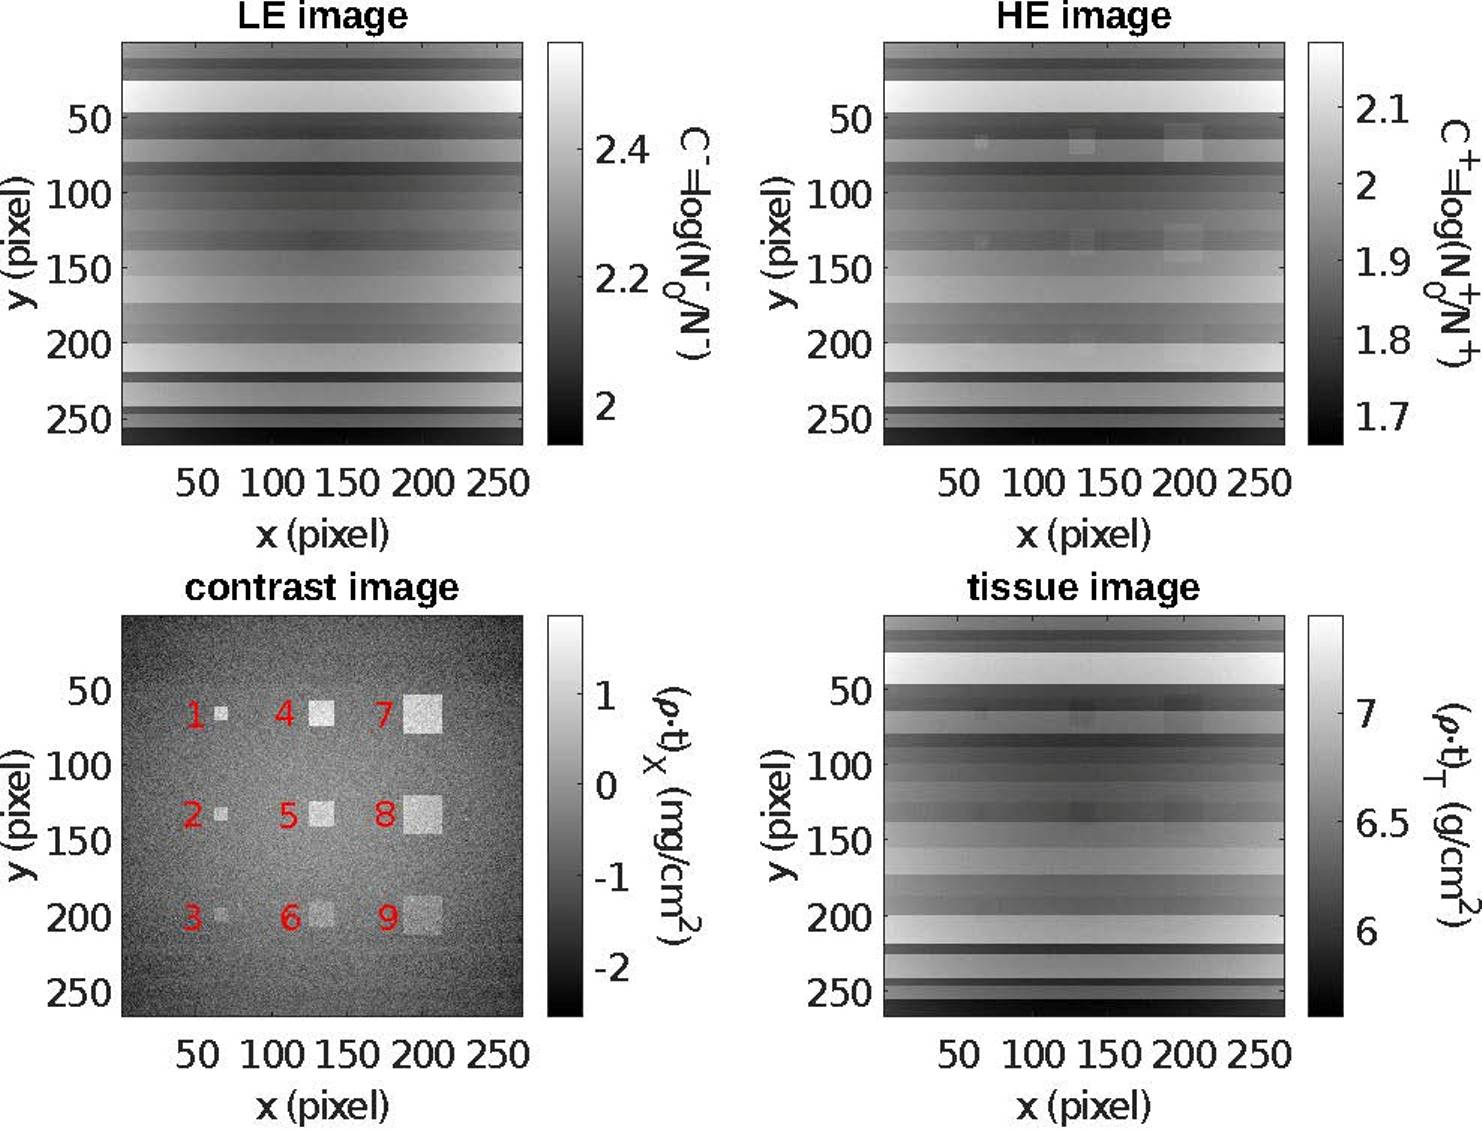
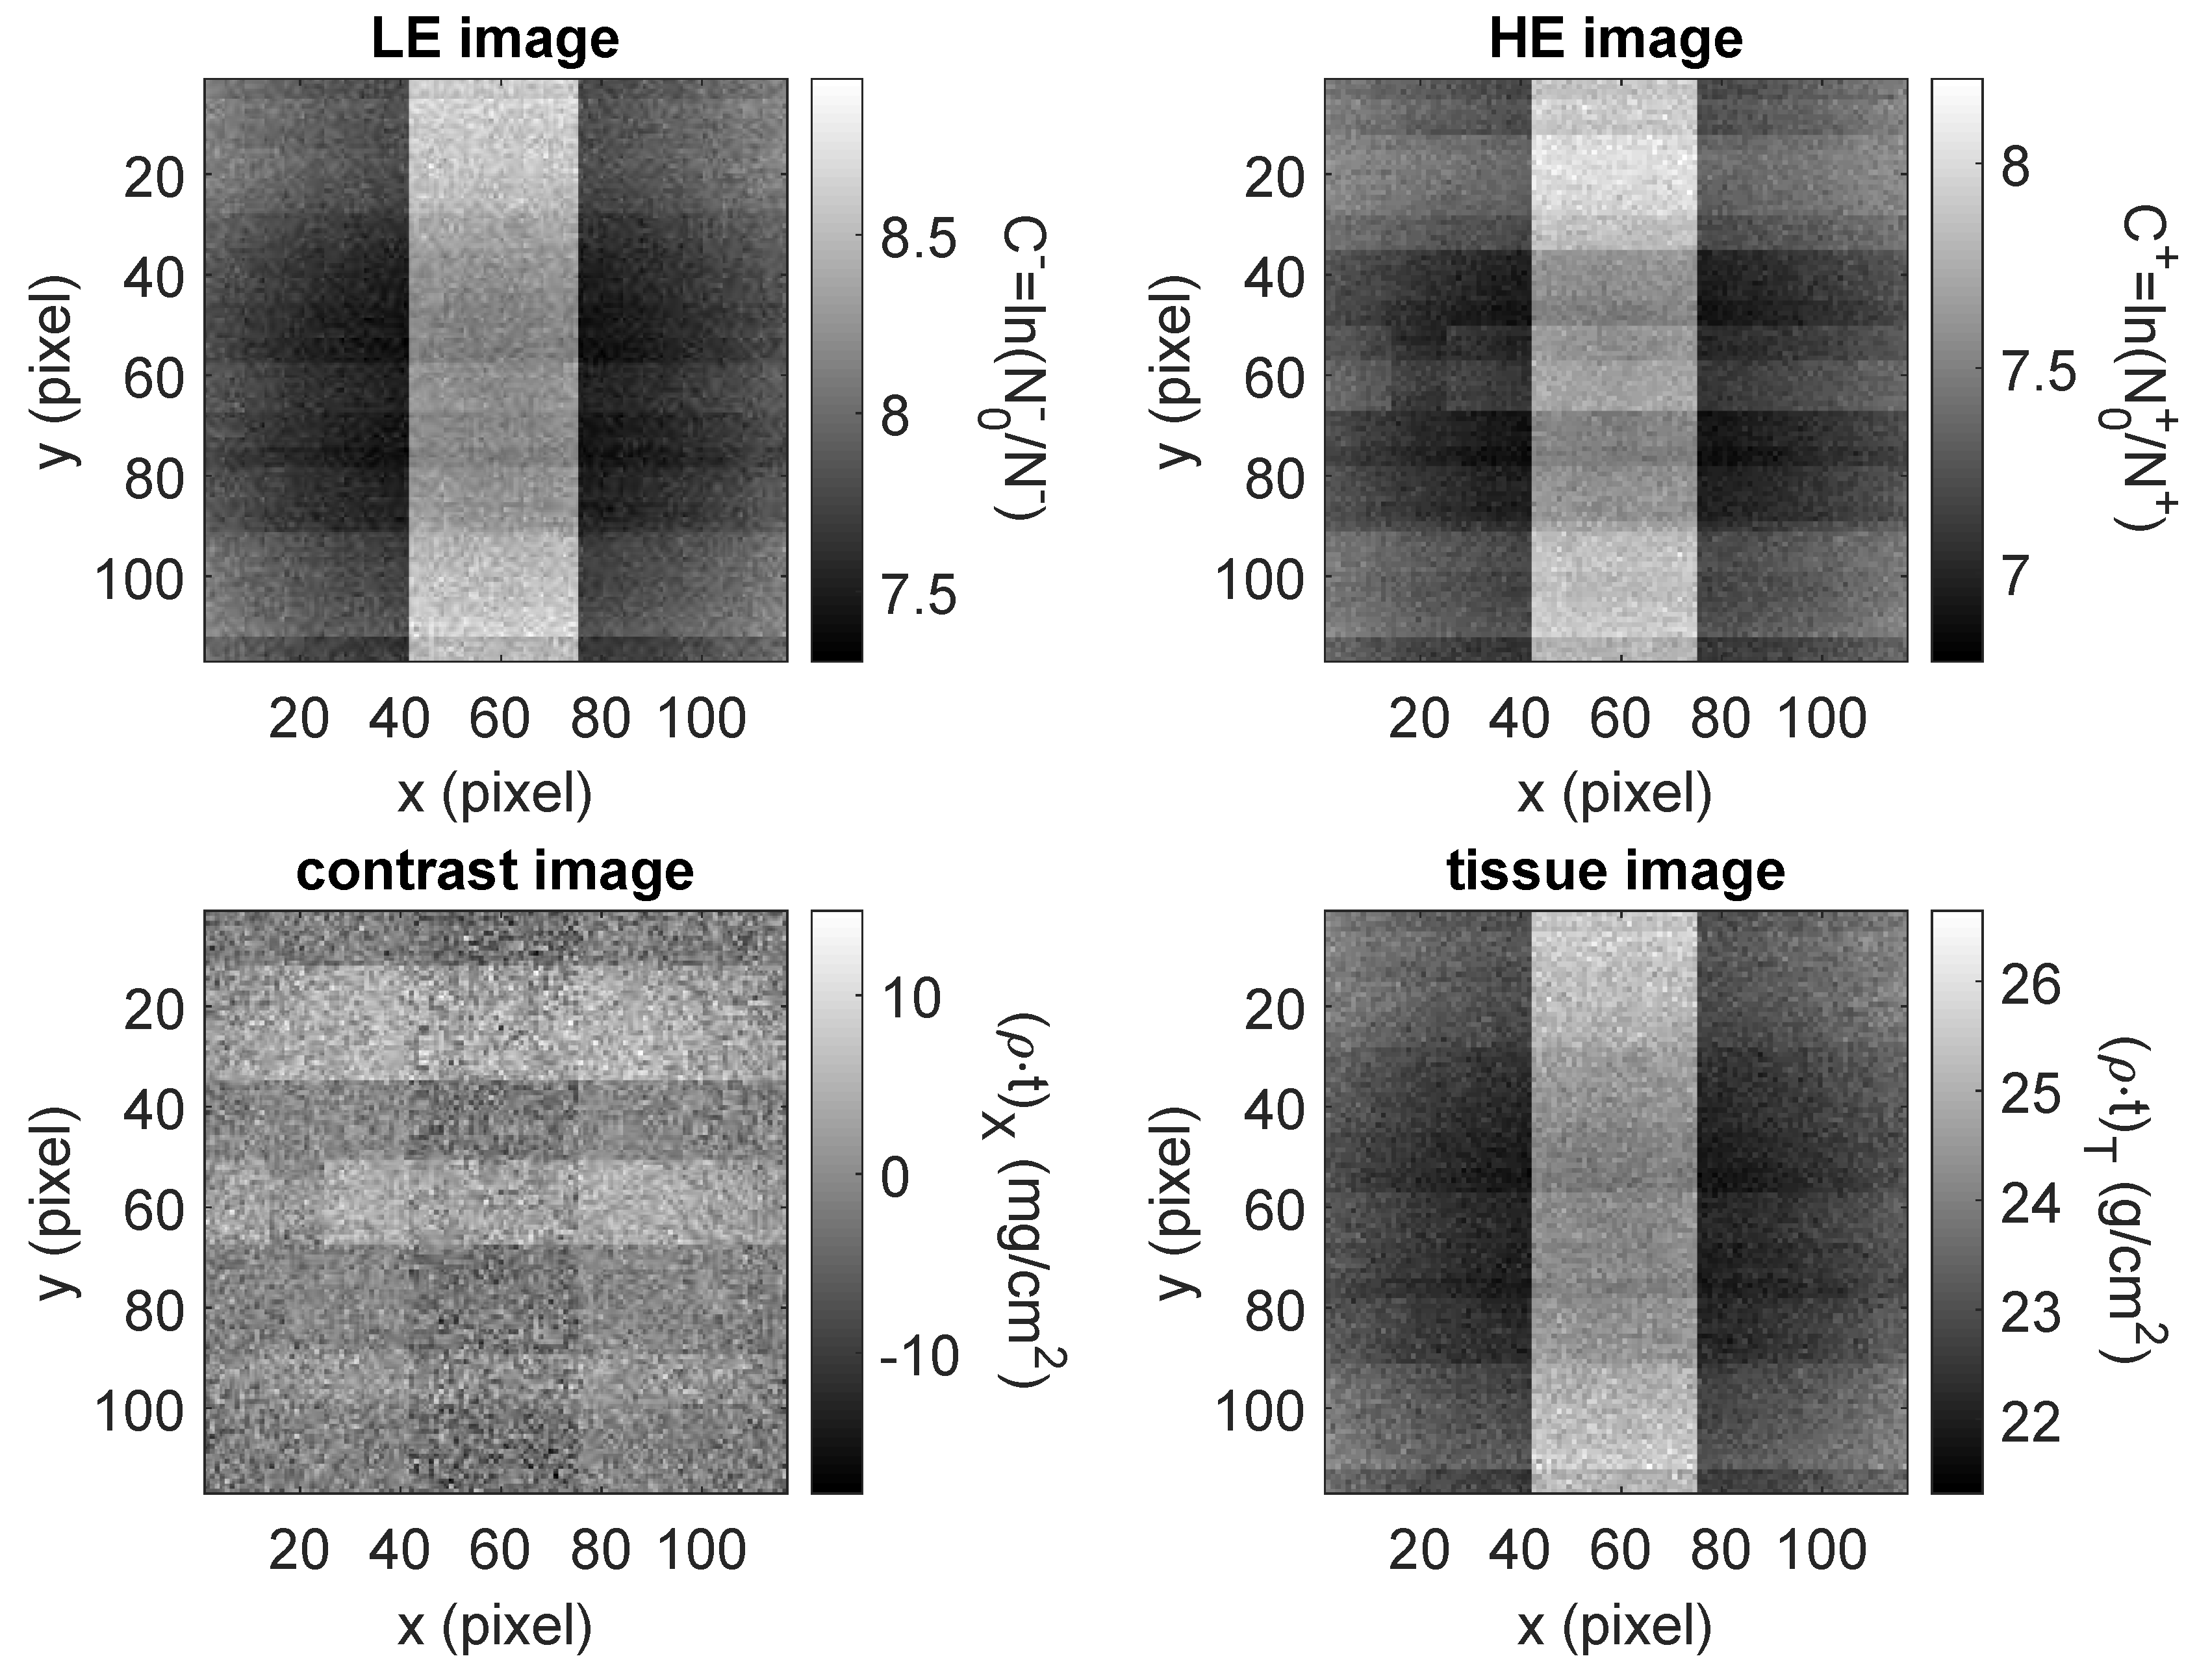
Figure 8 shows the simulated images, while Table 5 reports the figures of merit calculated on the contrast image. The strips used to account for anatomical background make difficult to discern the size of the vessels in the LE and HE images. Conversely, all the vessels are visible in the contrast image, even if the smaller vessel and the stenosis in the central one have a small at the considered fluence. Indeed, the contrast image is quite noisy and higher fluence values are required to enhance the visibility of the smaller details.
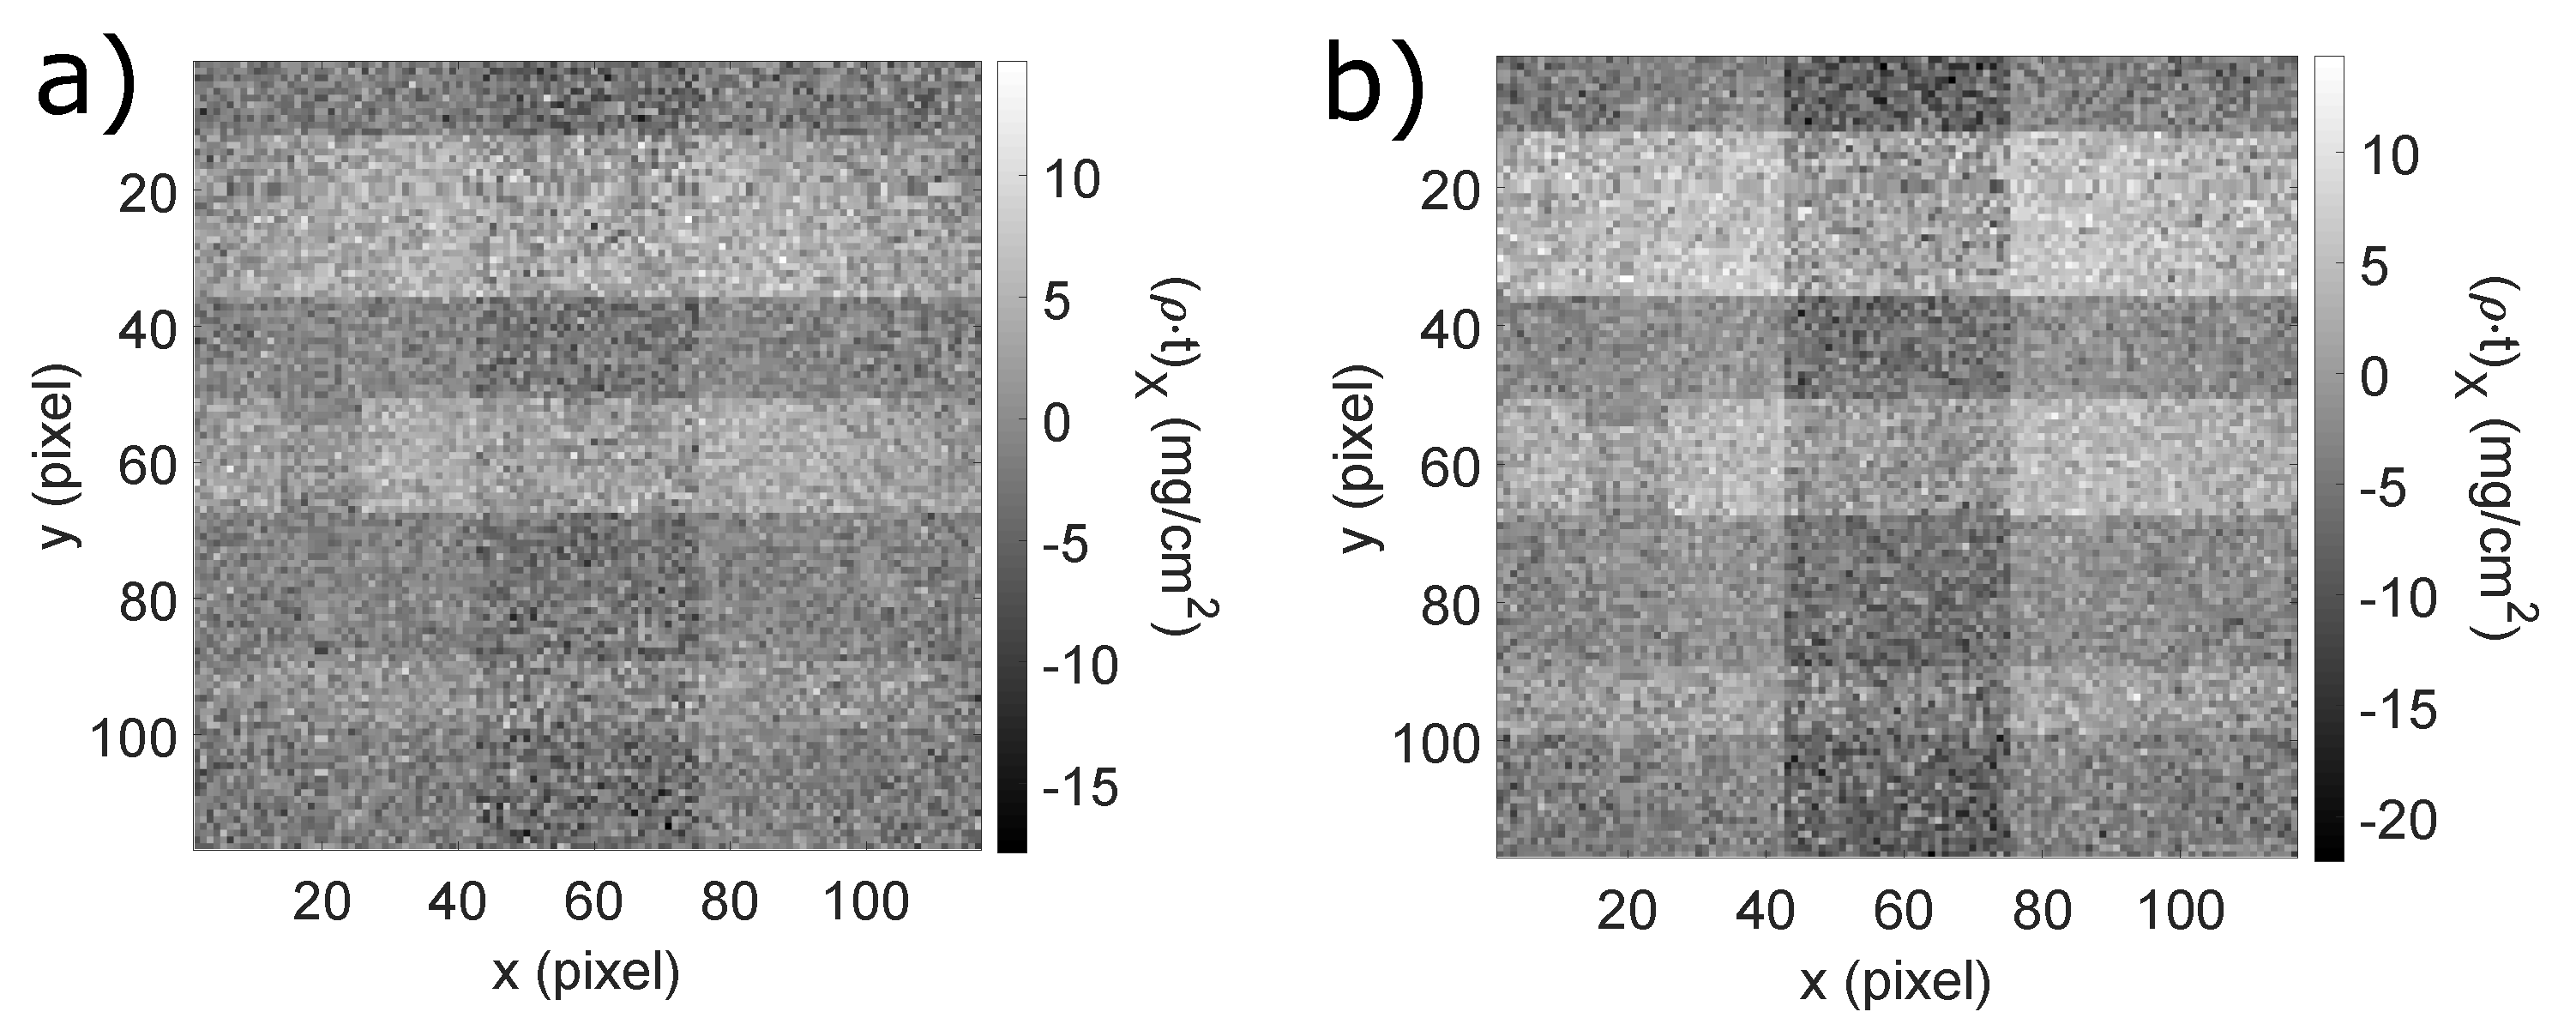
The values reported in Table 5 were obtained by considering a ROI with size proportional to the vessel diameter. The fluctuation in signal values related to the region of each vessel with or without the superposition of the bone are of statistical nature. Yet, the higher values of the noise in the region of the vessels with the superposition of the bone are consistent with the value calculated using Equation (15). Furthermore, the bigger the vessel the higher the , as expected. The vessel signal is reconstructed with an error of about 20% due to the choice of the peak energy of the X-ray beams. Better signal reconstruction could be obtained by increasing , but at the expense of an increased visibility of the bone. For the sake of comparison, we report the contrast images obtained with two different couples of spectra in Figure 9.
6. Discussion and Conclusions
In this paper, we discussed the possible application of innovative inverse Compton sources to dual-energy X-ray imaging. In particular, K-edge subtraction imaging was investigated and two specific imaging tasks were considered: contrast-enhanced dual-energy mammography and coronary angiography. The X-ray emission by ICS is not intrinsically monochromatic, i.e., the energy is related to the emission angle, hence, the beam divergence determines the bandwidth of the energy distribution. The beam divergence also determines the size and the profile of the irradiation field, as a function of the distance from the interaction point. In KES imaging, all these interlinked characteristics, namely energy distribution, size of irradiation field, spatial and energy distribution uniformity, affect the outcome of the image formation process. Various authors proposed in the past rigorous methods to calculate the characteristics of the X-rays resulting from an inverse Compton process [19,21,56,57]; however they require computationally intensive calculations. We carried out our investigation through a custom-made simulation tool. The use of an analytical simulation tool allowed us to take into account most of the peculiar features of ICS beams and to explore a wide range of parameters in order to identify the optimal irradiation conditions for the considered imaging tasks. This approach, even if is based on several approximations, is significantly more time-effective than particle tracking Monte Carlo codes, which can be used to obtain more accurate results, after the parameters choice is narrowed down. To our knowledge, this is the first time that such a systematic study is carried out. Indeed, other studies aimed at exploring the potential of ICS beams in KES imaging, both in mammography [58] and coronary angiography [37,38], were carried out experimentally at a fixed machine setup. These proof-of-principle studies demonstrate the general feasibility of KES imaging with ICS sources, but they considered only a limited number of configurations and the results regarding the coronary angiography were obtained with very high contrast medium concentrations if compared to the actual ones. Indeed, the contrast medium solution administered through intravenous injection dilutes in the patient body.
In our investigation, we considered realistic thicknesses and a concentration of contrast medium corresponding to mass thickness values actually measured in the blood vessels of human subjects for coronary angiography [59] and CEDEM [60]. The obtained results confirm the potential of KES imaging performed with inverse Compton X-rays. In CEDEM, a fluence of 5 ph mm allows reaching a of 19 even for small details (6.25 mm) with iodine mass thickness down to 0.5 mg cm. Furthermore, the optimal peak separation is about 4 keV, but good results can be still obtained at larger peak separations. Conversely, coronary angiography requires closer peaks, asymmetrically shifted with respect to the contrast medium K-edge. Also, the fluence of the beam impinging on the subject must be higher, since thicker and denser structures are involved. A fluence of about 1 ph mm is barely sufficient to image the smallest vessels considered here (2.5 mm diameter) with a contrast medium concentration of 10 mg mL. Higher values of fluence guarantee a better visibility of the smaller details with less contrast medium, as estimated in our previous work [54]. Our results are also compatible with past studies aimed at investigating the effects of energy separation [61] and energy spread [53] in KES imaging. In these works, monochromatic and Gaussian beams were used, respectively. The present work is then more comprehensive, since we considered asymmetrical ICS-like spectra with spatial variation of intensity, mean energy and local bandwidth. Nonetheless, we found that the reconstruction of the contrast medium signal and the of the details are not harmed due to the typical range of variation of these parameters.
The requirements to obtain images with good quality are within reach of most advanced ICS sources currently under commissioning or in a proposal stage. Thus, ICS sources are a promising compact alternative to synchrotron facilities for dual-energy KES imaging applications. In fact, the nature of ICS permits a significant reduction in the electron energy required to produce X-ray beams with the same average energies available at large synchrotron facilities at a fraction of the cost and size. The moderate divergence (a few mrads) of these beams allows to achieve a two-dimensional radiation field size compatible with imaging applications within a propagation distance below 50 m, so that images can be obtained without a linear scan of the beam. Also, the accessibility to higher emission energies with respect to synchrotron radiation opens the way to the investigation of KES imaging with contrast agents having a higher K-edge, such as Gadolinium (50.2 keV), which was proposed to reduce the imparted dose and for patients with severe iodine allergies or renal insufficiency [62,63,64]. Currently ICS sources are not table-top hence, translation from research to clinical application is not straightforward. Nonetheless, they represent a significant breakthrough to fill the gap between synchrotron facilities and laboratory-based conventional X-ray sources.
Author Contributions
Conceptualization, All authors; methodology, All authors; software, G.P.; formal analysis, G.P.; writing—original draft preparation, G.P., P.C.; writing—review and editing, All authors; visualization, G.P., P.C.; supervision, A.T. All authors have read and agreed to the published version of the manuscript.
Funding
This research received no external funding.
Acknowledgments
The authors would like to thank Luca Serafini, Vittoria Petrillo, Alberto Bacci and Illya Drebot from Universitá di Milano e INFN-Milano for providing the data for the expected X-ray emission of BriXS.
Conflicts of Interest
The authors declare no conflict of interest.
Abbreviations
The following abbreviations are used in this manuscript:
| ICS | Inverse Compton Scattering |
| KES | K-Edge Subtraction |
| IP | Interaction Point |
| BW | Bandwidth |
| RMS | Root Mean Square |
| CEDEM | Contrast Enhanced Dual Energy Mammography |
| SNR | Signal to Noise Ratio |
| ROI | Region Of Interest |
References
- Alvarez, R.E.; Macovski, A. Energy-selective reconstructions in X-ray computerised tomography. Phys. Med. Biol. 1976, 21, 733. [Google Scholar] [CrossRef] [PubMed]
- McCollough, C.H.; Leng, S.; Yu, L.; Fletcher, J.G. Dual- and Multi-Energy CT: Principles, Technical Approaches, and Clinical Applications. Radiology 2015, 276, 637–653. [Google Scholar] [CrossRef] [PubMed]
- Blake, G.M.; Fogelman, I. An update on dual-energy X-ray absorptiometry. In Seminars in Nuclear Medicine; Elsevier: Amsterdam, The Netherlands, 2010; Volume 40, pp. 62–73. [Google Scholar]
- Vock, P.; Szucs-Farkas, Z. Dual energy subtraction: Principles and clinical applications. Eur. J. Radiol. 2009, 72, 231–237. [Google Scholar] [CrossRef]
- Jacobson, B. Dichromatic absorption radiography. Dichromography. Acta Radiol. 1953, 6, 437–452. [Google Scholar]
- Thomlinson, W.; Elleaume, H.; Porra, L.; Suortti, P. K-edge subtraction synchrotron X-ray imaging in bio-medical research. Phys. Med. 2018, 49, 58–76. [Google Scholar] [CrossRef]
- Mistretta, C.; Ort, M.; Kelcz, F.; Cameron, J.; Siedband, M.; Crummy, A. Absorption edge fluoroscopy using quasi-monoenergetic X-ray beams. Investig. Radiol. 1973, 8, 402–412. [Google Scholar]
- Rutt, B.K.; Cunningham, I.A.; Fenster, A. Selective iodine imaging using lanthanum K fluorescence. Med. Phys. 1983, 10, 801–808. [Google Scholar] [CrossRef]
- Sarnelli, A.; Taibi, A.; Tuffanelli, A.; Baldazzi, G.; Bollini, D.; Rodriguez, A.C.; Gombia, M.; Prino, F.; Ramello, L.; Tomassi, E.; et al. K-edge digital subtraction imaging based on a dichromatic and compact X-ray source. Phys. Med. Biol. 2004, 49, 3291. [Google Scholar] [CrossRef]
- Willemink, M.J.; Persson, M.; Pourmorteza, A.; Pelc, N.J.; Fleischmann, D. Photon-counting CT: Technical principles and clinical prospects. Radiology 2018, 289, 293–312. [Google Scholar] [CrossRef]
- Riederer, I.; Si-Mohamed, S.; Ehn, S.; Bar-Ness, D.; Noël, P.B.; Fingerle, A.A.; Pfeiffer, F.; Rummeny, E.J.; Douek, P.; Pfeiffer, D. Differentiation between blood and iodine in a bovine brain—Initial experience with Spectral Photon-Counting Computed Tomography (SPCCT). PLoS ONE 2019, 14, e0212679. [Google Scholar] [CrossRef]
- Skarpathiotakis, M.; Yaffe, M.J.; Bloomquist, A.K.; Rico, D.; Muller, S.; Rick, A.; Jeunehomme, F. Development of contrast digital mammography. Med. Phys. 2002, 29, 2419–2426. [Google Scholar] [CrossRef] [PubMed]
- Contillo, A.; Di Domenico, G.; Cardarelli, P.; Gambaccini, M.; Taibi, A. A novel approach to background subtraction in contrast-enhanced dual-energy digital mammography with commercially available mammography devices: Polychromaticity correction. Med. Phys. 2015, 42, 6641–6650. [Google Scholar] [CrossRef] [PubMed]
- Tavakol, M.; Ashraf, S.; Brener, S.J. Risks and complications of coronary angiography: A comprehensive review. Glob. J. Health Sci. 2012, 4, 65. [Google Scholar] [CrossRef]
- Lehmann, L.; Alvarez, R.; Macovski, A.; Brody, W.; Pelc, N.; Riederer, S.J.; Hall, A. Generalized image combinations in dual KVP digital radiography. Med. Phys. 1981, 8, 659–667. [Google Scholar] [CrossRef] [PubMed]
- Sarnelli, A.; Elleaume, H.; Taibi, A.; Gambaccini, M.; Bravin, A. K-edge digital subtraction imaging with dichromatic X-ray sources: SNR and dose studies. Phys. Med. Biol. 2006, 51, 4311. [Google Scholar] [CrossRef]
- Esarey, E.; Ride, S.K.; Sprangle, P. Nonlinear Thomson scattering of intense laser pulses from beams and plasmas. Phys. Rev. E 1993, 48, 3003. [Google Scholar] [CrossRef]
- Brown, W.J.; Hartemann, F.V. Three-dimensional time and frequency-domain theory of femtosecond X-ray pulse generation through Thomson scattering. Phys. Rev. Accel. Beams 2004, 7, 060703. [Google Scholar] [CrossRef] [Green Version]
- Sun, C.; Wu, Y.K. Theoretical and simulation studies of characteristics of a Compton light source. Phys. Rev. Accel. Beams 2011, 14, 044701. [Google Scholar] [CrossRef] [Green Version]
- Petrillo, V.; Bacci, A.; Zinati, R.B.A.; Chaikovska, I.; Curatolo, C.; Ferrario, M.; Maroli, C.; Ronsivalle, C.; Rossi, A.; Serafini, L.; et al. Photon flux and spectrum of γ-rays Compton sources. Nucl. Instrum. Methods A 2012, 693, 109–116. [Google Scholar] [CrossRef]
- Krafft, G.; Johnson, E.; Deitrick, K.; Terzić, B.; Kelmar, R.; Hodges, T.; Melnitchouk, W.; Delayen, J. Laser pulsing in linear Compton scattering. Phys. Rev. Accel. Beams 2016, 19, 121302. [Google Scholar] [CrossRef] [Green Version]
- Paternò, G.; Cardarelli, P.; Marziani, M.; Bagli, E.; Evangelisti, F.; Andreotti, M.; Gambaccini, M.; Petrillo, V.; Drebot, I.; Bacci, A.; et al. A collimation system for ELI-NP Gamma Beam System–design and simulation of performance. Nucl. Instrum. Methods B 2017, 402, 349–353. [Google Scholar] [CrossRef] [Green Version]
- Krafft, G.A.; Priebe, G. Compton sources of electromagnetic radiation. In Reviews of Accelerator Science and Technology: Volume 3: Accelerators as Photon Sources; World Scientific: Singapore, 2010; pp. 147–163. [Google Scholar]
- Yokoya, K. User Manual of CAIN; Version 2.42; 2011. Available online: https://ilc.kek.jp/~yokoya/CAIN/ (accessed on 18 September 2020).
- Chen, P.; Horton-Smith, G.; Ohgaki, T.; Weidemann, A.; Yokoya, K. CAIN: Conglomérat d’ABEL et d’Interactions Non-linéaires. Nucl. Instrum. Methods A 1995, 355, 107–110. [Google Scholar] [CrossRef] [Green Version]
- Drebot, I.; Bacci, A.; Bosotti, A.; Broggi, F.; Canella, F.; Cardarelli, P.; Cialdi, S.; Faillace, L.; Galzerano, G.; Gambaccini, M.; et al. BriXs Ultra High Flux Inverse Compton Source Based on Modified Push-Pull Energy Recovery Linacs. Instruments 2019, 3, 49. [Google Scholar] [CrossRef] [Green Version]
- Jacquet, M. Potential of compact Compton sources in the medical field. Phys. Med. 2016, 32, 1790–1794. [Google Scholar] [CrossRef] [PubMed]
- Labate, L.; Tomassini, P.; Gizzi, L.A. Inverse Compton Scattering X-ray Sources. In Handbook of X-ray Imaging: Physics and Technology; CRC Press: Boca Raton, FL, USA, 2017; pp. 309–323. [Google Scholar]
- Faillace, L.; Agostino, R.; Bacci, A.; Barberi, R.; Bosotti, A.; Broggi, F.; Cardarelli, P.; Cialdi, S.; Drebot, I.; Formoso, V.; et al. Status of compact inverse Compton sources in Italy: BriXS and STAR. In Advances in Laboratory-Based X-ray Sources, Optics, and Applications VII; SPIE International Society for Optics and Photonics: Bellingham, WA, USA, 2019; Volume 11110, p. 1111005. [Google Scholar]
- Bacci, A.; Puppin, E.; Agostino, R.; Alesini, D.; Gatti, G.; Petrillo, V.; Borgese, G.; Anania, M.P.; Palmer, D.; Fabris, A.; et al. The STAR project. In Proceedings of the 5th International Particle Accelerator Conference (IPAC 2014), Dresden, Germany, 15–20 June 2014. [Google Scholar]
- Variola, A. The ThomX Project. In Proceedings of the 2nd International Particle Accelerator Conference (IPAC’11), San Sebastian, Spain, 4–9 September 2011; Joint Accelerator Conferences Website. 2011; Volume WEOAA01, pp. 1903–1905. [Google Scholar]
- Eggl, E.; Dierolf, M.; Achterhold, K.; Jud, C.; Günther, B.; Braig, E.; Gleich, B.; Pfeiffer, F. The Munich compact light source: Initial performance measures. J. Synchrotron Radiat. 2016, 23, 1137–1142. [Google Scholar] [CrossRef] [PubMed]
- Günther, B.; Gradl, R.; Jud, C.; Eggl, E.; Huang, J.; Kulpe, S.; Achterhold, K.; Gleich, B.; Dierolf, M.; Pfeiffer, F. The versatile X-ray beamline of the Munich Compact Light Source: Design, instrumentation and applications. J. Synchrotron Radiat. 2020, 27, 1395–1414. [Google Scholar] [CrossRef]
- Serafini, L.; Bacci, A.; Bellandi, A.; Bertucci, M.; Bolognesi, M.; Bosotti, A.; Broggi, F.; Calandrino, R.; Camera, F.; Canella, F.; et al. MariX, an advanced MHz-class repetition rate X-ray source for linear regime time-resolved spectroscopy and photon scattering. Nucl. Instrum. Methods A 2019, 930, 167–172. [Google Scholar] [CrossRef] [Green Version]
- Cardarelli, P.; Bacci, A.; Calandrino, R.; Canella, F.; Castriconi, R.; Cialdi, S.; Del Vecchio, A.; di Franco, F.; Drebot, I.; Gambaccini, M.; et al. BriXS, a new X-ray inverse Compton source for medical applications. Phys. Med. 2020, 77, 127–137. [Google Scholar] [CrossRef]
- Variola, A.; Haissinski, J.; Loulergue, A.; Zomer, F. THOMX Technical Design Report; 2014. Available online: http://hal.in2p3.fr/in2p3-00971281 (accessed on 18 September 2020).
- Kulpe, S.; Dierolf, M.; Braig, E.; Günther, B.; Achterhold, K.; Gleich, B.; Herzen, J.; Rummeny, E.; Pfeiffer, F.; Pfeiffer, D. K-edge subtraction imaging for coronary angiography with a compact synchrotron X-ray source. PLoS ONE 2018, 13, e0208446. [Google Scholar] [CrossRef] [Green Version]
- Kulpe, S.; Dierolf, M.; Braig, E.M.; Günther, B.; Achterhold, K.; Gleich, B.; Herzen, J.; Rummeny, E.J.; Pfeiffer, F.; Pfeiffer, D. K-edge subtraction imaging for iodine and calcium separation at a compact synchrotron X-ray source. J. Med. Imaging 2020, 7, 023504. [Google Scholar] [CrossRef]
- Drebot, I.; Petrillo, V.; Serafini, L. Two-colour X-gamma ray inverse Compton back-scattering source. EPL 2017, 120, 14002. [Google Scholar] [CrossRef] [Green Version]
- Drebot, I.; Calandrino, R.; Cardarelli, P.; Cialdi, S.; Galzerano, G.; Gambaccini, M.; Giannotti, D.; Paternò, G.; Petrillo, V.; Serafini, L.; et al. Multi Colour X-Gamma Ray Inverse Compton Back-Scattering Source. In Proceedings of the 9th International Particle Accelerator Conference (IPAC’18), Vancouver, BC, Canada, 29 April–4 May 2018; JACOW Publishing: Geneva, Switzerland, 2018. [Google Scholar]
- Vaccarezza, C.; Alesini, D.; Anania, M.P.; Bacci, A.; Biagioni, A.; Bisesto, F.; Bellaveglia, M.; Cardarelli, P.; Cardelli, F.; Cianchi, A.; et al. The SPARC_LAB Thomson source. Nucl. Instrum. Methods A 2016, 829, 237–242. [Google Scholar] [CrossRef]
- Priebe, G.; Laundy, D.; Phillips, P.; Graham, D.; Jamison, S.; Vassilev, S.; Seddon, E.; Rosenzweig, J.; Krafft, G.; Heinzl, T.; et al. First results from the Daresbury Compton backscattering X-ray source (COBALD). In Hard X-ray, Gamma-Ray, and Neutron Detector Physics XII; SPIE International Society for Optics and Photonics: Bellingham, WA, USA, 2010; Volume 7805, p. 780513. [Google Scholar]
- Tang, C.; Huang, W.; Li, R.; Du, Y.; Yan, L.; Shi, J.; Du, Q.; Yu, P.; Chen, H.; Du, T.; et al. Tsinghua Thomson scattering X-ray source. Nucl. Instrum. Methods A 2009, 608, S70–S74. [Google Scholar] [CrossRef]
- Yamada, K.; Kuroda, R.; Toyakawa, H.; Ikeura-Sekiguchi, H.; Yasumoto, M.; Koike, M.; Sakai, F.; Mori, K.; Mori, H.; Fukuyama, N.; et al. A trial for fine and low-dose imaging of biological specimens using quasi-monochromatic laser-Compton X-rays. Nucl. Instrum. Methods A 2009, 608, S7–S10. [Google Scholar] [CrossRef]
- Carroll, F. Tunable, monochromatic X-rays: An enabling technology for molecular/cellular imaging and therapy. J. Cell. Biochem. 2003, 90, 502–508. [Google Scholar] [CrossRef]
- Kuroda, R. Inverse Compton Scattering Sources. In Comprehensive BioMedical Physics; Brahme, A., Ed.; Elsevier: Amsterdam, The Netherlands, 2014. [Google Scholar]
- Eggl, E.; Mechlem, K.; Braig, E.; Kulpe, S.; Dierolf, M.; Günther, B.; Achterhold, K.; Herzen, J.; Gleich, B.; Rummeny, E.; et al. Mono-energy coronary angiography with a compact synchrotron source. Sci. Rep. 2017, 7, 42211. [Google Scholar] [CrossRef]
- MATLAB. Version 8.6 (R2015b); The MathWorks Inc.: Natick, MA, USA, 2015. [Google Scholar]
- ICRU. Photon, Electron, Proton and Neutron Interaction Data for Body Tissues; Report 46 of the International Commission on Radiation Units and Measurements; ICRU: Bethesda, MD, USA, 1992. [Google Scholar]
- Nowotny, R. XMuDat: Photon Attenuation Data on PC; 1998. Available online: https://www-nds.iaea.org/publications/iaea-nds/iaea-nds-0195.htm (accessed on 18 September 2020).
- Boone, J.M.; Chavez, A.E. Comparison of X-ray cross sections for diagnostic and therapeutic medical physics. Med. Phys. 1996, 23, 1997–2005. [Google Scholar] [CrossRef]
- Curatolo, C.; Drebot, I.; Petrillo, V.; Serafini, L. Analytical description of photon beam phase spaces in inverse Compton scattering sources. Phys. Rev. Accel. Beams 2017, 20, 080701. [Google Scholar] [CrossRef] [Green Version]
- Prino, F.; Ceballos, C.; Cabal, A.; Sarnelli, A.; Gambaccini, M.; Ramello, L. Effect of X-ray energy dispersion in digital subtraction imaging at the iodine-edge—A Monte Carlo study. Med. Phys. 2008, 35, 13–24. [Google Scholar] [CrossRef]
- Paternò, G.; Cardarelli, P.; Gambaccini, M.; Serafini, L.; Petrillo, V.; Drebot, I.; Taibi, A. Inverse Compton radiation: A novel X-ray source for K-edge subtraction angiography? Phys. Med. Biol. 2019, 64, 185002. [Google Scholar] [CrossRef]
- Boone, J.M. Normalized glandular dose (DgN) coefficients for arbitrary X-ray spectra in mammography: Computer-fit values of Monte Carlo derived data. Med. Phys. 2002, 29, 869–875. [Google Scholar] [CrossRef] [PubMed]
- Sun, C.; Li, J.; Rusev, G.; Tonchev, A.; Wu, Y. Energy and energy spread measurements of an electron beam by Compton scattering method. Phys. Rev. Spec. Top. Accel. Beams 2009, 12, 062801. [Google Scholar] [CrossRef] [Green Version]
- Ranjan, N.; Terzić, B.; Krafft, G.; Petrillo, V.; Drebot, I.; Serafini, L. Simulation of inverse Compton scattering and its implications on the scattered linewidth. Phys. Rev. Accel. Beams 2018, 21, 030701. [Google Scholar] [CrossRef] [Green Version]
- Heck, L.; Dierolf, M.; Jud, C.; Eggl, E.; Sellerer, T.; Mechlem, K.; Günther, B.; Achterhold, K.; Gleich, B.; Metz, S.; et al. Contrast-enhanced spectral mammography with a compact synchrotron source. PLoS ONE 2019, 14, e0222816. [Google Scholar] [CrossRef]
- Sarnelli, A.; Nemoz, C.; Elleaume, H.; Estève, F.; Bertrand, B.; Bravin, A. Quantitative analysis of synchrotron radiation intravenous angiographic images. Phys. Med. Biol. 2005, 50, 725. [Google Scholar] [CrossRef]
- Jong, R.A.; Yaffe, M.J.; Skarpathiotakis, M.; Shumak, R.S.; Danjoux, N.M.; Gunesekara, A.; Plewes, D.B. Contrast-enhanced digital mammography: Initial clinical experience. Radiology 2003, 228, 842–850. [Google Scholar] [CrossRef]
- Sarnelli, A.; Taibi, A.; Baldelli, P.; Gambaccini, M.; Bravin, A. Quantitative analysis of the effect of energy separation in k-edge digital subtraction imaging. Phys. Med. Biol. 2007, 52, 3015. [Google Scholar] [CrossRef]
- Spinosa, D.; Matsumoto, A.; Hagspiel, K.; Angle, J.; Hartwell, G. Gadolinium-based contrast agents in angiography and interventional radiology. AJR Am. J. Roentgenol. 1999, 173, 1403–1409. [Google Scholar] [CrossRef] [Green Version]
- SamI, A.D., II; Morasch, M.D.; Collins, J.; Song, G.; Chen, R.; Pereles, F.S. Safety of gadolinium contrast angiography in patients with chronic renal insufficiency. J. Vasc. Surg. 2003, 38, 313–318. [Google Scholar] [CrossRef] [Green Version]
- Sayin, T.; Turhan, S.; Akyürek, Ö.; Kilickap, M. Gadolinium: Nonionic contrast media (1:1) coronary angiography in patients with impaired renal function. Angiology 2007, 58, 561–564. [Google Scholar] [CrossRef]
Figure 1.
Schematic representation of inverse Compton scattering.

Figure 2.
Simulation of the X-ray emission of BriXS source. (a) Distribution of scattered photons as a function of the photon energy E and the scattering angle , (b) Energy spectrum for three different values of the collimation angle .
Figure 2.
Simulation of the X-ray emission of BriXS source. (a) Distribution of scattered photons as a function of the photon energy E and the scattering angle , (b) Energy spectrum for three different values of the collimation angle .

Figure 3.
ICS spectra used for our calculation in the mammography case. The features of these spectra, which are normalized to the integral, are reported in Table 3. The mass attenuation coefficient of iodine is also reported as a reference.
Figure 3.
ICS spectra used for our calculation in the mammography case. The features of these spectra, which are normalized to the integral, are reported in Table 3. The mass attenuation coefficient of iodine is also reported as a reference.

Figure 4.
(a) Mammography case ( = 5 cm): signal of the reconstructed detail as a function of the separation and bandwidth BW of two Gaussian beams bracketing the iodine K-edge. The peak separation is symmetric with respect to the K-edge. The expected signal was 1 g cm. (b) Noise per pixel as a function of the peak energy separation .

Figure 5.
Signal-to-noise ratio per pixel calculated, in the mammography case, as a function of peak values of the two ICS spectra bracketing the iodine K-edge. The spectra featured an energy bandwidth of 3% RMS. A detail with a thickness of 5 mm and a contrast medium concentration of 2 mg mL embedded in a bulk composed of 5 cm was considered. The number of impinging photons was 4.5 for both the spectra.

Figure 6.
Simulated images of the phantom considered in our mammography case study. The details are the regions of interest (ROIs) labelled in red in the contrast image.
Figure 6.
Simulated images of the phantom considered in our mammography case study. The details are the regions of interest (ROIs) labelled in red in the contrast image.

Figure 7.
Coronary angiography case: detail mass thickness reconstructed, as a function of the peak values of the two ICS spectra bracketing the iodine K-edge. The spectra featured an energy bandwidth of 3% RMS. A detail with a thickness of 5 mm and a contrast medium concentration of 10 mg mL, embedded in a bulk composed of 19 cm of soft tissue and 1 cm of bone, was considered.

Figure 8.
Simulated images of the phantom considered in our coronary angiography case study.

Figure 9.
Comparison of the contrast images obtained with two different couples of ICS beams in the coronary angiography case. (a) = 32.5 keV and = 34.5 keV. (b) = 32 keV and = 36 keV. In both cases, the energy bandwidth and the beam intensity were assumed to vary as a function of the pixel position (emission angle) according to Equations (9) and (10), respectively.


Table 1.
Characteristics of the main European ICS-based X-ray sources.
| Source | Energy | Bandwidth | Intensity (ph/s) | Brilliance (ph smmmrad (0.1%BW)) |
|---|---|---|---|---|
| MuCLS [33] | 15–35 keV | 3–5% | (1.5–4.5) | 1.2 |
| ThomX [36] | 45–90 keV | 1–10% | (10% BW) | |
| STAR [30] | 20–100 keV | 1–10% | (10% BW) | |
| BriXS [35] | 20–180 keV | 1–10% | – | – |
Table 2.
Features of the phantoms used in our case studies. The densities of the bone and the soft tissues were = 1.04 g cm and = 1.41 g cm, respectively. The contrast medium concentration was 2 mg mL and 10 mg mL for the CEDEM and coronary angiography case, respectively.
Table 2.
Features of the phantoms used in our case studies. The densities of the bone and the soft tissues were = 1.04 g cm and = 1.41 g cm, respectively. The contrast medium concentration was 2 mg mL and 10 mg mL for the CEDEM and coronary angiography case, respectively.
| Phantom | ||||||
|---|---|---|---|---|---|---|
| (cm × cm) | (cm) | (cm) | (cm × cm) | (cm) | (cm × cm) | |
| mammography (CEDEM) | 8.0 × 8.0 | 5.0 ± 0.1 | 0.25, 0.5, 0.75 | 0.25, 0.5, 0.75 | - | - |
| coronary angiography | 3.5 × 3.5 | 20.0 ± 0.2 | 0.3, 0.5, 0.7 | 1.0 |
Table 3.
Features of some X-ray energy spectra used in our case studies. Overlap of the two beams bracketing the iodine K-edge is 3.5% and 18.5% for the mammography and coronary angiography case, respectively. and are the mean and the maximum energy of the spectra, respectively. is the ratio between the integral of the part of spectrum approximated by a logistic function and the total area, while is the portion of spectrum below the iodine K-edge. The other symbols have the meaning already specified.
| Case | Beam | BW (RMS) | |||||||
|---|---|---|---|---|---|---|---|---|---|
| (keV) | (keV) | (keV) | (%) | (%) | (%) | ||||
| mammography (CEDEM) | LE | 0.8012 | 0.012 | 32.0 | 31.4 | 34.1 | 3.00 | 70.5 | 99.9 |
| mammography (CEDEM) | HE | 0.9212 | 0.012 | 36.0 | 35.3 | 38.1 | 3.05 | 70.3 | 4.6 |
| coronary angiography | LE | 0.8162 | 0.012 | 32.5 | 31.9 | 34.5 | 3.00 | 71.0 | 97.4 |
| coronary angiography | HE | 0.8762 | 0.012 | 34.5 | 33.9 | 36.7 | 3.04 | 71.0 | 20.1 |
Table 4.
Analysis of the contrast image of the mammography phantom. For each ROI, m is the mean value of the mass thickness, and are the mean value and the standard deviation of the mass thickness (sampled in the background part of the image close to the detail). The other symbols have the meaning already specified.
| ROI | n | m | S | ||||
|---|---|---|---|---|---|---|---|
| (mg/cm) | (mg/cm) | (mg/cm) | (mg/cm) | (mg/cm) | |||
| 1 | 81 | 1.001 | −0.580 | 0.029 | 1.58 | 1.50 | 55 |
| 2 | 81 | 0.719 | −0.351 | 0.029 | 1.07 | 1.00 | 37 |
| 3 | 81 | −0.052 | −0.594 | 0.029 | 0.54 | 0.50 | 19 |
| 4 | 289 | 1.235 | −0.374 | 0.016 | 1.61 | 1.50 | 103 |
| 5 | 289 | 1.000 | −0.079 | 0.016 | 1.08 | 1.00 | 69 |
| 6 | 289 | 0.157 | −0.375 | 0.016 | 0.53 | 0.50 | 34 |
| 7 | 676 | 0.985 | −0.631 | 0.010 | 1.62 | 1.50 | 158 |
| 8 | 676 | 0.682 | −0.397 | 0.010 | 1.08 | 1.00 | 106 |
| 9 | 676 | −0.094 | −0.631 | 0.010 | 0.54 | 0.50 | 53 |
Table 5.
Analysis of the contrast image of the phantom for coronary angiography. For each ROI, m is the mean value of the mass thickness, and are the mean value and the standard deviation of the mass thickness sampled in the background part of the image close to the detail. The other symbols have the meaning already specified.
| ROI | n | m | S | ||||
|---|---|---|---|---|---|---|---|
| (mg/cm) | (mg/cm) | (mg/cm) | (mg/cm) | (mg/cm) | |||
| top vessel | 144 | 4.92 | −0.603 | 0.163 | 5.53 | 7.00 | 34 |
| top vessel (bone) | 144 | 3.54 | −2.46 | 0.228 | 6.00 | 7.00 | 26 |
| central vessel | 64 | 4.04 | −0.624 | 0.239 | 4.66 | 5.00 | 20 |
| central vessel (bone) | 64 | 2.21 | −2.47 | 0.324 | 4.68 | 5.00 | 14 |
| bottom vessel | 16 | 1.90 | −0.644 | 0.507 | 2.55 | 3.00 | 5.0 |
| bottom vessel (bone) | 16 | 0.051 | −2.74 | 0.869 | 2.79 | 3.00 | 3.2 |
© 2020 by the authors. Licensee MDPI, Basel, Switzerland. This article is an open access article distributed under the terms and conditions of the Creative Commons Attribution (CC BY) license (http://creativecommons.org/licenses/by/4.0/).
Share and Cite
MDPI and ACS Style
Paternò, G.; Cardarelli, P.; Gambaccini, M.; Taibi, A. Dual-Energy X-ray Medical Imaging with Inverse Compton Sources: A Simulation Study. Crystals 2020, 10, 834. https://doi.org/10.3390/cryst10090834
AMA Style
Paternò G, Cardarelli P, Gambaccini M, Taibi A. Dual-Energy X-ray Medical Imaging with Inverse Compton Sources: A Simulation Study. Crystals. 2020; 10(9):834. https://doi.org/10.3390/cryst10090834
Chicago/Turabian StylePaternò, Gianfranco, Paolo Cardarelli, Mauro Gambaccini, and Angelo Taibi. 2020. "Dual-Energy X-ray Medical Imaging with Inverse Compton Sources: A Simulation Study" Crystals 10, no. 9: 834. https://doi.org/10.3390/cryst10090834
Note that from the first issue of 2016, this journal uses article numbers instead of page numbers. See further details here.