
X-ray Micro-Tomography as a Method to Distinguish and Characterize Natural and Cultivated Pearls

 , ,
, ,  and
and
Abstract
:1. Introduction
2. Materials and Methods
2.1. The Pearls
2.1.1. Natural Pearls
2.1.2. Cultured Pearls
2.2. Instrumentation and Experimental Procedures
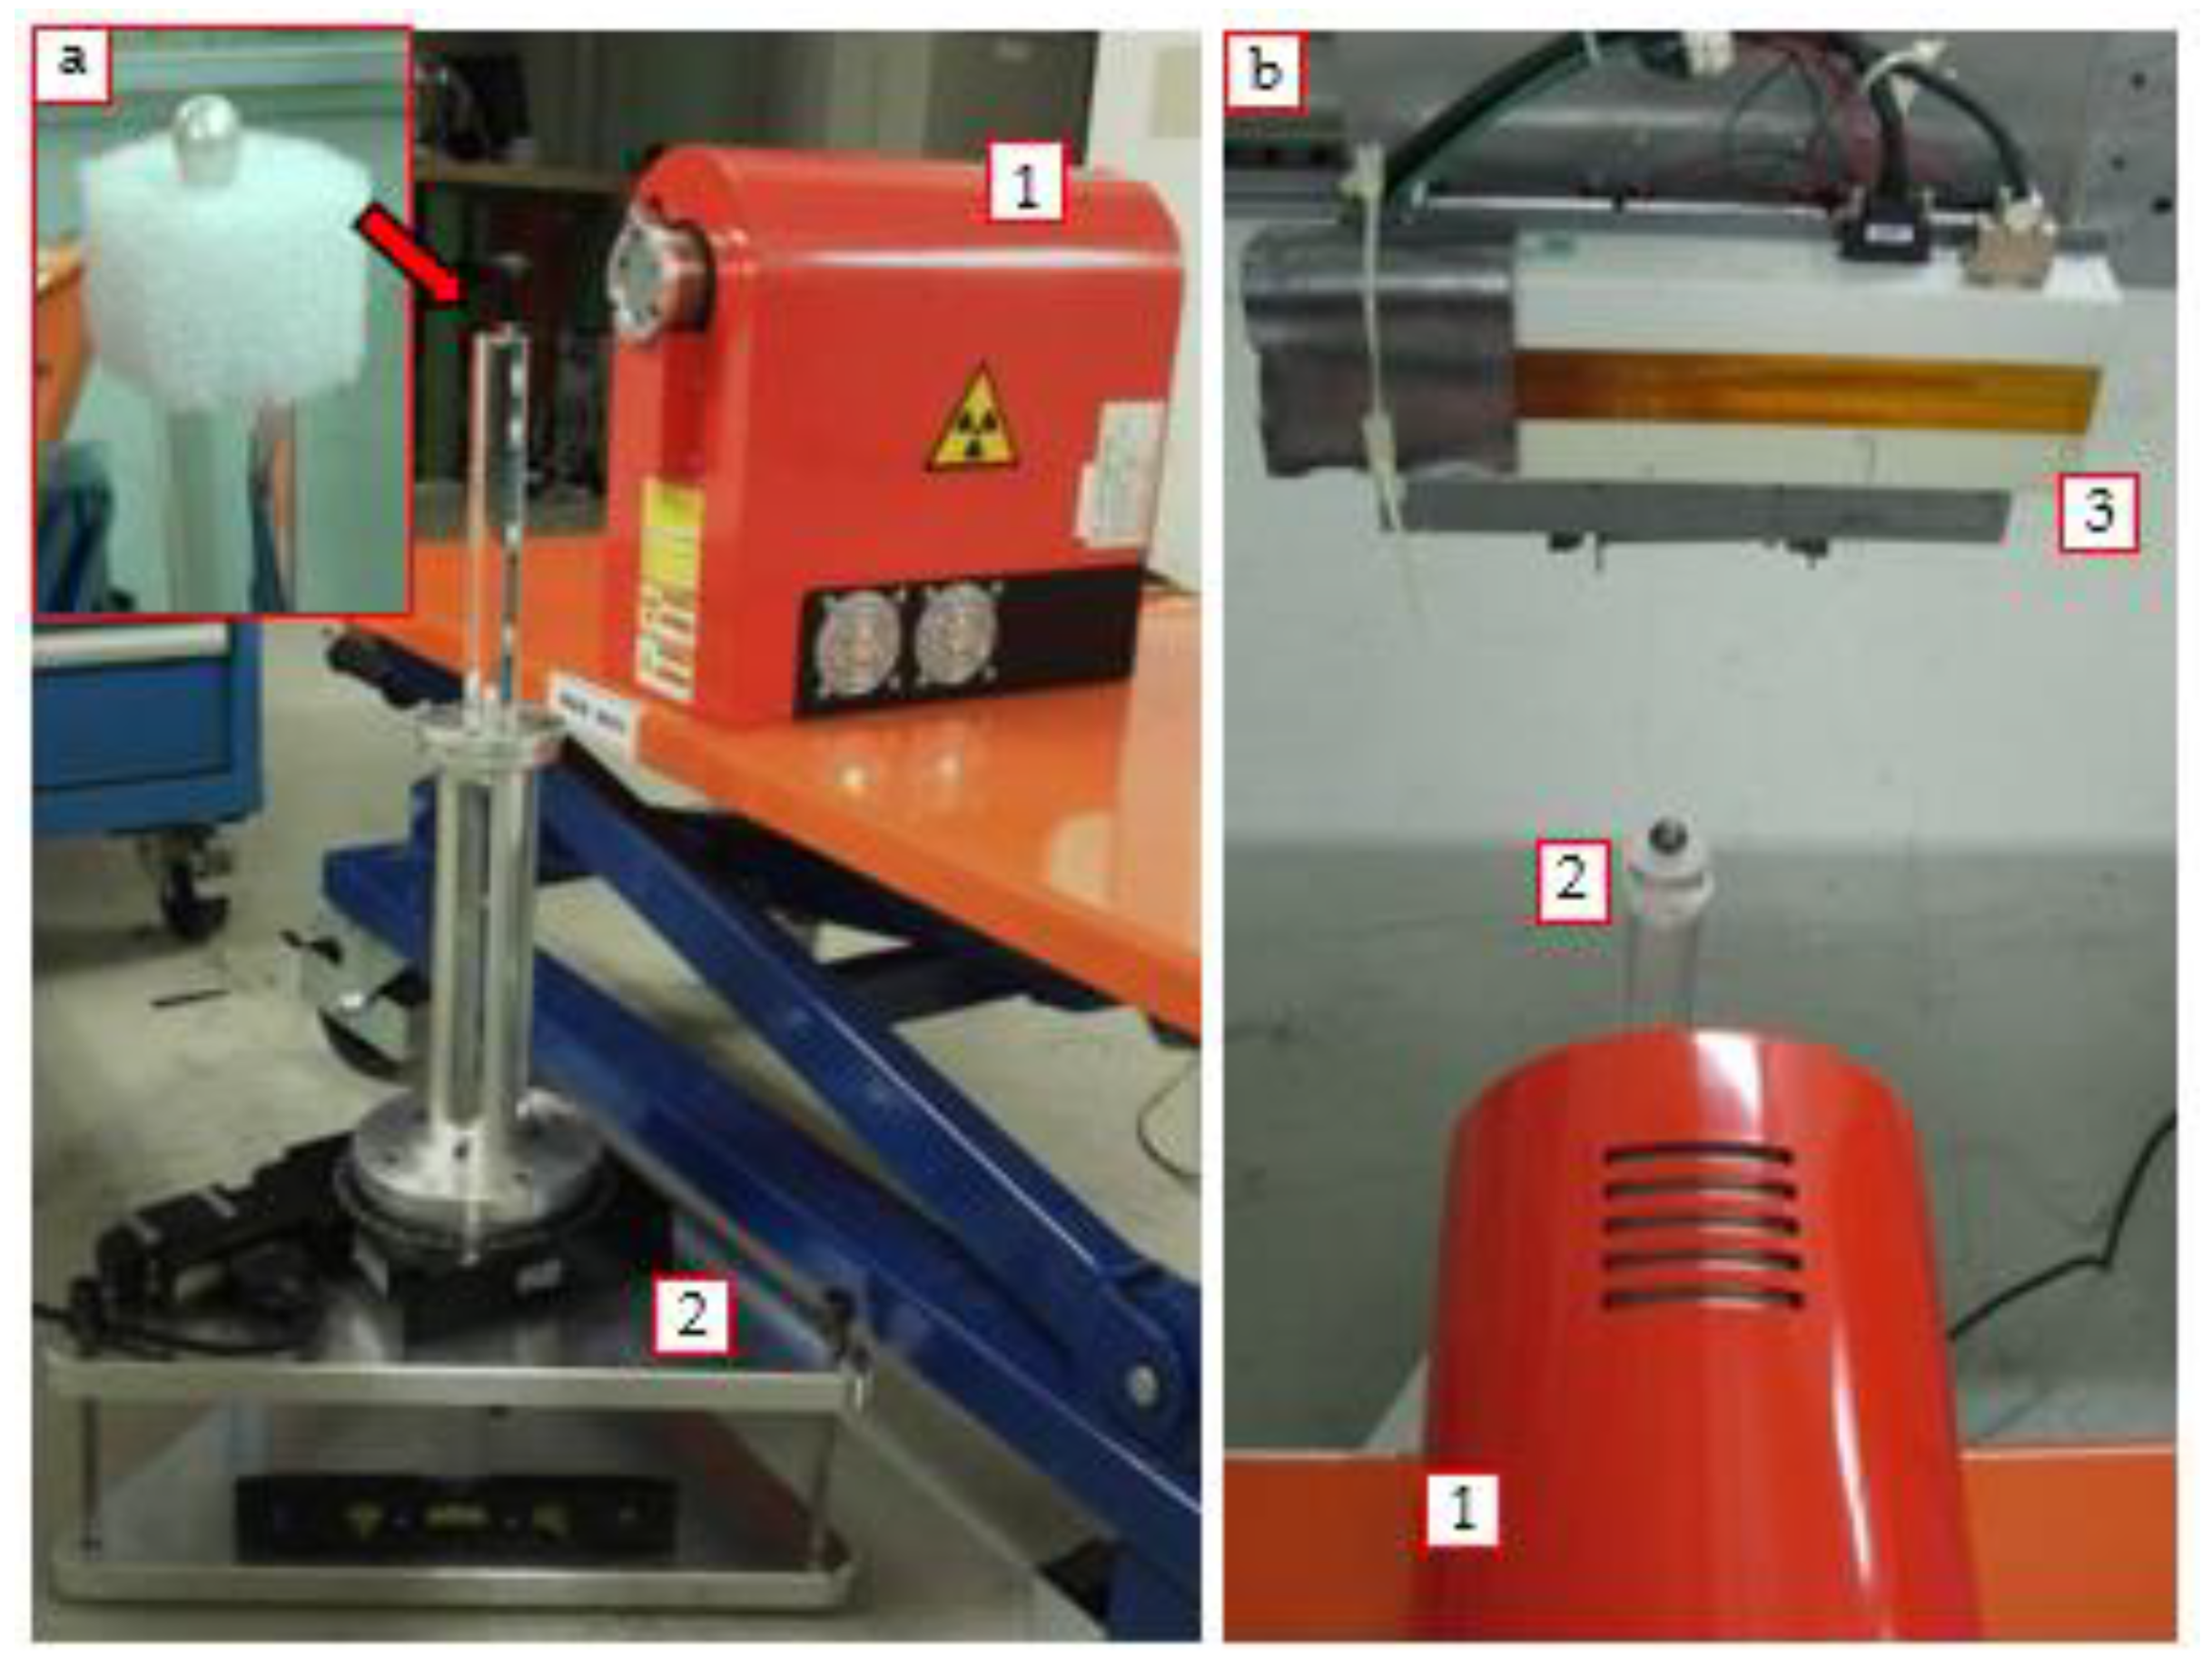
2.2.1. Experimental Setup
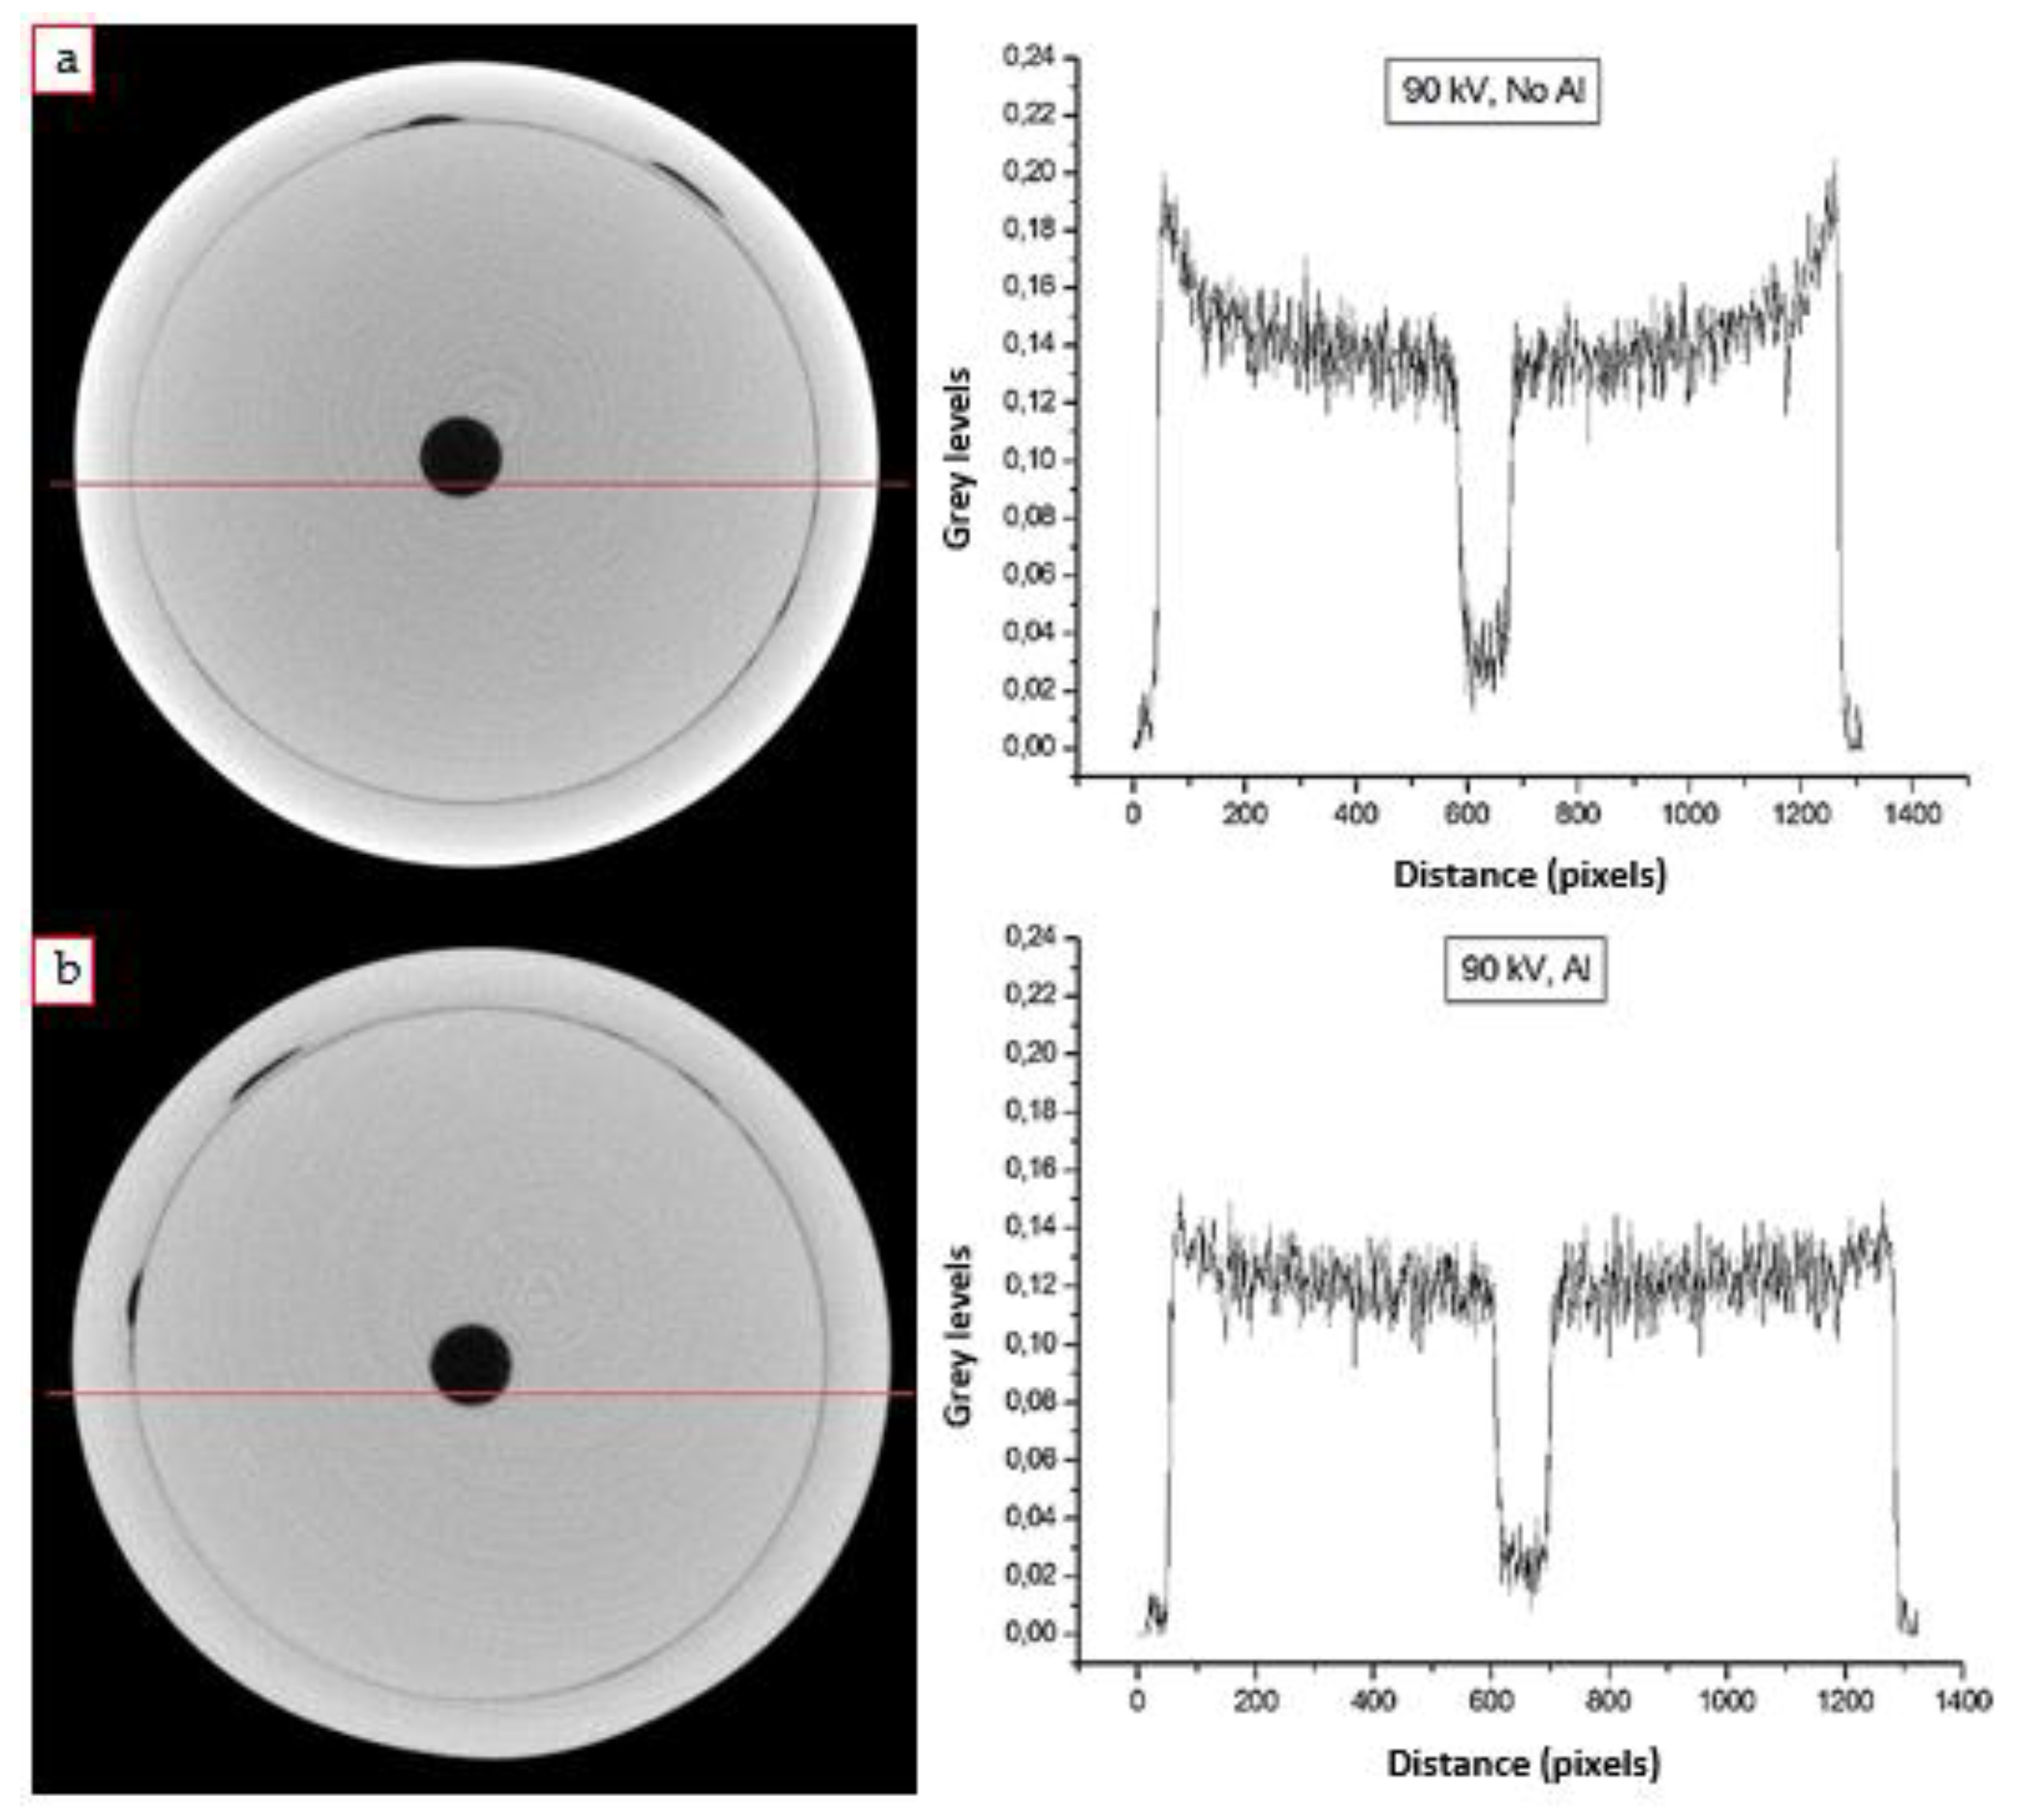
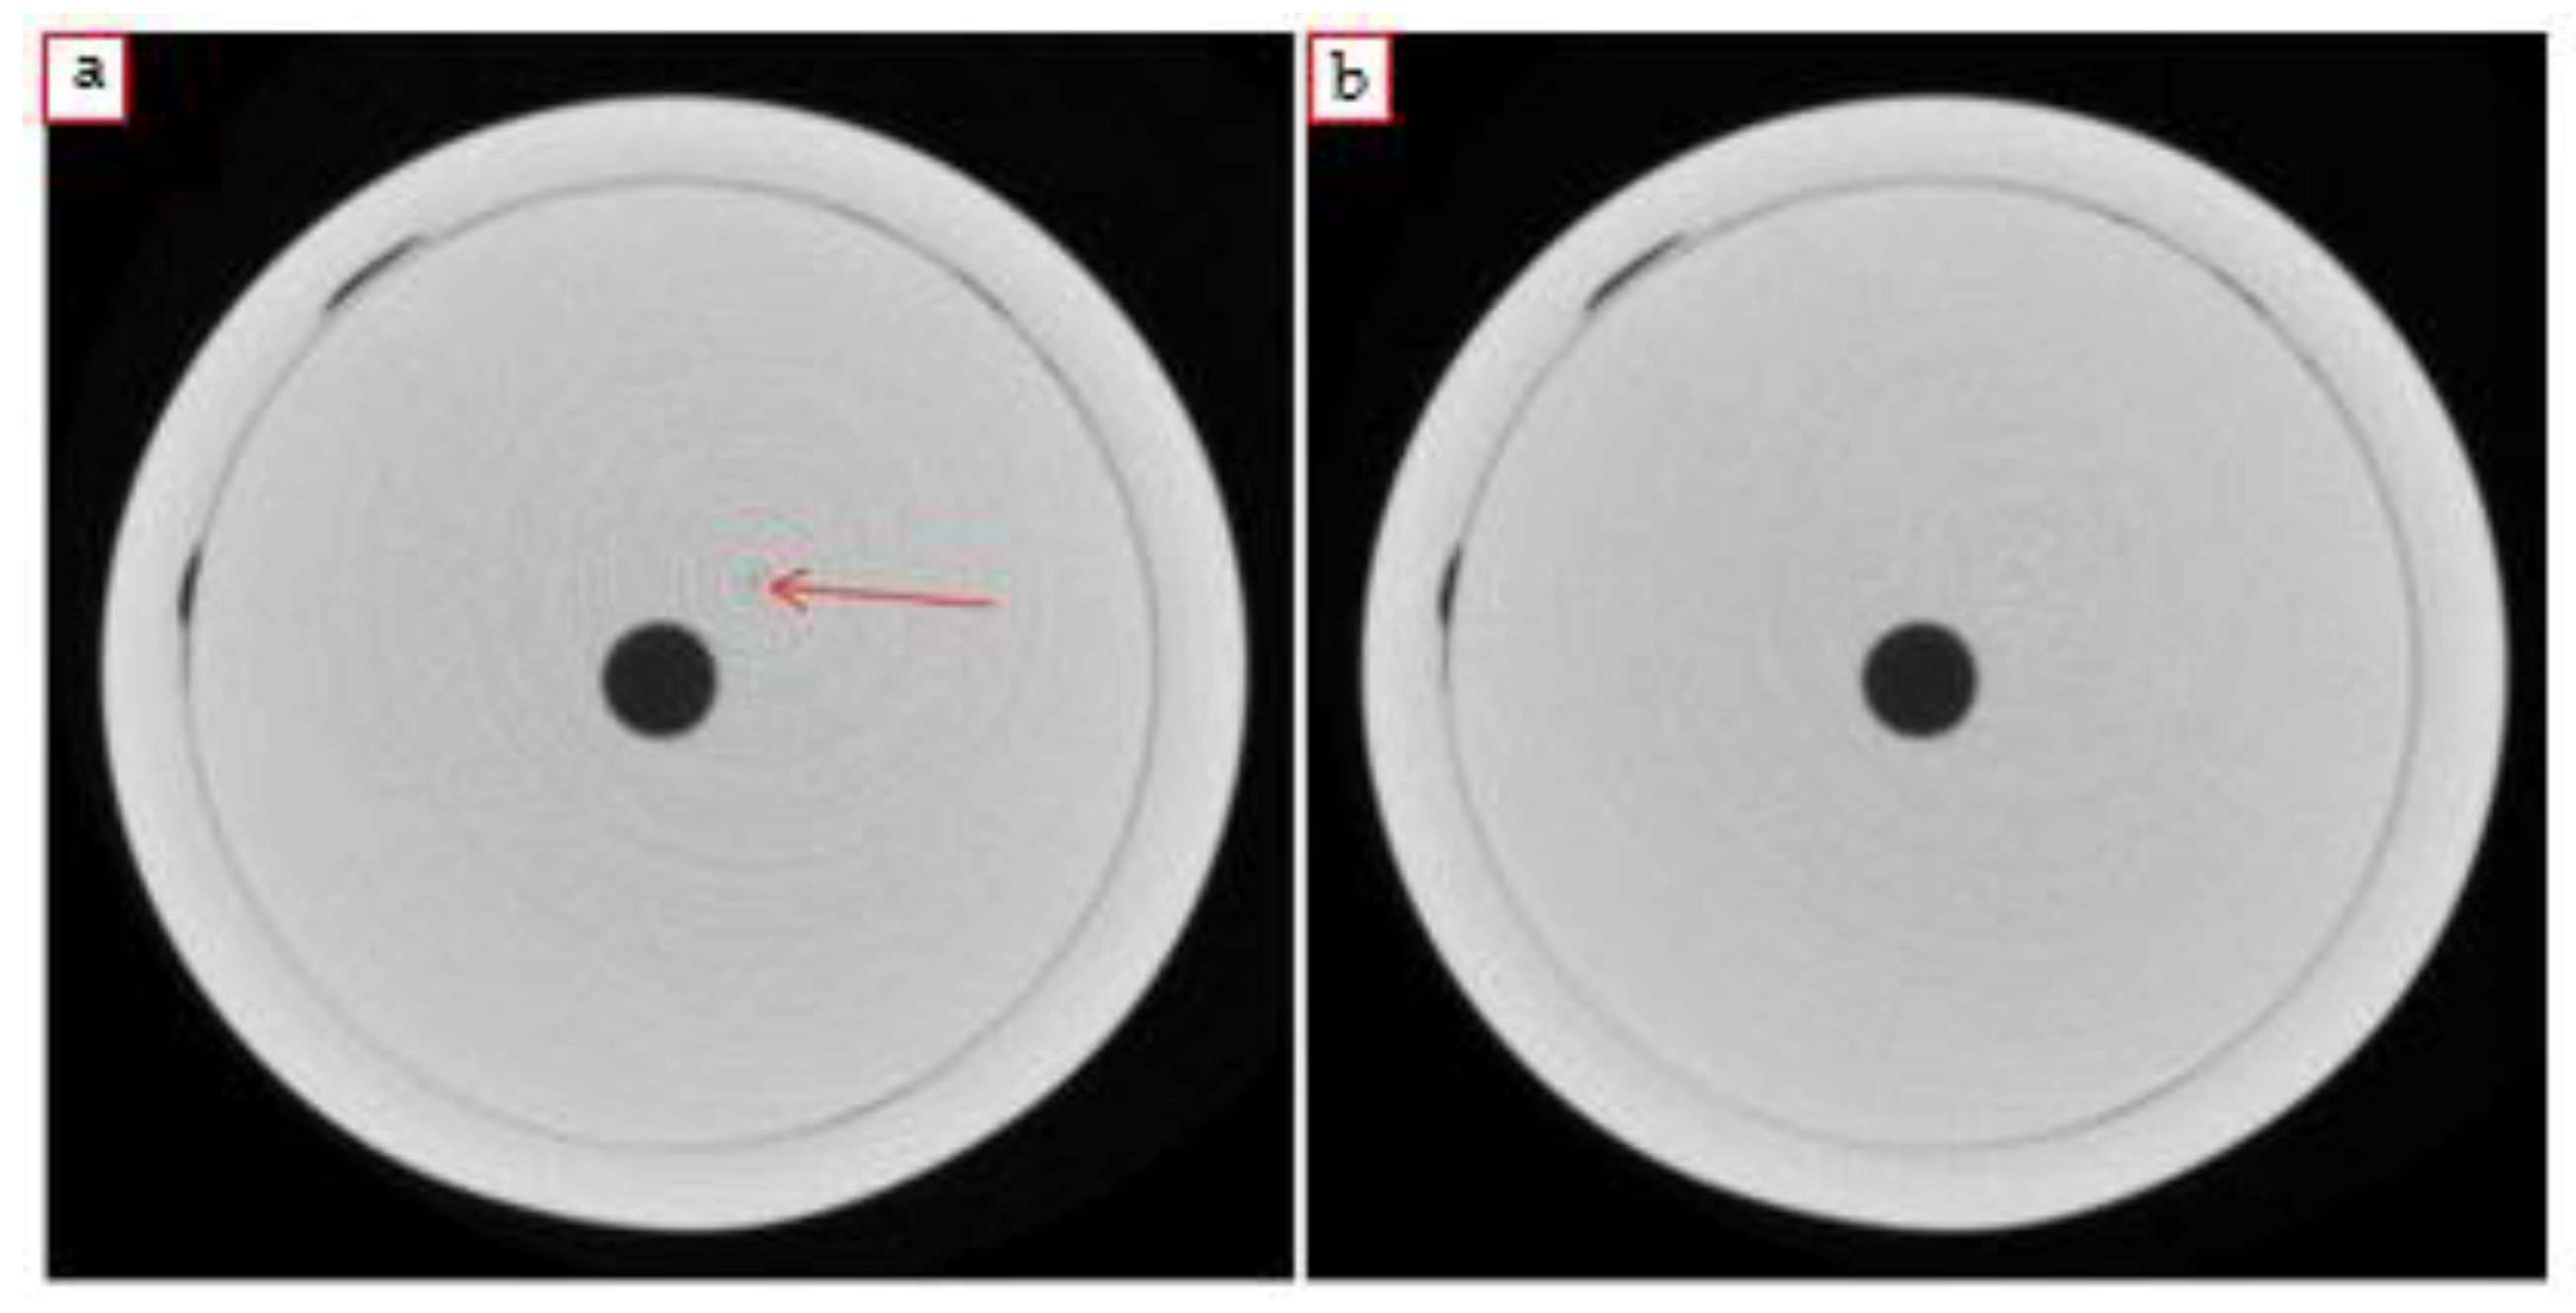
2.2.2. Optimization and Development of the Final Acquisition Procedure
3. Results and Discussion on Natural Pearls
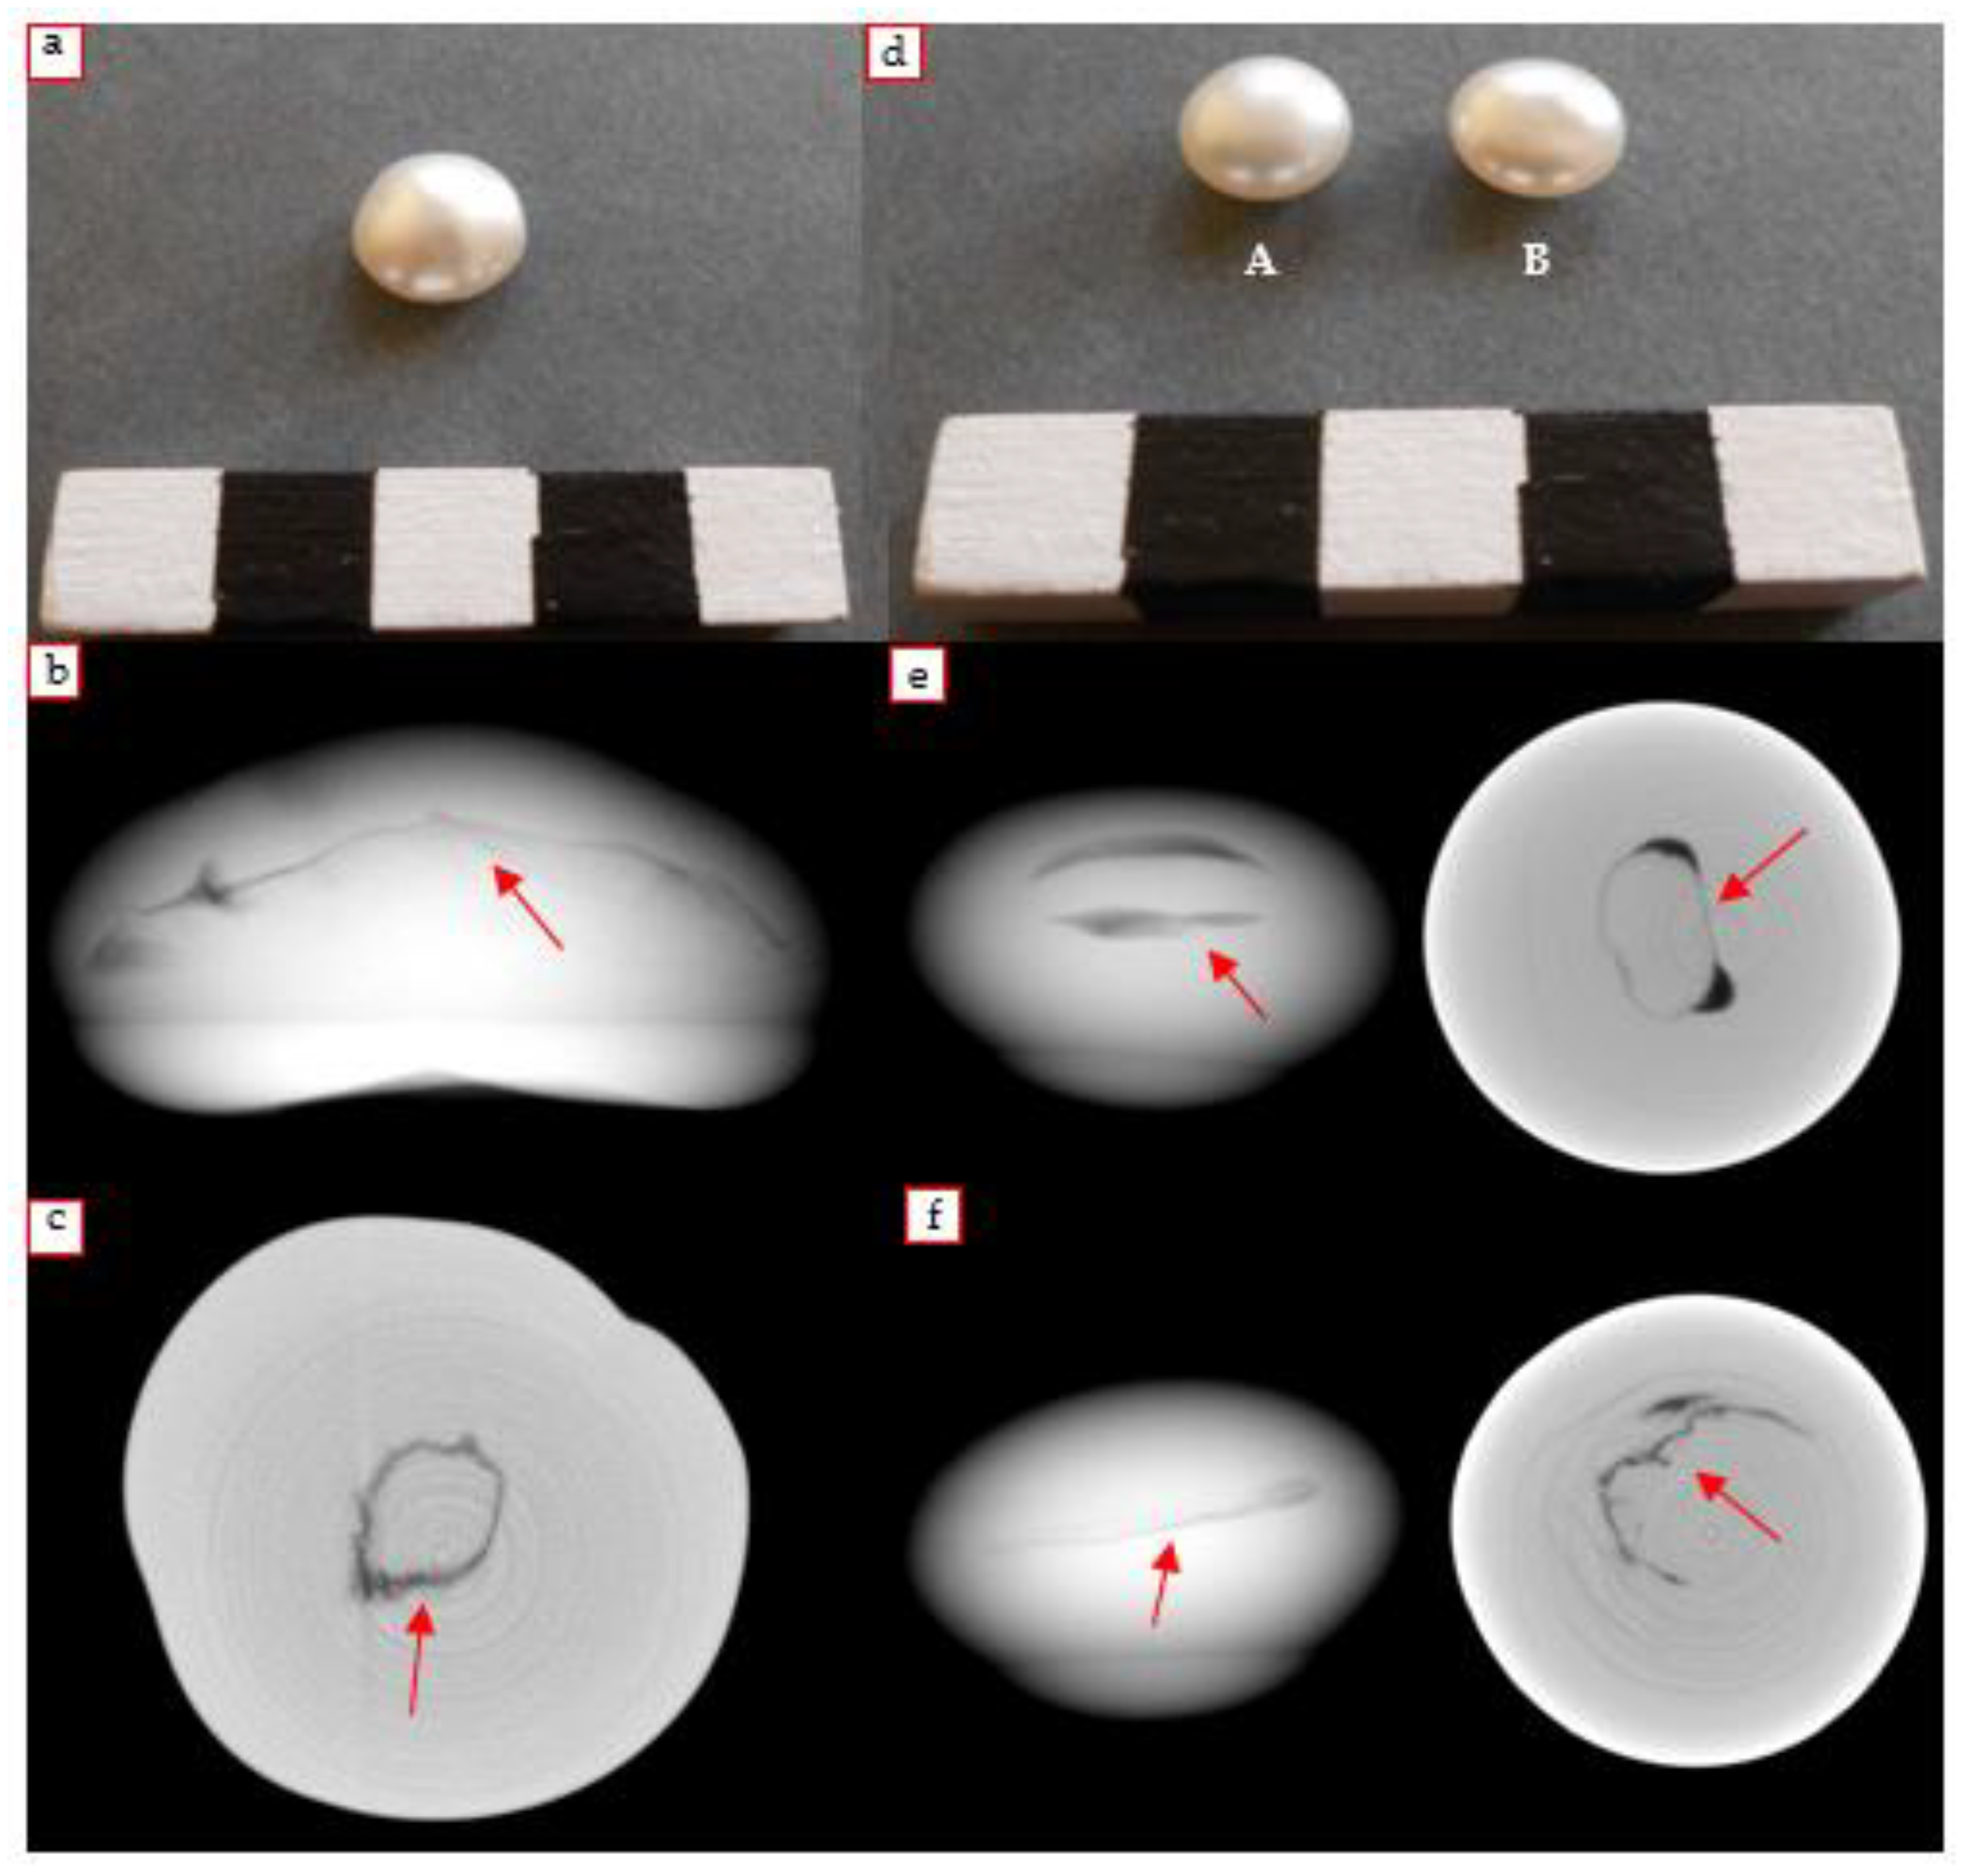
3.1. Earrings
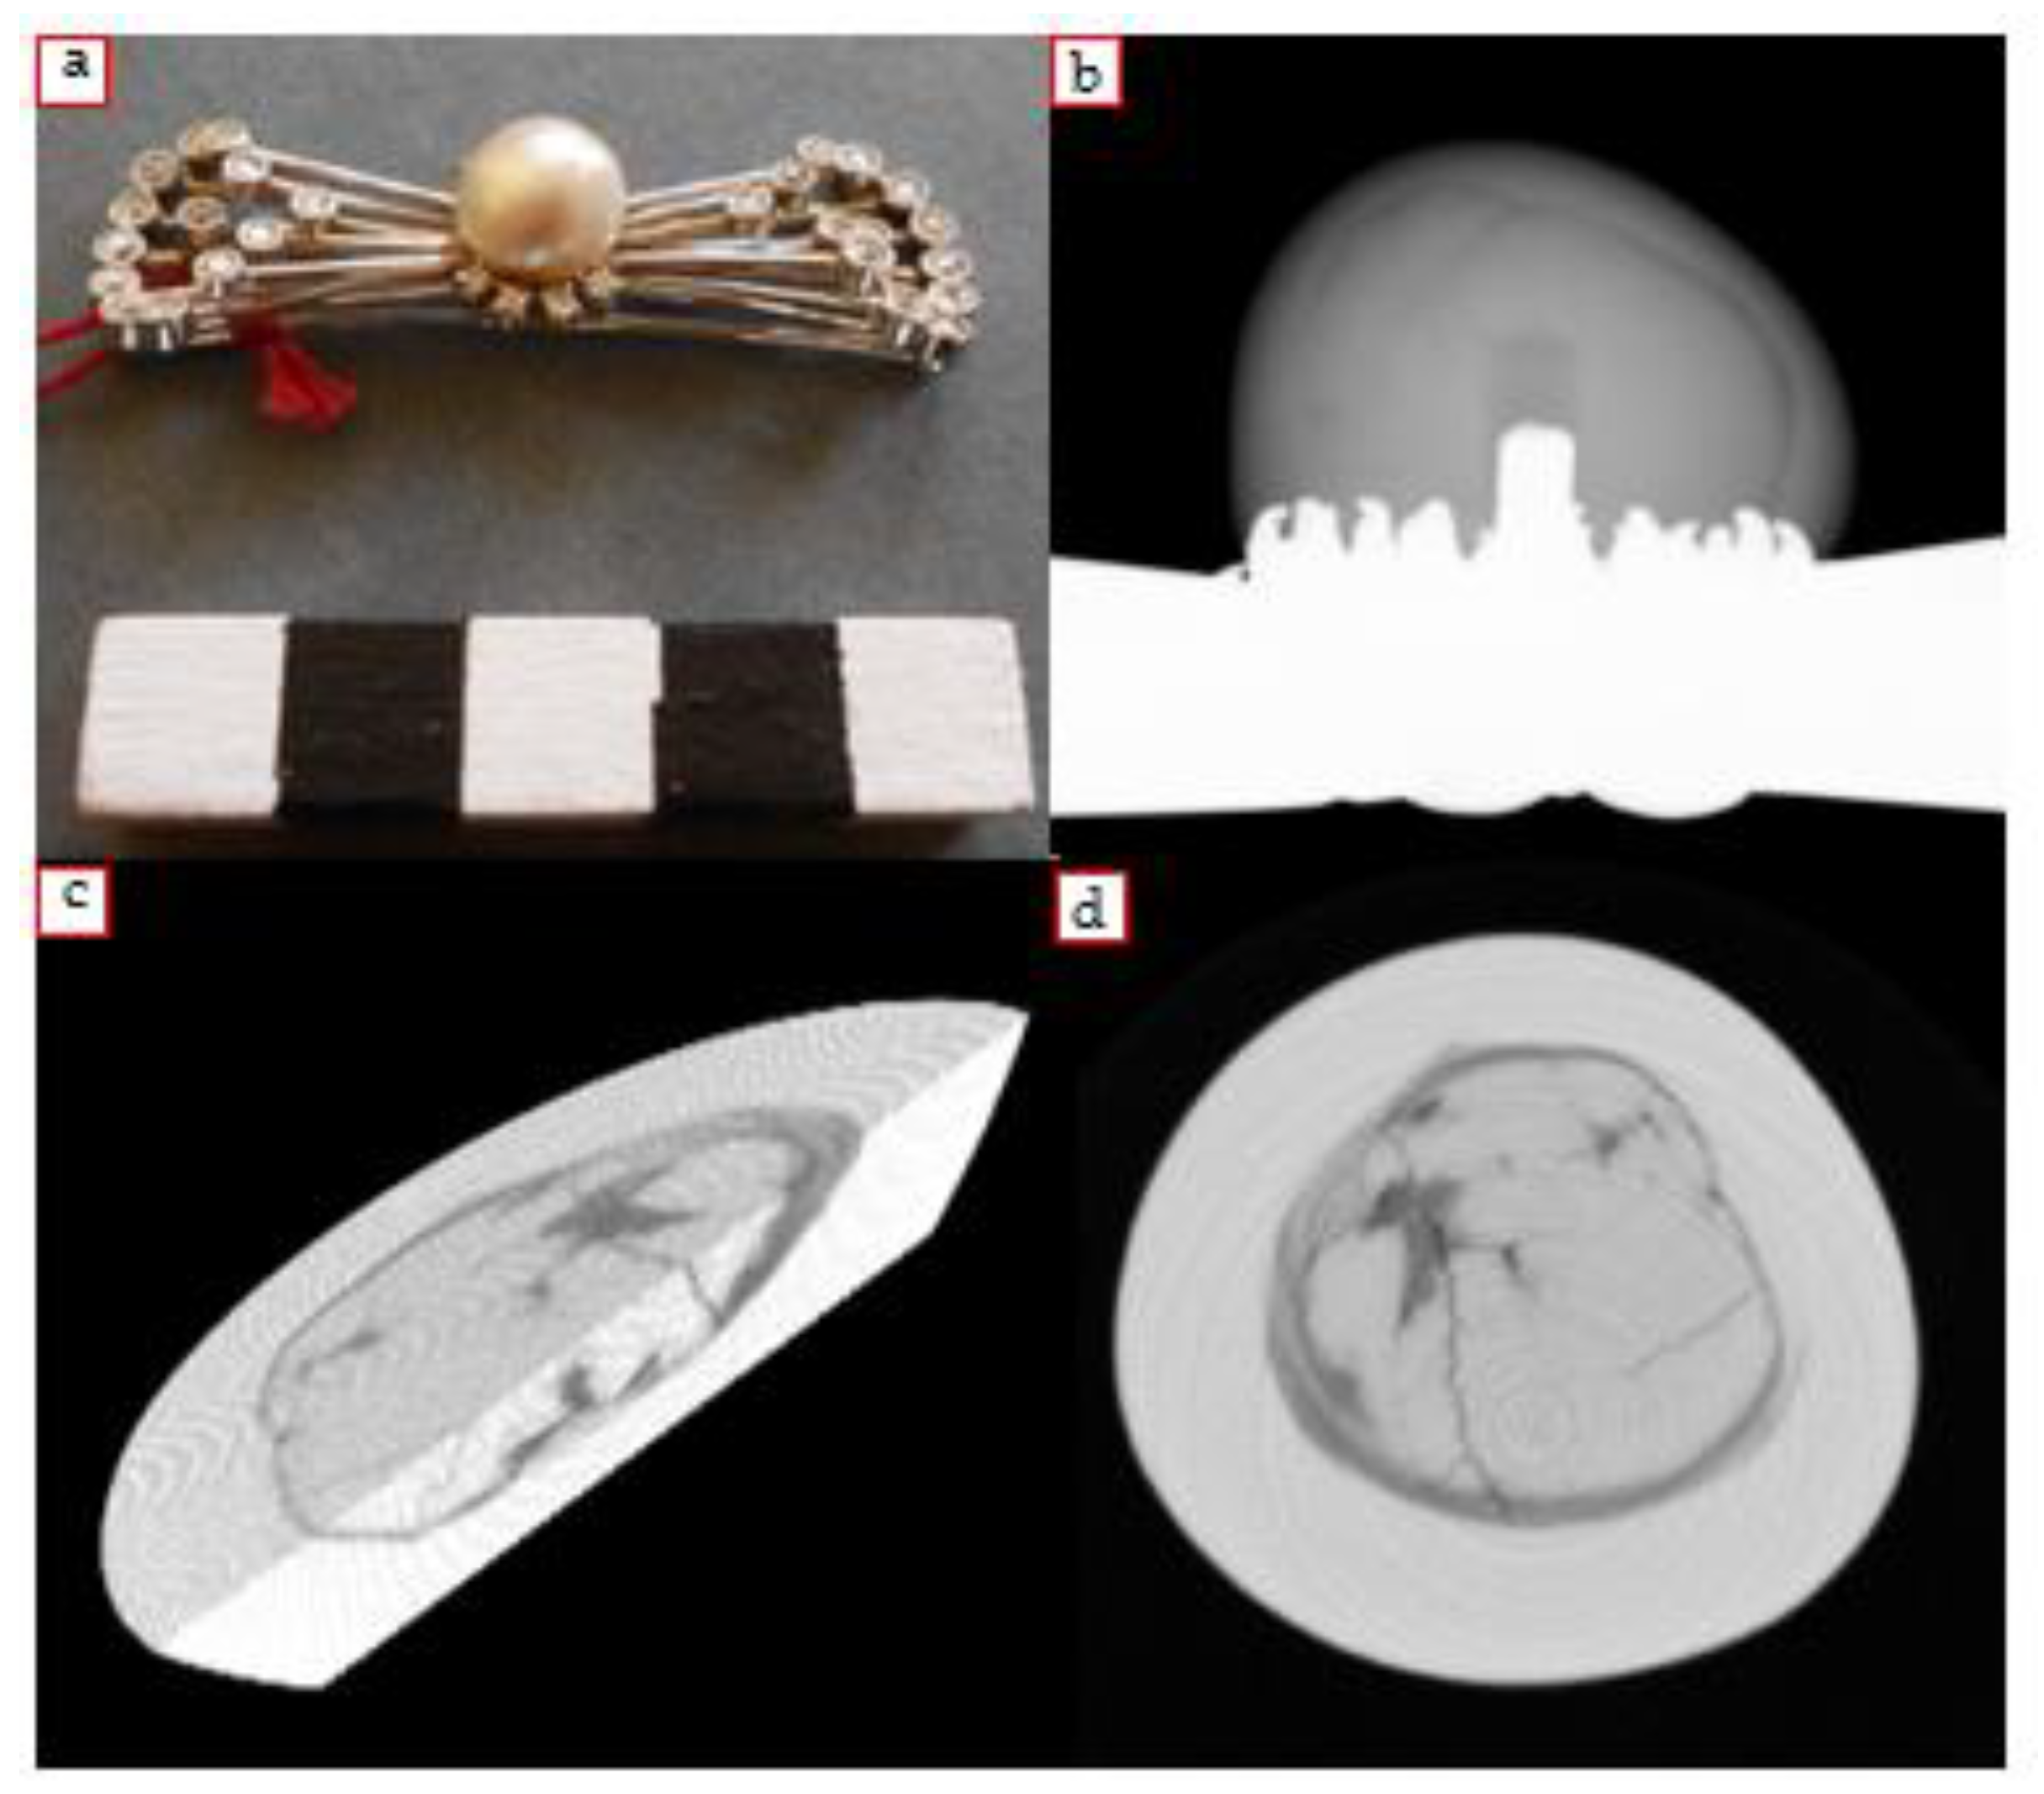
3.2. Brooch
4. Results and Discussion on Cultured Pearls
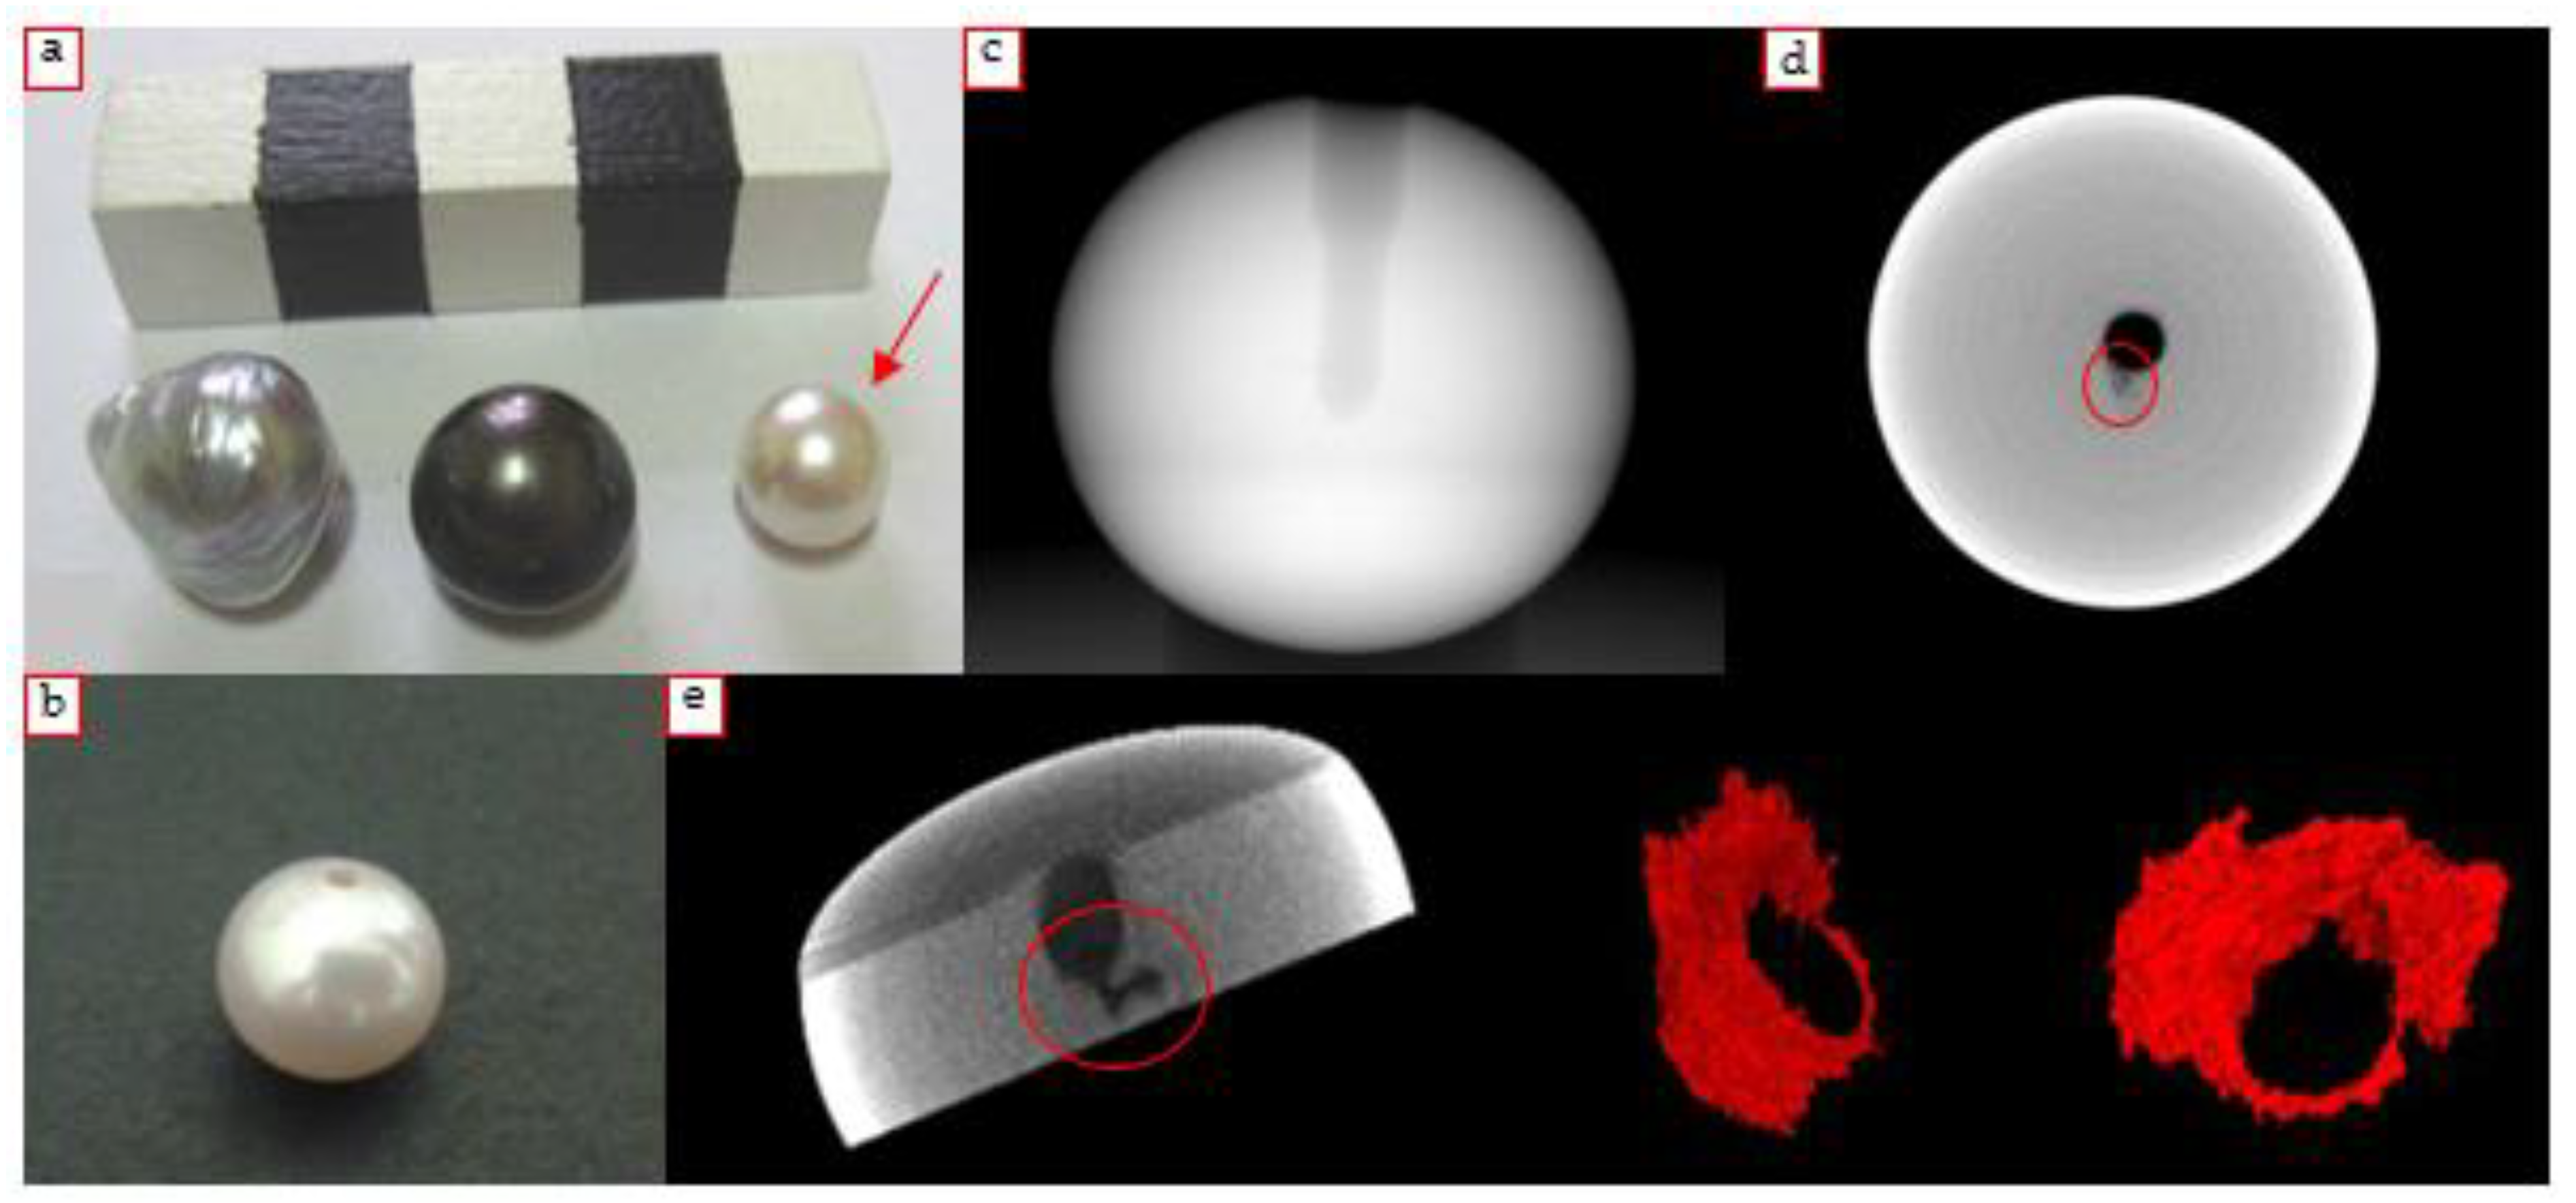
4.1. Beaded Pearls
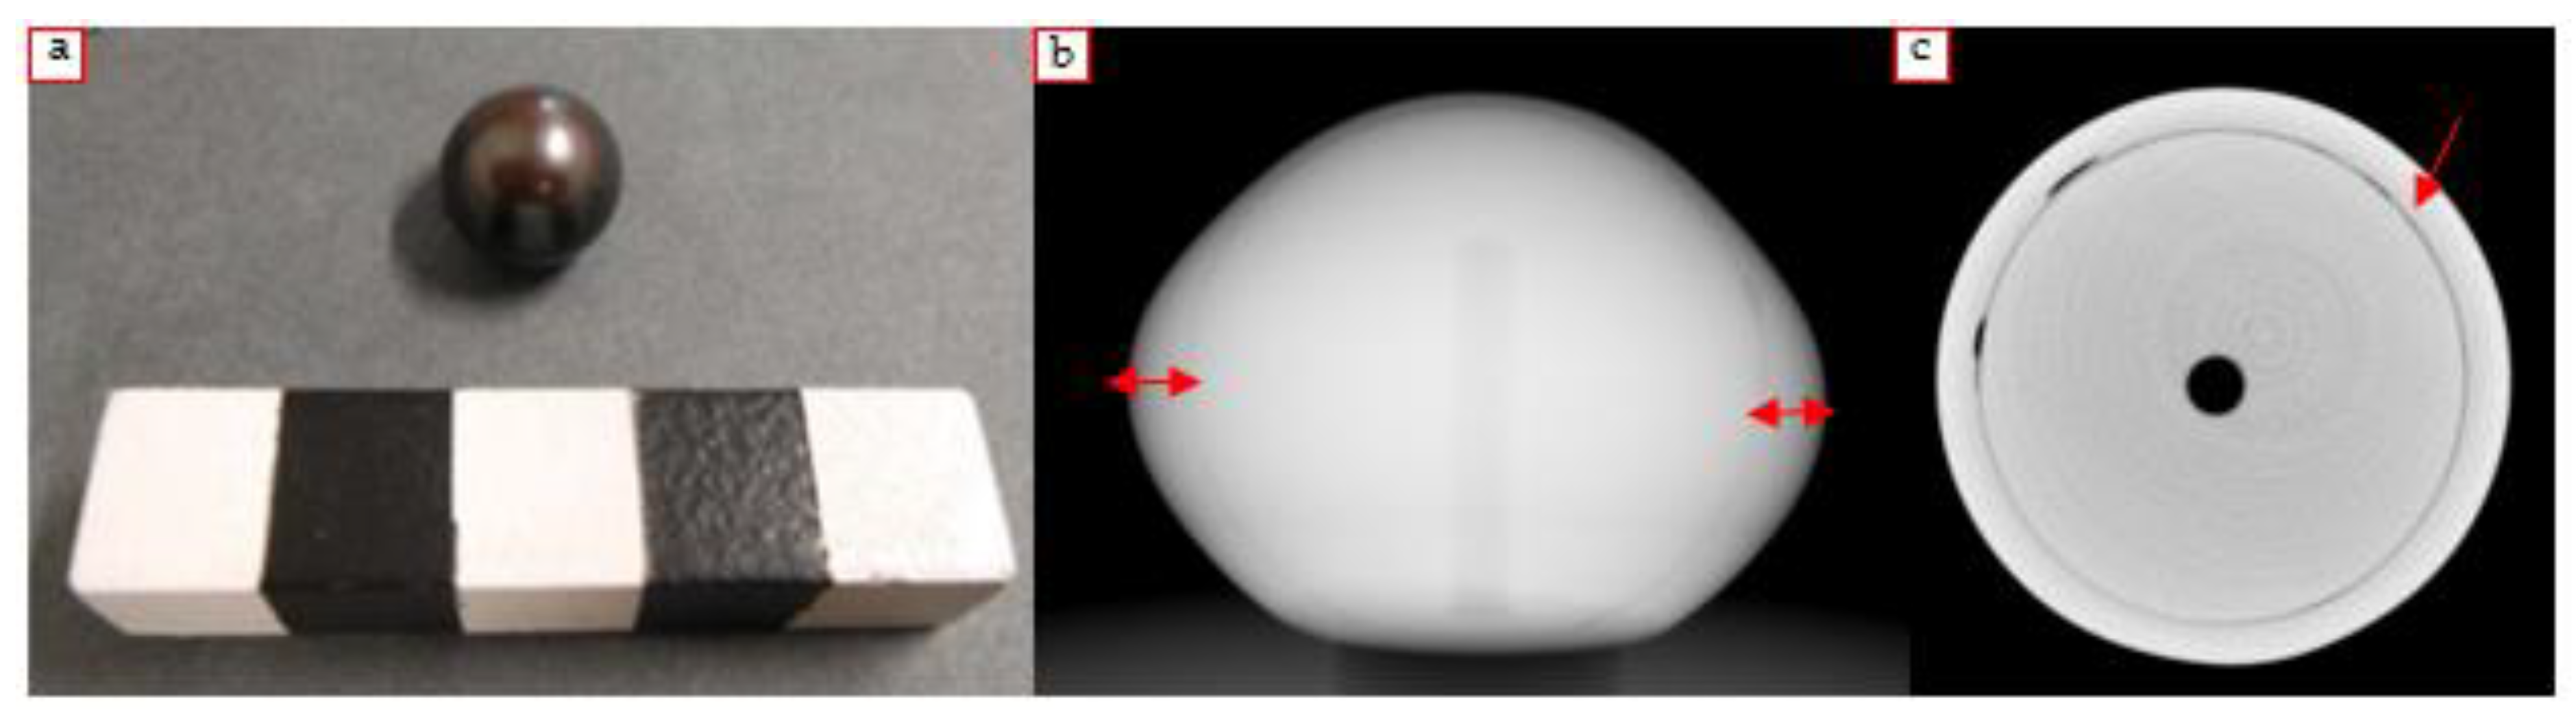
4.1.1. South Sea Pearl
4.1.2. Irradiated Pearl with γ-rays
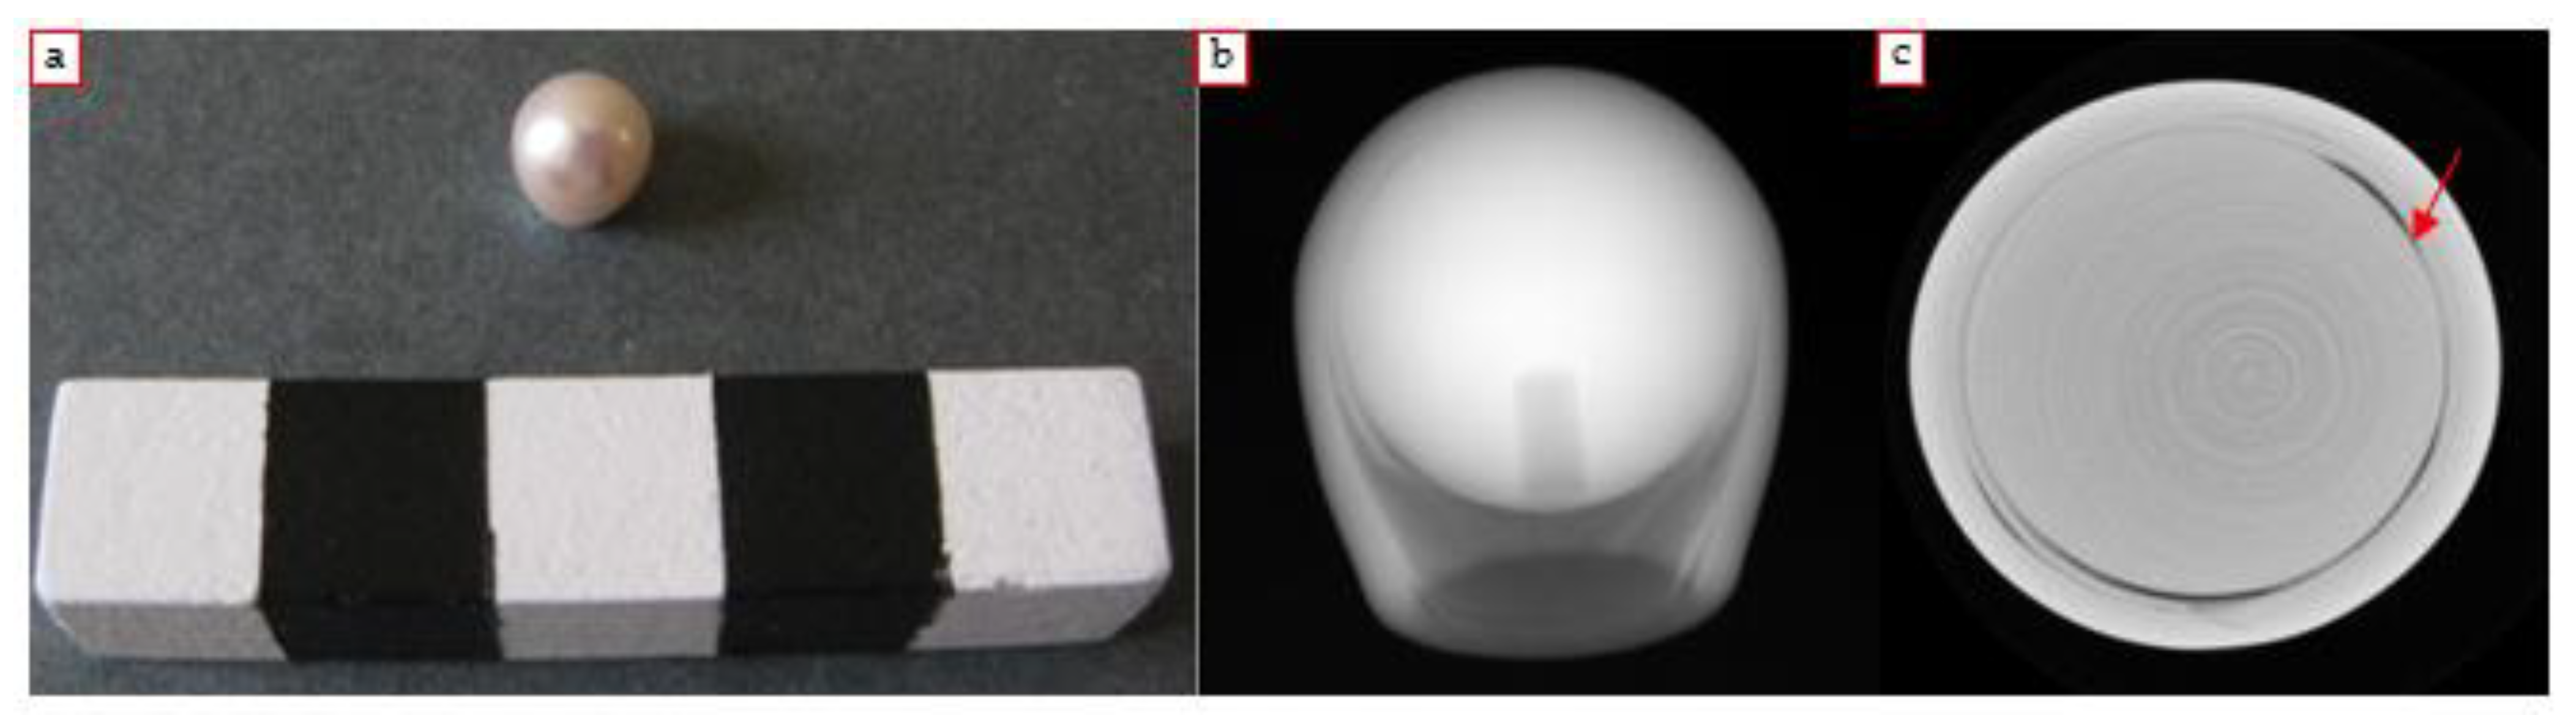
4.1.3. Pink Pearl
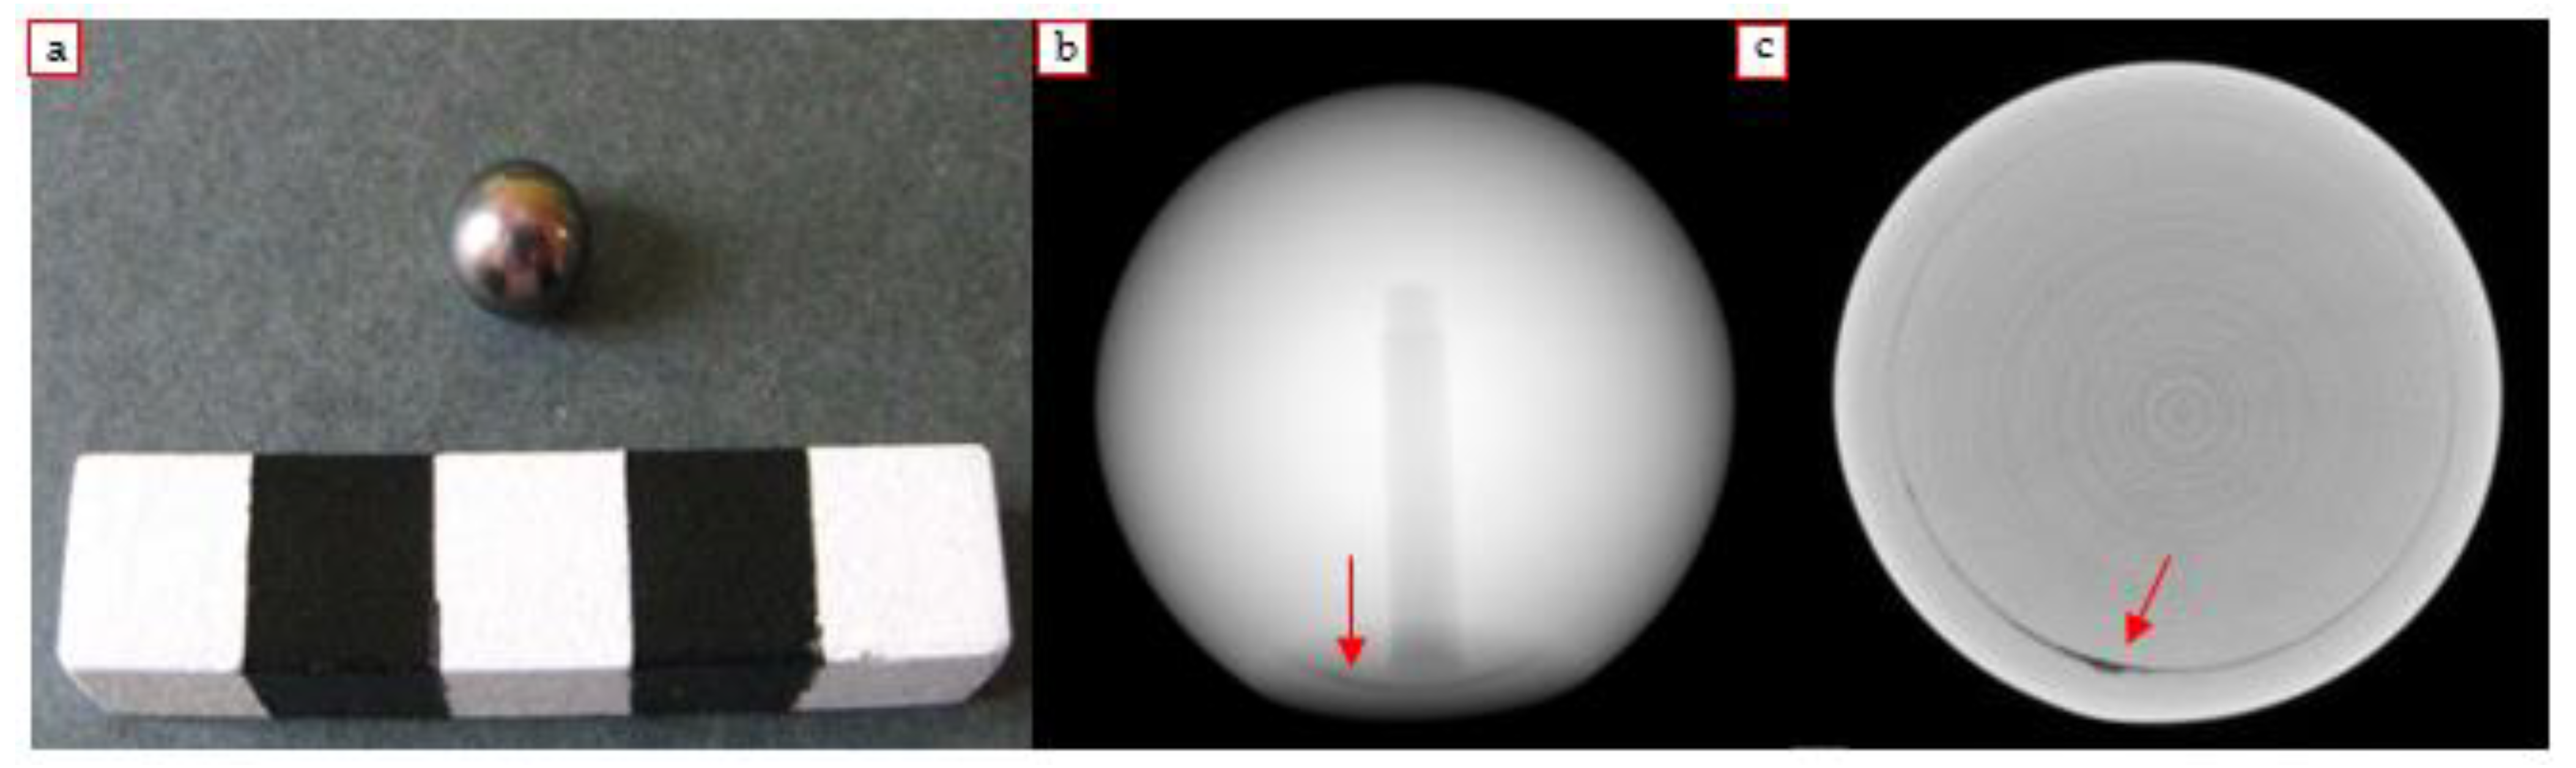
4.1.4. Black Pearl
4.1.5. Akoya Japanese Pearl
4.2. Non-Beaded Pearls
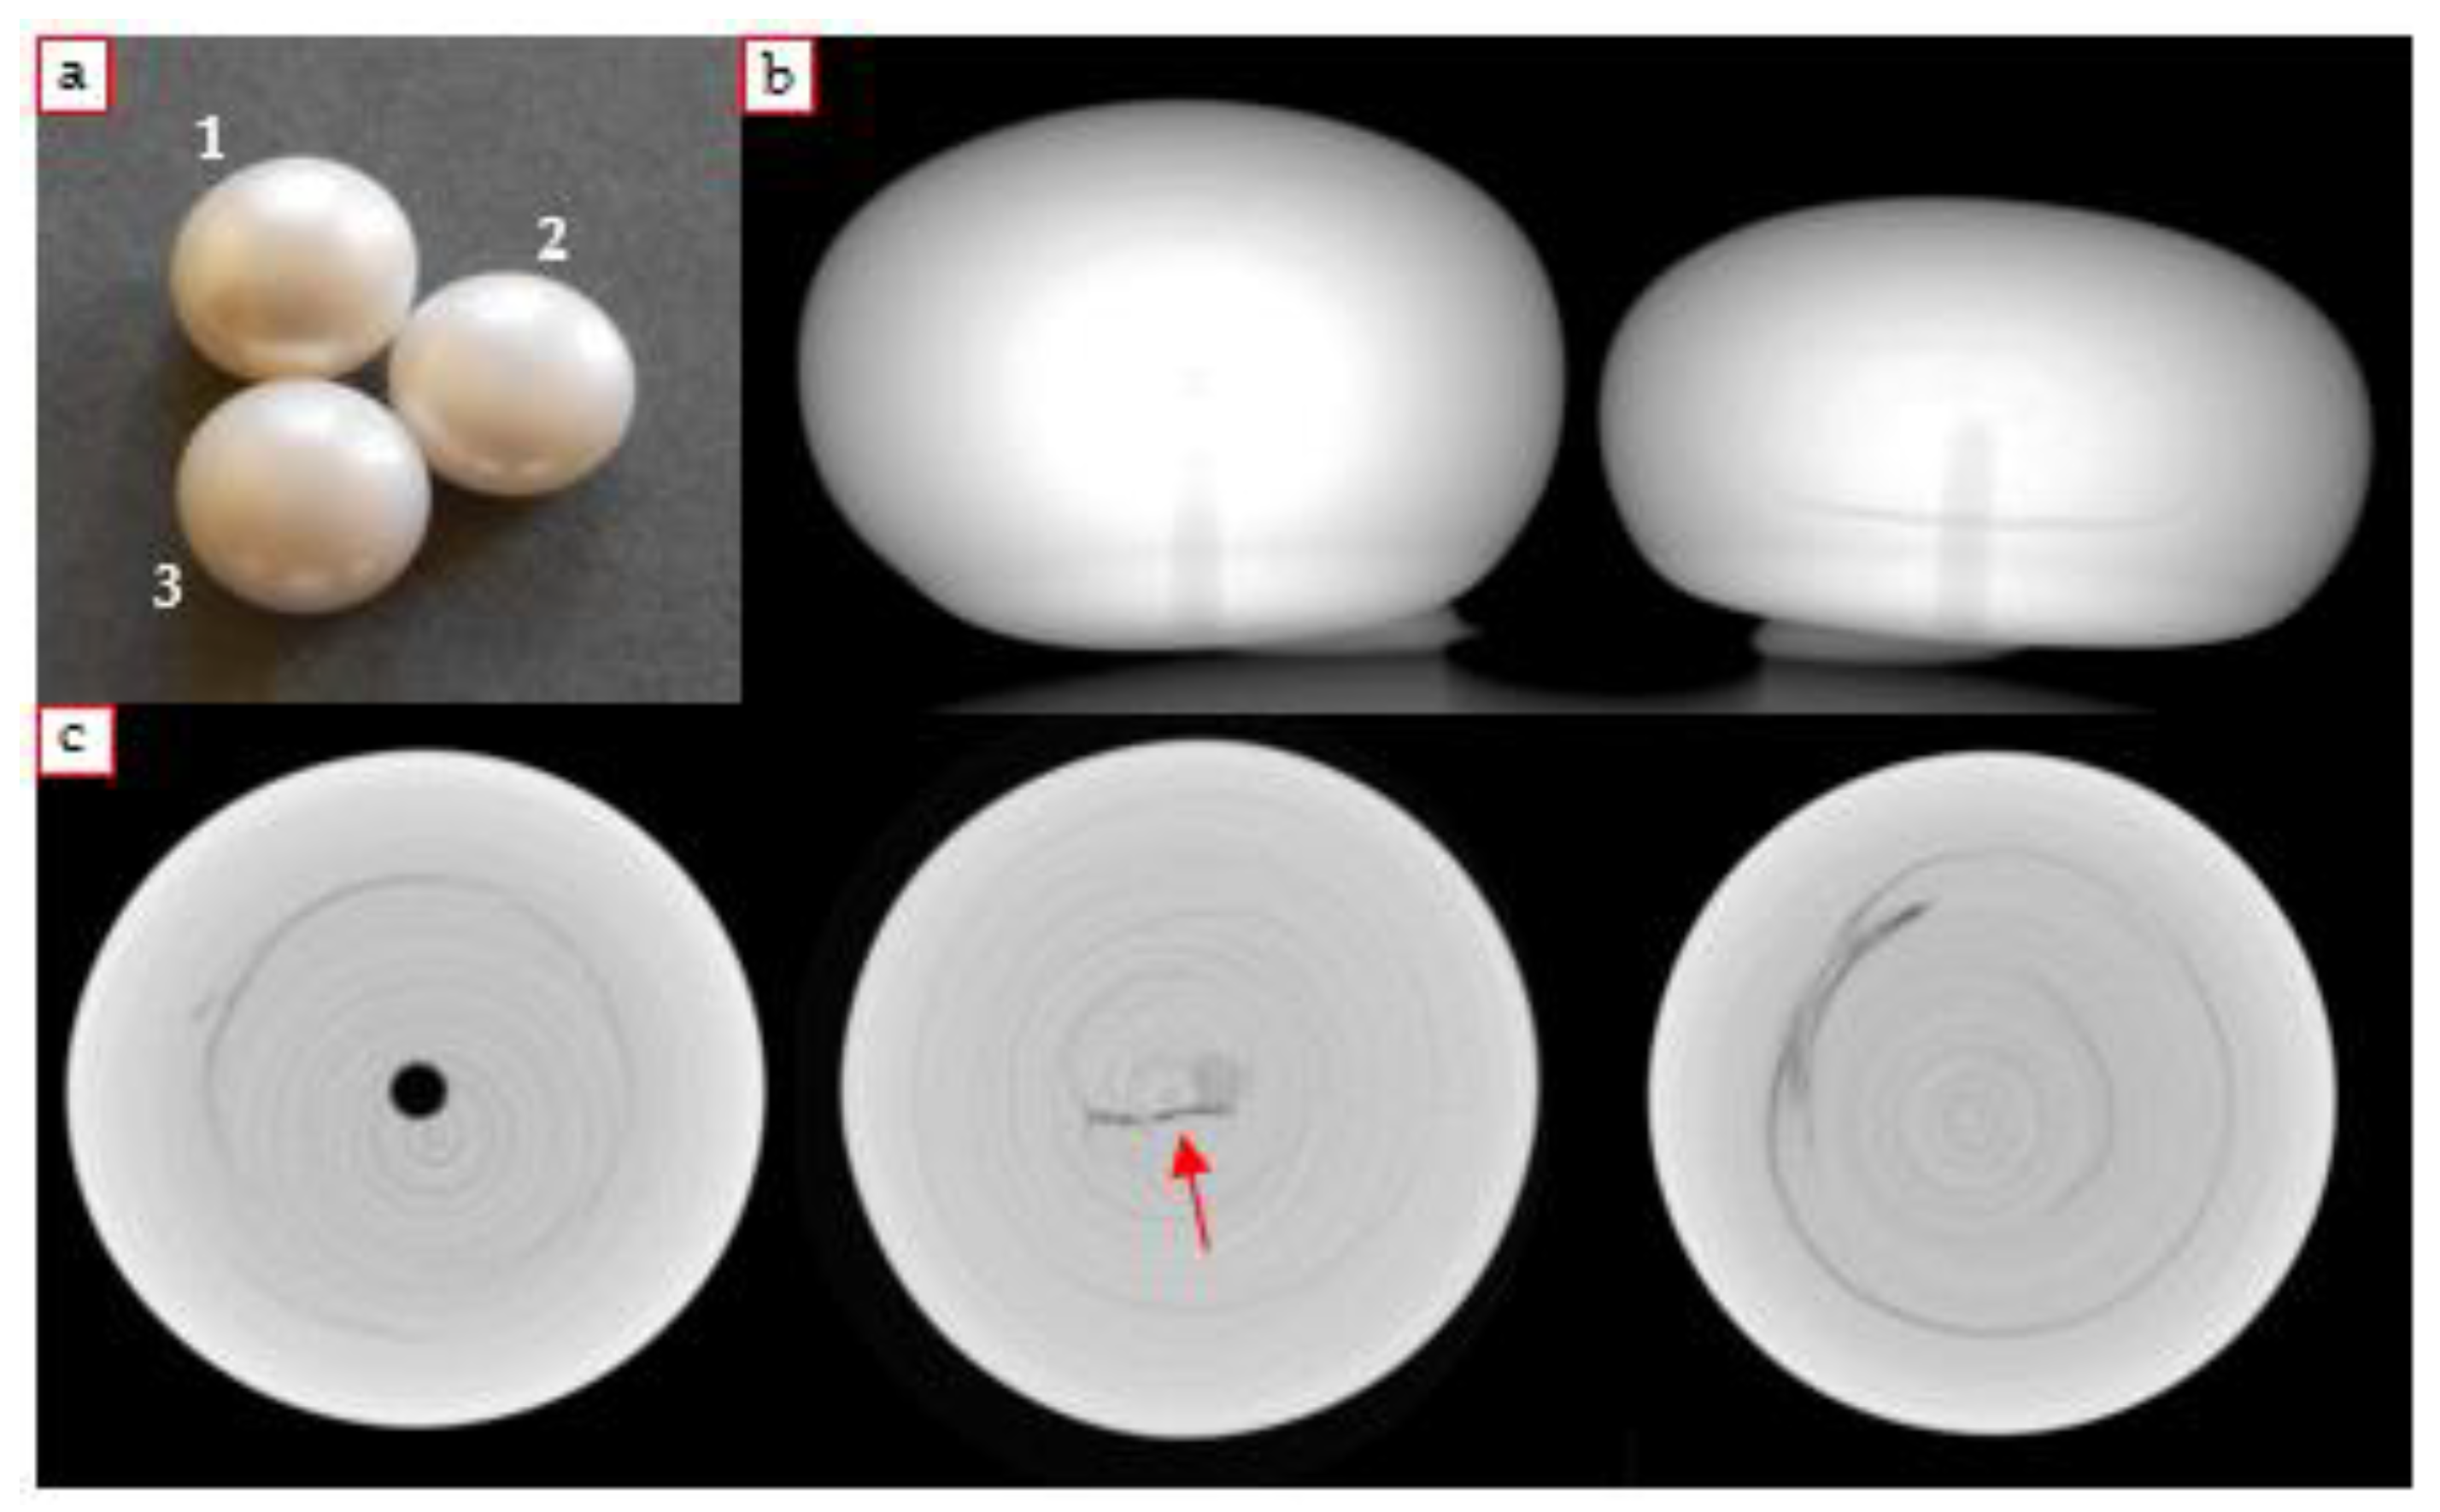
4.2.1. Freshwater Pearls
4.2.2. Saltwater Pearls (Keshi)
4.3. Particular Cases
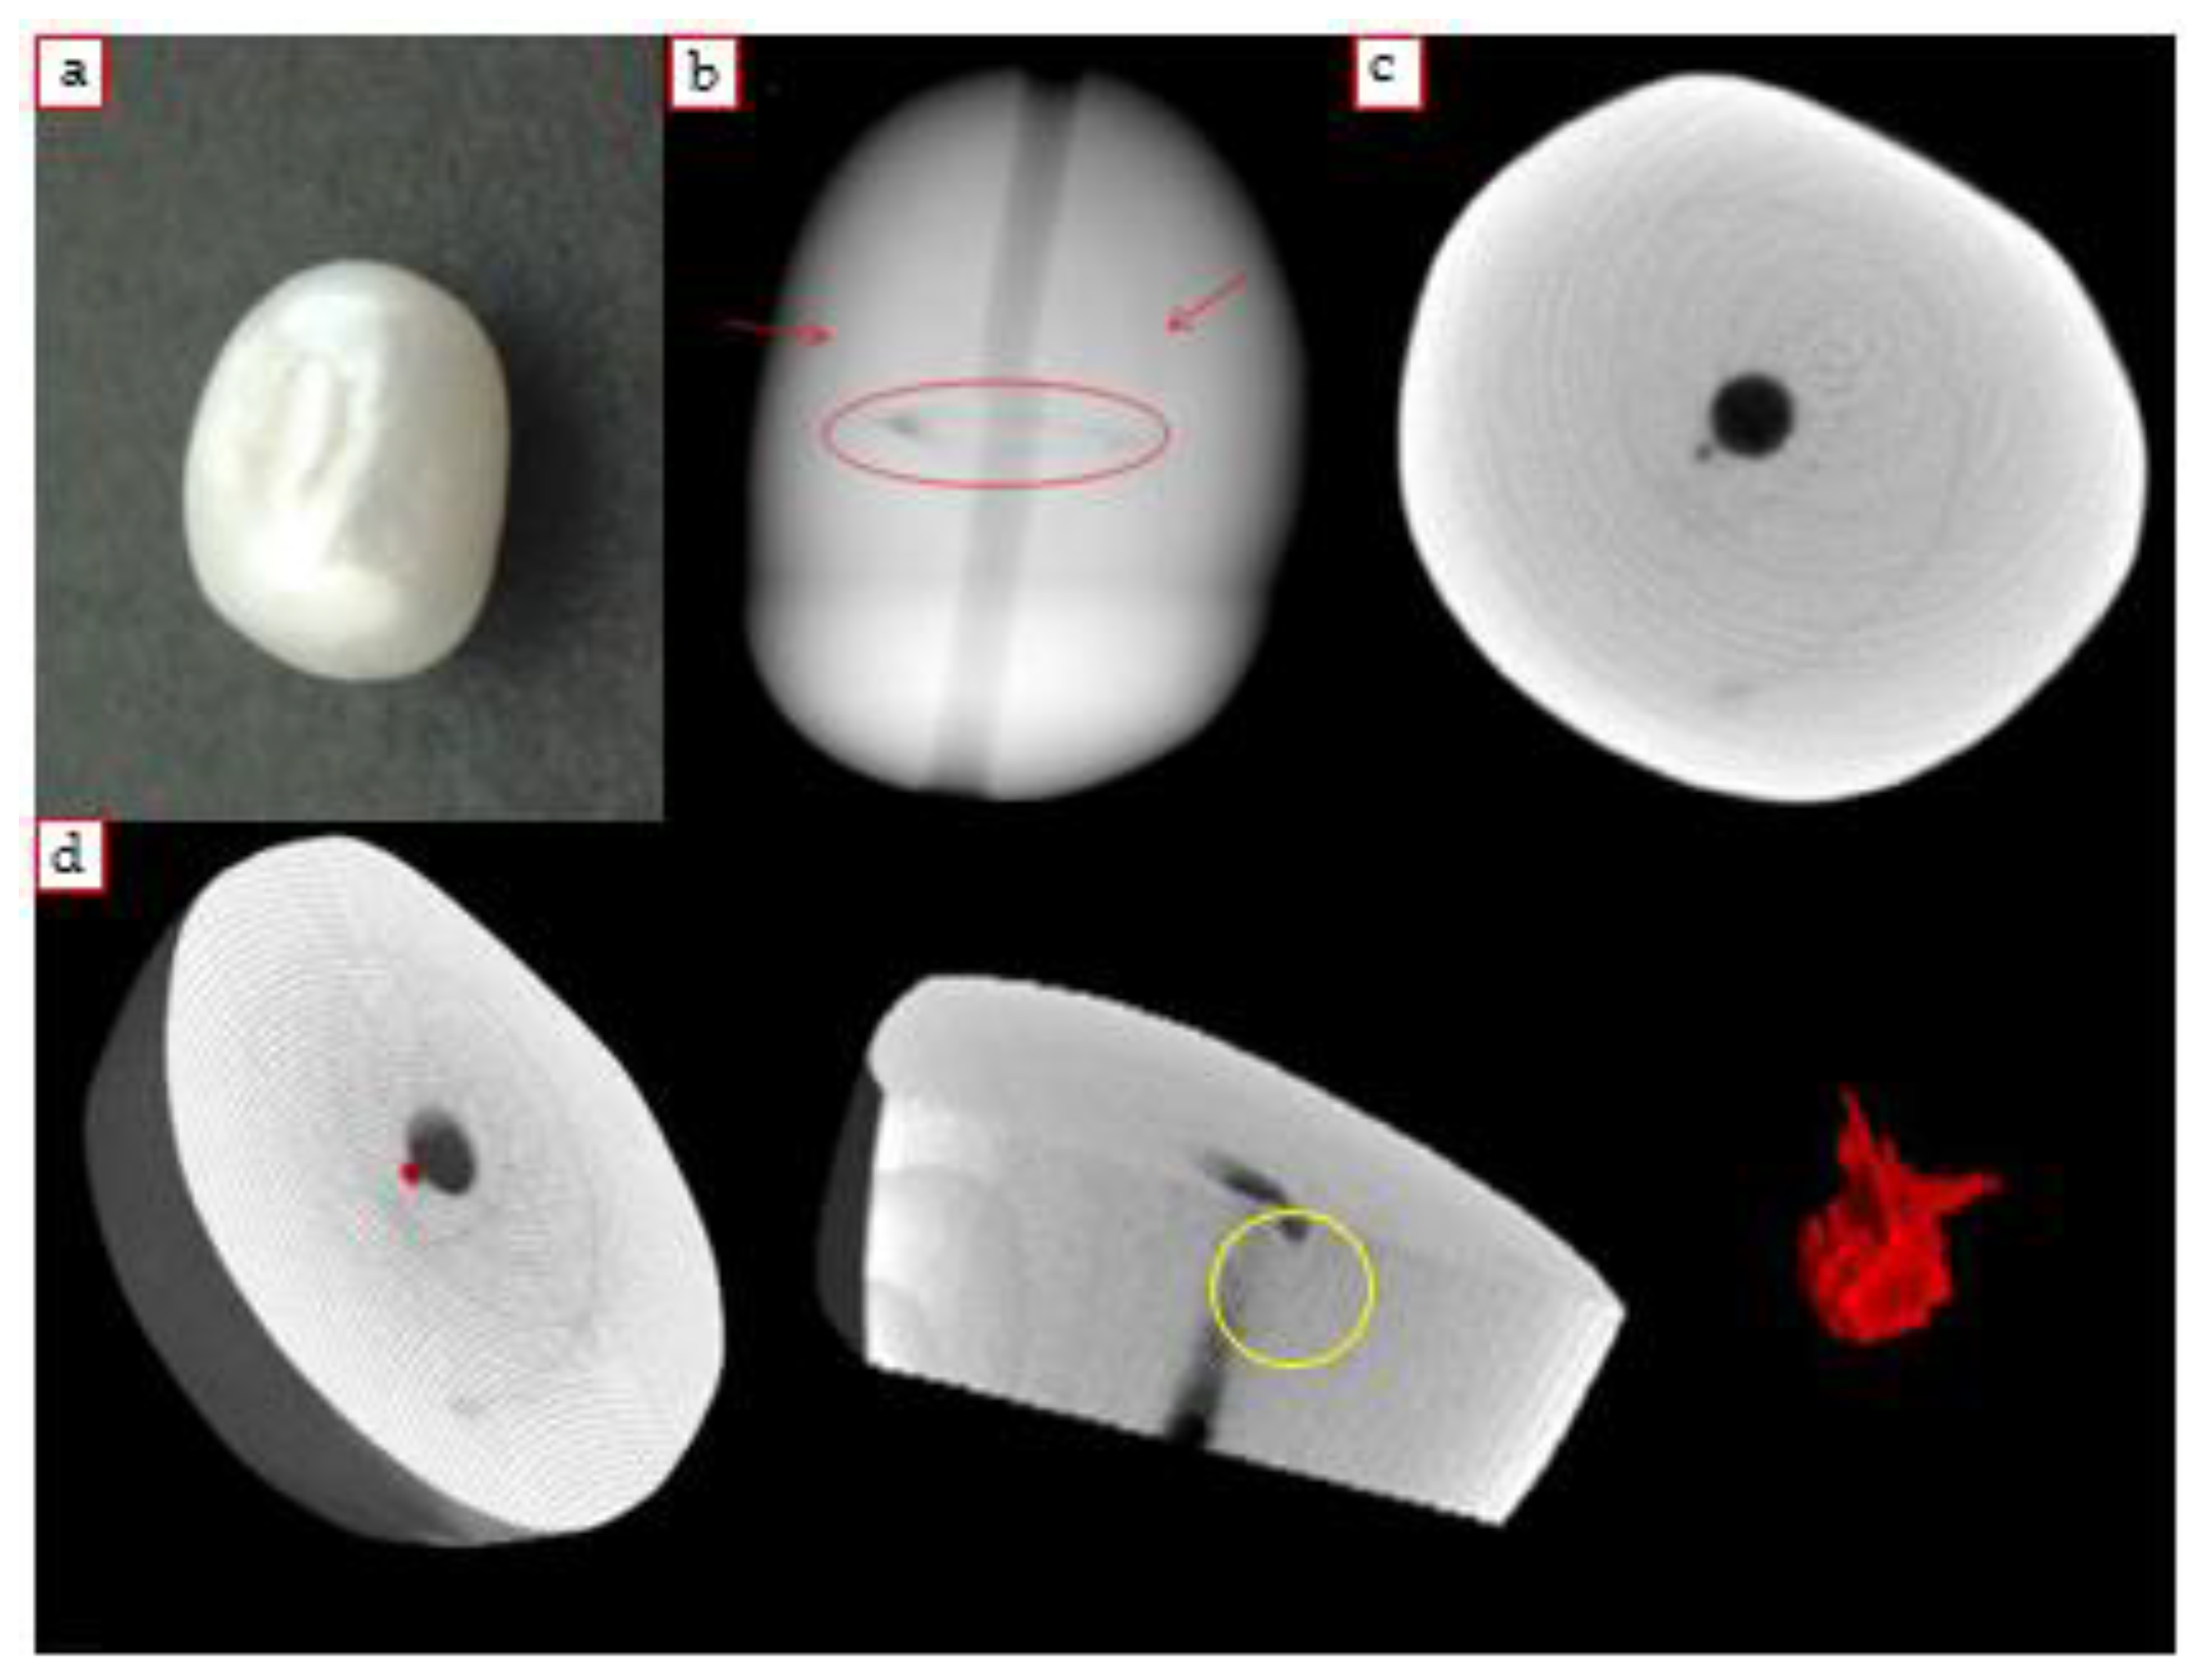
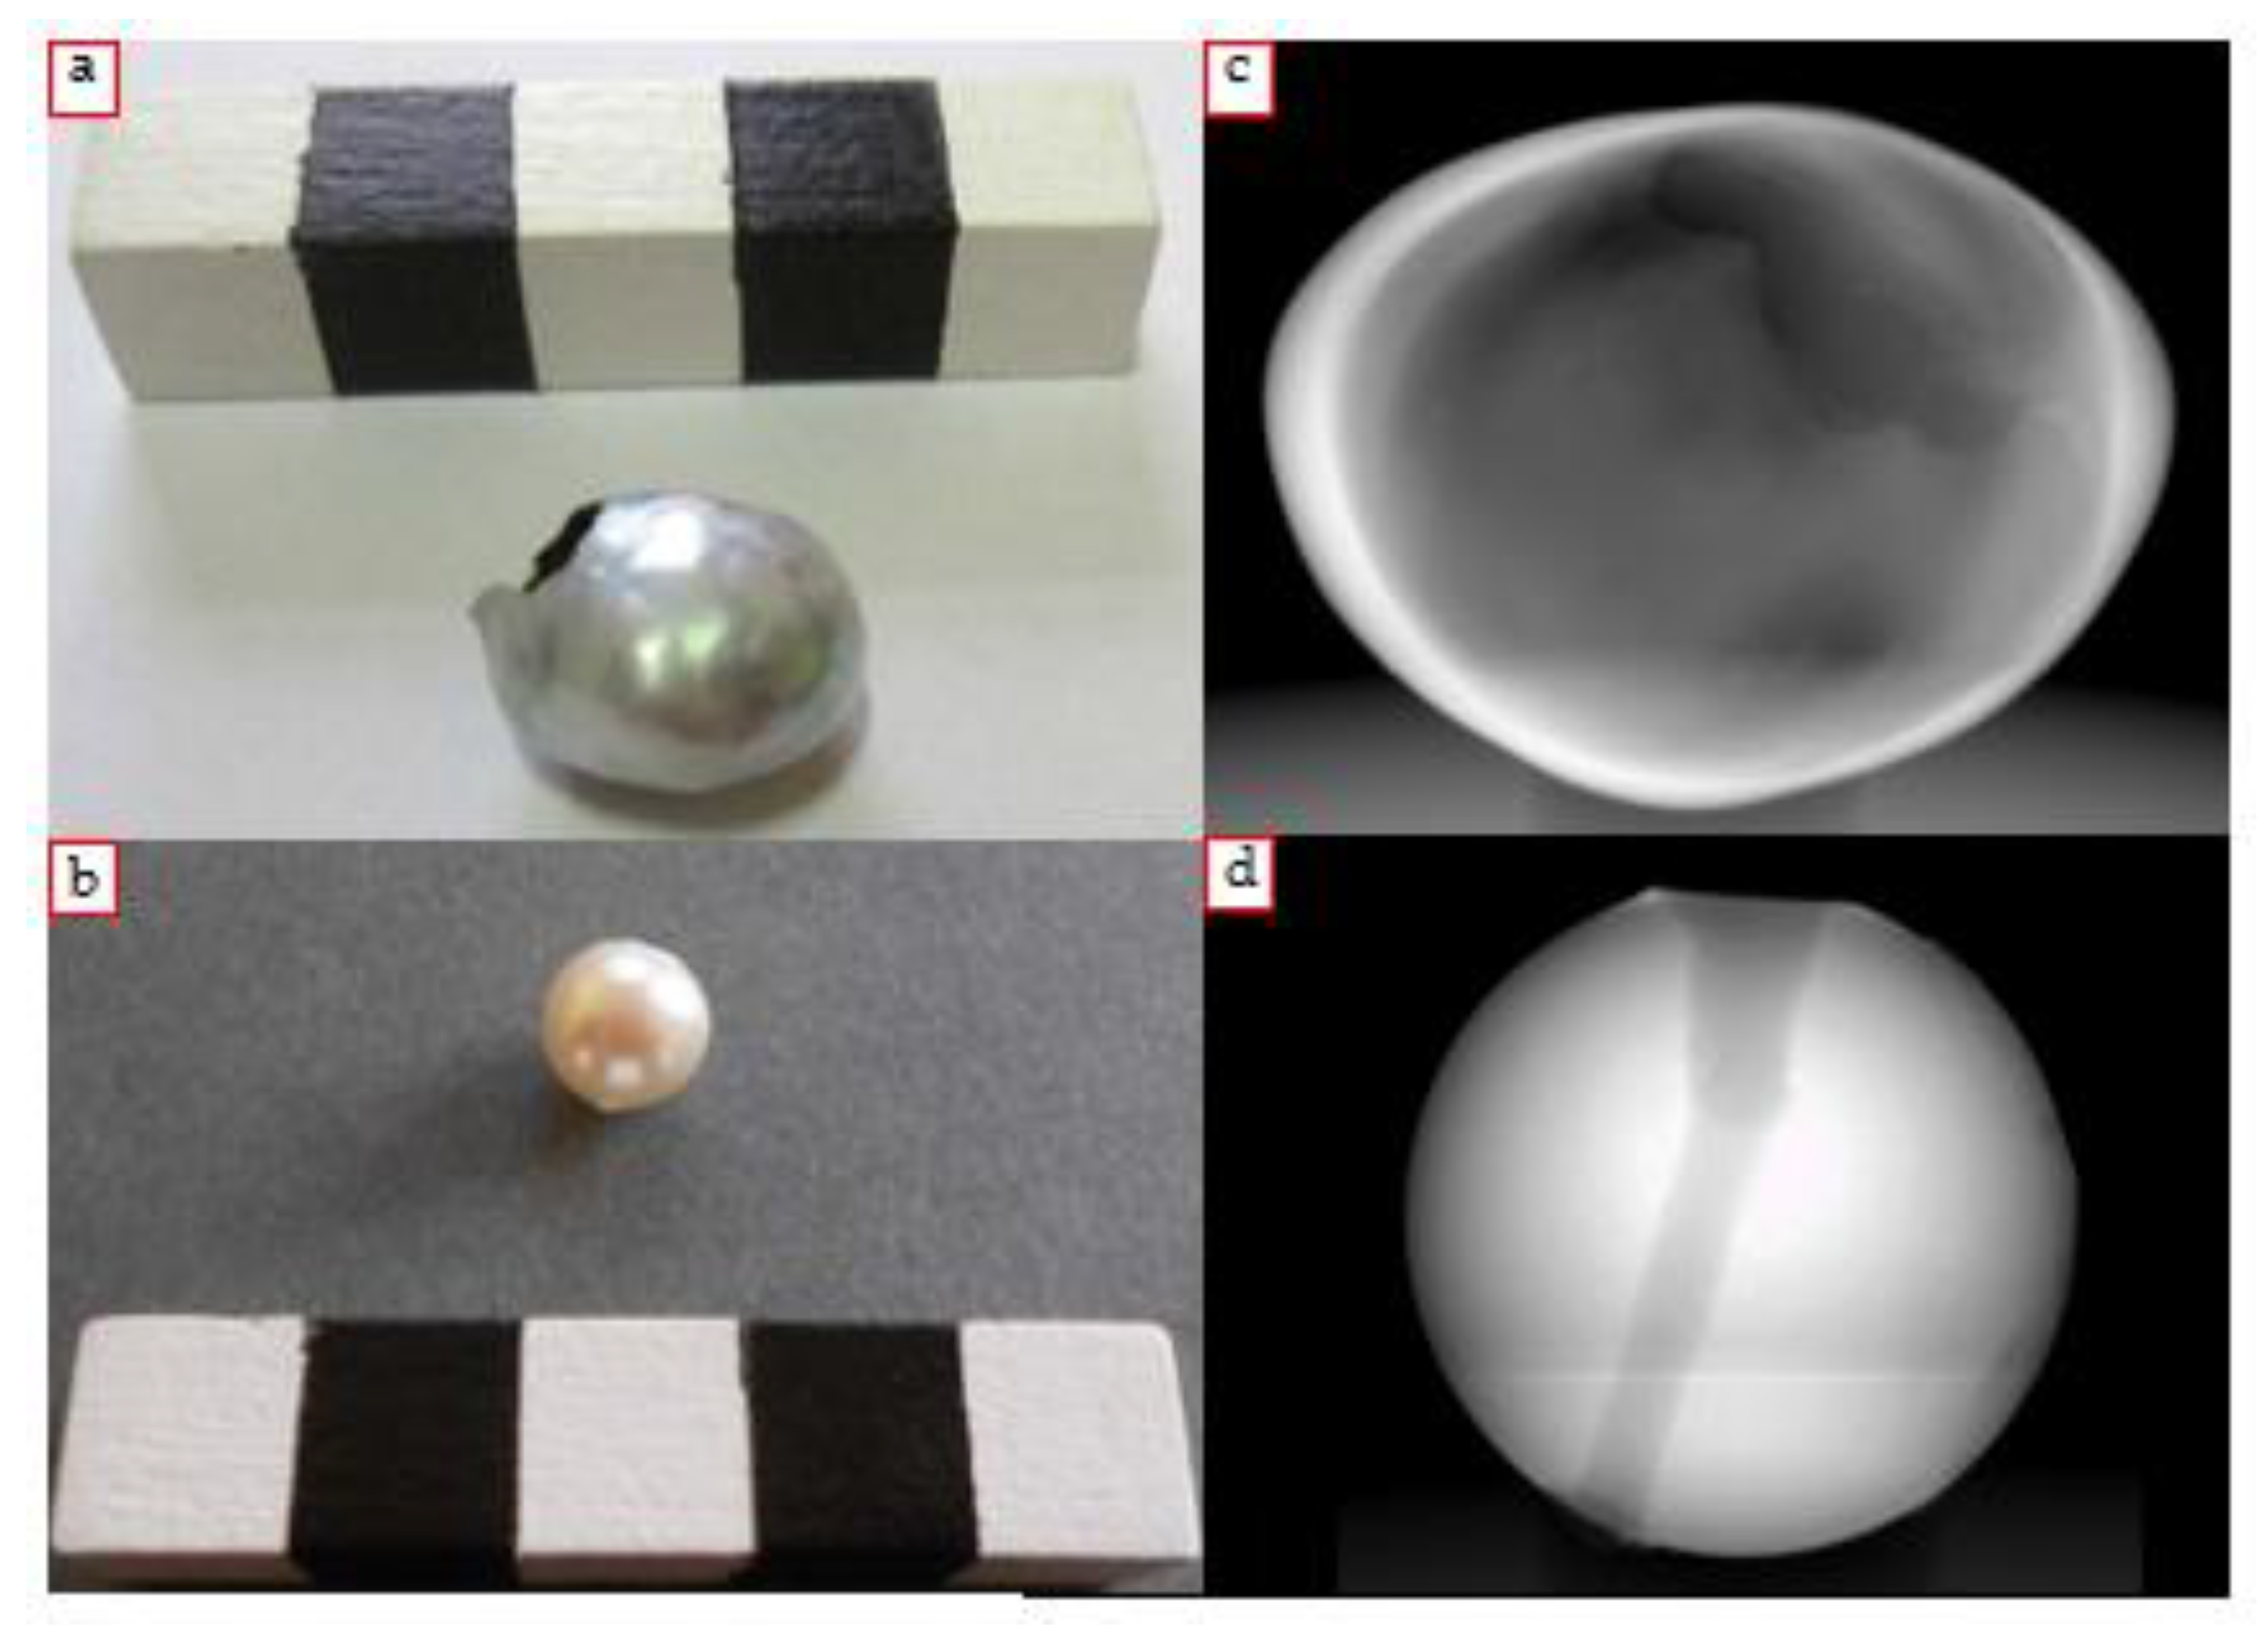
4.3.1. Soufflè Pearl
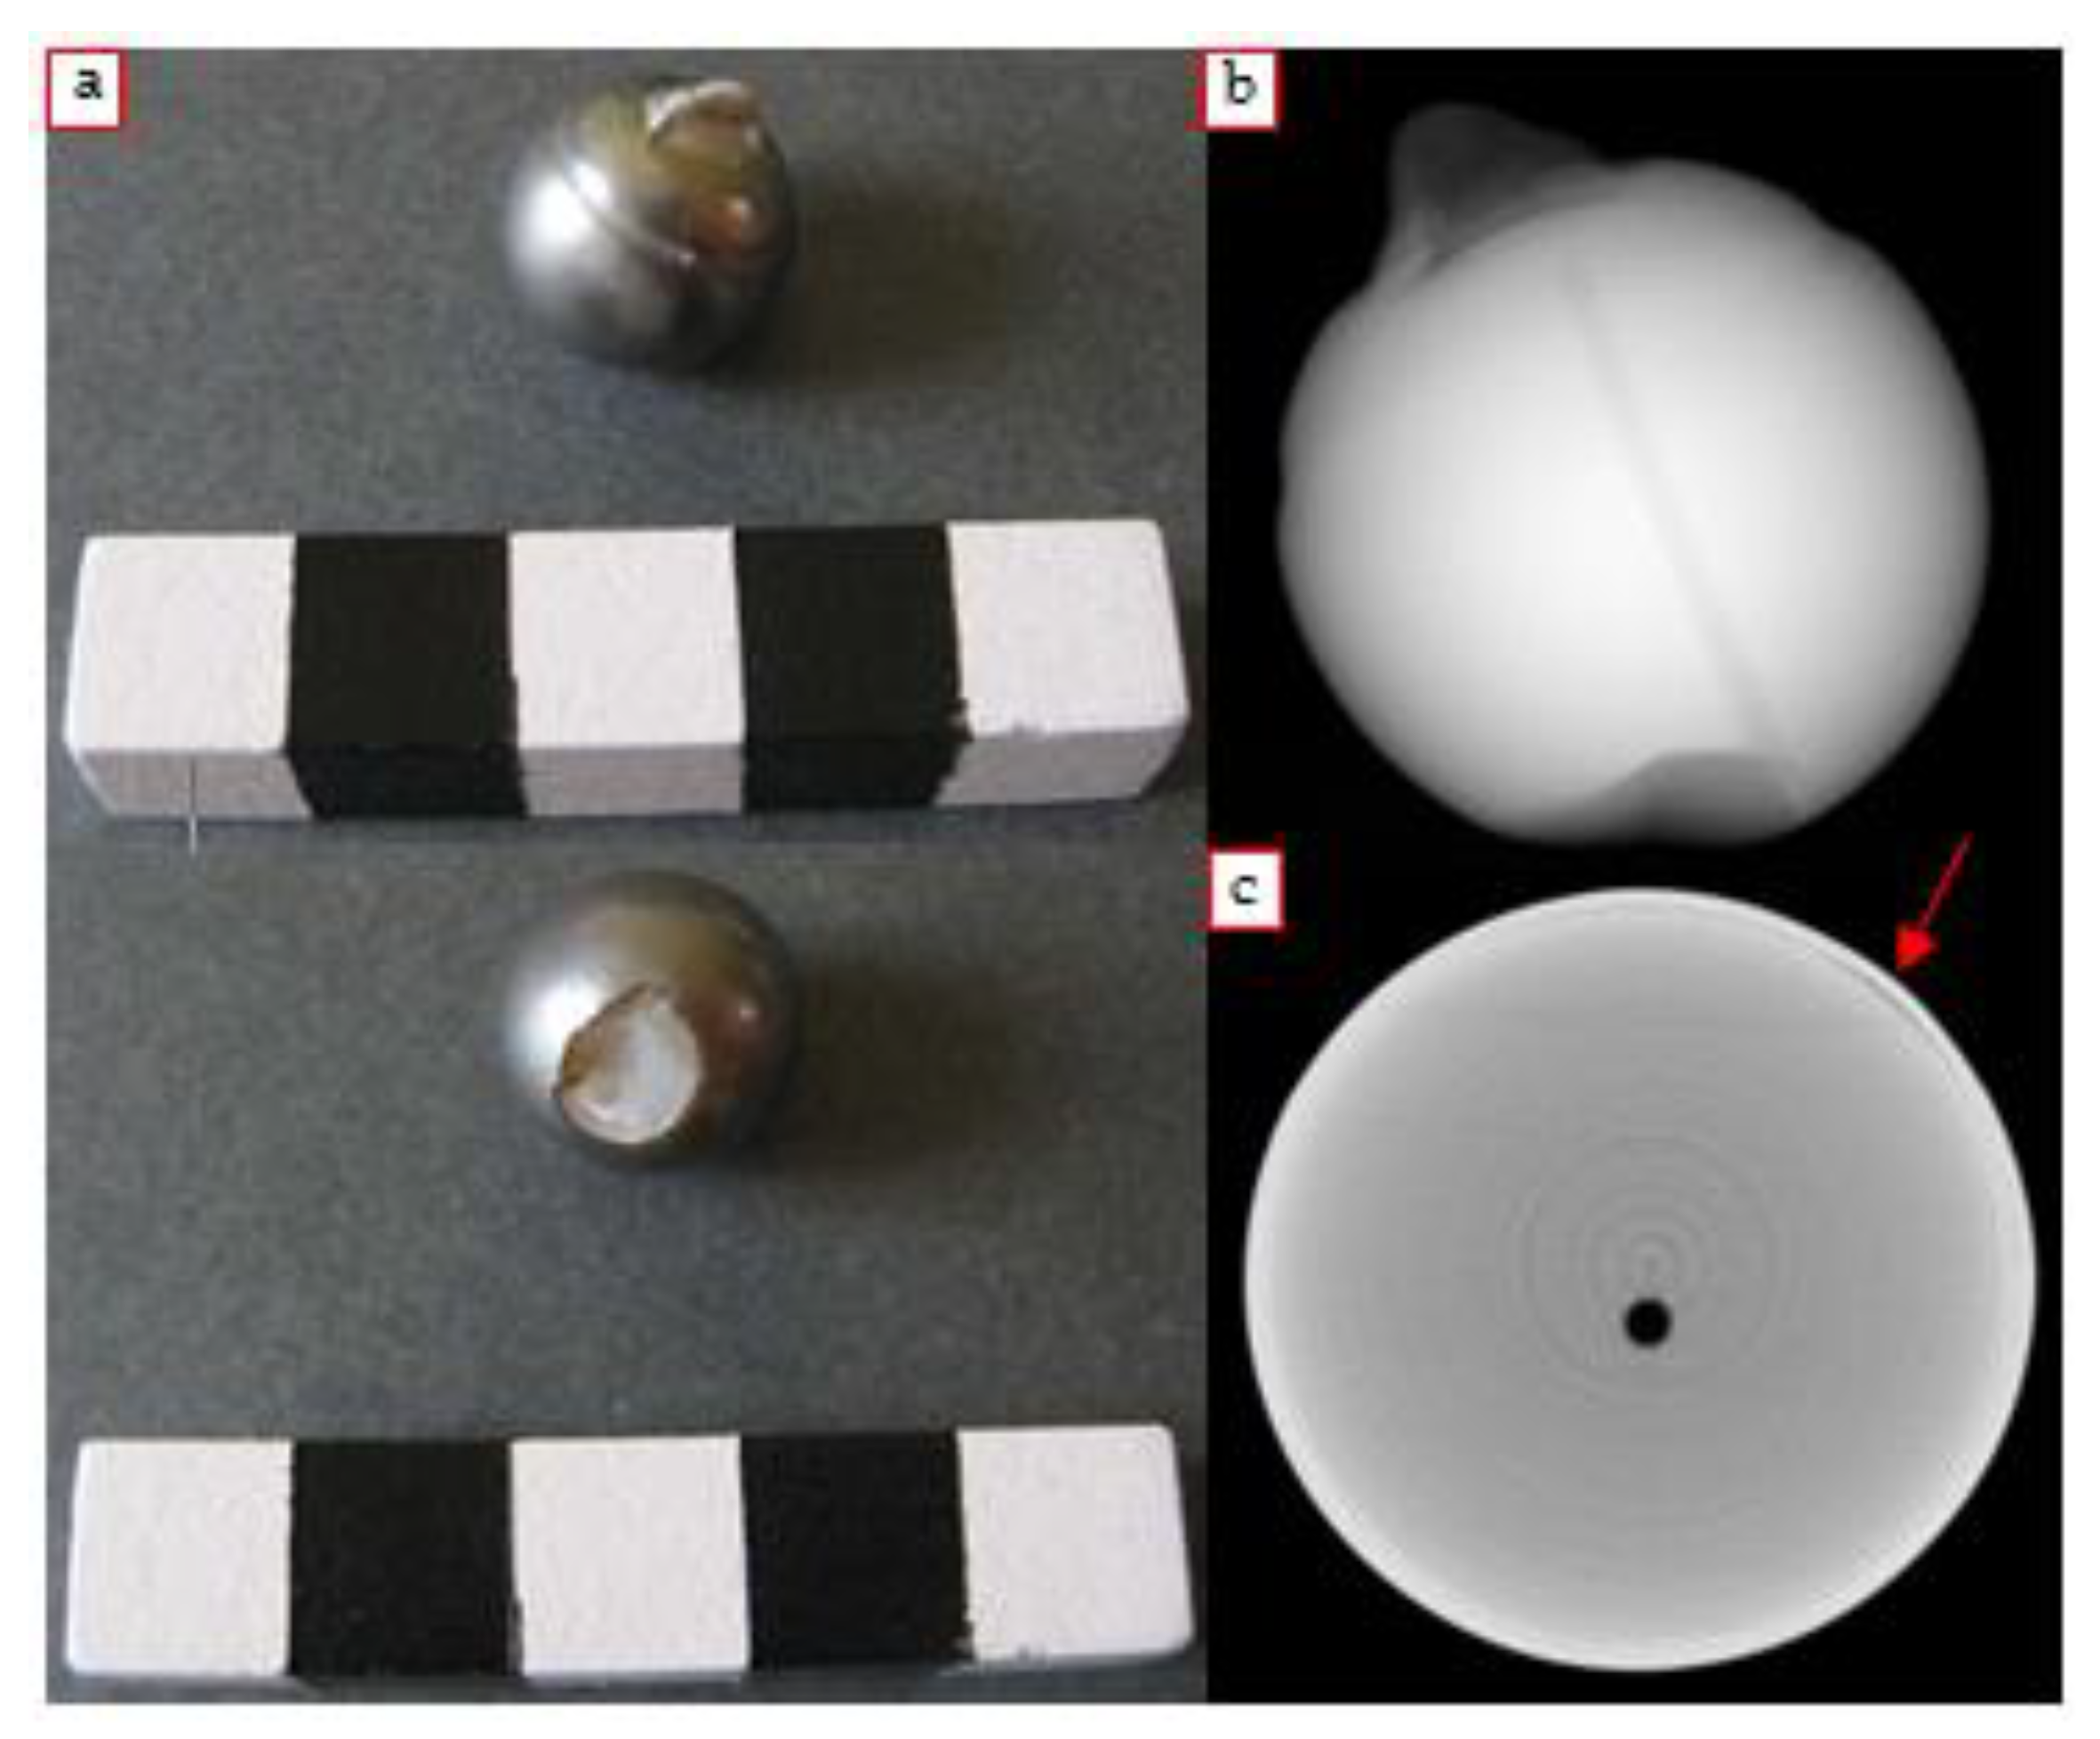
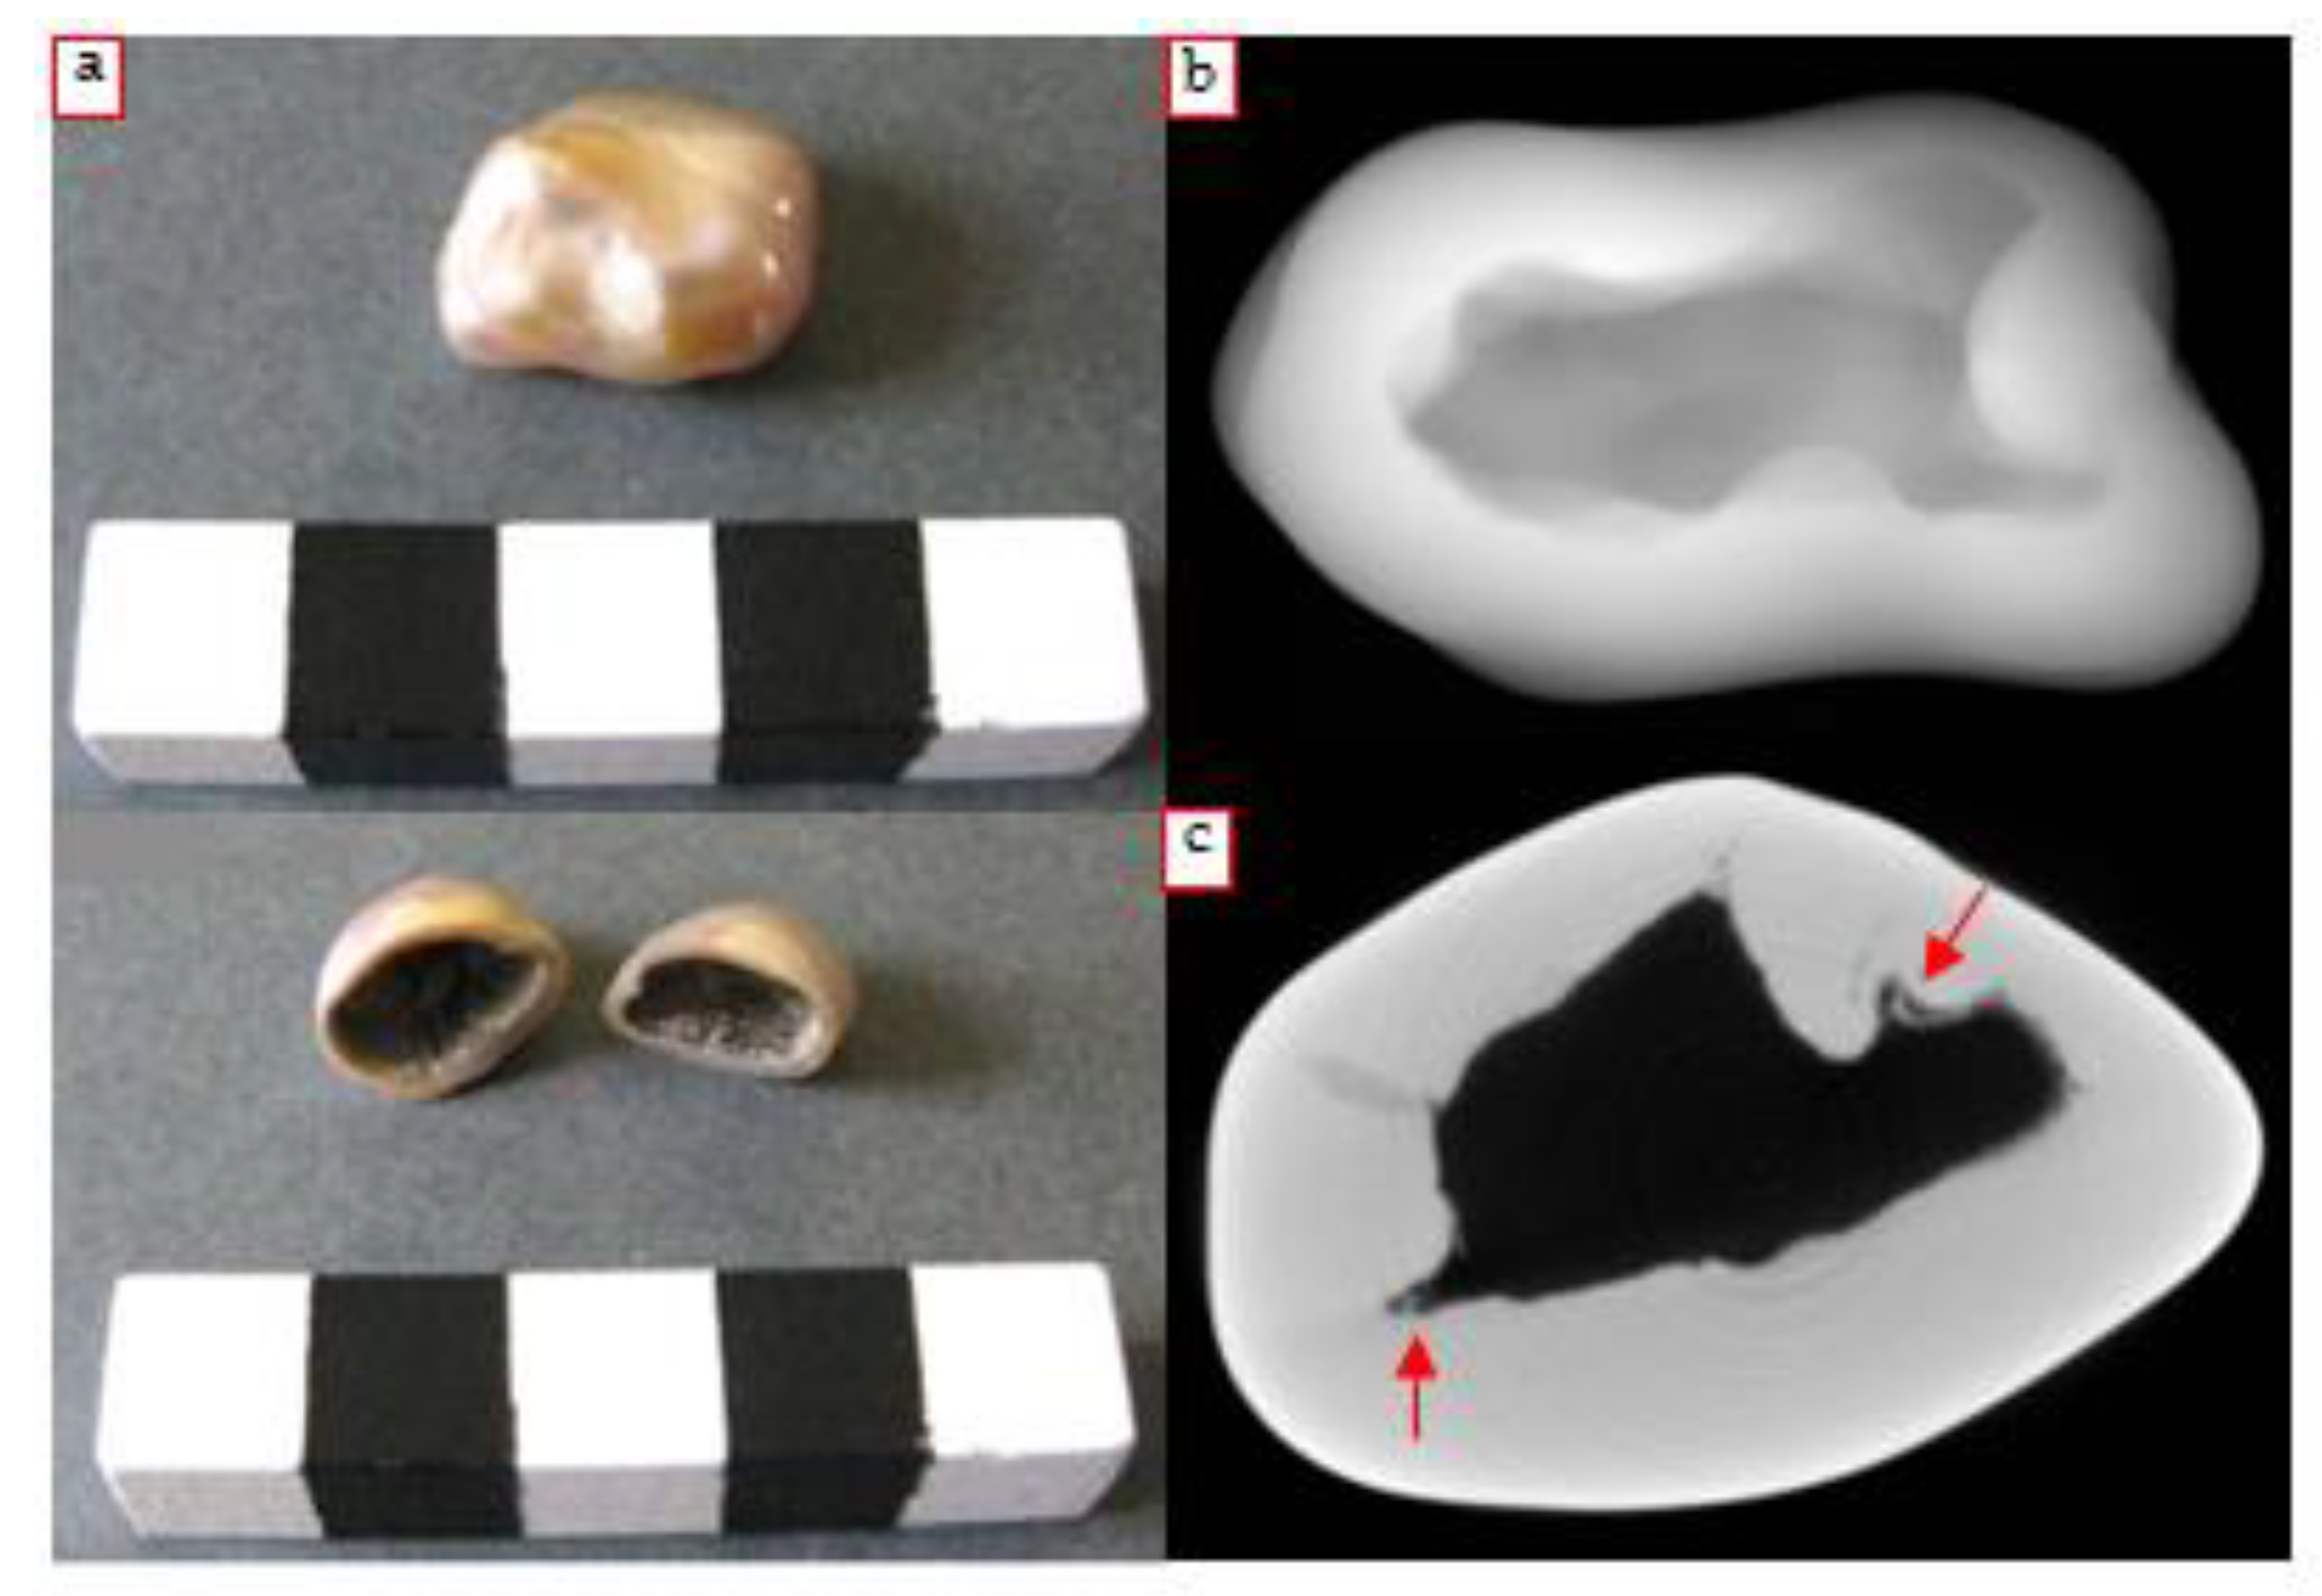
4.3.2. Beaded Empty Pearl
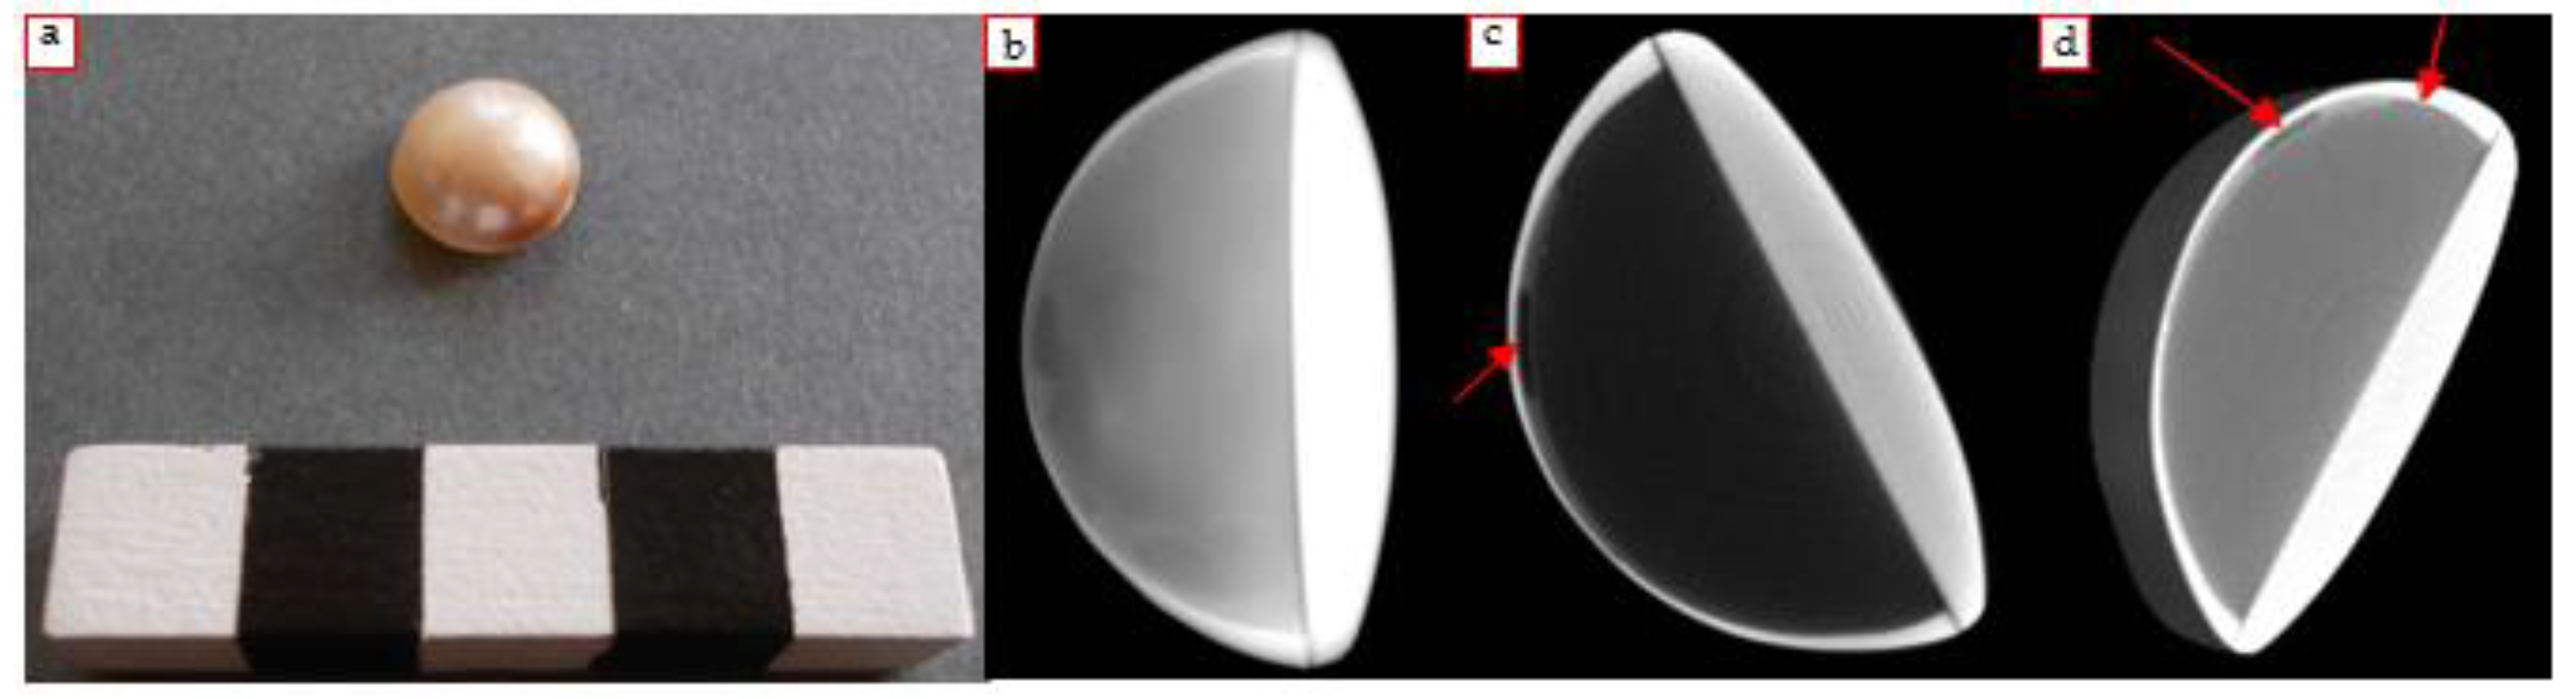
4.3.3. Mabé Pearl
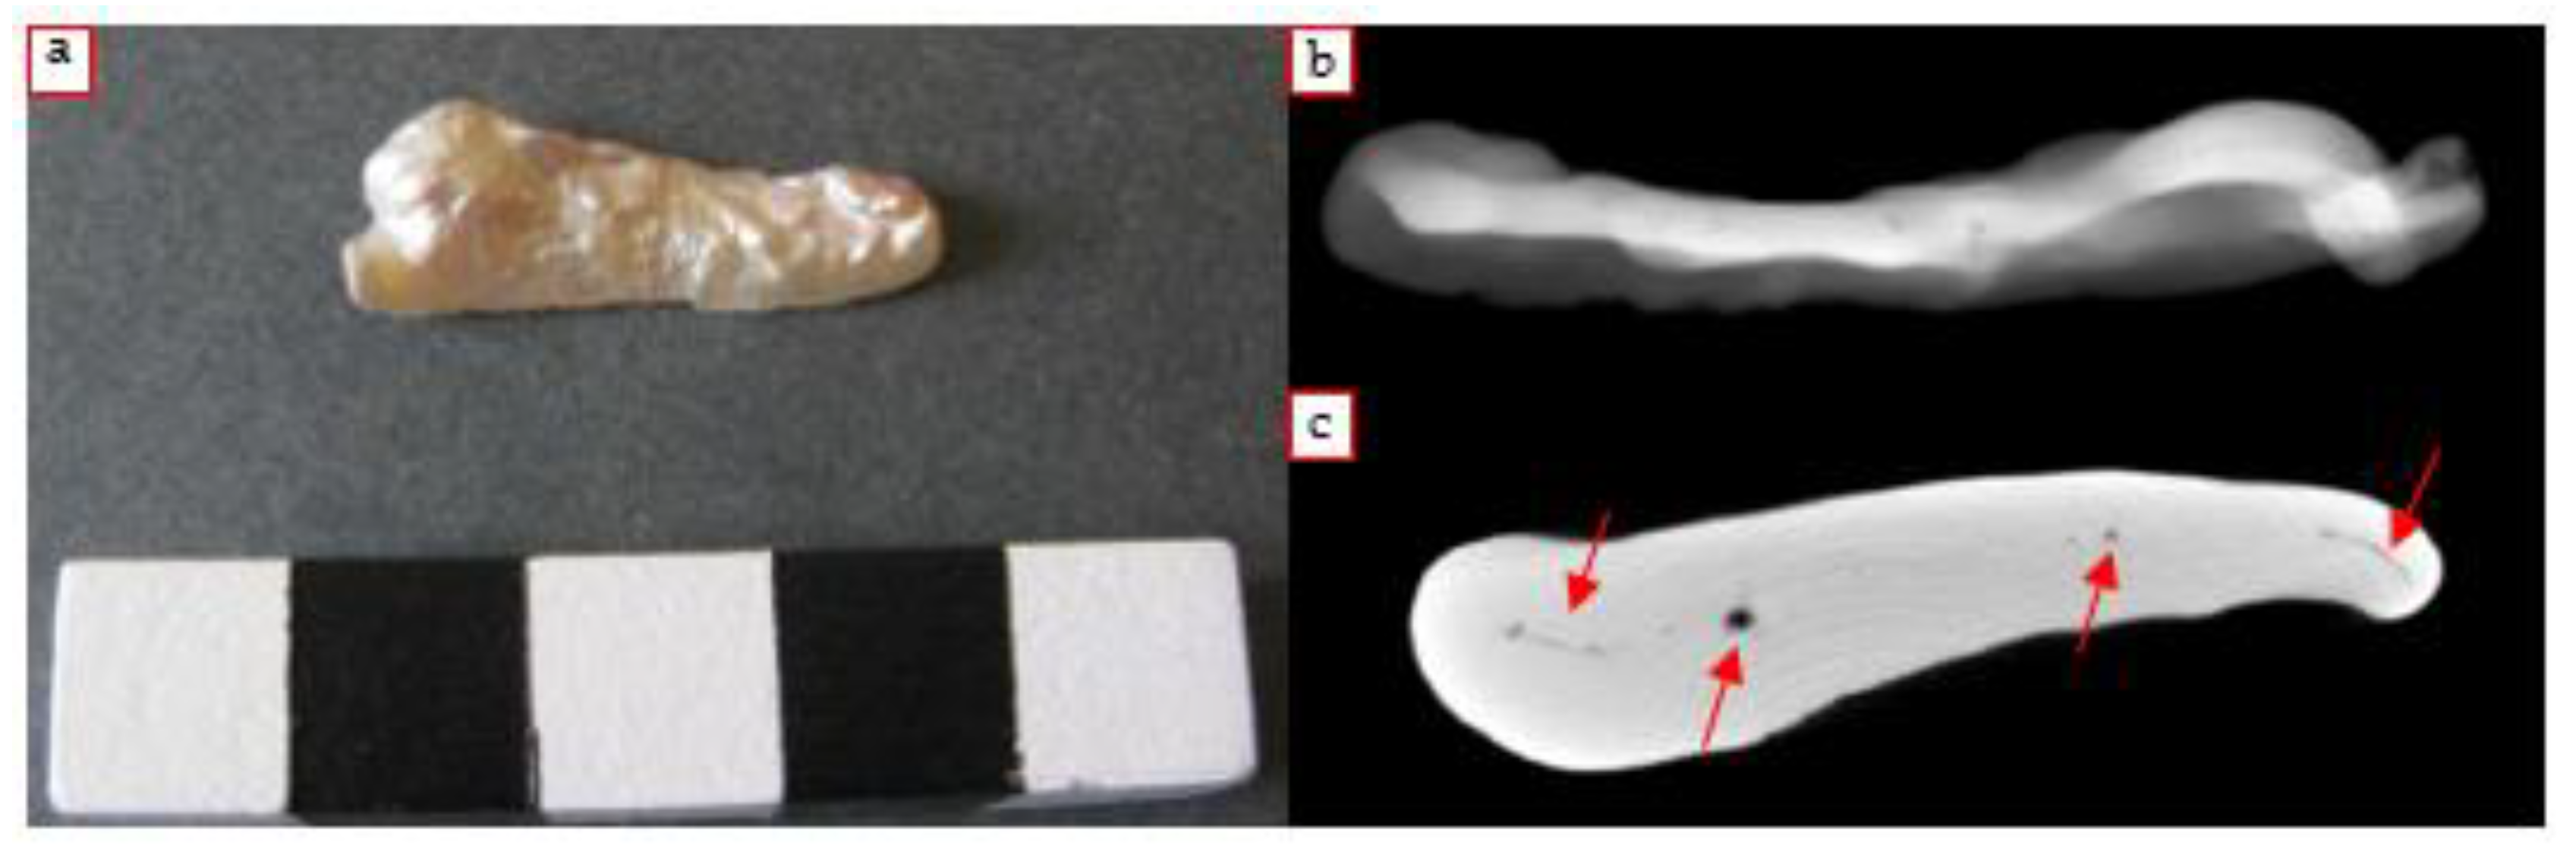
4.3.4. Baroque Pearl
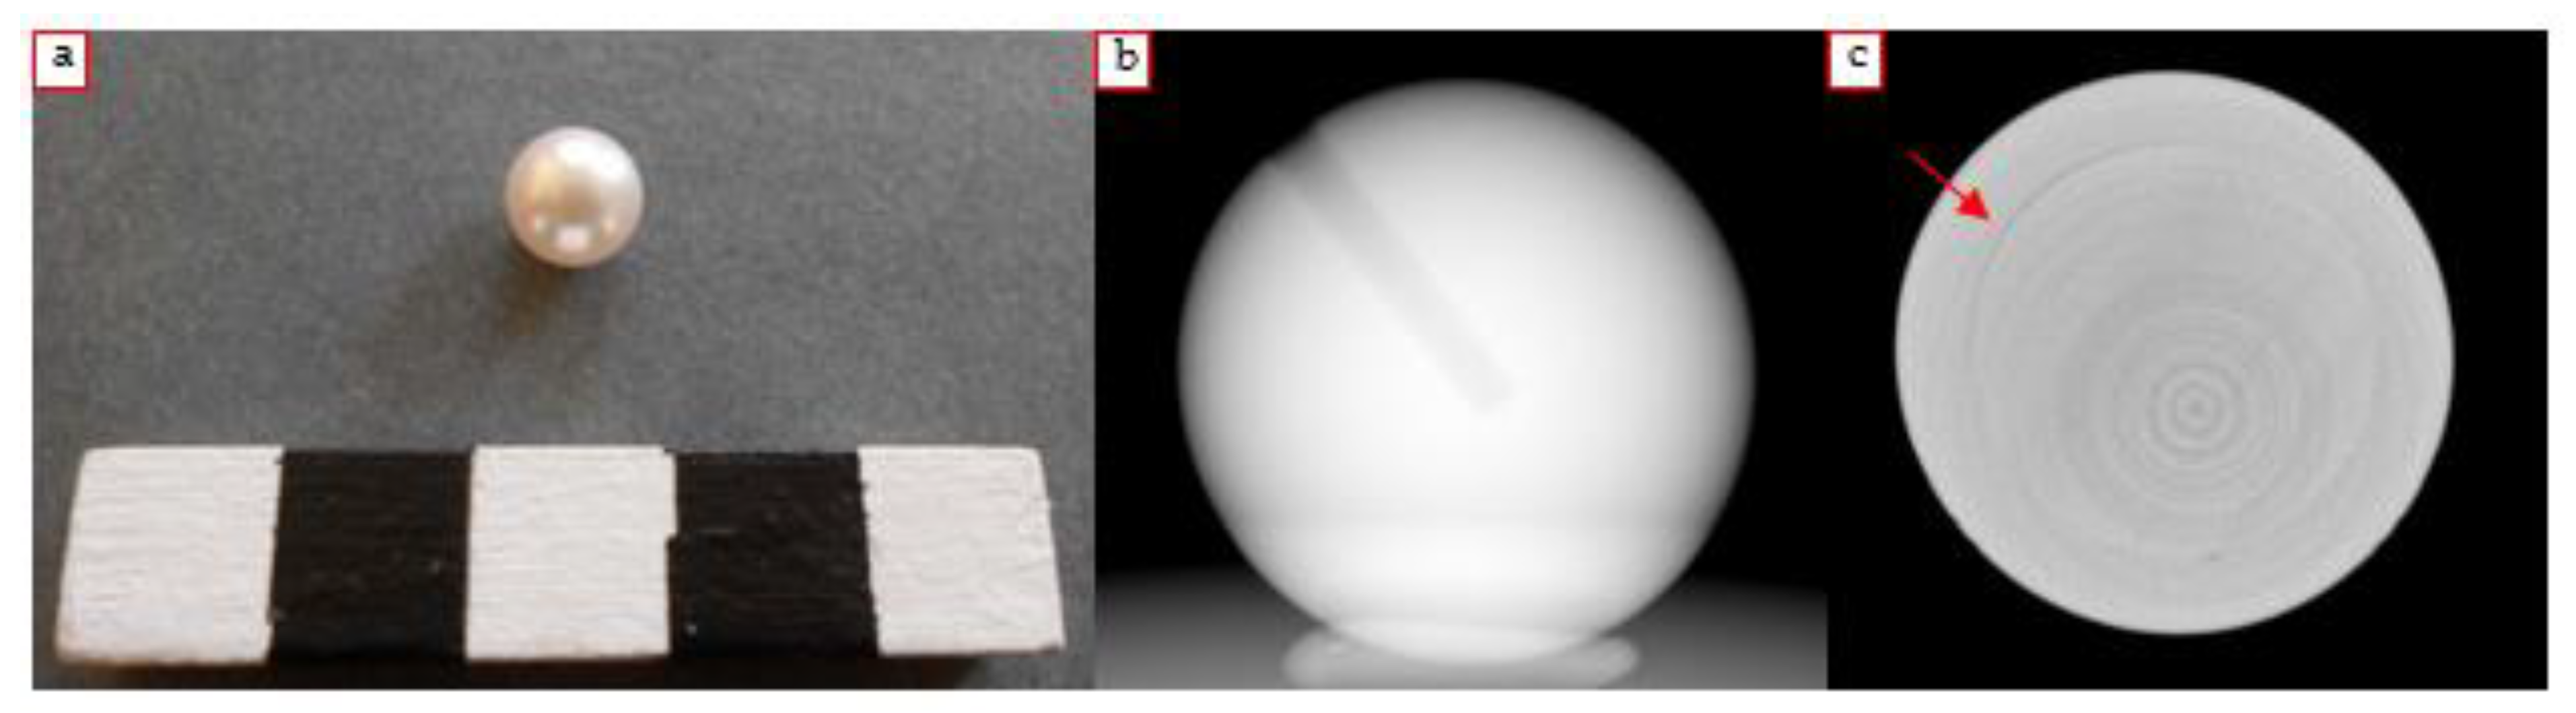
4.3.5. White Pearl
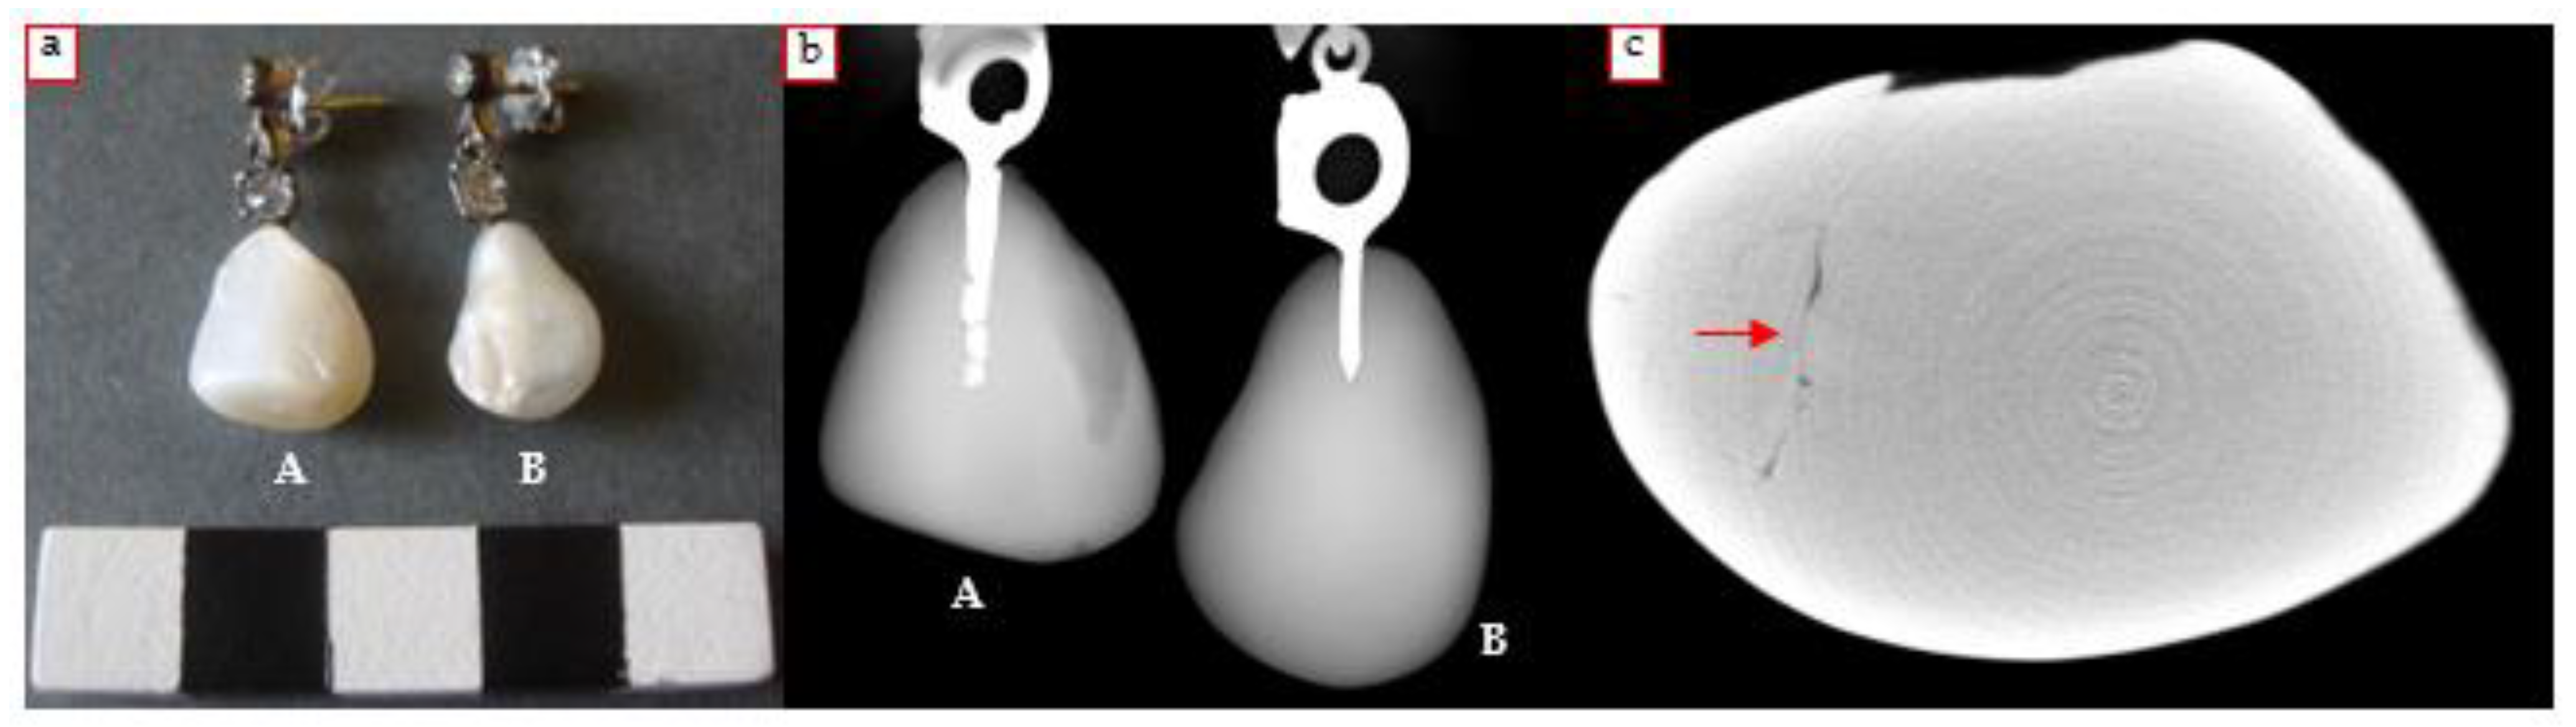
4.3.6. Hypothesized “Shell Pearls” Earrings
4.4. Heterogeneous Samples
5. Conclusions
Author Contributions
Funding
Acknowledgments
Conflicts of Interest
References
- Lang, J.; Middleton, A.A. Radiography of Cultural Material, 2nd ed.; Elsevier Butterworth-Heinemann: Oxford, UK, 2005. [Google Scholar]
- Casali, F. X-ray and Neutron Digital Radiography and Computed Tomography for Cultural Heritage Physical Techniques in the Study of Art, Archaeology and Cultural Heritage; Bradley, D., Creagh, D., Eds.; Elsevier: Amsterdam, The Netherlands, 2006; pp. 41–123. [Google Scholar]
- Morigi, M.P.; Casali, F.; Bettuzzi, M.; Brancaccio, R.; D’Errico, V. Application of X-ray Computed Tomography to Cultural Heritage diagnostics. Appl. Phys. A 2010, 100, 653–661. [Google Scholar] [CrossRef]
- Casali, F.; Bettuzzi, M.; Brancaccio, R.; Cornacchia, S.; Giordano, M.; Morigi, M.P.; Pasini, A.; Romani, D.; Talarico, F. Development of High Resolution X-ray DR and CT Systems for Non-Medical Applications, 2003 DGZfP-Proceedings BB 84-CD. In Proceedings of the International Symposium on Computed Tomography and Image Processing for Industrial Radiology, Berlin, Germany, 23–25 June 2003. [Google Scholar]
- Re, A.; Albertin, F.; Bortolin, C.; Brancaccio, R.; Buscaglia, P.; Corsi, J.; Cotto, G.; Dughera, G.; Durisi, E.; Ferrarese, W.; et al. Results of the Italian neu_ART project. IOP Conf. Ser. Mater. Sci. Eng. 2012, 37, 012007. [Google Scholar] [CrossRef] [Green Version]
- Nervo, M. Il Progetto Neu_ART. Studi e Applicazioni/Neutron and X-ray Tomography and Imaging for Cultural Heritage, Cronache 4, Editris, Torino, 2013. Available online: https://www.centrorestaurovenaria.it/documentazione/pubblicazioni (accessed on 22 November 2021).
- Re, A.; Lo Giudice, A.; Nervo, M.; Buscaglia, P.; Luciani, P.; Borla, M.; Greco, C. The Importance of Tomography Studying Wooden Artefacts: A Comparison with Radiography in the Case of a Coffin lid from ancient Egypt. Int. J. Conserv. Sci. 2016, 7, 935–944. [Google Scholar]
- Lo Giudice, A.; Corsi, J.; Cotto, G.; Mila, G.; Re, A.; Ricci, C.; Sacchi, R.; Visca, L.; Zamprotta, L. A New Digital Radiography System for Paintings on Canvas and on Wooden Panels of Large Dimensions. In Proceedings of the 2017 IEEE International Instrumentation and Measurement Technology Conference (I2MTC 2017), Torino, Italy, 22–25 May 2017. [Google Scholar]
- Re, A.; Albertin, F.; Avataneo, C.; Brancaccio, R.; Corsi, J.; Cotto, G.; De Blasi, S.; Dughera, G.; Durisi, E.; Ferrarese, W.; et al. X-ray Tomography of Large Wooden Artworks: The Case Study of “Doppio Corpo” by Pietro Piffetti. Herit. Sci. 2014, 2, 19. [Google Scholar] [CrossRef] [Green Version]
- Re, A.; Corsi, J.; Demmelbauer, M.; Martini, M.; Mila, G.; Ricci, C. X-ray Tomography of a Soil Block: A Useful Tool for the Restoration of Archaeological Finds. Herit. Sci. 2015, 3, 4. [Google Scholar] [CrossRef] [Green Version]
- Vigorelli, L.; Re, A.; Guidorzi, L.; Cavaleri, T.; Buscaglia, P.; Nervo, M.; Facchetti, F.; Borla, M.; Grassini, S.; Lo Giudice, A. X-ray Imaging Investigation and Study on the Gilding Technique of an Ancient Egyptian Taweret’s Wooden Statuette. J. Imaging 2021, 7, 229. [Google Scholar] [CrossRef]
- Vigorelli, L.; Lo Giudice, A.; Cavaleri, T.; Buscaglia, P.; Nervo, P.; Del Vesco, P.; Borla, M.; Grassini, S. Upgrade of the X-ray Imaging Set-up at CCR “La Venaria Reale”: The Case Study of an Egyptian Wooden Statuette. In Proceedings of the 2020 IMEKO TC-4 International Conference on Metrology for Archaeology and Cultural Heritage, Trento, Italy, 22–24 October 2020. [Google Scholar]
- Read, P.G. Gemmology, 3rd ed.; Elsevier: Amsterdam, The Netherlands, 2005; pp. 223–235. [Google Scholar]
- Sturman, N. The Microradiographic Structures of Non-Bead Cultured Pearls; GIA Lab. Notes; GIA Thailand: Bangkok, Thailand, 2009. [Google Scholar]
- Soldati, A.L.; Jacob, D.E.; Wehrmeister, U.; Hofmeister, W. Structural Characterization and Chemical Composition of Aragonite and Vaterite in Freshwater Cultured Pearls. Miner. Mag. 2008, 72, 579–592. [Google Scholar] [CrossRef]
- Gutmannsbauer, W.; Hänni, H. Structural and Chemical Investigations on Shells and Pearls of Nacre Forming Salt- and Fresh-Water Bivalve Molluscs. J. Gemmol. 1994, 24, 241–252. [Google Scholar] [CrossRef]
- Anderson, B.W. The Use of X Rays in the Study of Pearls. Br. J. Radiol. 1932, 5, 57–64. [Google Scholar] [CrossRef]
- Krzemnicki, M.S.; Friess, S.D.; Chalus, P.; Hänni, H.A.; Karampelas, S. X-Ray Computed Microtomography: Distinguishing Natural Pearls from Beaded and Non-Beaded Cultured Pearls. Gems Gemol. 2010, 46, 128–134. [Google Scholar] [CrossRef]
- Krzemnicki, M.S. Micro X-ray Tomography of Pearls: SSEF Introduces a New Service for Pearl Testing. SSEF Facet. 2010, 17, 9–10. [Google Scholar]
- Rosc, J.; Hammer, V.; Brunner, R. X-ray Computed Tomography for Fast and Non-Destructive Multiple Pearl Inspection. Case Stud. Nondestruct. Test. Eval. 2016, 6, 32–37. [Google Scholar] [CrossRef] [Green Version]
- Wehrmeister, U.; Goetz, H.; Jacob, D.; Soldati, A.; Xu, W.; Duschner, H.; Hofmeister, W. Visualization of the Internal Structures of Cultured Pearls by Computerized X-ray Microtomography. J. Gemmol. 2008, 31, 15–21. [Google Scholar] [CrossRef]
- Stiles, K.A.; Stiles, N.R.; Stiles, N.R. The Pearl, a Biological Gem. Bios 1943, 14, 69–80. [Google Scholar]
- Southgate, P.C.; Lucas, J.S. The Pearl Oyster, 1st ed.; Elsevier: Oxford, UK, 2008. [Google Scholar]
- Hänni, H.A. A Short Synopsis of Pearls: Natural, Cultured, Imitation. J. Gemmol. Assoc. Hong Kong 1995, 18, 43–46. [Google Scholar]
- Scarratt, K.; Bracher, P.; Bracher, M.; Attawi, A.; Safar, A.; Saeseaw, S.; Homkrajae, A.; Sturman, N. Natural Pearls from Australian Pinctada Maxima. Gems Gemol. 2012, 48, 236–261. [Google Scholar] [CrossRef] [Green Version]
- Hänni, H.A. Natural Pearls and Cultured Pearls: A Basic Concept and Its Variations. Aust. Gemmol. 2012, 24, 258–266. [Google Scholar]
- Nagai, K. A History of the Cultured Pearl Industry. Zool. Sci. 2013, 30, 783–793. [Google Scholar] [CrossRef] [PubMed] [Green Version]
- Alagarswami, K. Technology of Cultured Pearl Production. CMFRI Bull. Pearl Cult. 1987, 39, 98–106. [Google Scholar]
- Cartier, L.; Krzemnicki, M.S. New Developments in Cultured Pearl Production: Use of Organic and Baroque Shell Nuclei. Aust. Gemmol. 2013, 25, 6–13. [Google Scholar]
- Sturman, N.; Strack, E. “Soufflé” Freshwater Cultured Pearls. Gems Gemol. 2010, 46, 58–72. [Google Scholar]
- Available online: https://www.ignroma.it/wp-content/uploads/2014/05/IGN-Roma-MicroComputedTomography.pdf (accessed on 12 September 2021).
- Sturman, N.; Al-Attawi, A. The “Keshi” Pearl Issue. Gems Gemol. 2006, 42, 142. [Google Scholar]
- Haws, M.C.; Ellis, S.C.; Ellis, E.P. Producing Half-Pearls (Mabe); Western Indian Ocean Marine Science Assocaition: Zanzibar, Tanzania, 2006; p. 17. [Google Scholar]
- Re, A.; Angelici, D.; Boano, R.; Bortolin, C.; Brancaccio, R.; Corsi, J.; Fantino, F.; Grassi, N.; Lo Giudice, A.; Mila, J.; et al. Use of a Versatile Instrument for X-ray Radiography and Tomography of Artworks, Precious Objects and Archaeological Materials. In Proceedings of the FisMat 2013—Italian National Conference on Condensed Matter Physics, Milan, Italy, 9–13 September 2013; pp. 143–144. [Google Scholar]
- Vigorelli, L.; Re, A.; Guidorzi, L.; Brancaccio, R.; Bortolin, C.; Grassi, N.; Mila, G.; Pastrone, N.; Sacchi, R.; Grassini, S.; et al. The Study of Ancient Archaeological Finds through X-ray Tomography: The Case of the “Tintinnabulum” from the Museum of Anthropology and Ethnography of Torino. In Proceedings of the 2021 IEEE International Conference on Metrology for Archaeology and Cultural Heritage, Milan, Italy, 20–22 October 2020. [Google Scholar]
- Kak, A.C.; Slaney, M. Principles of Computerized Tomographic Imaging; Cotellessa, R.F., Ed.; IEEE Press: Hoboken, NJ, USA, 1987; Chapter 3; pp. 49–112. [Google Scholar]
- Brancaccio, R.; Bettuzzi, M.; Casali, F.; Morigi, M.P.; Levi, G.; Gallo, A.; Marchetti, G.; Schneberk, D. Real-Time Reconstruction for 3-D CT Applied to Large Objects of Cultural Heritage IEEE Trans. Nucl. Sci. 2011, 58, 1864–1871. [Google Scholar] [CrossRef]
- Martz, H.E.; Shull, P.J.; Schneberk, D.J.; Logan, C.M. X-ray Imaging; CRC Press Inc.: Boca Raton, FL, USA, 2009. Available online: http://www.llnl.gov (accessed on 22 November 2021).
- Barret, J.F.; Keat, N. Artifacts in CT: Recognition and Avoidance. Radiographics 2004, 24, 1679–1691. [Google Scholar] [CrossRef]
- Kijewski, P.K.; Bjärngard, B.E. Correction for Beam Hardening in Computed Tomography. Med. Phys. 1978, 5, 209–214. [Google Scholar] [CrossRef]
- Meganck, J.A.; Kozloff, K.M.; Thornton, M.M.; Broski, S.M.; Goldstein, S.A. Beam Hardening Artifacts in Micro-Computed Tomography Scanning Can Be Reduced by X-ray Beam Filtration and the Resulting Images Can Be Used to Accurately Measure BMD. Bone 2009, 45, 1104–1116. [Google Scholar] [CrossRef] [PubMed] [Green Version]
- Bond, K.P.; Schneberk, D.J. Lawrence Livermore National Laboratory, Imgrec Manual, Technical Reports, 2012. Available online: http://www.llnl.gov.www.gia.edu (accessed on 22 November 2021).
- Goebel, M.; Dirlam, D.M. Polynesian Black Pearls. Gems Gemol. 1989, 25, 130–148. [Google Scholar] [CrossRef]
- Kim, Y.; Choi, H.; Lee, B.; Abduriyim, A. Identification of Irradiated South Sea Cultured Pearls Using Electron Spin Resonance Spectroscopy. Gems Gemol. 2012, 48, 292–299. [Google Scholar] [CrossRef]
- Park, R.Y.; Kim, P.C. The Cultivation and Characterization of Akoya Pearls. J. Korean Cryst. Growth Cryst. Technol. 2005, 15, 152–156. [Google Scholar]
- Akamatsu, S.; Zansheng, L.T.; Moses, T.M.; Scarratt, K. The Current Status of Chinese Freshwater Cultured Pearls. Gems Gemol. 2001, 37, 96–113. [Google Scholar] [CrossRef] [Green Version]
- Scarratt, K.; Moses, T.M.; Akamatsu, S. Characteristics of Nuclei in Chinese Freshwater Cultured Pearls. Gems Gemol. 2000, 36, 98–109. [Google Scholar] [CrossRef]
- Otter, L.M.; Wehrmeister, U.; Enzmann, F.; Wolf, M.; Jacob, D. A Look inside a Remarkably Large Beaded South Sea Cultured Pearl. Gems Gemol. 2014, 50. [Google Scholar] [CrossRef]
- Gordona, S.E.; Ana’Akau’olac, S.; Wingfieldd, M.; Kishored, P.; Southgated, P.C. Using Microradiography to Assess Nacre Thickness of Mabé Pearls: Technique Suitability and Insights. Aquaculture 2018, 492, 195–200. [Google Scholar] [CrossRef]
- CIBJO. The Pearl Book: Natural, Cultured, Composite & Imitation Pearls—Terminology & Classification; CIBJO: Bern, Switzerland, 2014. [Google Scholar]
- Zhou, J.Y.; Zhou, C. Shell Pearls as a Pearl imitation. Gems Gemol. 2014, 374, 50. [Google Scholar]
- O’Donoghue, M. Gems: Their Sources, Descriptions and Identification, 6th ed.; Elsevier: Oxford, UK, 2006; pp. 556–625. [Google Scholar]


| Optimized Analysis Parameters | |
|---|---|
| Tube voltage | 90 kV |
| Tube current | 110 µA |
| Al filter | 2 mm |
| Focal spot | 7 µm |
| Source-detector distance (SDD) | 425 mm |
| Object-detector distance (ODD) | 367 mm |
| Source-object distance (SOD) | 58 mm |
| Magnification | 7.3× |
| Penumbra ⁽ᵃ⁾ | 44 µm |
| Voxel size | 6.6 µm |
| Angular step | 0.25° |
| N° of projection | 1440 |
| Integration time | 1792 ms |
| Investigated area | 30.2 × 0.8 mm |
| Time for a complete acquisition | 96 min |
Publisher’s Note: MDPI stays neutral with regard to jurisdictional claims in published maps and institutional affiliations. |
© 2021 by the authors. Licensee MDPI, Basel, Switzerland. This article is an open access article distributed under the terms and conditions of the Creative Commons Attribution (CC BY) license (https://creativecommons.org/licenses/by/4.0/).
Share and Cite
Vigorelli, L.; Croce, E.; Angelici, D.; Navone, R.; Grassini, S.; Guidorzi, L.; Re, A.; Lo Giudice, A. X-ray Micro-Tomography as a Method to Distinguish and Characterize Natural and Cultivated Pearls. Condens. Matter 2021, 6, 51. https://doi.org/10.3390/condmat6040051
Vigorelli L, Croce E, Angelici D, Navone R, Grassini S, Guidorzi L, Re A, Lo Giudice A. X-ray Micro-Tomography as a Method to Distinguish and Characterize Natural and Cultivated Pearls. Condensed Matter. 2021; 6(4):51. https://doi.org/10.3390/condmat6040051
Chicago/Turabian StyleVigorelli, Luisa, Elisabetta Croce, Debora Angelici, Raffaella Navone, Sabrina Grassini, Laura Guidorzi, Alessandro Re, and Alessandro Lo Giudice. 2021. "X-ray Micro-Tomography as a Method to Distinguish and Characterize Natural and Cultivated Pearls" Condensed Matter 6, no. 4: 51. https://doi.org/10.3390/condmat6040051