1. Introduction
Surfactants are substances that find applications almost everywhere in our life. A huge number of technologies are simply based on the action of surface-active molecules and would not properly work without them. Prominent examples of their application include the production of detergents, personal care and the many emulsifiers and foaming agents used for various industrial and consumer products. The global market for the largest application, detergents and cleaners, corresponds to more than USD 10 billion annually. About 50% of the total surfactant production [
1] are non-ionic surfactants, and among these, poly(ethoxylated) molecules are the most frequent, such as Tweens or Tritons. These technical surfactants are not chemically pure but consist of many components with different size distributions of the alkyl chain [
2] and ethylene oxide chain [
3,
4].
The adsorption behaviour of various types of poly(ethoxylated) surfactants was analysed in great detail in [
5], including also technical surfactants. In contrast to the technical non-ionics, the linear poly(ethylene glycol) alkyl ethers with the general structure, C
nEO
m consist of a single compound only. Surfactants of this type are well studied and the properties of their adsorption layers at the aqueous solution/air interface have been quantitatively characterised. Some of the first systematic studies were published about 20 years ago [
6,
7,
8] and it was shown, mainly via dynamic and equilibrium surface tension data, that the adsorption layers of these surfactants are excellently described by a reorientation model [
2] rather than by the classical adsorption models of Langmuir [
9] or Frumkin [
10]. In [
11,
12,
13], the dilational visco-elasticity of C
nEO
m was investigated and discussed on the basis of existing theoretical models. Fundamental work on the adsorption of these non-ionic surfactants was also published for water/oil interfaces [
14], however, an additional complication appears in this case—their solubility in both adjacent liquid phases. Therefore, we will not discuss water/oil interfaces here.
For the equilibrium state of C
nEO
m adsorption layers, the reorientation model is superior for describing the experimental data. Now the question arises as to whether this model can also best describe the dynamics of the adsorption process and the exchange of matter in response to external perturbations of C
nEO
m adsorption layers. In [
6], it was clearly stated that a diffusion-controlled adsorption of the molecules is found only when a reorientation model is assumed. When analysing the dilational surface visco-elasticity of aqueous C
14EO
8 solutions [
11], a diffusion-controlled exchange of matter combined with a reorientational adsorption model was also used and a good description of the experimental data was achieved.
So far, however, no systematic investigation of several compounds of this surfactant type has been performed that covers all the surface properties of C
nEO
m adsorption layers, including simultaneously adsorption kinetics, surface tension isotherms and dilational visco-elasticity. Instead, studies for a single surfactant have usually been presented, such as for C
10EO
8 in [
15,
16], C
10EO
5 in [
17], C
12EO
5 in [
18], C
12EO
8 in [
19], C
14EO
8 in [
10], or for other surfactants of this type following different aspects of surface science [
20,
21,
22,
23]. A broad investigation and analysis of all available results by a suitable adsorption model with a single set of model parameters is able to provide additional insight into the structure formation of C
nEO
m interfacial layers. Hence, a combined study would allow a much more precise determination of the dynamic and thermodynamic model parameters than a single investigation of an individual compound.
The aim of the present work was to analyse the experimental data for six selected C
nEO
m surfactants with
n = 10, 12 and 14 and
m = 4, 5 and 8. Due to the impact of
n and
m on the surface activity of the compounds, the selected surfactants cover a broad range of surface activity, ranging from C
10EO
8 with a critical micelles concentration (CMC) of about 10
−3 mol/L to C
14EO
4 with a CMC of about 10
−5 mol/L [
2], i.e., two orders of magnitude. The experiments were performed by bubble pressure tensiometry in the range of short adsorption times and bubble profile analysis tensiometry for longer adsorption times. The obtained results are in excellent agreement with those published earlier [
19,
24,
25,
26,
27]. A thermodynamic model combined with a diffusion-controlled mechanism for the adsorption kinetics and the exchange of matter response to harmonic surface perturbations was further refined and applied to the existing data in order to better understand the peculiarities of the interfacial dynamics of this type of non-ionic surfactants at the aqueous solution/air interface.
2. Theoretical Model
When the molecules of ethoxylated alcohols adsorb at the air/water interface, their flexible hydrophilic parts (ethoxylated chains) can either attach to the interface or detach and remain in the solution, depending on the available space depending on the surface coverage. This peculiarity of the ethoxylated surfactants can be well accounted for by the reorientation-adsorption model [
28]. This model assumes that the adsorbed molecules can exist in two different states, which are given by the two characteristic molar areas ω
1 and ω
2 (it is assumed here that ω
2 > ω
1). The model also assumes, similarly to what was first proposed in [
29] for the Frumkin model, that an intrinsic compressibility exists for the molecules in state 1:
where Π = γ
0 − γ is the surface pressure, γ
0 and γ are the surface tensions of pure solvent and surfactant solution, respectively, θ is the surface coverage, and ε is the intrinsic compressibility coefficient. It should be noted that the results obtained with the model proposed here are close to those reported in [
25]; however, the present model provides a more realistic description of the situation in the surface layer.
In a two-dimensional solution model, the solvent molecules (water) are also assumed to be present at the surface as part of the adsorption layer [
30]. In the version of the model considered here, the area per solvent molecule is equal to the area of the surfactant molecule in state 1 (with the ethoxylated chain immersed in the solution) at infinite dilution of adsorbed monolayer, ω
10. The molecules adsorbed in state 2 (with the ethoxylated chain adsorbed at the surface) have a constant molecular area, ω
2. There exists also an interaction between the adsorbed molecules, which, similarly to the Frumkin model, is accounted for by the interaction constant a. Under these assumptions, the equation of state of the adsorption layer can be written as:
where θ = ωΓ is the total surface coverage by adsorbent molecules, ω is the average molecular area, and Γ is the total adsorption of the surfactant. The expression for the adsorption isotherm is obtained assuming the adsorbing system is comprised of two subsystems each corresponding to the j-th state of adsorbing molecules (j = 1, 2), and for each subsystem its adsorption isotherm equation reads:
where b
j and Γ
j are the surfactant activity coefficient (in m
3/mol) and partial adsorption (surface concentration in mol/m
2) for the j-th subsystem, c is the surfactant bulk concentration. The total adsorption is
where the partial adsorptions Γ
1 and Γ
2 are related to the respective molecular areas and determine the total surface coverage:
The model assumes that the surfactant activity coefficients are related to each other via the expression [
30]
which introduces the model parameter α reflecting the degree of the surfactant activity increase with the molecular area increase. Using the above relations, one can eliminate b
2 between the two equations (3) to obtain the relation that expresses the equilibrium between the “subsystems” of the molecules adsorbed in the states 1 and 2:
As it is seen from the equations above, the model includes a number of physical parameters, which have different effects on the dependencies of the total and partial adsorbed amounts Γ, Γ1, and Γ2, the surface tension γ, and visco-elasticity modulus E on the surfactant concentration and on time. In particular, the interaction constant a has a stronger effect at smaller concentrations, i.e., when the adsorption layer is in a state far from saturation. In contrast, the effect of the molar areas ω10 and ω2 is more significant for higher surface coverages, when the concentration exceeds 1/b. The intrinsic compressibility ε only slightly influences the surface tension vs. concentration dependence, but has a strong effect on the adsorbed amounts, and especially, on the visco-elasticity modulus for surface coverage approaching 1.
Additional information about the model used here can be found in [
28,
29,
30,
31,
32,
33,
34,
35] and the references therein. In particular, the model introduced in [
35] assumes an average molar area ω instead of ω
1 and ω
10 in Equations (2) and (3). Also, the actual number of states of adsorbed molecules could exceed 2; in fact, we are presently elaborating the theory for any finite number of such molecular states of surfactants in the surface layer.
The set of Equations (1)–(7) is sufficient to calculate the dependencies of the total adsorbed amount Γ and the surface tension γ as a function of the surfactant bulk concentration for each non-contradictory set of model parameters b = b
1, ω
10, ω
2, a, α and ε. With these quantities, the surface dilational visco-elasticity modulus for the surfactant solutions, measured in the regime of small-amplitude oscillations of the surface area, can be calculated according to the Lucassen–van den Tempel (LvT) equation [
31]:
where
is the limiting elasticity,
is a frequency dependent parameter with
, where f is the frequency of the generated oscillations,
is the characteristic frequency of diffusion relaxation, and D is the diffusion coefficient of surfactant molecules in the solution bulk.
Equation (8) describes the dilation rheology of surfactant layers adsorbed at flat surfaces. However, for oscillations of small bubbles in surfactant solutions at low frequencies the actual bubble size can have a remarkable impact on the measured surface visco-elasticity. The respective equation, derived by Joos [
32], reads:
with
, and R is the bubble radius.
The application of Equation (9) to the results for sufficiently small bubbles, as compared with a flat surface, yields a decrease in the modulus and increase in the phase angle. However, even for a frequency of 0.001 Hz for bubbles with a diameter of 3–4 mm, the module values differ by no more than 5%. Note, bubbles of this size are already slightly non-spherical, which can also contribute slightly to the error in the determined rheological quantities. However, all in all, the effect of the curved interface in our bubble experiments is small enough to be neglected, and therefore, the experiments have been interpreted here only by Equation (8).
The dynamic surface tension of surfactant solutions was calculated by solving the diffusion equation numerically:
with the boundary condition
where a spherical coordinate system is assumed with the origin in the bubble centre, t is the time, r
0 is the bubble radius, and r is the distance from the origin. We assume here that the transition between the two states is fast enough, so that a quasi-equilibrium holds for the molecules adsorbed in the states 1 and 2 during the adsorption process. A quasi-equilibrium is also assumed between the adsorption layer and the subsurface. Additional information about the model used here can be found in [
28,
29,
30,
31,
32] and in the references therein.
Note, to obtain the optimum value of the diffusion coefficient D for describing the experimental data, we have to consider that it is responsible not only for the time variation of all adsorption layer characteristics (γ, Γ, Γ
1, Γ
2, ω, E), but also for the dependence of the visco-elasticity modulus on the surfactant concentration (or on the surface pressure Π). In the analysis of the dynamic data, D is varied while all parameters of the adsorption model are kept constant, i.e., the values obtained for the best fit of the surface tension isotherms (see
Table 1 and
Table 2).
3. Experiments
The experiments were performed with the bubble/drop profile analysis tensiometer PAT-2 (SINTERFACE Technologies, Berlin, Germany), the principle of which was described in [
12,
17,
18]. The temperature of the measuring cell with a volume of V = 20 mL was kept constant at 25 °C. The effect of temperature in multi-component systems can be rather complicated [
36] as temperature influences not only the surface tension of the pure solvent γ
0, but also other parameters characterising the adsorption behaviour of the surfactant, i.e., the surfactant activity coefficients, the interaction constant, the molar areas and the intrinsic compressibility. However, the variation of these parameters with temperature is outside the scope of the present study.
In this study, we used a buoyant (oblate) bubble formed at the bottom tip of a vertical Teflon capillary with an external diameter of 3 mm. For the studies of the non-ionic surfactants, we used bubbles with a volume of 23–25 mm3 and a corresponding surface area of 33–35 mm2. The bubble surface area was kept constant by the PAT software (version 1.5.0.736) during the whole experiment. Due to the decrease in surface tension the bubble volume decreased by not more than 1–2 mm3. The studies of the adsorption layer dynamics were carried out for adsorption times starting from a few seconds until the adsorption equilibrium was established. This adsorption equilibrium was established for C10EO5 solutions after 2000–5000 s, and for C14EO8 solutions after 20,000–40,000 s, depending on the surfactant bulk concentration.
The dilational visco-elasticity modulus E was measured after the adsorption equilibrium at the bubble surface was reached. Harmonic oscillations of the bubble surface were generated via bubble size oscillations produced by the syringe dosing system. The frequencies of oscillations were between 0.005 Hz and 0.2 Hz while the amplitude of surface area oscillation was in the range of 5–7% in order to stay in the linear range of the surface layer response. The obtained harmonic surface tension data were analysed by a Fourier transformation available as part of the PAT software:
Here A0 is the initial bubble surface area, ΔA is the generated area oscillations, and Δγ is the resulting surface tension oscillation.
Dynamic surface tensions at short adsorption times (between 10 ms and 100 s) were measured by the bubble pressure tensiometer BPA-1 (SINTERFACE Technologies, Berlin, Germany) with a measuring cell of 20 mL. The ethoxylated alcohols C10EO8, C10EO5, C12EO8, C12EO5, C14EO4 and C14EO8 were purchased from Sigma Chemicals (Merck KGaA, Darmstadt, Germany) and used without further purification. All aqueous solutions were prepared in Milli Q water (Sigma-Aldrich Chemie Gmbh, Munich, Germany). The surface tension of the water was constant at 72.0 ± 0.2 mN/m (25 °C) over a time interval of up to 28 h. The solution pH was in the range between 5.5 and 7. The six selected CnEOm samples are non-ionic surfactants, therefore the pH variation (in the given range) and the salt content in the bulk solution do not measurably influence the adsorption layer properties.
4. Results and Discussion
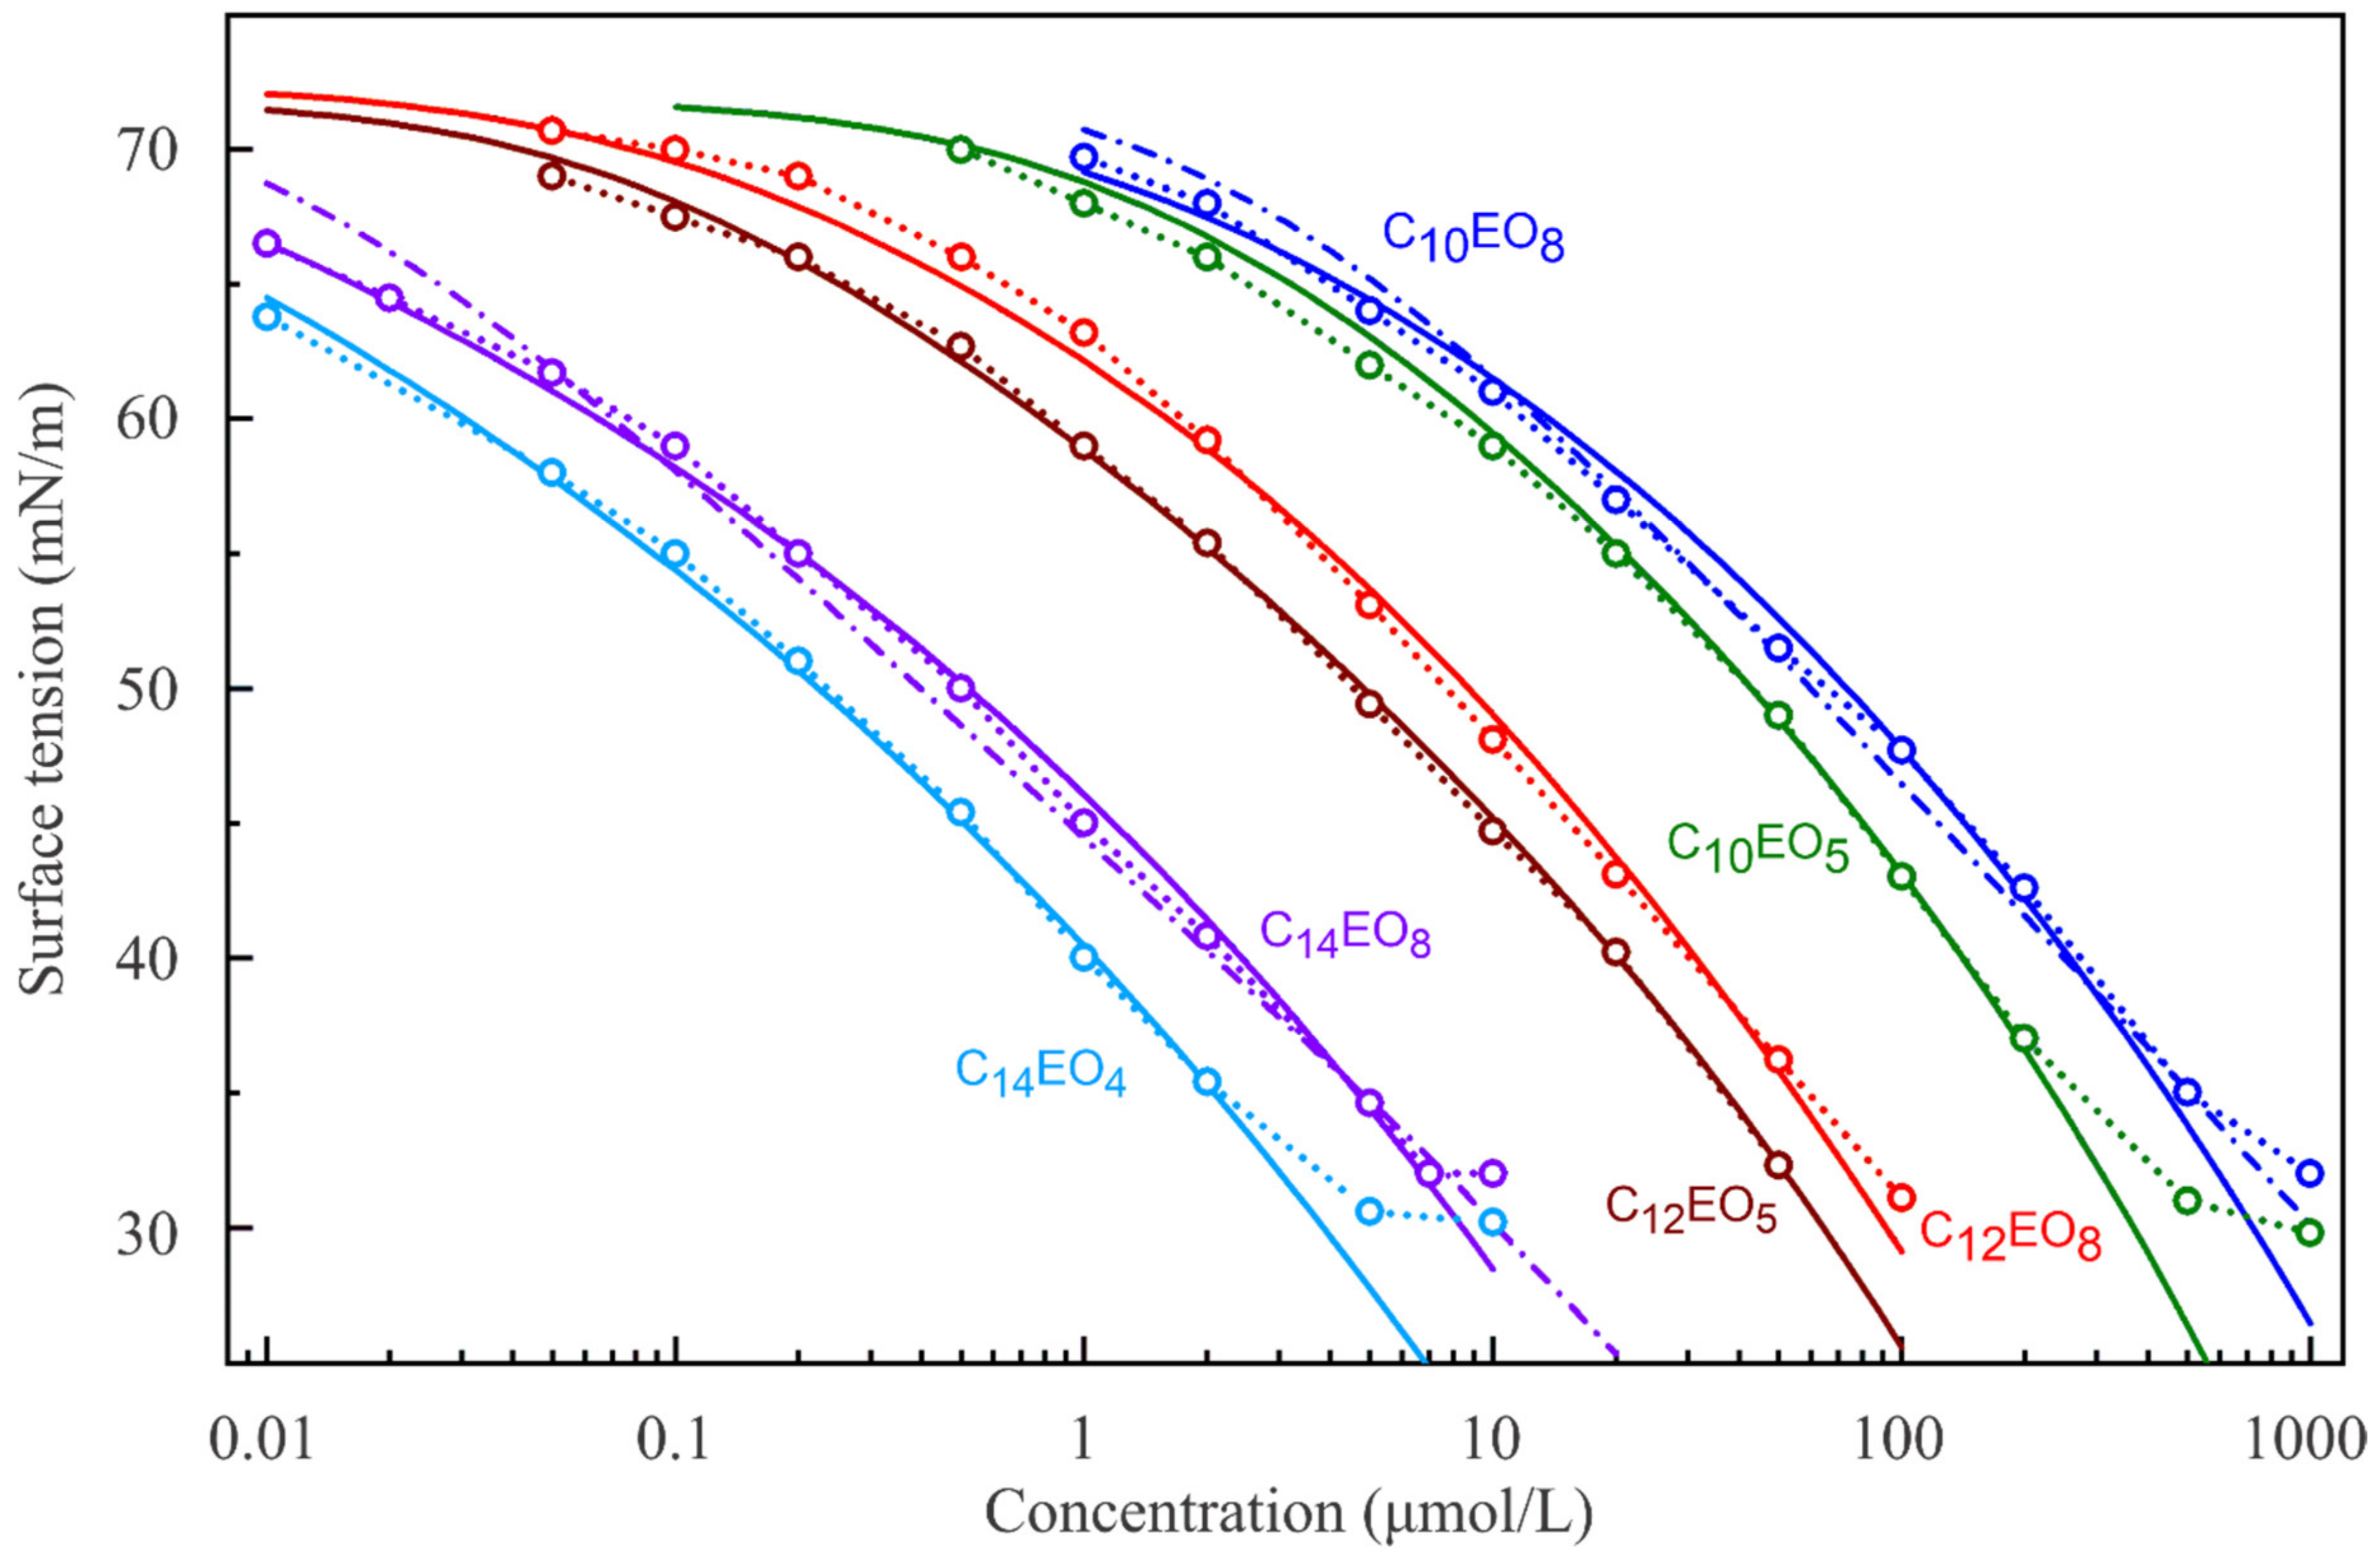
The measured surface tension isotherms for solutions of the six selected C
nEO
m (
n = 10, 12, 14;
m = 4, 5, 8) are shown in
Figure 1. The experimental data for concentrations smaller than the respective CMC were fitted by the reorientation model, and are shown as solid lines.
Table 1 summarises the respective parameters of the isotherms obtained by best fitting. It can be seen from
Table 1 that the molecular area in state 2, ω
2, increases with the length of the oxyethylene chain. For C
10EO
8 and C
14EO
8, the isotherms calculated for the standard Frumkin model are also presented (dash-dotted lines). One can see easily that the reorientation model fits the experimental data much better than the Frumkin model (the fitting error is 2–3 times larger for the Frumkin model). The sensitivity of parameter values obtained in the best fit procedures is shown in the
Supplementary Materials.
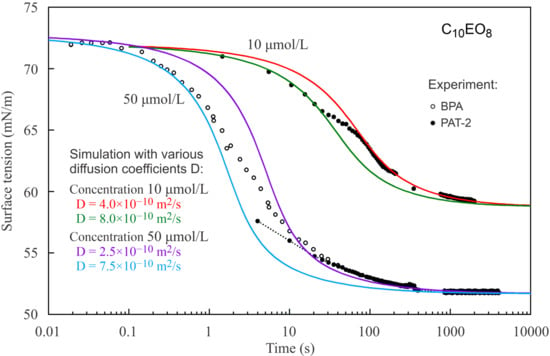
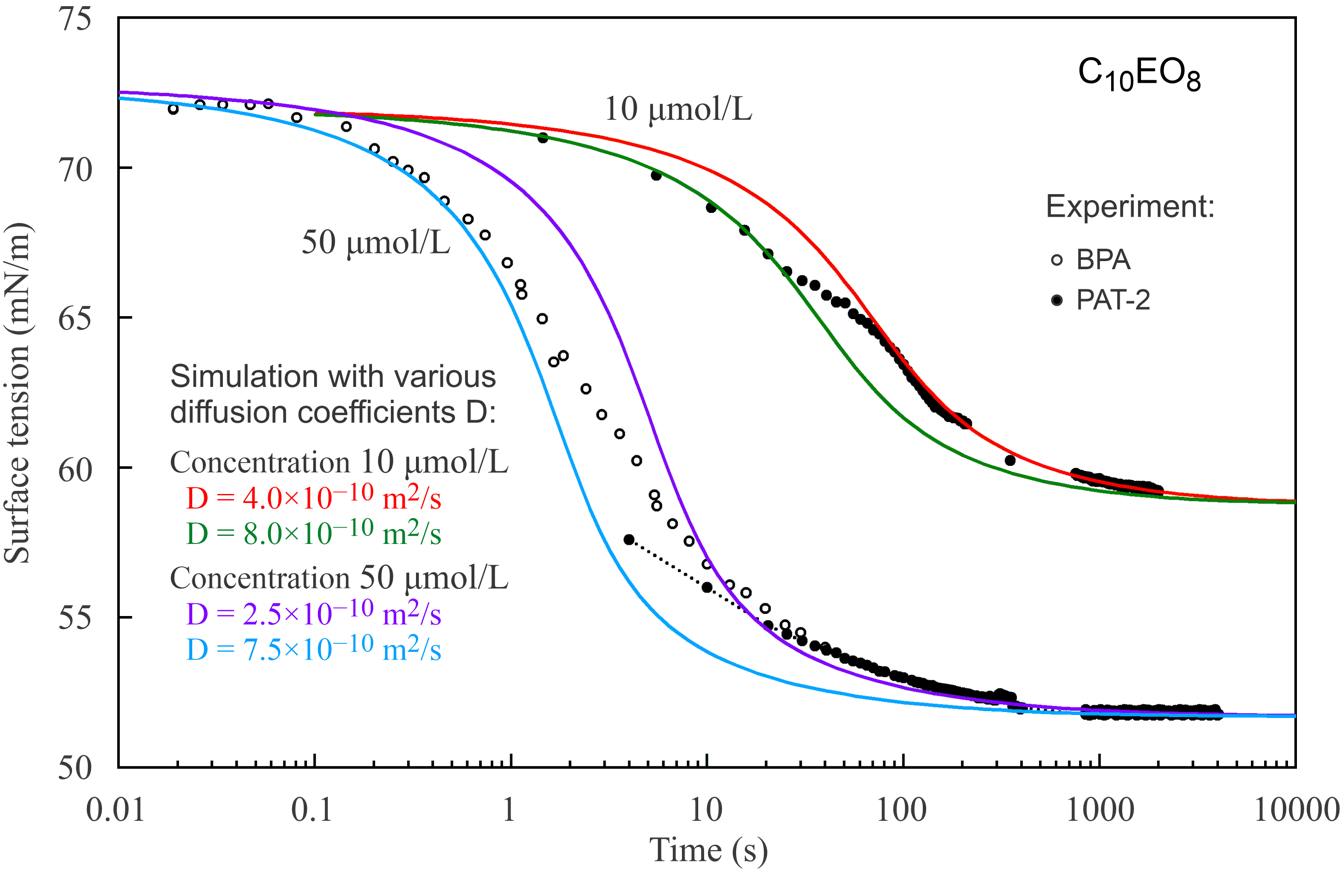
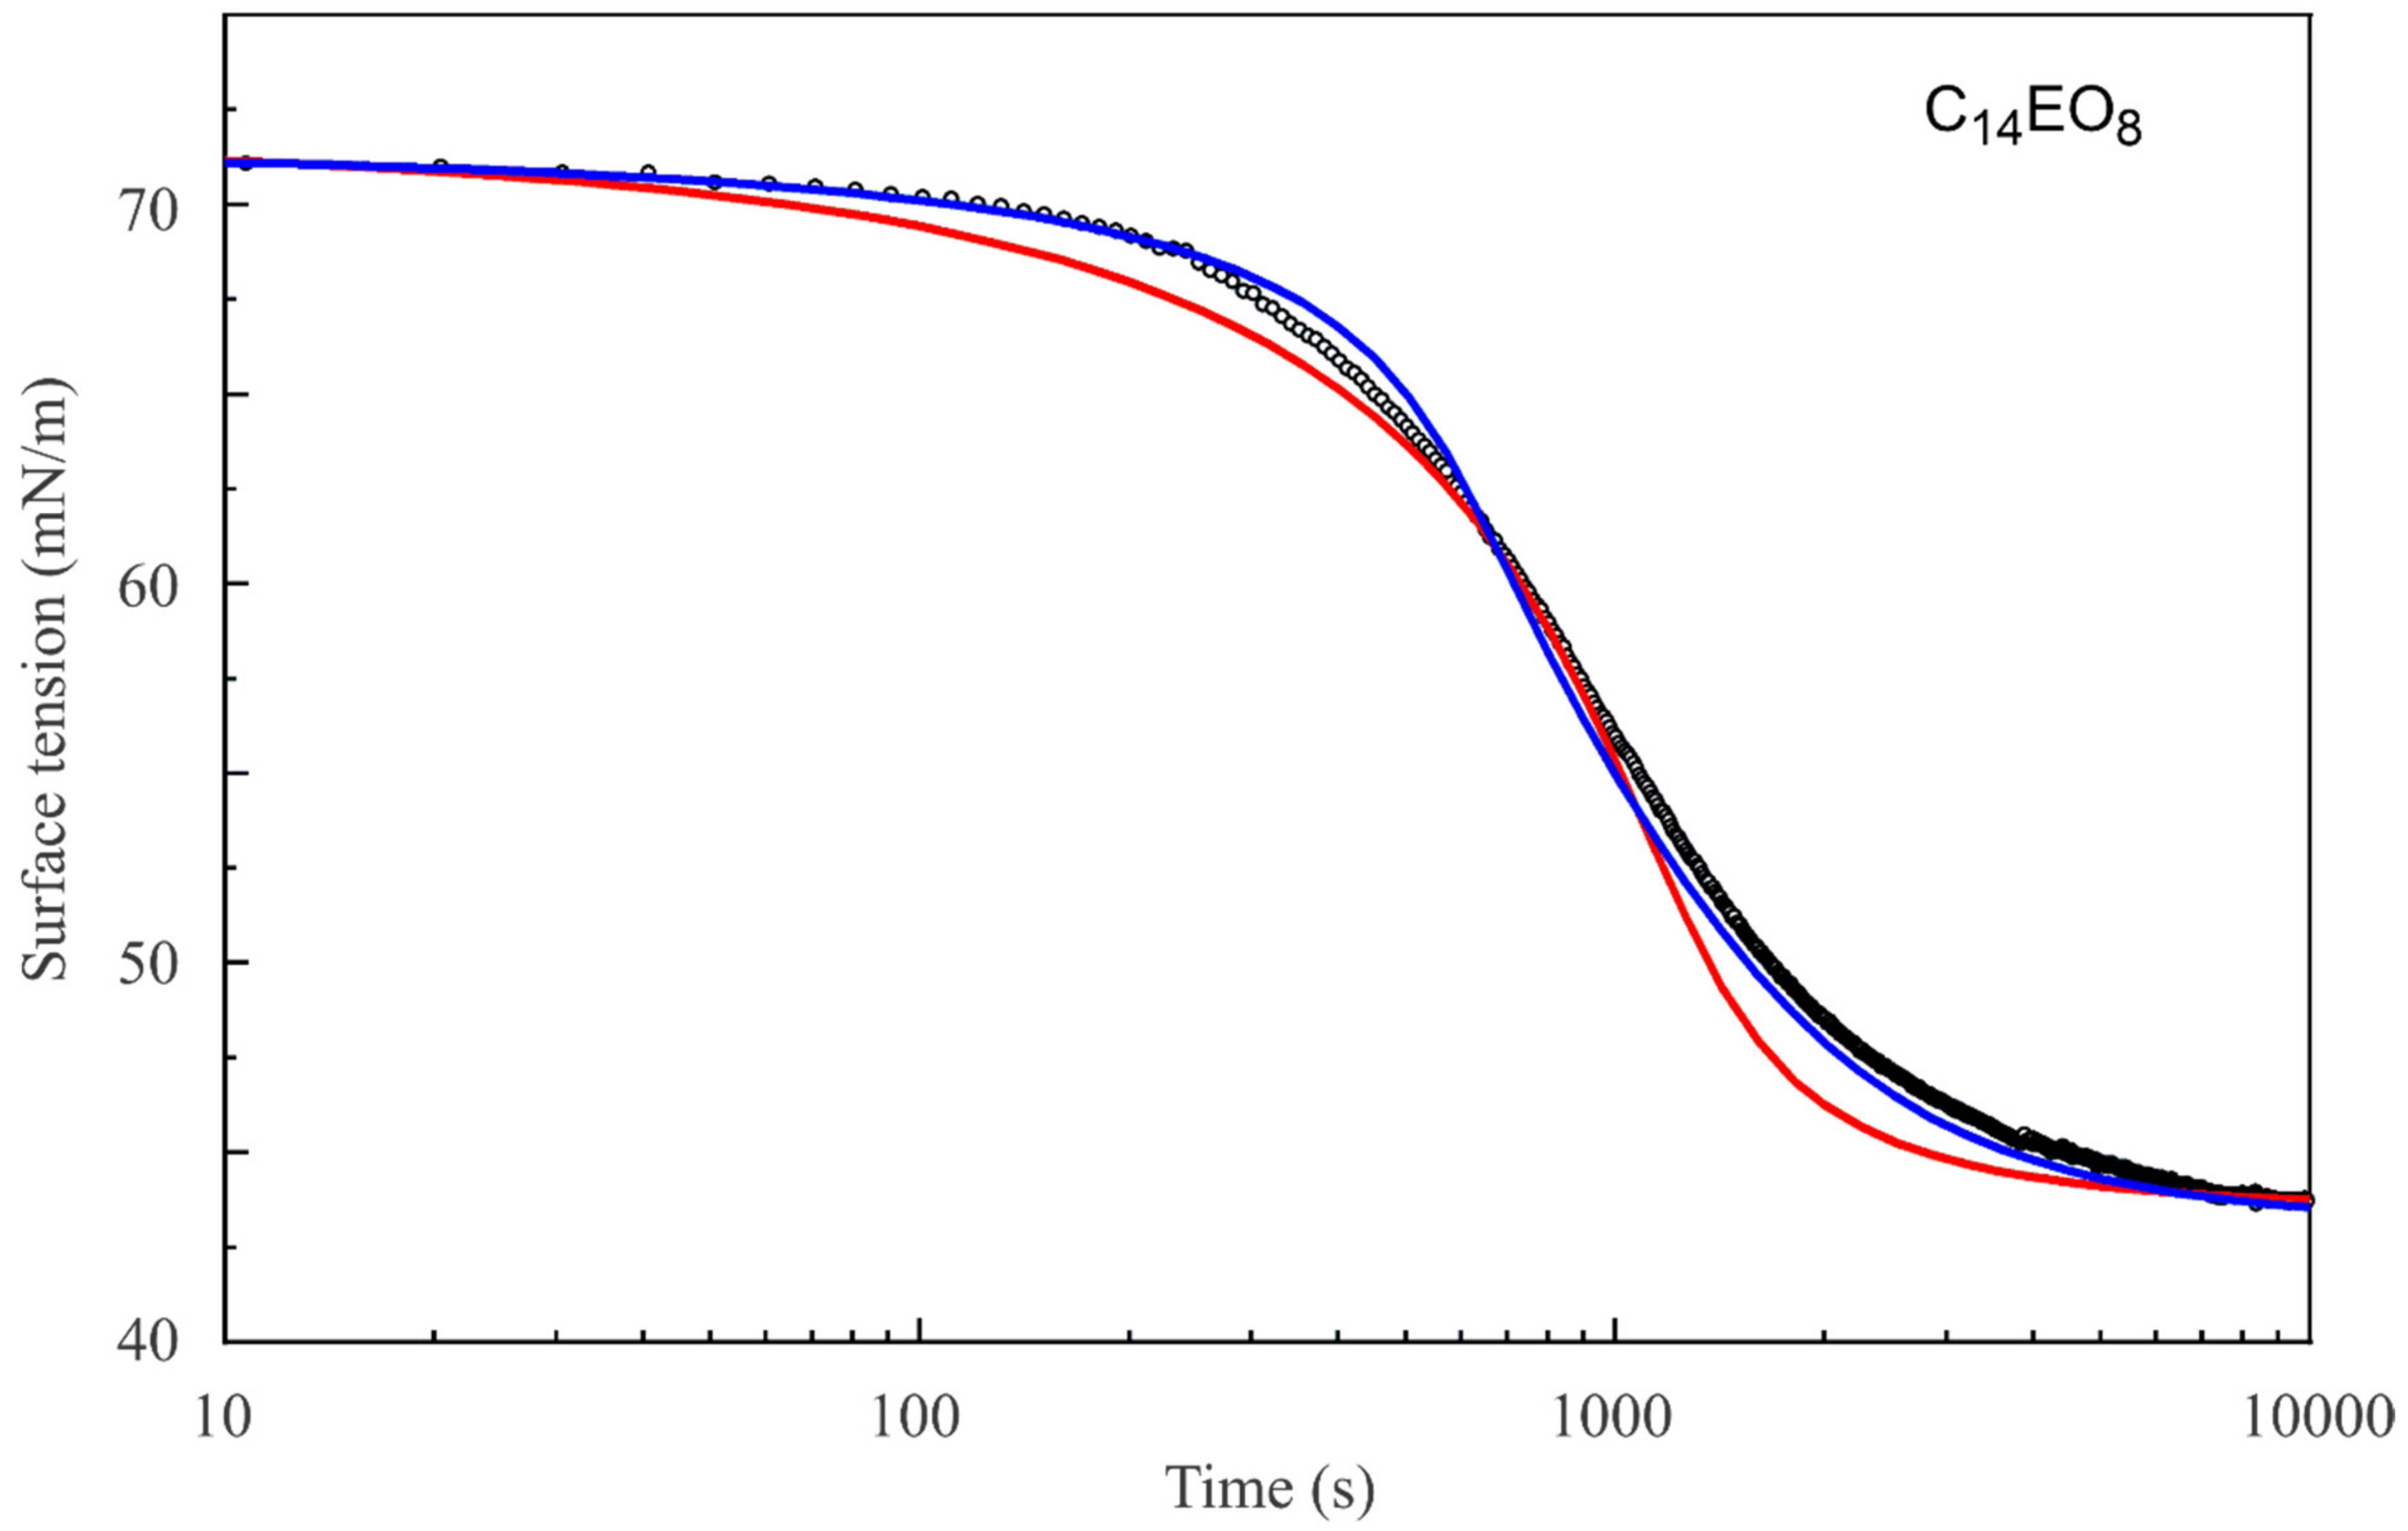
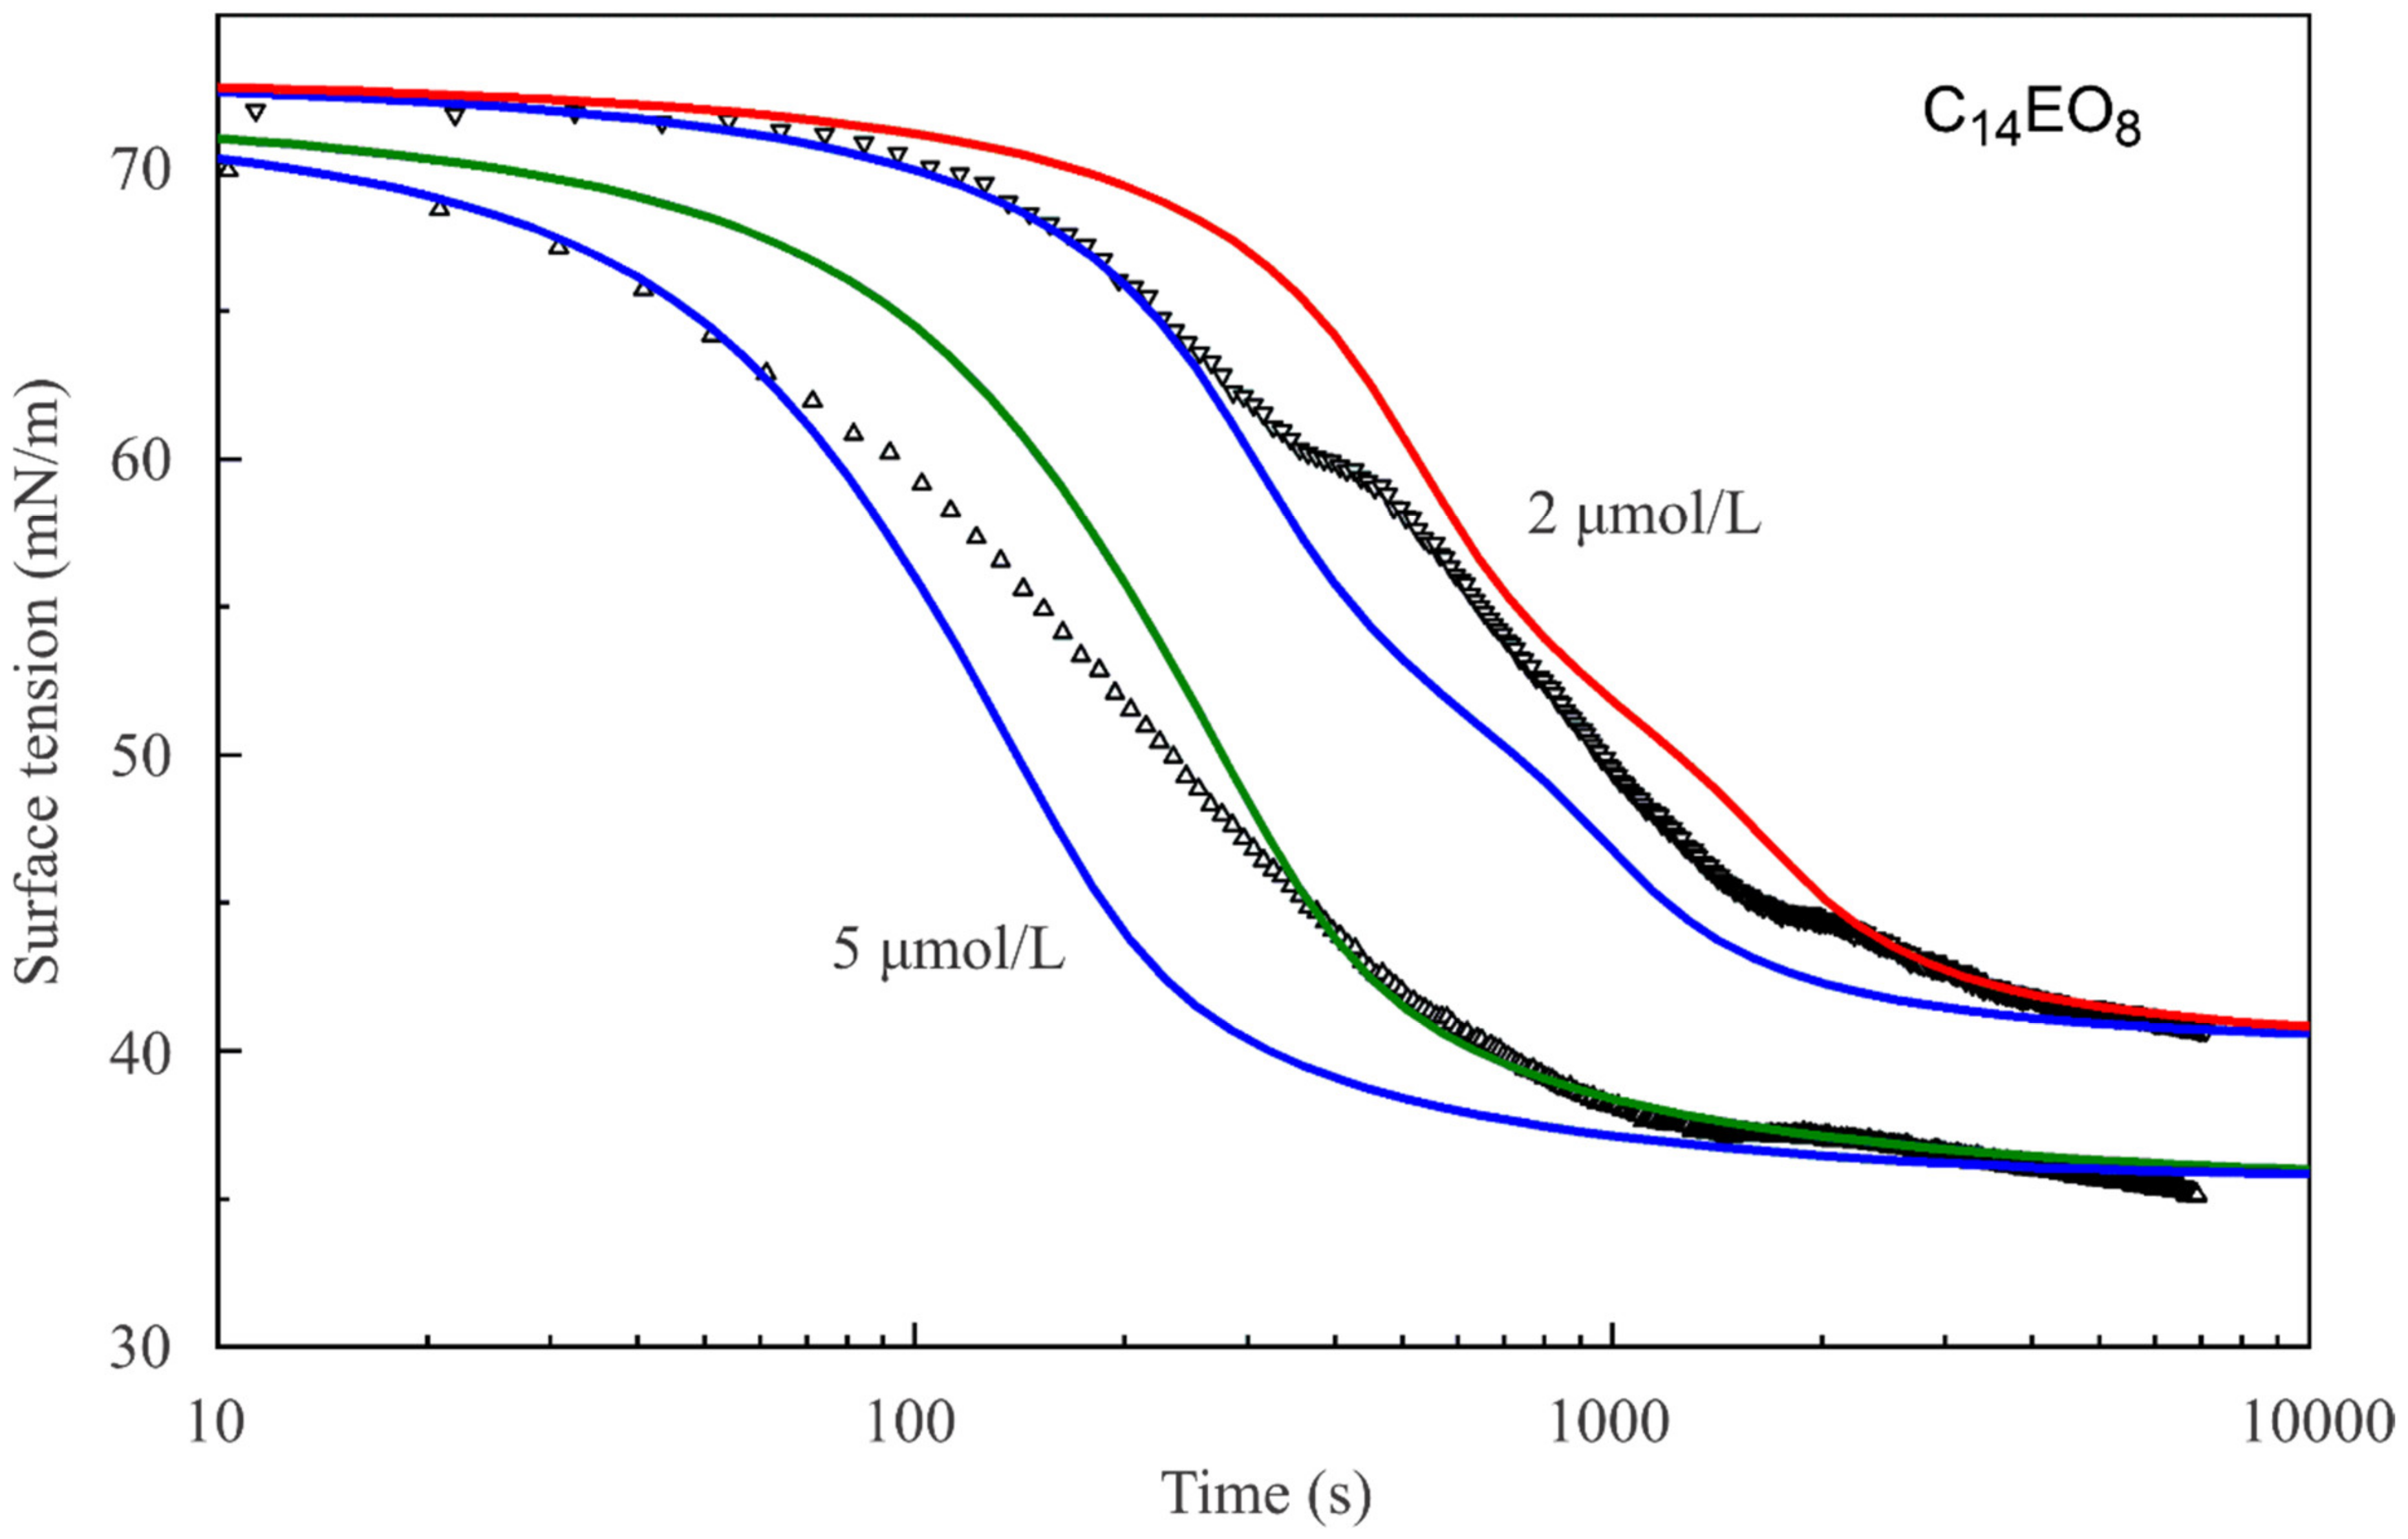
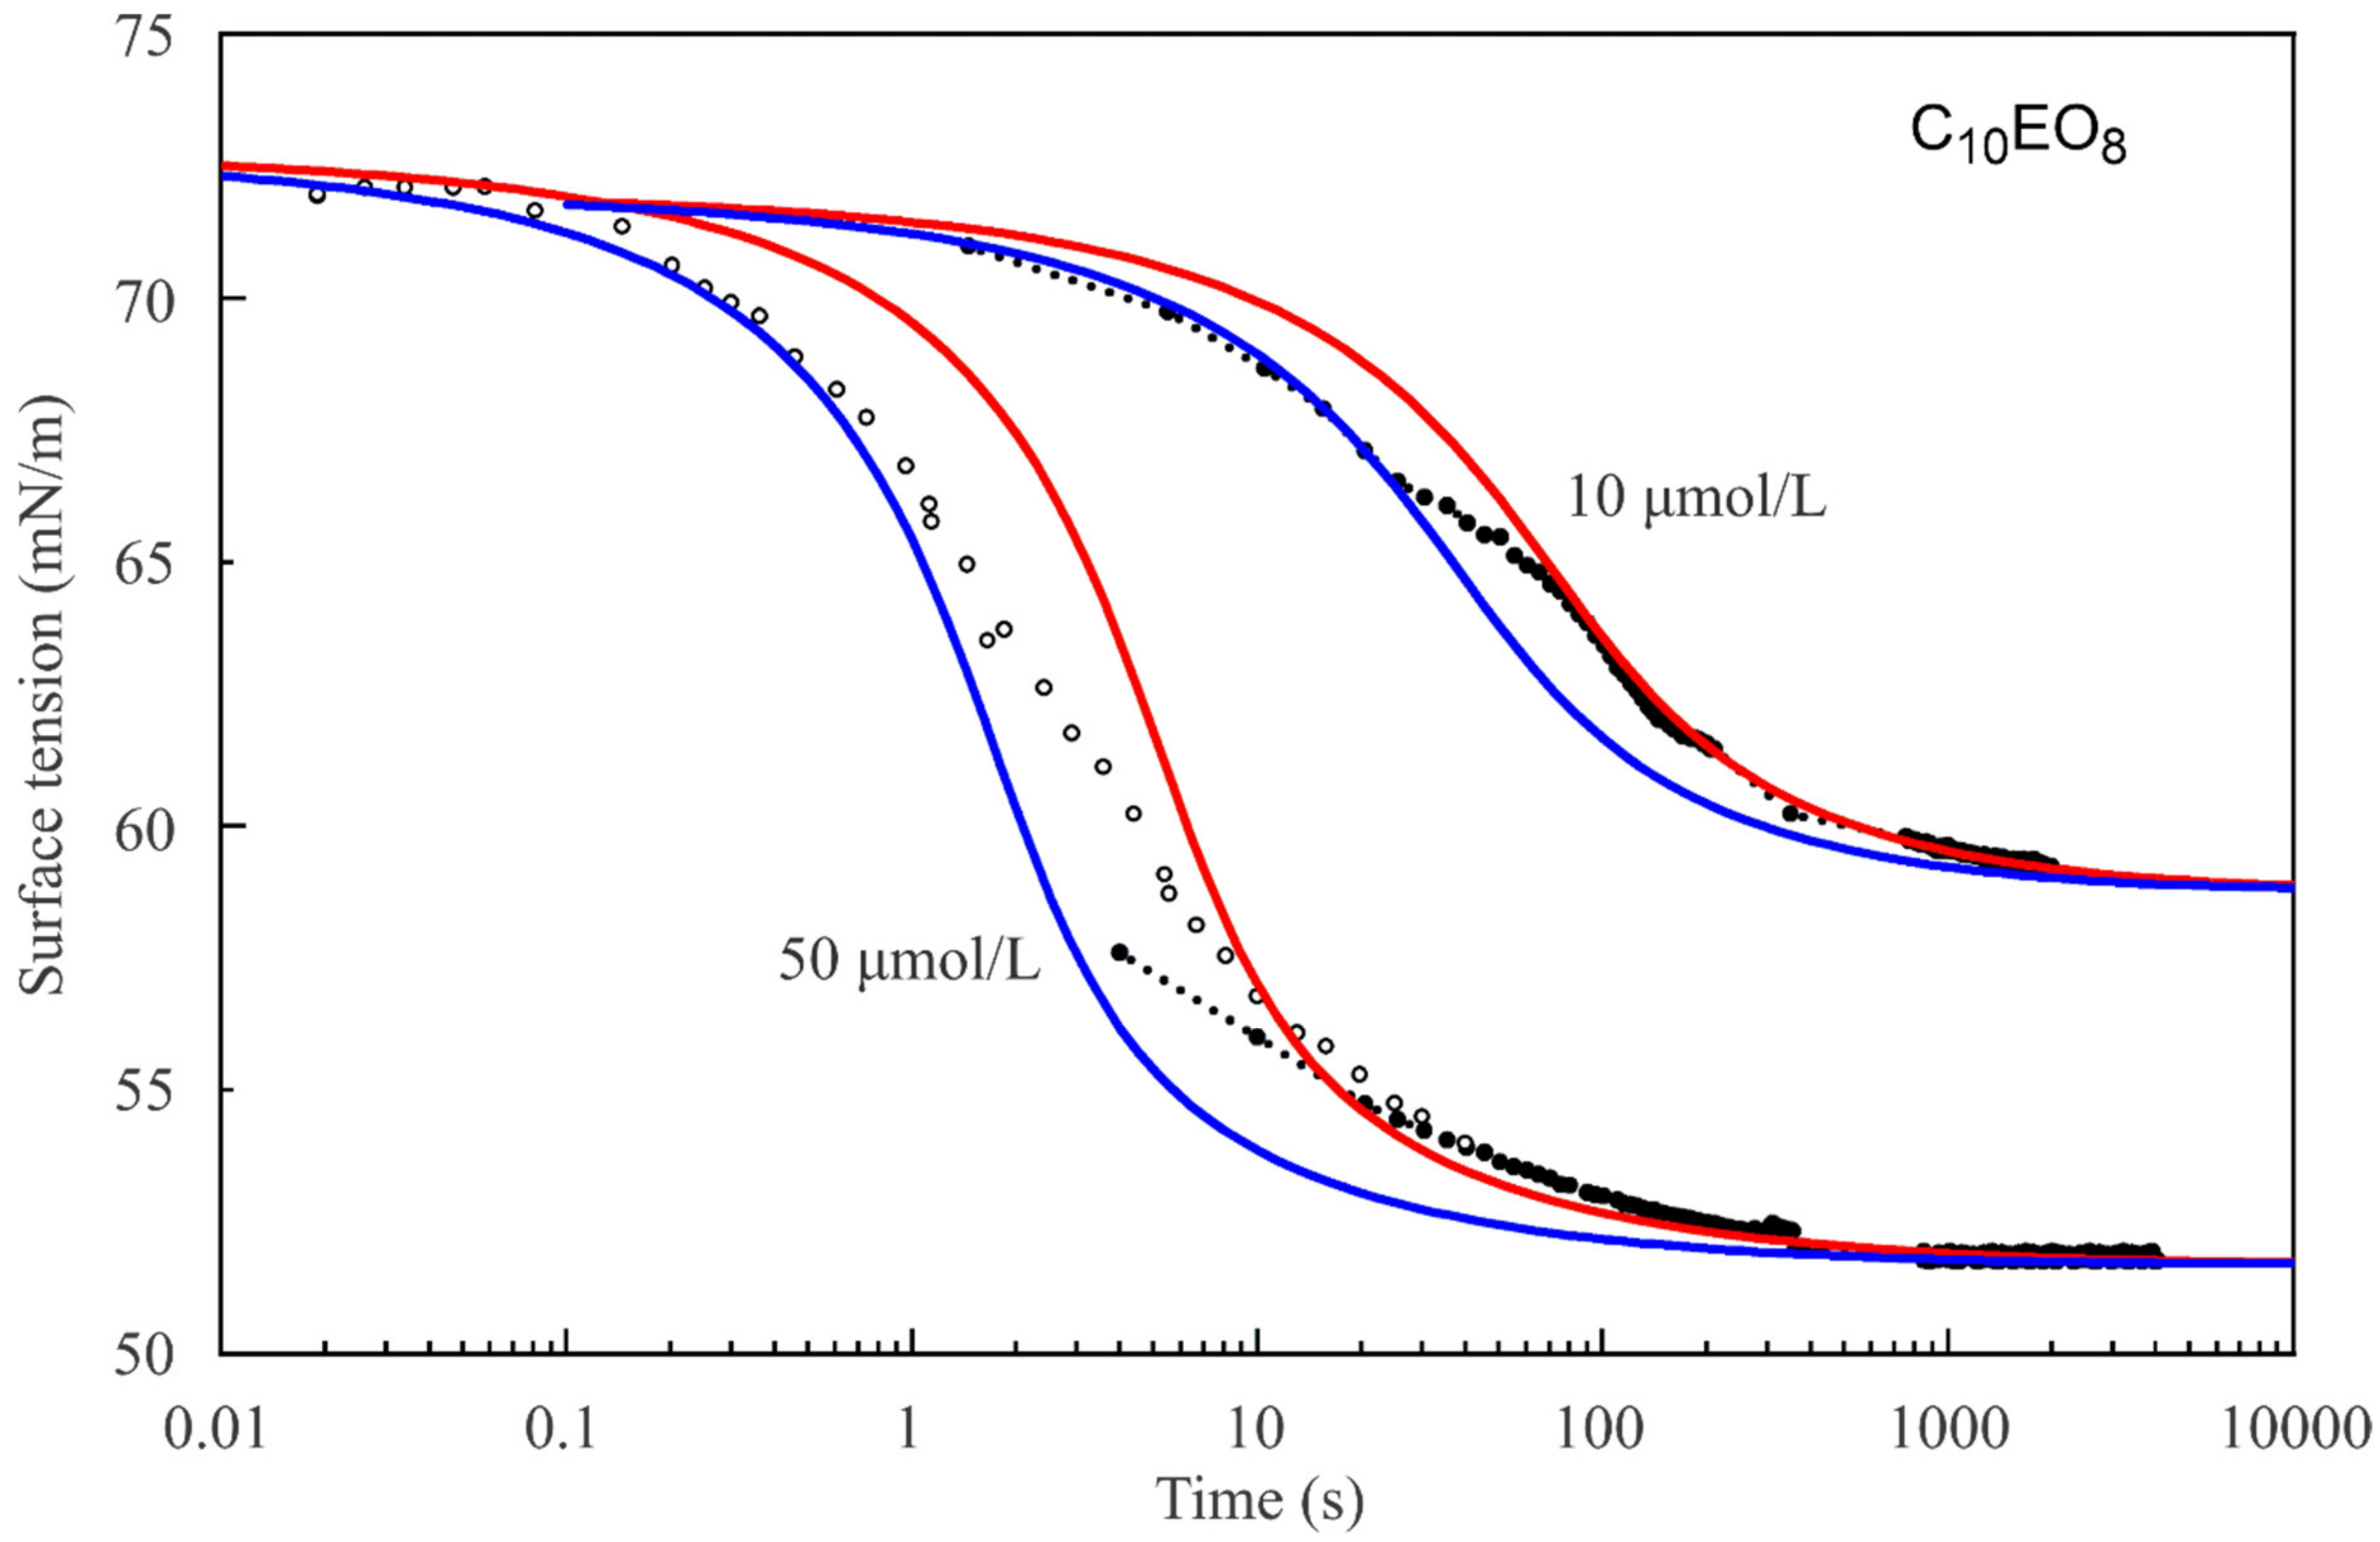
Figure 2,
Figure 3 and
Figure 4 show the dynamic surface tensions for C
14EO
8 and C
10EO
8 solutions with different concentrations measured by two methods: PAT-2 (for times longer than 2–5 s) and BPA-1 (for short times below 30 s). As seen from
Figure 2, the reorientation model also describes the dynamic curves much better than the Frumkin model.
It should be noted that the dynamic curve for the C
14EO
8 solution with the concentration of 1 μmol/L (
Figure 2) is described sufficiently well by the reorientation model, with the same diffusion coefficient for short and long adsorption times. In contrast, for C
14EO
8 solutions of higher concentrations and for C
10EO
8 solutions (
Figure 3 and
Figure 4) the dynamic curves show different behaviour for short and long times: at short times a larger diffusion coefficient provides a better fit to the experimental curve than for long times. Thus, we can say that we observed an apparent deceleration of the adsorption process at longer adsorption times. This apparent deceleration can be related to the transition of molecules from state 2 with larger surface area to state 1 with smaller surface area due to the increasing surface coverage. Note, as the diffusion coefficient must be constant, we should better speak here about an apparent diffusion coefficient, its change during the adsorption process includes the effect of the transition between the two adsorption states.
Initially, most of the molecules adsorb in the state with larger surface area because there is sufficient space at the surface. These molecules have a larger surface activity, as discussed above, and they reduce the surface tension more strongly than the molecules in a state with a smaller surface area. Therefore, the surface tension should initially decrease faster than for molecules adsorbed in only one state and reaching the same equilibrium surface tension. However, subsequently, the molecules with larger area are forced to transfer into the state with smaller surface area, that is, as soon as the surface coverage gradually increases. In the adsorption state with smaller surface area, the molecules have a lower surface activity and reduce the surface tension less. As a result, the surface tension continues to decrease, as soon as additional molecules are adsorbed, but this decrease is slowed down.
This mechanism takes place even in a quasi-equilibrium process, when the transition from one state to another occurs infinitely fast, in the absence of any kinetic barrier. If there is a kinetic barrier for the transition, then the molecules remain for a certain time in the state with a larger surface area, and the surface tension in the initial stage decreases more strongly. With time, the transition should still occur, but this process is delayed, and the surface tension should decrease more slowly as compared to the situation in quasi-equilibrium.
A good illustration of this mechanism was presented in [
6], where a two-state model was considered, which accounts for a kinetically limited transition between the two states. The calculations performed with this model have shown that the initial surface tension decrease can be more significant for both situations, i.e., in a quasi-equilibrium process and a kinetically limited process compared to the one-state (Langmuir) model. However, the model proposed in [
6] does not account for possible kinetic barriers related to the adsorption/desorption processes in each of the two states, which also can influence the rate of surface tension decrease. A more general kinetic model was presented in [
33] where both the kinetic limited transition between the two states and the kinetic barrier for adsorption from the sublayer are accounted for. This kinetic model predicts qualitatively similar behaviour of the dynamic surface tension of reorienting surfactants. The application of this model is, however, quite complex due to the required additional kinetic coefficients, which are unknown.
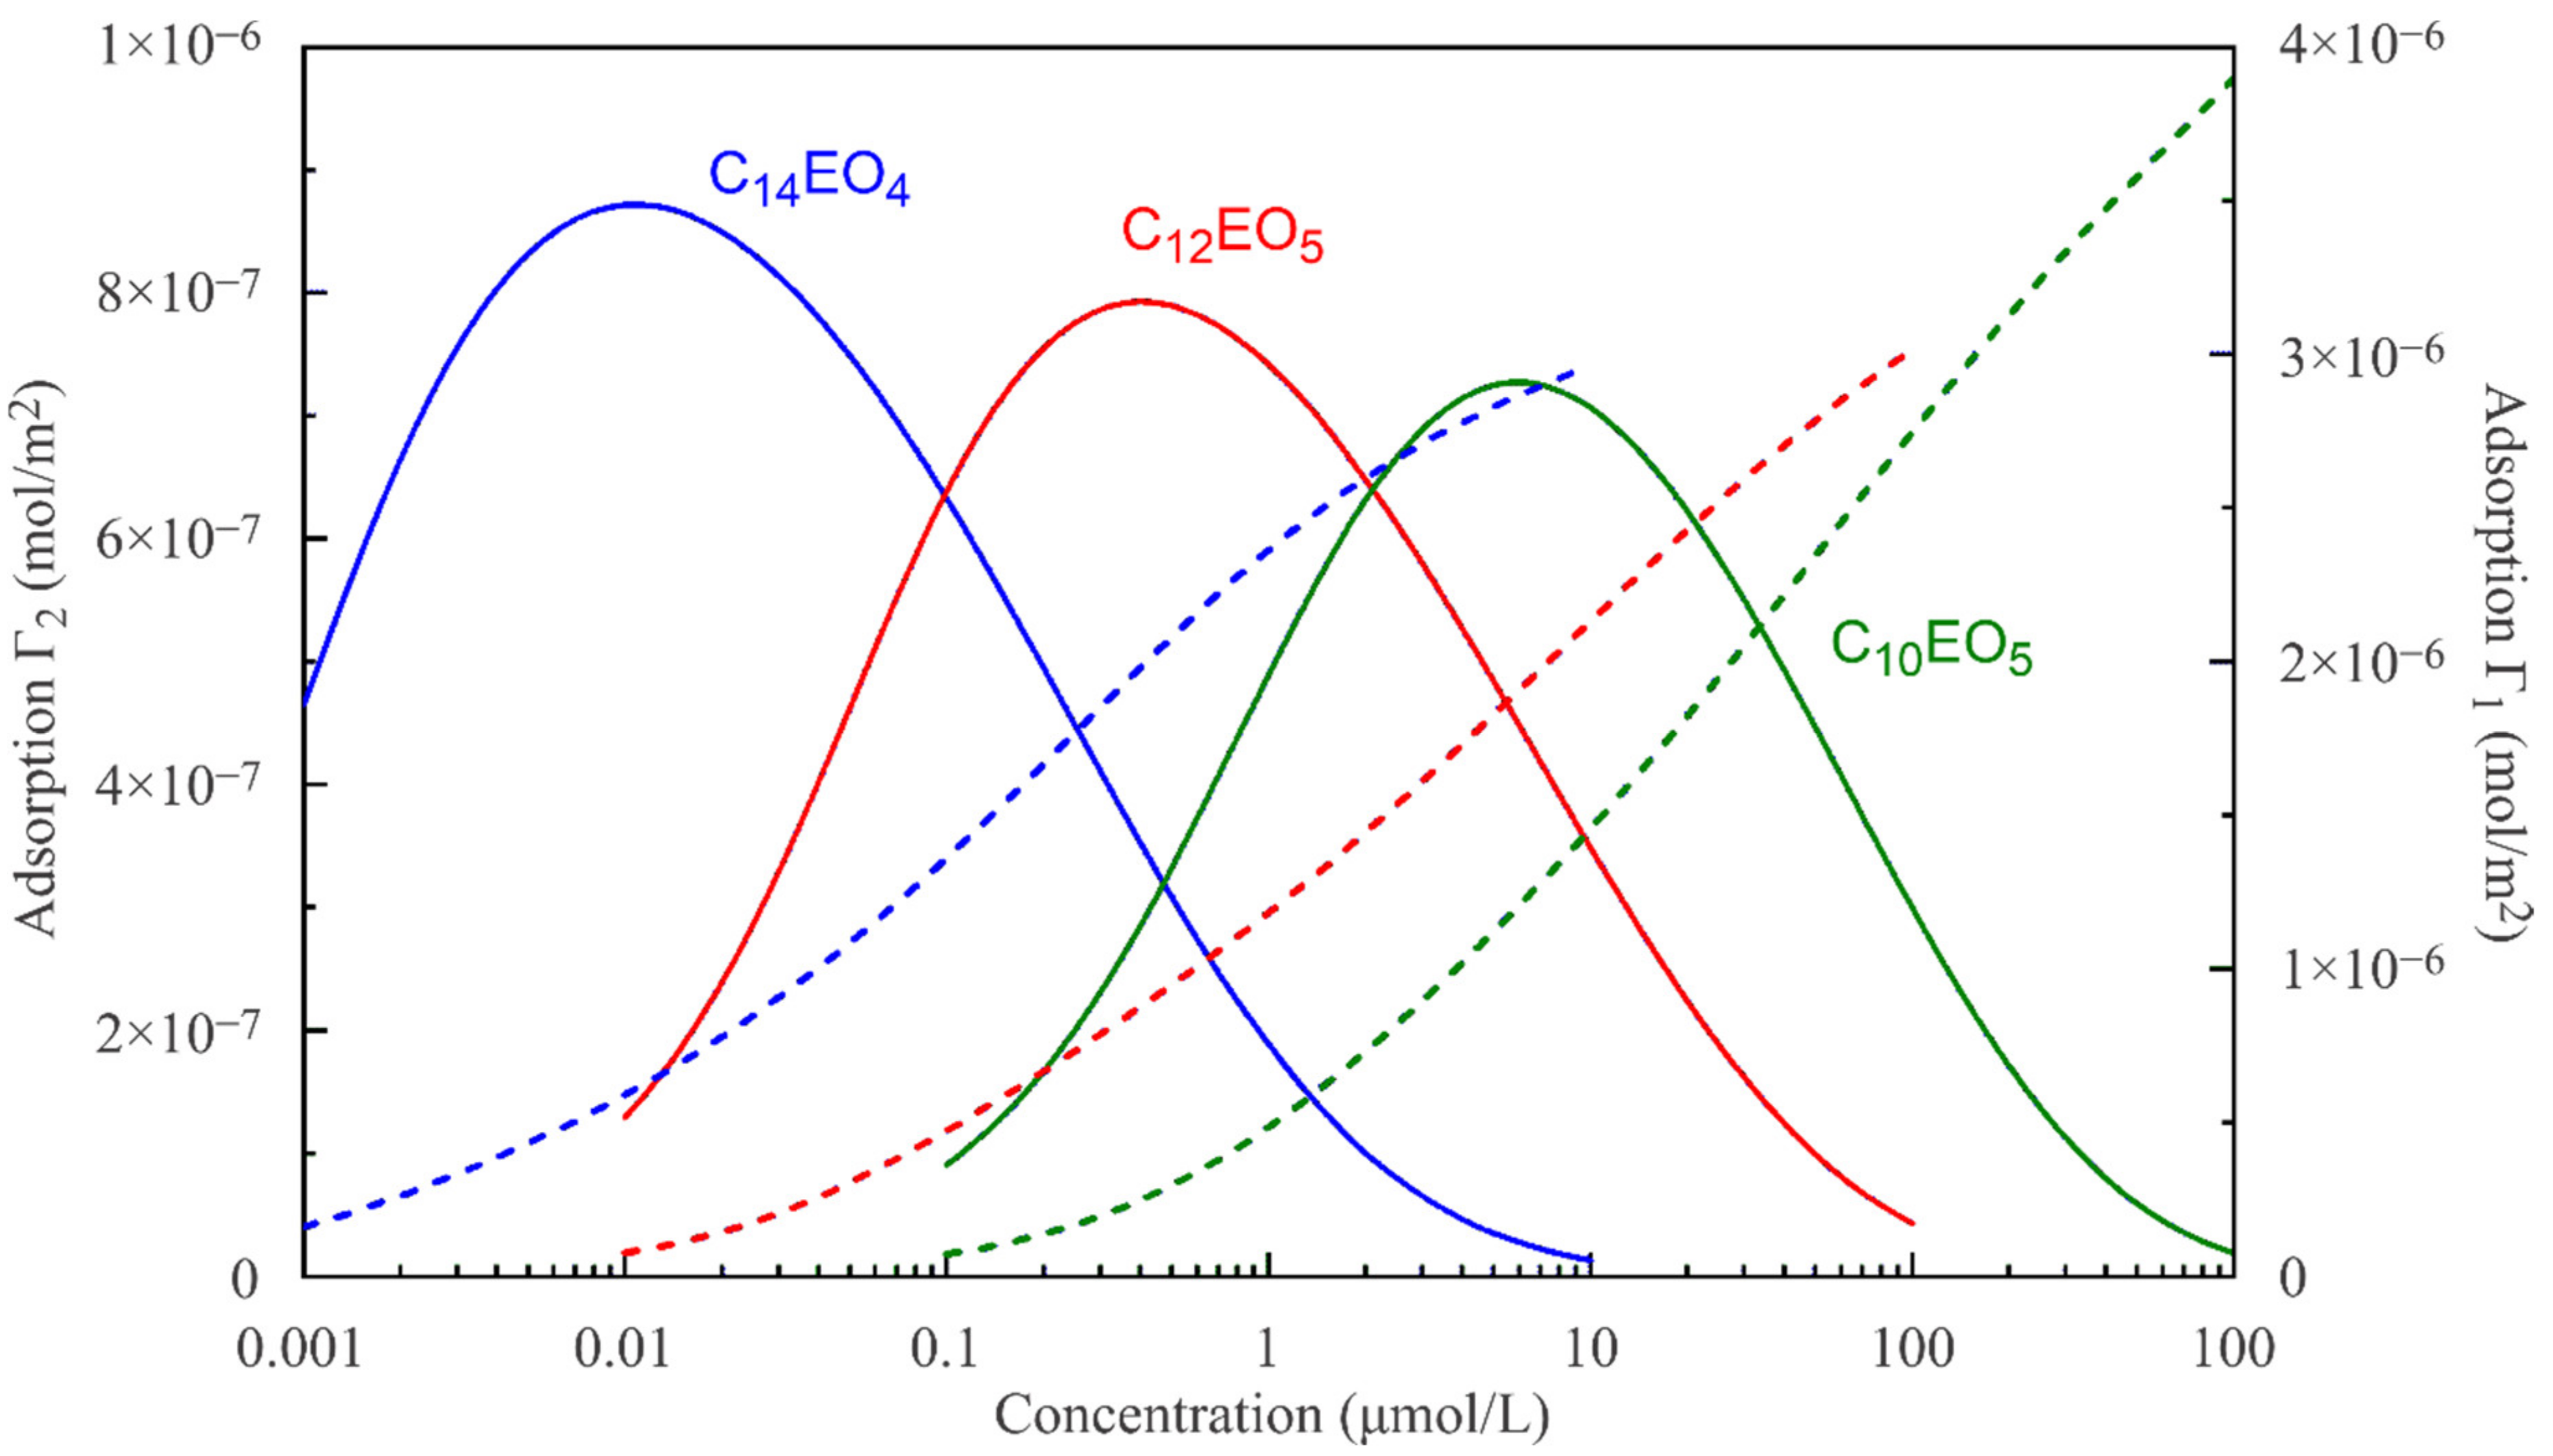
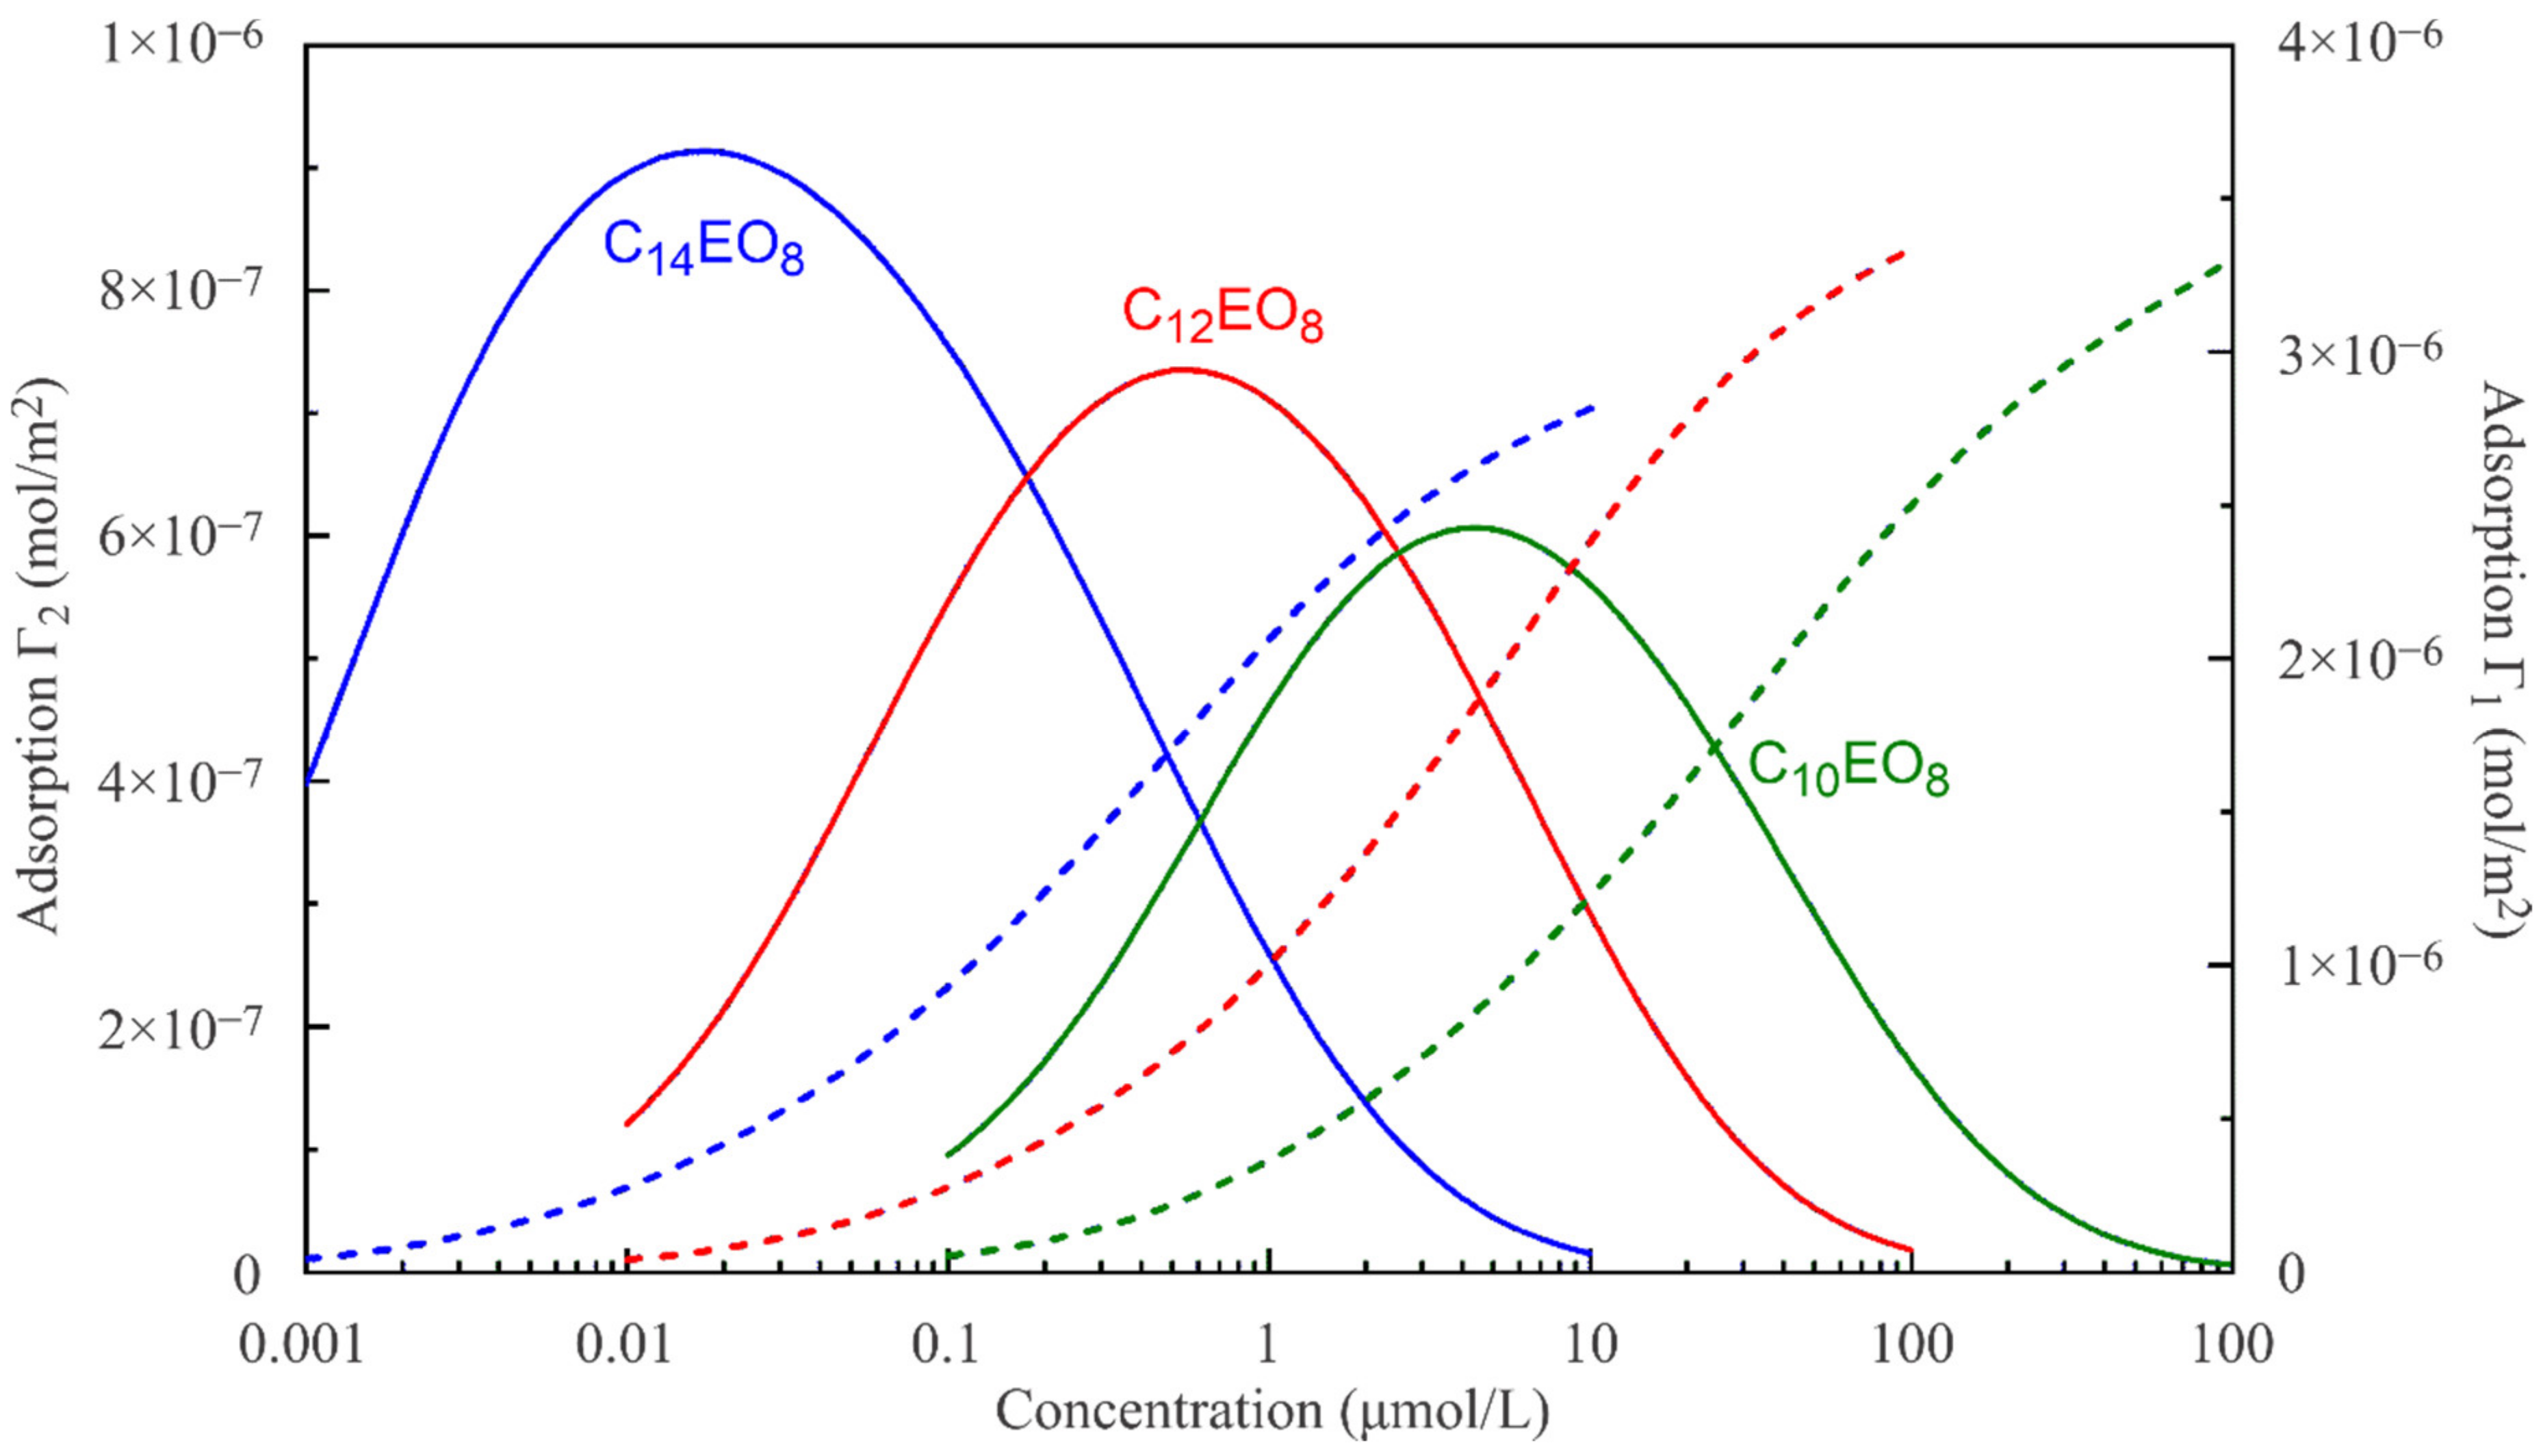
The reorientation model, given by Equations (1)–(6), allows us to calculate the adsorption of a surfactant in states 1 and 2 as a function of its bulk concentration. These theoretical dependencies are shown in
Figure 5 and
Figure 6. For a diffusion-limited adsorption process, a local equilibrium can also hold within the adsorption layer under dynamic conditions. Then, the dependences shown in
Figure 5 and
Figure 6 should preserve their validity for the surfactant adsorption in states 1 and 2 as a function of the subsurface concentration (which, however, is different from the constant concentration in the bulk). Initially, the surface pressure and the surface coverage are small, and accordingly, the subsurface concentration is also small. Therefore, initially the surfactant is preferentially adsorbed in state 2 characterised by a larger molecular area. With time, the surface coverage increases, and the surface becomes oversaturated by molecules in state 2, so that the molecules are forced to transfer from state 2 into state 1. This is seen in
Figure 5 and
Figure 6, where the adsorption in state 2 initially increases and then decreases. The adsorption in state 1 initially increases more slowly compared to state 2, but then it increases faster due to the transition of the molecules previously adsorbed in state 2. If the adsorption and transition processes are kinetically limited, then the molecules should remain for a longer time in state 2, and the surface tension should be reduced in the initial stage because the molecules in state 2 have a larger surface activity, as discussed above.
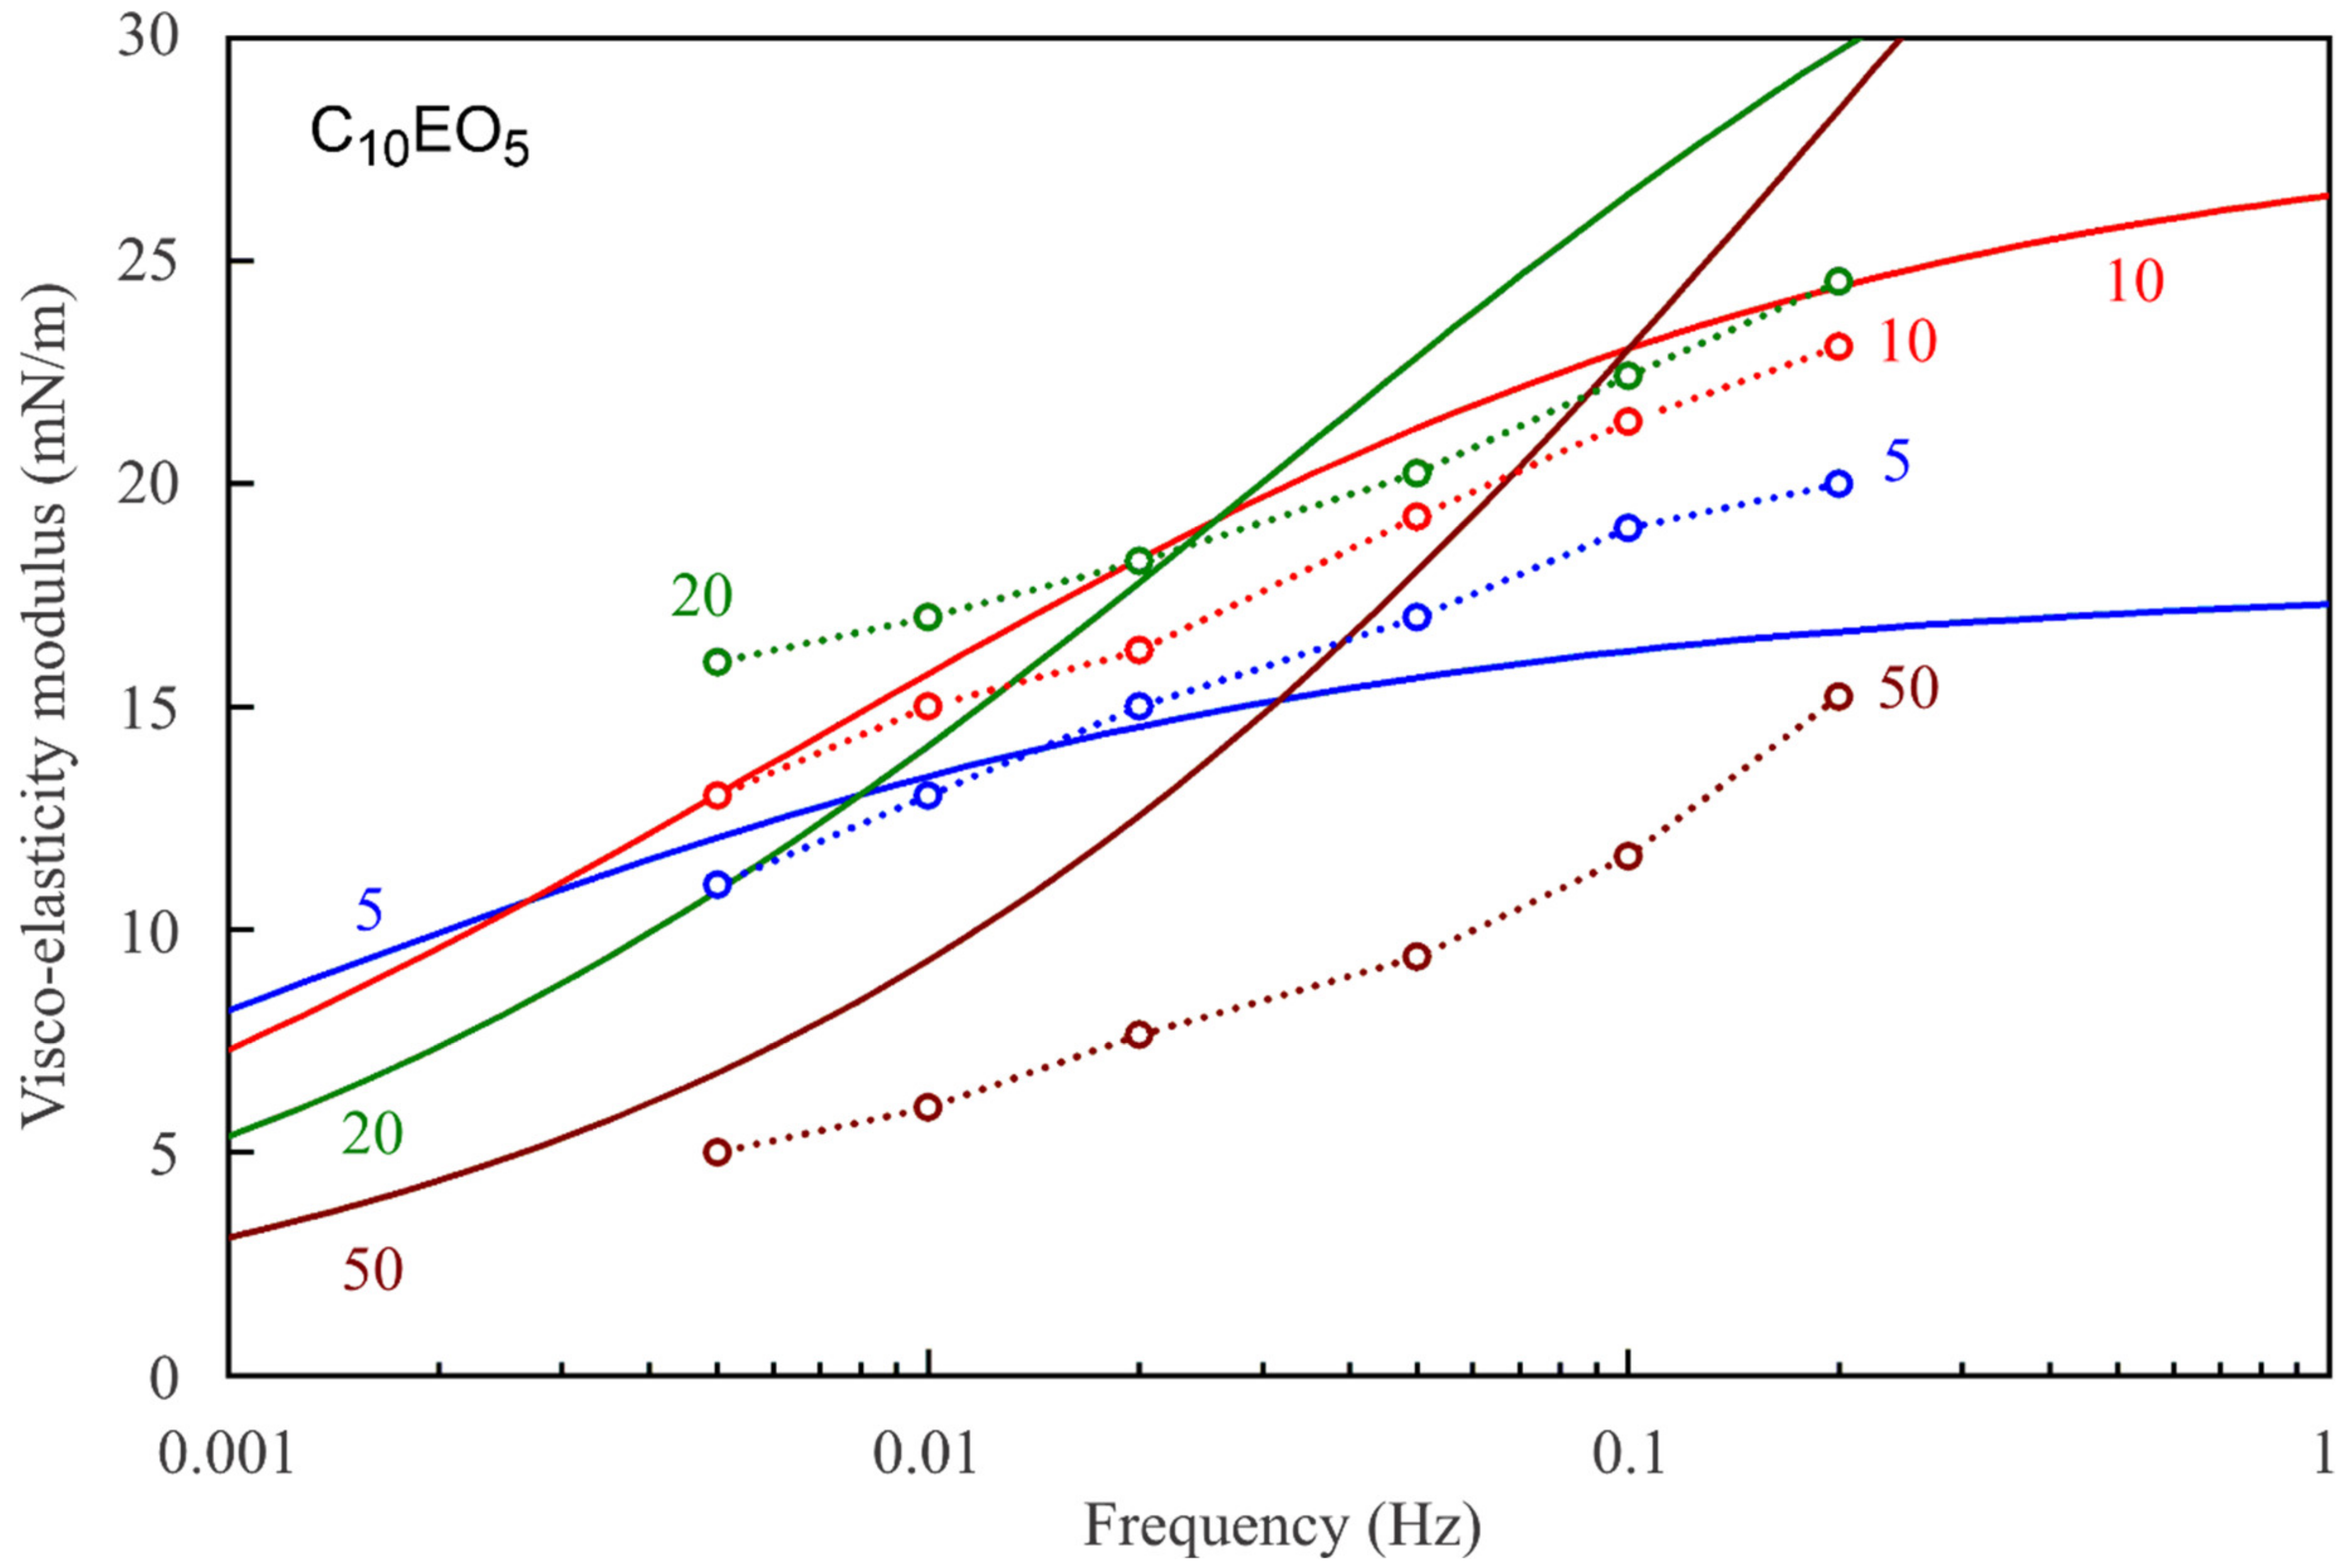
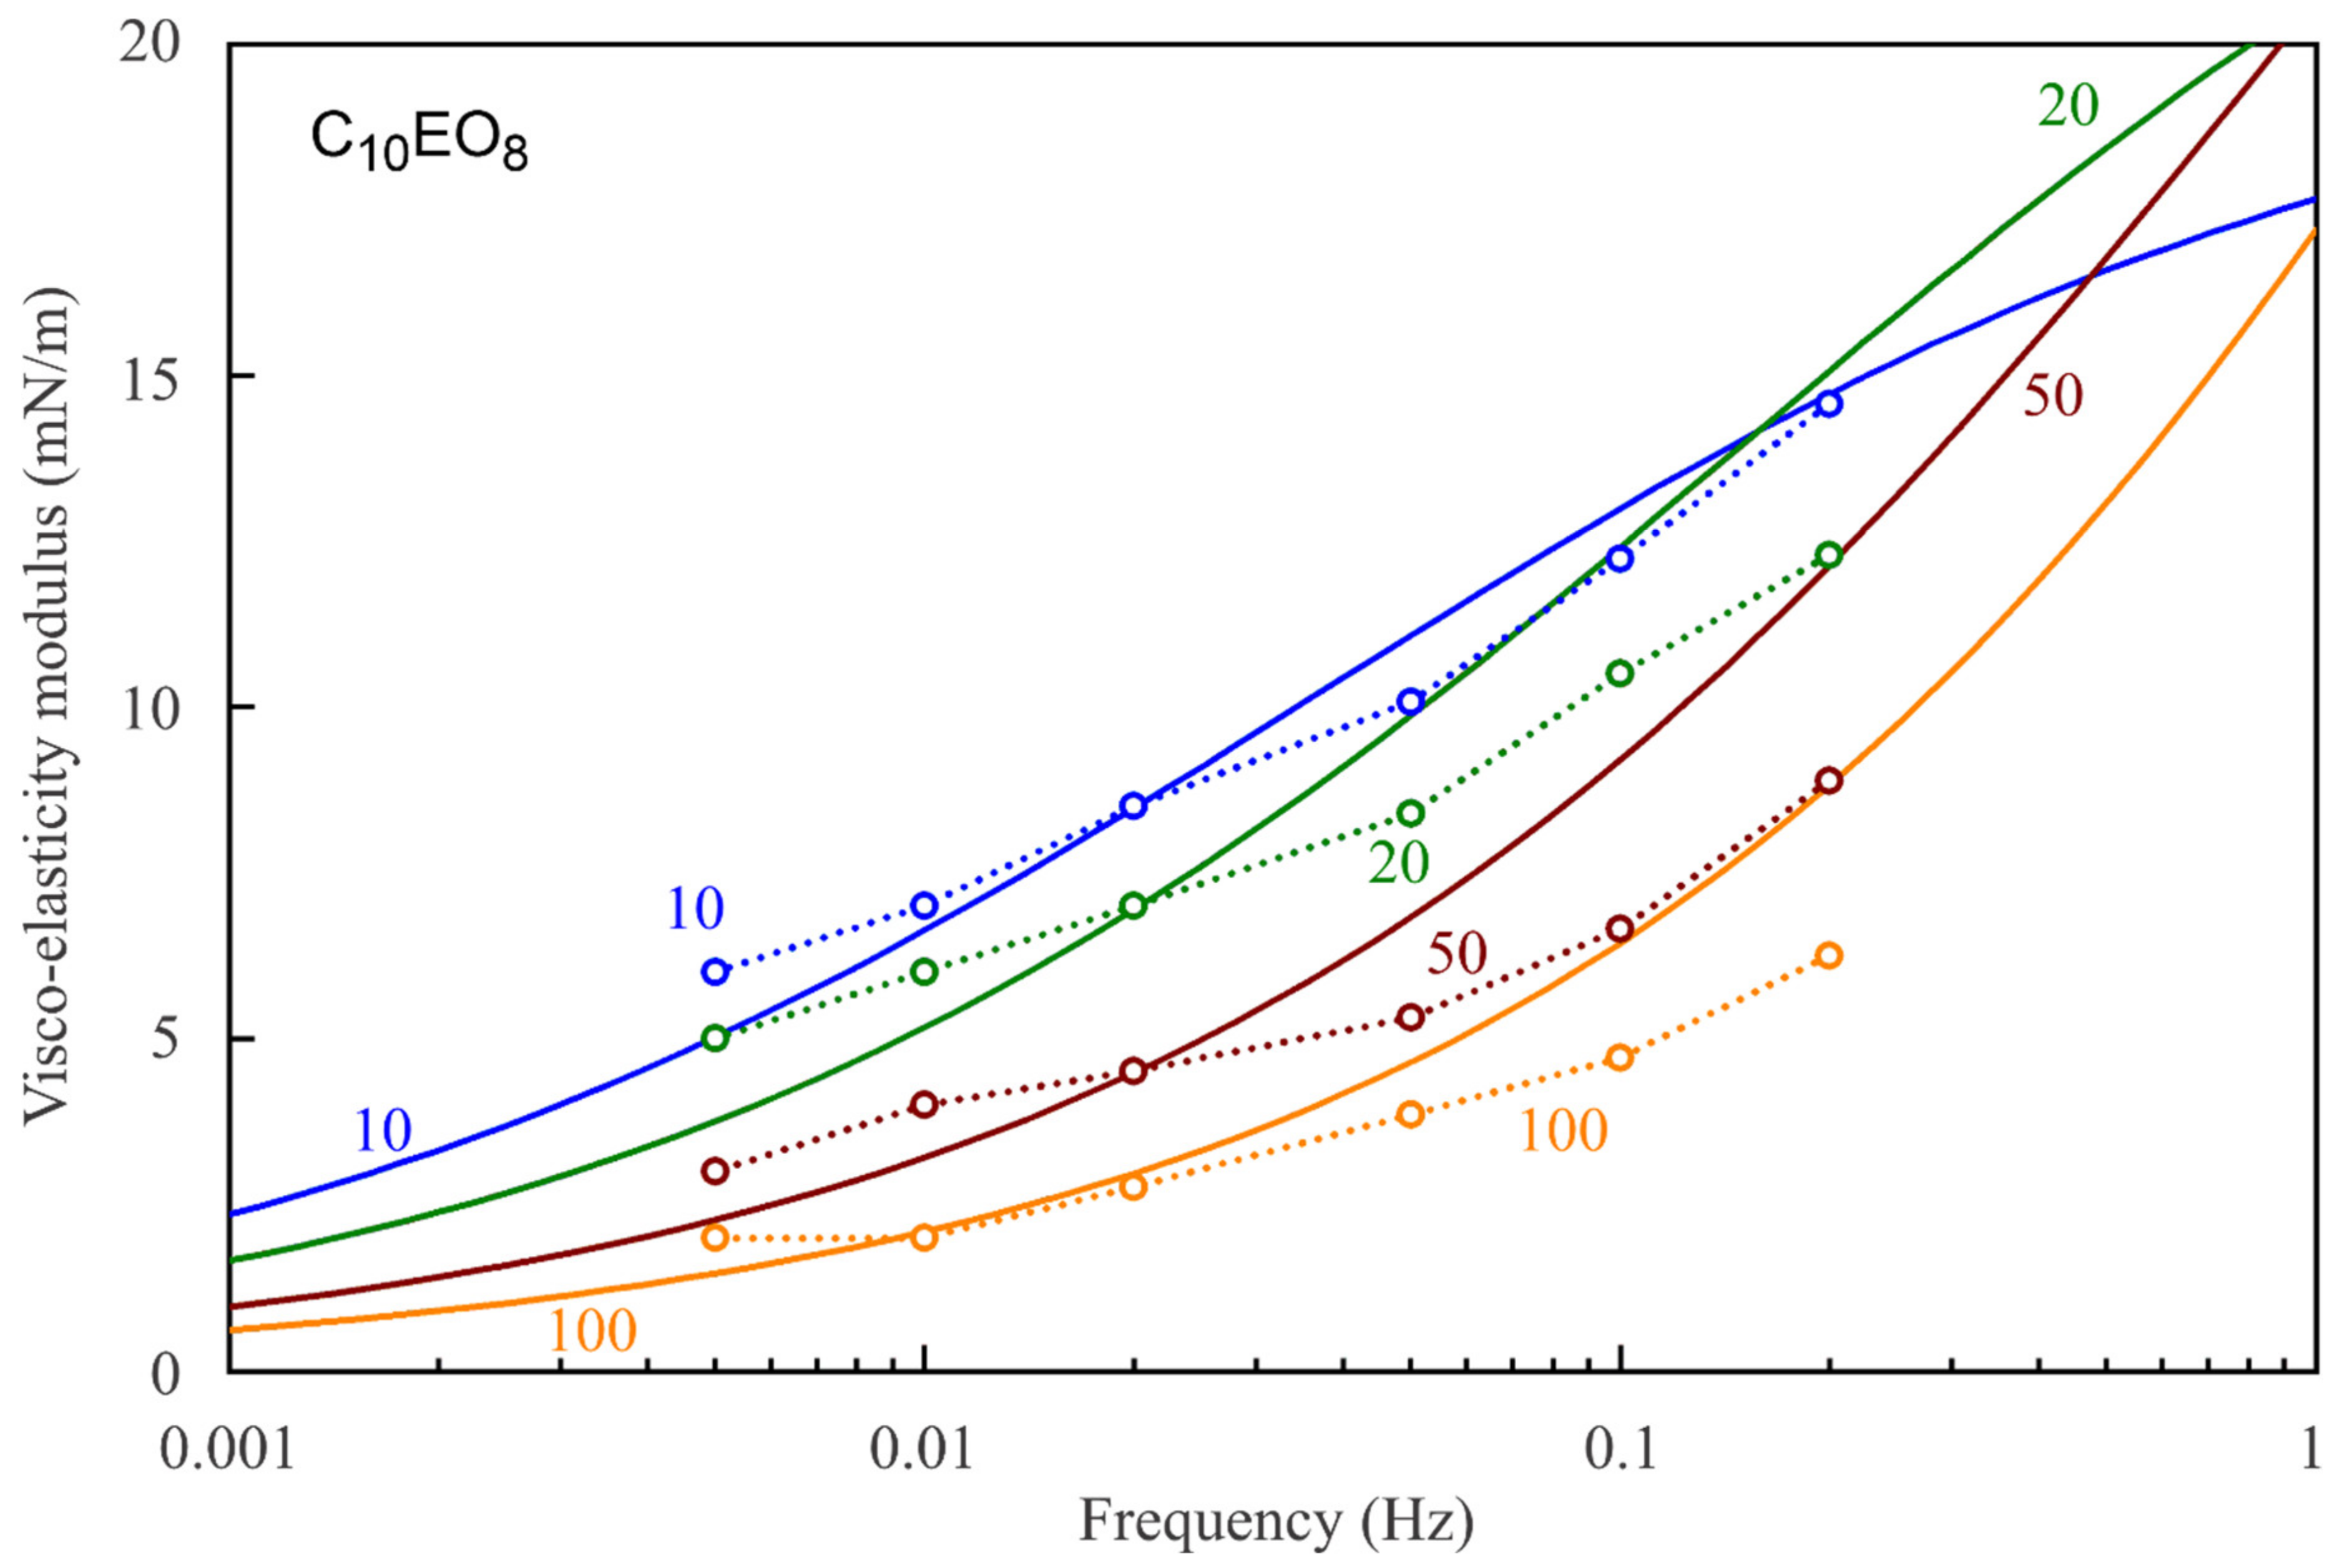
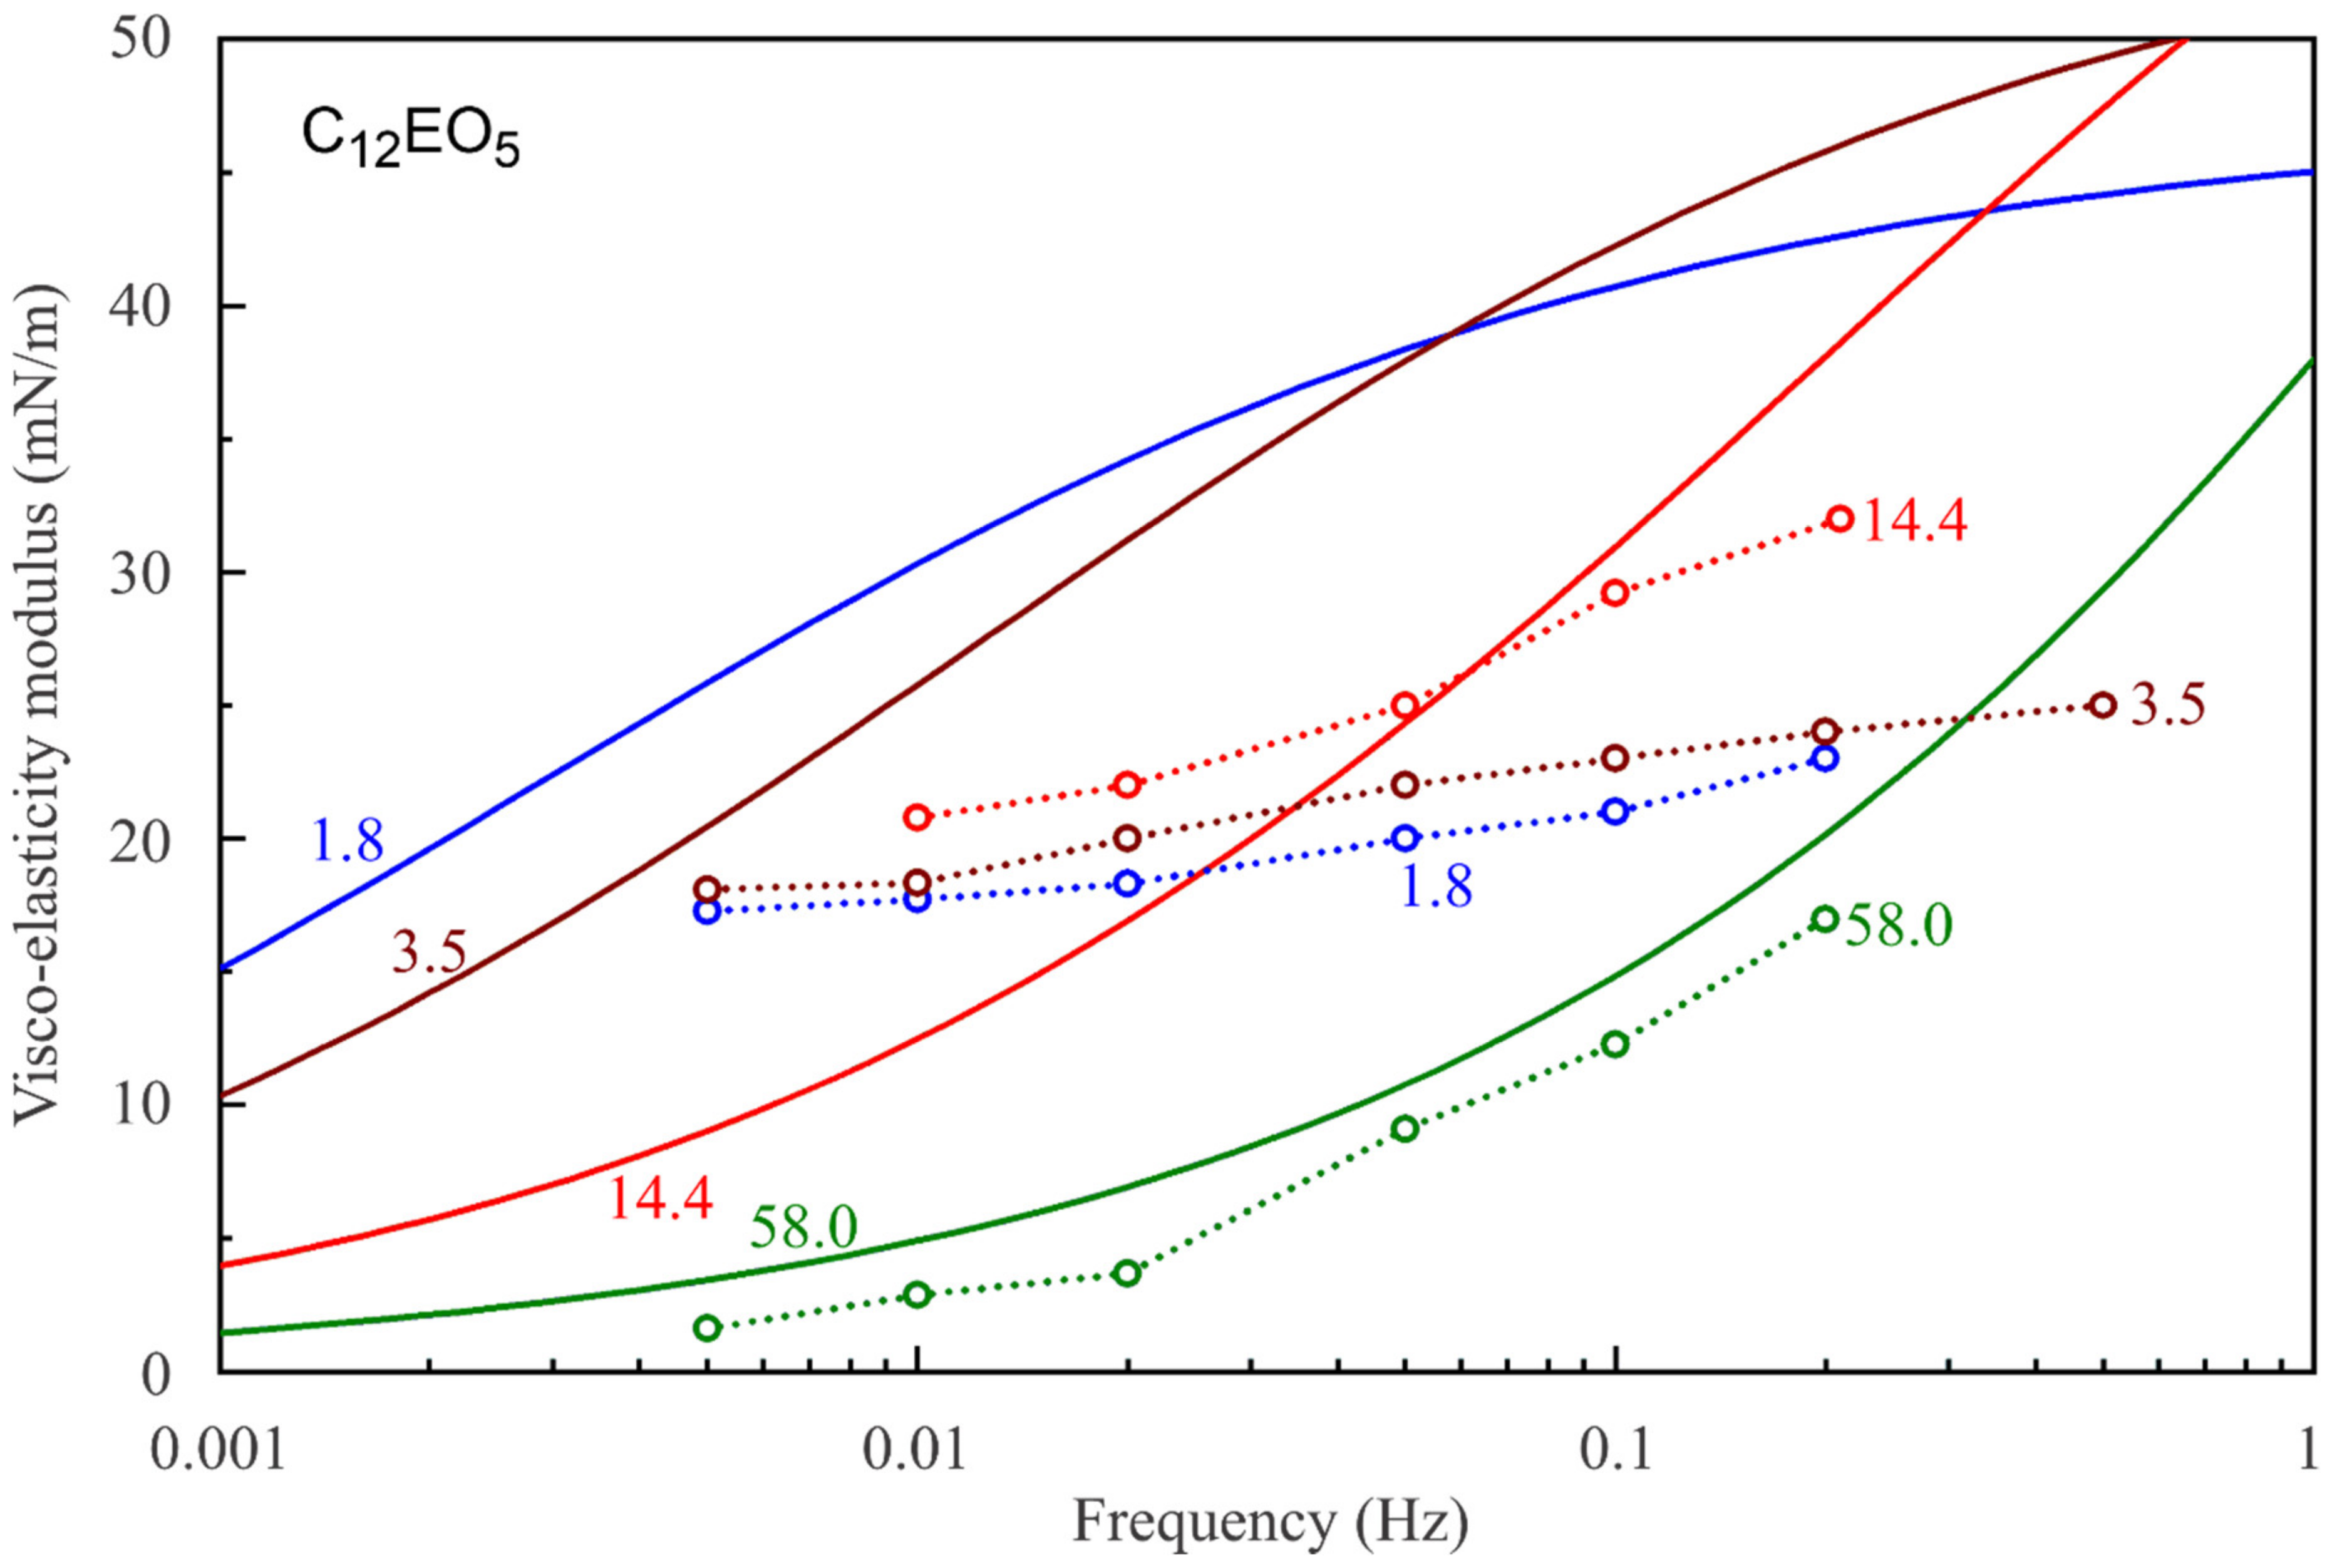
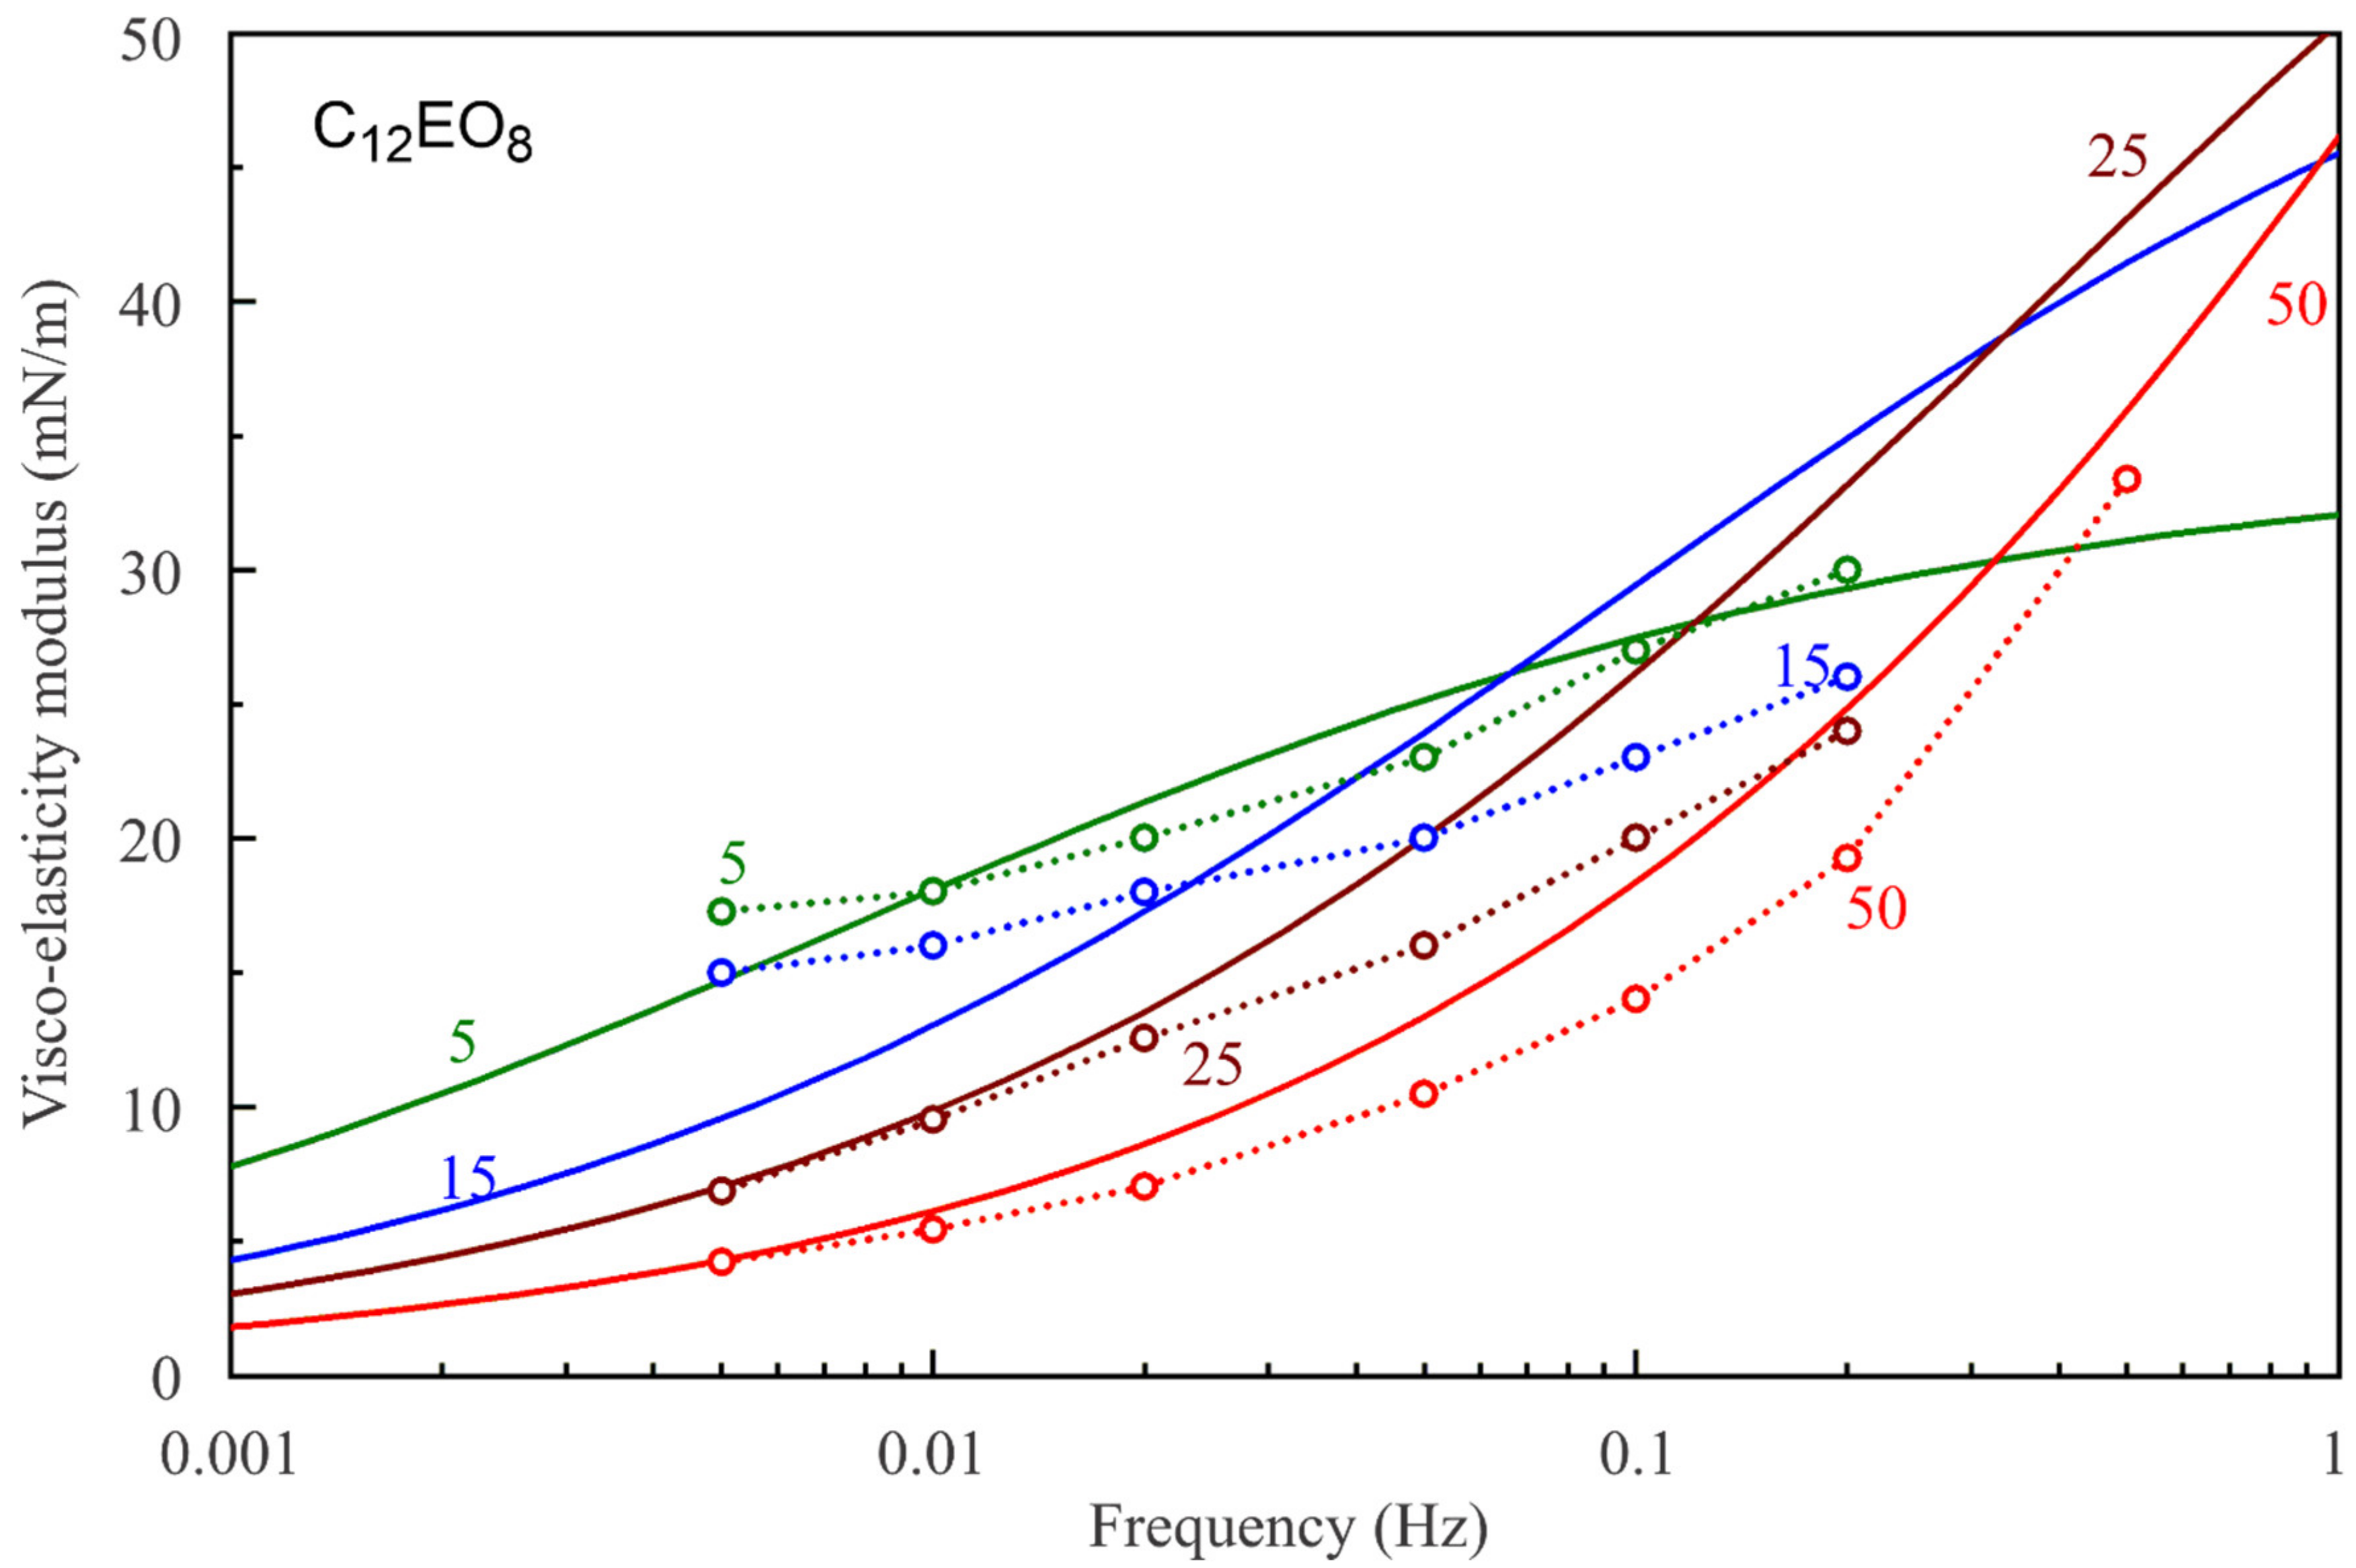
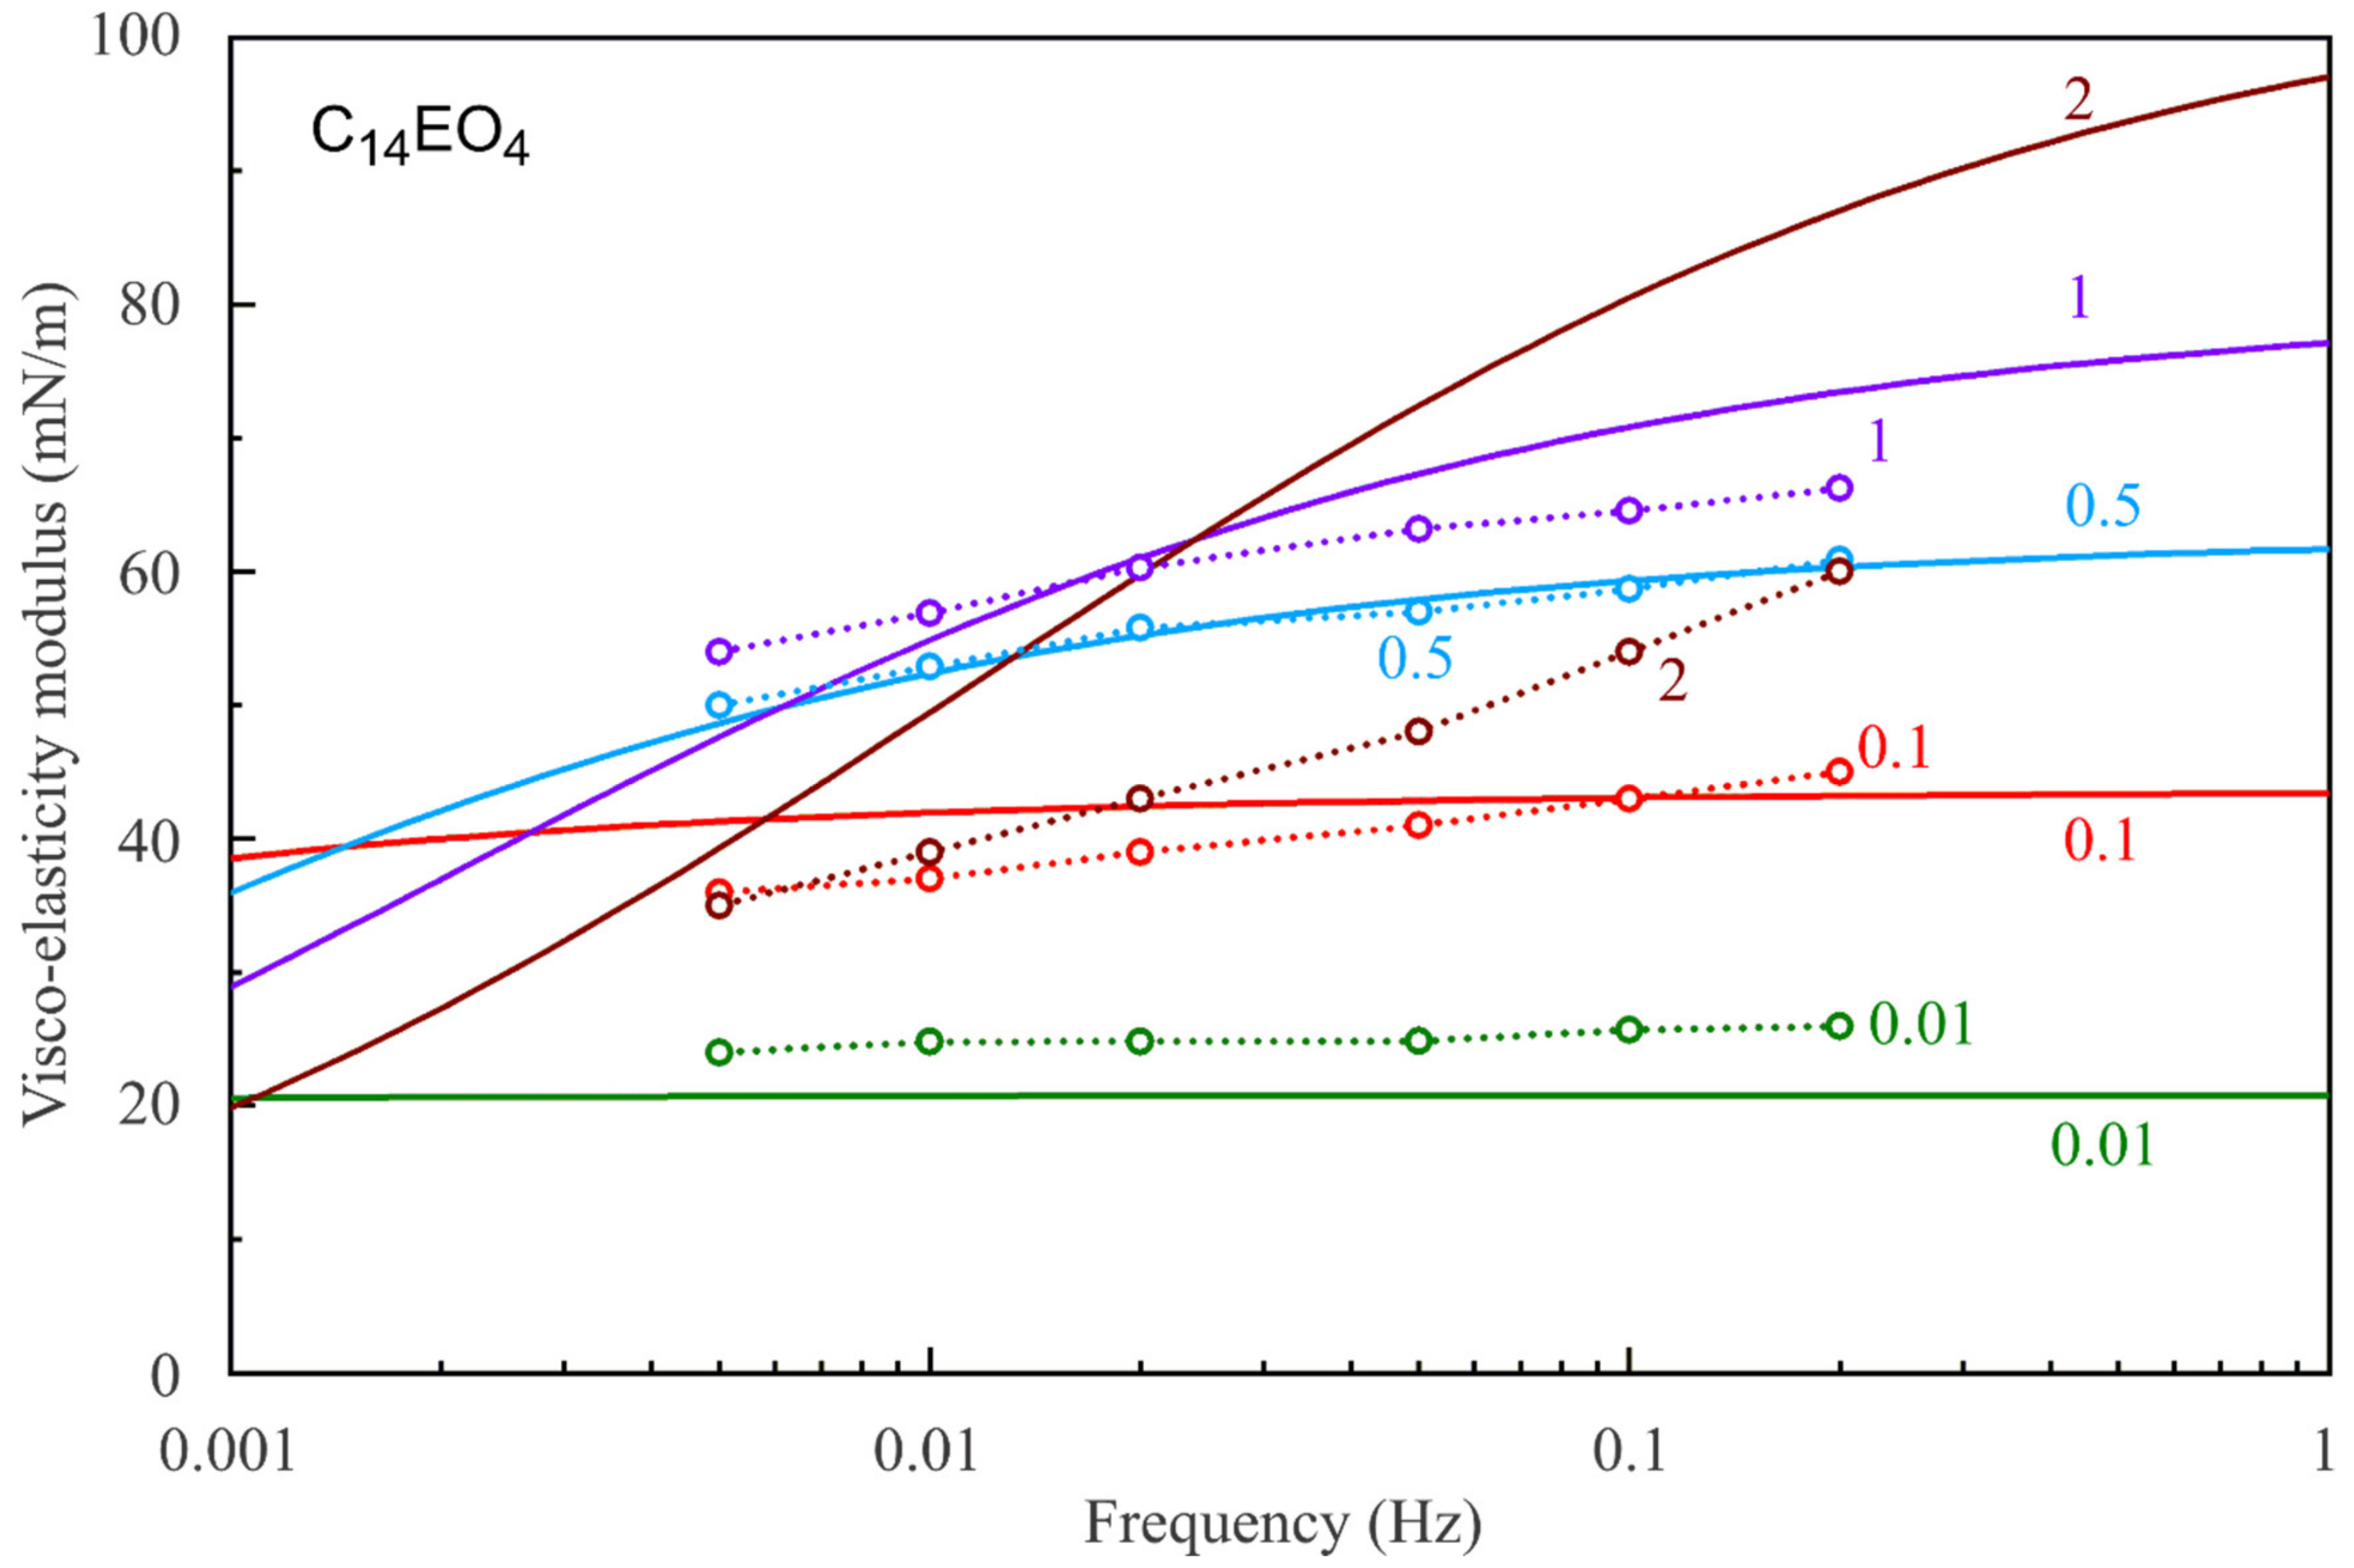
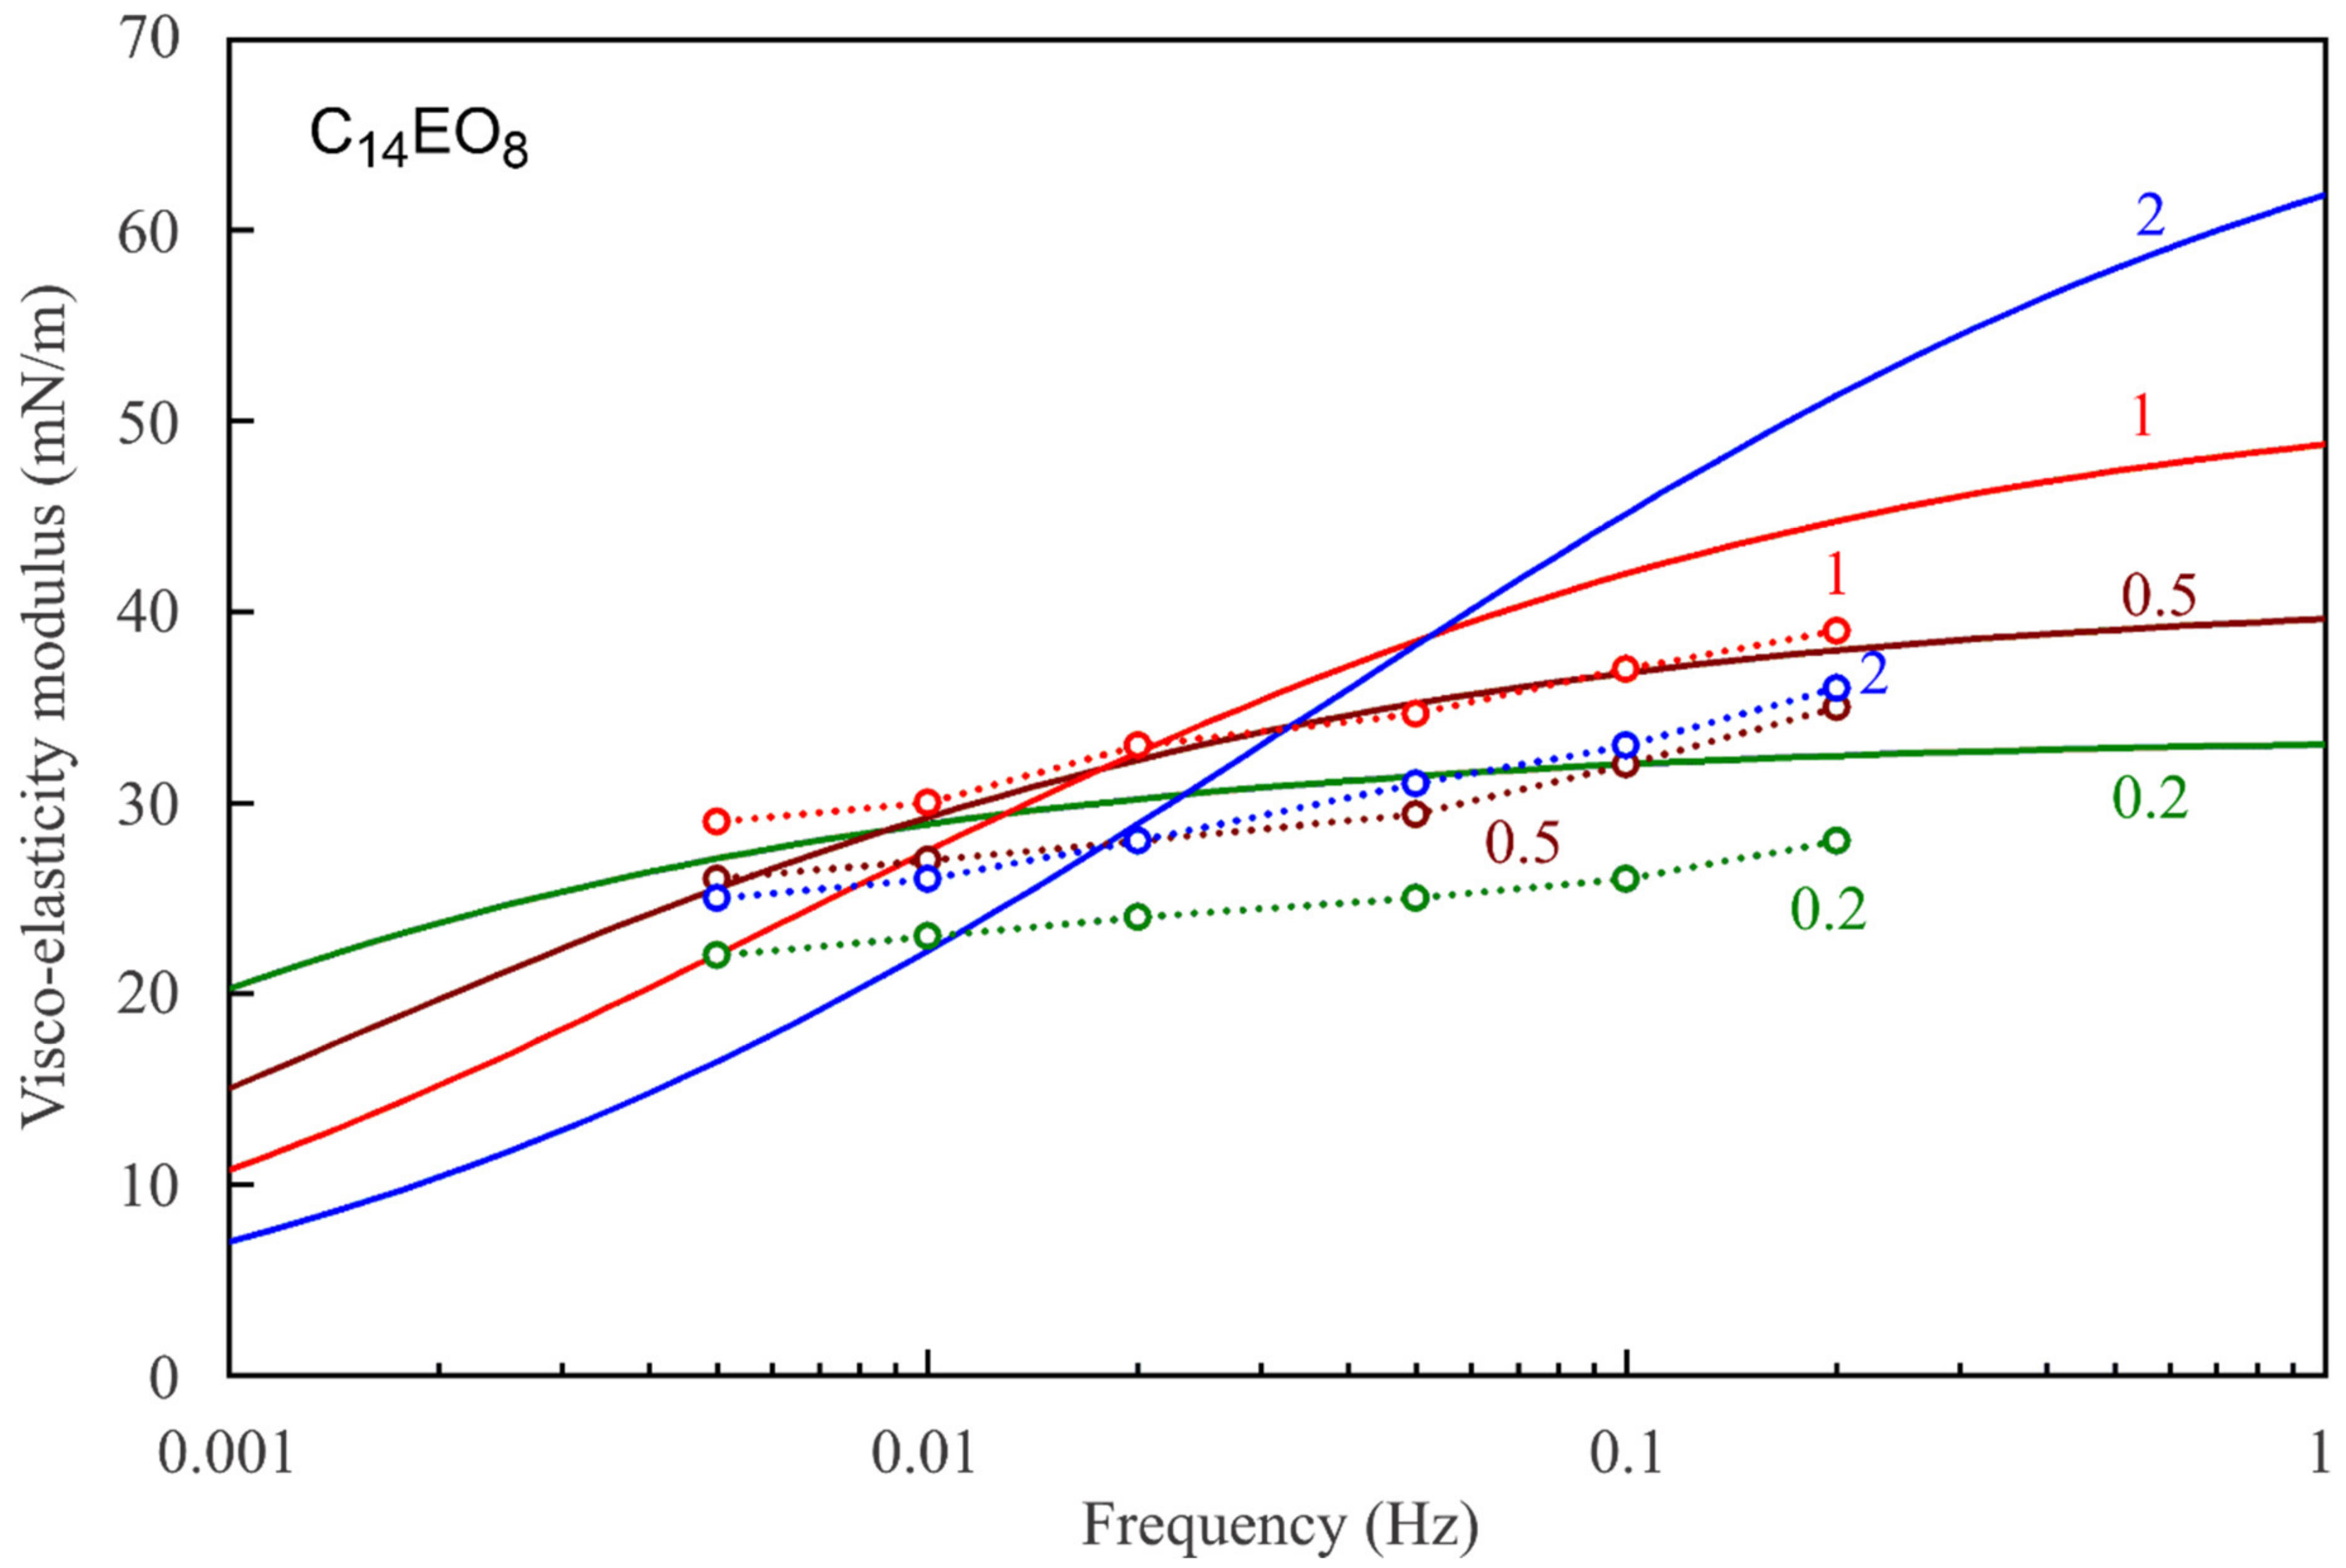
Figure 7,
Figure 8,
Figure 9,
Figure 10,
Figure 11 and
Figure 12 show the frequency dependencies of the surface dilational visco-elasticity modulus for different surfactant solutions. The experimental results are compared to the theoretical dependencies obtained by using the LvT equation, Equation (8), with the parameters E
0(c) and ω
D(c) calculated for each concentration by using the reorientation model, Equations (1)–(6), with the parameter values summarised in
Table 1. The diffusion coefficient is taken to be equal to 5 × 10
−10 m
2/s for all calculations of the visco-elasticity modulus. The results presented in
Figure 7,
Figure 8,
Figure 9,
Figure 10,
Figure 11 and
Figure 12 show a good qualitative agreement between the experimental data and the simplest LvT model, which does not account for a possible delay in the transition between the two states of adsorbed molecules. A more complicated model was elaborated in [
34], where a dynamic balance between the molecules in the two states is taken into account along with other possible relaxation processes. There is, however, no data on the characteristic time of the conformation transition between the two adsorption states, which complicates the application of this model. If this time is much shorter than the oscillation period, then the transition mechanism should not have a significant effect on the values of dilational visco-elasticity modulus. On the other hand, a kinetic barrier for adsorption and desorption of the molecules in the two states would influence the surface visco-elasticity modulus.
5. Conclusions
The adsorption layers of six selected ethoxylated glycol ethers (C10EO8, C10EO5, C12EO8, C12EO5, C14EO4 and C14EO8) were studied by two dynamic surface tension methods: bubble profile analysis and maximum bubble pressure tensiometry. These experimental methods allowed us to obtain equilibrium surface tension isotherms, dynamic surface tension curves and dilational surface visco-elasticity moduli. As shown, the surface tension isotherms can be fitted with good accuracy by the reorientation model, which accounts for the possibility for the surfactant molecules to adsorb in two states characterised by different surface areas (with ethoxylated chains either adsorbed or partially immersed in the solution). Via the fitting procedure, the values of the model parameters were obtained, which showed that the molecular area in the state with larger area correlates with the length of the ethylene oxide chain.
The same sets of model parameters were used to describe the dynamic surface tensions and dilational surface visco-elasticity moduli. In the case of dynamic surface tension, the apparent surfactant diffusion coefficient was varied to obtain optimum agreement with the experimental data. It was found that to fit the experimental curves for C14EO8 solutions with larger concentrations and for C10EO8 solutions in the range of short adsorption times, a larger diffusion coefficient is required than for long adsorption times. This apparent deceleration of the process can be related to the transition of molecules from the adsorption state with larger surface area to the state with smaller surface area caused by the increasing surface coverage. The molecules in a state with larger area have a higher surface activity, and they reduce the surface tension more strongly than the molecules adsorbed in a state with smaller surface area. However, the transition of the molecules between the two states leads to a slower surface tension decrease. A possible kinetic barrier for this transition process can produce an additional delay in the surface tension decrease at longer adsorption times.
The frequency dependencies of the surface dilational visco-elasticity modulus for different surfactant concentrations were calculated by using the Lucassen–van den Tempel equation with a constant diffusion coefficient (5 × 10⁻¹⁰ m2/s). Comparing the calculated dependencies with the experimental ones, we can conclude that a diffusion-limited adsorption mechanism describes very well the observed visco-elasticity moduli. However, kinetic barriers for adsorption and desorption of the molecules in the two adsorption states or for a direct transition between the two states can influence the surface modulus depending on the time scale of surface oscillations.


 ,
, 


