
Study of the Degradation of Biobased Plastic after Stress Tests in Water


1
CNR-INO, PRISM Lab, Via Branze 45, 25123 Brescia, Italy
2
Department of Information Engineering, University of Brescia, 25133 Brescia, Italy
3
Corapack S.r.l., 22040 Brenna, Italy
*
Author to whom correspondence should be addressed.
Coatings 2021, 11(11), 1330; https://doi.org/10.3390/coatings11111330
Submission received: 5 October 2021
/
Revised: 22 October 2021
/
Accepted: 27 October 2021
/
Published: 29 October 2021
(This article belongs to the Special Issue Multifunctional Coating for Packaging Applications)
Abstract
:Research on compostable bioplastics has recently obtained performances comparable to traditional plastics, like water vapor permeability, sealability, and UV transmission. Therefore, it is crucial to create new tools that help the developers of new polymeric composites study them quickly and cost-effectively. In this work, Raman spectroscopy (RS) was proposed as a versatile tool to investigate the degradation of biobased plastics after a stress test in water: this approach is a novelty for food packaging. Treatments at room temperature (RT) and 80 °C were selected, considering that these biopolymers can be used to packaging ready meals. The investigation was carried out on single-layer sheets of poly-lactic acid (PLA), cellulose ester (CE), poly-butylene succinate (PBS), poly-butylene adipate-co-terephthalate (PBAT), and a new composite material obtained by coupling CE and PBS (BB951) and PLA and CE (BB961). The vibrational modes of the water-treated materials at RT and 80 °C were compared to the Raman spectra of the pristine bioplastic, and the morphologies of the polymers were analyzed by scanning electron microscopy (SEM) and optical microscopy. Composite sheets were the plastics which were mostly affected by the 80 °C treatment in water, through changes in morphology (wrinkling with alternate white and transparent zones), as was especially the case for BB951. The Raman spectra acquired in different zones showed that the vibrations of BB951 were generally maintained in transparent zones but reduced or lacking in white zones. At the same time, the single-layer materials were almost unchanged. For BB961, the Raman vibrations were only slightly modified, in agreement with the visual inspection. The results suggest that RS detects the specific chemical bond that was modified, helping us understand the degradation process of biobased plastics after water treatment.
1. Introduction
Plastic derived from petroleum or fossil fuels is a cheap, versatile, lightweight, resistant, and widely used material in crucial sectors such as packaging, agriculture, automotive and electric appliances. However, it needs a long time to degrade (from 20 years of a plastic bag to 500 years of a toothbrush). At the end of its life path, it can be incinerated in a plant, recycled, or placed in landfills, but in some cases, it is dispersed in the environment. Often, food packaging is incorrectly displaced into biowaste, thus increasing pollution [1,2,3,4,5,6], making it contribute to the amount of plastic that pollutes the planet due to its extensive use [7,8]. Plastic recycling is the method of gathering and reconverting waste to new useful products, but waste management is highly variable from country to country [9,10,11]. Packaging is responsible for 60% of plastic waste in Europe, so regulation of the packaging is understood to help contain the problem [12]. The environmental concerns related to plastics can be tackled using bioplastics based on renewable resources (biobased) or biodegradable and/or compostable plastics [13,14]. The role of bioplastic in the circular economy was recognized by the European Commission (EC), and regulation from EC should be delivered by the end of 2021, raising awareness on the proper use of biobased and biodegradable plastics and acknowledging the role of biodegradable/compostable plastics in the recovery of biowaste. The impact of bioplastic use on sustainability is twofold: being produced from renewable resources, bioplastic reduces the use of raw materials. Moreover, if food packaging is biodegradable and/or compostable, it helps to reduce solid waste [15]. Furthermore, bioplastics are CO2 neutral, which means that they do not need incineration to be recycled, and thus do not produce CO2. Bioplastics are already used in the packaging field [16], but their properties are not comparable to traditional plastics, limiting their direct use [17]. Depending on the packaging usage, several features, such as, oxygen and water vapor permeability, brittleness, and difficult heat sealability should be addressed for the packaging of raw meat and cured meat under modified atmosphere packaging (MAP) [18]. Another critical parameter is the cost of the production process, which should be as low as possible. With many bioplastics entering various market segments for diverse applications, industries are interested in expanding its production capacity [19]. Conventionally, companies need to characterize newly developed bioplastic through expensive and time-consuming certifications, and would be highly interested in portable instruments that could check the polymer composition or modifications when the packaging material is modified (by temperature, aging, contact with food processing apparatus, and so on). In this way, a developer can test a polymer’s resistance to degradation in a fast and reliable way before spending time and money on a new certification.
Instruments based on the Raman spectroscopy (RS) method are already available as portable instruments, yet are rarely employed in the literature to study the structure and degradation of biobased polymers [20] under water tests. In the literature, the most conventional experimental technique used in polymer characterization is FTIR spectroscopy (FTIR) [3,21,22,23,24,25]. FTIR is only available in laboratory facilities, and the spectra acquired with this technique can be influenced by the water absorption band [26], so it is not best suited for in-situ characterization in a humid environment. Otherwise, one of the strengths of RS is its ability to analyze a sample for in-situ characterization, and this is a quick and cost-effective procedure. By using RS, the water need not be removed from the sample, as in FTIR. The only spectral requirement is that the sample band of interest must not overlap with the Raman contribution of some other sample components. RS allows us to determine the vibrations of the polymeric chain and to compare the spectrum of a material against a database of reference materials. It is widely used for fossil-derived plastic characterization [27,28,29,30].
This research studied how treatments in water at room temperature (RT) and 80 °C, mimicking processes that could occur during the preparation of ready meals, affects the Raman spectra of single-layer bioplastics: poly-lactic acid (PLA), cellulose ester (CE), poly-butylene succinate (PBS), poly-butylene adipate-co-terephthalate (PBAT), and composite bioplastics made by attaching CE and PBS for BB951 and PLA and CE for BB961. Such work was performed in the literature only on PBS [25], but the behaviour of the other bioplastics in a humid environment is still unknown. Moreover, the characterization of composite bioplastics, made of two different materials, has never been addressed.
The Raman measurements were accompanied by an analysis of the morphological properties of polymers by scanning electron microscopy (SEM) and by optical microscopy.
The bioplastics studied present different properties, and can be used in various food packaging or related food applications (Table 1). PLA is a biodegradable polymer [20] and its basic building block is lactic acid (LA) [31]. It is employed for disposable products, such as plastic bags, food packaging, and film [32]. It is attractive as a packaging material because it exhibits a tensile strength comparable to petroleum-derived thermoplastics and can be sealed at low temperatures [33]. CE is a biodegradable material, and it represents a class of commercially important thermoplastic polymers in the fiber, film, and filter industries [34,35]. It has a high oxygen barrier compared to other bioplastics, and it is used in composite materials to improve resistance to humid environments. PBS is a soft and flexible semi-crystalline polyester with excellent properties suitable for blown and cast film extrusion. PBAT is an aliphatic-aromatic co-polyester biodegradable due to its ester bonds in the soft chain, which are sensitive to hydrolysis [36,37,38]. PBAT is synthesized by esterifying 1,4-butanediol with an aromatic dicarboxylic acid and then poly-condensation with succinic acid; it is a commercially available aliphatic-co-aromatic co-polyester now widely used worldwide [39]. Due to its random structure, it shows low crystallinity, presenting lower modulus and stiffness. Still, concerning its gas barrier properties, PBAT shows slightly higher water vapor permeability than PLA and PBS.
The composite bioplastics used in this work and never studied before in the literature were developed to improve the performance of a single material: in BB951 the CE enhances the resistance to water vapor that is low in PBS; in BB961 the CE is used to improve sealability. Target applications include twist-wrap, vertical form-fill-seal (VFFS), overwrap, flow-wrap, and lamination for moisture-sensitive products. BB951 film is used for the packaging of ready-made dishes, capsules and coffees, and other foods that require a modified atmosphere. It is helpful for frozen food and pasteurization, but it is more opaque than BB961. Transparency makes BB961 ideal for packaging ready meals; it is also used for foods that require a modified atmosphere or for fruit packaging that requires holes.
In this work, we verified that RS is a fast and reliable tool to check the nature of unknown packagings, such as with samples of compostable packaging at the supermarket. Some unknown packaging materials used for cheese and fruits were compared against the database collected in this work to verify that a complete identification is possible.
2. Materials and Methods
2.1. Materials Tested
For the experiments, bioplastics provided by Corapack srl. (Brenna, Italy) and bioplastics bought at the supermarket were employed. The bioplastics delivered by the company had thicknesses of about 80 µm and were made by Coralene SW from poly-lactic acid (PLA), cellulose ester (CE), poly-butylene succinate (PBS), poly-butylene adipate-co-terephthalate (PBAT), and the two composite materials BB951 (made with CE and PBS) and BB961 (made with PLA and CE). In particular, the CE sample used in this experiment was lacquered on both sides with polyvinylidene chloride (PVdC) of NatureFlex NK. Incorporating a minimal amount of PVdC to optimize moisture and gas barrier functionality creates a simpler and lighter packaging that extends and maintains the shelf life of the packaged products. In addition, the film retains good conversion receptivity as well as heat-sealability on both sides. The materials were cut in pieces of about 1 cm × 1 cm for handling (an image of the pristine samples is shown in Figure 1, as a comparison to treated samples). The materials bought at the supermarket were used as a blind control of the database acquired. We used white packaging for fresh cheese (number IT 05112 CE) and transparent packaging for bio tomatoes.
To characterize the degradation of all the materials, Raman measurements were performed on the pristine bioplastics, and afterward, the responses of all the materials in a humid environment were studied (an image of the Raman setup and of the test at RT in water is found in Appendix A). For the humidity tests, two treatments in water at different temperatures on all the bioplastics were performed by keeping a set of bioplastics in MilliQ water (it is water purified using a Millipore lab water system) for 12 h at RT and another set of bioplastics for three hours in distilled water at 80 °C. The 80 °C temperature was chosen from the recommendation for cooking whole potatoes in a slow-cooker, 80 °C for 3 h [40].
The standard procedure for testing food packaging is the migration test, which is performed to obtain a certification of food packaging. Several food-contact legislative frameworks worldwide have set out requirements for testing the migration of substances or simulants. The substances used in the migration test established by EC 1935/2004 or MOCA regulation are oil, ethyl alcohol, and acetic acid in distilled water at different concentrations. The tests are performed in water at 20 °C and at high temperature when the food must be heated, like in the case of ready meals. The packaging used in this work has already been approved for the market because it had passed the migration tests.
2.2. SEM and Optical Microscopy
The morphology of PLA, CE, PBS, and PBAT was investigated by field emission scanning electron microscopy (FE-SEM, LEO 1525, Zeiss, Milan, Italy) in conventional mode (recording the secondary electrons with the secondary emission detector) with an accelerating voltage of 3 kV and by tilting the samples at 40° to avoid charging effects. The samples were not metalized before the measurements.
The optical measurements of BB951 were carried out through an Orma Scientific NB50T optical microscope (trinocular zoom 0.8×–5×–LED) with the devoted HDMI MDH5 camera model being used to acquire the images (Orma Scientific, Milan, Italy).
2.3. Raman Spectroscopy
The Raman spectra of the different bioplastics were recorded with an excitation wavelength of 785 nm using a confocal micro-Raman setup (Horiba, Rome, Italy) equipped with a grating of 600 grooves/mm and a Peltier cooled CCD detector. An model, Olympus (Milan, Italy) microscope with an objective of 50× was used during the experiments. The signal was dispersed with 600 groove/mm grating. The laser power impinging on the sample was 5 mW. The spectral calibration was performed using a Si substrate, and to avoid Raman signal from the microscope glass support, a silicon substrate was used below every bioplastic. In the Raman spectra, the contribution at 520 cm−1 has to be ascribed to the Si substrate and not to the bioplastics. The removal of the baseline in the Raman spectra was done using LabSpec 6 software, by Horiba (2018, Rome, Italy). Since the polymers are transparent to 785 nm, the signals observed in the Raman spectra were collected from the whole thickness of the biopolymer and not only from the region focused on the sample.
3. Results and Discussions
3.1. Characterization of the Pristine Materials
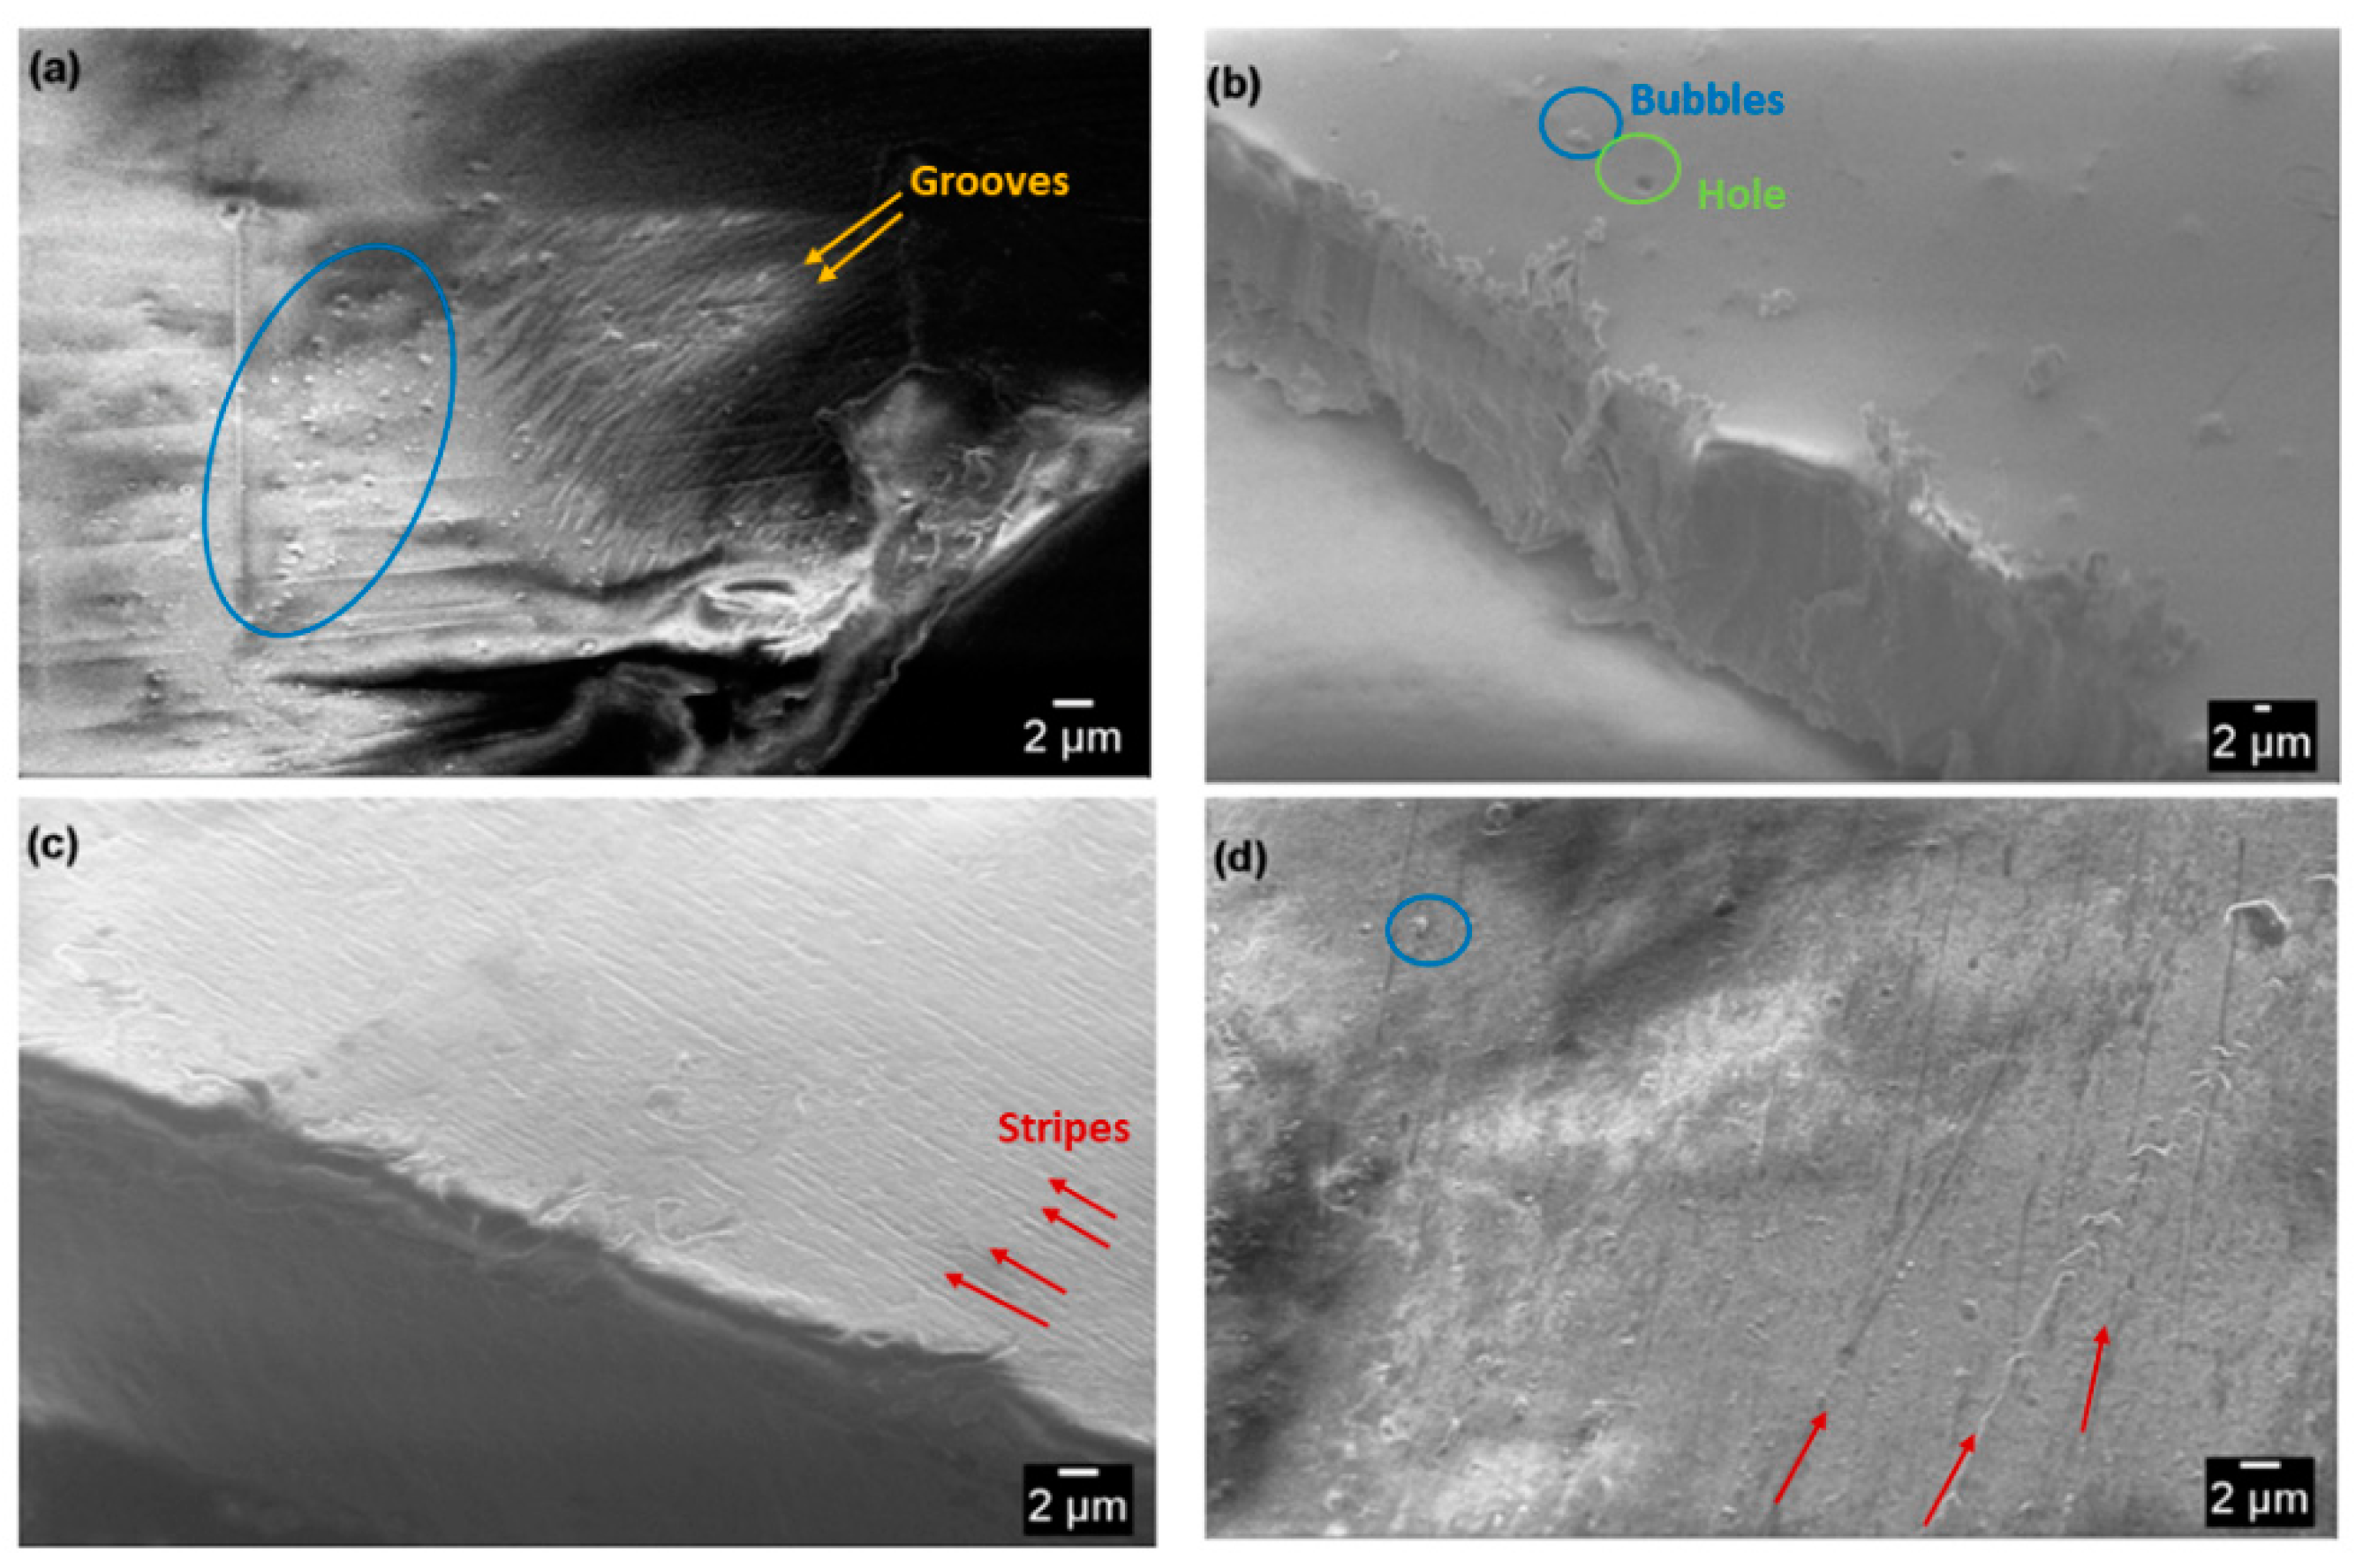
The surface morphology of single layer bioplastics was investigated by means of FE-SEM: the corresponding images collected at low magnification (5K×) are shown in Figure 2. From the SEM images, it is possible to observe that the morphological properties of the bioplastics are different. The grooves, stripes, and bubbles observed on the surfaces of the bioplastics were highlighted in the image using arrows and circles. PLA (Figure 2a) presents a surface with bubbles showing on top. The grooves seen on the right part of the image were probably due to the cutting process done by scissors, as they are absent on the left side. CE shows (Figure 2b) a smoother surface compared to the others thanks to the PVdC layer that covers both sides of the CE sheet to obtain superior humidity resistance but bubbles and holes can be observed on the surface. PBS (Figure 2c) is a soft material, and some stripes are seen on the surface due to the lamination process. PBAT (Figure 2d) shows a rougher surface with rounded particles; irregularities on the surface are sometimes aligned on a line, as seen on the right side of the image.
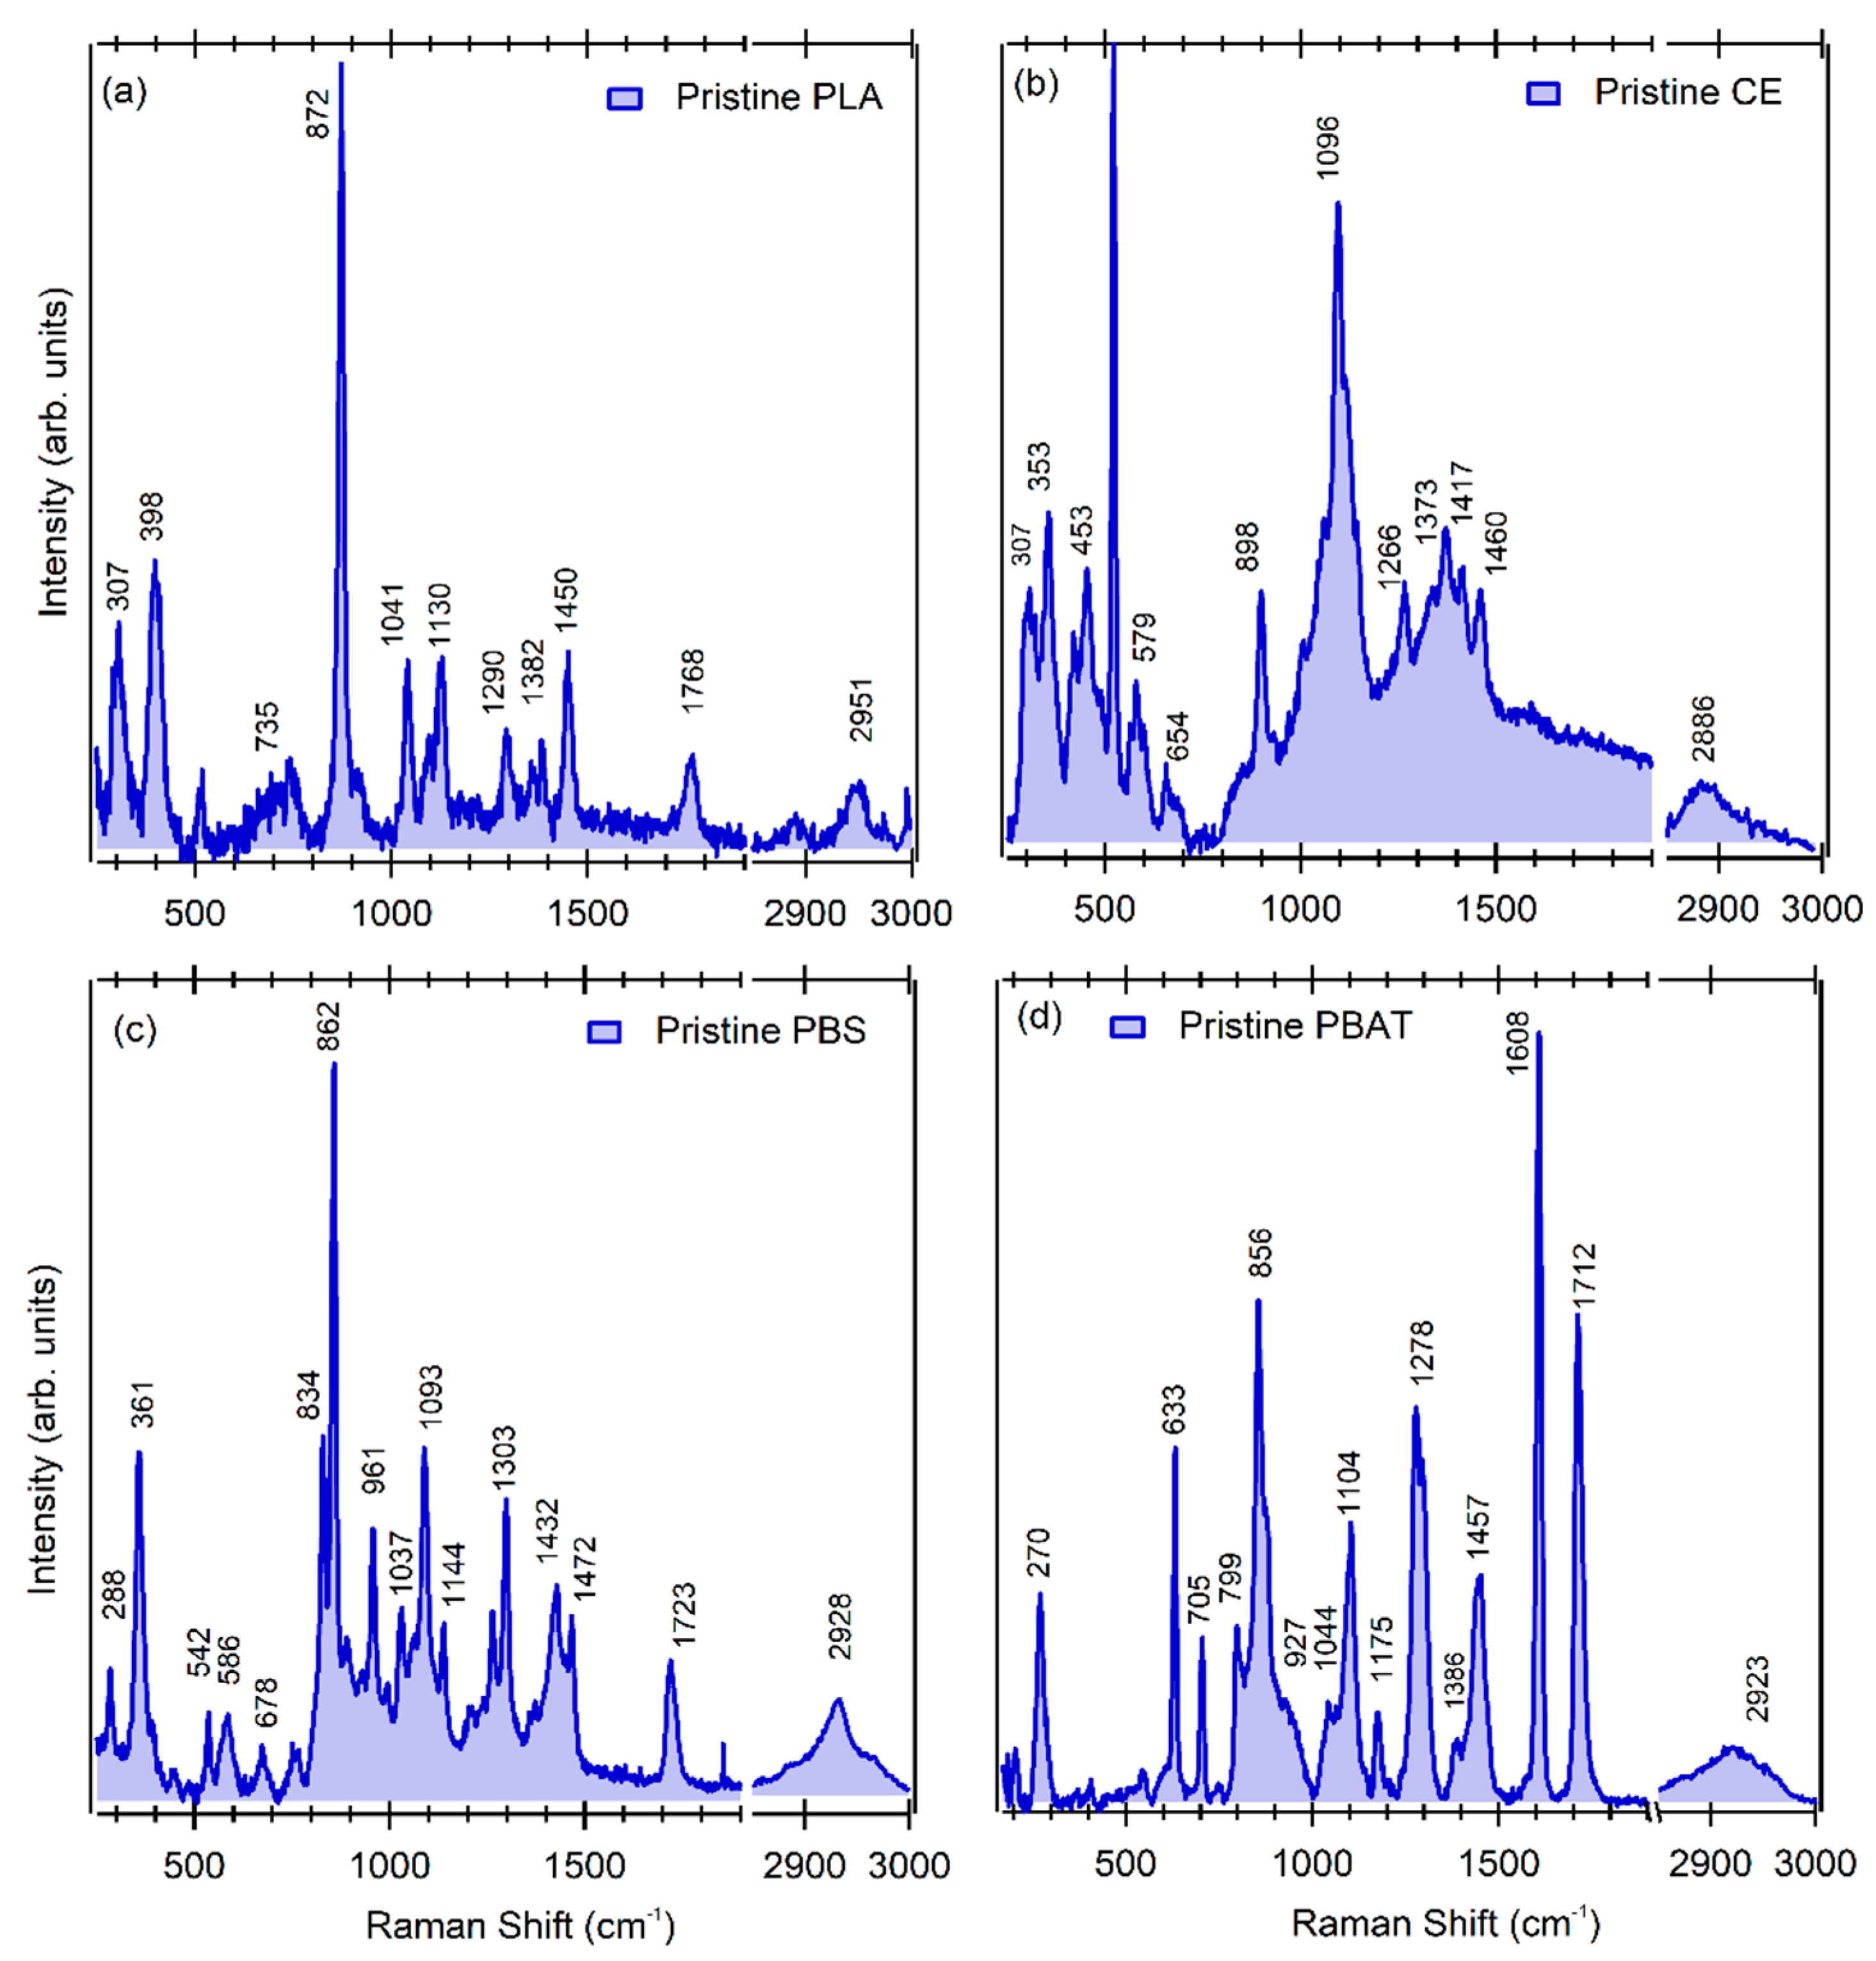
In the Raman spectra of the different bioplastics (Figure 3) all the main vibration modes are expected in the spectral range from 250 to 3000 cm−1 [30,41]. Due to the different chemical structures, the value of the peak position is not the same for all the materials because chemical bonds involved in the polymeric structure are different, as evidenced by the chemical structures of the single bioplastics reported in Figure 4. As a matter of fact, in the Raman spectra of the pristine bioplastics already studied in the literature, the peak positions attributed to specific functional groups were slightly shifted for the different bioplastics [42]. Table 2 reports the band assignments with the approximate wavenumber of the vibrational modes observed in the Raman spectra.
For PLA, we observed two peaks at 307 and 398 cm−1 ascribed to bending vibrations along the carbon-carbon and oxygen backbones [43]. At higher wavenumber, the peaks at 735 cm−1 and 872 cm−1 were ascribed to the weak carbonyl group C=O [20,43] and the ester (C-COO) stretching bands [44] of the polylactic acid, respectively. The asymmetric and symmetric bending vibrations of methyl group CH3 were observed around 1130 cm−1 and 1382 cm−1, respectively, and the peak at 1450 cm−1 was associated with asymmetric C–H bending vibration [20]. Lastly, the peak at 1768 cm−1 was associated with the strong carbonyl stretching mode C=O [20] and the peak at 2951 cm−1 was associated with the C–H stretching mode [45]. In the Raman spectra of the pristine CE in Figure 3b, the peak at 2886 cm−1 and 1096 cm−1 ascribed to C–H vibrations and the asymmetric stretching of C–O–C glycosidic linkage typical of CE [45] were observed. In addition, the pyranose ring signal, in which the five carbon atoms are nearly co-planar, and the right angle between the bonds of the oxygen ring [46] were observed at 1096 cm−1, and the band associated with the C–OH bonds of the rings was observed at 1266 cm−1. The characteristic signal of the acetyl group (CH3CO) observed at 1460 cm−1 was ascribed to the asymmetric and symmetric vibrations of the CH bond present in the acetyl groups. The peak at 1733 cm−1 ascribed to strong carbonyl stretching mode (C=O) of the acetyl group was not observed in the spectra. The peak at 353 cm−1 was ascribed to the bending vibration mode of CE skeletal deformation [47,48]. In the Raman spectra of the pristine PBS (Figure 3c), at 834 and 862 cm−1 the carbonyl stretching mode C=O and at 288 cm−1 the bending vibrations along the carbon, carbon, and oxygen backbone vibration, were observed. The peak at 961 cm−1 corresponded to the C–OH bending in the carboxylic acid groups of the PBS. The peak around 1037 cm−1 was due to O–C–C stretching vibrations, and the peaks in the range of 1144–1260 cm−1 resulted from the stretching of the C–O–C group in the ester linkages of PBS. The peak at the 1723 cm−1 region was attributed to the ester carbonyl group (C=O) stretching vibrations. Meanwhile, the peaks at 1303 and 2928 cm−1 were assigned to the symmetric and asymmetric deformational vibrations of the methylene groups (CH2) in the PBS main chains, respectively [49]. The Raman spectra of the PBAT in Figure 3d were similar to the ones reported in the literature by Cai et al. [42]. The peak at 1712 cm−1 was assigned to the carbonyl stretching mode and the methylene and methyl vibrations for the peaks at about 2800–3000 cm−1. At 1457 cm−1 the methylene group (CH2) in-plane bending mode appeared, and the contribution of the benzene ring appeared at 1278, 1104, and 856 cm−1 [39]. In particular, the peaks at 1278 and 1104 cm−1 were ascribed to the stretching mode of C–O connected to the benzene rings, while the peak at 856 cm−1 was ascribed to the out-plane bending mode of the =C–H in the benzene ring [39].
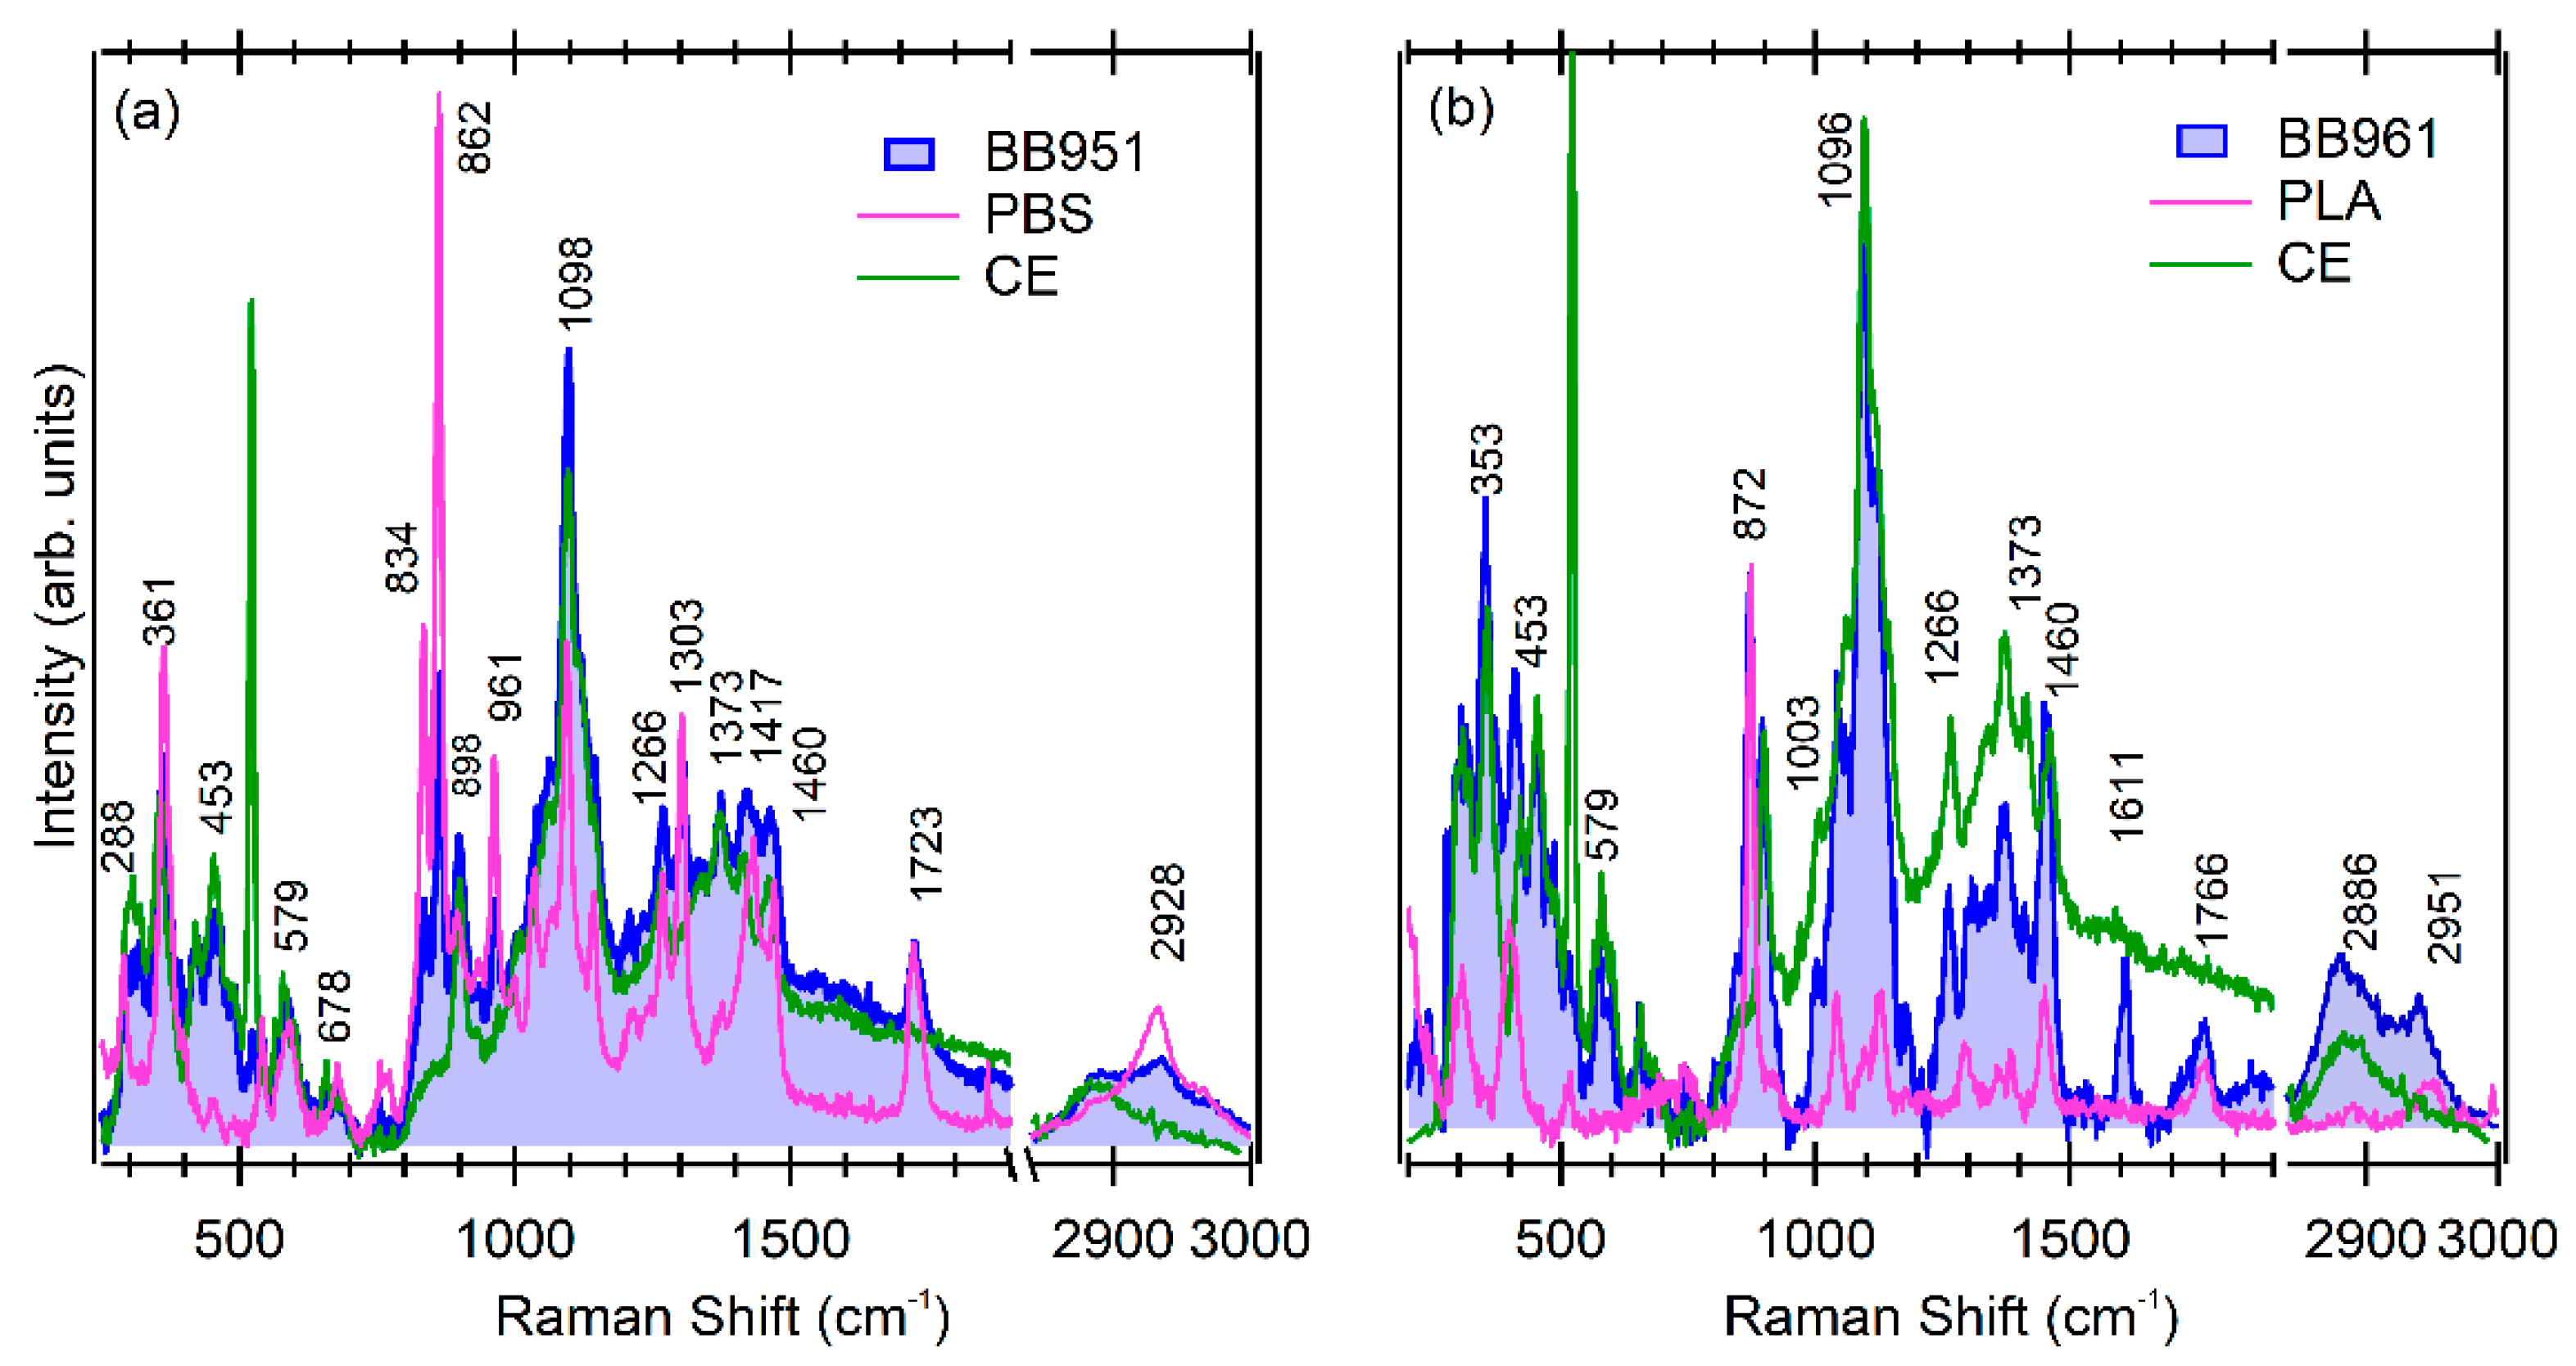
The Raman spectra of the two composite bioplastics BB951 (CE/PBS) and BB961 (CE/PLA) are shown in Figure 5. Each spectrum was obtained with the contribution of both layers, since the polymers are transparent at 785 nm. In the Raman spectra of BB951, the peaks ascribed to PBS and CE (Figure 5a) were observed. The contributions of CE were at 453, 1373, and 2886 cm−1, while the contributions of PBS were at 834, 862, 1723, and 2928 cm−1. In the Raman spectra of BB961, it was possible to distinguish some contributions ascribed to the CE (353, 453, 579, 898, and 2886 cm−1) and PLA (398, 872, and 2951 cm−1) already discussed. An additional peak at 1611 cm−1 was observed that did not pertain to either CE or PLA. A peak in this region is ascribed to either stretching of a benzene ring or NH bend, thus it could have been due to the glue [50] used to attach the two sheets, which was a compostable aqueous dispersion of a polyester polyurethane elastomer.
3.2. Bioplastics Exposed to Water Treatment
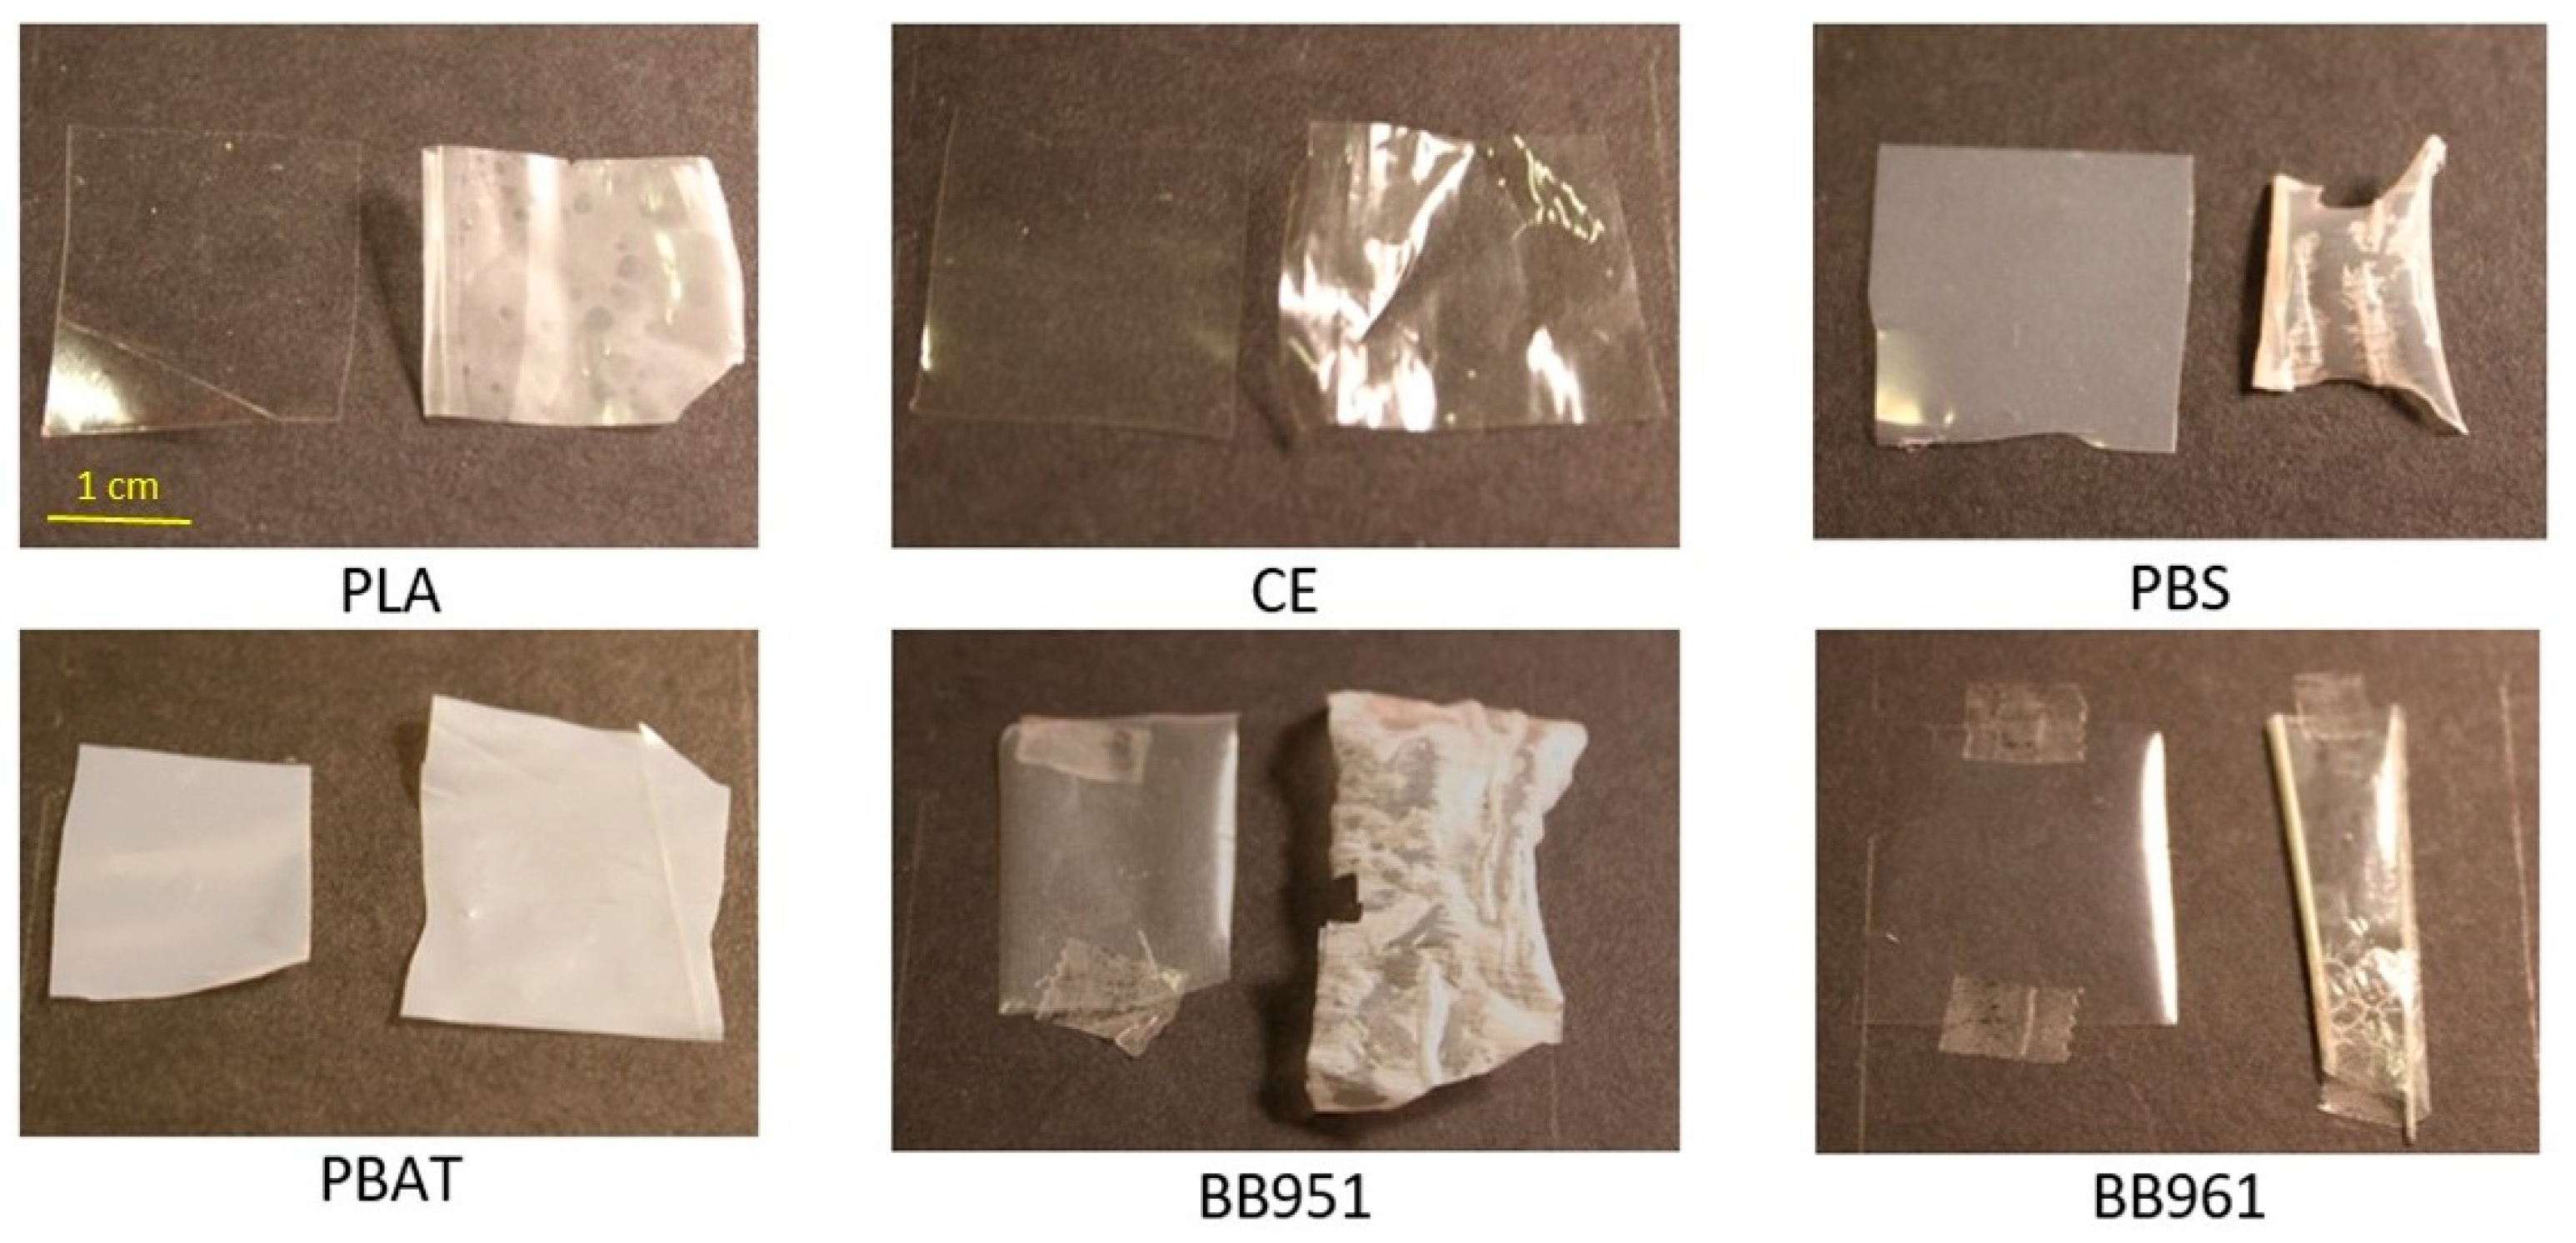
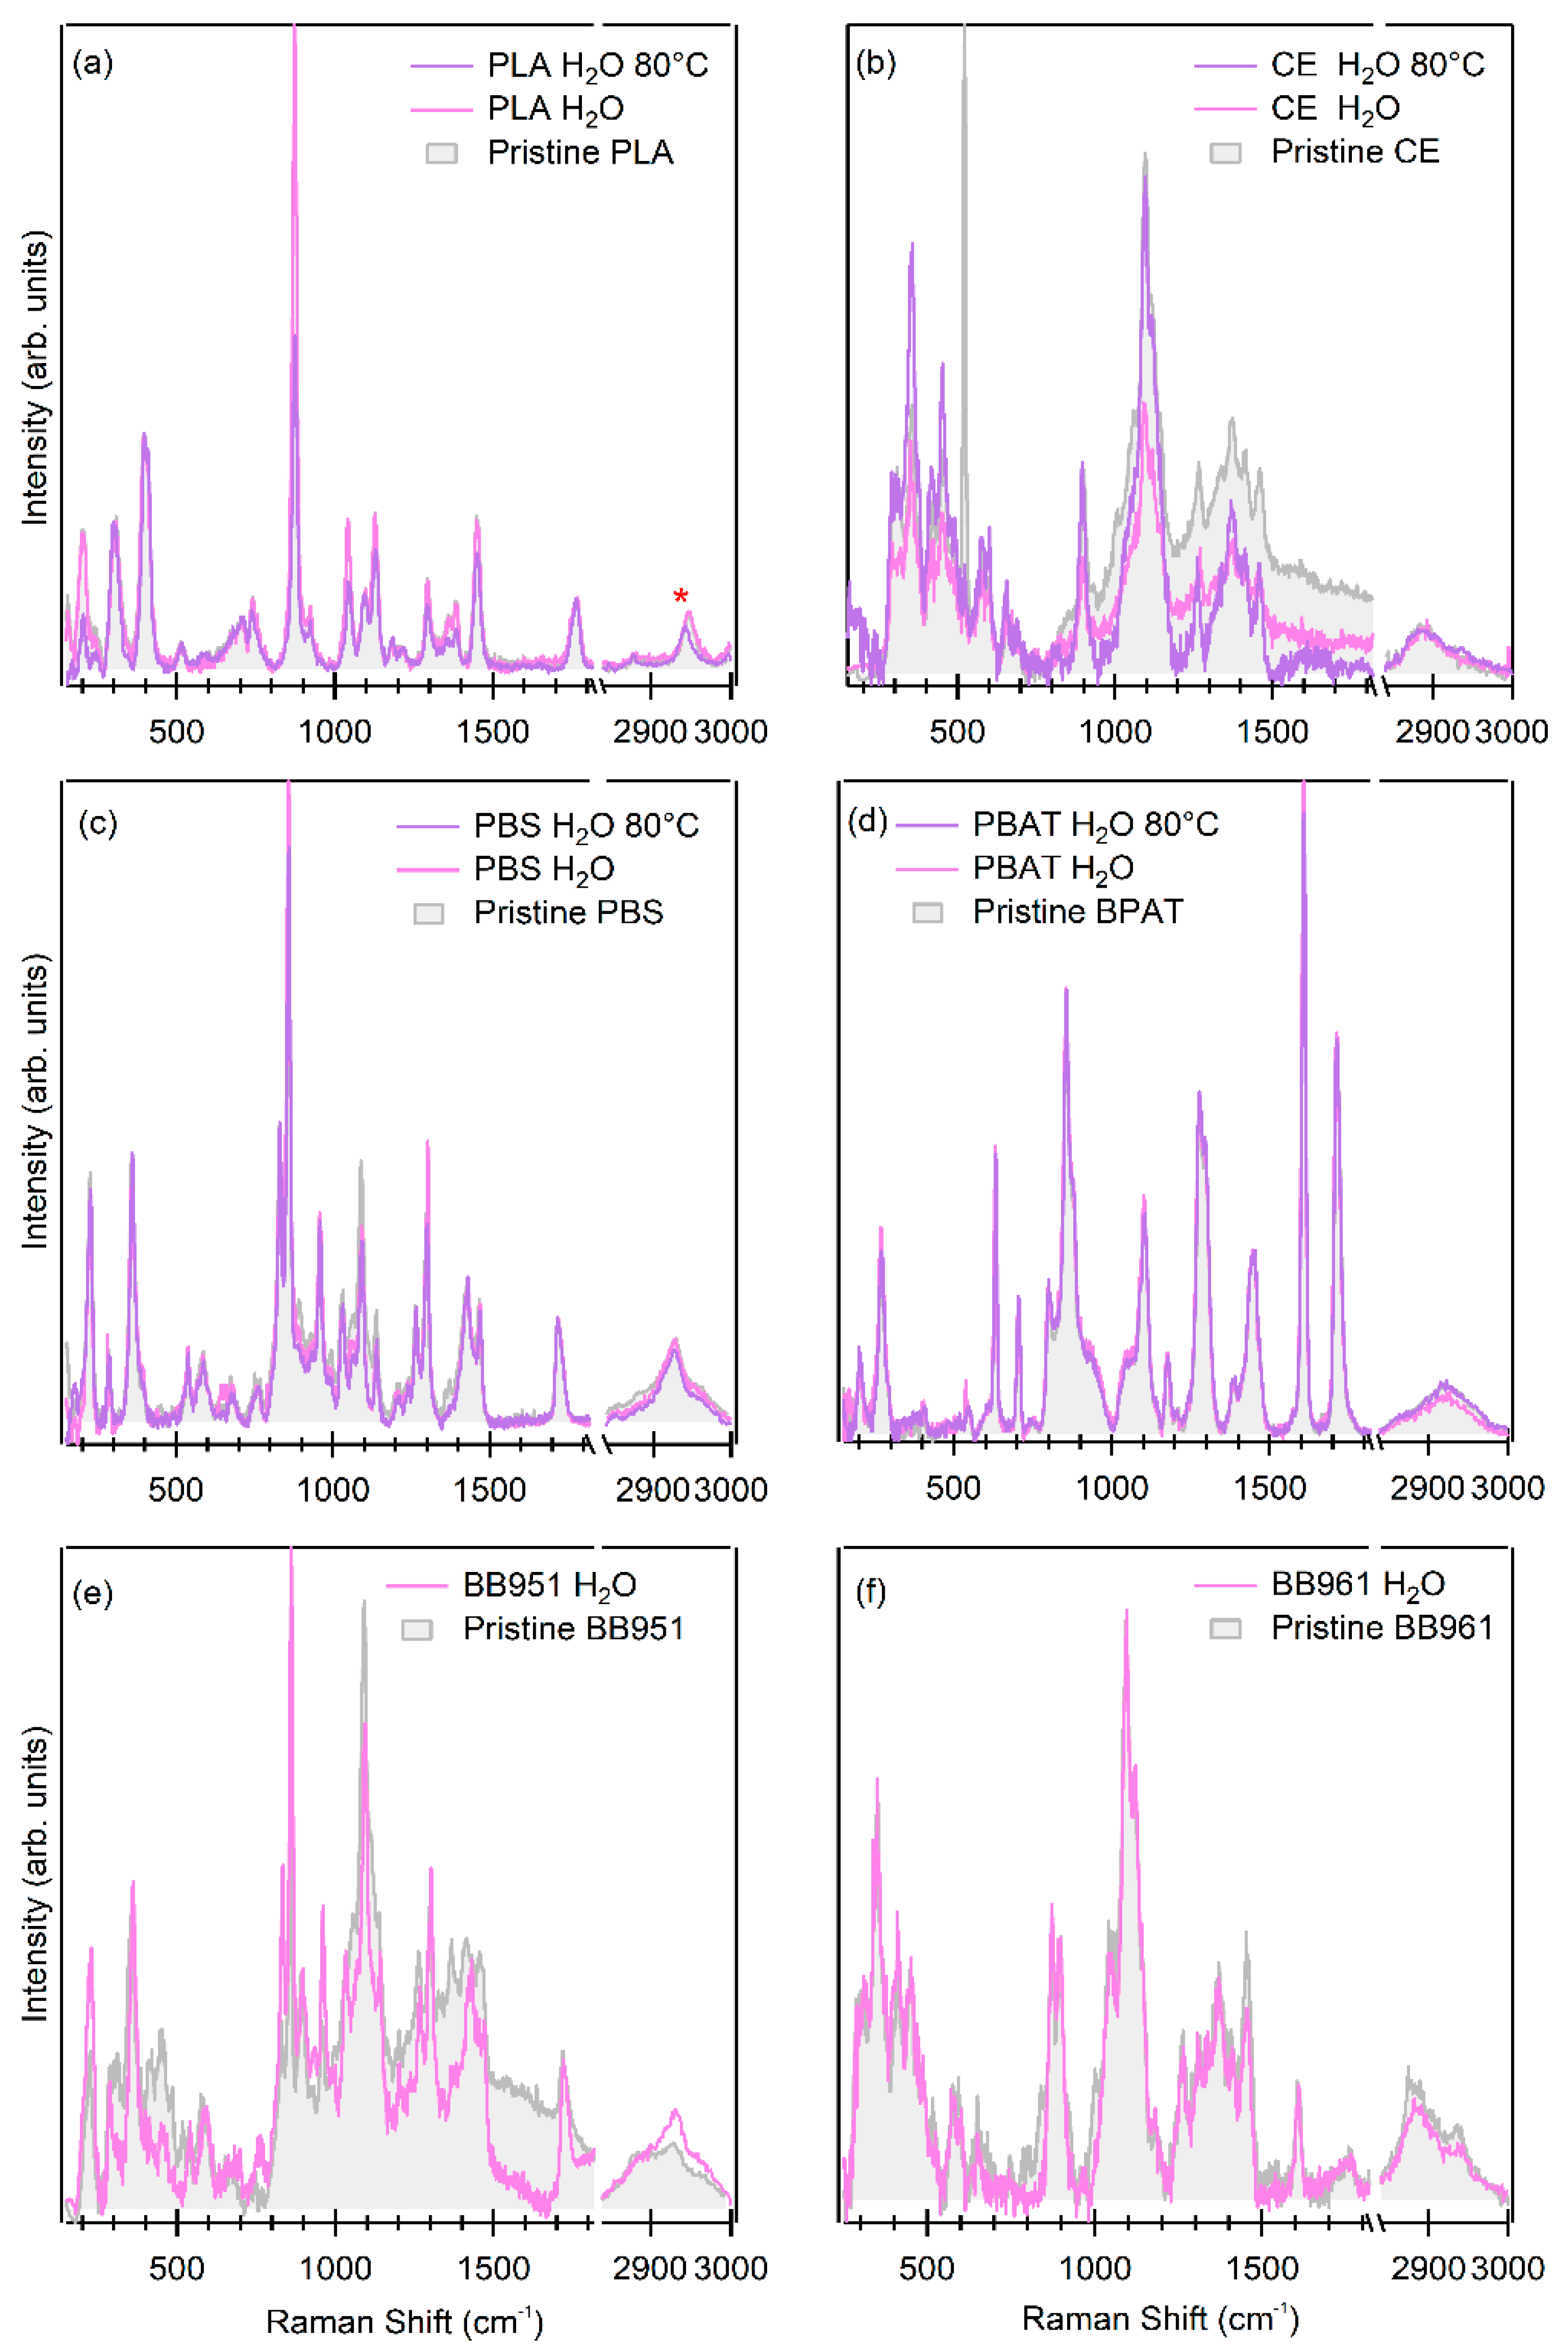
All the packaging films were tested by keeping them immersed in MilliQ water for 12 h at RT or at 80 °C for 3 h. Water treatment at high temperatures was chosen because some materials, especially double PBS-CE (BB951), are used for slow cooking in a vacuum. After naturally drying the films, the Raman spectra were measured to verify whether the vibrational fingerprint of the polymers had changed. The structural information given by RS (Figure 6 and Figure 7) was helpful for understanding polymers’ degradation and was accompanied by a simple visual inspection of the treated films. In the set of bioplastics exposed to MilliQ water at RT for 12 h, visible modifications on the surfaces of the single-layer and composite polymers were not observed. However, after water treatment at 80 °C for 3 h, some effects could be appreciated (Figure 1) from less important ones, such as the loss of transparency of the polymer sheet (PLA), or the wrinkling of the material (CE and PBAT), to more important ones, such as the appearance of entirely non-transparent areas in the PBS and the different shrinking of the two sheets of material in the bi-components (BB951 and BB961). Among the bioplastics, BB951 appears in the picture as the most damaged material after exposure to MilliQ water at 80 °C. The two layers of BB951 behaved differently with the water treatment, as can also be observed in the optical microscope images: the PBS appears more wrinkled than the CE, in agreement with the improved performance of the cellulose as a humidity barrier (Appendix B, Figure A2). The different resistances to shrinkage of PBS and CE explain the mechanical behavior of the composite, and the areas of different colors. At the same time, some wrinkling was also observable in BB961 but it was evident only in the lower side of the cutting in Figure 1.
The Raman measurements of the treatment performed at RT are shown in Figure 6. To compare the measurements acquired after different water treatments, all the spectra were normalized at the carbonyl stretching mode C=O vibration, a sharp and single peak. For the CE spectra, the normalization was performed with the peak ascribed to CH stretching mode (2886 cm−1) because the C=O peak is not present. The Raman spectra of the materials exposed to MilliQ water at RT did not change significantly with respect to the spectra of the pristine materials, in agreement with what can be seen by the naked eye, meaning that the properties of the polymers were preserved (Figure 6, grey and pink line). Only a decrease in the relative intensity was observed in the CE spectra for 1266 cm−1 (C–OH bonds), and for 1417 cm−1 and 1460 cm−1 (CH3CO) in Figure 6b.
In the composite materials, for BB951 a decrease in the relative intensity of the peaks ascribed to CE at about 307 cm−1 and in the region from 420 to 520 cm−1 was observed (Figure 6e,f, grey and pink line) and the peak ascribed to the C–H stretching mode at 2928 cm−1 showed increased relative intensity. For BB961, a decrease in the relative intensity of the peak at 2886 cm−1, ascribed to CH stretching modes, was observed.
After water treatment at 80 °C for 3 h (Figure 6, violet line) several changes in the single layer bioplastics were observed. For PLA, it was possible to observe a shift toward a lower wavelength of about 6 cm−1 of the peak at 2948 cm−1. In this case, the shift suggests a modification in the stretching mode of the C–H group. For CE, a reduction of the relative intensity at 1266 cm−1 (C–OH bonds), 1417 cm−1, and 1460 cm−1 (CH3CO) was observed, while for the single layer of PBAT, no modifications induced by exposure of the materials to water were observed. This means that no substantial modification happened in the polymeric structure of PBAT. Likewise, for PBS, no spectral changes were observed, even in different areas (wrinkled and regular). This agrees with the previous work, where FTIR was used to test long-term degradation; a slight decrease in the relative intensity of the peaks was reported after 60 days at 80 °C [25], but no modification was reported after a few hours.
For the composite films exposed to MilliQ water at 80 °C for 3 h, Raman measurements were conducted on different points of the samples (Figure 7) to take into account the dis-homogeneity observed in Figure 1. The Raman spectra acquired in the part of the BB951 with different transparency—the defined white and transparent zones—support this evidence (Figure 7a). The differences in the spectra were located at about 225, 353, 453, 834, 862, 898, 1037, 1144, 1207, 1298, 1373, and 2928 cm−1. Some of those peaks, such as those at 225, 353, 830, 1037, 1144, 1373, and 2928 cm−1 signified an increase in the relative intensity (yellow triangle) in the spectra acquired in the transparent zone compared to the white zone. In this zone, some peaks at 453 cm−1 ascribed to the C=O bending mode, the peak at 896 ascribed to CE, the peak at 1373 cm−1 ascribed to the C–H bending mode, and the peak at 2886 cm−1 ascribed to the C–H stretching mode did not appear (red rhombus). but the peak at 1207 cm−1 probably ascribed to C–C aliphatic chains appeared only in the white zone, while being absent in the transparent zone. The green bars in Figure 7a highlight the main difference of the treated BB951 with respect to the pristine BB951.
From the picture of BB961 exposed to MilliQ water at 80 °C (Figure 1), a flat surface with some scratches on one side of the sample was observed. The Raman spectra acquired in both zones of the sample—the intact and wrinkled zones—were compared with the spectra of the pristine BB961 (Figure 7b). In the Raman spectra of the wrinkled zone, the peak at 2886 cm−1 ascribed to the CH stretching mode did not appear (red rhombus), but the peak intensities changed in the same way for both zones as with the pristine BB961. However, reductions in the peaks’ relative intensities at 353, 898, 1093, and 2886 cm−1 were observed.
Table 3 summarizes all the changes observed by visual inspection and by RS after the water treatment at 80 °C. Among the single-layer plastics treated at 80 °C in water, the loss of transparency of PLA was connected to peak shift in the stretching mode of the C–H group, while in CE the wrinkling was due to modifications of C–OH bonds and of the acetyl group CH3CO. The raman spectra acquired in different areas showed that the vibrations of BB951 (CE/PBS) were generally maintained in the transparent areas, while in the white areas some peaks of the CE were lost. For BB961 (CE/PLA) the modification observed was less severe with respect to BB951. This suggests that RS helps in establishing the specific chemical bond that is modified, making it very helpful to understand the changes that occur to bioplastics after stress treatment in water.
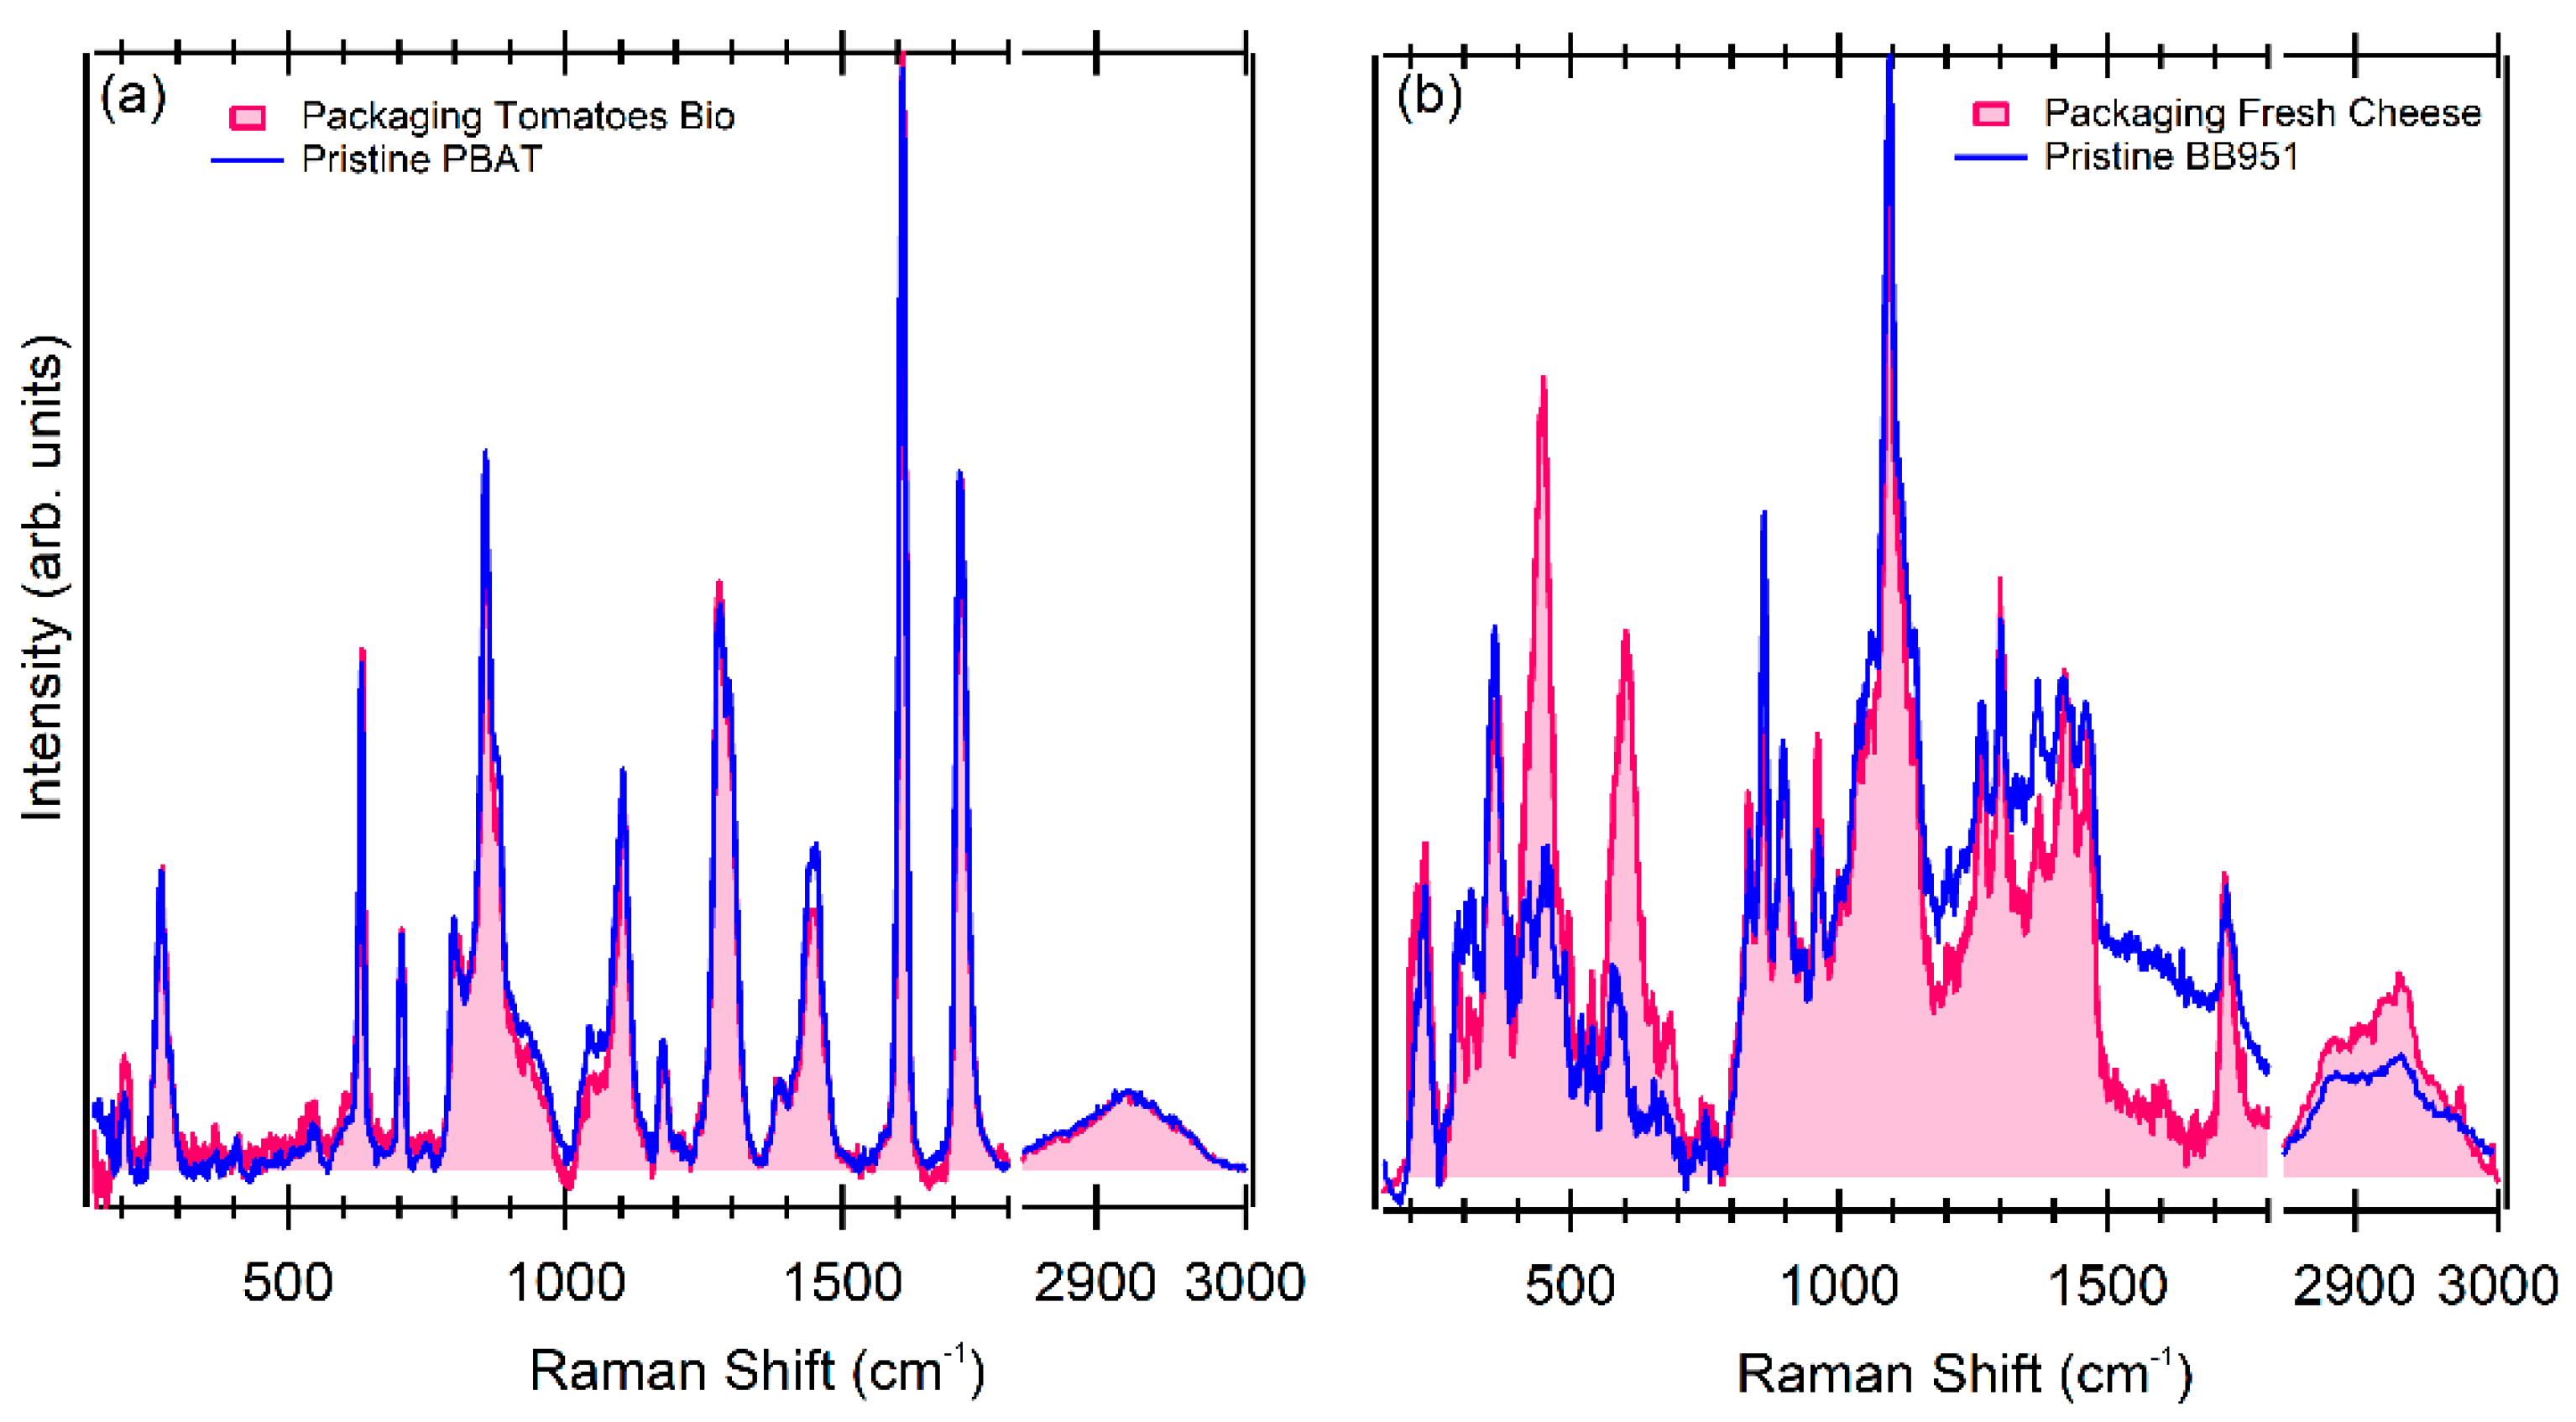
3.3. Test on Unknown Packagings
The unknown packaging materials from the food chain were tested and compared against the database acquired in this work to determine their structure and to identify them: this work used compostable packaging available from a supermarket. In particular, white packaging for fresh cheese and transparent packaging for bio tomatoes was used. By comparing those two spectra with the spectra of the bioplastics presented in this work, it was possible to deduce that the packaging of the vegetable was PBAT, while the packaging of the fresh cheese was BB951, both of them being biodegradable (Figure 8). The only difference was visible in the packaging of the fresh cheese: the peaks at 449 and 603 cm−1 were ascribed to the rutile vibrations of TiO2, which gives the packaging its white color and could be also used as a bactericide [51,52].
4. Conclusions
In this work, Raman spectroscopy (RS) was applied to characterize new composite bioplastics, investigate the modifications that occurred to biobased plastics after stress tests in water, and completely identify unknown polymers from the food chain and compare them against the database acquired. The characteristic spectra of single-layer and composite layer bioplastics were acquired and compared with spectra acquired from treated samples. The main findings of this work are:
- Room temperature exposure to water produced little effect on the characteristic vibrations of polymers, while treatment in water at 80 °C affected the bioplastics in a way that depended on the type of polymer and was more severe in the case of composite layers.
- Among single-layer plastics treated in water at 80 °C, the loss of transparency of PLA was connected to the peak shift in the stretching mode of the C–H group, while in CE the wrinkling was due to modifications of the C–OH bonds and of the acetyl group CH3CO.
- The composite sheets were the ones which were affected mainly by 80 °C treatment in water, with changes in the morphology. In these cases, we used Raman spectroscopy in different areas to map the occurring modifications. Those measurements showed that the vibrations of BB951 (CE/PBS) were generally maintained in the transparent areas, except for the C–C aliphatic vibration, while in the white areas some peaks of CE were lost (C=O bending mode, C–H bending, and stretching mode). For BB961 (CE/PLA), the modification observed was less severe with respect to BB951; in this case, the modification observed involved the C–H stretching mode of CE and a decrease of the peak relative intensity for the contribution ascribed to CE (peak at 353 and 1371 cm−1).
- To verify that a complete identification of unknown polymers is achievable, unknown packaging materials from the food chain were compared against the spectra database. This result suggests that the vegetable packaging was PBAT while the packaging for the fresh cheese was BB951 with the addition of rutile TiO2 for its white color.
In conclusion, this work set the basis for developing portable characterization techniques that allow direct, in situ characterization of packaging materials in the industrial environment to support tests intended to verify whether a specific material is adequate to be used in food packaging.
Author Contributions
Conceptualization, C.B. and G.A.; investigation, G.A. and C.B.; validation G.A.; writing—original draft preparation, G.A. and C.B; writing—review and editing, G.A., C.B. and G.F.; resources, S.T., C.B. and G.F.; funding acquisition: C.B. All authors have read and agreed to the published version of the manuscript.
Funding
This work was supported by the sPATIALS3 project financed by (ERDF ROP) 2014–2020—FESR Regione Lombardia—Axis I: “Strengthen technological research, development and innovation (RD&I)”—Action 1.b.1.3: “Support for co-operative R&D activities to develop new sustainable technologies, products and services”—Call Hub.
Institutional Review Board Statement
Not applicable.
Informed Consent Statement
Not applicable.
Data Availability Statement
Data sharing is not applicable for this article.
Acknowledgments
The authors are grateful to M. Serpelloni of the University of Brescia for the resources used in the optical image collection.
Conflicts of Interest
The authors declare no conflict of interest.
Appendix A
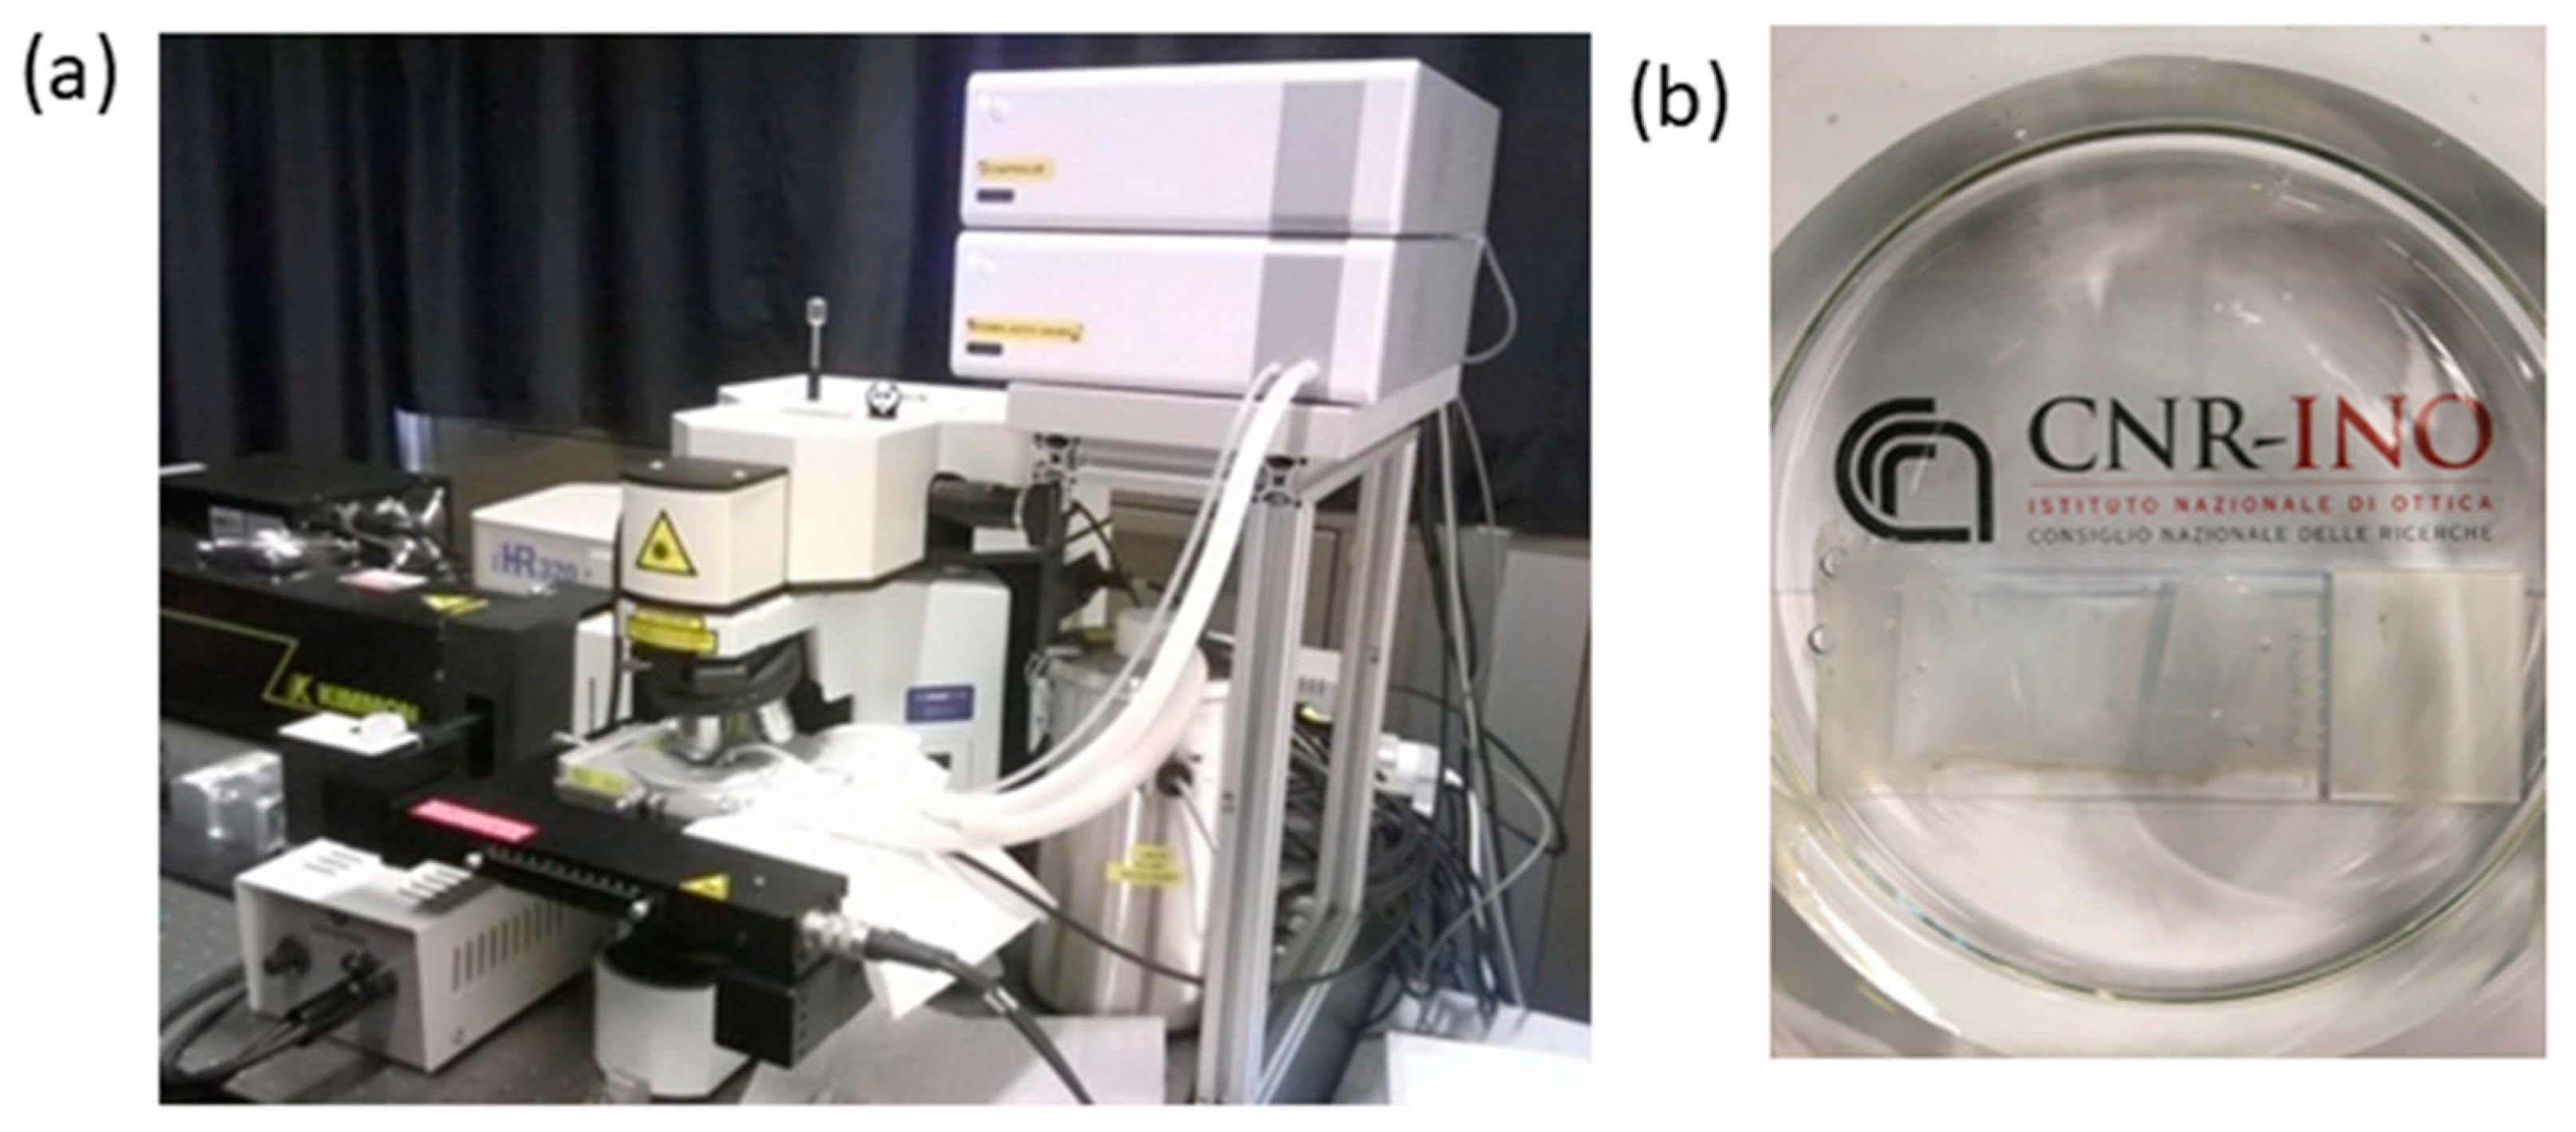
This appendix reports images of the Raman setup used to perform all the measurements presented in the main text and a picture of one sample exposed to MilliQ water for 12 h at RT. The polymer sample was mounted on a glass slide for handling.
Figure A1.
(a) Raman setup employed to perform the Raman measurements and (b) beaker used to expose the bioplastic to MilliQ water for 12 h at RT.
Figure A1.
(a) Raman setup employed to perform the Raman measurements and (b) beaker used to expose the bioplastic to MilliQ water for 12 h at RT.

Appendix B
The images were carried out using an optical microscope (Figure A1) on both sides of the bilayer BB951 made of PBS and CE, which revealed inhomogeneity in the color of the material. This inhomogeneity was more pronounced in the top layer, which is connected with the PBS contribution. The bottom layer shows less inhomogeneity since CE is resistant to water treatment.
Figure A2.
Optical images acquired of BB951 exposed to water at 80 °C for 3 h. The images appear dark because the polymers were attached with glue to flatten them.
Figure A2.
Optical images acquired of BB951 exposed to water at 80 °C for 3 h. The images appear dark because the polymers were attached with glue to flatten them.

Appendix C
The following table includes the list of abbreviations reported in the main text.

Table A1.
List of abbreviations reported in the main text.
| Abbreviation | Long Name |
|---|---|
| CE | Cellulose ester |
| EC | European Commission |
| FE-SEM | Field Emission Scanning Electron Microscopy |
| FTIR | Fourier-transform infrared spectroscopy |
| MAP | Modified Atmosphere Packaging |
| PBAT | Poly-butylene adipate-co-terephthalate |
| PBS | Poly-butylene succinate |
| PLA | Poly-lactic acid |
| PVdC | Polyvinylidene Chloride |
| RS | Raman Spectroscopy |
| BB951 | Composite material coupling CE and PBS |
| BB961 | Composite material coupling CE and PLA |
References
- Chu, J.; Liu, H.; Salvo, A. Air pollution as a determinant of food delivery and related plastic waste. Nat. Hum. Behav. 2021, 5, 212–220. [Google Scholar] [CrossRef] [PubMed]
- The Environmental Impact of Food Packaging. Available online: https://foodprint.org/issues/the-environmental-impact-of-food-packaging/ (accessed on 26 October 2021).
- Rizwana Beevi, K.; Sameera Fathima, A.R.; Thahira Fathima, A.I.; Thameemunisa, N.; Noorjahan, C.M.; Deepika, T. Bioplastic synthesis using banana peels and potato starch and characterization. Int. J. Sci. Technol. Res. 2020, 9, 1809–1814. [Google Scholar]
- Di Lorenzo, M.L.; Longo, A.; Androsch, R. Polymer Blends. Materials 2019, 12, 2833. [Google Scholar] [CrossRef] [PubMed] [Green Version]
- Rhodes, C.J. Plastic pollution and potential solutions. Sci. Prog. 2018, 101, 207–260. [Google Scholar] [CrossRef] [PubMed]
- Thushari, G.G.N.; Senevirathna, J.D.M. Plastic pollution in the marine environment. Heliyon 2020, 6, e04709. [Google Scholar] [CrossRef] [PubMed]
- Andrady, A.L. The plastic in microplastics: A review. Mar. Pollut. Bull. 2017, 119, 12–22. [Google Scholar] [CrossRef] [PubMed]
- Banerjee, A.; Shelver, W.L. Micro- and nanoplastic induced cellular toxicity in mammals: A review. Sci. Total Environ. 2021, 755, 142518. [Google Scholar] [CrossRef] [PubMed]
- Winterstetter, A.; Grodent, M.; Kini, V.; Ragaert, K.; Vrancken, K.C. A review of technological solutions to prevent or reduce marine plastic litter in developing countries. Sustainability 2021, 13, 4894. [Google Scholar] [CrossRef]
- D’Ambrières, W. Plastics recycling worldwide: Current overview and desirable changes. F. Actions Sci. Rep. J. F. Actions 2019, 19, 12–21. [Google Scholar]
- Hopewell, J.; Dvorak, R.; Kosior, E. Plastics recycling: Challenges and opportunities. Philos. Trans. R. Soc. B Biol. Sci. 2009, 364, 2115–2126. [Google Scholar] [CrossRef] [Green Version]
- EU Action to Tackle the Issue of Plastic Waste. Available online: https://www.eca.europa.eu/Lists/ECADocuments/RW20_04/RW_Plastic_waste_EN.pdf (accessed on 26 October 2021).
- Rai, P.; Mehrotra, S.; Priya, S.; Gnansounou, E.; Sharma, S.K. Recent advances in the sustainable design and applications of biodegradable polymers. Bioresour. Technol. 2021, 325, 124739. [Google Scholar] [CrossRef] [PubMed]
- Hahladakis, J.N.; Iacovidou, E.; Gerassimidou, S. Plastic Waste in a Circular Economy; Elsevier Inc.: Amsterdam, The Netherlands, 2020; ISBN 9780128178805. [Google Scholar]
- European Bioplastics. Available online: https://www.european-bioplastics.org/bioplastics/waste-management/ (accessed on 26 October 2021).
- Fabra, M.J.; López-Rubio, A.; Lagaron, J.M. Biopolymers for Food Packaging Applications; Institute of Agrochemistry and Food Technology: Valencia, Spain, 2014; ISBN 9780857096951.
- Peelman, N.; Ragaert, P.; De Meulenaer, B.; Adons, D.; Peeters, R.; Cardon, L.; Van Impe, F.; Devlieghere, F. Application of bioplastics for food packaging. Trends Food Sci. Technol. 2013, 32, 128–141. [Google Scholar] [CrossRef] [Green Version]
- Ivankovic, A.; Zeljko, K.; Talic, S.; Bevanda, A.M.; Lasic, M. Biodegradable packaging in the food industry. J. Food Saf. Food Qual. 2017, 68, 23–52. [Google Scholar] [CrossRef]
- RameshKumar, S.; Shaiju, P.; O’Connor, K.E.; P, R.B. Bio-based and biodegradable polymers—State-of-the-art, challenges and emerging trends. Curr. Opin. Green Sustain. Chem. 2020, 21, 75–81. [Google Scholar] [CrossRef]
- Łopusiewicz, Ł.; Jedra, F.; Mizieińska, M. New poly(lactic acid) active packaging composite films incorporated with fungal melanin. Polymers 2018, 10, 386. [Google Scholar] [CrossRef] [Green Version]
- Mostafa, N.A.; Farag, A.A.; Abo-dief, H.M.; Tayeb, A.M. Production of biodegradable plastic from agricultural wastes. Arab. J. Chem. 2018, 11, 546–553. [Google Scholar] [CrossRef] [Green Version]
- Suryanegara, L.; Fatriasari, W.; Zulfiana, D.; Anita, S.H.; Masruchin, N.; Gutari, S.; Kemala, T. Novel antimicrobial bioplastic based on PLA-chitosan by addition of TiO2 and ZnO. J. Environ. Health Sci. Eng. 2021, 19, 415–425. [Google Scholar] [CrossRef] [PubMed]
- Sudhakar, M.P.; Magesh Peter, D.; Dharani, G. Studies on the development and characterization of bioplastic film from the red seaweed (Kappaphycus alvarezii). Environ. Sci. Pollut. Res. 2021, 28, 33899–33913. [Google Scholar] [CrossRef]
- Gowman, A.; Wang, T.; Rodriguez-Uribe, A.; Mohanty, A.K.; Misra, M. Bio-poly(butylene succinate) and Its Composites with Grape Pomace: Mechanical Performance and Thermal Properties. ACS Omega 2018, 3, 15205–15216. [Google Scholar] [CrossRef] [Green Version]
- Phua, Y.J.; Chow, W.S.; Mohd Ishak, Z.A. The hydrolytic effect of moisture and hygrothermal aging on poly(butylene succinate)/organo-montmorillonite nanocomposites. Polym. Degrad. Stab. 2011, 96, 1194–1203. [Google Scholar] [CrossRef]
- Vasylieva, A.; Doroshenko, I.; Vaskivskyi, Y.; Chernolevska, Y.; Pogorelov, V. FTIR study of condensed water structure. J. Mol. Struct. 2018, 1167, 232–238. [Google Scholar] [CrossRef]
- Edwards, H.G.M.; Johnson, A.F.; Lewis, I.R. Applications of Raman spectroscopy to the study of polymers and polymerization processes. J. Raman Spectrosc. 1993, 24, 475–483. [Google Scholar] [CrossRef]
- Merino, J.C.; Fernàndez, M.; Pastor, J.M. Raman Microspectroscopy of Polymeric Materials. Macromol. Symp. 2001, 168, 55–65. [Google Scholar] [CrossRef]
- Koenig, J.L. Raman Scattering of Synthetic Polymers-A Review. Appl. Spectrosc. Rev. 1971, 4, 233–305. [Google Scholar] [CrossRef]
- Araujo, C.F.; Nolasco, M.M.; Ribeiro, A.M.P.; Ribeiro-Claro, P.J.A. Identification of microplastics using Raman spectroscopy: Latest developments and future prospects. Water Res. 2018, 142, 426–440. [Google Scholar] [CrossRef]
- Rincon Lasprilla, A.J.; Rueda Martinez, G.A.; Lunelli, B.H.; Jaimes Figueroa, J.E.; Jardini, A.L.; Filho, R.M. Synthesis and characterization of poly(Lactic Acid) for use in biomedical field. Chem. Eng. Trans. 2011, 24, 985–990. [Google Scholar] [CrossRef]
- Siracusa, V.; Lotti, N.; Munari, A.; Dalla Rosa, M. Poly(butylene succinate) and poly(butylene succinate-co-adipate) for food packaging applications: Gas barrier properties after stressed treatments. Polym. Degrad. Stab. 2015, 119, 35–45. [Google Scholar] [CrossRef]
- Kang, S.; Hsu, S.L.; Stidham, H.D.; Smith, P.B.; Anne Leugers, M.; Yang, X. A spectroscopic analysis of poly(lactic acid) structure. Macromolecules 2001, 34, 4542–4548. [Google Scholar] [CrossRef]
- Tanaka, S.; Iwata, T.; Iji, M. Long/short chain mixed cellulose esters: Effects of long acyl chain structures on mechanical and thermal properties. ACS Sustain. Chem. Eng. 2017, 5, 1485–1493. [Google Scholar] [CrossRef]
- Simon, J.; Müller, H.P.; Koch, R.; Müller, V. Thermoplastic and biodegradable polymers of cellulose. Polym. Degrad. Stab. 1998, 59, 107–115. [Google Scholar] [CrossRef]
- de Matos Costa, A.R.; Crocitti, A.; Hecker de Carvalho, L.; Carroccio, S.C.; Cerruti, P.; Santagata, G. Properties of Biodegradable Films Based on Poly(butylene Succinate) (PBS) and Poly(butylene Adipate-co-Terephthalate) (PBAT) Blends. Polymers 2020, 12, 2317. [Google Scholar] [CrossRef]
- Siyamak, S.; Ibrahim, N.A.; Abdolmohammadi, S.; Wan Yunus, W.M.Z.; Rahman, M.Z.A.B. Effect of fiber esterification on fundamental properties of oil palm empty fruit bunch fiber/poly(butylene adipate-co-terephthalate) biocomposites. Int. J. Mol. Sci. 2012, 13, 1327–1346. [Google Scholar] [CrossRef] [PubMed] [Green Version]
- Jian, J.; Xiangbin, Z.; Xianbo, H. An overview on synthesis, properties and applications of poly(butylene-adipate-co-terephthalate)–PBAT. Adv. Ind. Eng. Polym. Res. 2020, 3, 19–26. [Google Scholar] [CrossRef]
- Cai, Y.; Lv, J.; Feng, J.; Liu, Y.; Wang, Z.; Zhao, M.; Shi, R. Discrimination of poly(butylenes adipate-co-terephthalate) and poly(ethylene terephthalate) with fourier transform infrared microscope and Raman spectroscope. Spectrosc. Lett. 2012, 45, 280–284. [Google Scholar] [CrossRef]
- Sous-Vide. Available online: https://www.sous-vide.cooking/ (accessed on 26 October 2021).
- Asensio-Montesinos, F.; Oliva Ramírez, M.; González-Leal, J.M.; Carrizo, D.; Anfuso, G. Characterization of plastic beach litter by Raman spectroscopy in South-western Spain. Sci. Total Environ. 2020, 744, 140890. [Google Scholar] [CrossRef]
- Cai, Y.; Lv, J.; Feng, J. Spectral Characterization of Four Kinds of Biodegradable Plastics: Poly(Lactic Acid), Poly(Butylenes Adipate-Co-Terephthalate), Poly(Hydroxybutyrate-Co-Hydroxyvalerate) and Poly(Butylenes Succinate) with FTIR and Raman Spectroscopy. J. Polym. Environ. 2013, 21, 108–114. [Google Scholar] [CrossRef]
- Smith, P.B.; Leugers, A.; Kang, S.; Hsu, S.L.; Yang, X.; Al, S.E.T. An Analysis of the Correlation between Structural Anisotropy and Dimensional Stability for Drawn Poly(lactic acid) Films. J. Appl. Polym. Sci. 2001, 82, 2497–2505. [Google Scholar] [CrossRef]
- Vano-herrera, K.; Vogt, C. Preparation and characterization of poly(lactic acid)/poly(methyl methacrylate) blend tablets for application in quantitative analysis by micro Raman spectroscopy. J. Raman Spectrosc. 2015, 46, 273–279. [Google Scholar] [CrossRef]
- Sánchez-Márquez, J.A.; Fuentes-Ramírez, R.; Cano-Rodríguez, I.; Gamiño-Arroyo, Z.; Rubio-Rosas, E.; Kenny, J.M.; Rescignano, N. Membrane made of cellulose acetate with polyacrylic acid reinforced with carbon nanotubes and its applicability for chromium removal. Int. J. Polym. Sci. 2015, 2015, 320631. [Google Scholar] [CrossRef] [Green Version]
- Singh, I. Structure of Cellulose. Nature 1944, 154, 86. [Google Scholar] [CrossRef] [Green Version]
- Zhang, K.; Feldner, A.; Fischer, S. FT Raman spectroscopic investigation of cellulose acetate. Cellulose 2011, 18, 995–1003. [Google Scholar] [CrossRef]
- Schenzel, K.; Fischer, S. NIR FT Raman spectroscopy—A rapid analytical tool for detecting the transformation of cellulose polymorphs. Cellulose 2001, 8, 49–57. [Google Scholar] [CrossRef]
- Phua, Y.J.; Chow, W.S.; Mohd Ishak, Z.A. Reactive processing of maleic anhydride-grafted poly(butylene succinate) and the compatibilizing effect on poly(butylene succinate) nanocomposites. Express Polym. Lett. 2013, 7, 340–354. [Google Scholar] [CrossRef]
- Sui, X.M.; Pinkas, I.; Wagner, H.D. A polarized micro-Raman study of necked epoxy fibers. Polymer 2021, 230, 124034. [Google Scholar] [CrossRef]
- Kabir, I.I.; Sheppard, L.R.; Shahmiri, R.; Liu, R.; Le, A.; Lu, X.; Hanaor, D.; Chen, W.F.; Koshy, P.; Sorrell, C.C. Contamination of TiO2 thin films spin coated on rutile and soda–lime–silica substrates. J. Mater. Sci. 2020, 55, 8061–8087. [Google Scholar] [CrossRef]
- Chawengkijwanich, C.; Hayata, Y. Development of TiO2 powder-coated food packaging film and its ability to inactivate Escherichia coli in vitro and in actual tests. Int. J. Food Microbiol. 2008, 123, 288–292. [Google Scholar] [CrossRef] [PubMed]
Figure 1.
Pictures of the bioplastics before (left) and after (right) exposure to MilliQ water for 3 h at 80 °C. The treatment modifies the transparency properties of the polymers, sometimes in a severe way. In the best cases (CE and PBAT), only some wrinkling is observable. For bilayer materials, a mismatch in the shrinking of the polymer sheets is also observed.

Figure 2.
SEM images for different bioplastics: (a) poly-lactic acid (PLA), (b) cellulose ester (CE), (c) poly-butylene succinate (PBS) and (d) poly-butylene adipate-co-therephtalate (PBAT). In the figure, the arrows and circles highlight the features observed in the SEM image of the single-layer bioplastic.

Figure 3.
Raman spectra of pristine bio-plastics: (a) poly-lactic acid (PLA), (b) cellulose ester (CE), (c) poly-butylene succinate (PBS) and (d) poly-butylene adipate-co-terephthalate (PBAT). All spectra were normalized to the carbonyl stretching mode C=O, except for CE, where the CH stretching mode was used.

Figure 4.
Chemical structure of the bioplastics used (a) Poly-lactic acid (PLA), (b) cellulose ester (CE), (c) poly-butylene succinate (PBS) and (d) poly-butylene adipate-co-terephthalate (PBAT).
Figure 4.
Chemical structure of the bioplastics used (a) Poly-lactic acid (PLA), (b) cellulose ester (CE), (c) poly-butylene succinate (PBS) and (d) poly-butylene adipate-co-terephthalate (PBAT).

Figure 5.
Raman spectra of the composite materials and their constituents. (a) BB951 and its constituent CE (green spectrum) and PBS (pink spectrum), (b) BB961 and its constituent CE (green spectrum) and PLA (pink spectrum). The spectra were normalized to the carbonyl stretching mode C=O.
Figure 5.
Raman spectra of the composite materials and their constituents. (a) BB951 and its constituent CE (green spectrum) and PBS (pink spectrum), (b) BB961 and its constituent CE (green spectrum) and PLA (pink spectrum). The spectra were normalized to the carbonyl stretching mode C=O.

Figure 6.
Raman spectra of the single-layer bioplastics after water treatment at RT for 12 h (pink line) and 80 °C for 3 h (violet line) compared with the pristine material (grey spectra): (a) poly-lactic acid (PLA), (b) cellulose ester (CE), (c) poly-butylene succinate (PBS), and (d) poly-butylene adipate-co-terephthalate (PBAT). Raman spectra of the composite bioplastics after the water treatment at RT for 12 h (pink line) compared with the pristine material (grey spectra): (e) BB951 and (f) BB961. All the spectra were normalized to the carbonyl stretching mode C=O, except for CE where the CH stretching mode was used.

Figure 7.
Raman spectra of the bio-components under the water treatment acquired in a different part of the sample and compared with the pristine material (grey spectra): (a) BB951 (b) BB961. The red rhombus indicates the peaks that are suppressed in the spectra of the bioplastics exposed to MilliQ water at 80 °C with respect to the spectra of the pristine material. The yellow triangle indicates an increase or decrease in the relative intensity of a certain peak in the spectra of the bioplastic exposed to MilliQ water at 80 °C with respect to the pristine material. The spectra were normalized to the carbonyl stretching mode C=O.

Figure 8.
Raman spectra of the commercial packaging (label above the Raman spectra) compared with the biopolymers used in this work: (a) pristine PBAT and (b) pristine BB951. The spectra were normalized to the carbonyl stretching mode C=O.
Figure 8.
Raman spectra of the commercial packaging (label above the Raman spectra) compared with the biopolymers used in this work: (a) pristine PBAT and (b) pristine BB951. The spectra were normalized to the carbonyl stretching mode C=O.

Table 1.
Summary of the properties and applications of the bioplastics used in this work. The list of abbreviations is reported in Appendix C with the full name of the bioplastics.
Table 1.
Summary of the properties and applications of the bioplastics used in this work. The list of abbreviations is reported in Appendix C with the full name of the bioplastics.
| Polymer | Properties | Applications |
|---|---|---|
| PLA | Biodegradable, high tensile strength, sealed low temperature, rigid refrigerated environment. | Bags, food packaging, and films. |
| CE lacquered with PVdC | Biodegradable and thermoplastic, high oxygen barrier. | Films and filters. |
| PBS | Biodegradable and compostable, blown and cast film extrusion, low resistance to humidity. | Bag liners, agriculture film, and other blown film applications. |
| PBAT | Biodegradable, high water vapor permeability. | Shopping bags, mulching films, paper coating, labels, and other packaging materials. |
| BB951 (CE/PBS) | Biodegradable. | Coffee capsules, ready-made food and, in modified atmosphere, cheese packaging. |
| BB961 (CE/PLA) | Biodegradable, high water vapor permeability, increases shelf-life until 30 days. | Used for ready meals because it is transparent. |
Table 2.
Approximately wavenumber and associated vibrational mode.
| Approximately Wavenumber (cm−1) | Vibration Associated to |
|---|---|
| 288 | –C=O bending |
| 307–398 | Bending along the carbon-carbon, and oxygen backbones |
| 735 | C=O stretching |
| 872 | C–COO stretching |
| 960 | C–OH bending |
| 1037–1046 | O–C–C stretching |
| 1096 | C–O–C glycosidic linkage |
| 1130 | Asymmetric CH3 bending |
| 1144–1260 | C–O–C ester linkage |
| 1266 | C–OH stretching |
| 1330 | Symmetric CH2 bending |
| 1382 | Symmetric –CH3 bending |
| 1450 | Asymmetric –CH bending |
| 1723–1768 | C=O stretching |
| 2928–2951 | C–H stretching |
Table 3.
Changes observed by visual inspection and by RS after water treatment at 80 °C.
| Polymer | Visual Inspection | Raman Spectroscopy |
|---|---|---|
| PLA | Lost transparency | Peak shifted: 2951 cm−1 (stretching mode C–H) |
| CE | Light wrinkling | Decreased relative intensity: 1266 cm−1(C–OH bonds), 1417 cm−1 and 1460 cm−1 (CH3CO) |
| PBS | Severe wrinkling | No changes |
| PBAT | No changes | No changes |
| BB951 (CE/PBS) | Severe wrinkling; non-transparent (white) zones appear | Peaks disappeared- white zone: 453 cm−1 (C=O bending mode), 898 cm−1 (CE), 1373 cm−1 (C–H bending mode), 2886 cm−1 (C–H stretching mode); Peaks disappeared-transparent zone: 1207 cm−1 (C–C aliphatic chains). |
| BB961 (CE/PLA) | Wrinkling zones appear | Peaks disappeared-both zones: 2886 cm−1 (C–H stretching mode); decreased relative intensity: 353, 898, 1096 and 1373 cm−1 |
Publisher’s Note: MDPI stays neutral with regard to jurisdictional claims in published maps and institutional affiliations. |
© 2021 by the authors. Licensee MDPI, Basel, Switzerland. This article is an open access article distributed under the terms and conditions of the Creative Commons Attribution (CC BY) license (https://creativecommons.org/licenses/by/4.0/).
Share and Cite
MDPI and ACS Style
Ambrosio, G.; Faglia, G.; Tagliabue, S.; Baratto, C. Study of the Degradation of Biobased Plastic after Stress Tests in Water. Coatings 2021, 11, 1330. https://doi.org/10.3390/coatings11111330
AMA Style
Ambrosio G, Faglia G, Tagliabue S, Baratto C. Study of the Degradation of Biobased Plastic after Stress Tests in Water. Coatings. 2021; 11(11):1330. https://doi.org/10.3390/coatings11111330
Chicago/Turabian StyleAmbrosio, Gina, Guido Faglia, Stefano Tagliabue, and Camilla Baratto. 2021. "Study of the Degradation of Biobased Plastic after Stress Tests in Water" Coatings 11, no. 11: 1330. https://doi.org/10.3390/coatings11111330
Note that from the first issue of 2016, this journal uses article numbers instead of page numbers. See further details here.