Low Friction at the Nanoscale of Hydrogenated Fullerene-Like Carbon Films
by
 , , ,
, , ,
Zhao Liu
1,† ,
,
Yongfu Wang
2,†, 
Thilo Glatzel
1,
Antoine Hinaut
1,
Junyan Zhang
2,* and
Ernst Meyer
1,* 1
Department of Physics, University of Basel, 4056 Basel, Switzerland
2
State Key Laboratory of Solid Lubrication, Lanzhou Institute of Chemical Physics, Chinese Academy of Sciences, Lanzhou 730000, China
*
Authors to whom correspondence should be addressed.
†
These authors contributed equally to this work.
Coatings 2020, 10(7), 643; https://doi.org/10.3390/coatings10070643
Submission received: 13 April 2020
/
Revised: 22 June 2020
/
Accepted: 27 June 2020
/
Published: 1 July 2020
(This article belongs to the Section Tribology)
Abstract
:Friction force microscopy experiments at the nanometer scale are applied to study low friction of hydrogenated fullerene-like carbon films. The measured friction coefficients indicate that lower hydrogen concentration during preparation is beneficial to enter the low friction regime, especially in combination with only methane as precursor. Furthermore, two regions are found with distinct friction coefficients and surface roughnesses related to different surface structures. One is rich in amorphous carbon and the other is rich in fullerene-like carbon, dispersed on the same surface. Transmission electron microscopy and Raman spectroscopy images verify this observation of the two separated structures, especially with the extracted fullerene-like structures in the wear debris from macro friction experiments. It is speculated that hydrogen may tend to impair the growth of fullerene-like carbon and is therefore detrimental for lubricity.

1. Introduction
Carbon-based layers with different structures have excellent protective function for efficient control of the heat transfer rate at the solid-liquid interface and better viability of the living matters [1]. Considering high hardness, low friction coefficients and chemical inertness, these materials are also applied for the design and manufacture of nanoelectromechanical systems (NEMS) [2]. Previous studies have shown that graphene can help to enter the superlubricity regime [3]. Even under relatively harsh conditions after fluorination or oxidation, it is found that polycrystalline graphene deposited on Ge(111) still exhibits ultralow friction forces [4]. Besides, the diamond-like carbon (DLC) films are another group of carbon materials with a high content of sp3 C–C bonds [5]. They have a quite distinct lubricity in dry environment, with lower friction coefficients ( = 0.05–0.2) for hydrogenated DLC and higher values ( = 0.4–0.7) for hydrogen-free DLC films [6]. The main cause for low friction in dry atmosphere are the dangling C–H bonds of the hydrogenated DLC films, which lead to a complete passivation and can prevent charge accumulation at the interface [7]. However, these special bonds will gradually disappear with the escape of the hydrogen termination after a considerable number of sliding cycles [8,9,10]. Apart from DLC films, disordered solid interfaces in fullerene-like nanoparticles (such as MoS2 and WS2) have shown a great potential to obtain low friction in recent years [11,12]. During the friction, these particles will be modified by the contact pressure and broken into individual sheets under stress [13,14]. Furthermore, hydrogenated carbon layers can also been prepared in fullerene-like structures, which possess high hardness and elasticity at the same time [15,16]. Raman spectroscopy was applied on such systems to study detailed structural and chemical properties [16,17]. However, a systematic study concerning friction and lubrication of this special carbon films has not yet been fully discussed at the micro and nanoscale, including some key factors of preparation conditions.
Friction force microscopy (FFM) is an ideal technique for precisely determining the friction force at the nanometer scale. It allows tiny forces to be measured with the sensitivity of nanonewtons (nN) or even piconewtons (pN) [18,19]. Considering the tip of a soft cantilever (the spring constant of a typical contact cantilever is approximately /) in contact with the substrate, the lateral force is obtained as the torsional signal, while the flexural forces are determined by the normal bending of the cantilever [20]. With the help of FFM, considerable efforts have been made to explain the basic mechanisms of friction and lubricity at the micro- and nanoscale [21].
In this work, fullerene-like hydrogenated carbon (FL-C:H) films were fabricated by plasma enhanced chemical vapor deposition (PECVD) and subsequently analyzed by FFM under controlled atmosphere in a nitrogen glovebox and ambient air separately. By the comparison of the friction coefficient and the surface roughness, two regions on the films were identified and related to different carbon structures. One of them performs more elastically with less energy dissipation during sliding, thus leading to a better lubrication behavior.
2. Experimental
2.1. Sample Preparation
The FL-C:H films were grown on Si(001) substrates by PECVD, with an average thickness of around 100 nm. Prior to the deposition, the chamber was pumped to m followed by introducing a mixed gas of constant methane gas (30 SCCM) and argon as carrier gas (10 SCCM), as well as variable contents of hydrogen gas, from 0 SCCM, 5 SCCM, 10 SCCM, 15 SCCM to 20 SCCM. For the convenience to describe, they are simplified as 0% H, 5% H, 10% H, 15% H and 20% H in the following text and set as the only variable in this work. The total pressure is increased from 27 of pure CH4 to the mixed with hydrogen gas of 44 . The parameters for deposition were set to 880 and A, with a 50% duty cycle and Hz of pulse power supply. After the preparation, the samples were vacuum encapsulated for transportation. Notably, we will focus here on the 5% H sample to show some intrinsic regularities between hydrogen concentration and nanoscale friction properties, but similar effects have also been observed for the other hydrogen samples.
2.2. Scanning Probe Microscopy
The experiments were performed with an atomic force microscope (Nanosurf FlexAFM C3000, Basel, Switzerland) in a nitrogen glovebox ( ppm, ppm). Comparative experiments were carried out in ambient air (humidity ≈40%) with the same samples, of which results are listed in the supporting information. The friction force mode was used with a contact cantilever (Nanosensors, PPP-CONT, /, kHz). The samples were scanned at a speed of 4 μm at different normal forces , ranging from 6–20 nN (in a linear relationship between friction and normal forces). The scanning areas were selected to be μm2 and each sample was scanned at ten random areas (from P1 to P10) with the same cantilever. Therefore, the contact topographic images and the friction loops can be obtained at the same time. Additionally, the surface roughness S (here, we take the root mean square roughness of a full image) was determined during the experiments.
2.3. Force Calibration
The torsional bending of the cantilever is proportional to the friction or lateral force and is given by the AFM system as a voltage signal . To obtain calibrated friction force values, the following formula can be used [22]:
where is the lateral force, is the lateral spring constant and is the sensitivity of the photodetector ( nm ), which was determined beforehand by recording force-distance curves on a hard surface. The lateral spring constant can be calculated by the dimensions of the cantilever [22]:
where is the shear modulus, which is 50 GPa for silicon [20], l, w and t are the length, width and thickness of the cantilever respectively, and h is the height of the tip. In this experiment, μm, μm, μm and μm are obtained from the cantilever manufacturer values, so that is calculated to be /. Furthermore, the tip radius was measured to be ∼20 nm by scanning electron microscopy (Nova NanoSEM 230, Basel, Switzerland). The friction coefficient is obtained from the slope of the dependence from friction (lateral) and the normal forces, which allows to avoid the effect of adhesive forces (see Supplementary Figure S1). These attractive forces between tip apex and the sample surface are a significant effect which was also measured by force-distance curves. It is considered as the maximum attractive force when the tip retracts from the sample surface.
2.4. TEM Characterization
The structures of the FL-C:H films were characterized by high resolution transmission electron microscopy (FEI Tecani F30, Lanzhou, China) at an acceleration voltage of 300 kV. The samples for HRTEM observation were deposited on a freshly cleaved NaCl wafer and then thinned down by dissolving the NaCl wafer with water.
2.5. Raman Spectroscopy
The FL-C:H film of 5% H was analyzed in situ using Raman spectroscopy (LABRAM HR 800 Microspectrometer, Lanzhou, China) at an excitation wavelength of 532 nm. To avoid the unintentional damage of the sample, we chose a laser power of 0.5 for the Raman spectroscopy experiments.
2.6. Extract from Wear Debris
In order to investigate the composition of surface structures, the friction experiments at the macro scale were also carried out with a reciprocating ball-on-disc tester (CSM Tribometer III, Lanzhou, China) at 25 °C and relative humidity of 40%. The sliding velocity and normal force were set as 10 cm and 10 N, respectively, with the counterpart material of Al2O3 ( = 5 mm). After testing, the wear debris on the films was collected and analyzed by HRTEM to characterize the extracted structures.
3. Results
3.1. The Binary Structure via TEM and Raman Spectra
Low friction is one of the representative features of amorphous hydrogenated carbon films (a-C:H), especially in vacuum or dry atmosphere [23,24,25,26]. However, this value strongly depends on the humidity and preparation conditions. Especially in the low humidity regime the friction coefficient is known to depend on the precursor used to make the a-C:H films [27]. It was reported that the friction coefficient decreases with increasing hydrogen concentration in inert atmosphere [9]. Interestingly, the films produced here are also in the range of low friction but presents the contrary trend of hydrogen dependence with a-C:H films. With a low concentration of 5% H, the high-resolution transmission electron microscopy image of Figure 1a indicates a nearly full coverage by a heavily bent and cross-linked structure. Contrarily, for the 20% H sample it looks more hybrid as shown in Figure 1b, where more crystalline areas are highlighted in the yellow squares and more amorphous in the red, respectively. It suggests the different surface roughnesses between the two areas, which will be discussed more in the following Raman analysis.
Raman spectroscopy is a fast and convenient method for the characterization of carbon film materials [28,29]. The result of 5% H sample is shown in Figure 1c. In the first order region of 1000–2000 , an obvious overlapped D and G band is observed that were fitted to be 1360 and 1560 by Gaussian functions, respectively. The G band around 1560 is related to the optical mode with the in-plane stretching of the C=C bonds such as C atoms in aromatic rings and olefinic chains [30]. While the D band around 1350 is assigned to an breathing mode of sp2 atoms arranged in rings, of which the intensity is linked to the amount of defects in these graphite sheet [31]. The fitted D and G bands here correspond well to those of amorphous carbon films of [32]. Notably, owing to the obvious shoulder peak at ∼1250 (marked with a grey circle), another two bands were also fitted at 1200 and 1470 , respectively. It was discussed that the band at ∼1200 can be attributed to the formation of the fullerene or onion-like structures [33,34]. Furthermore, the second-order bands are observed in the range from 2500 to 3200 . It is formed by the mixture of several band signals including the 2D band (also called the G’ band, ∼2700 ), the D + G band (∼2940 ) and the 2G band (∼3170 ) [35,36]. Consequently, on the basis of all the Raman data, the FL-C:H fims not only possesses the amorphous structures with the similar G and D bands, but also displays the fullerene-like structures at the peak of ∼1191 .
Moreover, to verify this crystalline fullerene-like structures, pin-disk friction experiments were performed with considerable reciprocated cycles on sample 5% H. Finally, a group of fullerene-like structures were extracted from the wear debris, as shown in Figure 1d. The fullerene-like carbon ball with a diameter of ∼30 nm is assumed to be formed by tens of individual flakes. It indirectly proves that the carbon film prepared in this work is composed of the binary structure of rich fullerene-like carbon (FL-C) and rich amorphous carbon (a-C) varying with different hydrogen concentrations. A speculative structure is proposed that: the coiling FL-C structures pile up while the a-C structures are forming the substrate. Thus, the friction properties of this binary structures are highly interesting as well as the effect of hydrogen concentration and the comparison with the a-C:H films.
3.2. Friction Experiments at the Microscale
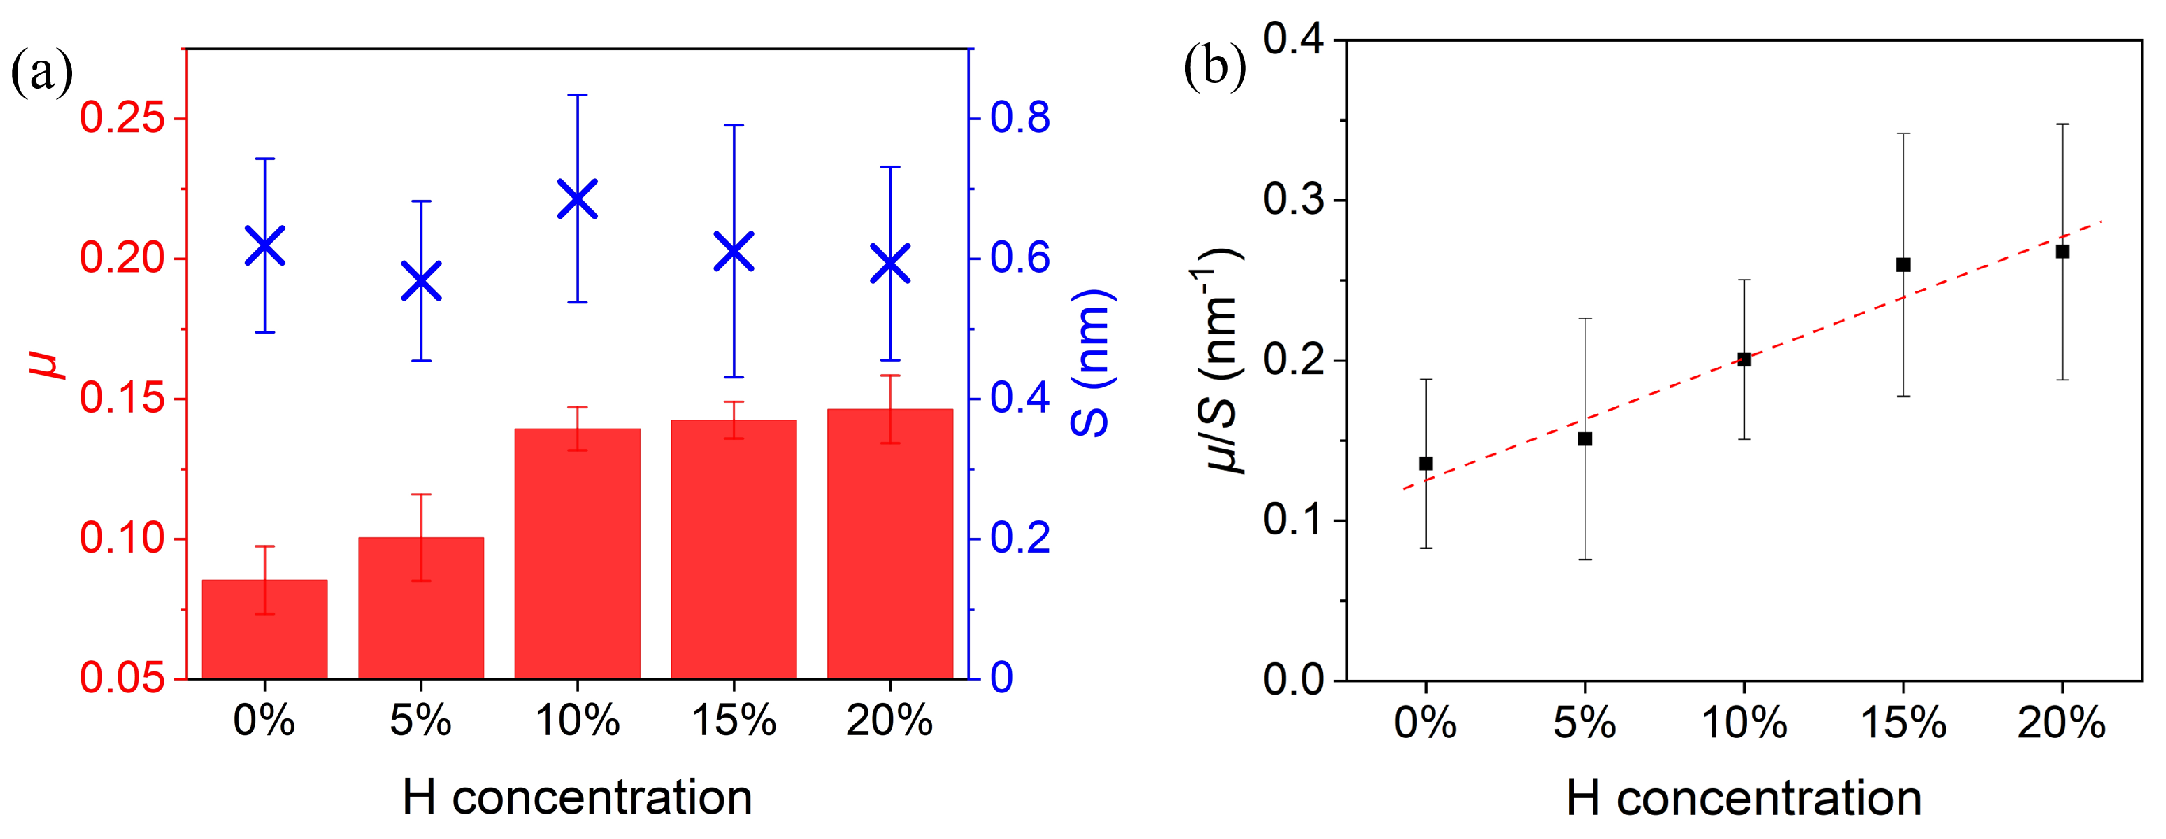
Figure 2a shows the friction coefficient determined from a measured area of μm2 and averaged over ten random sites (P1 to P10) for each sample. Differently, with the hydrogen concentrations of the precursor from 0% to 20%, the friction coefficient shows a slight increase from to , which is still considered to be in the range of low friction but presents the contrary trend of hydrogen dependence with the a-C:H films [7,8,9]. This unexpected behavior between friction coefficient and hydrogen concentration suggests that there is another dominant factor for the low friction of the FL-C:H layers. Also, in the measurements under ambient conditions, where a water film plays an important role between the two sliding surfaces, the friction coefficient still presents a small increase with the hydrogen concentration, however, in a narrower range (see Supplementary Figure S2).
Compared to the increasing friction coefficient, the surface roughness of the films with different hydrogen concentration stays nearly constant as visible in Figure 2a. It is contrary to the assumption at the nanoscale or the situation at the macroscale [37], of a smoother surface with lower friction coefficient. To compensate the influence of surface roughness on friction in our data, we therefore determined the ratio between the measured friction coefficient and the surface roughness S which is shown in Figure 2b as a function of the hydrogen concentration. The introduction of this ratio is a challenging attempt and will help us indirectly verify whether there is a dependent relationship of friction coefficient on hydrogen concentration, after excluding the effect from the irregular average values of surface roughness in Figure 2a. A linear behavior is observed which indicates a correlation of the increasing friction with the hydrogen concentration.
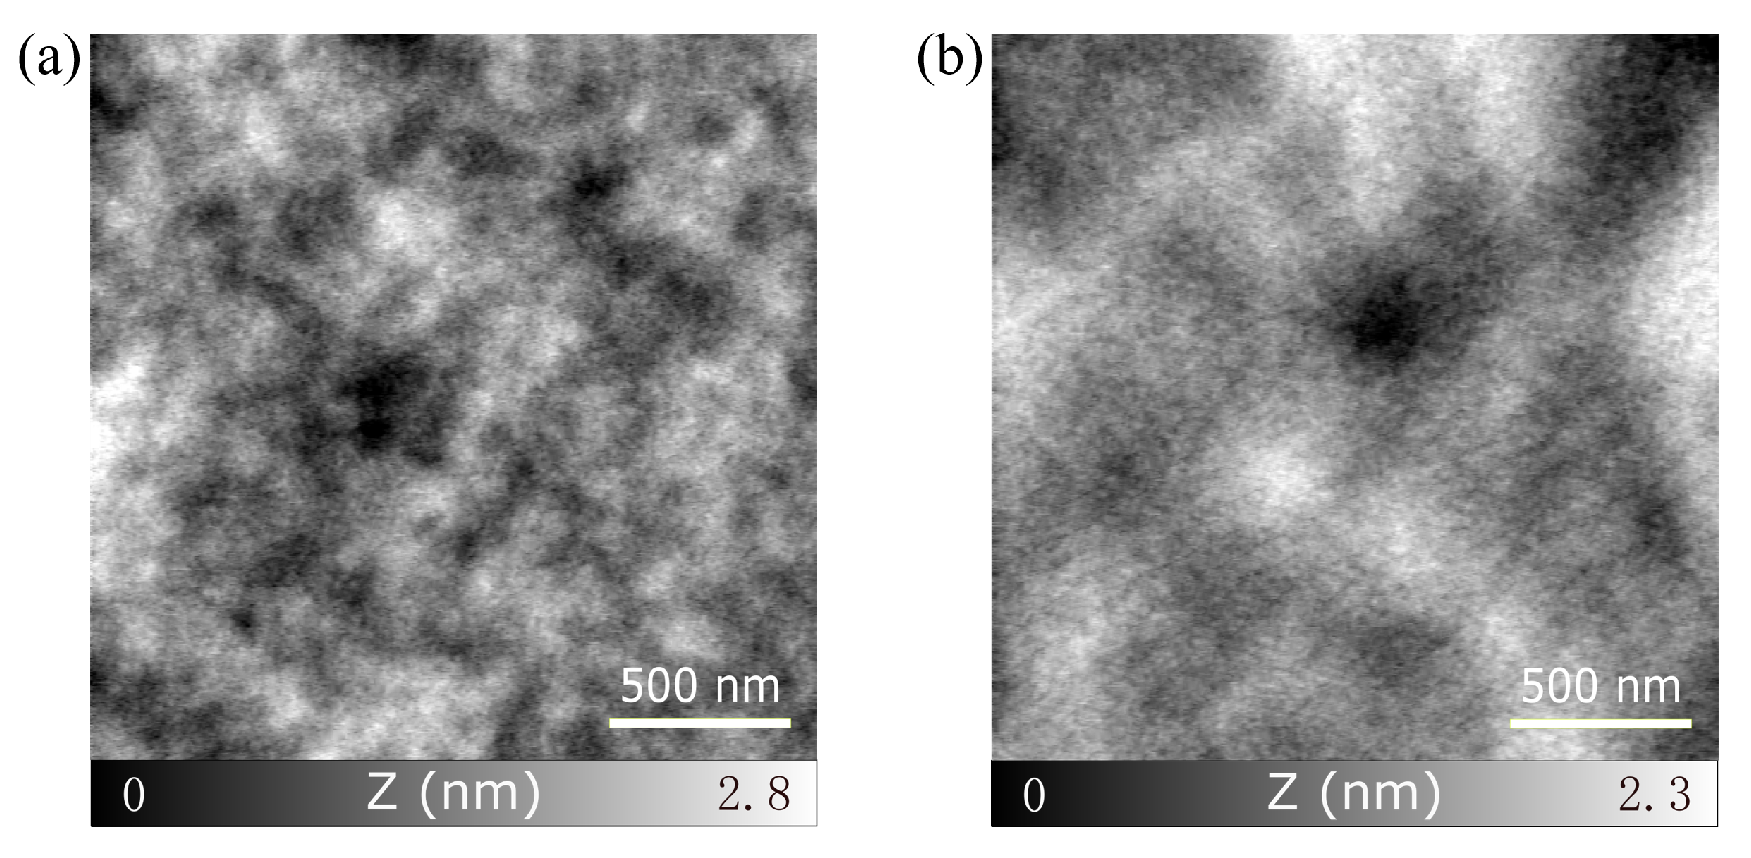
To illustrate the correlation of the friction coefficient and the surface roughness, the topographic images measured by AFM reveal a detailed view. Figure 3 shows two typical images with identical image size of the 0% H (Figure 3a) and the 20% H (Figure 3b) samples. In both images topographic variations in the order of a few nanometers are observed, however, the expansion of these variations becomes larger with increasing hydrogen concentration. The specific surface roughnesses of both measurements are nm and nm for the 0% H and the 20% H sample, respectively. On the other hand, the friction coefficient increases from 0.08 to 0.17, indicating the evolution of lubricity with microscopic morphology.
3.3. Friction Experiments at the Nanoscale
Figure 4 shows the friction coefficient, surface roughness and their ratio of all ten random areas of sample 5% H sorted by the ratio. Unambiguously, the data from these measured areas can be divided into two parts: region A, with high surface roughness and low friction coefficient (e.g., P1 to P7), and region B, with high friction coefficient and low surface roughness (e.g., P9 to P10). The values of the ratio (the black curve in Figure 4) also reveal a transition around P8.
To clarify this behavior, we have compared the topography images in region A (P2, , S = 0.75 nm) and region B (P9, , S = 0.46 nm) on sample 5% H, as shown in Figure 5. Clearly distinct height variation in the range of Δz = 3 nm can be observed in both images. This is consistent with the observation shown in Figure 5b that specific areas extracted either on peaks (black square) or in valleys (white square) have an opposite behavior between friction coefficient and surface roughness, i.e., peak: lower friction coefficient and higher surface roughness or valley: higher friction coefficient and lower surface roughness. If we utilize several colorful lines as the contour to separate Figure 5a,b based on the topography, the essence of region A and B will become more clear. As shown in Figure 5c, P2 possesses more higher areas (ranging from nm to nm) while more flatter areas (ranging from nm to nm) are observed for P9. Since the measured friction coefficient of the higher area is smaller than that of flatter ones, it finally leads to the lower friction coefficient of P2 compared with P9. We assume that the separated ratios between region A and B are the result of distinct structures with higher and lower roughnesses on this hydrogenated carbon films, respectively.
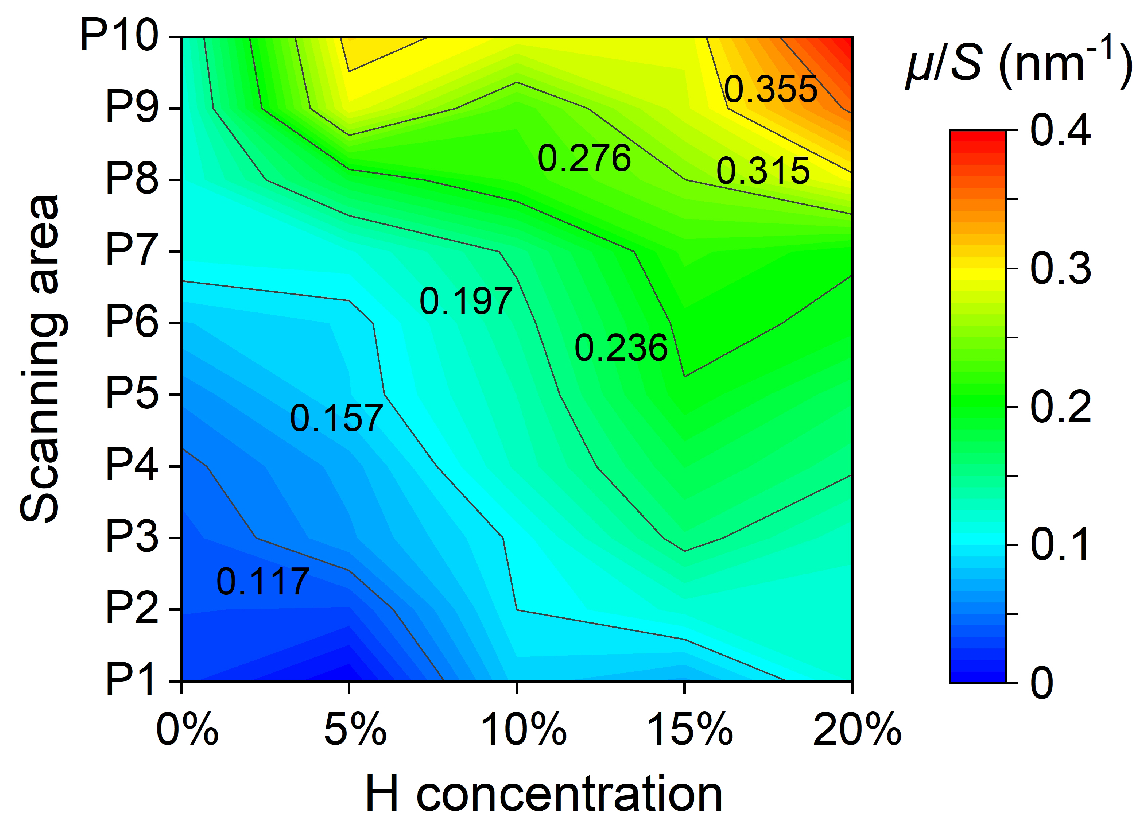
To generalize the influence of ratio for different hydrogen concentrations, we performed similar experiment, i.e., calculation for 10 different areas for samples from 0% H to 20% H. In Figure 6, all the measured areas are shown by the ratio between friction coefficient and surface roughness (). The measurements for each H concentration are all sorted so that P1 always corresponds to the lowest ratio and P10 to the highest. Apart from sample 0% H that shows less differences as others in , it occurs to form an obvious change from region A to region B, which will make a big effect on the formation and distribution of different structures whether adding hydrogen as the feedstock or not.
4. Discussion
Compared with the results of the TEM and Raman analysis in Figure 1 and the AFM measurement in Figure 3, one could draw a conclusion that the FL-C:H films are composed of different topographies on the separated regions: the flat area with amorphous appearance and the rough area with more crystalline structures. The observed structures extracted from the wear debris in the macro friction experiments turn out that these FL-C:H pieces should be peeled off from the higher part of the films. Besides the higher roughness, the results in Figure 4 indicate that the friction coefficient of the crystalline structures is lower than that of the flat amorphous with smaller roughness. This is not only the case in sample 5% H, but also for the other hydrogen concentrations, with the largest in sample 20% H and lowest in sample 0% H. Additionally, the increasing adhesive force from 0% H to 20% H not only results from the surface curvature and surface roughness, but also from variable lubricated properties (see Supplementary Figure S3). It presents that region A possesses shorter contact time and less energy dissipation than those of region B during sliding, which are representative of rich FL-C and rich a-C accumulated areas, respectively.
It is proposed that the phenomenon of opposite friction properties with roughness is stemmed from the variable hydrogen concentrations in the precursor gas. As it is known that hydrogen makes an important effect on the lubrication of the hydrogenated DLC films in the inert atmosphere, which is attributed to the large amount of hydrogen-terminated dangling bonds extending from the amorphous carbons [38]. Even so, there is also a maximum threshold of hydrogen to avoid the formation of hydrocarbon polymers [39,40]. In contrary to the hydrogenated DLC films, the FL-C:H films prepared in this work seem not to functionalize through these dangling bonds. Related studies on the effect of the hydrogen addition during the deposition of FL-CNx films have shown that the precursor gas enables the termination of bonds by hydrogen atoms so that the extension of ring structures are prohibited [41,42]. It demonstrates that a small amount of hydrogen in the precursor is beneficial to initiate the formation of fullerene-like structures, rather than graphitic. Yet, on the other hand, the increasing hydrogen concentration will interrupt this process rapidly, replaced by the formation of amorphous carbon.
Furthermore, several other views are also useful to explain the lower friction coefficient of the FL-C:H films. First, the excellent mechanical properties like the high hardness (∼20.9 GPa) and elastic recovery (∼85%) of the FL-C:H films measured in other articles [15,16] suggests that the contact during sliding is likely to behave more elastically than plastically [43,44]. The main difference between elastic and plastic behaviors is depended on whether there is an accumulated unrecoverable deformation on the surface or not. In our case, the film surfaces seem not to be scratched or damaged with the increasing normal load during the scanning procedures. It demonstrates that the fullerene-like structures will not produce plastic accumulation at the end of the frictional path, otherwise it can break such smooth sliding and sometimes cause stuck with rather high friction force. Second, the rather weak interlayer van der Waals forces and the large lattice spacing of the fullerene-like structures provide a high compressibility between the sliding surfaces [45]. When the surfaces are elastically contacting, the FL-C structures prefer to deform or coil rather than break. Thus, the damage always happens at a-C:H area with dangling C-H bonds, while the FL-C:H regions tend to be peeled off in whole pieces as shown in Figure 1c. Sometimes the debris could transfer into multilayer nano-onion balls after repeated friction cycles, which behave like nano bearings for lower friction and may become another interesting topic about this FL-C:H films [46,47]. Finally, another robust explanation was discussed by Rachel J. Cannara et al. that lighter atoms vibrate faster and induce rapid energy dissipation, as a result of higher friction than heavier atoms [48], which just corresponds to the roles of the amorphous carbon with the terminated hydrogen (light atoms) and the fullerene-like carbon (heavy atoms) on the surface in our experiment, respectively.
5. Conclusions
In this paper, the FL-C:H films are prepared by PECVD, where tribological properties at the nanoscale are investigated by FFM in dry nitrogen atmosphere and under ambient conditions. This film is considered to be composed of a binary structure: FL-C and a-C areas. The former structure induces lower friction coefficient, lower adhesive force and higher surface roughness, while the latter behaves just opposite.
It is obvious that the low friction is determined by the ratio of both FL-C and a-C structures. To understand the lubrication mechanism, it should shed light on the excellent hardness and elastic modulus of this film, which behaves elastically with less energy dissipation during frictional sliding.
Since higher hydrogen fraction is verified to impede the formation of FL-C structures, the further plan is to reduce the hydrogen concentration during the film preparation, such as utilizing the unsaturated hydrocarbon as reaction gas. In contrast to DLC films, the FL-C:H films are rather independent of hydrogen to perform excellent lubricity as well as durability, which promotes the application range of this special carbon film and continues to be a great impetus to perform superlubricity in the ambient environment.
Supplementary Materials
The following are available online at https://www.mdpi.com/2079-6412/10/7/643/s1, Figure S1: The normal-friction force curve with the slope of friction coefficient. Figure S2: Friction coefficient and surface roughness of the FL-C:H films measured in ambient air. Figure S3. Measured adhesive force of each hydrogen concentration in nitrogen averaged over all ten areas by force spectroscopy curve.
Author Contributions
Data curation, Y.W.; writing—original draft preparation, Z.L.; writing—review and editing, A.H.; supervision, T.G.; funding acquisition, J.Z. and E.M. All authors have read and agreed to the published version of the manuscript.
Funding
This research was funded by the Projects of International Cooperation and Exchanges from National Natural Science Foundation of China (No. 51661135022) and European Research Council (ERC) under the European Union’s Horizon 2020 Research and Innovation Programme (No. 834402) as well as the Swiss National Science Foundation (SNSF), the Swiss Nanoscience Institute (SNI) and the University of Basel for funding.
Conflicts of Interest
The authors declare no conflict of interest.
References
- Esmeryan, K.D.; Lazarov, Y.; Stamenov, G.S.; Chaushev, T.A. When condensed matter physics meets biology: Does superhydrophobicity benefiting the cryopreservation of human spermatozoa? Cryobiology 2020, 92, 263–266. [Google Scholar] [CrossRef]
- Zhang, Y.F.; Polychronopoulou, K.; Humood, M.; Polycarpou, A.A. High temperature nanotribology of ultra-thin hydrogenated amorphous carbon coatings. Carbon 2017, 123, 112–121. [Google Scholar] [CrossRef]
- Kawai, S.; Benassi, A.; Gnecco, E.; Söde, H.; Pawlak, R.; Feng, X.L.; Müllen, K.; Passerone, D.; Pignedoli, C.A.; Ruffieux, P.; et al. Superlubricity of graphene nanoribbons on gold surfaces. Science 2016, 351, 957–961. [Google Scholar] [CrossRef] [PubMed] [Green Version]
- Zheng, X.H.; Gao, L.; Yao, Q.Z.; Li, Q.Y.; Zhang, M.; Xie, X.M.; Qiao, S.; Wang, G.; Ma, T.B.; Di, Z.F.; et al. Robust ultra-low-friction state of graphene via moiré superlattice confinement. Nat. Commun. 2016, 7, 13204. [Google Scholar] [CrossRef] [PubMed] [Green Version]
- Robertson, J. Diamond-like amorphous carbon. Mater. Sci. Eng. R Rep. 2002, 37, 129–281. [Google Scholar] [CrossRef] [Green Version]
- Wolloch, M.; Levita, G.; Restuccia, P.; Righi, M.C. Interfacial charge density and its connection to adhension and frictional forces. Phys. Rev. Lett. 2018, 121, 026804. [Google Scholar] [CrossRef] [Green Version]
- Zhang, M.L.; Xia, Y.B.; Wang, L.J.; Zhang, W.L. The electrical properties of diamond-like carbon film/D263 glass composite for the substrate of micro-strip gas chamber. Diam. Relat. Mater. 2003, 12, 1544–1547. [Google Scholar] [CrossRef]
- Donnet, C.; Erdemir, A. Tribology of Diamond-Like Carbon Films; Springer: New York, NY, USA, 2008. [Google Scholar]
- Erdemir, A. The role of hydrogen in tribological properties of diamond-like carbon films. Surf. Coat. Technol. 2001, 146–147, 292–297. [Google Scholar] [CrossRef]
- Ma, T.B.; Hu, Y.Z.; Wang, H. Molecular dynamics simulation of shear-induced graphitization of amorphous carbon films. Carbon 2009, 47, 1953–1957. [Google Scholar] [CrossRef]
- Chhowalla, M.; Amaratunga, G.A.J. Thin films of fullerene-like MoS2 nanoparticles with ultra-low friction and wear. Nature 2000, 407, 164–167. [Google Scholar] [CrossRef]
- Rapoport, L.; Lvovsky, M.; Lapsker, I.; Leshchinsky, W.; Volovik, Y.; Feldman, Y.; Tenne, R. Friction and wear of bronze powder composites including fullerene-like WS2 nanoparticles. Wear 2001, 249, 149–156. [Google Scholar] [CrossRef]
- Cizaire, L.; Vacher, B.; Mogne, T.L.; Martin, J.M.; Rapoport, L.; Margolin, A.; Tenne, R. Mechanisms of ultra-low friction by hollow inorganic fullerene-like MoS2 nanoparticles. Surf. Coat. Technol. 2002, 160, 282–287. [Google Scholar] [CrossRef]
- André, B.; Gustavsson, F.; Svahn, F.; Jacobson, S. Performance and tribofilm formation of a low-friction coating incorporating inorganic fullerene like nano-particles. Sur. Coat. Technol. 2012, 206, 2325–2329. [Google Scholar] [CrossRef]
- Wang, C.B.; Yang, S.R.; Wang, Q.; Wang, Z.; Zhang, J.Y. Super-low friction and super-elastic hydrogenated carbon films originated from a unique fullerene-like nanostructure. Nanotechnology 2008, 19, 225709. [Google Scholar] [CrossRef]
- Wang, P.; Wang, X.; Liu, W.M.; Zhang, J.Y. Growth and structure of hydrogenated carbon films containing fullerene-like structure. J. Phys. D Appl. Phys. 2008, 41, 085401. [Google Scholar] [CrossRef]
- Kuzmany, H.; Pfeiffer, R.; Hulman, M.; Kramberger, C. Raman spectroscopy of fullerenes and fullerene–nanotube composites. Philos. Trans. R. Soc. Lond. A 2004, 362, 2375–2406. [Google Scholar] [CrossRef]
- Giessibl, F.J. Forces and frequency shifts in atomic-resolution dynamic-force microscopy. Phys. Rev. B 1997, 56, 16010–16015. [Google Scholar] [CrossRef] [Green Version]
- Pfeiffer, O.; Bennewitz, R.; Baratoff, A.; Meyer, E.; Grütter, P. Lateral-force measurements in dynamic force microscopy. Phys. Rev. B 2002, 65, 161403. [Google Scholar] [CrossRef]
- Ogletree, D.F.; Carpick, R.W.; Salmeron, M. Calibration of frictional forces in atomic force microscopy. Rev. Sci. Instrum. 1996, 67, 3298–3306. [Google Scholar] [CrossRef] [Green Version]
- Varenberg, M.; Etsion, I.; Halperin, G. An improved wedge calibration method for lateral force in atomic force microscopy. Rev. Sci. Instrum. 2003, 74, 3362–3367. [Google Scholar] [CrossRef]
- Bhushan, B. Nanotribology and Nanomechanics; Springer: New York, NY, USA, 2005. [Google Scholar]
- Meunier, C.; Alers, P.; Marot, L.; Stauffer, J.; Randall, N.; Mikhailov, S. Friction properties of ta-C and a-C:H coatings under high vacuum. Surf. Coat. Technol. 2005, 200, 1976–1981. [Google Scholar] [CrossRef]
- Fontaine, J.; Mogne, T.L.; Loubet, J.L.; Belin, M. Achieving superlow friction with hydrogenated amorphous carbon: Some key requirements. Thin Solid Films 2005, 482, 99–108. [Google Scholar] [CrossRef]
- Grill, A. Diamond-like carbon: State of the art. Diam. Relat. Mater. 1999, 8, 428–434. [Google Scholar] [CrossRef]
- Cui, L.C.; Lu, Z.B.; Wang, L.P. Probing the low-friction mechanism of diamond-like carbon by varying of sliding velocity and vacuum pressure. Carbon 2014, 66, 259–266. [Google Scholar] [CrossRef]
- Erdemir, A.; Eryilmaz, O.L.; Fenske, G. Synthesis of diamondlike carbon films with superlow friction and wear properties. J. Vac. Sci. Technol. A 2000, 18, 1987–1992. [Google Scholar] [CrossRef] [Green Version]
- Ferrari, A.C.; Robertson, J. Raman spectroscopy of amorphous, nanostructured, diamond–like carbon, and nanodiamond. Philos. Trans. R. Soc. Lond. A 2004, 362, 2477–2512. [Google Scholar] [CrossRef]
- Dennison, J.R.; Holtz, M.; Swain, G. Raman spectroscopy of carbon materials. Spectroscopy 1996, 11, 38–45. [Google Scholar]
- Ferreira, E.H.M.; Moutinho, M.V.O.; Stavale, F.; Lucchese, M.M.; Capaz, R.B.; Achete, C.A.; Jorio, A. Evolution of the Raman spectra from single-, few-, and many-layer graphene with increasing disorder. Phys. Rev. B 2010, 82, 125429. [Google Scholar] [CrossRef] [Green Version]
- Cançado, L.G.; Jorio, A.; Ferreira, E.H.M.; Stavale, F.; Achete, C.A.; Capaz, R.B.; Moutinho, M.V.O.; Lombardo, A.; Kulmala, T.S.; Ferrari, A.C. Quantifying defects in graphene via Raman spectroscopy at different excitation energies. Nano Lett. 2011, 11, 3190–3196. [Google Scholar] [CrossRef] [Green Version]
- Ferrari, A.C.; Robertson, J. Resonant Raman spectroscopy of disordered, amorphous, and diamondlike carbon. Phys. Rev. B 2001, 64, 075414. [Google Scholar] [CrossRef] [Green Version]
- Wang, Q.; Wang, C.B.; Wang, Z.; Zhang, J.Y.; He, D.Y. Fullerene nanostructure-induced excellent mechanical properties in hydrogenated amorphous carbon. Appl. Phys. Lett. 2007, 91, 141902. [Google Scholar] [CrossRef]
- Wang, C.B.; Yang, S.R.; Li, H.X.; Zhang, J.Y. Elastic properties of a-C:N:H films. J. Appl. Phys. 2007, 101, 013501. [Google Scholar] [CrossRef]
- Krishnamoorthy, K.; Veerapandian, M.; Yun, K.; Kim, S.-J. The chemical and structural analysis of graphene oxide with different degrees of oxidation. Carbon 2013, 53, 38–49. [Google Scholar] [CrossRef]
- Vollebregt, S.; Ishihara, R.; Tichelaar, F.D.; Hou, Y.; Beenakker, C.I.M. Influence of the growth temperature on the first and second-order Raman band ratios and widths of carbon nanotubes and fibers. Carbon 2012, 50, 3542–3554. [Google Scholar] [CrossRef]
- Gupta, B.K.; Malshe, A.; Bhushan, B.; Subramaniam, V.V. Friction and wear properties of chemomechanically polished diamond films. J. Tribol. 1994, 116, 445–453. [Google Scholar] [CrossRef]
- Erdemir, A.; Donnet, C. Tribology of Diamond and Diamond-Like Carbon Films: An Overview; Wiley: London, UK, 2005. [Google Scholar]
- Tamor, M.A.; Vassell, W.C.; Carduner, K.R. Atomic constraint in hydrogenated “diamond-like” carbon. Appl. Phys. Lett. 1991, 58, 592–594. [Google Scholar] [CrossRef]
- Esmeryan, K.D.; Castano, C.E.; Bressler, A.H.; Abolghasemibizaki, M.; Fergusson, C.P.; Roberts, A.; Mohammadi, R. Kinetically driven graphite-like to diamond-like carbon transformation in low temperature laminar diffusion flames. Diam. Relat. Mater. 2017, 75, 58–68. [Google Scholar] [CrossRef]
- Hellgren, N.; Johansson, M.P.; Hjörvarsson, B.; Broitman, E.; Östblom, M.; Liedberg, B.; Hultman, L.; Sundgren, J.E. Growth, structure, and mechanical properties of CNxHy films deposited by dc magnetron sputtering in N2/Ar/H2 discharges. J. Vac. Sci. Technol. A 2000, 18, 2349–2358. [Google Scholar] [CrossRef]
- Voevodin, A.A.; Jones, J.G.; Zabinski, J.S.; Czigány, Z.; Hultman, L. Growth and structure of fullerene-like CNx thin films produced by pulsed laser ablation of graphite in nitrogen. J. Appl. Phys. 2002, 92, 4980–4988. [Google Scholar] [CrossRef]
- Garcia, I.A.; Berasategui, E.G.; Bull, S.J.; Page, T.F.; Neidhardt, J.; Hultman, L.; Hellgren, N. How hard is fullerene-like CNx some observations from the nanoindentation response of a magnetron-sputtered coating. Philos. Mag. A 2002, 82, 2133–2147. [Google Scholar] [CrossRef]
- Palacio, J.F.; Bull, S.J.; Neidhardt, J.; Hultman, L. Nanoindentation response of high performance fullerene-like CNx. Thin Solid Films 2006, 494, 63–68. [Google Scholar] [CrossRef]
- Webb, R.P.; Kerford, M. The computer simulation of the scattering of fullerenes from a graphite surface: Energy partitioning and vibrational spectra. Nucl. Instrum. Methods Phys. Res. B 2001, 180, 32–36. [Google Scholar] [CrossRef]
- Bucholz, E.W.; Phillpot, S.R.; Sinnott, S.B. Molecular dynamics investigation of the lubrication mechanism of carbon nano-onions. Comput. Mater. Sci. 2012, 54, 91–96. [Google Scholar] [CrossRef]
- Pottuz, L.J.; Bucholz, E.W.; Matsumoto, N.; Phillpot, S.R.; Sinnott, S.B.; Ohmae, N.; Martin, J.M. Friction properties of carbon nano-onions from experiment and computer simulations. Tribol. Lett. 2010, 37, 75–81. [Google Scholar] [CrossRef]
- Cannara, R.J.; Brukman, M.J.; Cimatu, K.; Sumant, A.V.; Baldelli, S.; Carpick, R.W. Nanoscale friction varied by isotopic shifting of surface vibrational frequencies. Science 2007, 318, 780–783. [Google Scholar] [CrossRef] [PubMed] [Green Version]
Figure 1.
Structural analysis of the FL-C films: (a) TEM image of sample 5% H. (b) TEM image of sample 20% H, with flat amorphous structures in the red square mark and coarse crystalline structures in the yellow square mark, respectively. (c) Raman spectra of the sample 5% H in the range from 750 to 3250 . (d) TEM image of extracted fullerene-like structures from wear debris of sample 5% H.

Figure 2.
(a) Measured friction coefficient () and surface roughness (S) of the FL-C:H films for various hydrogen concentrations. (b) The average ratio increases linearly with the hydrogen concentration.
Figure 2.
(a) Measured friction coefficient () and surface roughness (S) of the FL-C:H films for various hydrogen concentrations. (b) The average ratio increases linearly with the hydrogen concentration.

Figure 3.
AFM topography images in contact mode of the FL-C:H films with two hydrogen concentrations: (a) 0% H, , S = 0.45 nm ( = 10 nN). (b) 20% H, , S = 0.36 nm ( = 10 nN).
Figure 3.
AFM topography images in contact mode of the FL-C:H films with two hydrogen concentrations: (a) 0% H, , S = 0.45 nm ( = 10 nN). (b) 20% H, , S = 0.36 nm ( = 10 nN).

Figure 4.
Friction coefficient, surface roughness and their ratio determined from ten random areas for sample 5% H, which are arranged by the the increasing ratio.
Figure 4.
Friction coefficient, surface roughness and their ratio determined from ten random areas for sample 5% H, which are arranged by the the increasing ratio.

Figure 5.
AFM images in contact mode of two different areas ( μm2) on sample 5% H: (a) P2, low and high S ( = 10 nN). (b) P9, high and low S ( = 10 nN). The areas of nm2 highlighted by a white mark (, S = 0.12 nm) and a black mark (, S = 0.14 nm) show different local friction coefficients, respectively. (c) The coverage distribution at different regions (equally divided by the colorful dotted lines) for P2 and P9.

Figure 6.
The ratio between friction coefficient and surface roughness (/S) of ten random areas for each hydrogen concentration.
Figure 6.
The ratio between friction coefficient and surface roughness (/S) of ten random areas for each hydrogen concentration.

© 2020 by the authors. Licensee MDPI, Basel, Switzerland. This article is an open access article distributed under the terms and conditions of the Creative Commons Attribution (CC BY) license (http://creativecommons.org/licenses/by/4.0/).
Share and Cite
MDPI and ACS Style
Liu, Z.; Wang, Y.; Glatzel, T.; Hinaut, A.; Zhang, J.; Meyer, E. Low Friction at the Nanoscale of Hydrogenated Fullerene-Like Carbon Films. Coatings 2020, 10, 643. https://doi.org/10.3390/coatings10070643
AMA Style
Liu Z, Wang Y, Glatzel T, Hinaut A, Zhang J, Meyer E. Low Friction at the Nanoscale of Hydrogenated Fullerene-Like Carbon Films. Coatings. 2020; 10(7):643. https://doi.org/10.3390/coatings10070643
Chicago/Turabian StyleLiu, Zhao, Yongfu Wang, Thilo Glatzel, Antoine Hinaut, Junyan Zhang, and Ernst Meyer. 2020. "Low Friction at the Nanoscale of Hydrogenated Fullerene-Like Carbon Films" Coatings 10, no. 7: 643. https://doi.org/10.3390/coatings10070643
Note that from the first issue of 2016, this journal uses article numbers instead of page numbers. See further details here.