
Interannual Variability and Trends of Extreme Rainfall Indices over Benin
by
Ezéchiel Obada
1,2,3,*, 
Eric Adechina Alamou
1,2,3,
Eliezer Iboukoun Biao
1,2,4 and
Esdras B. Josué Zandagba
1,2 1
Laboratoire de Géosciences de l’Environnement et Applications, Université Nationale des Sciences, Technologies, Ingénierie et Mathématiques (UNSTIM), Abomey, Benin
2
Laboratoire d’Hydrologie Appliquée (LHA), Institut National de l’Eau, Université d’Abomey-Calavi (UAC), Abomey-Calavi, Benin
3
Ecole Nationale Supérieure des Travaux Publics (ENSTP/UNSTIM), Abomey, Benin
4
Ecole Nationale Supérieure de Génie Mathématique et Modélisation (ENSGMM/UNSTIM), Abomey, Benin
*
Author to whom correspondence should be addressed.
Climate 2021, 9(11), 160; https://doi.org/10.3390/cli9110160
Submission received: 14 September 2021
/
Revised: 18 October 2021
/
Accepted: 25 October 2021
/
Published: 29 October 2021
(This article belongs to the Special Issue Extreme Weather Events)
Abstract
:Observed rainfall data (1961–2016) were used to analyze variability, trends and changes of extreme precipitation indices over Benin. Nine indices out of the ones developed by the Expert Team on Climate Change Detection and Indices (ETCCDI) were used. The results indicate a mix of downward and upward trends for maximum 1-day precipitation (RX1day) and maximum 5-days precipitation (RX5day). Decrease trends are observed for annual total precipitation of wet days (P), while significant increases are found for the simple daily intensity index (SDII). The number of wet days (RR1) and maximum consecutive dry days (CDD) show a mix of increase/decrease trends. However, the number of heavy (R10) and very heavy (R20) wet days and maximum consecutive wet days (CWD) show decreased trends. All wet indices increased over 1991–2010 in relation to 1971–1990. The increase in all wet indices over Benin could explain the intensification of hydrology, and the increase in the frequency and the intensity of floods. It caused damages such as soil erosion, crop destruction, livestock destruction, displacement of populations, proliferation of waterborne diseases and loss of human life. Some adaptive strategies are suggested to mitigate the impacts of changes in extreme rainfall.
1. Introduction
Extreme weather events are, by definition, events that occur only rarely, and very often with enormous consequences on the environment and human health. An extreme rainfall event is an occurrence that is significantly different from typical rainfall at a specific area and time of year. In the context of climate change, extreme rainfall events are becoming more frequent and intense [1]. It is evidence that global warming has altered the water cycle, which has led to change in the magnitude, frequency and probability of extreme rainfall around the world [2,3,4]. Extreme climate events frequently cause severe environmental, human and economic impacts such as soil erosion, crop damage, increase of drought and flood risk, decline in agricultural production which can lead to a situation of food insecurity and famine, etc., [5,6,7]. Many appreciated efforts have been made in the development of datasets of extreme indices over the word. This has led to great progress in climate extremes research over the last few decades. For example, the Expert Team on Climate Change Detection and Indices (ETCCDI) [8] recommended many extreme rainfall and temperature indices in extreme climate studies.
West Africa is particularly vulnerable to the impact of extreme rainfall events due to a constantly increasing population and a lack of adequate adaptation strategies [9]. As with all the West African countries, Benin is also vulnerable to extreme rainfall impact because its economy is based on rain-fed agriculture. In recent decades, a succession of extreme rainfall events has occurred in Benin. Indeed, the 1970s and 1980s were marked by severe drought which caused enormous economic loss due to the decline in agricultural production, loss of livestock, lower production of hydroelectric power, etc. After this period of drought, a resumption of precipitation is observed with an increase in the intensity and frequency of daily extreme rainfall in the decades 2000 and 2010. This led to an increase in the frequency and intensity of floods and caused material and human damage. The main impact of climate change on humanity is caused by the extreme events, since the occurrence of extreme events leads to more impact related to change in the mean climate [10].
Many studies were carried out to assess changes and trends in extreme rainfall at local, regional and global scales. At a global scale, Ref. [11] indicated that extreme rainfall events showed a general upward trend in these last decades. In northern China (Jing-Jin-Ji district), Ref. [4] stated that the regional extreme rainfall indices have downward trends. However, they pointed out a strong increasing trend of extreme rainfall from the northwest to the southeast excluding the consecutive dry days (CDD) and the consecutive wet days (CWD). Ref. [12] pointed out that extreme precipitation indices have significant increasing trends, excepting maximum consecutive dry days, showing an increasing probability of flood-induced catastrophes over the Monsoon region in China. Over southeastern South America, observed precipitation showed an increasing trend in the annual maximum of daily precipitation (RX1day) over the period from 1955–2005 [13]. Ref. [14] investigated the cause of increased trends in annual RX1day and RX5day precipitation indices and established that anthropogenic climate change has intensified the continental and regional of these extreme precipitation indices. They also concluded that, because of anthropogenic climate change, extreme precipitation events will be more frequent and intense in North America in the future. An overall intensification and a positive scaling signal with North Hemispheric temperature is identified in annual summer and winter single day to monthly maximum rainfall over Central Europe [15]. In West Africa, downward trends in dry conditions were found in Sahel and Sahara, while upward trends of wet indices were found over western and southern Sahel [9]. Ref. [16] found a statistically significant upward trend in the number of wet days, while for the number of dry days a statistically downward trend was detected over the Sahel. They also indicated that the occurrence of extreme summer rainfall events is characterized by a significant decreasing trend over West Africa and a local upward trend in West Sahel. In Ghana, Ref. [17] indicated a significant downward trend in wet indices around the Volta Lake and in the center of Ghana, whereas over northern Ghana upward trends were detected. Ref. [18] indicated the lack of strong trends of extreme rainfall indices over the upper Ouémé basin in the north of Benin. Ref. [19] showed that the number of heavy and very heavy rainfall days, the number of consecutive wet days, the number of annual wet days and the total rainfall have downward trends in most rain gauges of the Ouéme basin (Benin). Ref. [20] indicated an intensification of heavy rainfall, simple daily intensity index (SDII) and a decrease in maximum consecutive wet days (CWD) over the Ouémé Delta in Benin. The assessment of extreme rainfall in Benin has so far been conducted at watershed scale [18,19,20,21]. No study has yet investigated the spatio-temporal variability and trend of extreme precipitation in the entirety of Benin.
This study aims to examine the inter-annual variability and trends of extreme precipitation indices over the entirety of Benin using in-situ observed rainfall. Furthermore, the study will explore the changes in extreme rainfall in Benin over two sub-periods. The study of extreme rainfall over Benin is of paramount importance because agriculture which is the main economic activity in Benin, is is a rain-fed agriculture and depends on rainfall and extreme rainfall events. The West African population in general, and particularly those from Benin, are very vulnerable to climatic hazards and an accentuation of the hydrological cycle could have disastrous societal and economic consequences. A scientific analysis of extreme rainfall and its evolution over Benin is an essential element for the implementation of operational management and flood risk mitigation policies, which are currently underdeveloped in this country.
2. Materials and Methods
2.1. Study Area
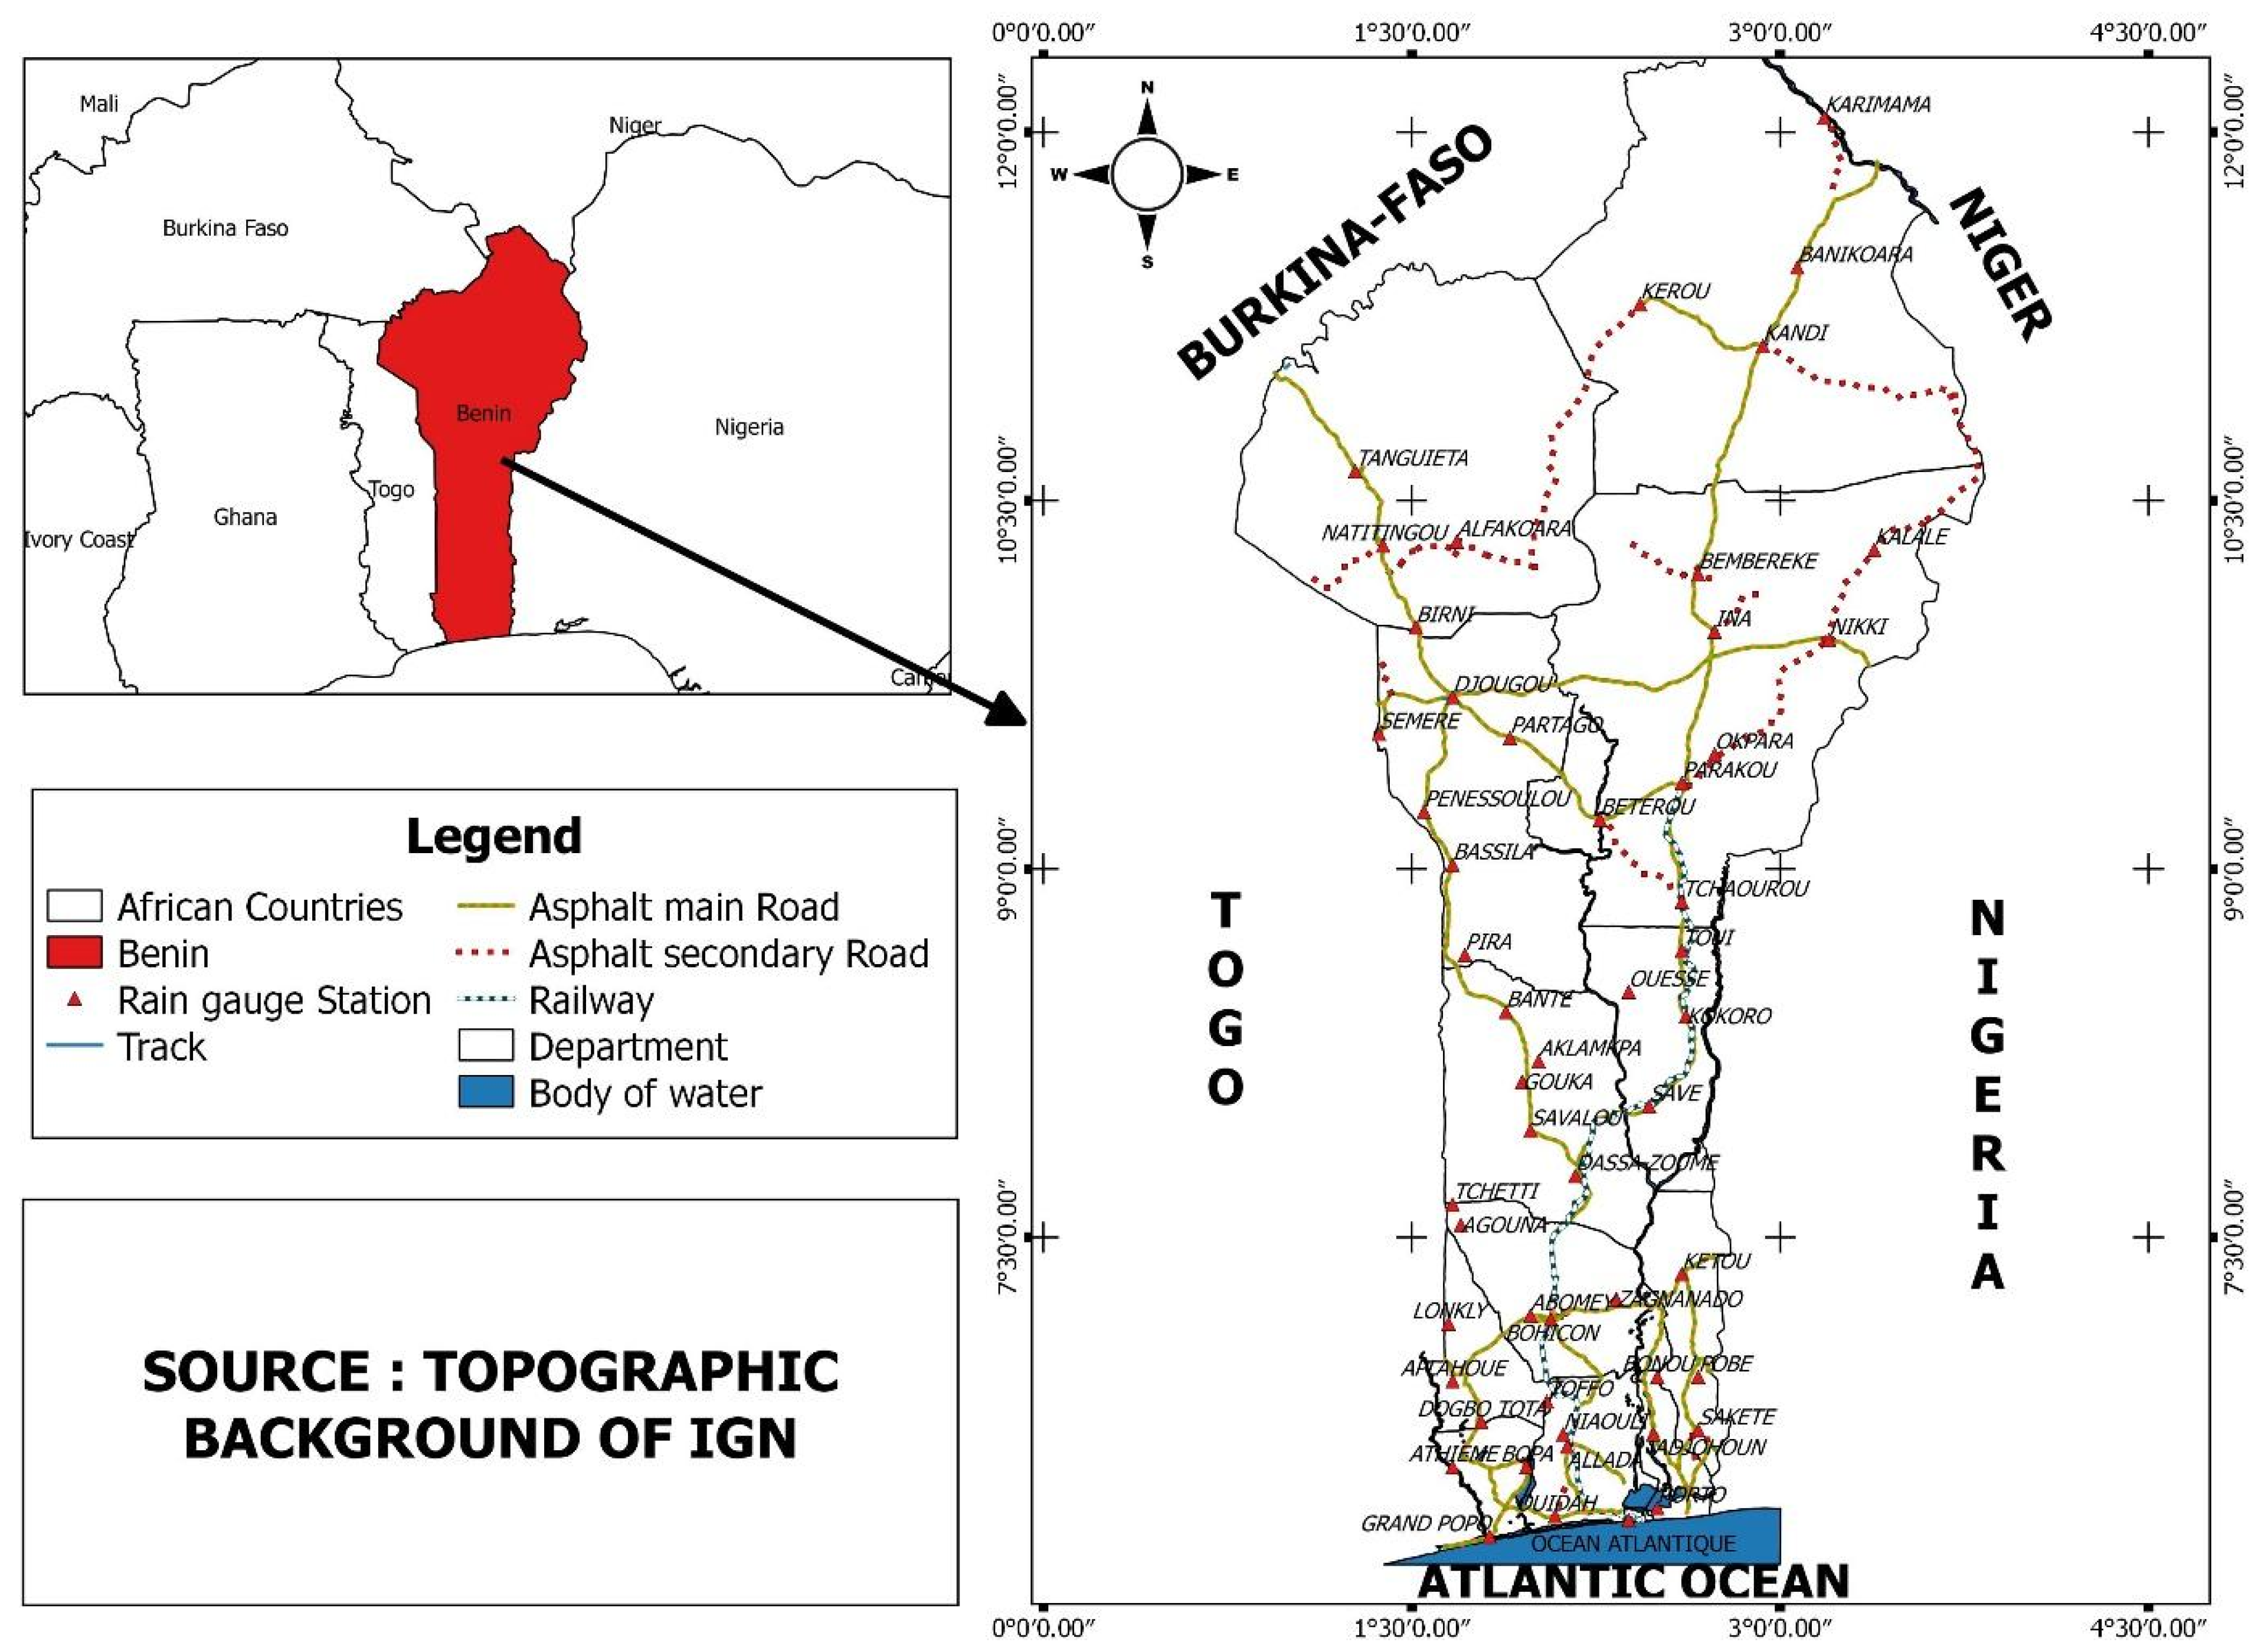
Benin is a West African country which has an elongated shape and is oriented perpendicularly to the coast of Gulf of Guinea [22,23]. It extends over an area of 112,622 km2 and is bounded in the North by Niger and Burkina Faso Republics, in the East by the Federal Republic of Nigeria, in the West by the Republic of Togo and in the South by Atlantic Ocean (Figure 1). Benin is under the influence of the West African monsoon. It is under a continental tropical climate which is characterized by one rainy season (April to October) and one dry season (November to March) in the North, and two rainy seasons (April to July and September to November) and two dry seasons (December to March and August). Annual precipitation amounts vary from 700 mm to 1400 mm and annual mean temperature is generally between 23 °C and 32 °C.
Agriculture is the main economic sector in Benin. Agriculture contributes to 35% of the gross domestic product of Benin, 75% of export earnings, 15% of country revenue and provides about 70% of jobs [24]. Agriculture also contributes to ensuring food security in the country. It is largely subsistence agriculture, depending on rainfall, and therefore it is strongly impacted by climatic variability and especially the frequency and the intensity of extreme rainfall.
2.2. Data and Methods
In this study, observed rainfall data used are provided by the National Agency of Meteorology of Benin. The stations were selected after applying the quality control procedure of data by detecting missing values, remaining outliers and transcription errors for manual stations. Only stations with less than 5% of missing data over 1961–2016 in rainy seasons were considered. Then, extreme rainfall indices were extracted. Fifty-four (54) stations were considered (Figure 1). Data are considered over the period 1961–2016.
We investigated nine extreme rainfall indices recommended by the Expert Team on Climate Change Detection and Indices (ETCCDI) [8]. These indices capture not only the intensity and duration of changes in rainfall, but also the frequency of heavy precipitation events. The investigated extreme climate indices are shown in Table 1.
To assess extreme precipitation trends, we used the Mann–Kendall [25,26] test and the Theil–Sen slope [27,28]; The Student t-test is also used to find the significance of these changes.
2.2.1. Mann–Kendall Test
The Mann–Kendall test is a non-parametric test commonly used to detect monotonic trends in the series of meteorological data, hydrological data, environmental data, etc. [23,29,30,31]. The main advantages of Mann–Kendall test are the low sensitivity in homogeneous time series [32] and the non-requirement of normal distributed time series [33] since the test is non-parametric (distribution-free test). The null hypothesis (H0) shows no trend in the series and data, which come from an independent population, are identically distributed. The alternative hypothesis (H1) indicates that the data follow a monotonic trend (upward or downward trend). It is calculated following these equations.
where and are the annual values in years i and j, and
The mean of S is E[S] = 0 and the variance of S is computed by
where n is a number of data points, q is the number of tied groups and tp is the number of data values in the pth group.
Normal approximation (Z statistic) is generally used when the sample size is more than 10. Z statistic is given by Equation (4).
2.2.2. Theil–Sen Slope
2.2.3. Student’s t-Test
To assess whether the means of the projected periods are statistically different from the mean of the baseline period, the student’s t-test was used. Under the null-hypothesis of equal sample means and alternate hypothesis of unequal sample means, the t-statistic is calculated as [23]:
where and are, respectively, the means of projected and baseline periods; and are, respectively, the variance of projected and baseline periods; and and are, respectively, the sizes of projected and baseline periods.
If the difference between and are not statistically significant at the 95% confidence level.
If the difference between and are statistically significant at the 95% confidence level.
2.2.4. Rate of Change
The rate of change is estimated following Equation (7).
where is the mean of an extreme rainfall index over the period of 1991–2010, and is the mean of the same index over the period of 1971–1990.
2.2.5. Interpolation Method
The Kriging method [34,35,36] was used to interpolate extreme rainfall indices. The first step is to build the spatial structure of extreme rainfall indices by the semivariogram, simply called variogram. The spherical model, shown by Equation (8), was adopted to fit the sample semivariogram. The interpolation was completed using the fitted semivariogram. A regular grid point was adopted, and an ordinary Kriging which assumes unknown mean as well as second-order stationary process, was implemented.
where h is the distance between two rain gauges and S the sill and a is the range of the semivariogram.
3. Results and Discussion
3.1. Mean Climatology of Extreme Rainfall Indices
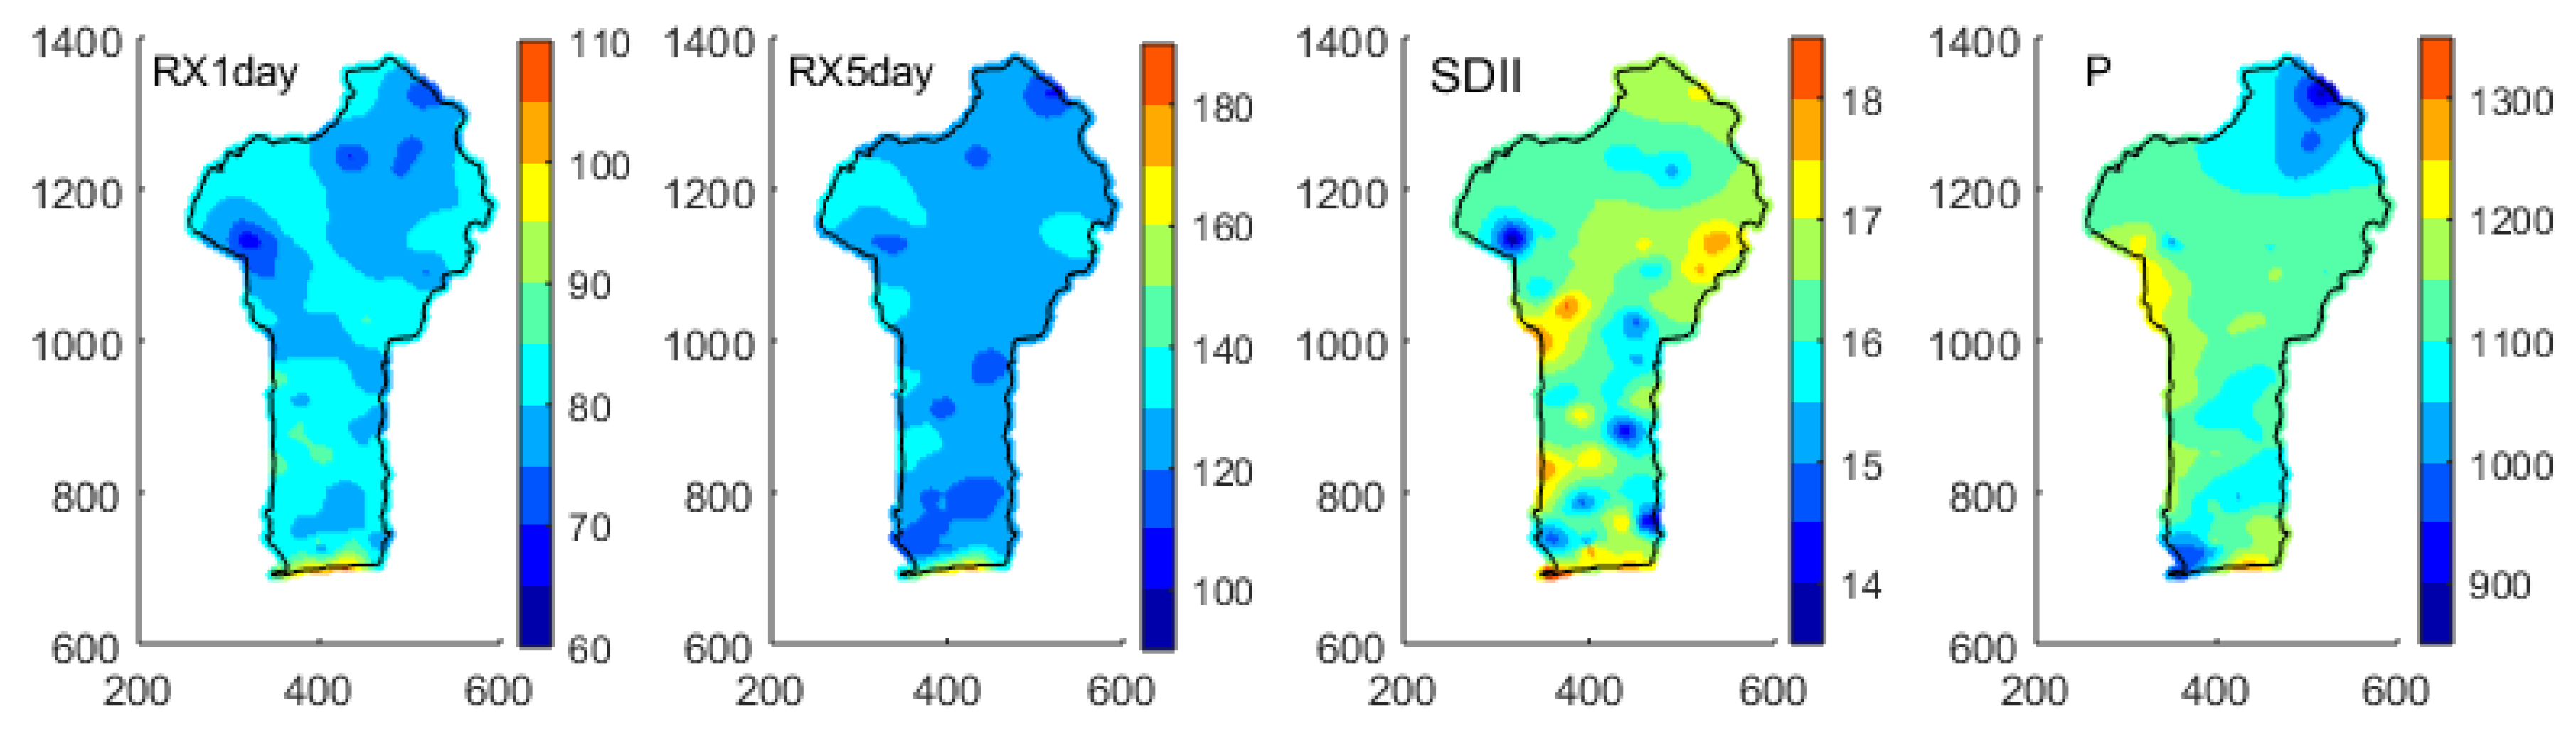
Figure 2 shows the mean climatology (1961–2016) of the precipitation intensity indices (RX1day, RX5day, SDII and P). From this figure, it is observed that the annual maximum one-day precipitation amount varies between 66.6 mm and 107.3 mm with an average of mm over Benin. The highest RX1day (more than 90 mm) are observed only in the coastal region. The annual maximum consecutive 5 days rainfall amount over Benin varies between 107.4 mm and 179.6 mm with an average of mm. The highest RX5day are also located in the coastal region of the country. A small variation of simple daily intensity index (SDII) is observed over Benin. The lowest SDII is around 13.5 mm/day and it is observed in the northwestern, southeastern and central parts of the country. Highest SDII of about 18.8 mm/day is found in the coastal region, as well as in the north. The average of SDII over the country is mm/day. Annual precipitation of wet days (P) varies between 882 mm and 1308.5 mm. The average of P over Benin is mm. The highest P are observed in the southern and in northwestern areas of the country. In general, high intensity indices are found in the southern areas. These findings are in line with [17] who found that the maximum average rainfall intensity indices are located in southern Ghana, while the minimum are found in the northwestern area. This can be explained by a large surface of evaporation over the Atlantic Ocean. The same results were obtained by Ref. [37] over Cameroon for SDII and P. In the northwestern area of Benin, there is sometimes high extreme rainfall because this region is a mountain region and therefore it is dominated by orographic precipitation. At a large scale, an upward trend pattern is detected from Sahel to the Gulf of Guinea coast in the West Africa for extreme rainfall intensity indices (P, SDII, RX1day and RX5day) with the highest values of intensity indices near highland regions [9].
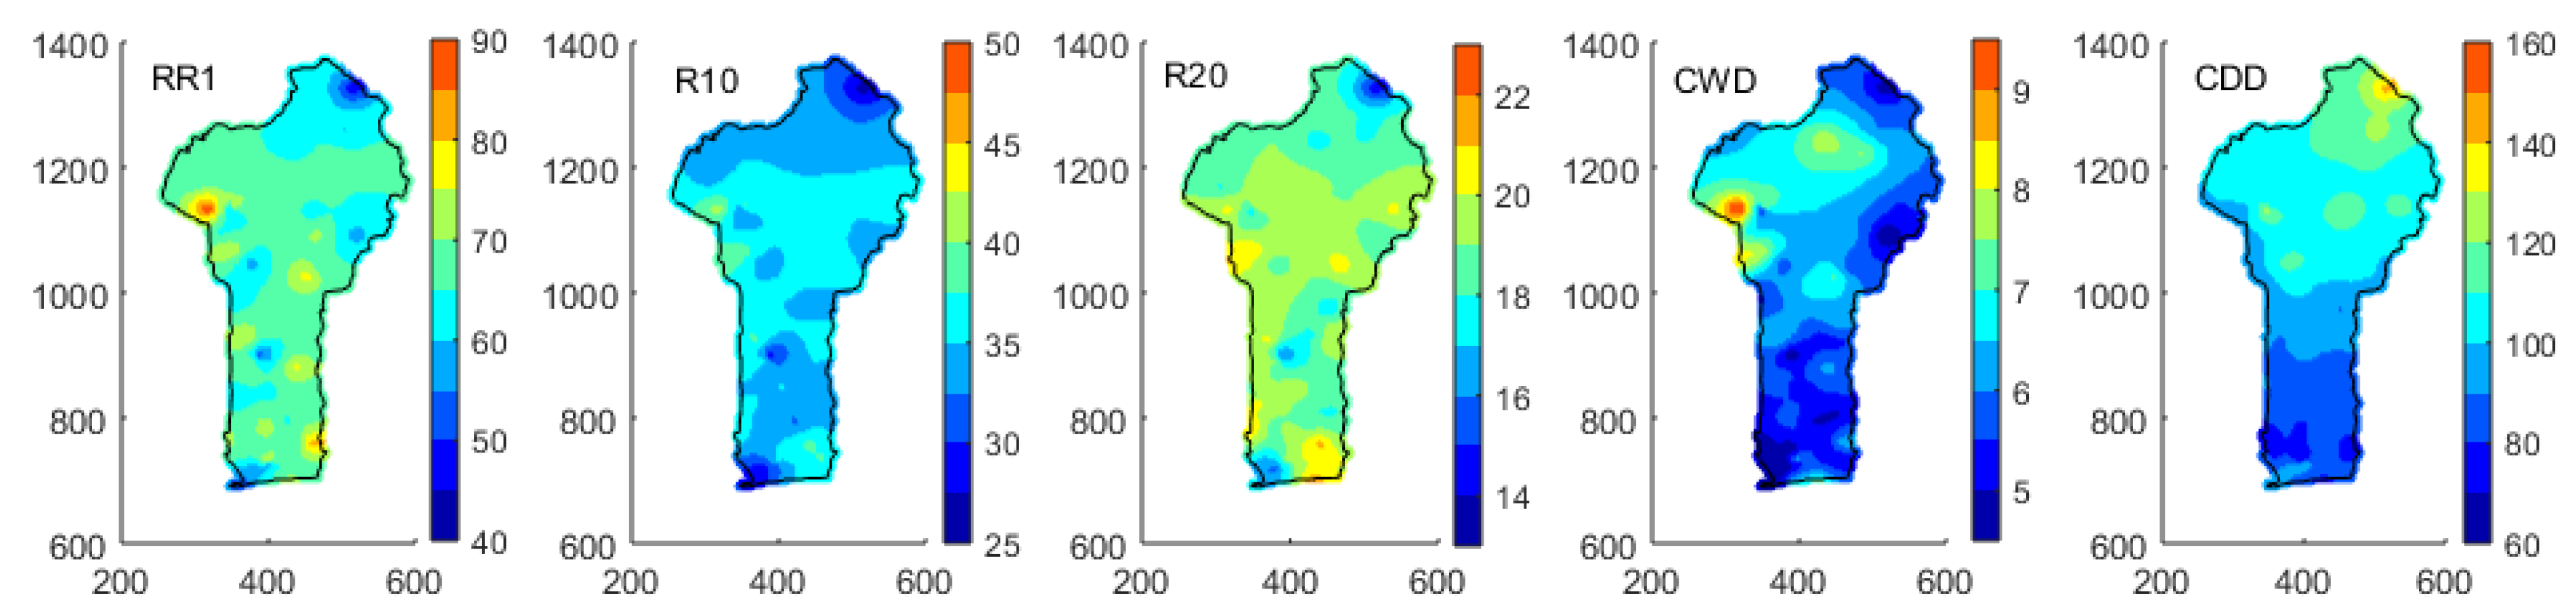
Figure 3 shows the mean climatology (1961–2016) of the extreme rainfall frequency indices (RR1, R10, R20, CWD and CDD). It is observed from this figure that the number of wet days (RR1) is between 46 days and 89 days over Benin. Its average is around days. The annual number of heavy wet days (R10) and very heavy wet days (R20) has the same spatial pattern over Benin. The annual frequency of R10 is in a range of 26 days to 42 days with an average of days, while very heavy rainfall (R20) is between 14 days and 22 days with an average of days. The lowest R10 and R20 are found in the north and in the center of Benin, and the highest R10 and R20 are observed in southeastern and northwestern areas of the country. The consecutive wet days (CWD) range from 4 to 10 days per year. The maximum rainy days are observed in the northwestern area of Benin which is a region of forest and mountain. The number of consecutive dry days (CDD) over Benin are between 71 and 146 days per year. Overall, CDD is relatively greater in the south than in the north. As we expected, CDD decreases from the North to the South of the country in contrast to the other frequency indices which generally follow the same pattern as the intensity indices. Consecutive dry days in the northern half of the country range between 100 and 146 days per year, while in the southern half we found 71–100 days per year. These findings are similar to the results of [17] over Ghana using 35 years of mean data. They indicated that CDD, CWD, R10, R20 are in the range of 10–125, 6–14, 30–60 and 8–24 days per year, respectively. A similar spatial variability of rainfall frequency indices was found over Cameroon [37]. Refs. [17,37] also found that frequency indices have approximate rainfall intensity patterns, except for consecutive dry days where the spatial south-north gradient is inverted.
3.2. Trends in Extreme Rainfall Indices
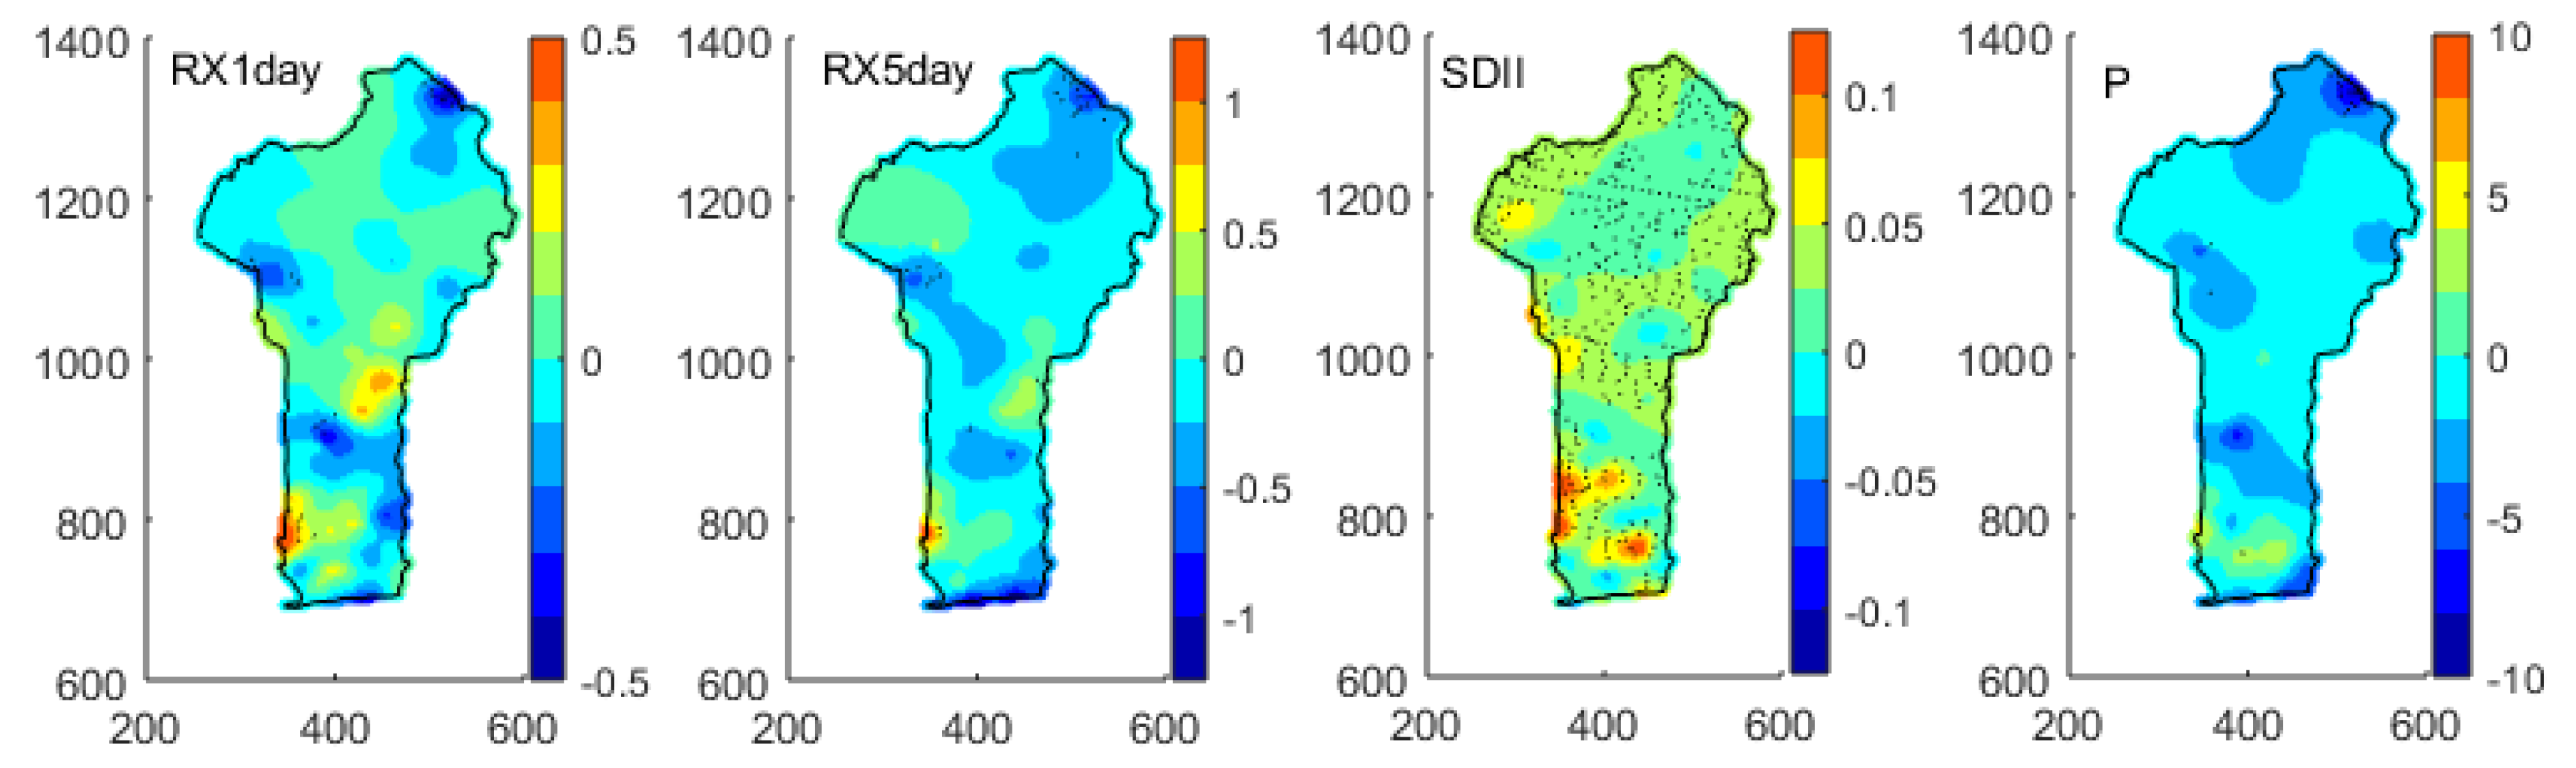
The spatial trends of the investigated rainfall indices for the period 1961–2016 are shown in Figure 4 and Figure 5. From Figure 4, it is observed that annual maximum one-day precipitation (RX1day) has non-significant positive trends (at 5% confidence level) ranging between 0 and 4.7 mm per decade over Benin, except in the northwestern and northeastern areas, and in some parts of central and south Benin, where non-significant (5% confidence level) increase trends (0 to 6 mm per decade) were found. The annual maximum consecutive 5 days rainfall amount (RX5day) over Benin shows non-significant downward trends (varying from 0 to 13 mm/decade), except in the northwestern and southwestern areas where non-significant increase trends (ranging from 0 to 12 mm/decade) are found. The annual wet day precipitation (P) shows non-significant downward trends over Benin. These drying trends vary between 0 and 8.7 mm/year. However, non-significant increase trends of annual wet day rainfall total are observed over a part of the south of Benin in the range of 0–4.9 mm/year. The simple daily intensity index (SDII) shows significant increase trends over Benin in the range of 0–1.6 mm/day/decade. These findings are in line with [17] who found a mix of increase and decrease trends for RX1day, RX5day, P and SDII over Ghana. A similar conclusion was made by [37] over Cameroon for P and SDII.
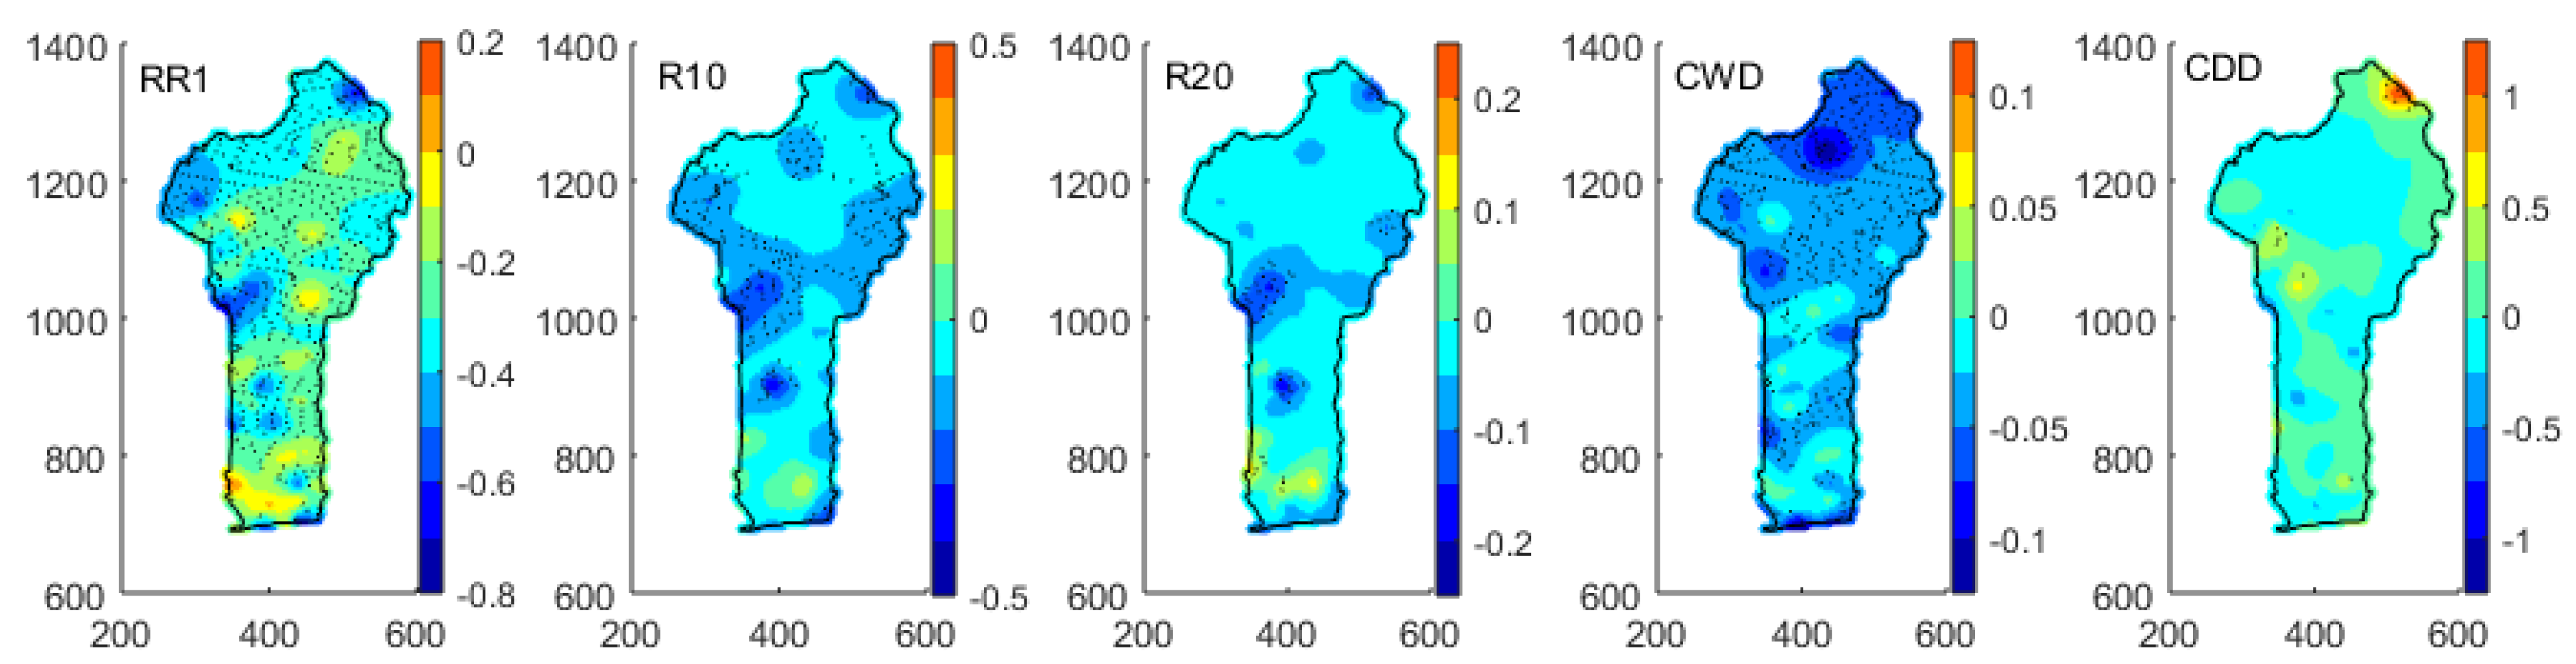
From Figure 5, it is observed that extreme rainfall frequency indicates a decrease trend from 1961 to 2016 over Benin. It is observed that the frequency of extreme rainfall shows a decrease in trends from 1961 to 2016 over Benin in general. The number of wet days (RR1) shows significant (at 5% confidence level) decrease trends in the range of 0–8 days/decades over the entirety of Benin. However, non-significant increase trends in few southeastern areas of the country are observed. The number of heavy wet days and the number of very heavy wet days have the same spatial trend pattern over Benin. These trends are the downward trends which vary from 0 to 4.2 days/decade for R10 and from 0 to days/decade for R20. The downward trends are mostly significant in the north of Benin for R10. Few areas of non-significant increase trends are also found in the south of the country for both R10 and R20. The consecutive wet days (CWD) indicate significant decrease trends in the range of 0–2 days per decade over Benin, while the consecutive dry days (CDD) show a mix of non-significant upward and downward trends over the country. Ref. [17] also indicated significant downward trends in wet indices across the Volta Lake and over central portions of Ghana, while small upward trends were found over northern parts of Ghana. The trend analysis over West Africa [9] shows a decrease of dry conditions in Sahara and Sahel, whereas an increasing trend in wet conditions was observed over western and southern Sahel.
3.3. Changes in Extreme Rainfall Indices
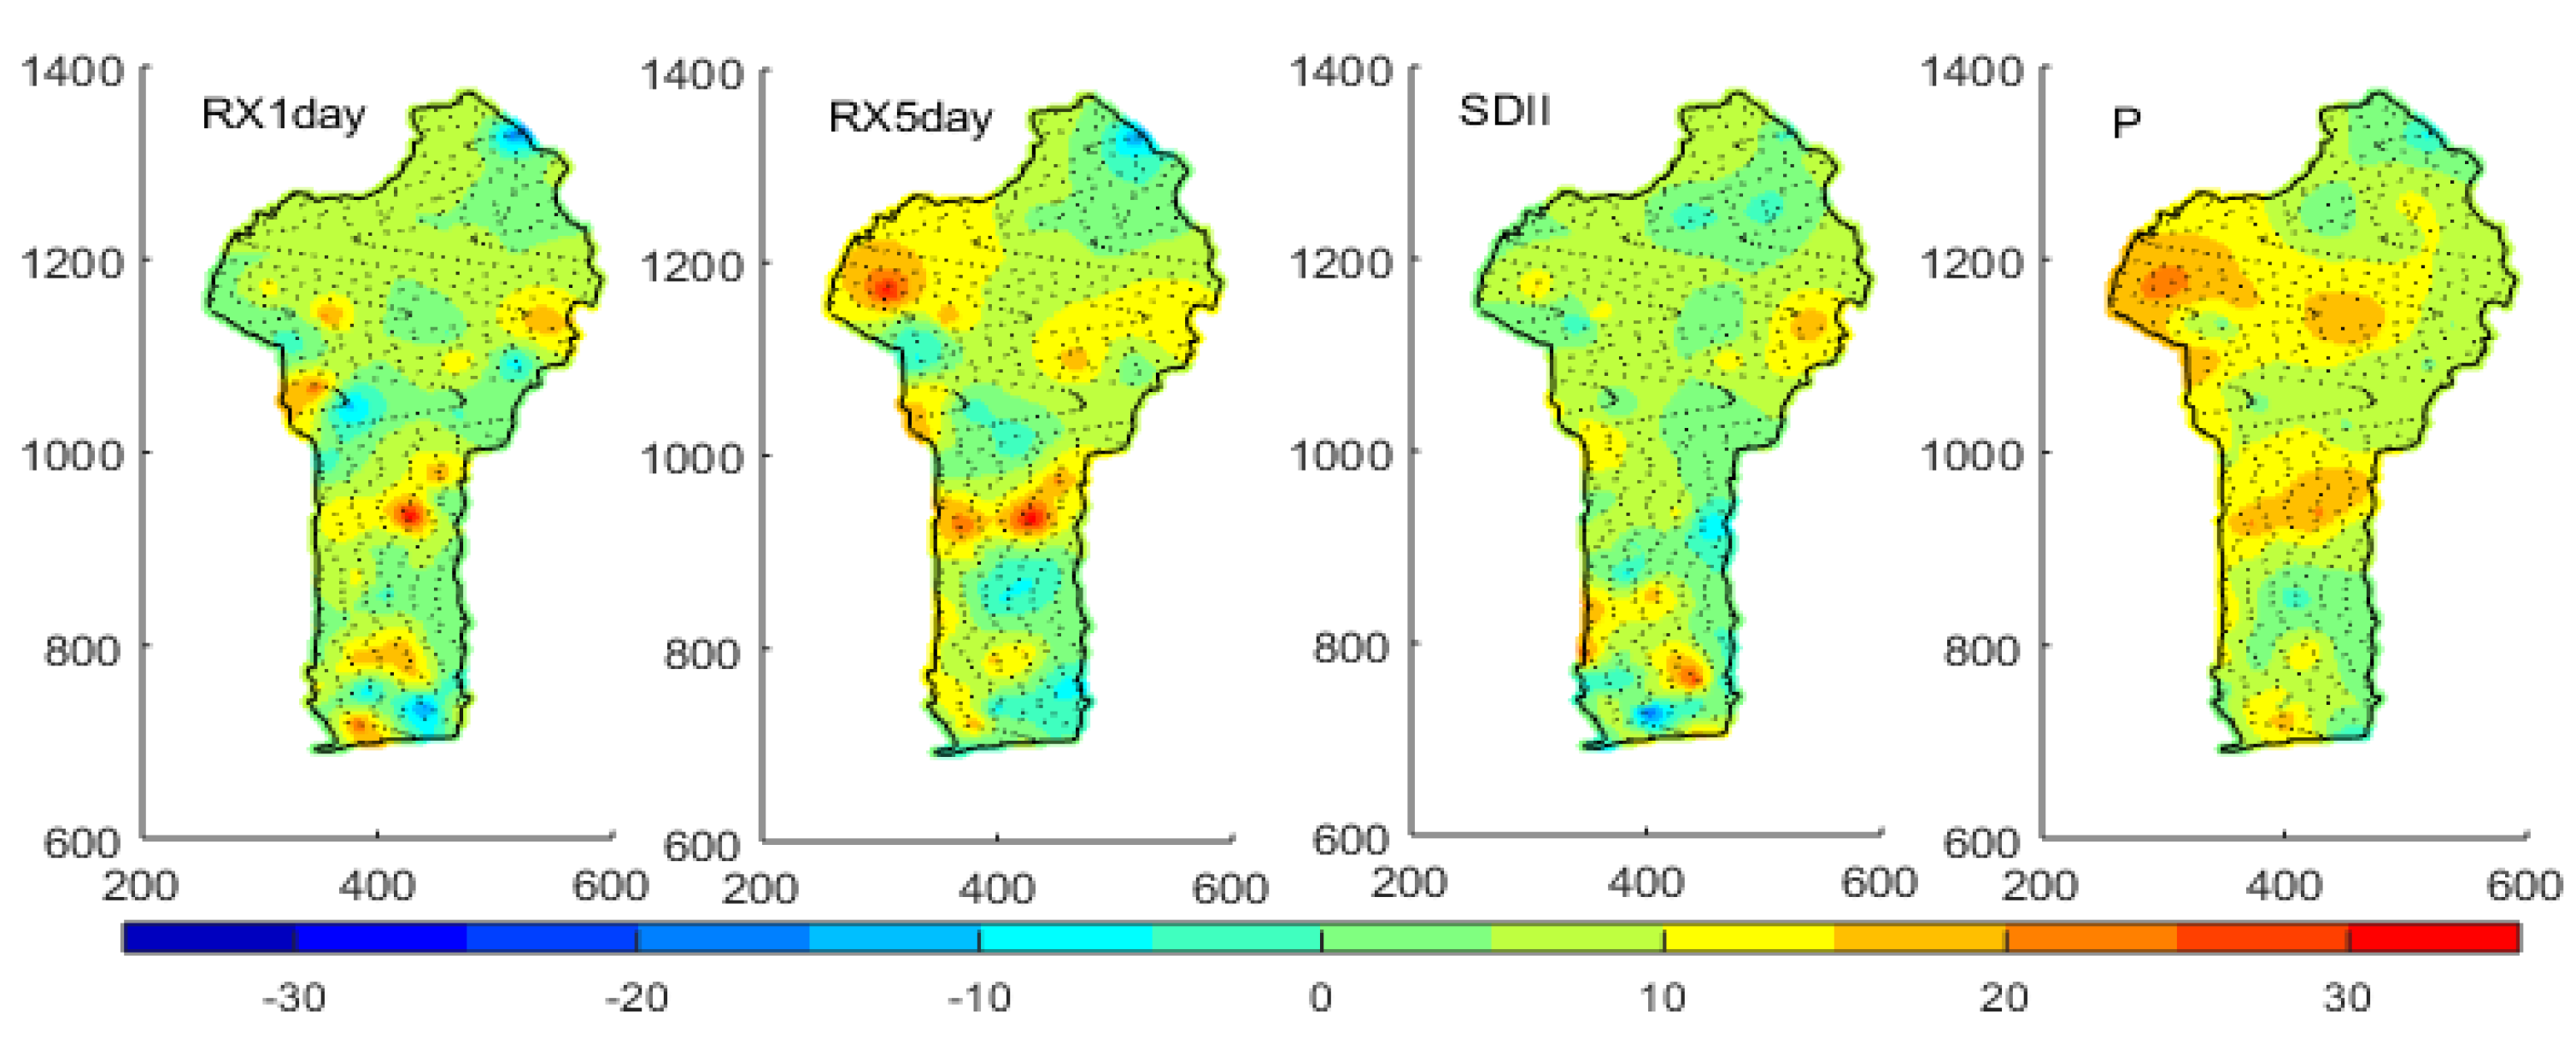
The spatial patterns of changes in the nine extreme rainfall indices over the period from 1991–2010 related to the baseline period (1971–1990) are shown in Figure 6 and Figure 7. From Figure 6, it is observed that the intensities of the extreme rainfall increased significantly at a 5% confidence level over 1991–2010 related to the baseline period. The annual maximum one-day precipitation (RX1day) has increased from 0 to 34% related to the baseline period over most parts of Benin. However, some areas across the country show a decrease in RX1day over 1991–2010 related to the baseline period. The simple daily intensity index (SDII) has the same pattern of change as RX1day. Likewise, the annual maximum 5 days precipitation amount (RX5day) and annual wet day rainfall total (P) over Benin also show the same pattern of changes over the period from 1991–2010 related to the baseline period. These changes are significant at a 5% confidence level. Positive changes are observed for RX5day and P over 1991–2010 related to the baseline period in the entire country. Positive changes vary from 0 to 35.9% for RX5day and from 0 to 29% for P. For both RX5day and P, the highest changes are found over the northwestern and central parts of Benin. However, few areas of significant decrease are found across the country.
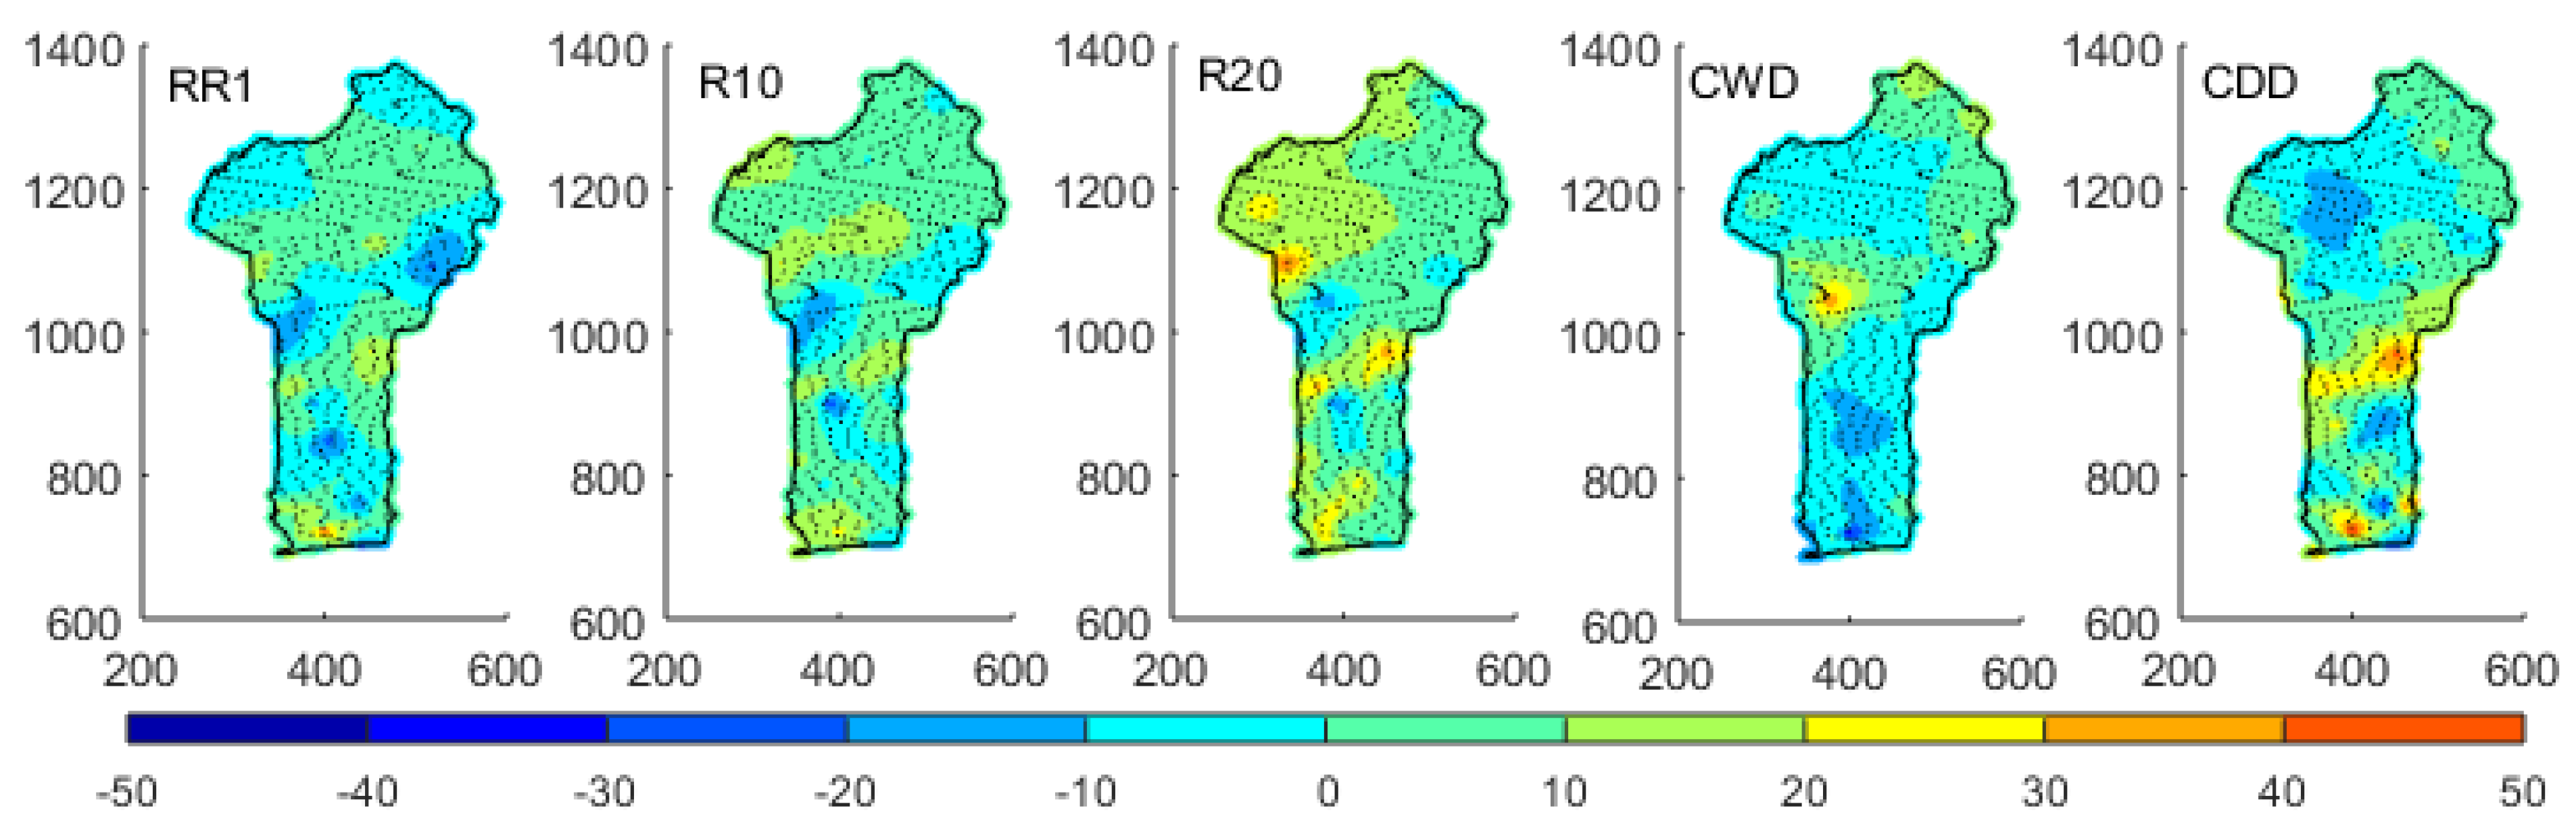
From Figure 7 it is observed that all the five investigated frequency indices show significant changes over the period 1991–2010 related to the period 1971–1990. A mix of increase and decrease changes is observed for the number of wet days (RR1) over Benin. The increase of RR1 is in the range of 0–40% and was observed in large parts of northern and central Benin. The highest increase change is found in the southern area; however this increase change covers few areas. In the other parts of the country we noticed a decrease of RR1 in the range of 0–24% over the period of 1991–2010 compared to the baseline period. The changes in heavy wet days (R10) and in very heavy wet days have the same spatial pattern. Over the period from 1991–2010, R10 and R20 have increased related to the period from 1971–1990. These increases are in the range of 0–28% for R10 and in the range of 0–41% for R20. However, we found in some areas of central Benin a decrease of R10 (ranging from 0–28%) and in R20 (ranging from 0–22%) over 1991–2010 related to the period 1971–1990. The consecutive wet days (CWD) mostly decrease over the period 1991–2010 compared to 1971–1990, except in some areas in the north where we found that CWD has increased. The consecutive dry days (CDD) over Benin show a mix of increase and decrease over the period 1991–2010 related to the period 1971–1990.
In general, we observed throughout Benin a significant increase of all investigated wet indices (P, RX1day, RX5day, SDII, R10 and R20) over 1991–2010 related to the period of 1971–1990, except for CWD, which mostly decreases. The increase in wet indices can be explained by the fact that the baseline period is a dry period in the whole of West Africa [38,39,40] and particularly in Benin [41] while, the period 1991–2010 is characterized by many authors (for example [41,42,43]) as a period of resumption of rainfall in West Africa. Decrease in CWD and RR1 over the period of 1991–2010 compared to 1971–1990 indicated that the resumption of rainfall over Benin, after the period of drought (1970s and 1980s), is not the consequence of an increase in wet days and consecutive wet days. This can be explained by the intensification of SDII, RX1day, RX5day, R10 and R20. This intensification in extreme precipitation has increased the flash flood occurrences and their socio-economic impact in the country. Indeed, Benin, similar to all West African countries, is particularly vulnerable to climate change due to high climate variability, high reliance on rain-fed agriculture, inadequate institutional capacity and limited economic capacity to face climate change impact.
3.4. Implication of Change in Extreme Rainfall and Proposal Solutions
Many studies have investigated the potential cause of extreme rainfall change over West Africa [9,17,44,45]. They state that West African extreme rainfall is highly influenced by the large scale ocean surface temperature and atmospheric conditions in the tropical Atlantic. Ref. [44] found that extreme rainfall on the Guinean coast is greatly associated with Atlantic sea surface temperature (SST) anomalies, the Northern Cold Tongue Index and with an opposite sign of Nino3.4. Over Benin, the North Atlantic Oscillation, Pacific Decadal Oscillation and Nino3 negatively influence precipitation, while Southern Oscillation, Antarctic Oscillation and Dipole Mode Index positively correlate with precipitation [45].
Changes assessment indicates a significant increase in all wet indices (P, RX1day, RX5day, SDII, R10 and R20) over the period of 1991–2010 related to the period of 1971–1990. This confirms that the intensification in rainfall events is mainly due to the increase in mean intensities of wet days as highlighted by [46] in Southern West Africa. The increase in all wet indices over Benin could explain the intensification of the hydrological cycle that led to an increase in the frequency and the intensity of floods in recent decades over Benin. Flooding can cause several damages such as soil erosion, crop destruction, livestock destruction, displacement of populations, proliferation of waterborne diseases and loss of human life. Agriculture, which is the main economic activity in Benin, is exceedingly vulnerable to extreme rainfall [6] because it is still at the stage of rain-fed agriculture. Ref. [6] showed that during extreme rainfall years, agriculture activities are disrupted. The excess or deficit in rainfall causes drops in agricultural production [6]. Any perturbation in agriculture can considerably affect the food system and thus increase the vulnerability of people in Benin. In addition, this lack in the agricultural calendar, due to climate variability and the intensification of extreme rainfall, has accentuated rural exodus. Many young people have left the fields for the cities because of agricultural yield problems. In general, through the impacts of the increase in intensity and frequency of extreme rainfall indices, the economy and food security of Benin should be highly affected. Therefore, to prevent food insecurity and to preserve the economy, some adaptive strategies have been proposed. These are:
- − Water harvesting and conservation
Several techniques are proposed for reducing the runoff coefficient of rainfall events in order to reduce the frequency and intensity of floods. This will involve promoting rain collection systems in homes (gutters and cisterns), and building small water reservoirs at village and district levels to develop agricultural production and livestock. The presence of these reservoirs can also promote infiltration and groundwater recharge.
- − Soil erosion mitigation
We suggest small arrangements in order to slow down the speed of the flow. These arrangements can be reforestation areas using trees, such as oil palm and caïlcedrat, or fodder species such as panicum and mucuna. Other arrangements such as bunds or the orientation of the furrows perpendicular to the direction of runoff are also recommended.
- − Capacity building of agriculture and sharing of experiences
Farmers must be regularly trained, on one hand on possible disruptions in the agricultural calendar due to the impact of climate change, and on the other hand in cultivation techniques such as off-season crops, irrigation. Bearing this in mind, we recommend strengthening the seasonal forecasting capacity of the National Meteorological Agency in order to impact as many farmers as much as possible. We also recommend the creation of experience-sharing crucibles between farmers, researchers and policy-makers.
- − Improved land-use and natural resource management policies and institutions
This will involve adopting laws to facilitate access to land and also to separate agricultural land from the corridors of livestock transhumance.
4. Conclusions
The spatio-temporal variability of rainfall is a challenge to food security and other socioeconomic activities over West Africa in general and over Benin in particular. Using observed rainfall data from 1961 to 2010, spatial variability, trends and changes of nine extreme rainfall indices have been analyzed over Benin. Mean climatology of extreme rainfall indices are in the range of 66.6–107.3 mm, 107.4–179.6 mm, 13–18.8 mm/day, 882–1308.5 mm, 46–89 days, 26–42 days, 14–22 days, 4–10 days and 71–146 days for RX1day, RX5day, SDII, P, RR1, R10, R20, CWD and CDD, respectively. Trends analysis for extreme rainfall intensity indicates a mix of downward and upward trends for both RX1day and RX5day. A decrease trend is observed for P over Benin, while a significant increase is found for SDII. For extreme rainfall frequency, RR1 and CDD show a mix of increase and decrease trends over Benin. RR1 show significant trends, while the trends of CDD are not significant. R10, R20 and CWD show decrease trends which are significant in the northern area of Benin for R10 and R20, but significant in most areas of Benin for CWD.
Changes assessment indicates a significant increase in all wet indices (P, RX1day, RX5day, SDII, R10 and R20) over the period of 1991–2010 related to 1971–1990, except for CWD which mostly decreases. Such a study is very vital in this area where the planning of economic activities such as agriculture, hydropower management, and civil engineering is usually influenced by rainfall variability. The results of this study can be useful to better understand the climate in Benin. Consequently, it is very important for Beninese policy makers to define adaptation strategies and mitigation measures against climate change and its impacts on society. We recommended practical methods for water harvesting and conservation and for soil erosion mitigation to reduce runoff and flood frequency and intensity, and drought occurrence. Capacity building of farmers, improved land-use and natural resource management policies and institutions and the sharing of experiences between farmers, researchers and policy-makers are also recommended to improve agriculture yields in the context of climate change to avoid food insecurity problems.
Author Contributions
E.O., E.A.A., E.I.B. and E.B.J.Z. designed the study, developed the methodology and wrote the manuscript; E.O. performed the field work, collected the data and conducted the computer analysis. All authors have read and agreed to the published version of the manuscript.
Funding
This work has been funded by the International Foundation For Science (IFS) under IFS grant No. I-2-W-6111-1. The authors then acknowledge the IFS for this great support.
Institutional Review Board Statement
Not applicable.
Acknowledgments
All authors thank reviewers for they very helpful contribution.
Conflicts of Interest
The authors declare no conflict of interest.
References
- Fowler, H.J.; Ali, H.; Allan, R.P.; Ban, N.; Barbero, R.; Berg, P.; Blenkinsop, S.; Cabi, N.S.; Chan, S.; Dale, M.; et al. Towards advancing scientific knowledge of climate change impacts on short-duration rainfall extremes. Philos. Trans. R. Soc. 2021, 379, 20190542. [Google Scholar] [CrossRef]
- Bengtsson, L.; Rana, A. Long-term change of daily and multi-daily precipitation in southern Sweden. Hydrol. Process. 2014, 28, 2897–2911. [Google Scholar] [CrossRef]
- Du, H.; Xia, J.; Zeng, S.D.; She, D.X.; Liu, J.J. Variations and statistical probability characteristic analysis of extreme precipitation events under climate in Haihe River Basin, China. Hydrol. Process. 2014, 28, 913–925. [Google Scholar] [CrossRef]
- Mei, C.; Liu, J.; Chen, M.T.; Wang, H.; Li, M.; Yu, Y. Multi-decadal spatial and temporal changes of extreme precipitation patterns in northern China (Jing-Jin-Ji district, 1960–2013). Quat. Int. 2018, 476, 1–13. [Google Scholar] [CrossRef]
- Vogel, E.; Donat, M.G.; Alexander, L.V.; Meinshausen, M.; Ray, D.K.; Karoly, D.; Meinshausen, N.; Frieler, K. The effects of climate extremes on global agricultural yields. Environ. Res. Lett. 2019, 14, 054010. [Google Scholar] [CrossRef]
- Yabi, I.; Afouda, F. Extreme rainfall years in Benin (West Africa). Quat. Int. 2012, 262, 39–43. [Google Scholar] [CrossRef]
- Ologunorisa, T.E.; Tersoo, T. The changing rainfall pattern and its implication for flood frequency in Makurdi, Northern Nigeria. J. Appl. Sci. Environ. Manag. 2006, 10, 97–102. [Google Scholar] [CrossRef] [Green Version]
- Zhang, X.; Alexander, L.; Hegerl, G.C.; Jones, P.; Tank, A.K.; Peterson, T.C.; Trewin, B.; Zwiers, F.W. Indices for monitoring changes in extremes based on daily temperature and precipitation data, WIREs. Clim. Chang. 2011, 2, 851–870. [Google Scholar]
- Diatta, S.; Diedhiou, C.W.; Dione, D.M.; Sambou, S. Spatial Variation and Trend of Extreme Precipitation in West Africa and Teleconnections with remote indices. Atmosphere 2020, 11, 999. [Google Scholar] [CrossRef]
- Katz, R.W.; Brown, B.G. Extreme events in a changing climate: Variability is more important than averages. Clim. Chang. 1992, 21, 289–302. [Google Scholar] [CrossRef]
- Donat, M.G.; Lowry, A.L.; Alexander, L.V.; O’Gorman, P.A.; Maher, N. More extreme precipitation in the world’s dry and wet regions. Nat. Clim. Chang. 2016, 6, 508–513. [Google Scholar] [CrossRef]
- Gao, T.; Wang, H.J.; Zhou, T. Changes of extreme precipitation and nonlinear influence of climate variables over monsoon region in China. Atmos. Res. 2017, 197, 379–389. [Google Scholar] [CrossRef]
- Wu, Y.; Polvani, L.M. Recent Trends in Extreme Precipitation and Temperature over Southeastern South America: The Dominant Role of Stratospheric Ozone Depletion in the CESM Large Ensemble. J. Clim. 2017, 30, 6433–6441. [Google Scholar] [CrossRef]
- Kirchmeier-Younga, M.C.; Zhanga, X. Human influence has intensified extreme precipitation in the North America. Proc. Natl. Acad. Sci. USA 2020, 117, 13308–13313. [Google Scholar] [CrossRef] [PubMed]
- Zeder, J.; Fischer, E.M. Observed extreme precipitation trends and scaling in Central Europe. Weather Clim. Extrem. 2020, 29, 100266. [Google Scholar] [CrossRef]
- Odoulami, R.C.; Akinsanola, A.A. Recent assessment of West African summer monsoon daily rainfall trends. Weather 2018, 73, 283–287. [Google Scholar] [CrossRef]
- Atiah, W.A.; Tsidu, G.M.; Amekudzi, L.K.; Yorke, C. Trends and interannual variability of extreme rainfall indices over Ghana, West Africa. Theor. Appl. Climatol. 2020, 140, 1393–1407. [Google Scholar] [CrossRef]
- André Attogouinon, A.; Lawin, A.E.; M’Po, Y.N.; Houngue, R. Extreme Precipitation Indices Trend Assessment over the Upper Oueme River Valley-(Benin). Hydrology 2017, 4, 36. [Google Scholar] [CrossRef] [Green Version]
- N’Tcha M’Po, Y.; Lawin, A.E.; Yao, B.K.; Oyerinde, G.T.; Attogouinon, A.; Afouda, A.A. Decreasing Past and Mid-Century Rainfall Indices over Ouémé River Basin, Benin (West Africa). Climate 2017, 5, 74. [Google Scholar] [CrossRef] [Green Version]
- Hounguè, R.; Lawin, A.E.; Moumouni, S.; Afouda, A.A. Change in Climate Extremes and Pan Evaporation Influencing Factors over Ouémé Delta in Benin. Climate 2019, 7, 2. [Google Scholar] [CrossRef] [Green Version]
- Hounkpè, J.; Diekkrüger, B.; Badou, D.; Afouda, A. Change in Heavy Rainfall Characteristics over the Ouémé River Basin, Benin Republic, West Africa. Climate 2016, 4, 15. [Google Scholar] [CrossRef] [Green Version]
- Judex, M.; Thamm, H.P. IMPETUS Atlas Benin Research Results 2000–2007, 3rd ed.; IMPETUS Projet: Bonn, Germany, 2008. [Google Scholar]
- Obada, E.; Alamou, A.E.; Chabi, A.; Zandagba, J.; Afouda, A. Trends and Changes in Recent and Future Penman-Monteith Potential Evapotranspiration in Benin (West Africa). Hydrology 2017, 4, 38. [Google Scholar] [CrossRef] [Green Version]
- Programme Alimentaire Mondial des Nations Unies (PAM), Analyse Globale de la Vulnérabilité et de la Sécurité Alimentaire (AGVSA) en République du Bénin, Rapport. 2014. Available online: https://documents.wfp.org/stellent/groups/public/documents/ena/wfp203247.pdf (accessed on 15 October 2021).
- Mann, H.B. Nonparametric tests against trend. Econometrica 1945, 13, 245–259. [Google Scholar] [CrossRef]
- Kendall, M. Rank Correlation Methods; Oxford University Press: Oxford, UK, 1948. [Google Scholar]
- Theil, H. A Rank-Invariant Method of Linear and Polynomial Regression Analysis. In Henri Theil’s Contributions to Economics and Econometrics; Raj, B., Koerts, J., Eds.; Advanced Studies in Theoretical and Applied Econometrics; Springer: Dordrecht, The Netherlands, 1992; Volume 23, pp. 345–381. ISBN 978-94-010-5124-8. [Google Scholar]
- Sen, P.K. Estimates of the Regression Coefficient Based on Kendall’s Tau. J. Am. Stat. Assoc. 1968, 63, 1379–1389. [Google Scholar] [CrossRef]
- Partal, T.; Kahya, E. Trend analysis in Turkish precipitation data. Hydrol. Process. 2006, 20, 2011–2026. [Google Scholar] [CrossRef]
- Yu, X.; Zhao, G.; Zhao, W.; Yan, T.; Yuan, X. Analysis of Precipitation and Drought Data in Hexi Corridor, Northwest China. Hydrology 2017, 4, 29. [Google Scholar] [CrossRef] [Green Version]
- Bera, S. Trend Analysis of Rainfall in Ganga Basin, India during 1901–2000. Am. J. Clim. Chang. 2017, 6, 116–131. [Google Scholar] [CrossRef] [Green Version]
- Jaagus, J. Trends in Sea Ice Conditions in the Baltic Sea near the Estonia, Coast during the Period 1949/1950–2003/2004 and Their Relationships to Large Scale Atmospheric Circulation. Boreal Environ. Res. 2006, 11, 169–183. [Google Scholar]
- Tabari, H.; Talaee, P.H. Temporal Variability of Precipitation over Iran: 1966–2005. J. Hydrol. 2011, 396, 313–320. [Google Scholar] [CrossRef]
- Arnaud, M.; Emery, X. Estimation and Spatial Interpolation: Deterministic Methods and Geostatistics Methods; Hermès: Paris, France, 2000; p. 221. [Google Scholar]
- Cressie, N. Statistics for Spatial Data; Wiley: New York, NY, USA, 1992; pp. 613–617. [Google Scholar]
- Matheron, G. Regionalized variables theory and its applications. In Note Book of Mathematical Morphology Centre; Fasc. 5 EMP: Paris, France, 1971; p. 212. [Google Scholar]
- Voundou, D.A.; Guenang, G.M.; Djiotang, T.L.A.; Kamsu-Tamo, P.H. Trends and Interannual Variability of Extreme Rainfall Indices over Cameroon. Sustainability 2021, 13, 6803. [Google Scholar] [CrossRef]
- Le Barbé, L.; Lebel, T.; Tapsoba, D. Rainfall variability in West Africa during the years 1950–1990. J. Clim. 2002, 15, 187–202. [Google Scholar] [CrossRef]
- Paturel, J.E.; Servat, E.; Delattre, M.O. Analyse de séries pluviométriques de longue durée en Afrique de l’Ouest et Centrale non sahélienne dans un contexte de variabilité climatique. J. Des. Sci. Hydrol. 1998, 43, 937–945. [Google Scholar] [CrossRef]
- Ozer, P.; Laminou, M.O.; Hountondji, Y.C. Evolution des caractéristiques pluviométriques dans l’Est du Niger de 1940 à 2007. Geo-Eco-Trop 2009, 33, 11–30. [Google Scholar]
- Lebel, T.; Ali, A. Recent trends in the Central and Western Sahel rainfall regime (1990–2007). J. Hydrol. 2009, 375, 52–64. [Google Scholar] [CrossRef]
- Ozer, P.; Laminou, M.O.; Tidjani, A.D.; Djaby, B.; De Longueville, F. Evolution récente des extrêmes pluviométriques au Niger (1950–2014). Geo-Eco-Trop 2017, 41, 375–383. [Google Scholar]
- Nouaceur, Z. la reprise des pluies et la recrudescence des inondations en Afrique de l’Ouest sahélienne. Physio-Géo 2020, 15. [Google Scholar] [CrossRef] [Green Version]
- Ta, S.; Kouadio, K.Y.; Ali, K.E.; Toualy, E.; Aman, A.; Yoroba, F. West Africa extreme rainfall events and large-scale ocean surface and atmospheric conditions in the Tropical Atlantic. Adv. Meteorol. 2016, 2016, 1940456. [Google Scholar] [CrossRef] [Green Version]
- Ahokpossi, Y. Analysis of the rainfall variability and change in the Republic of Benin (West Africa). Hydrol. Sci. J. 2019, 63, 2097–2123. [Google Scholar] [CrossRef]
- Nkrumah, F.; Vischel, T.; Panthou, G.; Klutse, N.A.B.; Adukpo, D.C.; Diedhiou, A. Recent trends in daily rainfall regime in southern West Africa. Atmosphere 2019, 10, 741. [Google Scholar] [CrossRef] [Green Version]
Figure 1.
Study area and rain gauges’ location.

Figure 2.
Mean climatology of rainfall intensity indices over the period of 1961–2016 in Benin (RX1day, RX5day and P in mm; SDII in mm/day).
Figure 2.
Mean climatology of rainfall intensity indices over the period of 1961–2016 in Benin (RX1day, RX5day and P in mm; SDII in mm/day).

Figure 3.
Mean climatology of rainfall frequency indices (days) over the period 1961–2016 in Benin.

Figure 4.
Trends in extreme rainfall intensity indices (mm/year) over the period 1961–2016 (hatching area indicates significant trends at 5% confidence level).
Figure 4.
Trends in extreme rainfall intensity indices (mm/year) over the period 1961–2016 (hatching area indicates significant trends at 5% confidence level).

Figure 5.
Trends in extreme rainfall frequency indices (days/year) over the period 1961–2016 in Benin (hatching area indicates significant trends at 5% confidence level).
Figure 5.
Trends in extreme rainfall frequency indices (days/year) over the period 1961–2016 in Benin (hatching area indicates significant trends at 5% confidence level).

Figure 6.
Changes in extreme rainfall intensity indices (%) between the periods of 1971–1990 and 1991–2010 over Benin (hatching area indicates significant changes at 5% confidence level).
Figure 6.
Changes in extreme rainfall intensity indices (%) between the periods of 1971–1990 and 1991–2010 over Benin (hatching area indicates significant changes at 5% confidence level).

Figure 7.
Changes in extreme rainfall frequency indices (%) between the periods of 1971–1990 and 1991–2010 over Benin (hatching area indicates significant changes at 5% confidence level).
Figure 7.
Changes in extreme rainfall frequency indices (%) between the periods of 1971–1990 and 1991–2010 over Benin (hatching area indicates significant changes at 5% confidence level).


Table 1.
Extreme rainfall indices.
| Common Name | Indices | Description | Units |
|---|---|---|---|
| Number of Wet days | RR1 | Annual count of days with PRCP ≥ 1 mm | days |
| Consecutive dry days | CDD | Maximum number of consecutive days with PRCP < 1 mm | days |
| Consecutive wet days | CWD | Maximum number of consecutive days with PRCP ≥ 1 mm | days |
| Number of heavy precipitation | R10 | Annual count of days when PRCP ≥ 10 mm | days |
| Number of very heavy precipitation | R20 | Annual count of days when PRCP ≥ 20 mm | days |
| Max 1-day precipitation amount | RX1day | Annual maximum 1-day precipitation | mm |
| Max 5-day precipitation amount | RX5day | Annual maximum consecutive 5-day precipitation | mm |
| Annual precipitation total of wet day | P | Annual precipitation | mm |
| Simple daily intensity index | SDII | Annual total precipitation divided by the number of wet days (defined as PRCP ≥ 1.0 mm) in the year | mm/days |
Publisher’s Note: MDPI stays neutral with regard to jurisdictional claims in published maps and institutional affiliations. |
© 2021 by the authors. Licensee MDPI, Basel, Switzerland. This article is an open access article distributed under the terms and conditions of the Creative Commons Attribution (CC BY) license (https://creativecommons.org/licenses/by/4.0/).
Share and Cite
MDPI and ACS Style
Obada, E.; Alamou, E.A.; Biao, E.I.; Zandagba, E.B.J. Interannual Variability and Trends of Extreme Rainfall Indices over Benin. Climate 2021, 9, 160. https://doi.org/10.3390/cli9110160
AMA Style
Obada E, Alamou EA, Biao EI, Zandagba EBJ. Interannual Variability and Trends of Extreme Rainfall Indices over Benin. Climate. 2021; 9(11):160. https://doi.org/10.3390/cli9110160
Chicago/Turabian StyleObada, Ezéchiel, Eric Adechina Alamou, Eliezer Iboukoun Biao, and Esdras B. Josué Zandagba. 2021. "Interannual Variability and Trends of Extreme Rainfall Indices over Benin" Climate 9, no. 11: 160. https://doi.org/10.3390/cli9110160
Note that from the first issue of 2016, this journal uses article numbers instead of page numbers. See further details here.