1. Introduction
Recent studies have shown that both precipitation and precipitable water have increased in many regions of North America as the atmosphere has warmed over the last century [
1,
2,
3,
4]. Karl and Knight [
5] found a 10% increase in annual precipitation in the United States between 1910 and 1996 with over half of this increase coming from the upper 10th percentile of daily precipitation. Higgins
et al. [
6] also found that daily precipitation events, heavy precipitation, and total annual rainfall have increased over much of the western U.S. during the last 5 decades. Furthermore, atmospheric rivers (AR), such as the Pineapple Express, bring extreme storms to coastal California. Climate change projections suggest there may be more landfalling AR events in California in the coming decades, with more years having many ARs, leading to more frequent extreme storms [
7]. On the long-term averages, atmospheric rivers contribute 20%–50% of the state’s total precipitation [
8].
In recent decades warmer climate has led to changes in the California hydrological cycle that influences state water supplies. These include the decreasing spring snowpack [
9], earlier snowmelt runoff [
10] and trends towards more precipitation falling as rain rather than snow [
11]. These changes herald lessening California water supplies. However, increasing precipitation could counter these trends.
Another variable to consider in recent decadal precipitation time series is natural variability. In the western United States, natural cycles also account for large interannual to decadal changes in precipitation. The Pacific Decadal Oscillation (PDO) is a multidecadal shift in North Pacific sea surface temperatures (SST) and consists of a warm, positive phase and a cool, negative phase. The warm phase is characterized by above normal SSTs in the eastern North Pacific and cooler than normal SSTs in the western North Pacific. In contrast, SST configurations during the cool phase are opposite those of the warm phase [
12]. When comparing the 1948–1975 period to the later 1976–2004 years, Higgins
et al. [
6] found that the large increase in total precipitation in the western United States could be explained by the warm phase of the Pacific Decadal Oscillation. More recently the PDO shifted from a warm to cool phase around 1998 and precipitation has decreased in the western United States. This PDO-precipitation connection especially explained the increases in heaviest precipitation (heavy precipitation was defined as the top 10% of daily totals) [
6]. The impacts of El Niño events on precipitation parallel those associated with the warm PDO phase. El Niño events have been linked to greater precipitation in California, with strong, Type 1 El Niños averaging between 113% and 174% of normal rainfall for the water year (1 July–30 June) by climatic divisions [
13]. For southern California, climatic impacts associated with cool PDO phases are similar to those tied to La Niña, both of which generally lead to decreased precipitation (see discussion below). Decadal-scale oceanic fluctuations account for 20 to 45 percent of annual precipitation variance in the West [
14], and California climate is significantly modified by these interdecadal and interannual climate shifts.
Here, we consider rainfall trends in California over a much longer period than previous studies. These longer-termed records allow us to test for trends in the presence of strong interannual to decadal variability and to determine if rainfall and precipitation intensity is increasing similar to other regions of the U.S. The records also allow us to test for the influence of climate change on California precipitation trends.
2. Data and Methods
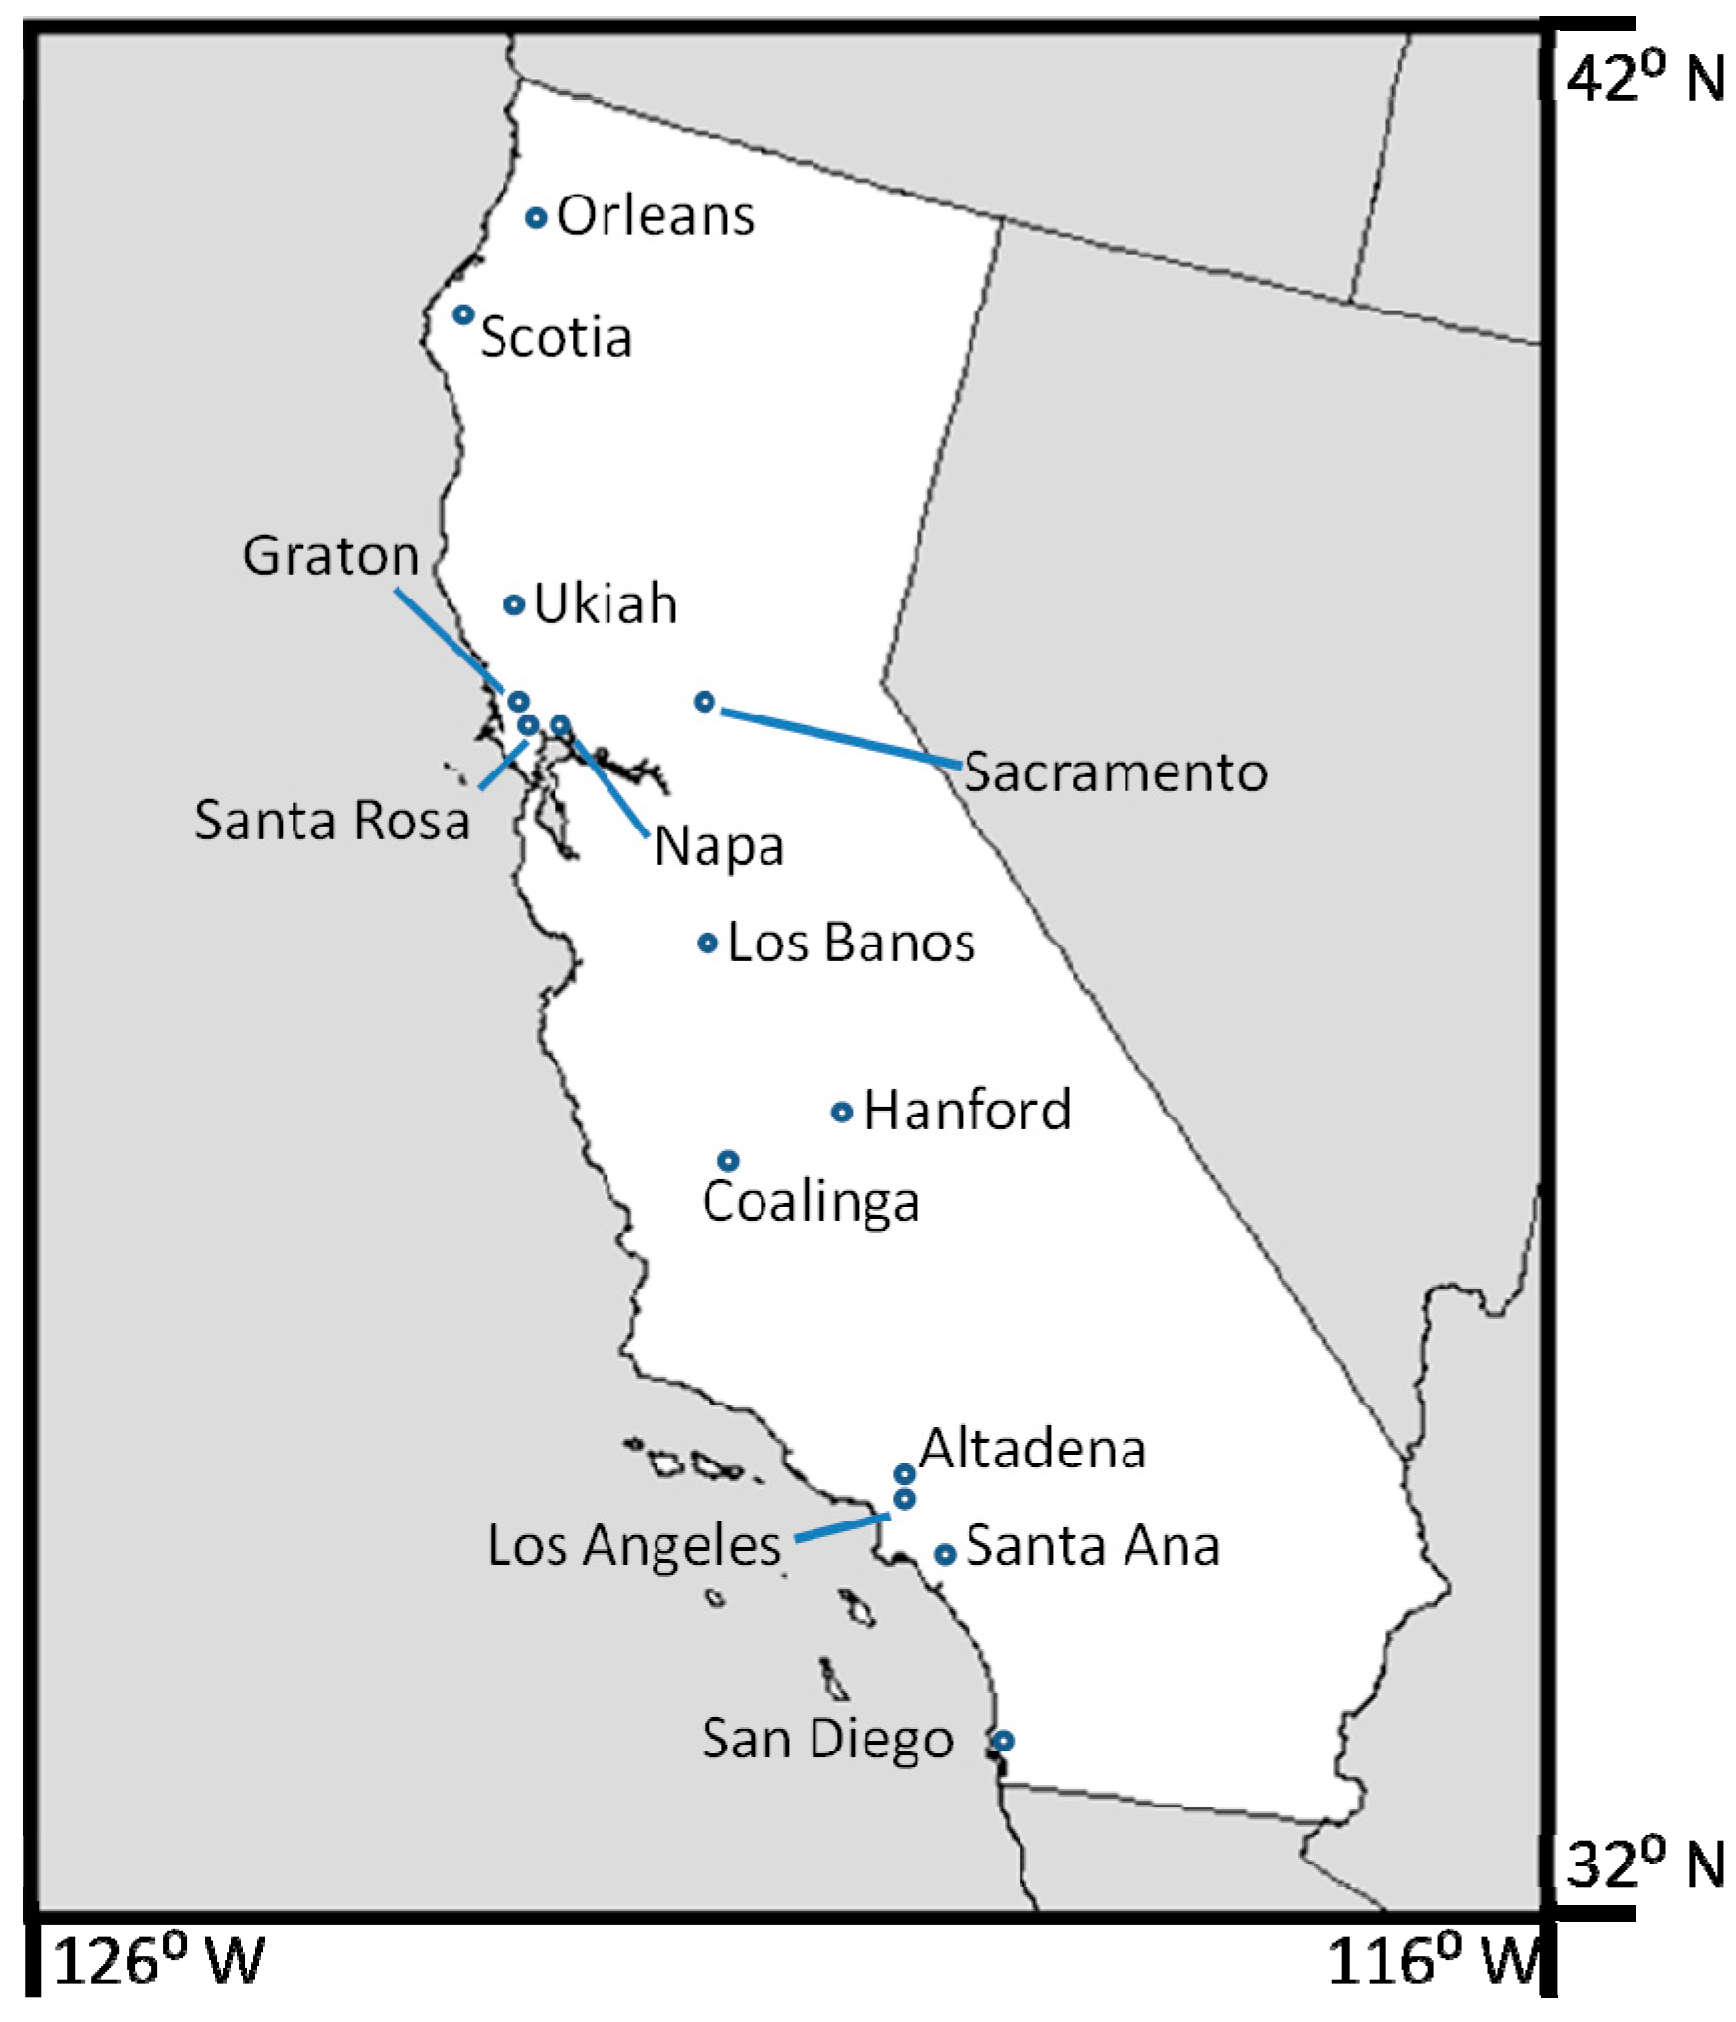
To investigate trends in California precipitation, daily precipitation records for state stations retrieved from the NOAA National Climate Data Center (NCDC) were evaluated. Fourteen records from meteorology stations (
Figure 1) from various regions of the state met our criteria for extending continuously over long periods (since at least 1925). The two longest records are for Los Angeles and Sacramento, which extend from 1878 to present (
Figure 2). These long records are important for testing robustness of trends and for establishing regional precipitation patterns in California. Trends in annual and seasonal precipitation were calculated for all sites investigated and confidence intervals computed assuming that each year is independent.
Figure 1.
Index map showing station locations.
Figure 1.
Index map showing station locations.
Daily data were also analyzed for trends in intensity and frequency of precipitation events for the Los Angeles and Sacramento records. Rain frequency is defined as the number of days with a measurable (>0.25 mm) amount of rain and intensity is defined as mm of rainfall per day averaged over the days with measurable rainfall.
Monthly and annual precipitation data from 1895 to 2011 were also acquired for the eleven California climate divisions and for the entire state from the Western Regional Climate Center (WRCC), Desert Research Institute, Reno, NV California Climate Tracker: [
15]. Annual precipitation values are based on water years, 1 July–30 June, as the rainy season in California generally lasts from late fall through early spring. Annual precipitation trends and 95% confidence intervals are calculated for three periods: 1895–2011, 1949–2011, and 1975–2011 by climate division. The span of the three periods was determined by the WRCC and was used to show non-linearity Trends and 95% confidence intervals are also calculated by climatic divisions for each meteorological season, for the same three periods.
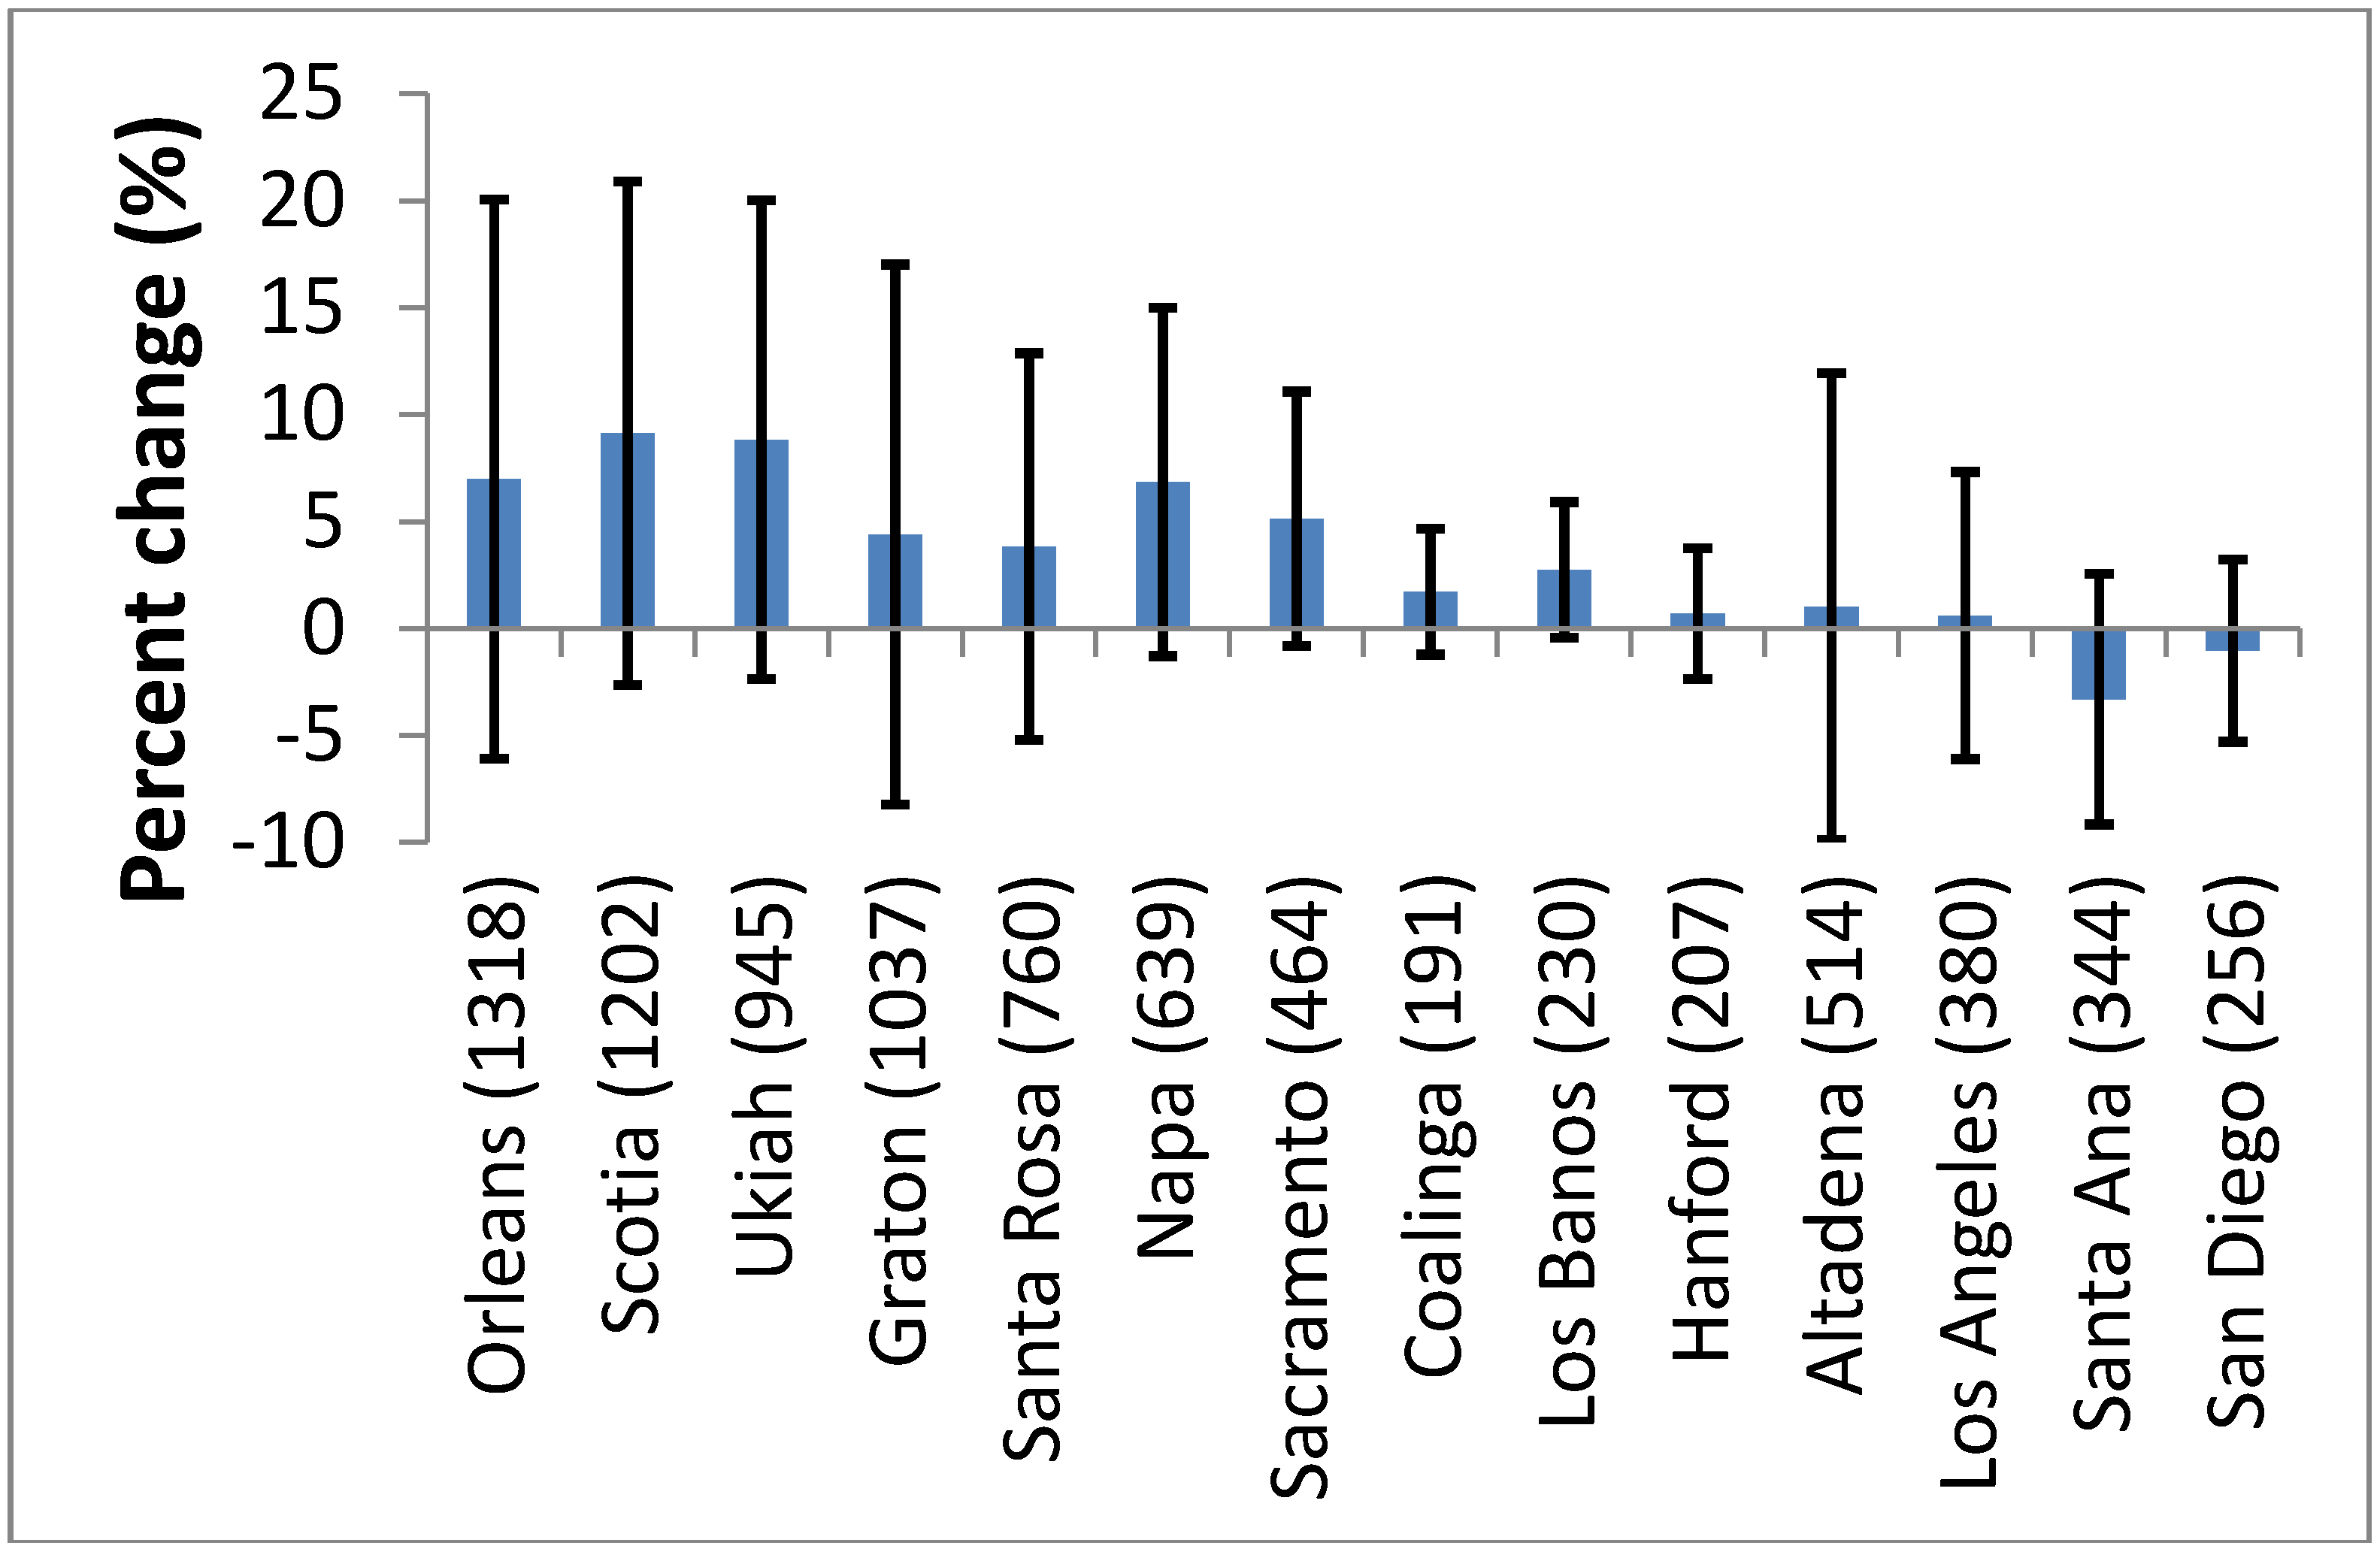
Figure 2.
Graph showing percent change of total annual precipitation relative to average annual precipitation for the period 1925–2007 for stations investigated. Stations are arranged North to South with error bars (95% confidence interval). Stations in the North show positive trends, while Southern California stations show less change or decreases in rainfall over the period.
3. Results
When meteorological stations are ordered by latitude, trends in annual precipitation totals since 1925 show increases in the North and Central regions and decreases or minimal changes in the South (
Figure 2). Though the trends in the North show the largest increases, none of the trends for the meteorological stations are significant at the 95% confidence interval.
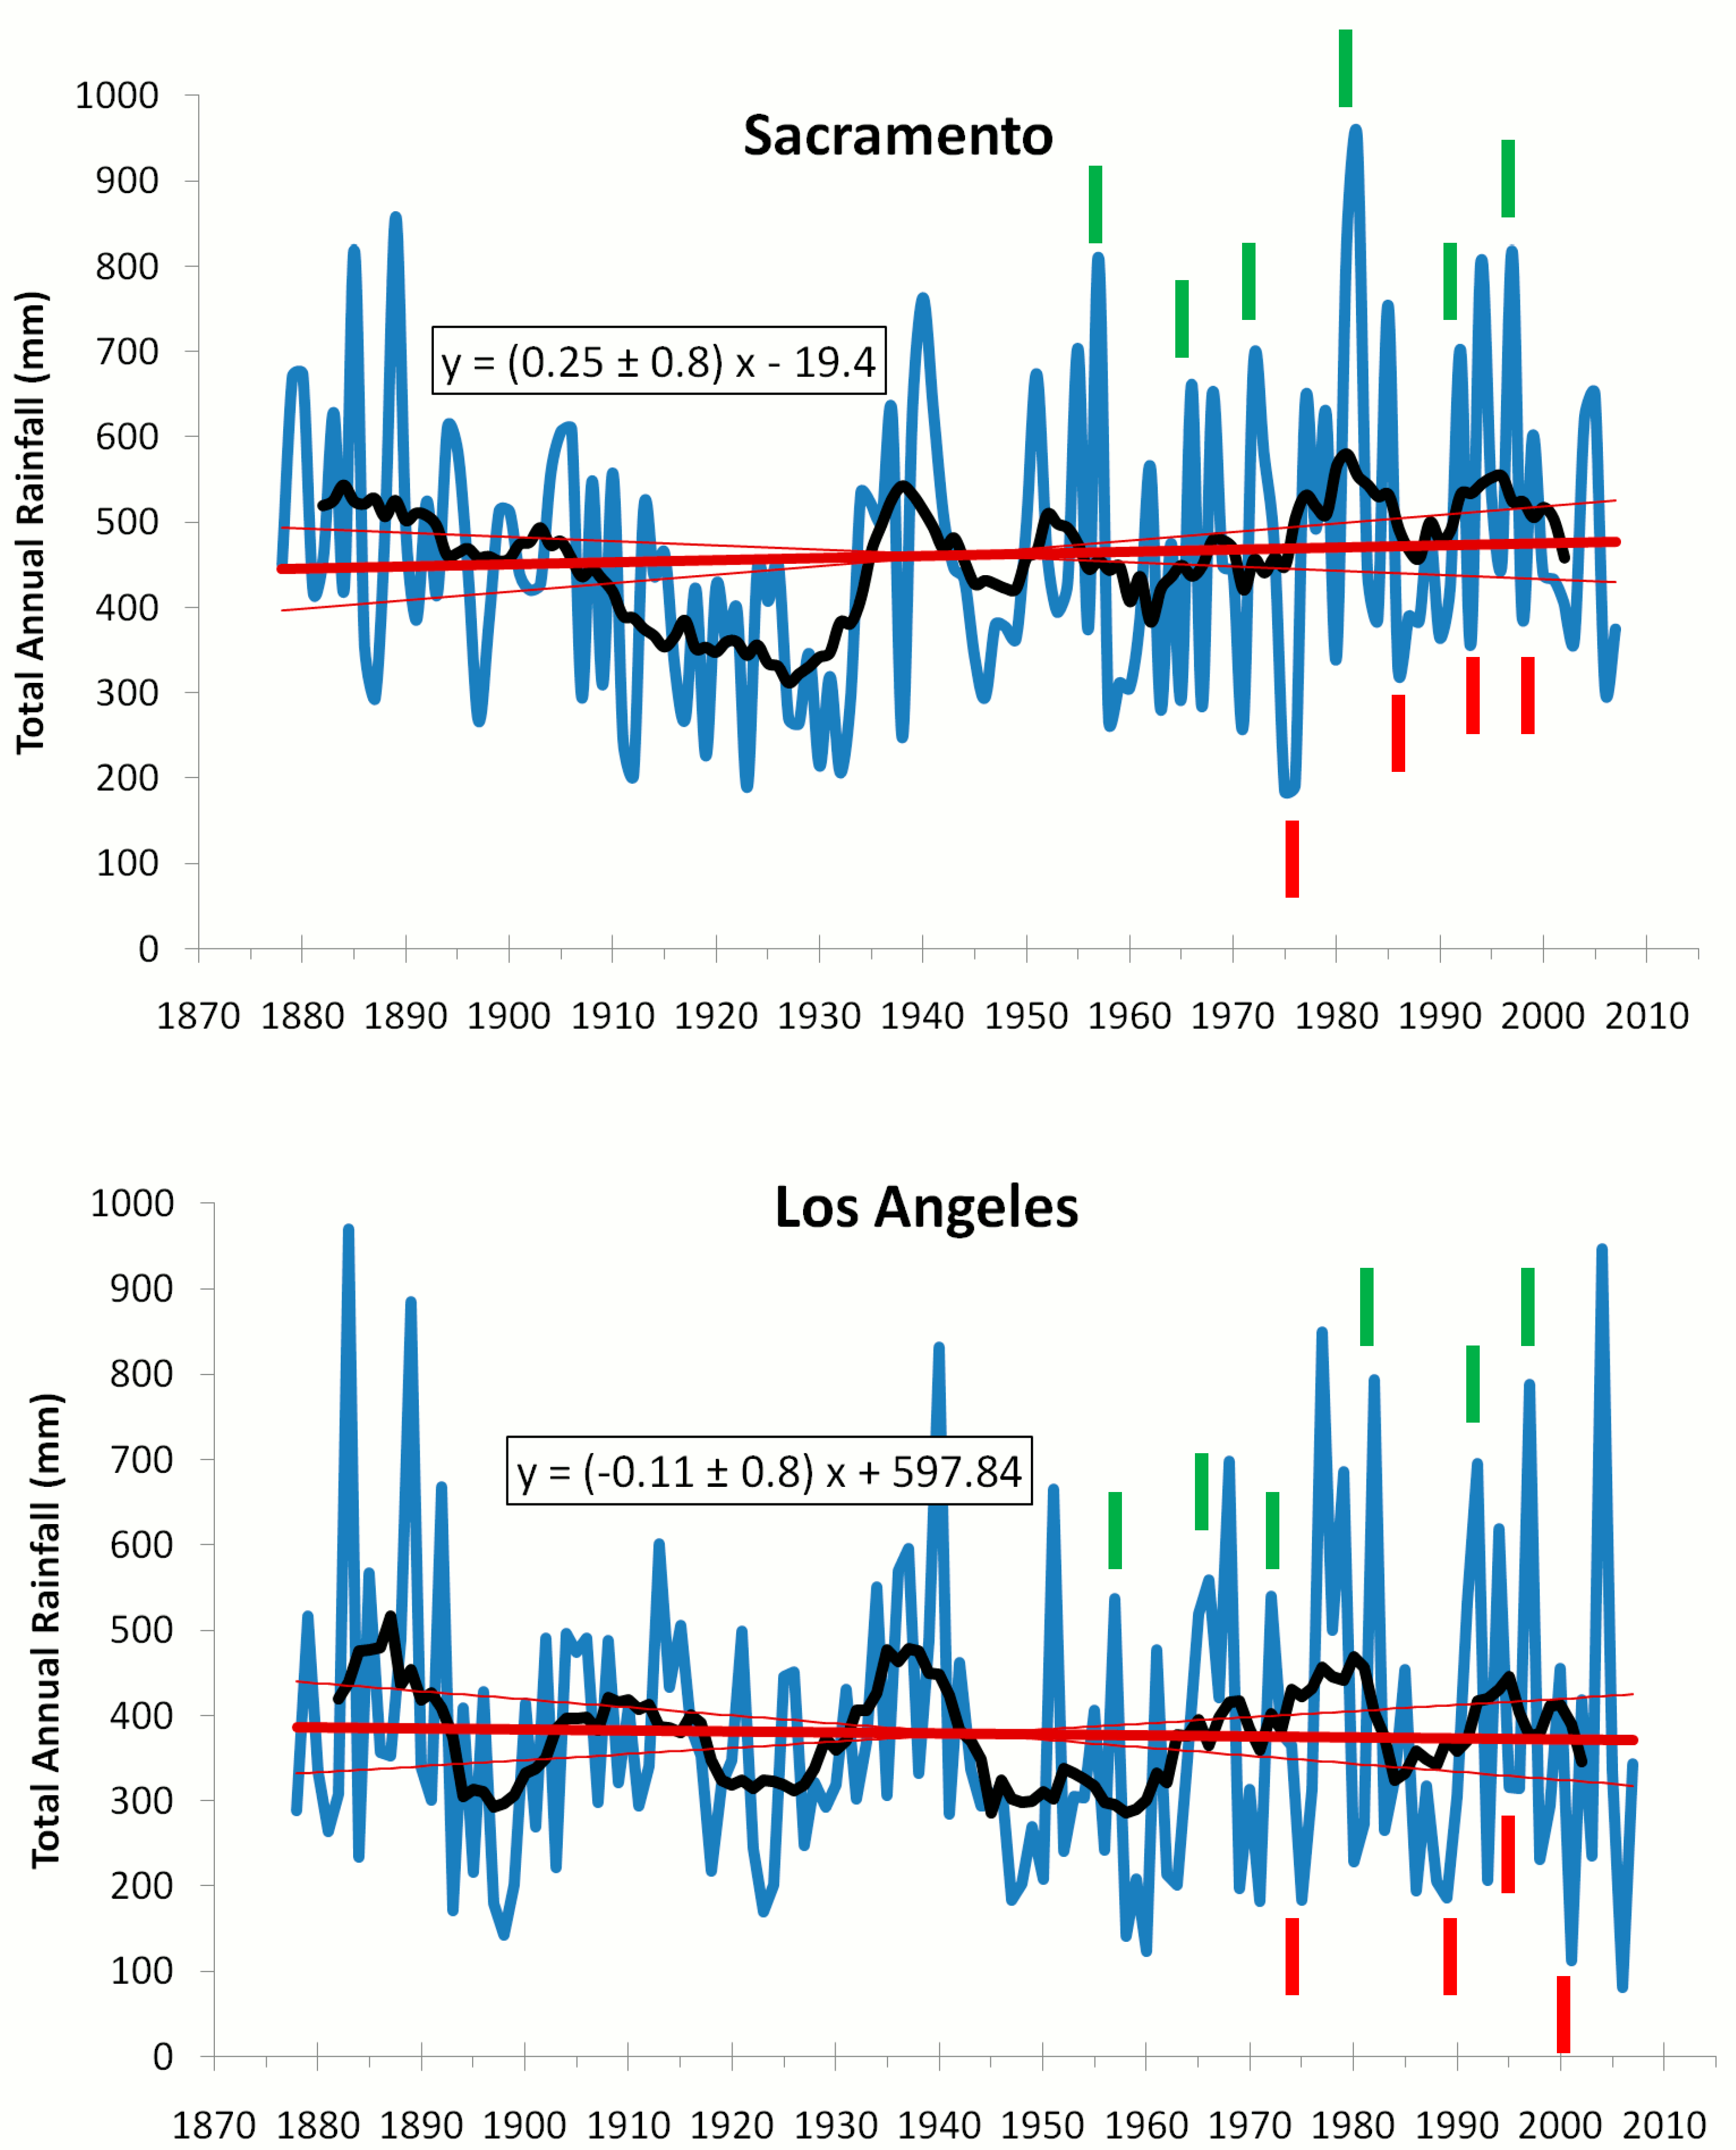
For the Sacramento meteorological station increasing annual precipitations trends were detected (25 ± 80 mm per 100 years), while trends decreased for the Los Angeles (−11 ± 80 mm per 100 years) station (
Figure 3). A high rainfall period occurs in the early part of the Sacramento record which greatly impacts the trend. If the trend is computed solely for the period 1895–2007 (94 ± 90 mm per 100 years), then it is statistically significant at the 95 percent confidence level. Consequently, the time period analyzed may bias results. A Mann-Kendall test on the Sacramento and Los Angeles time series did not show significant trends,
p-values are 0.63 for Sacramento and 0.43 for Los Angeles. Trends would only be considered significant if
p-vales were smaller than 0.05. Furthermore, a test of homogeneity for the Sacramento record shows no discontinuity. For Los Angeles, the record shows homogeneity up until 1999. Afterwards the station was moved to a new location, but the move did not affect our findings.
Figure 3.
Time series of annual rainfall for Sacramento and Los Angeles. These plots are based on monthly rainfall records. Blue lines show annual rainfall; black lines show the 10-year running mean, and the red line shows the trend with 95% confidence limits (thinner red lines). The 10-year running mean illustrates the large amount of decadal variability present in these records, which complicates the detection of any long-term trend. Red dashes mark strong La Niña and green ones strong El Niño events.
A similar pattern in precipitation trends holds for the WRCC California climate divisions. The mean annual precipitation trend for the state shows a 15% increase for the long-term record (since 1895), but only a 1% increase since 1975 (
Table 1). Regionally, central and northern California show mostly slight to moderate precipitation gains for the entire record, while southern California shows large decreases since the 1970s (
Table 1).
Table 1.
Annual rainfall trends over different periods based on the eleven California climatic regions in mm per 100 years. Values in blue represent significant trends.
Table 1.
Annual rainfall trends over different periods based on the eleven California climatic regions in mm per 100 years. Values in blue represent significant trends.
| | Mean | Precipitation Trends with 95% Confidence Limits |
|---|
| 1895–2013 | 1949–2013 | 1975–2013 |
|---|
| Trend | Error | Trend | Error | Trend | Error |
|---|
| North Coast | 1636 | −18 | 200 | −192 | 519 | 389 | 1275 |
| North Central | 1296 | 226 | 175 | −104 | 483 | −16 | 1185 |
| Northeast | 757 | 41 | 87 | −93 | 224 | −107 | 549 |
| Sierra | 994 | 103 | 143 | −34 | 415 | −134 | 1022 |
| Sacramento-Delta | 499 | 118 | 78 | 33 | 226 | −42 | 538 |
| Central Coast | 641 | 68 | 108 | 47 | 303 | −24 | 733 |
| San Joaquin Valley | 318 | 33 | 57 | 35 | 165 | −137 | 392 |
| South Coast | 441 | 77 | 94 | 41 | 277 | −339 | 687 |
| South Interior | 451 | −12 | 97 | 19 | 280 | −513 | 674 |
| Mohave Desert | 185 | 33 | 37 | 32 | 106 | −214 | 260 |
| Sonoran Desert | 112 | 21 | 28 | 30 | 76 | −213 | 177 |
| Statewide | 581 | 73 | 78 | −14 | 224 | −137 | 558 |
Table 2.
Winter rainfall trends over different periods based on the eleven California climatic regions in mm per 100 years. Values in blue represent significant trends.
Table 2.
Winter rainfall trends over different periods based on the eleven California climatic regions in mm per 100 years. Values in blue represent significant trends.
| | Mean | Precipitation Trends with 95% Confidence Limits |
|---|
| 1895–2013 | 1949–2011 | 1975–2011 |
|---|
| Trend | Error | Trend | Error | Trend | Error |
|---|
| North Coast | 1636 | −29 | 143 | −147 | 374 | 423 | 1,361 |
| North Central | 1296 | 99 | 128 | −98 | 343 | 176 | 787 |
| Northeast | 757 | 7 | 59 | −71 | 157 | 33 | 358 |
| Sierra | 994 | 51 | 106 | −25 | 367 | 102 | 659 |
| Sacramento-Delta | 499 | 65 | 57 | 26 | 152 | 83 | 358 |
| Central Coast | 641 | 42 | 81 | 43 | 210 | 130 | 492 |
| San Joaquin Valley | 318 | 19 | 42 | 39 | 113 | 23 | 257 |
| South Coast | 441 | 52 | 75 | 93 | 211 | −27 | 519 |
| South Interior | 451 | 19 | 78 | 100 | 213 | −92 | 522 |
| Mohave Desert | 186 | 21 | 27 | 49 | 76 | −25 | 191 |
| Sonoran Desert | 112 | 11 | 20 | 53 | 8,052 | −21 | 138 |
| Statewide | 581 | 73 | 80 | −14 | 224 | −138 | 558 |
Seasonally, all WRCC California climatic divisions show increased winter precipitation for the 1895 to present record, except the North Coast which exhibits a slight negative trend. For other seasons no clear precipitation patterns emerge except for decreases in southern divisions since the 1970s (
Table 2). During spring, all southern regions show significant decreases since 1975. Because much of the annual precipitation comes in the winter months (DJF) [
16], the annual precipitation also shows positive trends for most divisions (
Table 2). The values in blue in
Table 1 and
Table 2 represent significance, meaning the time series is showing a significant increase or decrease in values. All other values listed in the tables indicate a more random distribution in the time series.
The US west coast exhibits a distinct dipole relationship with ENSO (El Niño-Southern Oscillation) events [
17,
18]. During El Niño events, winter precipitation is above normal in the Southwest and below normal in the Northwest. The opposite occurs during La Niña events. California is included within this large dipole pattern, where the northern portion of the state reflects the Northwest region, while southern California reflects the SW. This pattern between ENSO and precipitation is strongest in southern California and weakens northward [
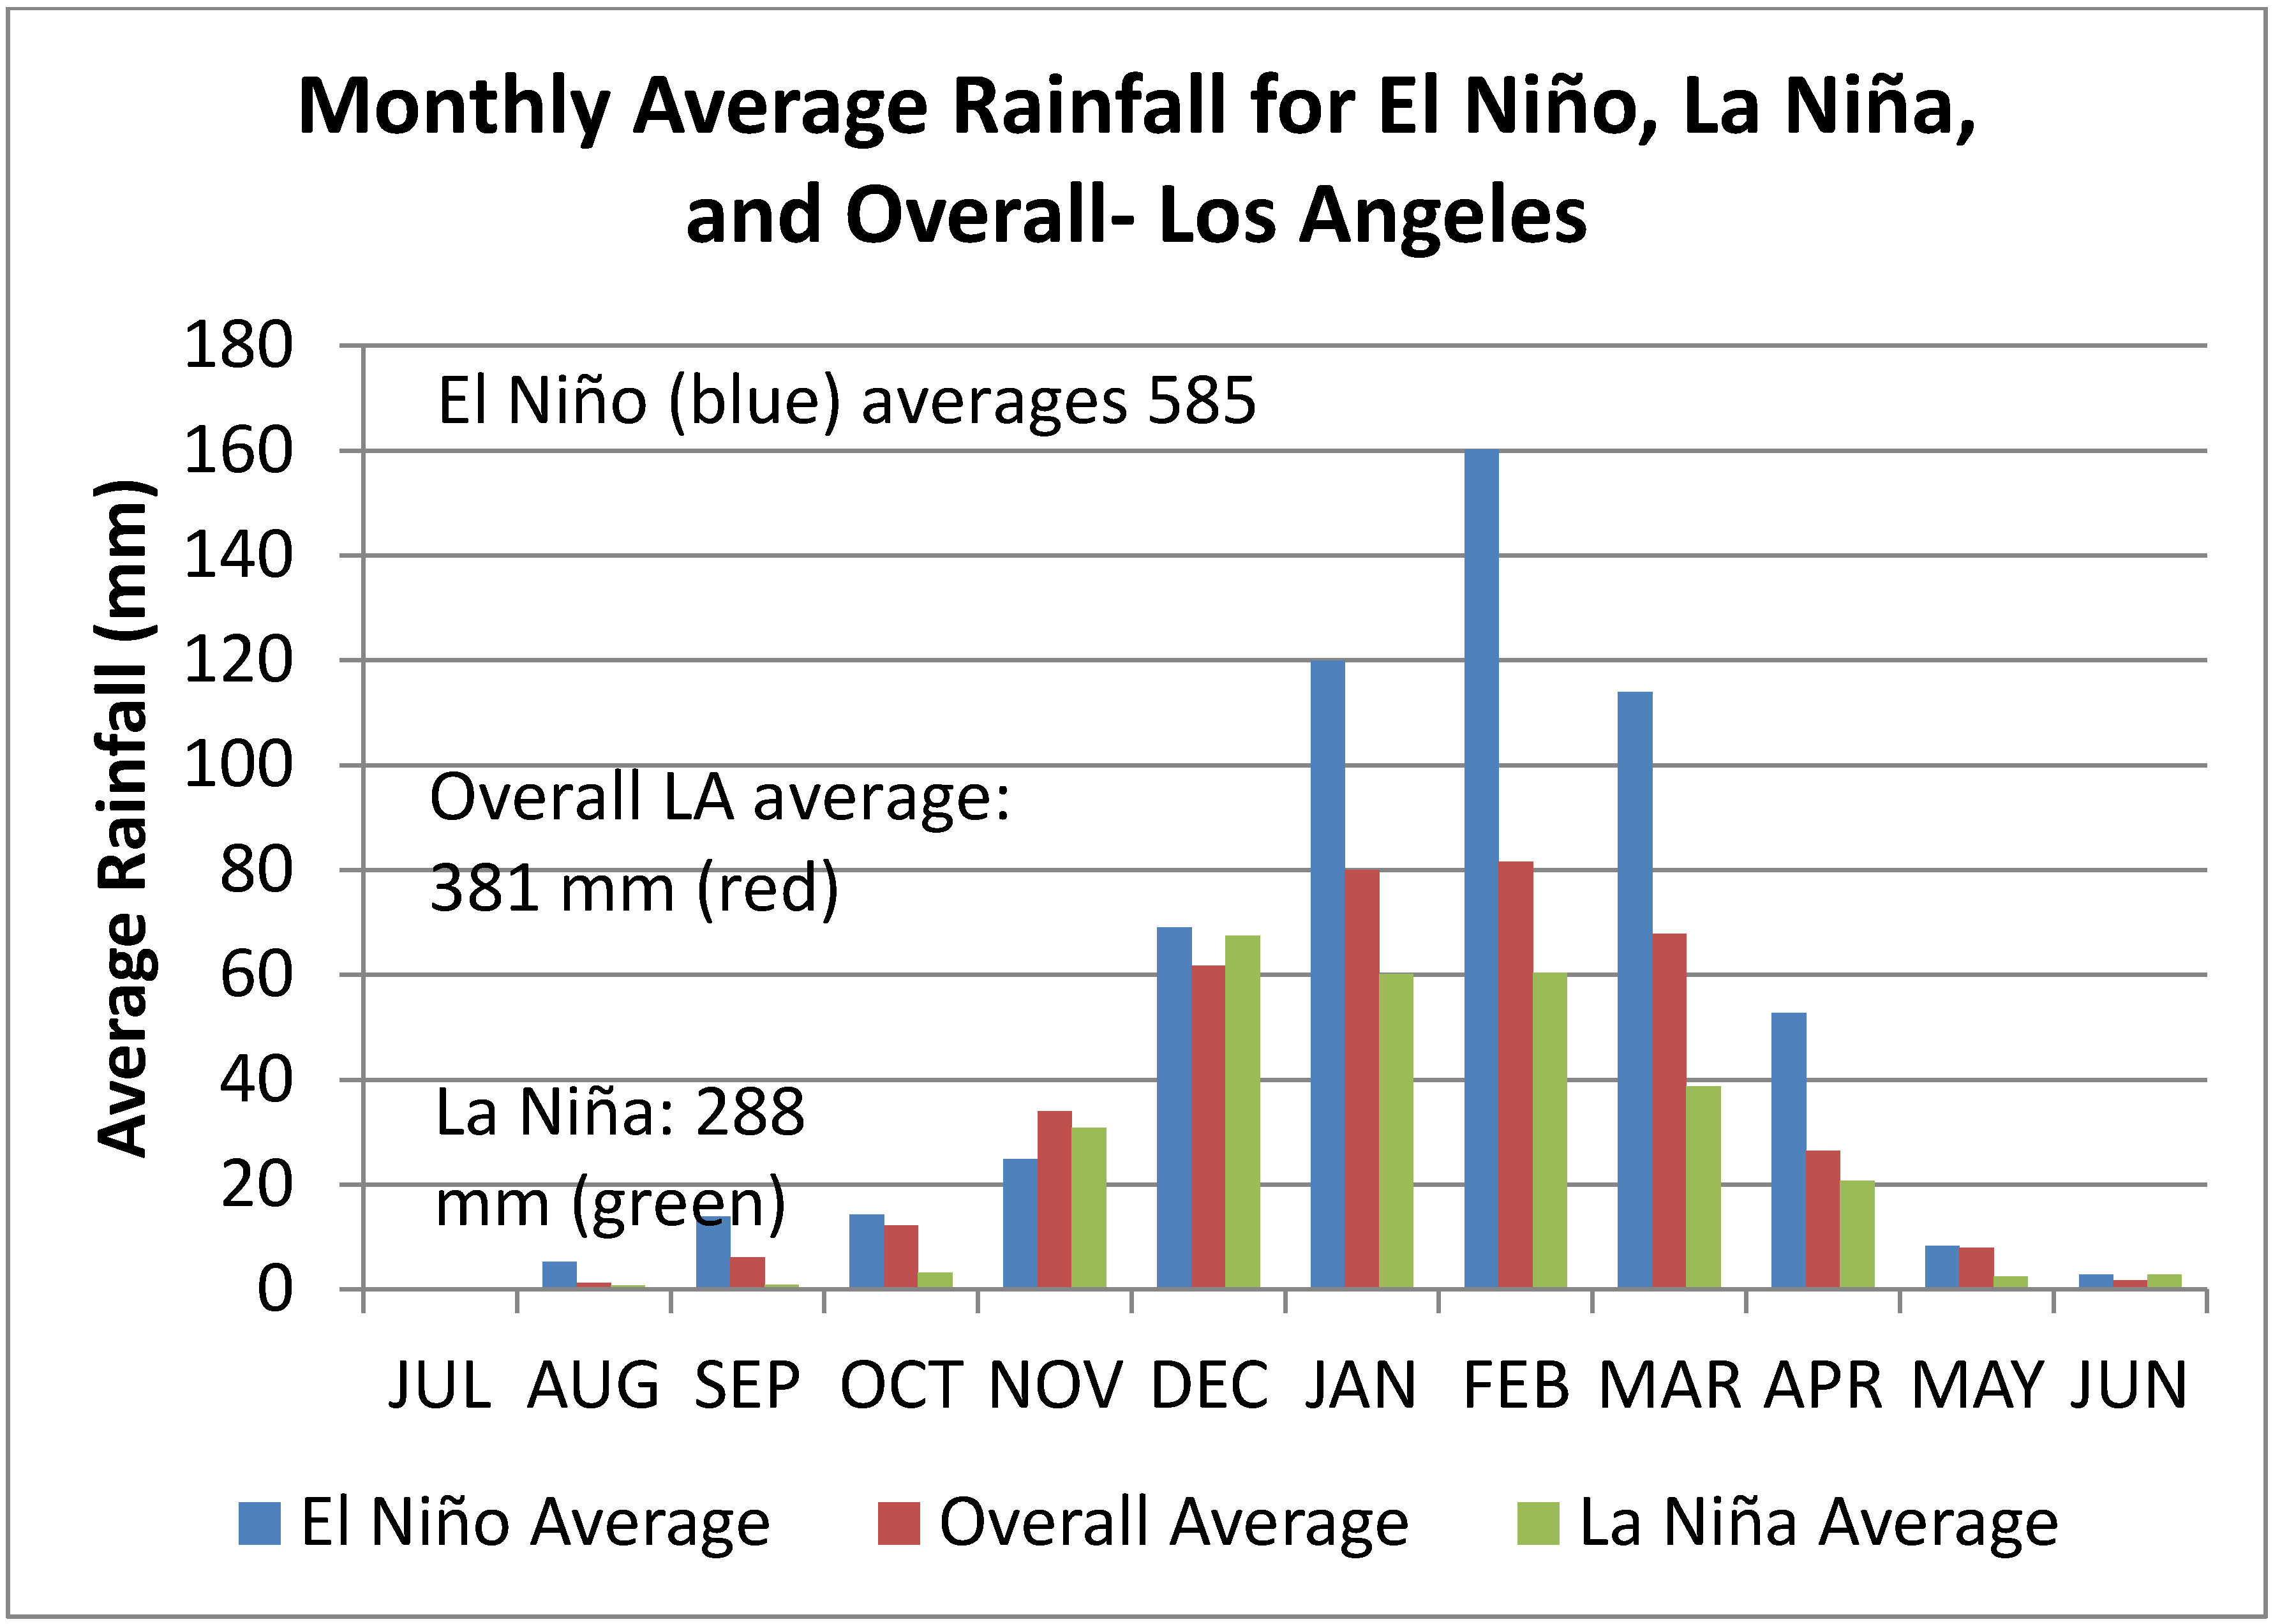
17,
18]. Los Angeles shows this strong relationship with 204% more precipitation in El Niño years than in La Niña years (
Figure 4).
Figure 4.
During El Nino events, Los Angeles receives more than twice the rainfall than during La Nina events. Note also that rainfall peaks later during El Niño events than La Niña events.
Figure 4.
During El Nino events, Los Angeles receives more than twice the rainfall than during La Nina events. Note also that rainfall peaks later during El Niño events than La Niña events.
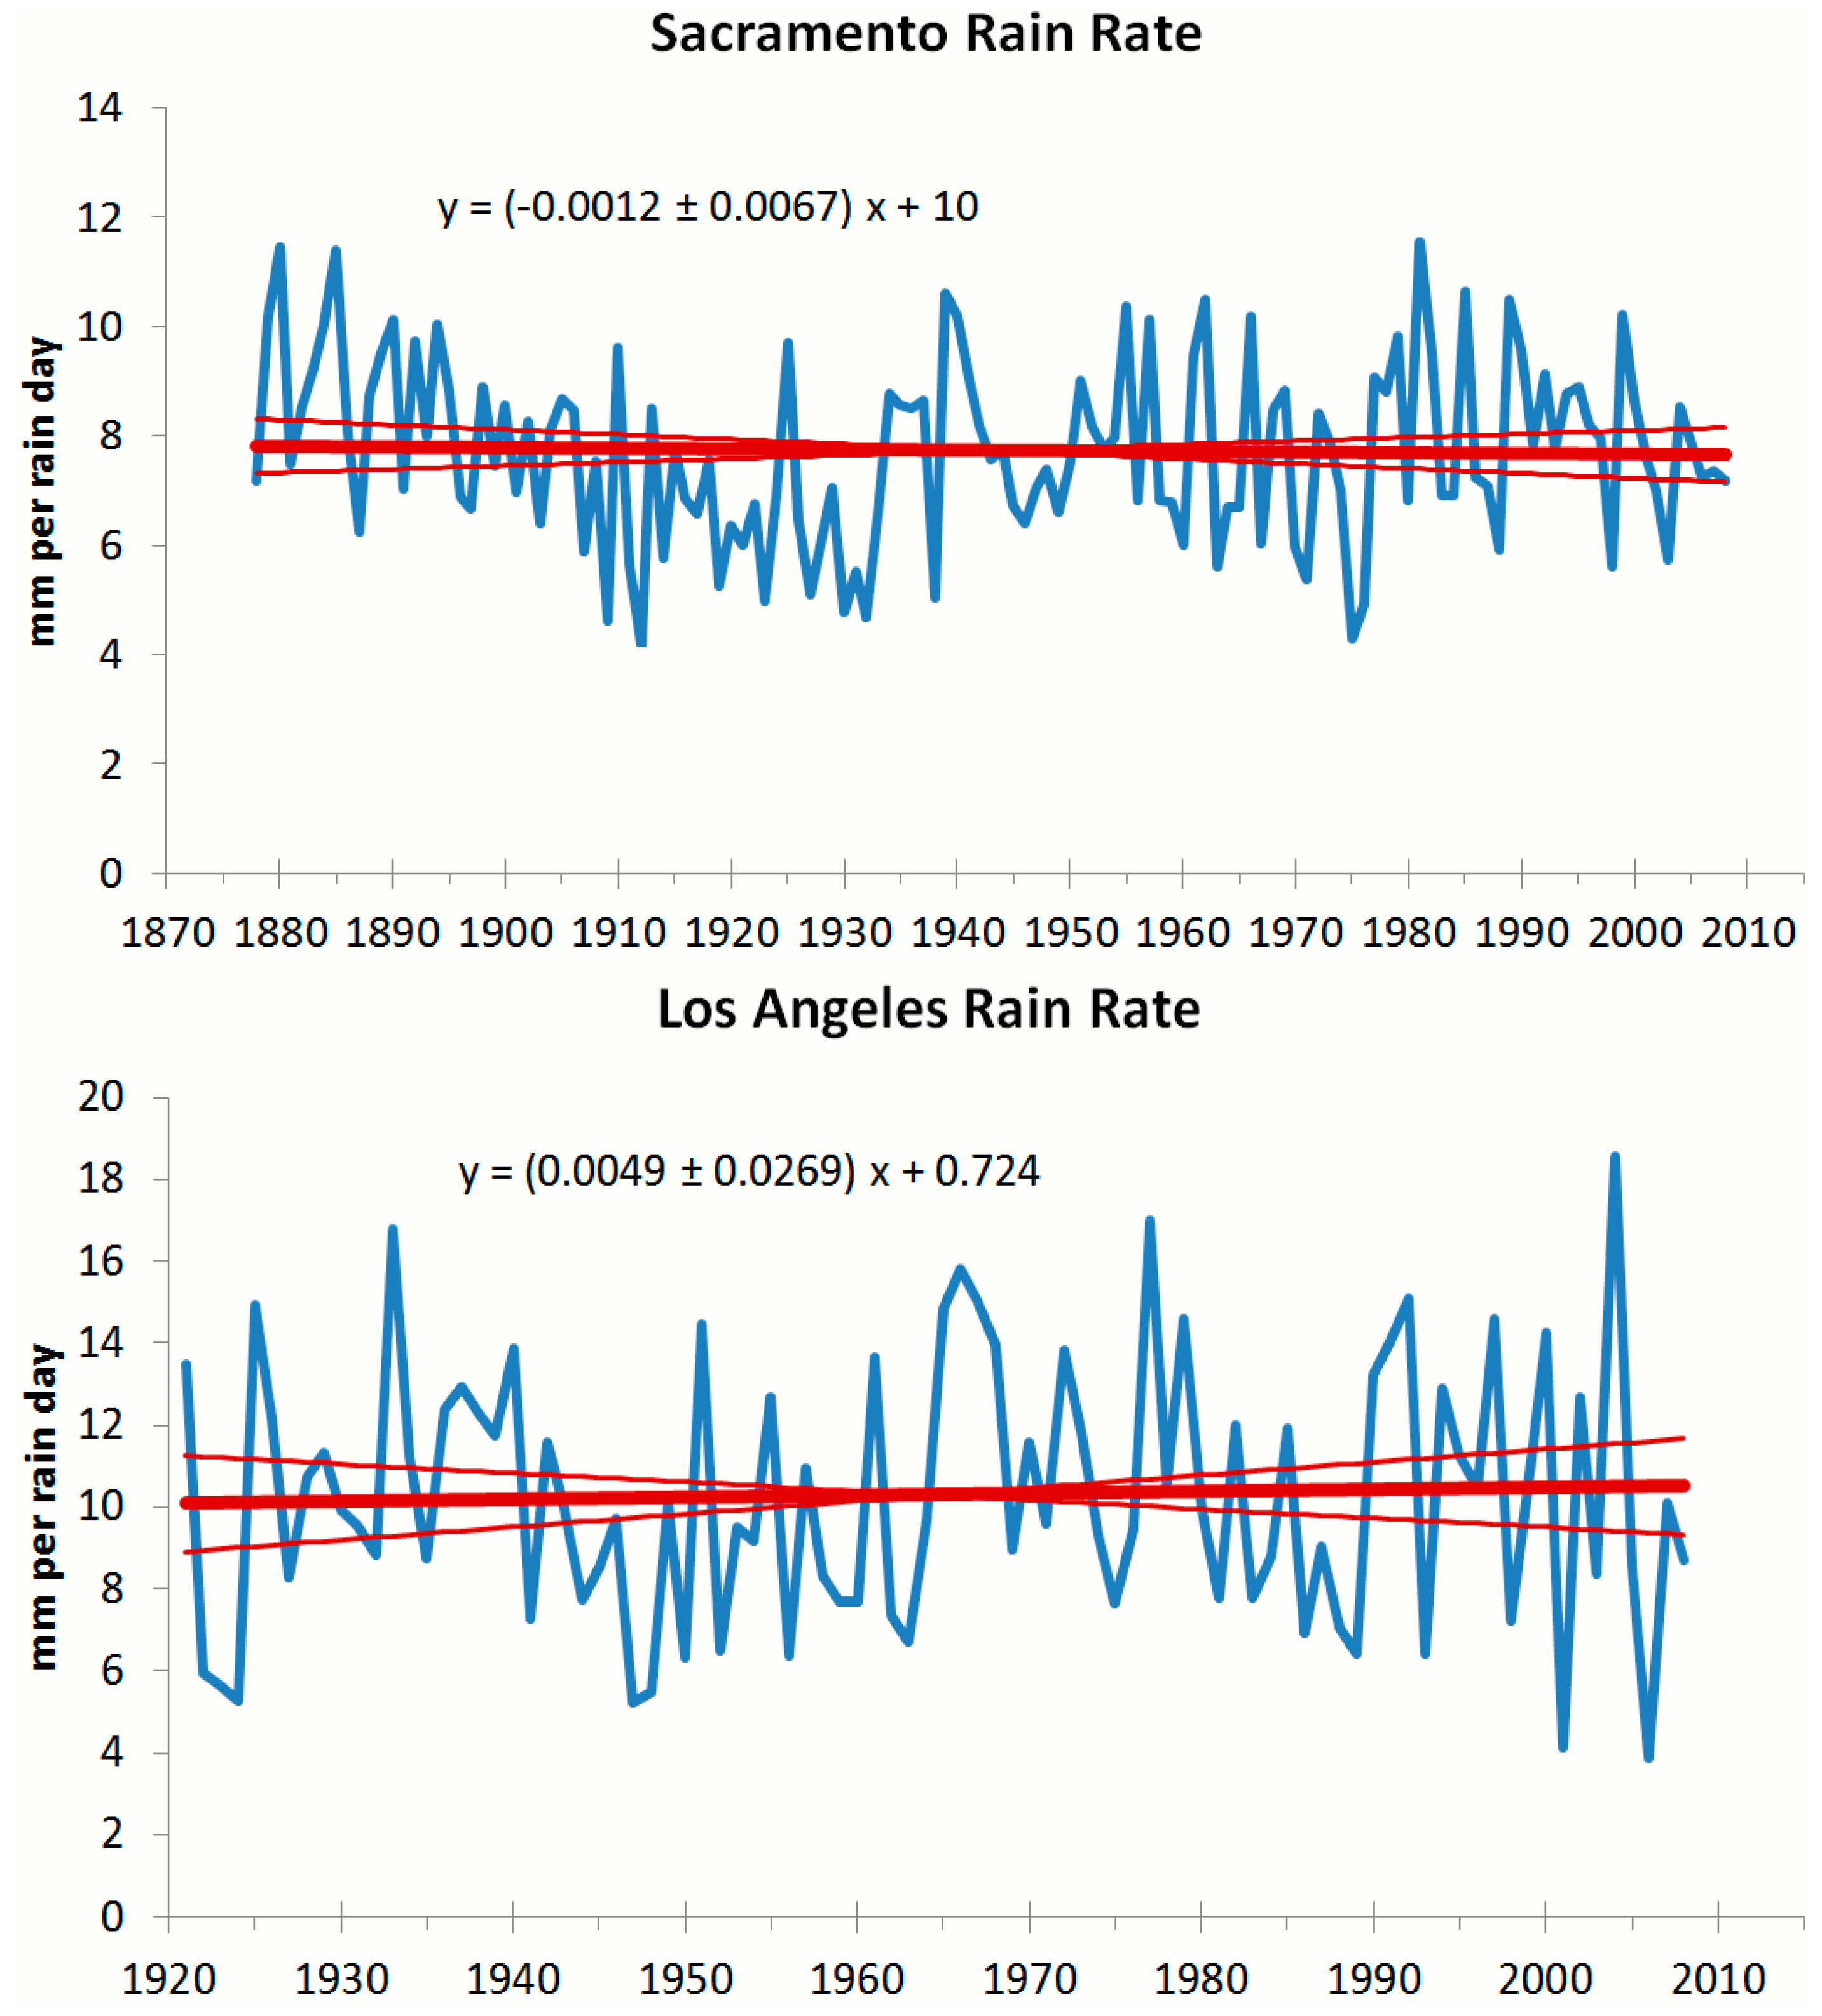
Using the daily records, rainfall intensity and frequency were also analyzed for the Los Angeles and Sacramento stations.
Figure 5 shows the average precipitation per day (for days with a measurable amount of rainfall) for the two stations. For the period 1878 to 2007, Sacramento had a trend of −0.12 ± 0.67 mm per day/century. For the period 1920–2007, Los Angeles had a trend of 0.49 ± 2.7 mm per day/century. Although the rainfall record for Los Angeles extends back to 1878, much of the daily records were missing prior to 1920. As with total rainfall trends, Los Angeles and Sacramento trends in rainfall intensity were not significant. Frequency of rainfall (number of days per rain-year with measurable rain) for Sacramento shows an increase of about 3 rain days per year in a century, while Los Angeles loses nearly 4 days of rain, or about a 10% decrease in the last century (
Figure 6). These rainfall frequency trends were also not significant.
Figure 5.
Average precipitation per day (for days with a measurable amount of rainfall) for the two longest daily records, Sacramento (top) and Los Angeles (bottom). Units of the slope in the trend equations are (mm of rain per rain day)/year. Neither record contains a significant trend in the daily rain rate, or rain intensity.
Figure 6.
Number of days with measurable rain. Units of the slope in the trend equation are (number of rain days per year)/year. Neither record contains a significant trend in the frequency of rain.
Figure 6.
Number of days with measurable rain. Units of the slope in the trend equation are (number of rain days per year)/year. Neither record contains a significant trend in the frequency of rain.
4. Discussion and Conclusions
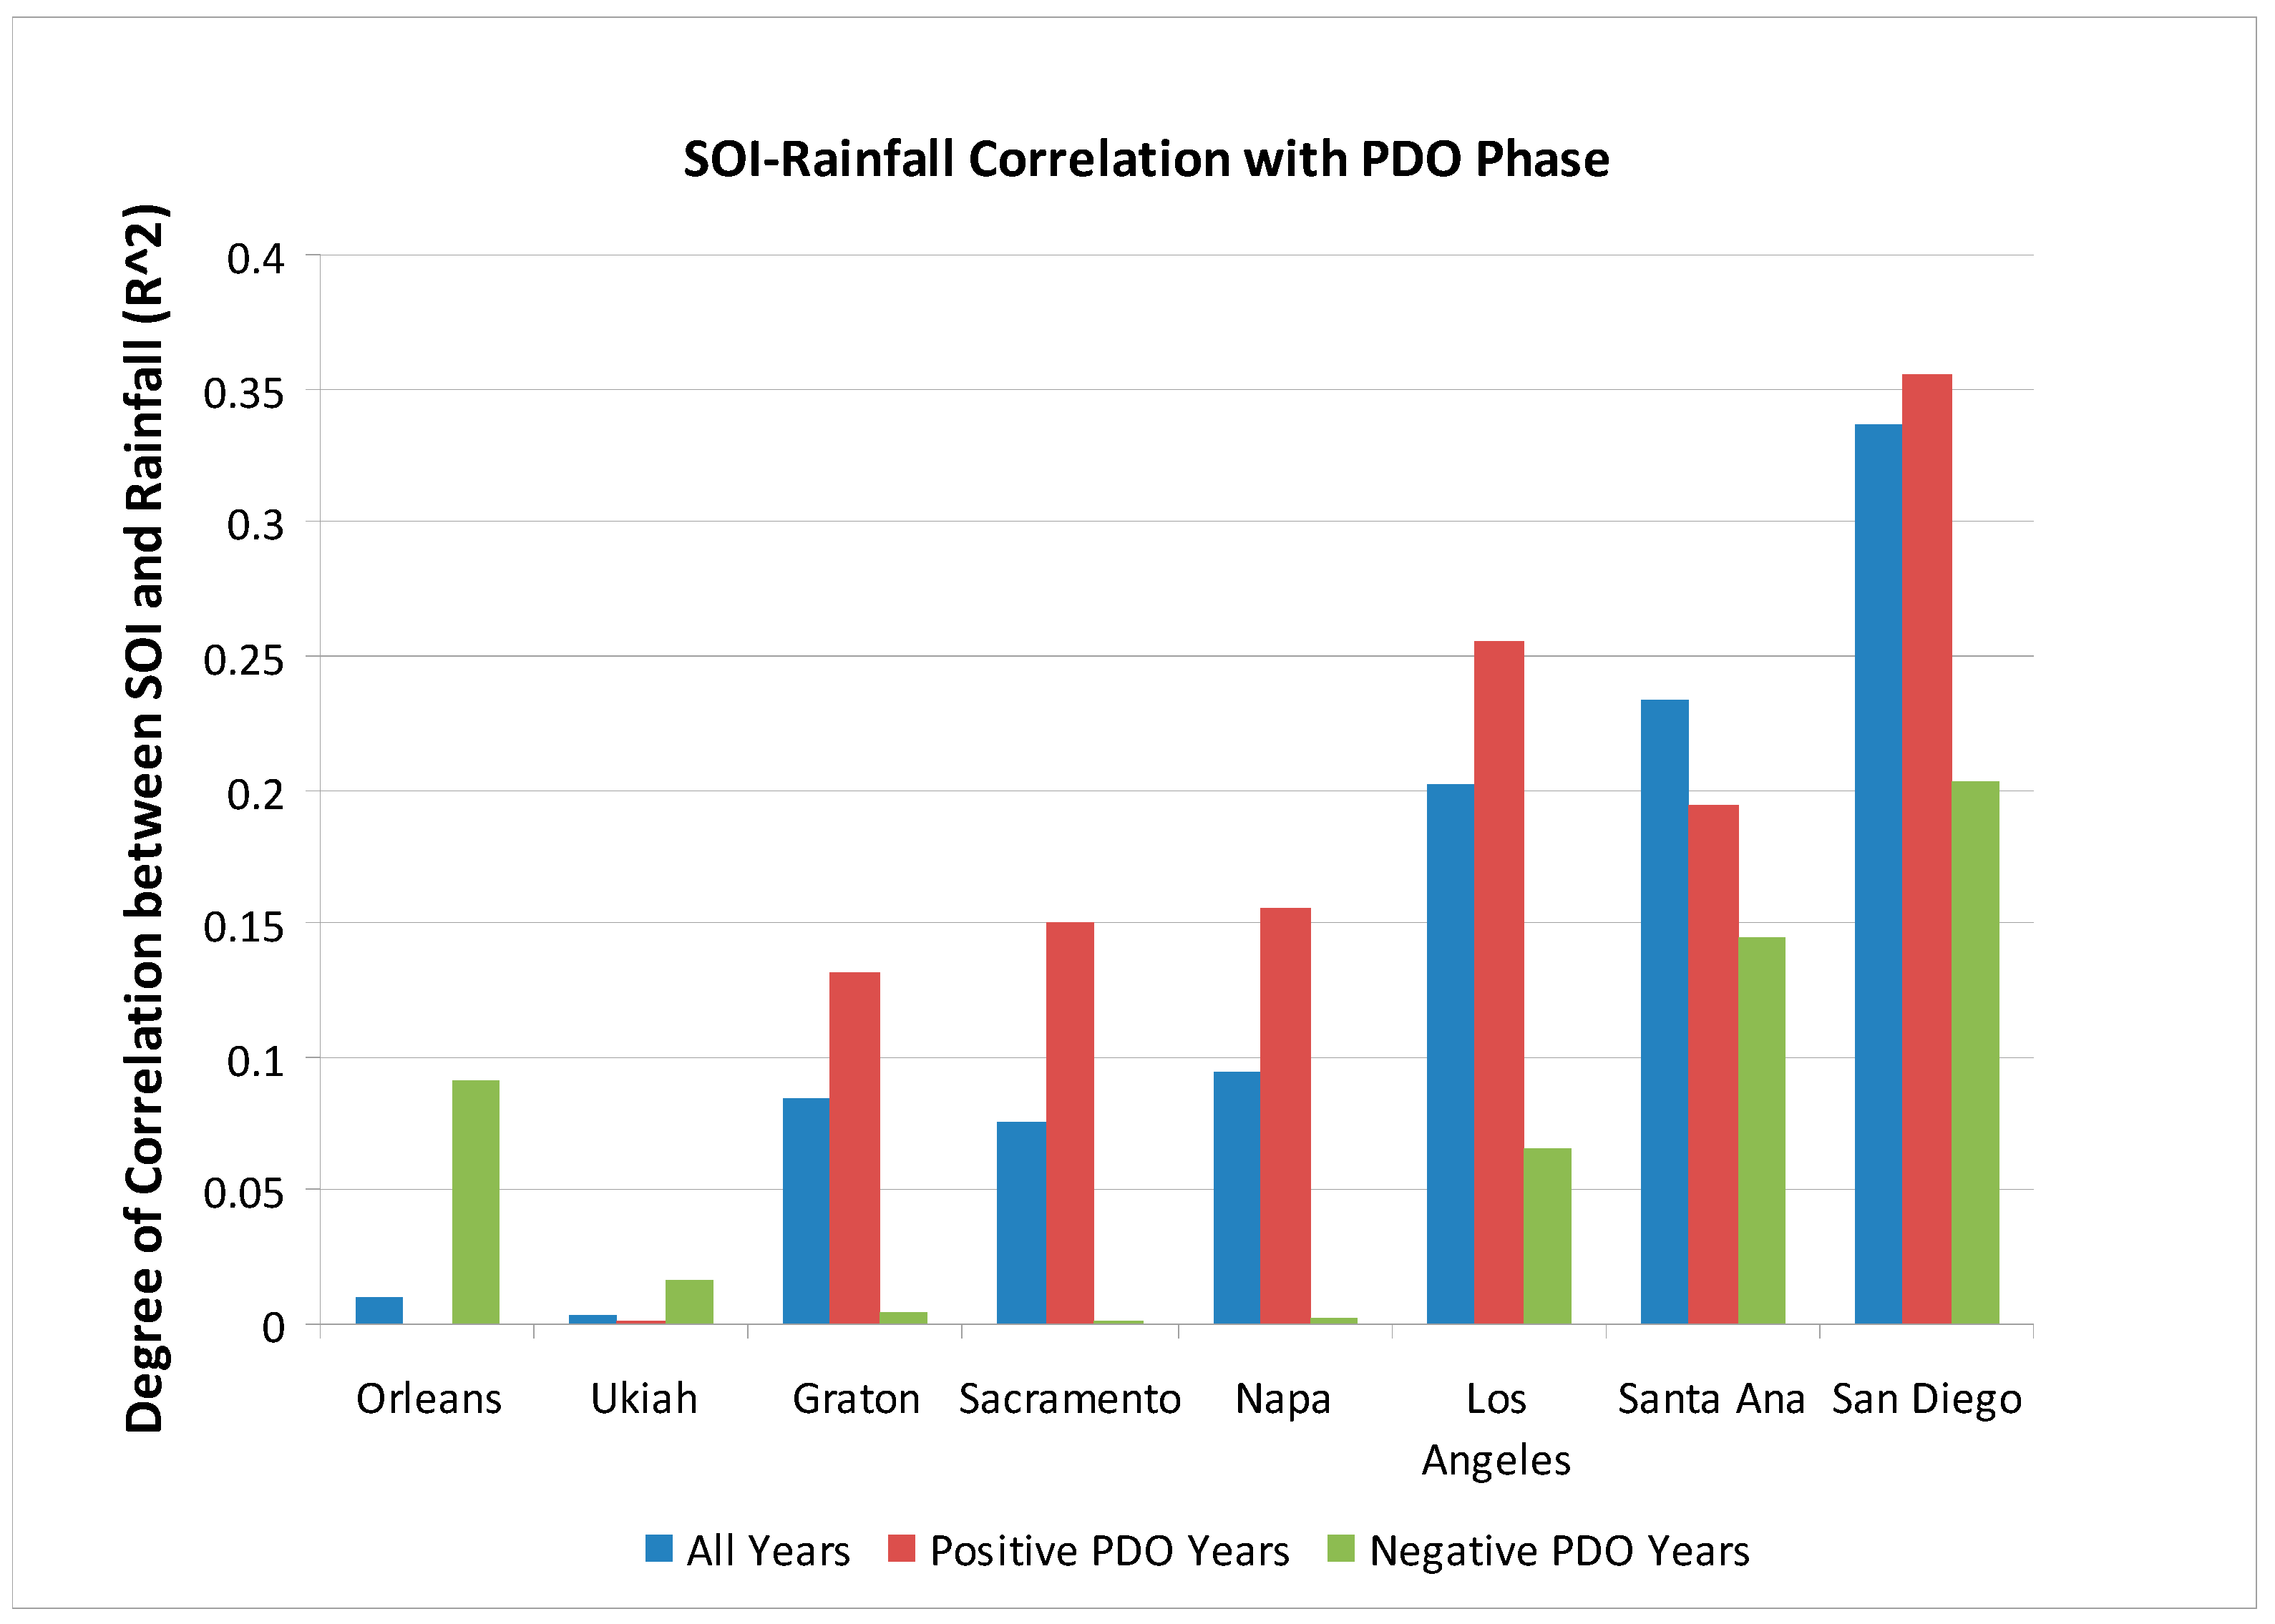
In California, any analysis of precipitation patterns must account for regional differences in climate. As previously mentioned the state as a whole has been getting wetter over the last century. Regionally, the northern and central parts show modest to slight increases in annual precipitation, while the southern regions show negligible change or decreases since the early 1900s and large decreases since the 1970s. Are the changes observed attributable to climate change, natural variability, or both? A connection occurs between precipitation patterns in California and PDO/ENSO. Increased precipitation in the southern part of the state is associated with warm PDO phases which are also tied to increased El Niño events (
Figure 7). San Diego shows the strongest correlation between precipitation and the positive PDO, although the r
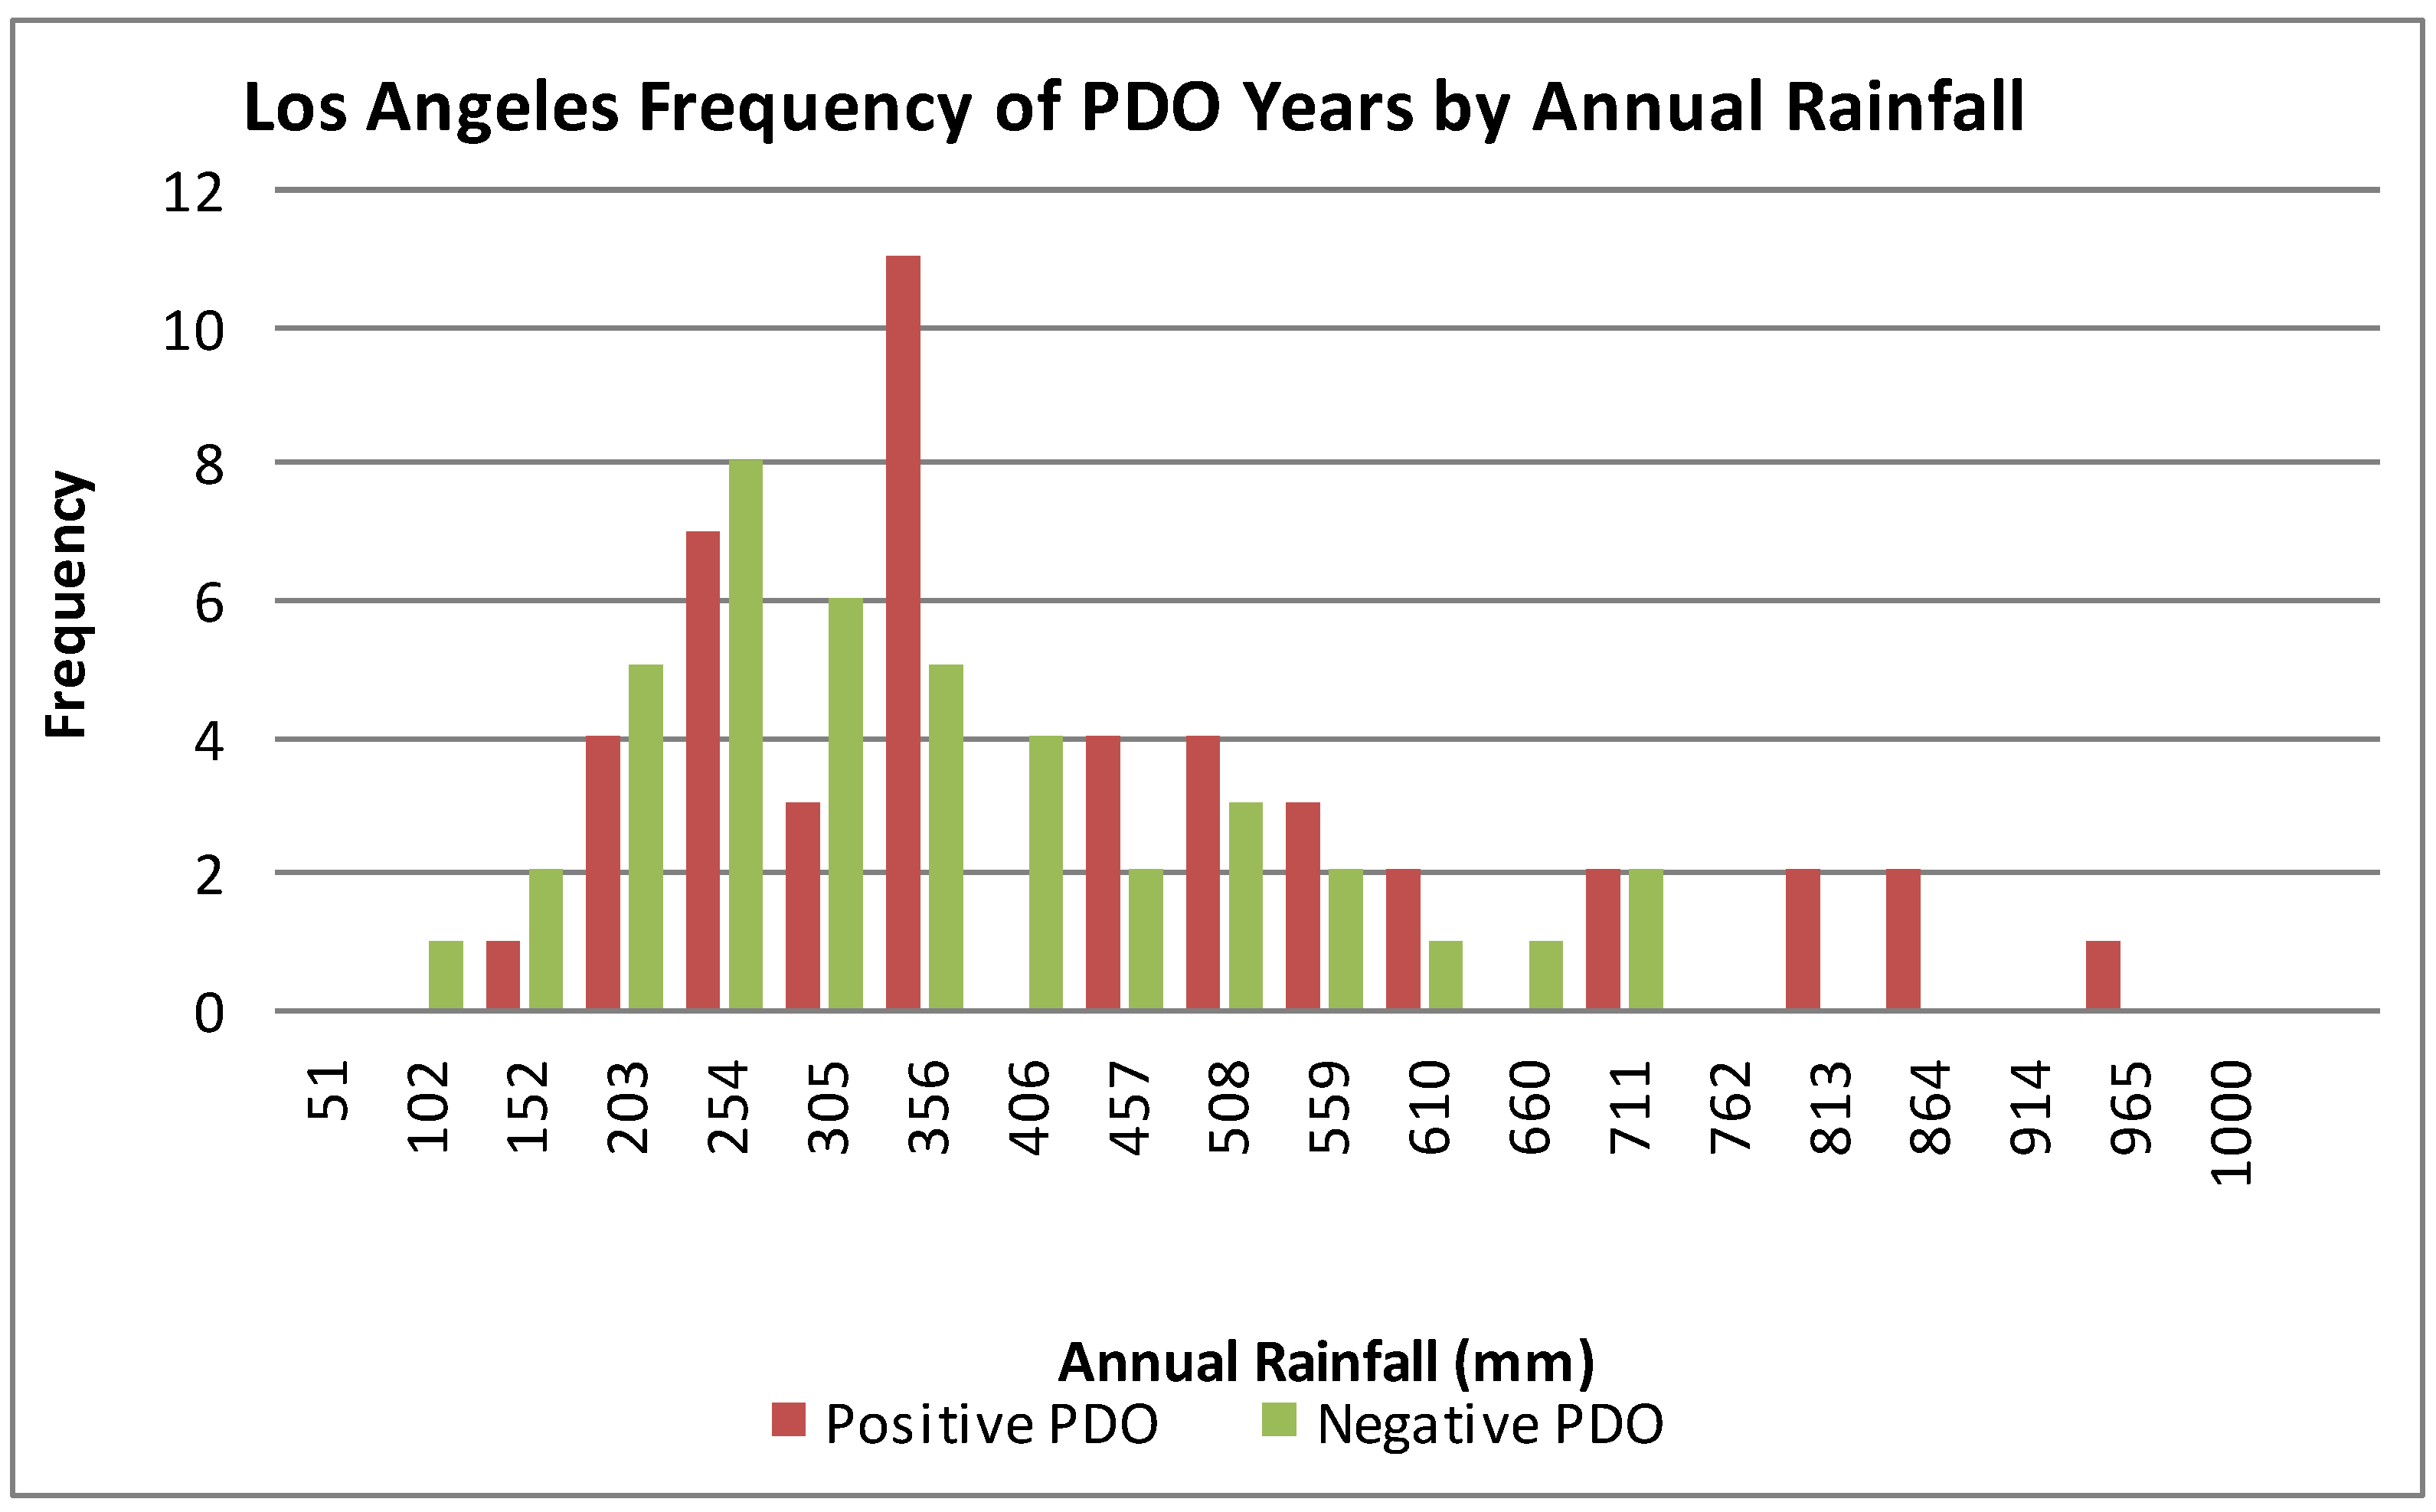
2 value is 0.126. Similarly, Los Angeles has more above normal precipitation years during the positive phase (warm) of PDO and more drier than normal years during the negative (cool) PDO phase (
Figure 8). However, for the northern region of the state, increased precipitation is tied to La Niña events and thus the cool PDO phase (
Figure 7). As much of California’s water supply originates in the northern sections, the state may actually be benefiting from climatic influences of the cool phase of the PDO and more La Niña events. The state water supply may suffer when the PDO switches back to the warm phase. Modest overall precipitation increases in California over the last century coupled with warmer temperatures may not balance resulting greater evaporation and runoff which in turn may lead to reduced water supply. Additionally, Barnett
et al. [
9], report that a warming climate has led to less snowfall in California. Decreased snowfall and warming implies more winter and spring runoff, possibly increasing flooding and leading to less water storage as snowpack. Decreased snowpack means less available water resources for warmer months.
The question of how much of a role global warming plays in California precipitation trends is difficult to answer. Warming may be leading to rising precipitation trends, although more to the northern sections of the state than the south. Rainfall intensity also has not changed significantly with warming. Sacramento, representing the northern portion of the state, shows more rain, more rainfall days, but less intensity of rain. Los Angeles, representing southern regions, on the other hand, shows greater intensity of rainfall, but decreasing rain days and amounts. McAfee and Russell [
19] predict that warming will lead to a northward shift in storm track position causing reduced rainfall in the West in the late winter and early spring. This shift, which is also predicted in climate models [
20], is similar to the patterns described in this paper that northern regions are getting more precipitation while southern regions, like the rest of the Southwest, are drying.
Figure 7.
Correlation between SOI and station rainfall and PDO phases. The figure shows stronger correlations in the southern California stations indicating increased rainfall with SOI and positive (warm phase) PDO years.
Figure 7.
Correlation between SOI and station rainfall and PDO phases. The figure shows stronger correlations in the southern California stations indicating increased rainfall with SOI and positive (warm phase) PDO years.
Figure 8.
Frequency of PDO years versus annual rainfall for the Los Angeles station. Positive PDO years correspond with increased annual rainfall compared to negative PDO years.
Figure 8.
Frequency of PDO years versus annual rainfall for the Los Angeles station. Positive PDO years correspond with increased annual rainfall compared to negative PDO years.
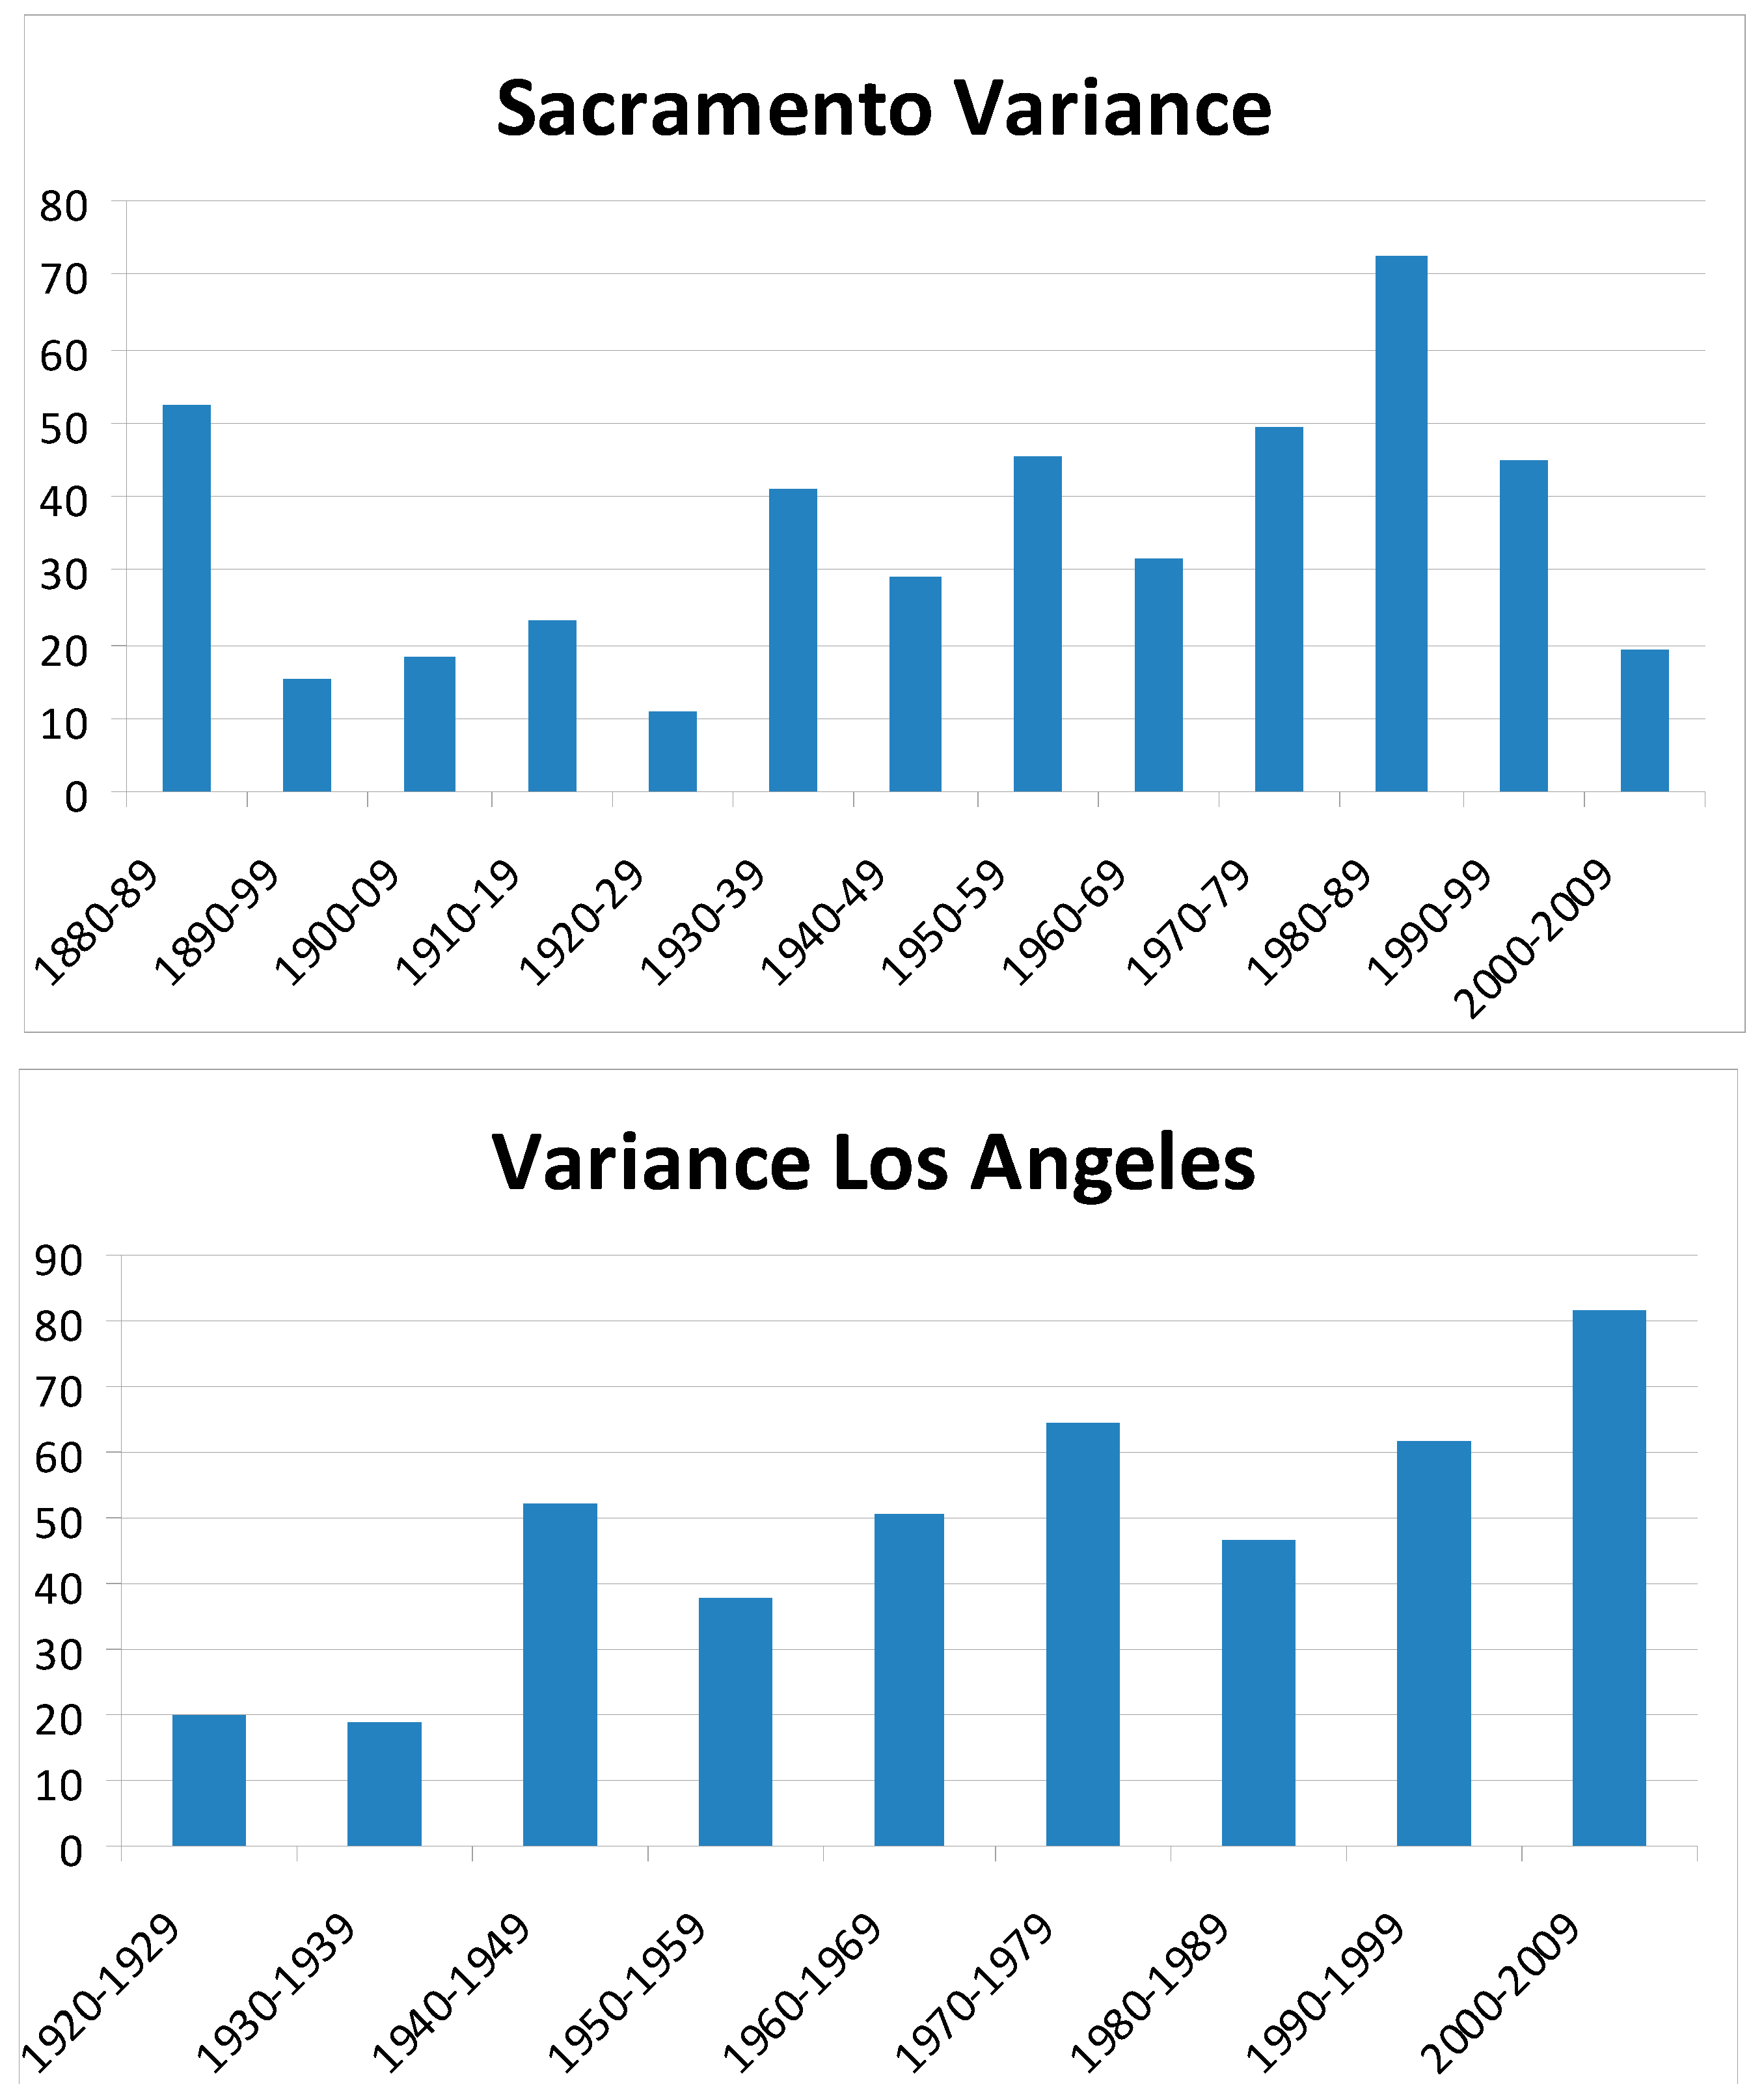
Figure 9.
Decadal coefficient of variance for Sacramento and Los Angeles annual rainfall. The Los Angeles record shows increased variance for more recent decades. The Sacramento record does not show any discernible pattern in variance. Even though the Los Angeles record extends back to 1878, missing data for the earlier decades resulted in their exclusion.
In general, Pacific SSTs (sea surface temperatures), especially those influenced by ENSO and PDO, explain much of the annual variability in precipitation, although the relationships are stronger to the south. Climate models and observational studies indicate that warming is leading to the absorption of more water vapor by the atmosphere [
19]. We find no evidence, however, that increased atmospheric water vapor has led to more frequent or more intense rainfall in California. If a climate signal exists in California precipitation records, it is still too small to detect given the interannual to decadal variability in the historical records such as those for Los Angeles and Sacramento (
Figure 9). In fact the variability in precipitation has increased over the last few decades, especially in the southern regions. Because of this, only a much longer record or a larger anthropogenic signal in the rainfall records will permit detection of climate change impacts on state precipitation.


