1. Introduction
Moderate and responsible consumption of spirits and wine is associated commonly with social relationships during leisure times and relaxing activities. People like tasting good products and experiencing new flavors and are prone to accept slightly higher expenses than usual. However, problems may arise when trust is broken by illicit practices like counterfeiting. At best ‘only’ economical losses are suffered, at worst health problems may arise.
Drinking a good spirit or wine is a hugely common social activity in many countries and thus an honest, historical, labor-demanding, and profitable industrial sector is devoted to those goods. Worldwide, the leading spirits markets in the 2010–2020 period according to value sales were (decreasing order) USA, Japan, Russia, China, UK, France, Germany, Mexico, Spain, and Canada [
1]. According to the last European survey and statistics [
2], during the period 2008–2013 EU annual production of spirits amounted to €22 billion and imports from third countries amounted to €1 billion (UK and France being the largest producers of spirits, with production valued at more than €5 and €4 billion, respectively) [
3]. More recent figures indicate a European production of 25 million hectoliters of spirits and about €37 billion sales [
4].
With such big figures in place, adulteration of alcoholic beverages has become a very important practice worldwide and a health-threating problem because methanol (a possible contaminant of ethanol) is very harmful for human health. A recent study presented by the EU Intellectual Property Office (EUIPO) compiled previous unreported studies in which around 5.3% of sales of spirits and wine correspond to counterfeited products (ca. €2.3 billion), which causes ca. €5.2 billion in total lost sales and affects around 31,850 lost employments [
5]. Unfortunately, these figures are rising fast [
6,
7] as the €1.3 billion lost sales in 2016 demonstrated [
7].
One of the most EU-demanded imported spirits is Mexican Tequila, which agrees with a worldwide rise in its demand during the last years and with ca. 3.6% increments until 2020 [
8]. In 2020, a total of 345.2 million liters of Tequila (207.2 million ‘100% agave’ and 137.9 million ‘mixed’) were produced within the denomination of origin of which 76.6% were exported [
7]. Tequila is the spirit obtained after the double distillation of milled and cooked pinecones or stems of Mexican Agave Tequilana Weber blue variety [
9]. Tequila’s denomination of origin was first established in 1974 [
10] and recognized by the EU in 1997 [
11]. The Tequila´s Regulatory Council (in brief, CRT,
Consejo Regulador del Tequila) was created in 1993 to certify the quality and authenticity of Tequila and to avoid its undue imitation outside Mexico. By 2017, five countries, including the EU, imported ca. 95% of exported Tequila (the US being by far the main importer).
In Mexico alone, Tequila distillers estimated that ca. 40–50% of Tequila sales were adulterated, yielding an economic loss of about US
$0.55 billion (equivalent to 60 million liters) [
12]. Various types of counterfeit are common, such as the addition of water, alcohol, colorants, and aromas to the original beverages, even under poor hygienic conditions, leading to potential risks associated to their consumption. In particular, the most frequent fraud is the increased amount of methanol in the beverage, well above the norm [
13]. To complicate things further, it is almost impossible for the final consumer to visually identify counterfeited Tequilas because they are sold as ‘original Tequila’, sometimes even in bottles and boxes that are very good copies of the original ones.
White Tequila is the non-matured (in wood barrels) spirit of blue agave. It is also called ‘silver’ Tequila and it is likely the most common type of Tequila sold worldwide. If the spirit is matured, it leads to rested and aged Tequila. A common form of counterfeiting white Tequila consists of an undue declaration at the label, stating that it is ‘100% from blue agave’ when, in fact, it was obtained from agave Tequilana Weber variety blue and other sources of fermentable sugars (sugar cane, other agaves, etc.). Please note that the second possibility is legal as far as only 49% of the fermentable sugars employed to get Tequila proceed from sources different from blue agave, which should be called ‘mixed Tequila’ or simply ‘Tequila’ and its denomination must be declared on the label according to CRT guidelines. Despite health might not be affected in this case, the denomination of origin and/or the label declaration is violated yielding deceptive products for consumers (including economic deception) and leading to economic losses to distilleries.
In previous works, reviews were made to ascertain the analytical techniques most commonly applied to authenticate Tequilas and it was concluded that from a pragmatic point of view usual infrared (IR) and ultraviolet–visible (UV–Vis) spectrometric techniques would be favored for routine quality control [
14,
15]. In fact, a study was presented in order to show that common UV–Vis spectrometry can be a powerful tool to assess different qualities of Tequila (with significantly different prices: white, gold, rested, and aged Tequilas) and that they can be easily differentiated from Mezcal, another Mexican spirit [
16].
The use of these spectrometric nondestructive techniques is usually potentiated by hybridizing them with multivariate data analysis (MVA) algorithms (in brief, chemometrics). That may lead to off-line or in-line sensors of potential interest for quality control and authentication analyses in the modern alcoholic beverage industry and related organizations. In addition, they are powerful, potential tools to evaluate the denominations of origin and to perform geographical discrimination of products. In addition, chemometric methods play an important role in the recent popularity of analytical screening methodologies. The essential objective of chemometrics is to extract useful information and get meaningful conclusions through the most appropriate data treatment, modeling, and characterization of samples, and the study of related variables [
17,
18,
19,
20].
Data fusion consists of combining results of different measurement techniques in hopes that they all can lead to more powerful and reliable authentication models, and to a better understanding of the chemistry behind the samples [
21,
22,
23]. Data fusion can be performed at low, mid, and high levels. The former consists simply of concatenating data from all sources into a single ‘raw’ data matrix. The mid-level approach first extracts separately important information from each data set and then concatenates it into one matrix. Finally, the high-level approach concatenates the individual results derived from classification or regression models to obtain a final data matrix [
23]. Despite several researches aimed at studying different properties of Tequila with chemometrics [
14,
24,
25], up to date, to the best of the authors’ knowledge, this is the first work which considers data fusion to handle spectroscopic data from Tequila.
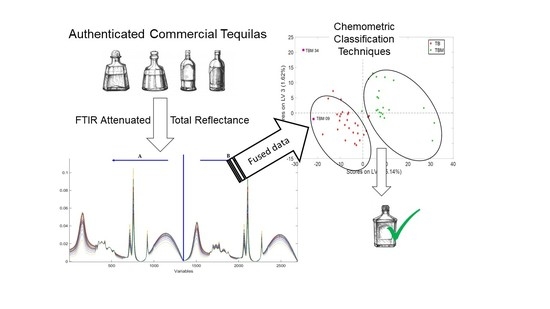
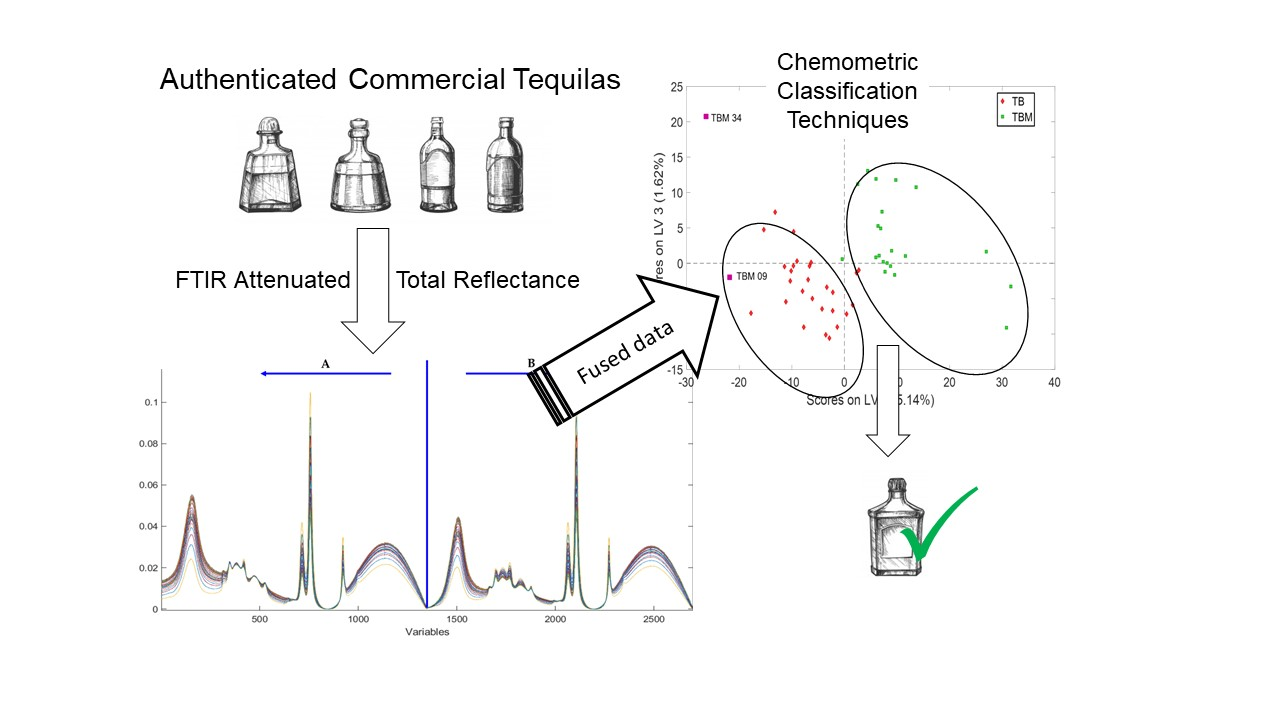
The aim of this paper is to develop a sensor-based methodology that combines IR spectrometry, chemometric tools, and data fusion to address a complex problem: to evaluate whether white Tequila is 100% from blue agave or whether it comes from a mixture of blue agave plus other sources of sugars (recall that to be considered Tequila, at least 51% of them should be from Agave Tequilana Weber blue variety). This is an insidious problem because the physicochemical and organoleptic properties of both categories of white Tequila are very similar (but for gross adulterations) and despite health might not be affected, deceptive products are released to consumers.
2. Materials and Methods
2.1. Samples
A total of sixty-five samples of white Tequila from different Mexican brands were used in this study. Thirty-six were of ‘100% agave’ category (TB—’Tequila Blanco’) and twenty-nine were of the ‘mixed’ category (TBM—’Tequila Blanco Mixto’). Samples were obtained in specialized Mexican liquor stores from well-known Tequila producers whose labels displayed the corresponding CRT quality seals, some bottles were provided by CRT itself. This collection was selected to include different factories, brands, raw materials, processing units, etc. Those details cannot be disclosed due to confidentiality agreements.
2.2. Instrumentation
A PerkinElmer Frontier FTIR Spectrometer, equipped with a single-reflection diamond PerkinElmer UATR device, was employed. Samples were withdrawn from the bottles and poured (50 µL) directly on the surface of the UATR to perform the measurements and capped with a lid. Then, the crystal was gently dried with cotton, washed with ethanol and distilled water, and dried with lens cleaning tissues. MIR (medium-range infrared) spectra were obtained in the 4000–400 cm−1 range, using 16 scans, with a nominal resolution of 4 cm−1, and background corrected (a background per sample). They were transformed to absorbance, ATR corrected (using the built-in PerkinElmer proprietary function) to take account of radiation penetration and baseline corrected; finally, they were digitized and exported (1 datum per cm−1).
Baseline correction was made setting the correction points manually for each type of Tequila before performing the MVA. The spectra of all Tequilas showed the same spectral bands, with minor differences in the spectral band centered around 1045 cm−1. In particular, the band was a bit broader for ‘100% blue agave’ Tequilas as it extended to 954.5 cm−1, whereas the band for the mixed Tequilas finished at 957.8 cm−1.
A practical problem arises here when the methodology is to be implemented in routine quality control laboratories because although selecting the baseline correction is simple for the authenticated samples used in modeling (e.g., a set of wavenumbers per category of white Tequila) this is not the case for real samples, for which the class is unknown (or suspicious) and so selecting the ‘correct’ baseline is not possible. A possible solution is to base the models on fused data gathered from different baseline corrections, as studied in next section.
2.3. Multivariate Analysis and Data Fusion
The spectral data treatments, digitation, and exportation were made using the PerkinElmer proprietary software, Spectrum. Unsupervised models—used to visually explore data—such as principal component analysis (PCA) and supervised models—employed for classification purposes—like partial least squares (PLS), soft independent modeling for class analogy (SIMCA), and partial least squares discriminant analysis (PLS-DA) were built using PLS_Toolbox 8.6.1 (Eigenvector Research, Manson, WA USA) for MATLAB environment (MathWorks Inc., Massachusetts, USA, versions R2015a and R2017b). The classification results of each model were evaluated with several quality performance metrics (QPM), mainly: (i) sensitivity (SENS), (ii) specificity (SPEC), (iii) positive predictive value (PPV) or precision, and (iv) negative predictive value (NPV). Twenty-two complementary QPMs for each classification model—calculated from the four main QPMs previously mentioned—are also presented. However, detailed explanations for each of them are out of the scope of this work. The reader is kindly referred to the literature cited herein where detailed information can be found [
26,
27].
After preliminary studies focused on detecting outliers and searching for the spectral regions less affected by the spectral bands of the OH group (water plus alcohols), the spectral working region was established at the fingerprint region, i.e., 1800–451 cm−1.
At the same time, the baseline correction had to be considered in a pragmatic way. As samples to be investigated might be in reality of any of the two categories (classes), and so without a sound reason to select the baseline correction of the ‘mixed’ or of the ‘100% agave’ Tequilas, a way to consider this into the models is to develop them with two baseline corrections:
A unique correction for all kinds of white Tequilas (4000, 957, and 450 cm−1); and
A baseline correction specific for each class (4000, 1854, 954.5, and 450 cm−1 for Tequilas ‘100% agave’; and 4000, 1854, 957.8, and 450 cm−1 for the mixed ones).
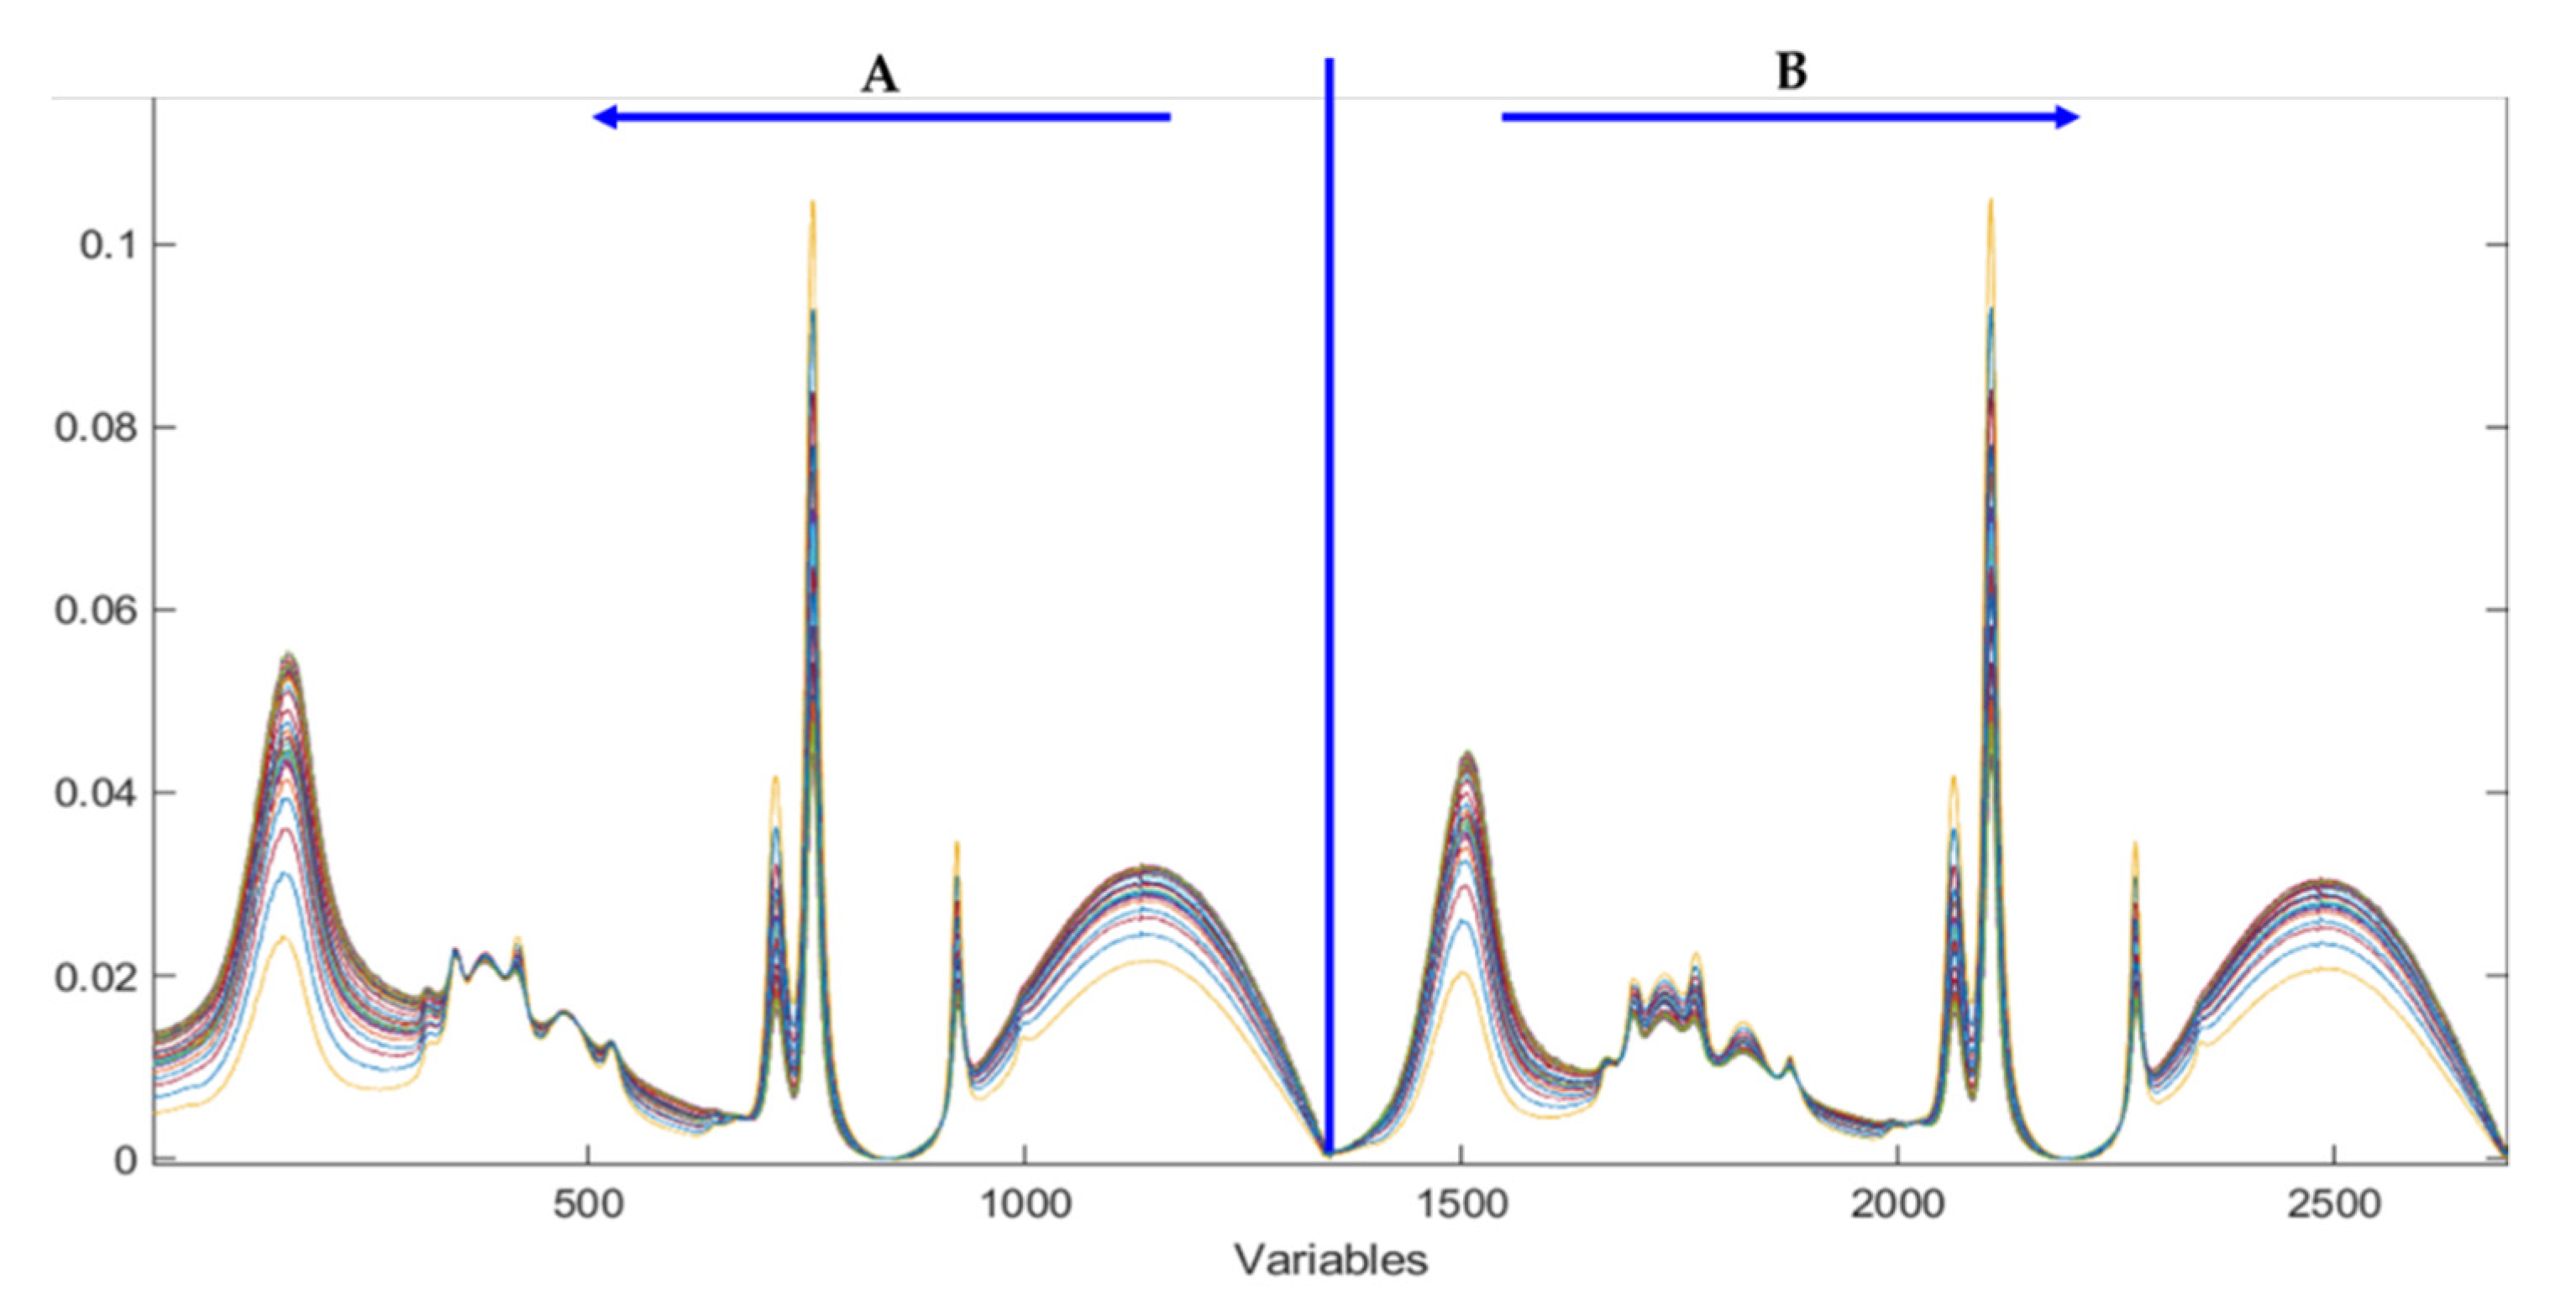
For simplicity, let us call blocks (or matrices)
A and
B the options in points 1 and 2, respectively. Hence, the low-level data fusion [
21] consisted of concatenating block
B to block
A after its 1350th variable, forming a new fused-data matrix [
A B], of the size 65 × 2700 (samples × variables). In this way, the suspicious sample will be corrected at the common points and at the ‘100% agave’ ones (it will be absolutely rare to sell ‘100% agave’ Tequila as ‘mixed’).
The training set was made up of fifty samples randomly selected, twenty-seven for TB class and twenty-three for TBM class. The fused-data matrix [A B] was auto-scaled and used for the exploratory analysis with PCA and PLS, and for the authentication analysis with SIMCA and PLS-DA. Venetian blinds was employed as cross-validation technique, using ten PCs (PCA and SIMCA) or LVs (PLS and PLS-DA), ten splits, and one sample per split.
Different classification models were studied, each of them with different setups, and once the most satisfactory model for each chemometric approach was selected, external validation was performed using a validation set composed of 15 samples, 9 for TB and 6 for TBM classes, which was auto-scaled using the parameters derived from the training set.
3. Results and Discussion
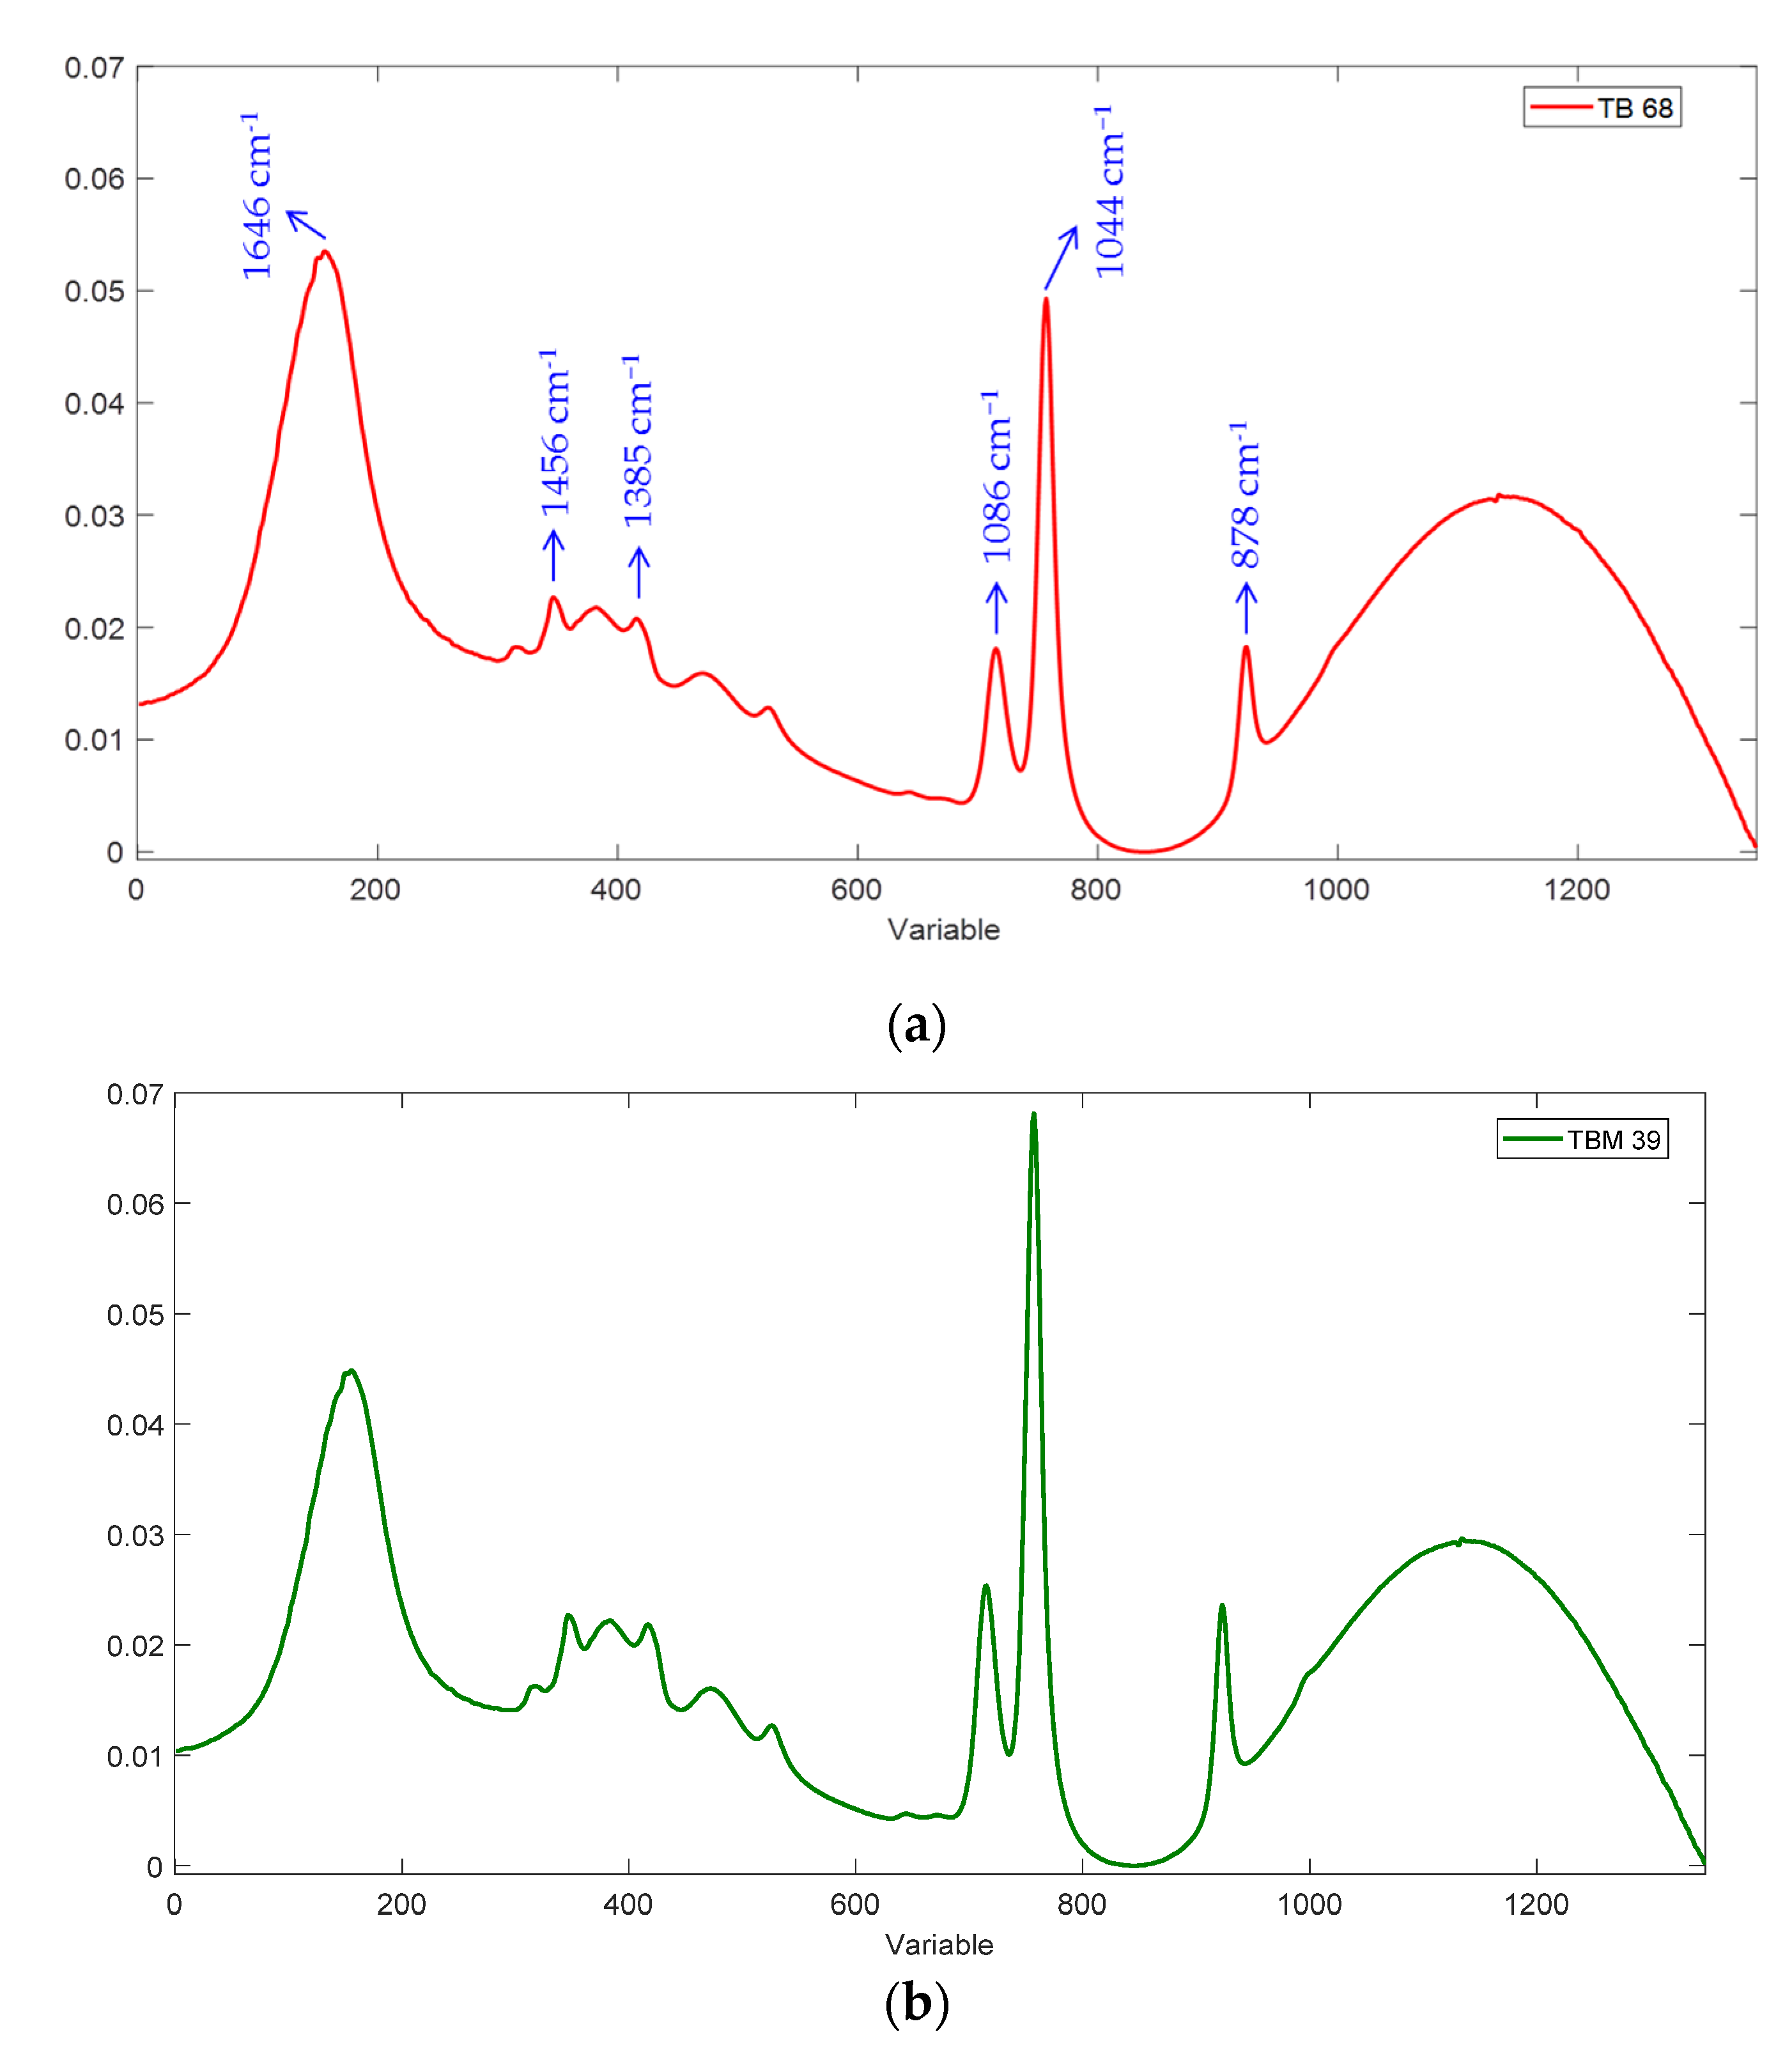
The IR fingerprints of two representative samples of TB (100% agave) and TBM (mixed) classes are displayed in
Figure 1. Strong molecular vibrations are observed in this characteristic region of white Tequila. In essence, the pronounced peak from variable #155 (1646 cm
−1) is assigned to the bending vibration of OH in water and to the O–H deformation, which is important in the identification of alcohol compounds. The small peak at variable #345 (1456 cm
−1) corresponds to C–OH bending deformation. The small band at variable #416 (1385 cm
−1) may be due to the stretching vibrations of C–O of tartaric acid whilst the band at variable #715 (1086 cm
−1) may be due to the stretching vibration of C–O of sucrose (C–O stretching of secondary alcohols). These two latter bands overlap with the C–H stretching of CH
2 and CH
3 moieties. The sharp peak represented by variable #757 (1044 cm
−1) is attributed to the stretching vibration of the C–O bond in primary alcohols, and the small peak at variable #923 (878 cm
−1) is assigned to some meta–disubstituted aromatic compounds in white Tequila [
28,
29,
30].
The fused-data matrix is shown in
Figure 2. It is worth noting that independent data analysis of blocks
A and
B showed poor results, but when data were fused, the exploratory analysis and the authentication analyses improved notably (i.e., the number of misclassifications decreased).
3.1. Exploratory Analysis
The main goal of exploratory data analysis is to visually identify possible groups of samples [
31], being the most common technique for this PCA. Despite the typical predictive use of PLS, it can also be used for exploration purposes since its algorithm pursuits the calculation of factors that capture both variance and correlation [
32], thus resulting more powerful than PCA.
For the [
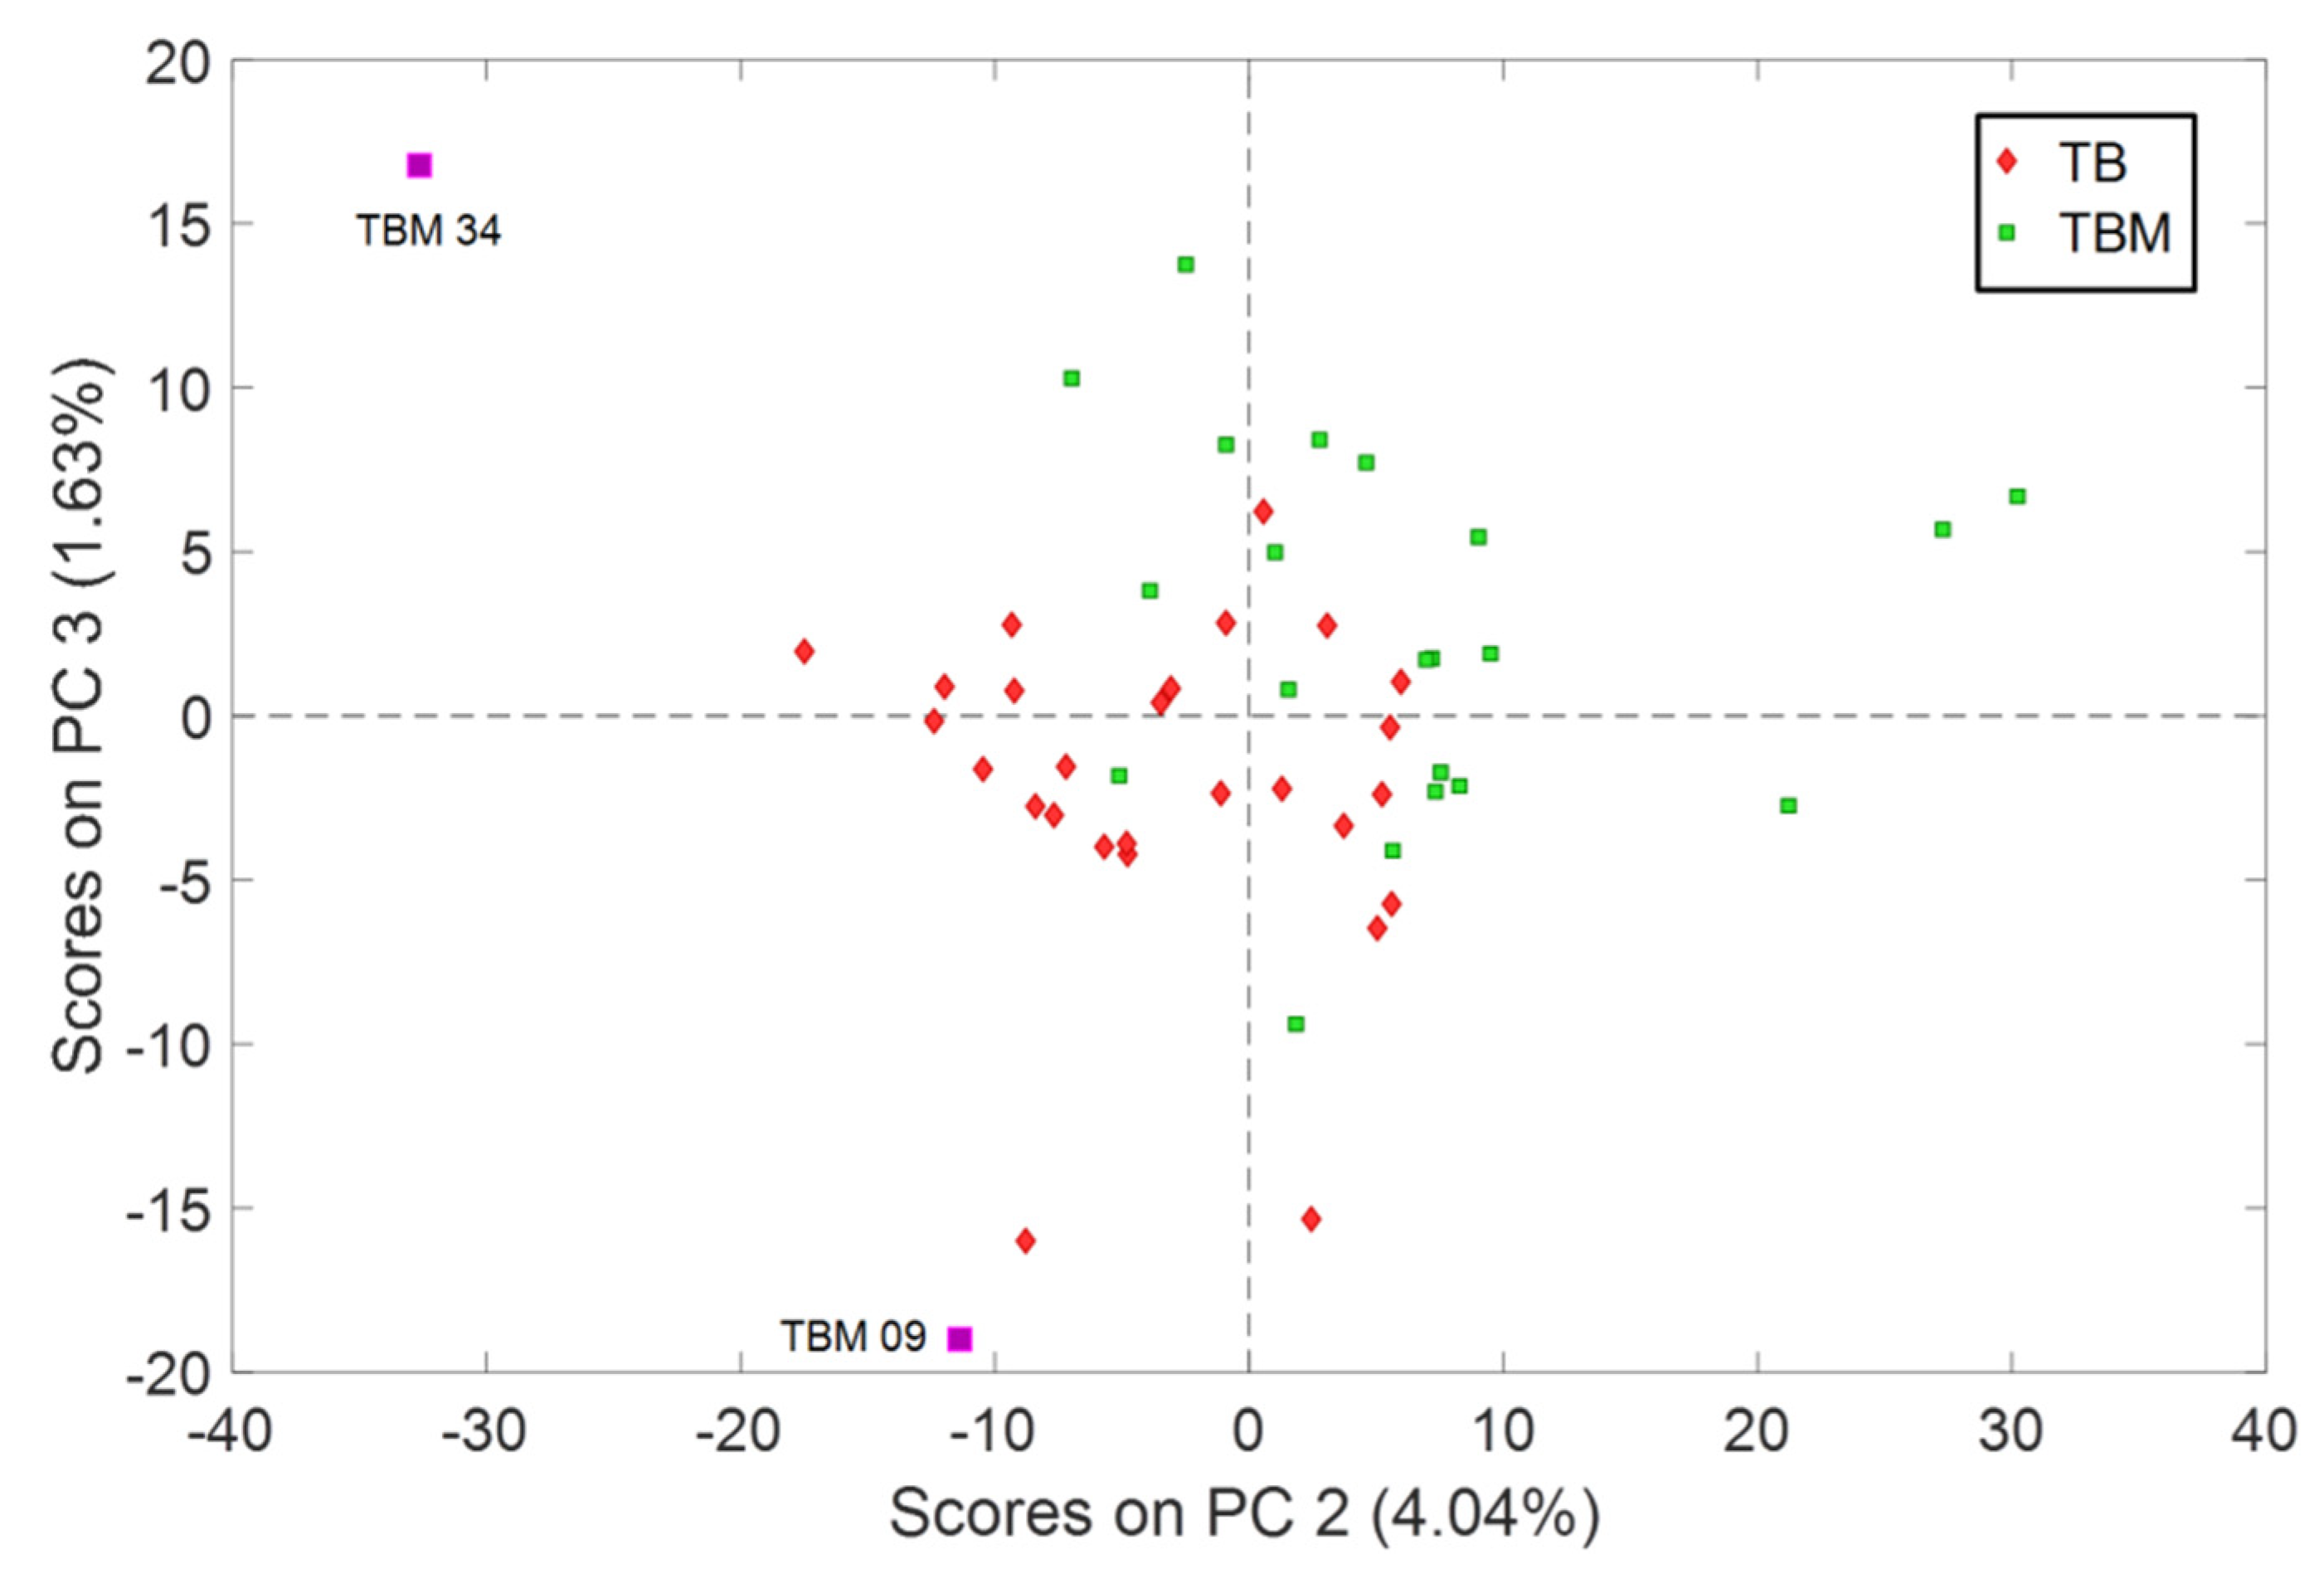
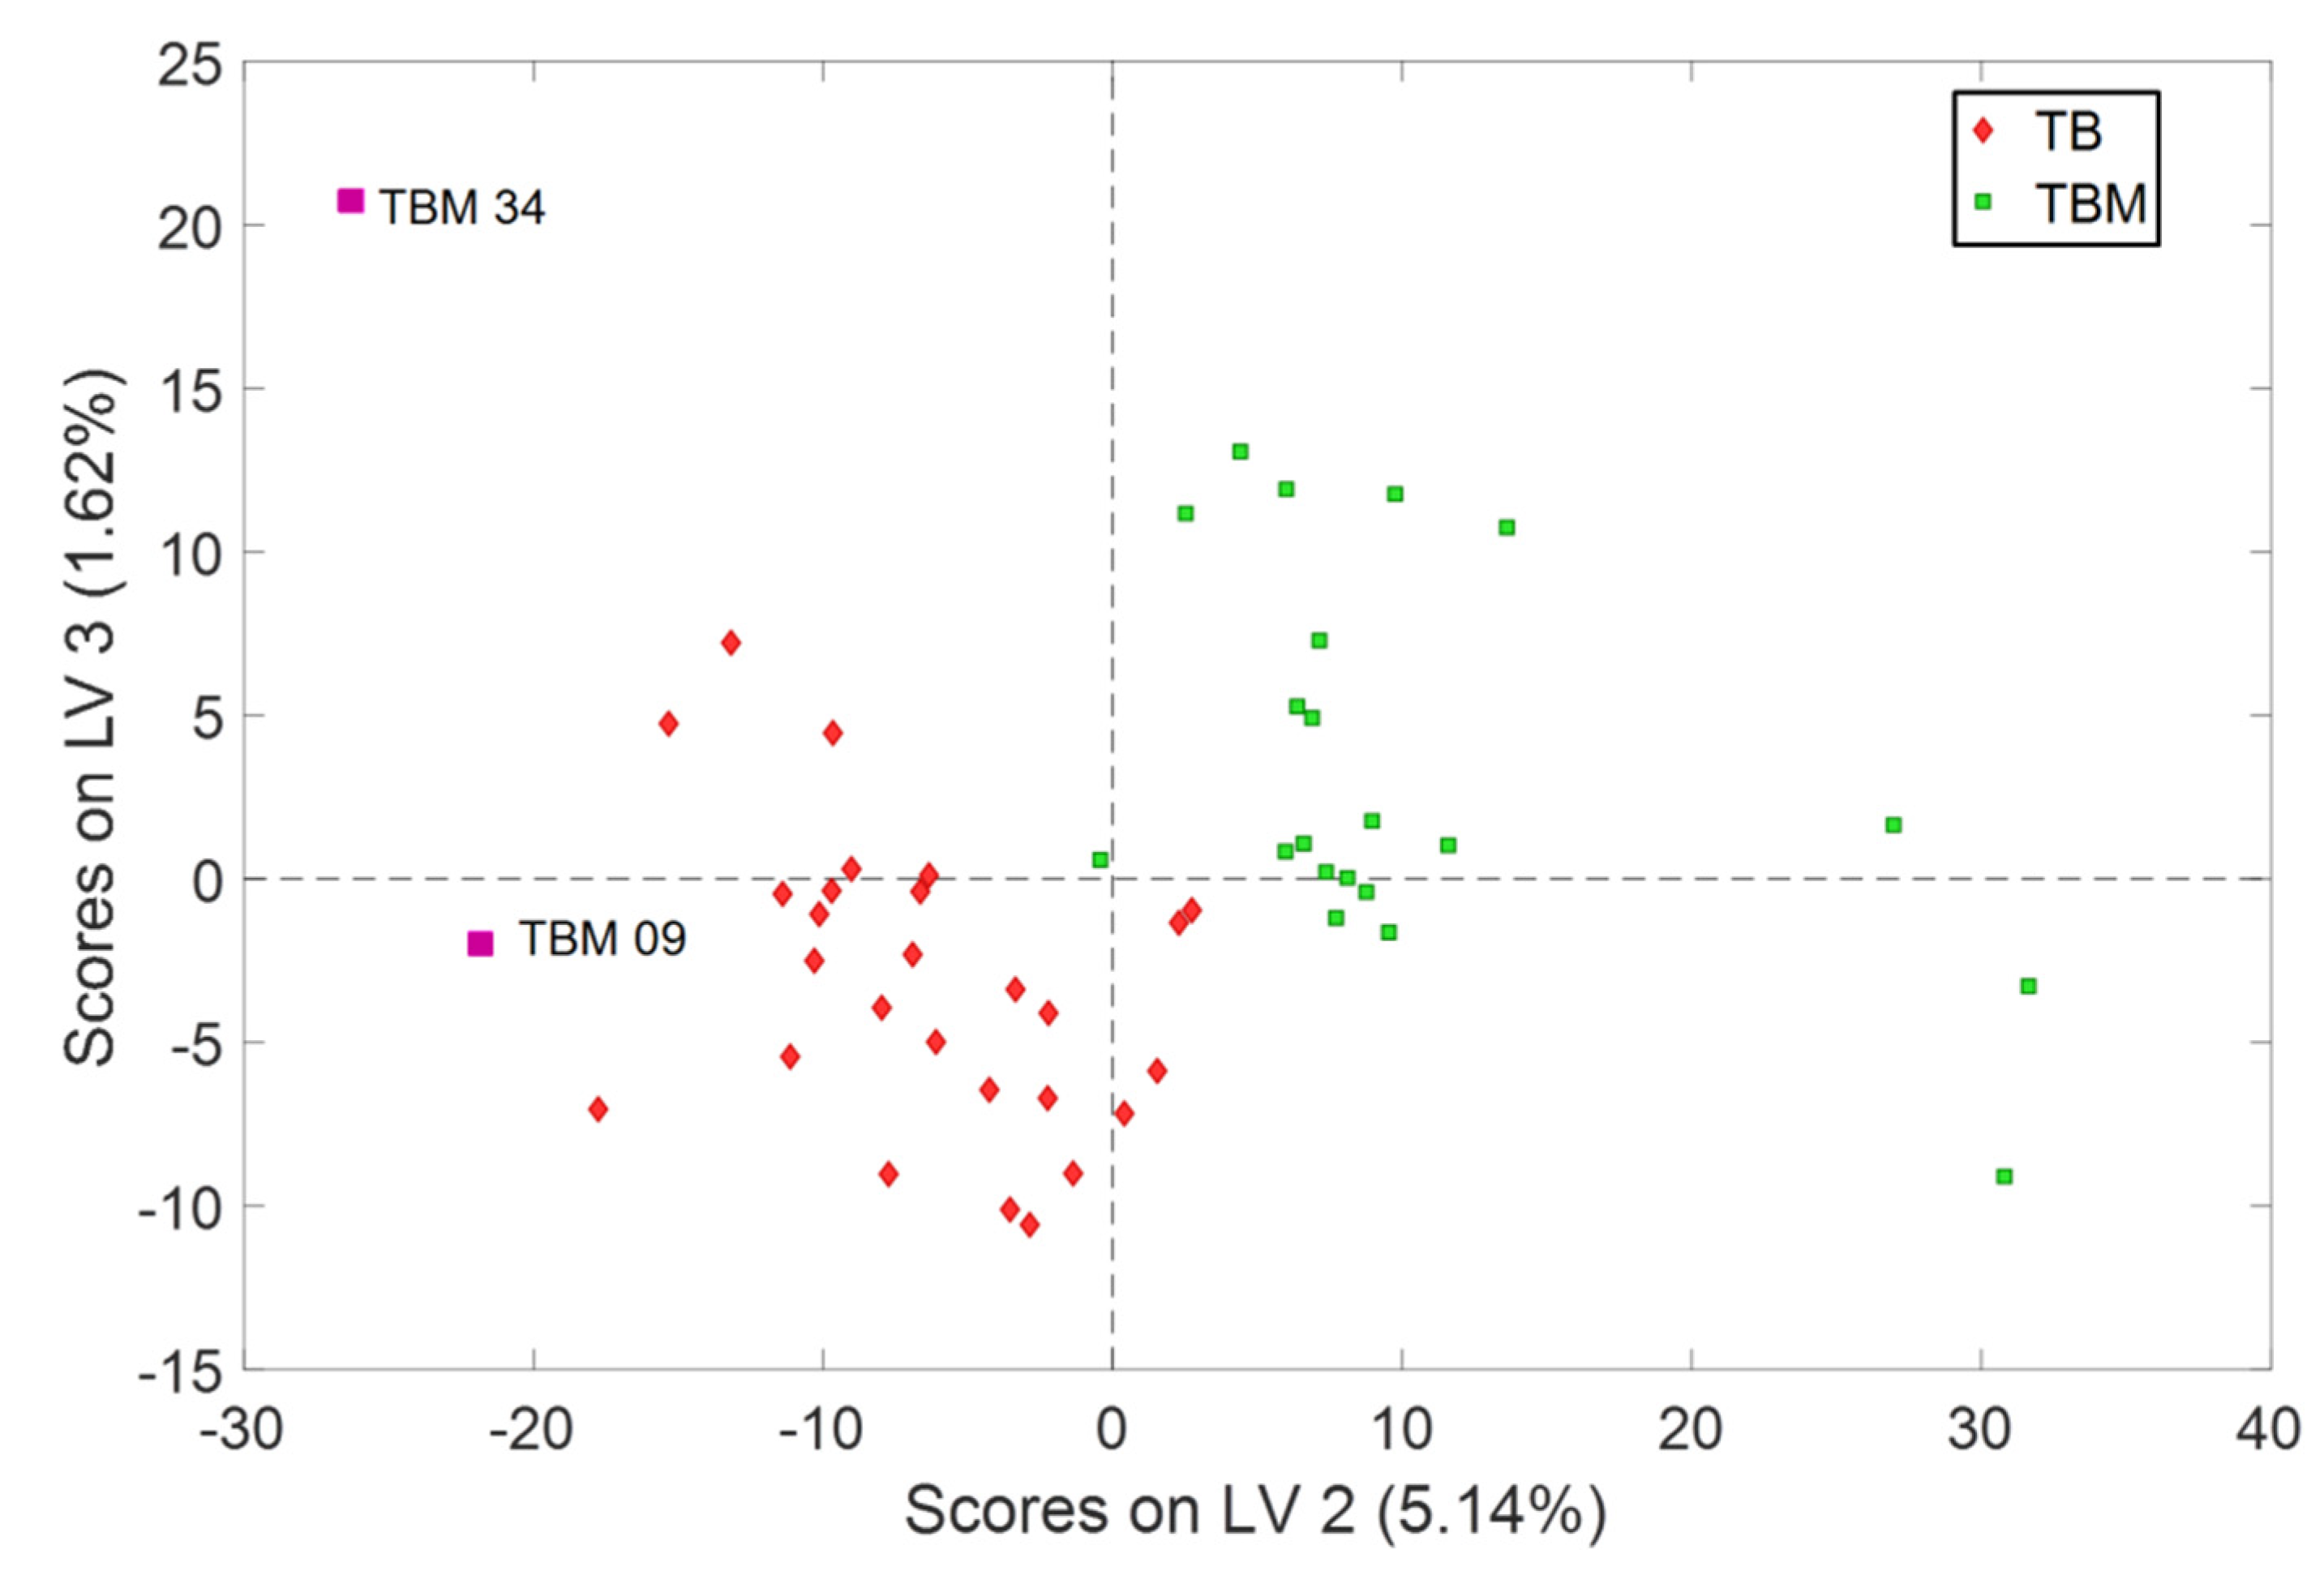
A B] fused dataset, the PCA model required three principal components (PCs), which were selected according to the explained variance (97.8%) and visualization of the information of interest (results in this respect where very poor); whilst for the PLS model, three latent variables (LVs) were considered, which explained 97.3% of the variance, with root mean square errors for calibration (RMSEC) and cross-validation (RMSECV) of 0.50 and 0.55, respectively (they are very similar, so overfitting is not expected). Note that PC1 explained ca. 92% of the information but it is not displayed here because it ‘merely’ ordered the samples according to the percentage of ethanol they had. However, no useful groups of samples could be visualized. Indeed, the only vision that allowed some differentiation (very poor) is presented in
Figure 3. If different color codes or symbols would not have been used no groups would have been guessed. On the contrary, PLS displays quite clear groups, with the two categories easily differentiated (
Figure 4). Additionally, samples TBM 09 and TBM 34 were misplaced in the score plots, but only TBM 34 was considered as an outlier since it affected the classification models and thus it was excluded from the models. The reason for such different behavior among the two techniques is, precisely, what makes PLS so powerful: the extraction of spectral information maximally related to the property of interest, while PCA only decomposes the overall variance in its major components (regardless of being useful to see groups of samples).
3.2. Authentication Analysis
After data exploration, SIMCA and PLS-DA models were employed to authenticate white Tequila considering the ‘100% agave’ category as target class. The results are summarized below.
3.2.1. SIMCA
This chemometric method builds a classification model with classes independently modelled (hence its name) from the training set. First, an individual PC model is built per class. In this case, since previous PCA exploratory analysis suggested three PCs, they were studied and kept for both classes. They explained 98.6% and 98.1% of the variance for TB and TBM, respectively. Then, spatial regions of probability around each Tequila class are constructed considering the average distances of the samples to the PCs subspace and a critical distance is calculated by means of an F statistic [
32].
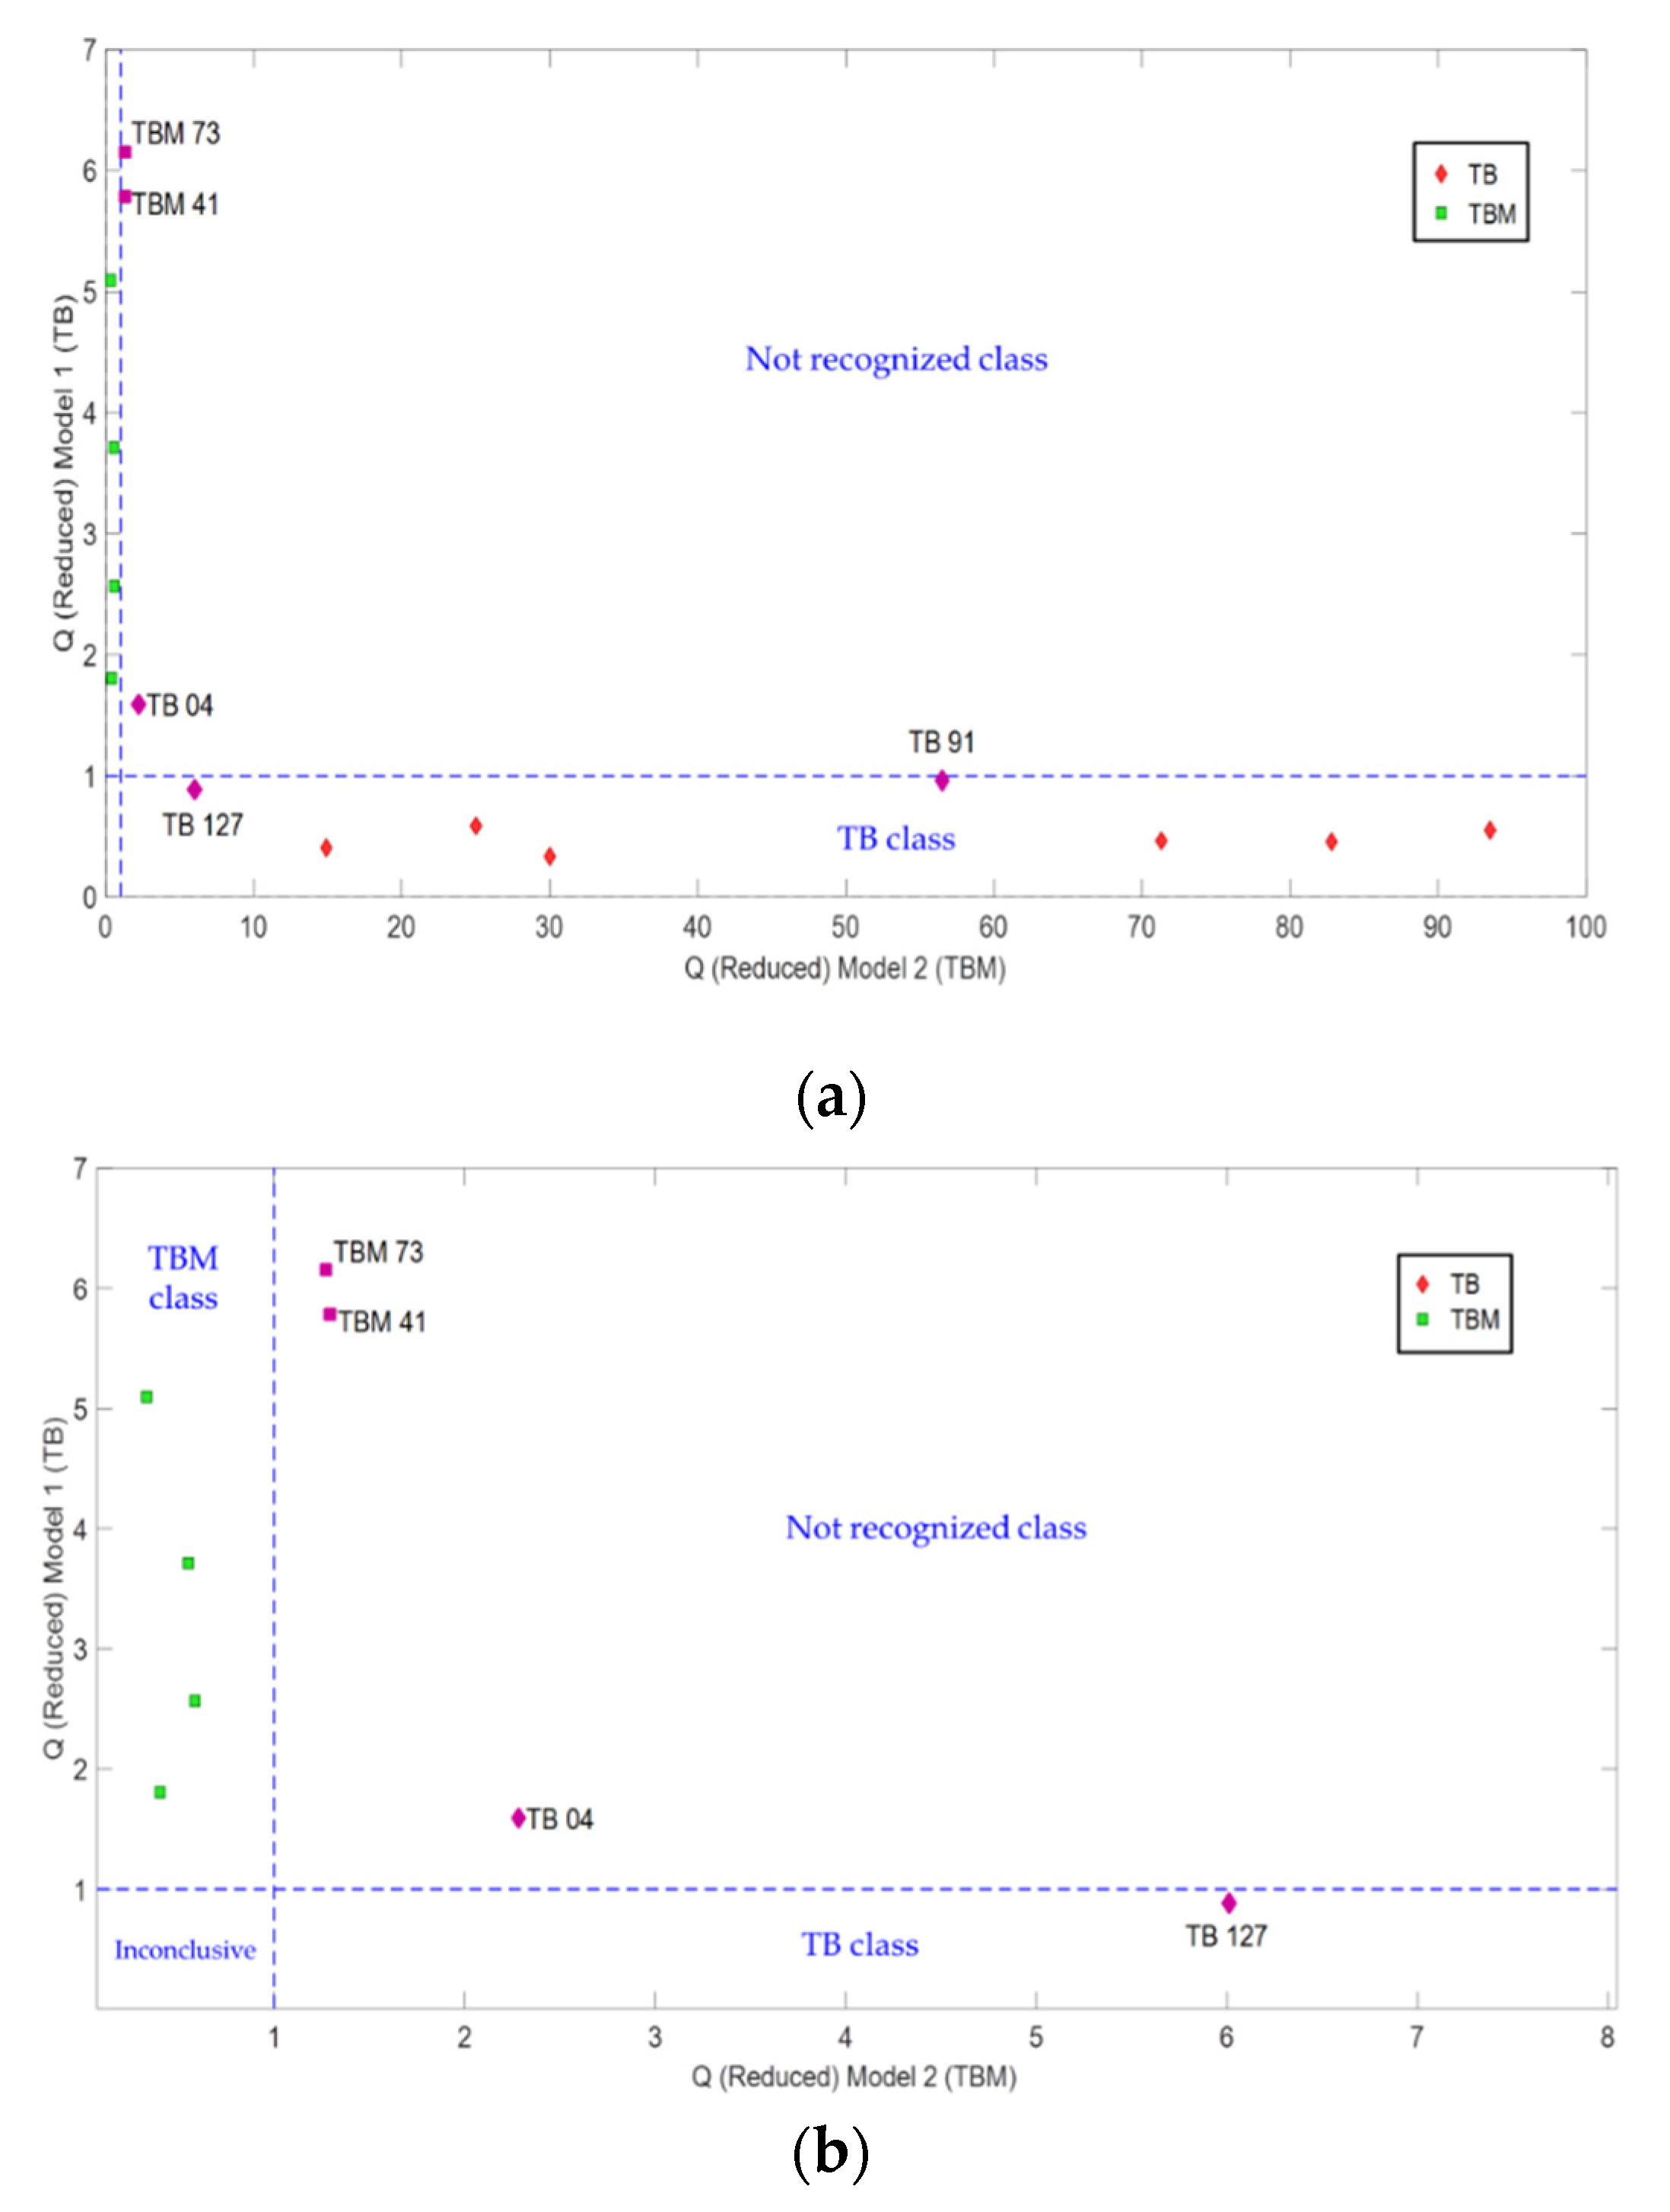
The classification results can be evaluated with the Coomans’ plot (
Figure 5). Samples coded as TB 04, TBM 41, and TBM 73 are placed in the upper-right quadrant, which are considered as not recognized and are not classified in any of the two classes. Moreover, samples TB 91 and TB 127 are correctly classified, but close to the boundary of the not recognized quadrant, which may indicate that these samples could present some authenticity (i.e., compositional) problem.
Table 1 presents the contingency results that were used to calculate the QPM figures (
Table 2). The sensitivity (SENS) also known as ‘recall’ or ‘true positive rate’ indicates the ratio of agreement of TB class, and specificity (SPEC) or ‘true negative rate’ shows the ratio of agreements of TBM class. For the SIMCA model, SENS and SPEC were 0.89 and 0.67, respectively. Though these values can be considered low, the result for the predictive capability (both positive predictive value (PPV) or precision, and negative predictive value (NPV)) is 1.00 for each of them. These results indicate that the model is good in assigning samples to classes, since precision represents the proportion of target samples correctly allocated in TB class and NPV the proportion of target samples correctly assigned to TBM in relation to the total samples assigned to those classes, respectively.
3.2.2. PLS-DA
PLS-DA is a latent variable-based method that, first, builds a PLS regression model using a set of latent variables (LV) that are employed to establish limits for the classes and, then, it carries out a discriminant analysis (DA) to classify the samples into a particular class. The boundaries among the different classes are calculated using the Tequilas training set only.
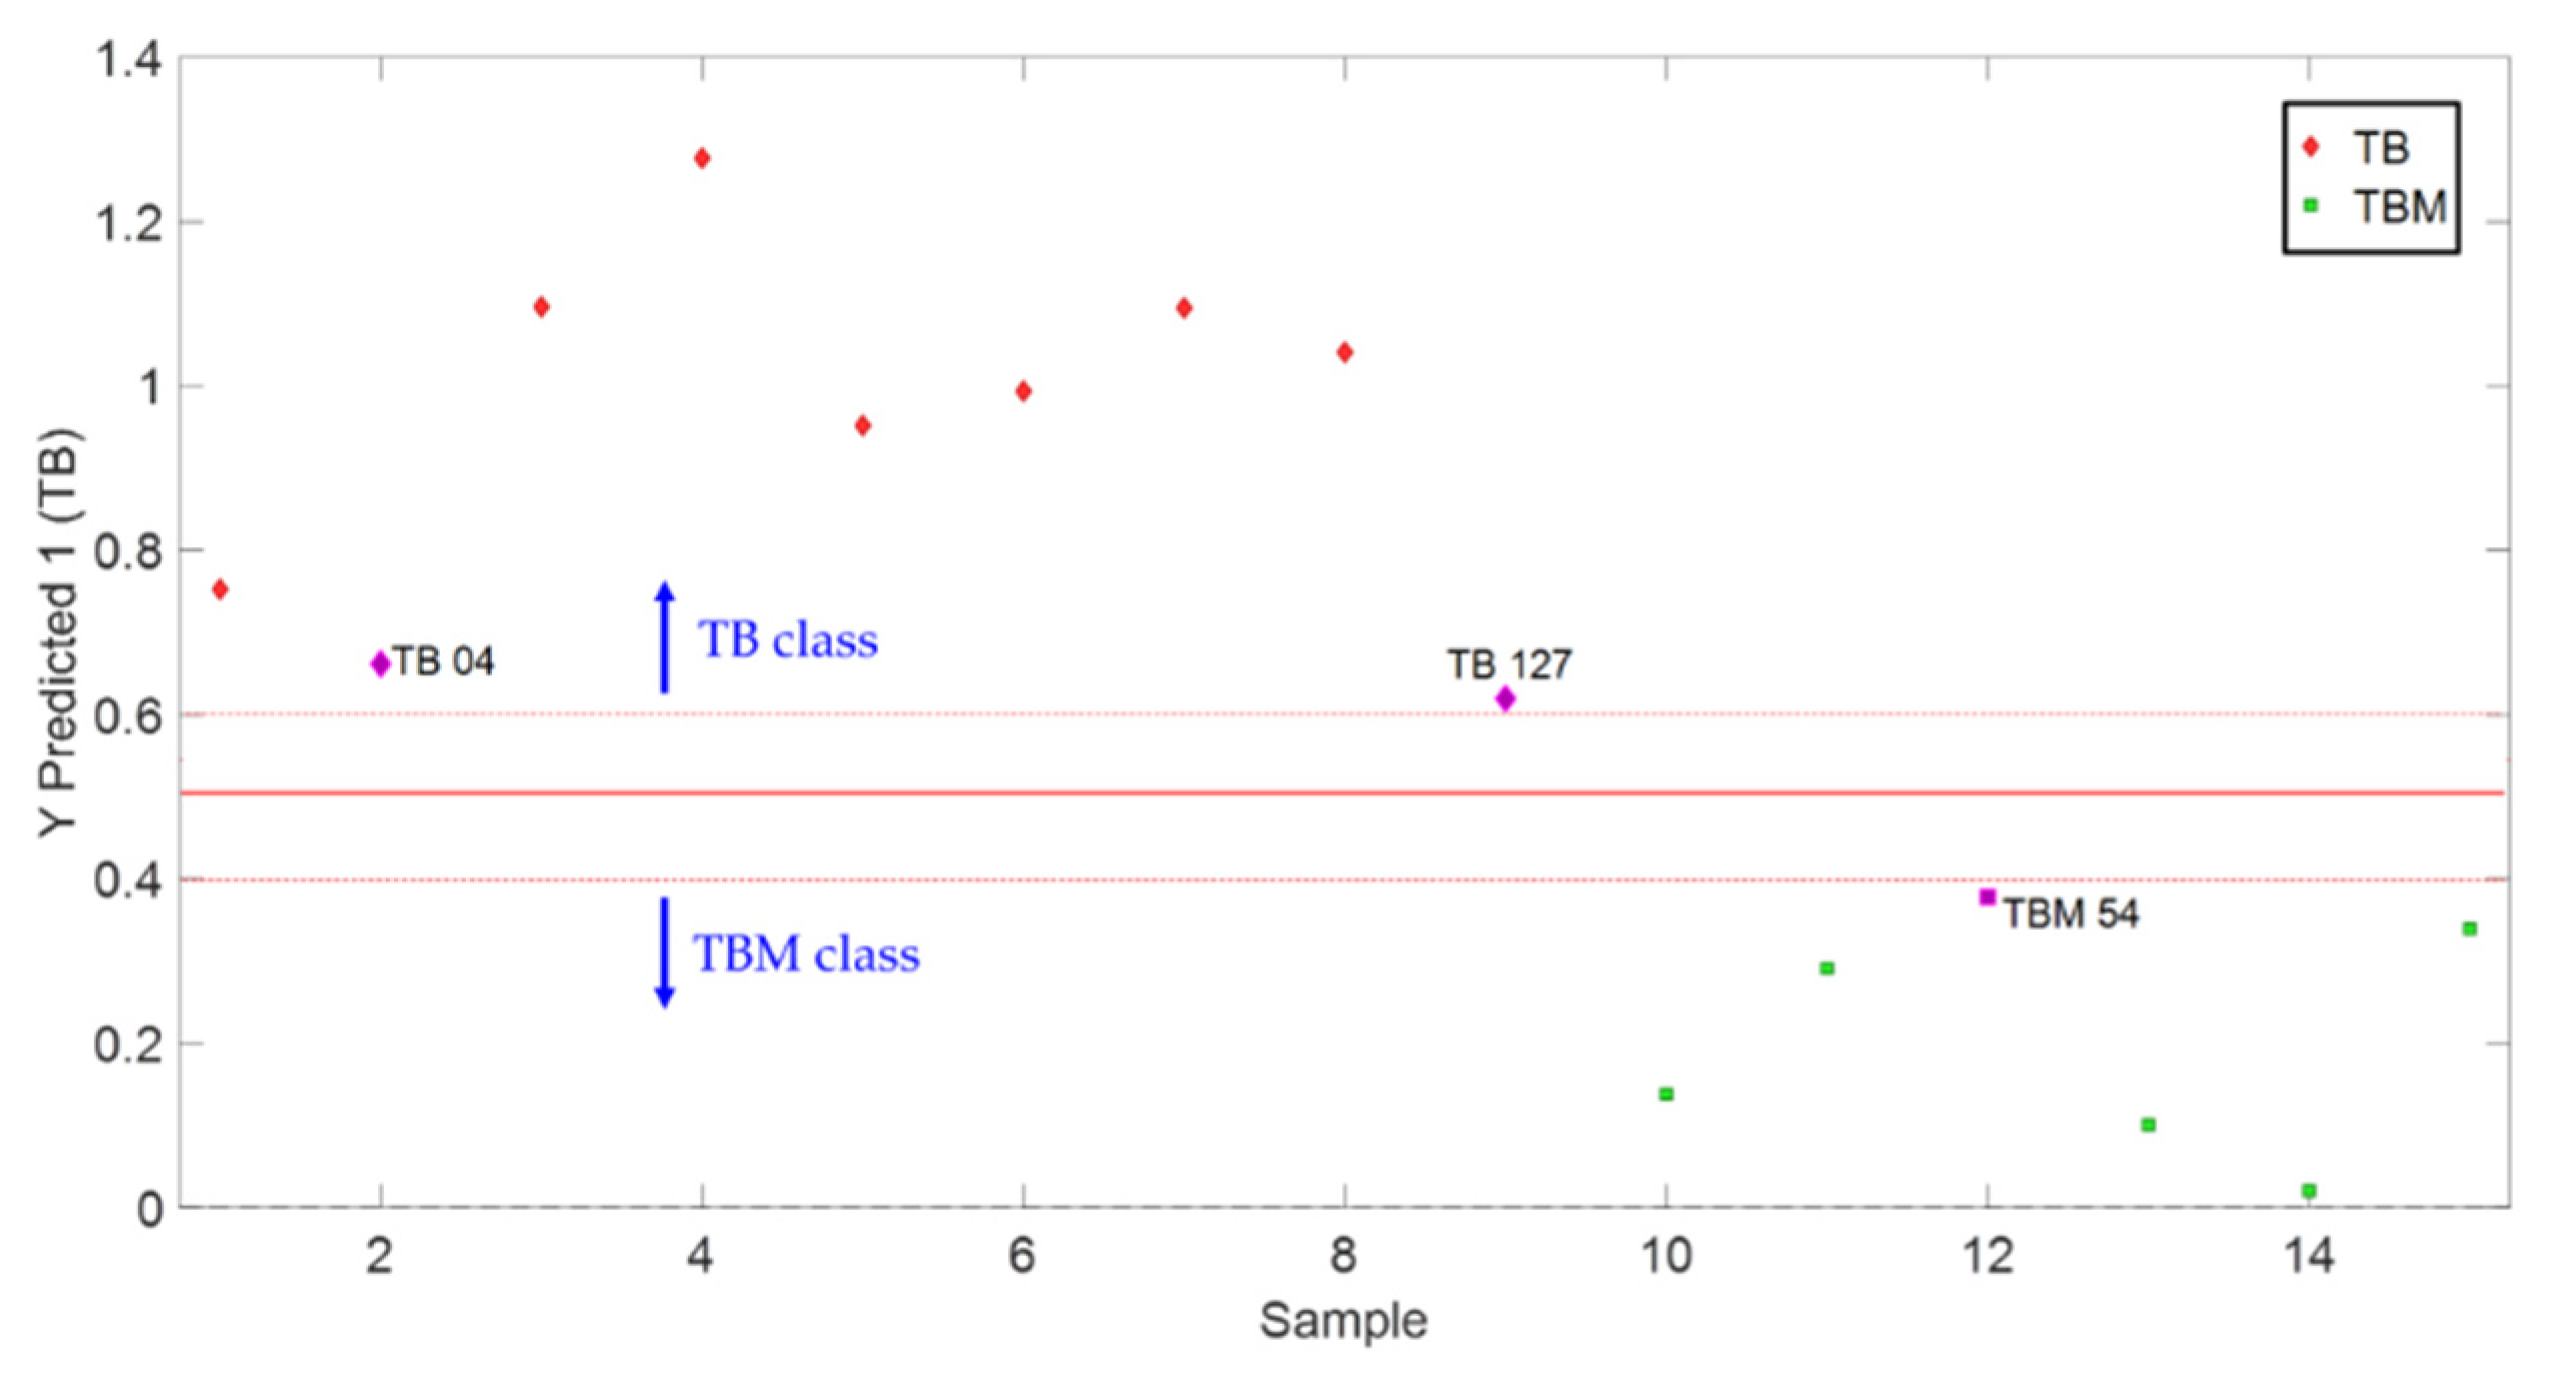
In this study, three LVs (explaining 97.3% of the total variance) were used to create the PLS-DA model from the IR fused data. For this, ‘100% agave’ and ‘mixed’ Tequilas were coded as 1 and 0, respectively. A threshold value of 0.5 was established as a decision criterion for the classification of the samples. In this sense, samples with scores above the decision criterion (values around one) were classified as ‘100% agave’ whereas samples with scores below the decision criterion (values around zero) were considered as ‘mixed’. Moreover, an uncertainty region of plus/minus 0.1 the threshold value was established to improve the reliability of the validation results.
Figure 6 displays the PLS-DA classification plot. The solid line represents the threshold value whereas the dotted lines indicate the uncertainty region, where the sample is labeled as inconclusive. For the current model, all samples were correctly classified in their corresponding categories in validation. However, validation samples TB 04, TB 127, and TBM 54 are close to the uncertainty region. In fact, special attention must be given to samples TB 04 and TB 127 because slightly problematic results were obtained for them also with SIMCA, where sample TB 04 was not recognized by the model and TB 127 was allocated near the limit of ‘not recognized’ quadrant.
The contingency results for validation are shown in
Table 3, which were employed to obtain the main four QPMs (
Table 2). According to these results, it becomes clear that the PLS-DA model is able to correctly classify new samples in the corresponding class with 100% confidence.
In addition, twenty-two other QPMs reported in literature were calculated for a more comprehensive evaluation of the models (
Table 4).
The conclusions derived from the QPMs results shown in
Table 4 are in agreement with the typical four main QPMs (
Table 3). They all indicate that the PLS-DA model is capable to classify unknowns better than SIMCA since the parameters that report good quality of the model and/or good probability of classification (i.e., SENS, SPEC, PPV, NPV, YOUD, EFFIC, AUC, MCC, and Bayes’ conditional probabilities 1/1 and 2/2) are equal or close to one. For instance, YOUD indicates that PLS-DA model is more reliable for classifying both classes than SIMCA model; EFFIC shows the ratio between agreements (i.e., correct assignations) and the total number of objects, which is better for PLS-DA than for SIMCA; and AUC demonstrates that PLS-DA is better avoiding errors during classification than SIMCA.
Moreover, the parameters that indicate bad quality/probability of misclassification (i.e., FPR, FNR, MR, and Bayes’ conditional probabilities 1/2 and 2/1) are low or equal to zero. In this sense, MR displays the ratio between errors (i.e., wrong assignations) and the total number of objects, which is lower for PLS-DA than for SIMCA. PROB (1/2) refers to the probability of an object being assigned to TBM class when it belongs to TB, which is better for PLS-DA than for SIMCA; and analogously for PROB (2/1).
Furthermore, SIMCA was not able to classify three samples in any class (TB 04, TBM41, and TBM73), considering them as not recognized. All QPMs for PLS-DA were equal to 1.00 with no inconclusive samples. Every Tequila sample of the ‘100% agave’ (TB) category was correctly classified (probability = 1), as well as the ‘mixed’ (TBM) ones (probability = 0). Noteworthy, no ‘mixed’ Tequila sample was included in the ‘100% agave’ category, which is a very positive and relevant result. Additional studies in which particularly conflictive products (sold as low-price Tequilas in urban and rural marketplaces) and potential fraudulent samples are considered, are under development.
4. Conclusions
The current research presented the development of an analytical methodology based on the combination of a common but powerful screening sensor, an FTIR instrument, and multivariate classification tools to authenticate two commercial categories of white Tequila (‘100% agave’ and ‘mixed’). The mid-IR spectra of a broad collection of commercial samples were collected and baseline corrected according to their classes. However, this posed a problem when studying truly unknown samples because it is not obvious how to baseline correct their spectra.
Therefore, a low-level data fusion approach was considered (to the best of our knowledge, this is the first study which involves data fusion to authenticate Tequilas). In this context, the solution was to develop multivariate models based on fused data gathered from diverse baseline corrections since differences between both classes are taken into consideration. This avoided subjective decisions when trying to select the ‘correct’ baseline correction for unknowns. In this sense, the results presented here demonstrated that multivariate discrimination models addressed the authentication of the two Tequila categories. Noteworthy, no ‘mixed’ Tequila sample was included in the ‘100% agave’ category, which is a very positive and relevant result. The model finally selected was even able to cope with two complex samples declared as ‘100% agave’ which were not obviously classified as such.
This sensor-based methodology is fast, cheap, non-destructive, and it allows for potential on-line/at-line implementations, and it can be straightforwardly implemented in routine quality control laboratories. The use of data fusion approaches to develop the multivariate authentication models for Tequila is highly recommended not only for the industry but for regulatory organizations.


 ,
, 


