Article

Discriminating Bacteria with Optical Sensors Based on Functionalized Nanoporous Xerogels

1
CEA, DSM/IRAMIS/NIMBE /Laboratoire Francis Perrin, URA 2453, bât. 522, Gif-sur-Yvette F-91191, France
2
Department of Technology for Biology and Health, CEA-LETI-MINATEC, 17 avenue des Martyrs, Grenoble F-38054, France
3
SA, 5 rue des Berges, Grenoble F-38000, France
4
CNRS, DSM/IRAMIS/NIMBE, Laboratoire Francis Perrin, URA 2453, bât. 522, Gif-sur-Yvette F-91191, France
*
Author to whom correspondence should be addressed.
Current affiliation: École des Mines de DOUAI, Département Sciences de l’Atmosphère et Génie de l’Environnement, 941 Rue Charles BOURSEUL, CS 10838, Douai F-59508, France
Chemosensors 2014, 2(2), 171-181; https://doi.org/10.3390/chemosensors2020171
Submission received: 13 December 2013 / Revised: 12 May 2014 / Accepted: 22 May 2014 / Published: 11 June 2014
(This article belongs to the Special Issue Photonic Sensors for Biological and Chemical Measurements)

Abstract

:
An innovative and low-cost method is proposed for the detection and discrimination of indole-positive pathogen bacteria. The method allows the non-invasive detection of gaseous indole, released by bacteria, with nanoporous colorimetric sensors. The innovation comes from the use of nanoporous matrices doped with 4-(dimethylamino)-cinnamaldehyde, which act as sponges to trap and concentrate the targeted analyte and turn from transparent to dark green, long before the colonies get visible with naked eyes. With such sensors, it was possible to discriminate E. coli from H. alvei, two indole-positive and negative bacteria after seven hours of incubation.

Graphical Abstract

1. Introduction

Microbial contamination is an important problem in medicine, food, the pharmaceutical industry, and in biotechnology. In these fields a rapid detection, identification and phenotypic characterization of microorganisms is crucial for triggering adapted treatment, control or safety procedures. Bacteria can be detected and identified by standard microbiological methods based on their phenotypes: shapes, biochemical characteristics, and virulence properties. Over a long period of time, a large part of the innovations in this field has been linked to improvements and automation of phenotypic methods, using chromogenic or fluorogenic molecules. In parallel, powerful methods based on chemical characterization of bacteria themselves have emerged. Genetic profiling, based on the analysis of 16S DNA sequences, has become a reference method for bacterial identification, now opening the way to metagenomic analysis through the unprecedented acceleration of sequencing methods. Mass spectrometric (MALDI-TOF) analysis of bacteria has also emerged as a new powerful classification method that is now in routine use in clinical microbiology laboratories [1]. Optical spectroscopic methods including fluorescence, Raman, IR, that give information about the chemical composition of bacteria, have been shown to discriminate between bacteria down to the strain level [2,3]. The use of such methods, however, is limited by the complexity of the associated instrumentation and protocols, and the need to show a good correlation of their results with those of the robust and low cost phenotypic reference methods.
Detecting a metabolic fingerprint is another method of interest since it could facilitate the correlation with reference methods by analyzing cellular byproducts linked to the bacterial phenotype. Depending on their phenotype, bacteria can release a complex mixture of metabolites. Among these, volatile organic compounds (VOC) raise a growing interest, since they are measurable through non-invasive methods. Recently, a tremendous work of identification of the VOC released from in vitro bacterial cultures was performed, using reference methods like gas chromatography (GC) [4], GC coupled with mass spectrometry (GC-MS) [5], proton-transfer reaction mass spectrometry (PTR-MS) [6] and selected ion flow tube coupled with mass spectrometry (SIFT-MS) [7,8,9,10]. A large number of VOC including alkanes, alkenes, alcohols, ketones, aldehydes, thiols or amines were identified and quantified so that a “VOC profile” could be in some cases correlated with bacterial identification. Although such methods provide unprecedented sensitivity and specificity for detection and identification of VOCs in complex mixtures, the complexity and cost of the instrumentation used still largely precludes their use in the field.
Artificial noses have emerged as alternative—potentially portable—testing systems. Most of them are based on field-effect transistors and resistors [11]. The specificity of each sensor is mediated by the specific interaction of target molecules with capture molecules grafted onto the sensors. Alternatively, in a further simplification step, inexpensive and simple methods based on colorimetric sensors have recently been developed. For instance, the “colorimetric nose” proposed by K. Suslick is a cross-responsive array of 36 sensor elements [12], each sensor being a dot of dried colorimetric chemoreactant showing an extended selectivity range. The non-selective sensors of the array are combined in order to cover a wide range of families of chemicals. This approach is attractive but has some drawbacks. As the color of the spots can change with time (disappearance of color or color change), due to the change of the interactions of the probe molecules with the analytes emitted with time by bacteria, the kinetics profile of each spot must be followed with time at least over 600 min, starting with media inoculated with ~3.0 × 10⁸ to 1.5 × 10⁹ cfu/mL. Moreover, the kinetics data must be collected for each bacteria to obtain a data set, important enough for the bacteria discrimination. Alternative solutions have been proposed in the literature to overcome these problems, in particular the use of selective probes. McDonald et al. report the identification of microorganisms by selecting probe molecules able to induce a detectable color change in the presence of a targeted volatile compound [13]. A list of probe molecules and targeted VOC was proposed but the reactions are not always specific to a given VOC, but rather to the same family of chemicals. Moreover, the coloration intensity cannot be quantified and the interference problem due to the “VOC profile” overlapping remains.
Specific and semi-quantitative detection of bacterial VOC is still a major challenge on the road to low cost and minimally invasive diagnostic tests for bacterial detection and identification based on the use of colorimetric VOC sensors in very simple test settings.
In the present work, a specific sensor for indole was designed as a nanoporous matrix formed via the sol-gel process and doped with chromogenic capture molecules. We describe here the strategies developed to optimize the selectivity and sensitivity of indole detection, keeping the sensor simple and low cost. The resulting sensor could be used to measure specifically the concentration of bacterial indole, in chemically complex environment, either in the liquid or gas phases.

2. Experimental Section

2.1. Synthesis of Nanoporous Pastilles Doped with DMACA

Tetramethoxysilane (TMOS) and 3-aminopropyltriethoxysilane (APTES) were used as precursors for the synthesis of nanoporous xerogels via the sol-gel process. The methanolic solution of the probe molecule, p-dimethylaminocinnamaldehyde (DMACA), was mixed with concentrated hydrochloric acid and water to start the reactions of hydrolysis and polycondensation which leads to a gel. The molar proportion of the reagents in the sol, (TMOS/APTES)/MeOH/H2O/HCl/DMACA is (0.97/0.03)/5.2/3.9/5.3/0.02. The reaction is extremely fast due to the acidic catalysis and the sol is immediately poured into the wells (diameter = 6 mm) of a microplate. With a sol volume of 80 µL, the final pastilles display the following dimensions: diameter = (3.0 ± 0.1) mm, thickness = 800 µm. The microplate is covered with an adhesive microporous film (ABGene Gas permeable adhesive seals) in order to dry slowly the gel during 3 days in standard conditions of temperature (22 °C) and relative humidity (55%). They are stored in airtight glassware and kept in a fridge at 4 °C, for a shelf-life of 6 months.

2.2. Characterization of the Xerogel Pastilles

The porosity properties (surface area and pore size distribution) were analyzed with a porosimeter Autosorb-1 Quantachrome, by establishing the isotherms of adsorption and desorption of nitrogen at 77 K and using both BET (Brunauer, Emmett and Taylor) and Density Functional Theory (DFT) analytical methods.

2.3. Detection of Bacterial Indole

Lysogeny Broth (LB Lennox, Q-Biogene) and DEV Tryptophan (Fluka 31406) are used as liquid nutrient media. The corresponding agar media are obtained by adding 15 g/L of agar (Fluka 05039). Escherichia coli ATCC 11775 and Hafnia alvei ATCC 13337 are employed as tryptophanase-positive and tryptophanase-negative strains, respectively. Their indole-producing ability is confirmed with API 20E strips (bioMérieux). For liquid-phase experiments, non-inoculated LB and LB inoculated at 5 × 10⁶ cfu/mL at t = 0 are incubated at 37 °C in the same conditions. A measurement is operated by dropping 20 µL of non-filtrated bacterial culture onto the pastille. Each pastille is used only once. The analyzing light coming from a Deuterium-Halogen Light Source (Melles Griot, 215–2000 nm) is focused on the pastille via an optical fiber coupled with lenses and the transmitted light is collected with an optical fiber and transmitted to a spectrometer (Ocean Optics). For gas phase detection experiments, 100 µL of bacterial suspension is spread at t = 0 on DEV Tryptophan agar plate and incubated at 37 °C. As a control, a non-inoculated agar plate is incubated in similar conditions. In each plate, a DMACA-doped sensor is placed at t = 0 in the center of a Petri dish (diameter 85 mm; height 15 mm), in a small plate (diameter 35 mm) filled with anhydrous CaCl2 (Fluka 21074). The sensor color change is monitored by taking a picture every 15 min from t = 0 to t = 24 h.

3. Results and Discussion

3.1. Probe Choice and Interferences

Indole is a widespread metabolite of a large variety of both Gram-positive and Gram-negative bacteria: to date, more than 85 species including many pathogens [14,15,16,17], the most commonly known being Escherichia coli. Bacteria that produce the enzyme tryptophanase are able to split the amino acid tryptophan into pyruvic acid, ammonia and indole. The indole test is traditionally used as one of the classification test in phenotypic identification of bacteria.
Ehrlich’s reagent p-dimethylaminocinnamaldehyde, DMACA (Figure 1a), was chosen for the detection of indole since it is well-known that the condensation reaction of DMACA with indole in acidic conditions produces a strongly colored, green-blue, azafulvenium chloride salt (2-[3’-(p-dimethylaminophenyl)-2’-propenyliden]-2H-indolenine hydrochloride). The reaction involves a DMACA carbocation and a transient hydroxy species as shown in Figure 1a. The azafulvenium chloride salt, in aqueous solutions, absorbs in the visible region (500–700 nm) with a maximum centered at 624 nm and displays a high extinction coefficient value (86,666 mol−1·L·cm−1 [18], 97,000 ± 13,000 mol−1·L·cm−1 (this work)). In the presence of tryptophan, another condensation reaction occurs, which yields a red-violet product, absorbing at 563 nm [19]. In culture media, such as Lysogenic Broth or Buffered Peptone Water, which both contain tryptophan, both reactions occur and the absorption bands of the two products overlap.
The present indole sensor, a hybrid organic-inorganic nanoporous matrix functionalized with DMACA, will allow us to overcome the interference between tryptophan and indole. The role of the nanoporous matrix is fourfold: (1) the pores sizes are tailored by using the right ratio between TMOS and APTES, to selectively trap indole in the matrix and discard tryptophan; (2) due to its high adsorption surface area, the matrix acts as a sponge to concentrate the targeted analyte; (3) the sensor can be heavily doped to display a high sensitivity; and (4) each nanopore is a nanoreactor in which the targeted reaction is enhanced due to the reactants confinement.
Figure 1. (a) Proposed mechanism for the reaction of p-dimethylaminocinnamaldehyde (DMACA) with indole in aqueous acidic solution leading to the formation of the azafulvenium chloride salt; (b) Spectral variation as a function of time after the addition of 20 µL of an aqueous solution of indole (63 µM) to a pastille doped with DMACA; (c) Kinetics of formation of the azafulvenium salt at λ = 624 nm, fitted with an exponential rise with a plateau. The formation rate of azafulvenium salt corresponds to the slope at time t = 0; (d) Calibration curve for indole detection with a nanoporous sensor doped with DMACA: Azafulvenium salt formation rate versus indole concentration, from 10−6 to 2.5 × 10⁻⁴ mol·L−1.
Chemosensors 02 00171 g001
The matrices, synthesized via the sol-gel process and doped with protonated DMACA, are molded into 0.8 mm thick pastilles with a diameter of 3.0 ± 0.1 mm. Their porosity properties were studied by analyzing the nitrogen adsorption isotherms at liquid nitrogen temperature. They display a high adsorption surface area, 610 ± 80 m2·g−1, and a distribution of pore sizes ranging from 10 to 60 Å, with a maximum peaking at 30 Å. They are optically transparent over the 300–800 nm domain, where DMACA and azafulvenium salt both absorb. The formation kinetics of the azafulvenium chloride salt can therefore be followed spectroscopically by recording its absorption spectrum as a function of time.
The transduction reaction of DMACA within sensor with indole analyte is followed under various conditions: (i) with indole diluted in aqueous solutions; (ii) with indole generated in a nutrient medium by bacteria; and (iii) with indole in the gas phase above a nutrient medium containing bacteria. The potential interference of the reaction with tryptophan is also examined.

3.2. Preliminary Solution-phase Study of Indole Detection

In a first set of experiments dedicated to characterization of the analytical capabilities of the sensors, aqueous solutions of indole at various concentrations ranging from (1 to 250) 10−6 mol·L−1 were prepared and for each concentration, a small aliquot (20 µL) was added to a pastille placed in a transparent well. The spectral change of the pastille is followed as a function of time (Figure 1b). The absorption band, peaking at 624 nm and growing with time, witnesses the formation of the azafulvenium salt. The growth of the second absorption band at 460 nm is due to the deprotonation of protonated DMACA molecules, as the intrapore pH is becoming less acidic. The kinetics of formation of the azafulvenium salt, monitored at 624 nm (Figure 1c), can be fitted with an exponential rise with a plateau. The slope of the signal rise is proportional to the indole concentration. A calibration curve is then obtained by varying the concentration of indole (1–250 µmol·L−1) in the 20 µL aliquot and by measuring the growth of the azafulvenium absorption at 624 nm as function of time. Over the linear regime, for indole concentration up to 100 µmol·L−1, the absorbance variation at 624 nm, per unit of time and of indole concentration, is found to be equal to 6.4 ± 0.1 s−1·L·mol−1. This first set of experiments provides a calibration curve for the analysis of indole in the range of 20 picomoles to 5 nanomoles (Figure 1d).

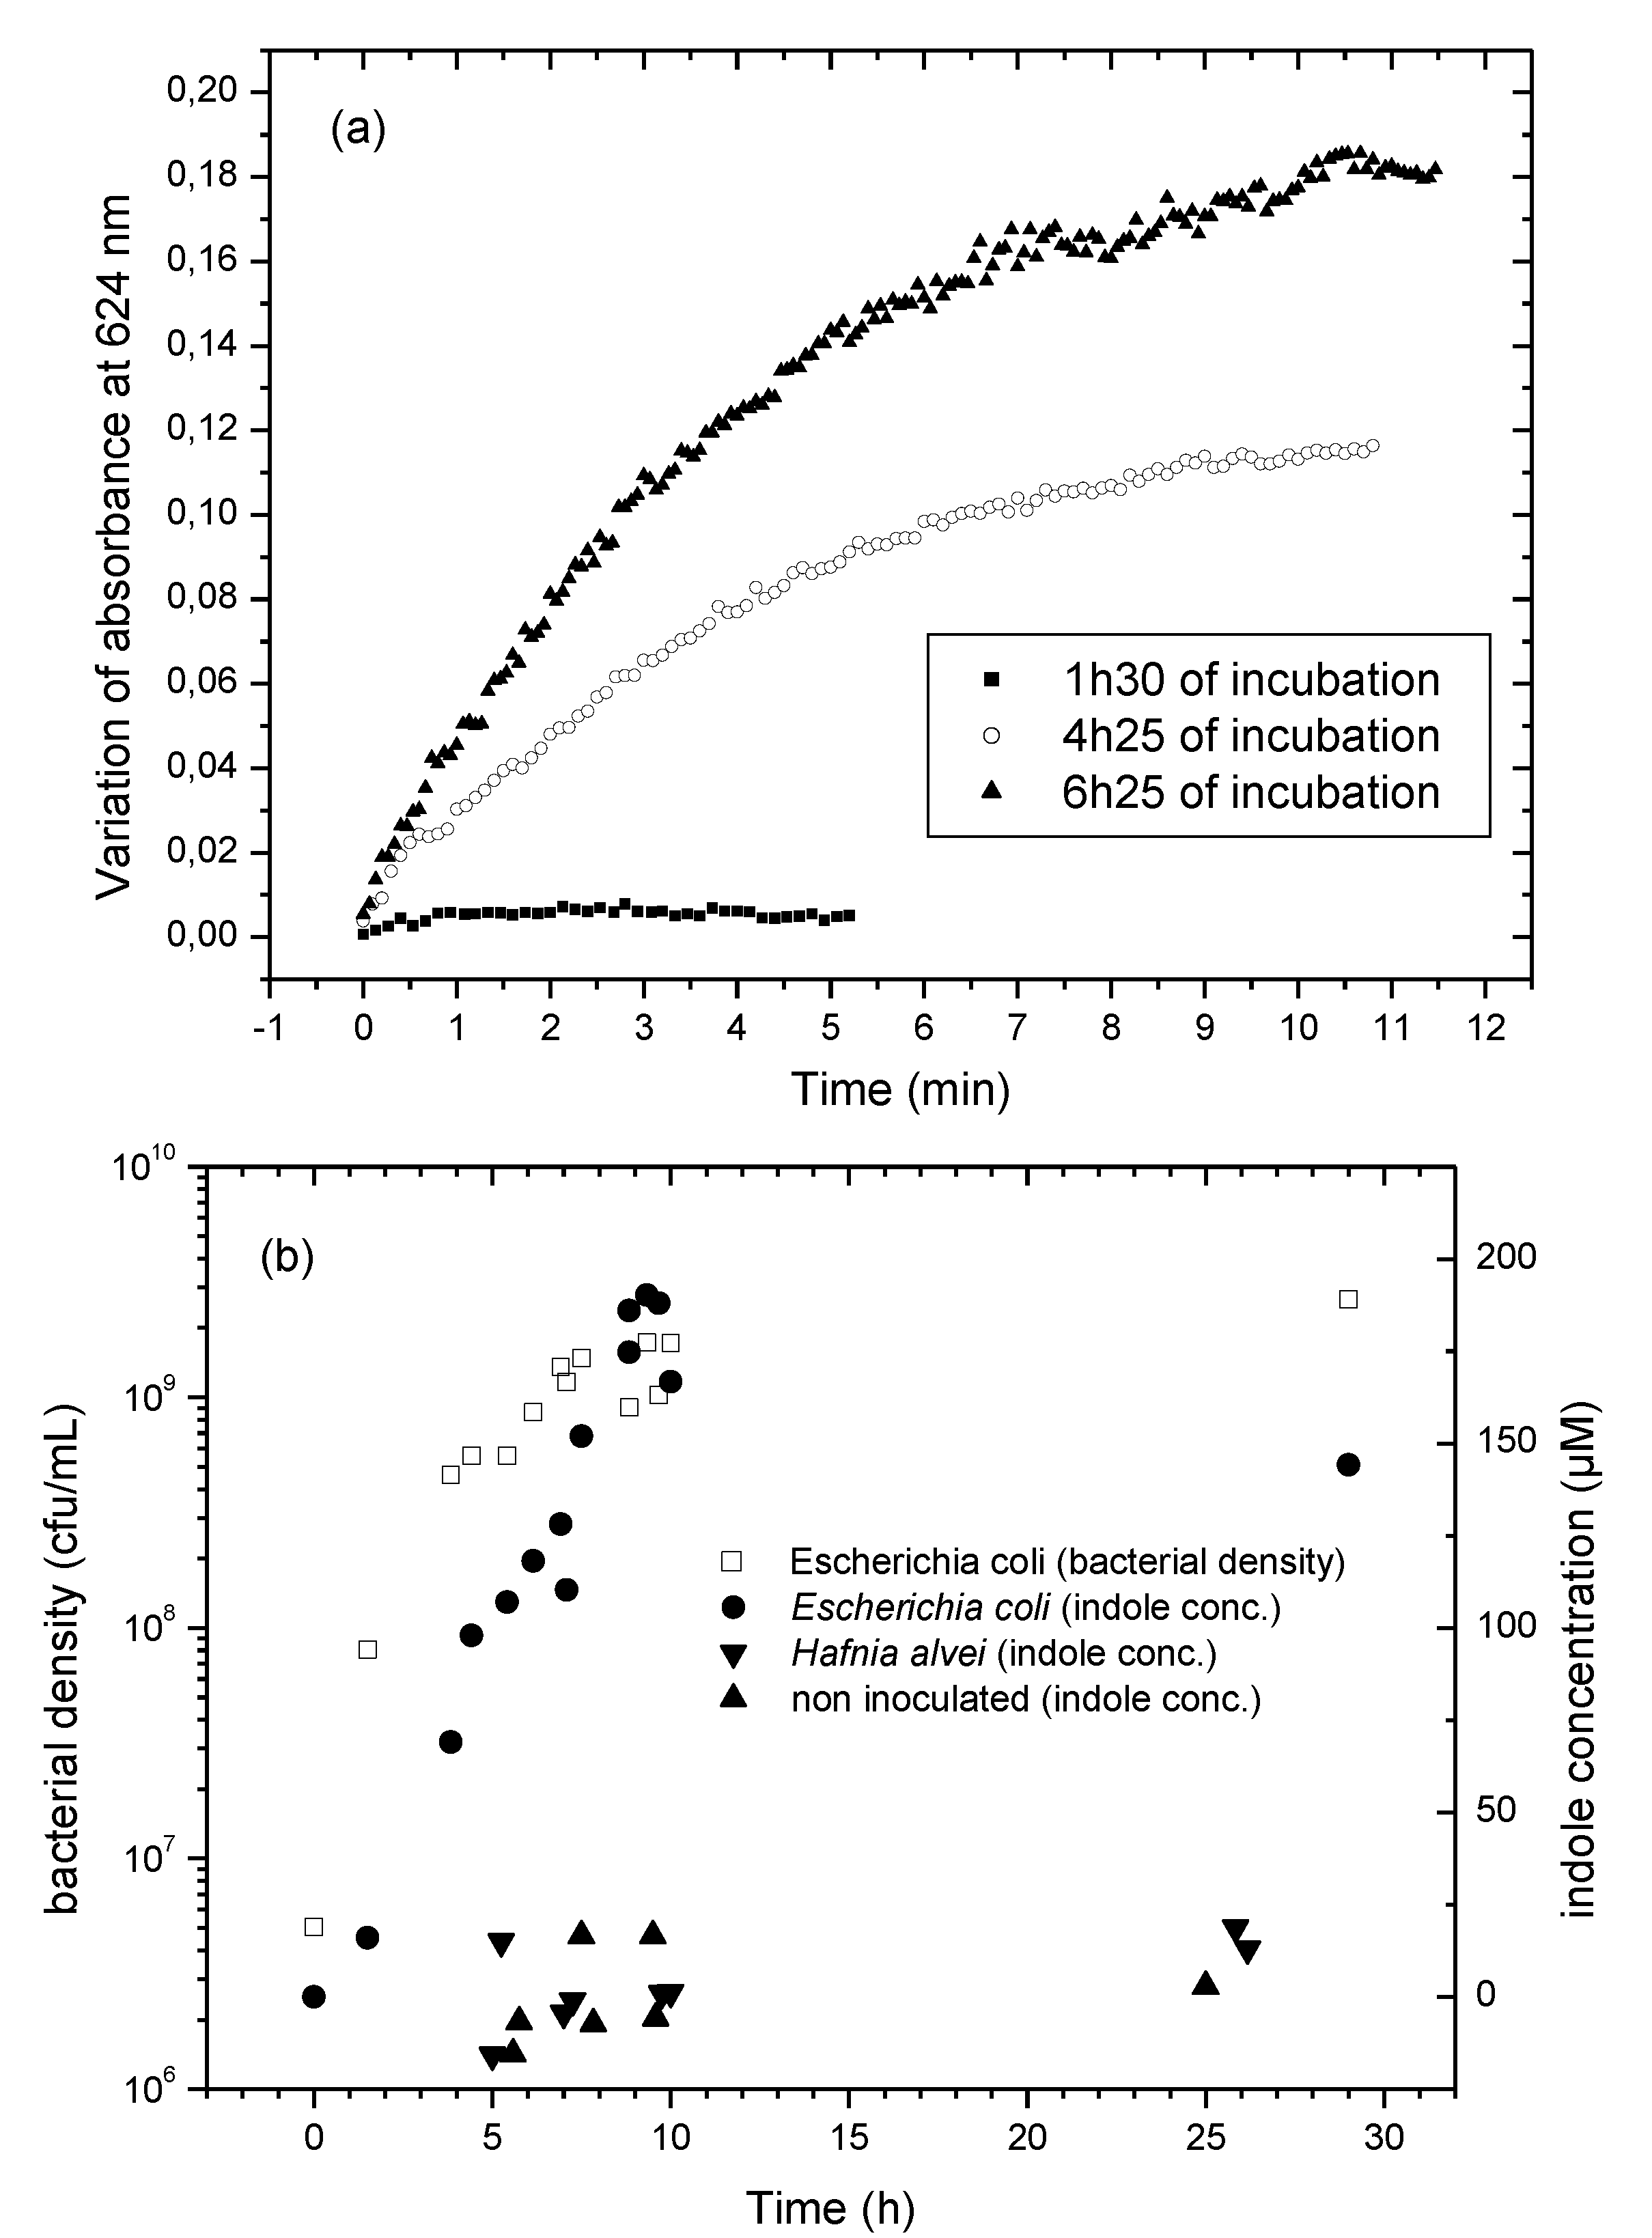
3.3. Detection of Bacterial Indole in Liquid Phase

In the second set of experiments, we wanted to show that there is no chemical interference with compounds of the chemically complex media typically used for bacterial growth. Pastilles doped with DMACA were used for the detection of indole released by bacteria grown in a liquid LB Lennox nutrient medium. This medium is composed of tryptone, a mixture of amino acids and short polypeptides that contain tryptophan moieties. The experiment was done using Escherichia coli, an indole-producing bacterium and Hafnia alvei, an indole-negative bacterium, used as a negative control. Each culture medium was sampled during bacterial growth as a function of time over a large incubation period (29 h): at various incubation times, a 20 µL aliquot was taken from the culture medium and added to a pastille. The growth of absorbance of the azafulvenium chloride salt, measured at 624 nm, was plotted for three samplings at the early stage of incubation (Figure 2a). From the calibration curve previously established, the concentration of indole released in the nutrient medium was determined and plotted as a function of the incubation time (Figure 2b). It appears that a significant amount of indole (100 µmol·L−1) is released in E. coli culture after only 5h of incubation. In parallel of the indole detection, the bacterial density was determined by streaking of agar plates and recording the absorbance at 580 nm, and was plotted as a function of incubation time.
A peak of indole emission (nearly 200 µM) is reached for E. coli at the beginning of the stationary growth phase. At this stage, the tryptophanase turnover is 105 molecules per minute and per E. coli cell. This value is coherent with previous literature data (8.104 molecules·min−1·cfu−1) [20]. Interestingly, no significant amount of indole was detected at t = 0 in cultures of E. coli, nor throughout the whole experiment in cultures of H. alvei, and in non-inoculated LB samples. These results demonstrate that H. alvei bacteria do not show any tryptophanase activity and that LB Lennox does not contain any significant amount of indole. More importantly, this result shows that the sensor is insensitive to the uncontrolled variety of organic molecules present in the culture medium. In particular, tryptophan does not interfere with indole due to a size exclusion effect linked to the finely tuned pore size of the xerogel.
Figure 2. Detection of indole released by E. coli bacteria in Lysogeny Broth (LB) media at 37 °C. (a) Variation of the absorbance of pastille at 624 nm vs. time. It reveals the kinetics of formation of the azafulvenium chloride salt in the nanoporous sensor at different incubation times; (b) Left ordinate: Bacterial density in the nutrient phase as a function of incubation time for E. coli. Right ordinate: indole concentration in the nutrient phase for E. coli, H. alvei and a blank sample.
Chemosensors 02 00171 g002

3.4. Detection of Bacterial Indole in the Gas Phase
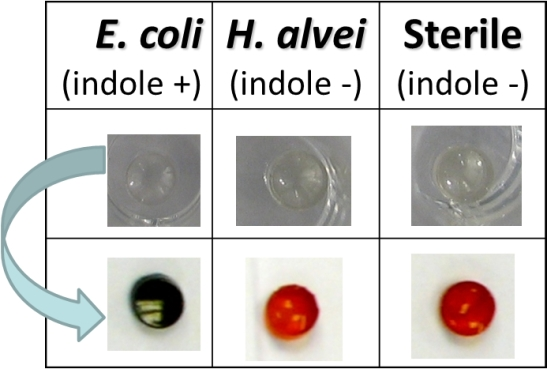
The sensor is now used to detect gaseous indole above bacterial cultures on agar media. LB and DEV tryptophan were employed as nutrient media, the last one being enriched with tryptophan in order to enhance indole release from bacteria. The experimental set-up is shown in Figure 3. The sensor is placed on a plastic knob in the middle of a small dish containing a desiccant, CaCl2. This container is placed in the center of a standard Petri dish and the culture medium with E. coli is poured into the Petri dish. There is no contact between the sensor and the bacterial culture. Two other Petri dishes filled with the same nutrient medium free of bacteria or with indole-negative bacteria, H. alvei, were used as control experiments. The Petri dishes are covered and incubated at 37 °C during 24 h. The formation of the azafulvenium chloride salt is now monitored by taking a photo every 15 min (see Supporting Information for pictures, Figure S1).
Figure 3. Detection of gaseous indole above an E. coli culture on agar media (LB agar or DEV Tryptophan agar). Photo of the experimental set-up: the sensor is deposited on the central dish filled with CaCl2 and surrounded by the bacterial culture in the Petri dish.
Chemosensors 02 00171 g003
On a densely inoculated agar plate (108 to 109 cells), the color change, from colorless to green, can be detected after 7 to 8 h of incubation at 37 °C, i.e., before the colonies get visible to naked-eye. Starting from a much lighter inoculum (92 cells on the whole plate), the color change gets eye-visible after 17 h. After 24 h of incubation, the sensor is dark green with a too large absorbance to be measured (Table 1). Inside the two control Petri dishes without bacteria and with H. alvei, the sensors turn from colorless to dark orange (Table 1). The absence of green color witnesses the absence of indole. The orange color is due to the deprotonation of protonated DMACA as the humidity inside Petri dishes increases with time and induces an increase of the intrapore pH within the sensors.
Table 1. Coloration of the sensors after 24 h: dark green for E. coli (indole-positive) and dark orange for the two control tests: H. alvei (indole-negative) and blank sample (bacteria-free).
Escherichia coli ATCC 11775Hafnia alvei ATCC 13337Control (no bacteria)
tryptophan agar medium Chemosensors 02 00171 i001 Chemosensors 02 00171 i002 Chemosensors 02 00171 i003
LB agar medium Chemosensors 02 00171 i004 Chemosensors 02 00171 i005 Chemosensors 02 00171 i006

4. Conclusions

In the present work, we have demonstrated the possibility of tailoring and functionalizing nanoporous xerogel in order to produce a sensitive and selective detection of indole in a chemically complex environment. The indole sensor displays many advantages compared to commercially available indole detection systems: (1) it can be used to detect indole either in the liquid or gaseous phase; (2) the colorimetric response is visible to naked eyes within 17 h when starting with media inoculated with less than 100 cells; (3) when used in the liquid phase, the sensor remains insensitive to tryptophan, a major nutrient component which could interfere in the colorimetric detection of indole, thanks to the pore size distribution of the sensor, tailored to exclude large molecules; (4) the coloration increases with time and remains stable. Moreover, due to the large specific surface area, 600 m2/g, the sensor behaves like a “sponge” to concentrate the targeted analyte, thus decreasing the exposure time needed for detection. Alternatively, the sensor could be used over very long accumulation times to detect trace amounts of indole, for example, in the environment of hospitals, clinical labs, industrial plants. Such very specific, simple and low cost sensors open the way to a new generation of rapid tests in the field of clinical and industrial microbiology, as well as in doctors’ practice.

Acknowledgments

The authors acknowledge Sylvain Orenga and Victoria Girard from bioMérieux for helpful discussions, Charles Rivron from Laboratoire Francis Perrin for porosimetry measurements. The authors are grateful to bioMérieux, CNRS and CEA for financial support.

Conflicts of Interest

The authors declare conflict of interest with Suslick’s group.

References

  1. Fox, A. Mass spectrometry for species or strain identification after culture or without culture: Past, present and future. J. Clin. Microbiol. 2006, 44, 2677–2680. [Google Scholar] [CrossRef]
  2. Ammor, M.S. Recent advances in the use of intrinsic fluorescence for bacterial identification and characterization. J. Fluoresc. 2007, 17, 455–459. [Google Scholar] [CrossRef]
  3. Oust, A.; Moretro, T.; Kirschner, C.; Narvhus, J.A.; Kohler, A. FT-IR spectroscopy for identification of closely related lactobacilli. J. Microbiol. Methods 2004, 59, 149–162. [Google Scholar] [CrossRef]
  4. Holst, E.; Larsson, L. Gas-chromatographic comparison of peptone yeast glucose and gas-liquid-chromatography growth media for anaerobic bacteria. Eur. J. Clin. Microbiol. 1987, 6, 724–728. [Google Scholar] [CrossRef]
  5. Tait, E.; Perry, J.D.; Stanforth, S.P.; Dean, J.R. Identification of volatile organic compounds produced by bacteria using HS-SPME-GC-MS. J. Chromatogr. Sci. 2014, 52, 363–373. [Google Scholar] [CrossRef]
  6. Bunge, M.; Araghipour, N.; Mikoviny, T.; Dunkl, J.; Schnitzhofer, R.; Hansel, A.; Schinner, F.; Wisthaler, A.; Margesin, R.; Märk, T.D. On-line monitoring of microbial volatile metabolites by proton transfer reaction-mass spectrometry. Appl. Environ. Microbiol. 2008, 74, 2179–2186. [Google Scholar] [CrossRef]
  7. Allardyce, R.A.; Hill, A.L.; Murdoch, D.R. The rapid evaluation of bacterial growth and antibiotic susceptibility in blood cultures by selected ion flow tube mass spectrometry. Diagn. Microbiol. Infect. Dis. 2006, 55, 255–261. [Google Scholar] [CrossRef]
  8. Allardyce, R.A.; Langford, V.S.; Hill, A.L.; Murdoch, D.R. Detection of volatile metabolites produced by bacterial growth in blood culture media by selected ion flow tube mass spectrometry (SIFT-MS). J. Microbiol. Methods 2006, 65, 361–365. [Google Scholar] [CrossRef]
  9. Scotter, J.M.; Langford, V.S.; Wilson, P.F.; McEwan, M.J.; Chambers, S.T. Real-time detection of common microbial volatile organic compounds from medically important fungi by Selected Ion Flow Tube-Mass Spectrometry (SIFT-MS). J. Microbiol. Methods 2005, 63, 127–134. [Google Scholar] [CrossRef]
  10. Scotter, J.M.; Allardyce, R.A.; Langford, V.S.; Hill, A.; Murdoch, D.R. The rapid evaluation of bacterial growth in blood cultures by selected ion flow tube-mass spectrometry (SIFT-MS) and comparison with the BacT/ALERT automated blood culture system. J. Microbiol. Methods 2006, 65, 628–631. [Google Scholar] [CrossRef]
  11. Siripatrawan, U. Rapid differentiation between E. coli and Salmonella typhimurium using metal oxide sensors integrated with pattern recognition. Sens. Actuators B 2008, 133, 414–419. [Google Scholar] [CrossRef]
  12. Carey, J.R.; Suslick, K.S.; Hulkower, K.I.; Imlay, J.A.; Imlay, K.R.C.; Ingison, C.K.; Ponder, J.B.; Sen, A.; Wittrig, A.E. Rapid identification of bacteria with a disposable colorimetric sensing array. J. Am. Chem. Soc. 2011, 133, 7571–7576. [Google Scholar] [CrossRef]
  13. McDonald, J.G.; Borders, R.A. Technique for Detecting Microorganisms US Pat. U.S. Patent 2006/0223052 A1, 2006. [Google Scholar]
  14. Lee, J.-H.; Lee, J. Indole as an intercellular signal in microbial communities. FEMS Microbiol. Rev. 2010, 34, 426–444. [Google Scholar]
  15. Lee, H.H.; Molla, M.N.; Cantor, C.R.; Collins, J.J. Bacterial charity work leads to population-wide resistance. Nature 2010, 467, 82–86. [Google Scholar] [CrossRef]
  16. Di Martino, P.; Fursy, R.; Bret, L.; Sundararaju, B.; Phillips, R.S. Indole can act as an extracellular signal to regulate biofilm formation of Escherichia coli and other indole-producing bacteria. Can. J. Microbiol. 2003, 49, 443–449. [Google Scholar] [CrossRef]
  17. Han, T.H.; Lee, J.-H.; Cho, M.H.; Wood, T.K.; Lee, J. Environmental factors affecting indole production in Escherichia coli. Res. Microbiol. 2011, 162, 108–116. [Google Scholar] [CrossRef]
  18. Ahmad, A.; Qureshi, M.; Khan, I.A.; Alam, K.Z. Spectrophotometric determination of diphenylamine, pyrrole, and indole—A kinetic study. Anal. Lett. 1990, 23, 1139–1157. [Google Scholar]
  19. Lowrance, B.L.; Reich, P.; Traub, W.H. Evaluation of two spot-indole reagents. Appl. Microbiol. 1969, 17, 923–924. [Google Scholar]
  20. Pastan, I.; Perlman, R.L. Stimulation of Tryptophanase Synthesis in Escherichia coli by Cyclic 3',5'-Adenosine Monophosphate. J. Biol. Chem. 1969, 244, 2226–2232. [Google Scholar]

