
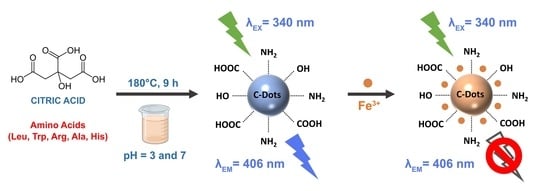
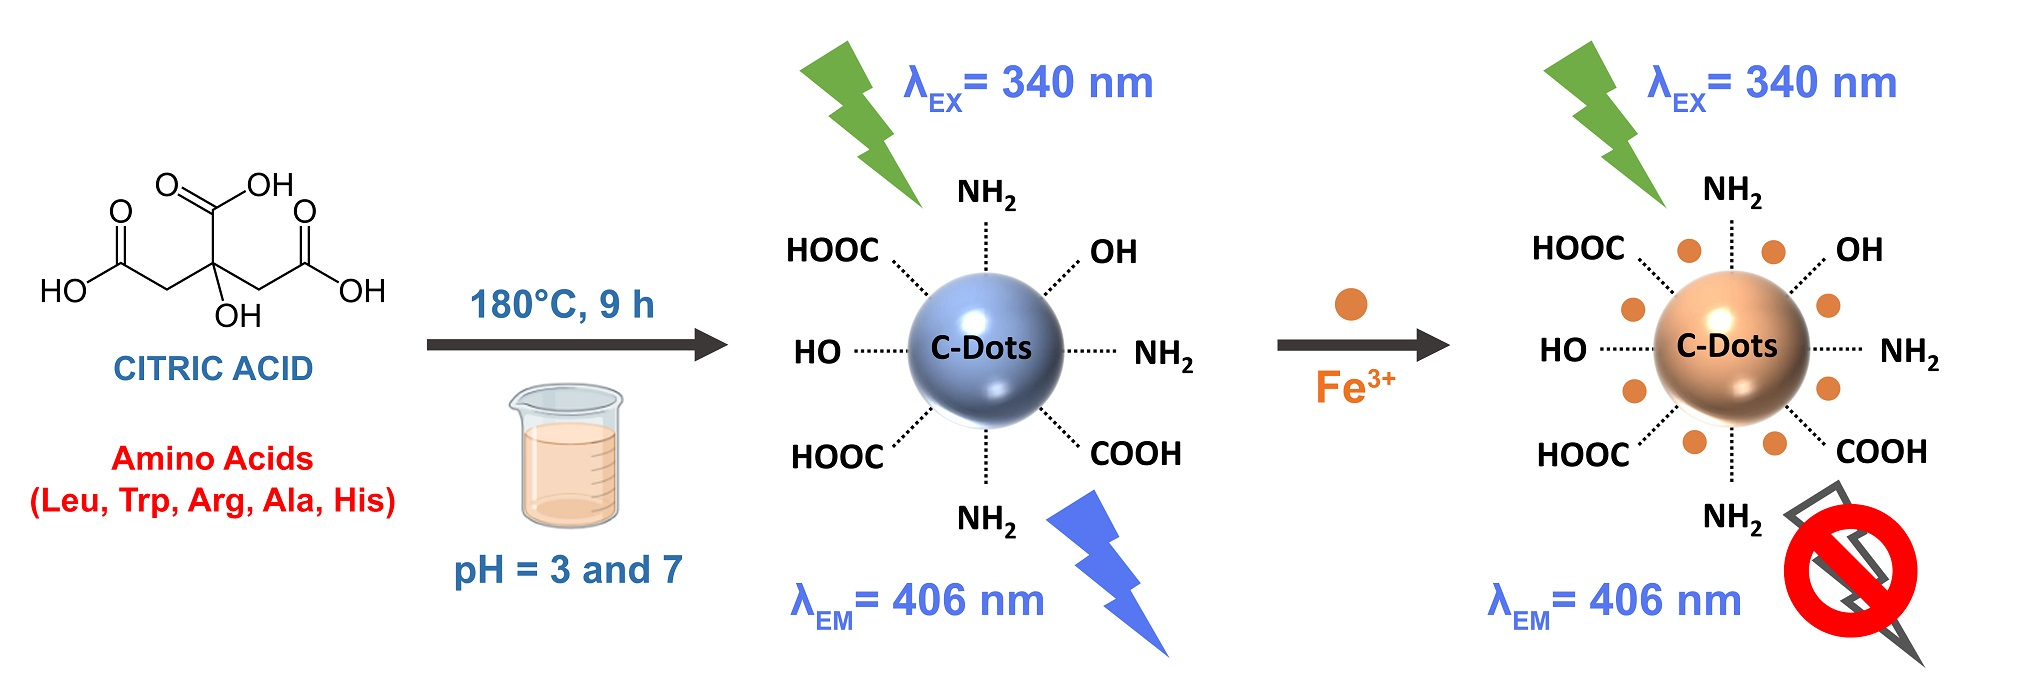
A Facile Synthetic Approach toward Obtaining N-Doped Carbon Quantum Dots from Citric Acid and Amino Acids, and Their Application in Selective Detection of Fe(III) Ions
 , ,
, ,  , , , ,
  ,
,
Abstract
:
1. Introduction
2. Materials and Methods
2.1. Chemicals and Materials
2.2. Preparation of Undoped and N-doped CQDs
2.3. Quantum Yield (QY) Measurements
2.4. Material Characterization
2.5. Biocompatibility Tests of CQD@Leu on Tumor and Normal Cells In Vitro
2.6. Measurements for Selective and Sensitive Metal Detection
2.7. Development of a Model for Detection of Fe3+ Ions Using CQD@Leu
2.8. Detection of Fe3+ Ions in Well Water Samples
3. Results and Discussion
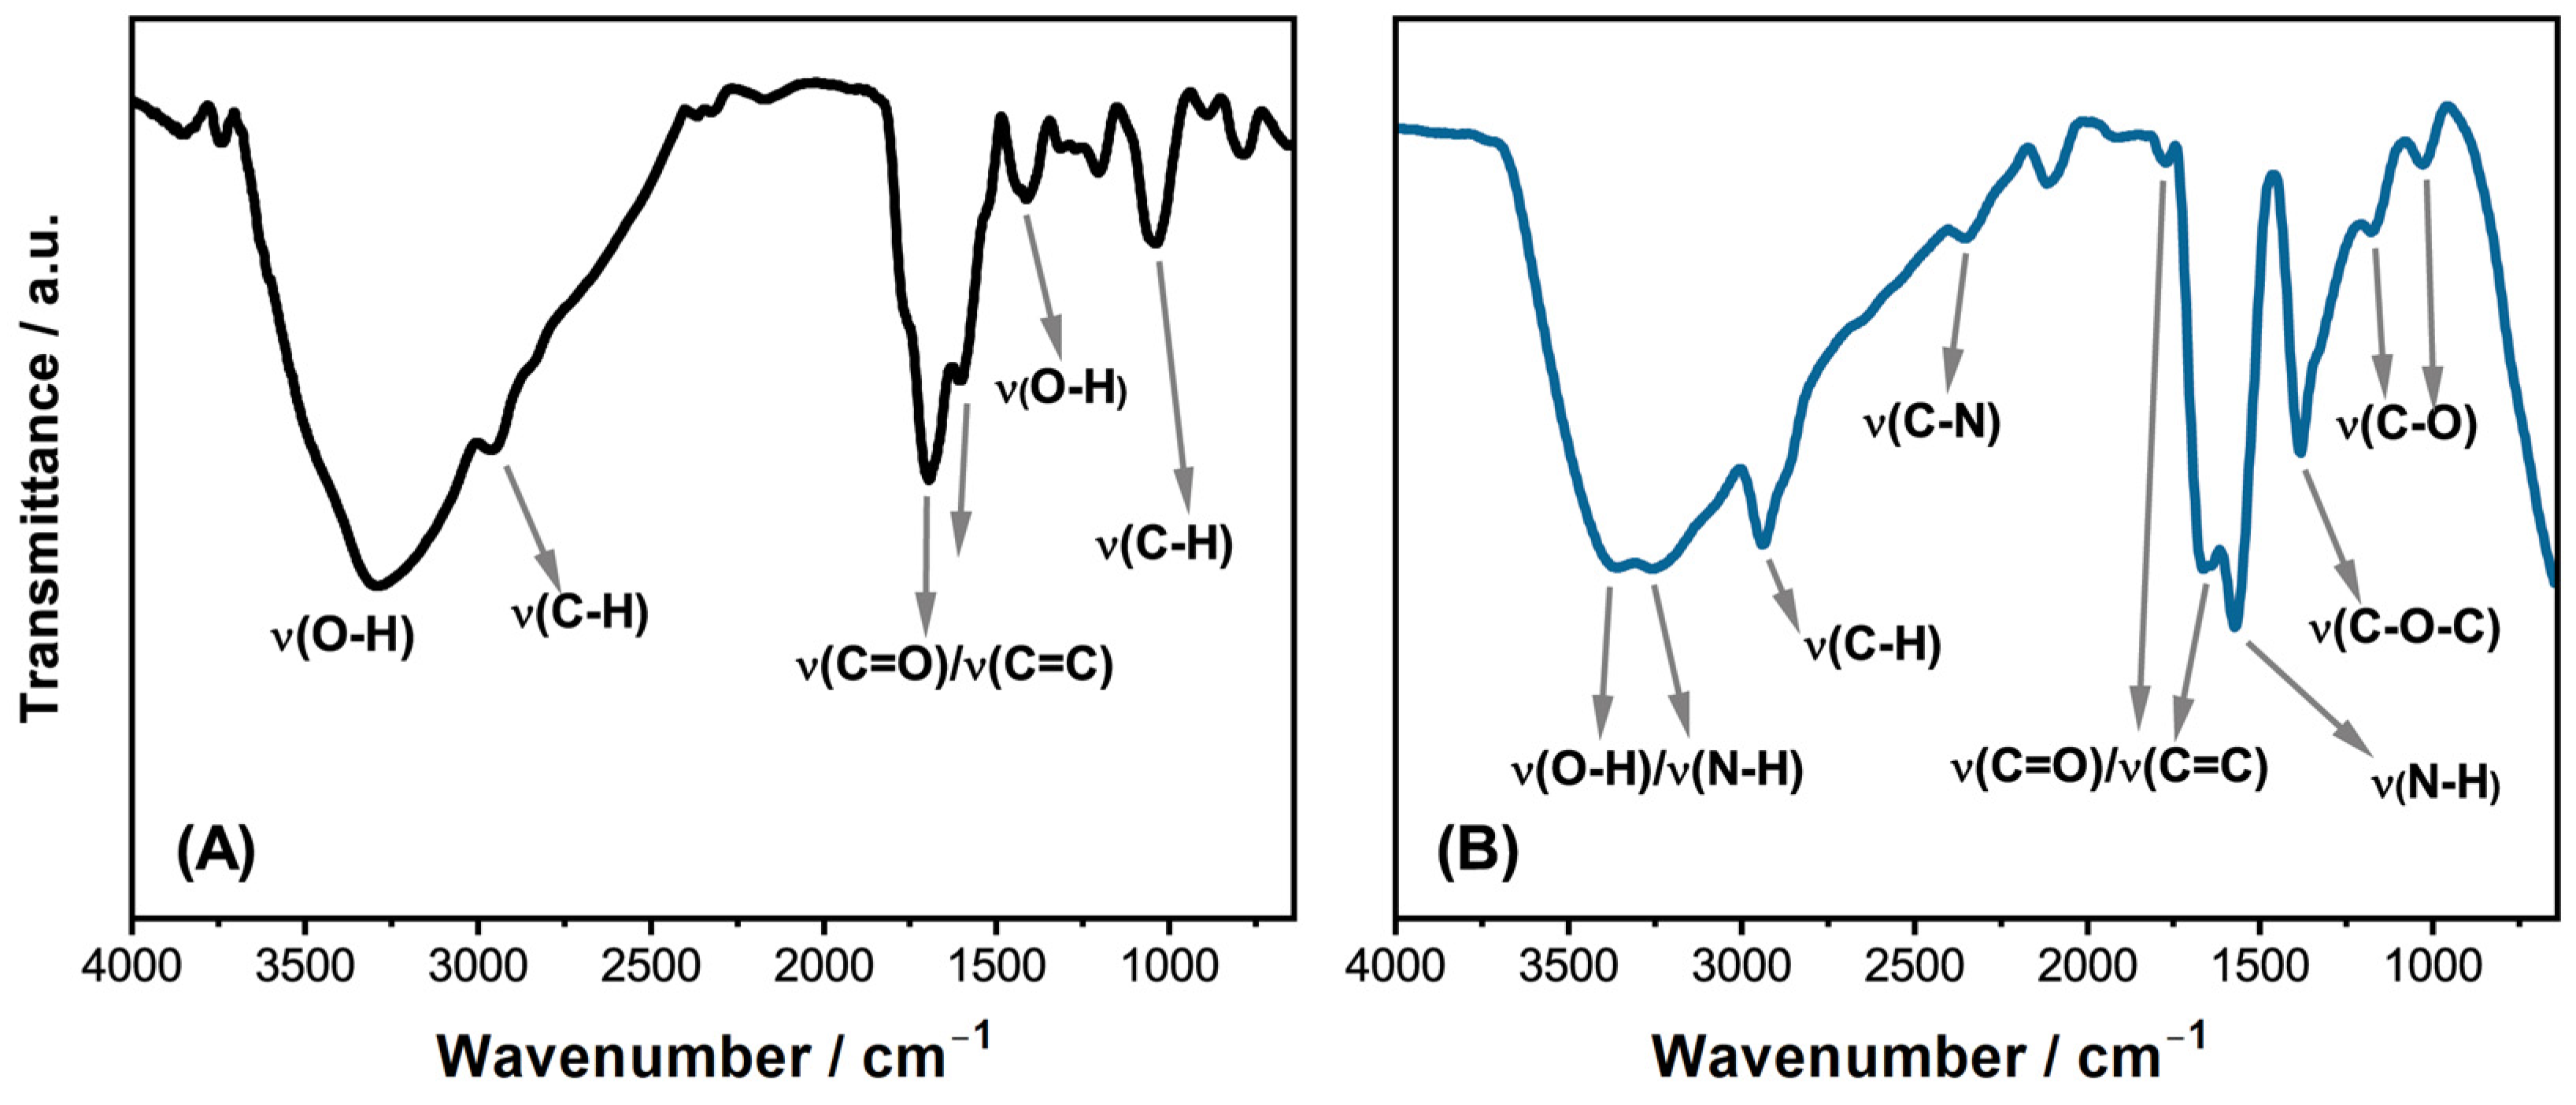
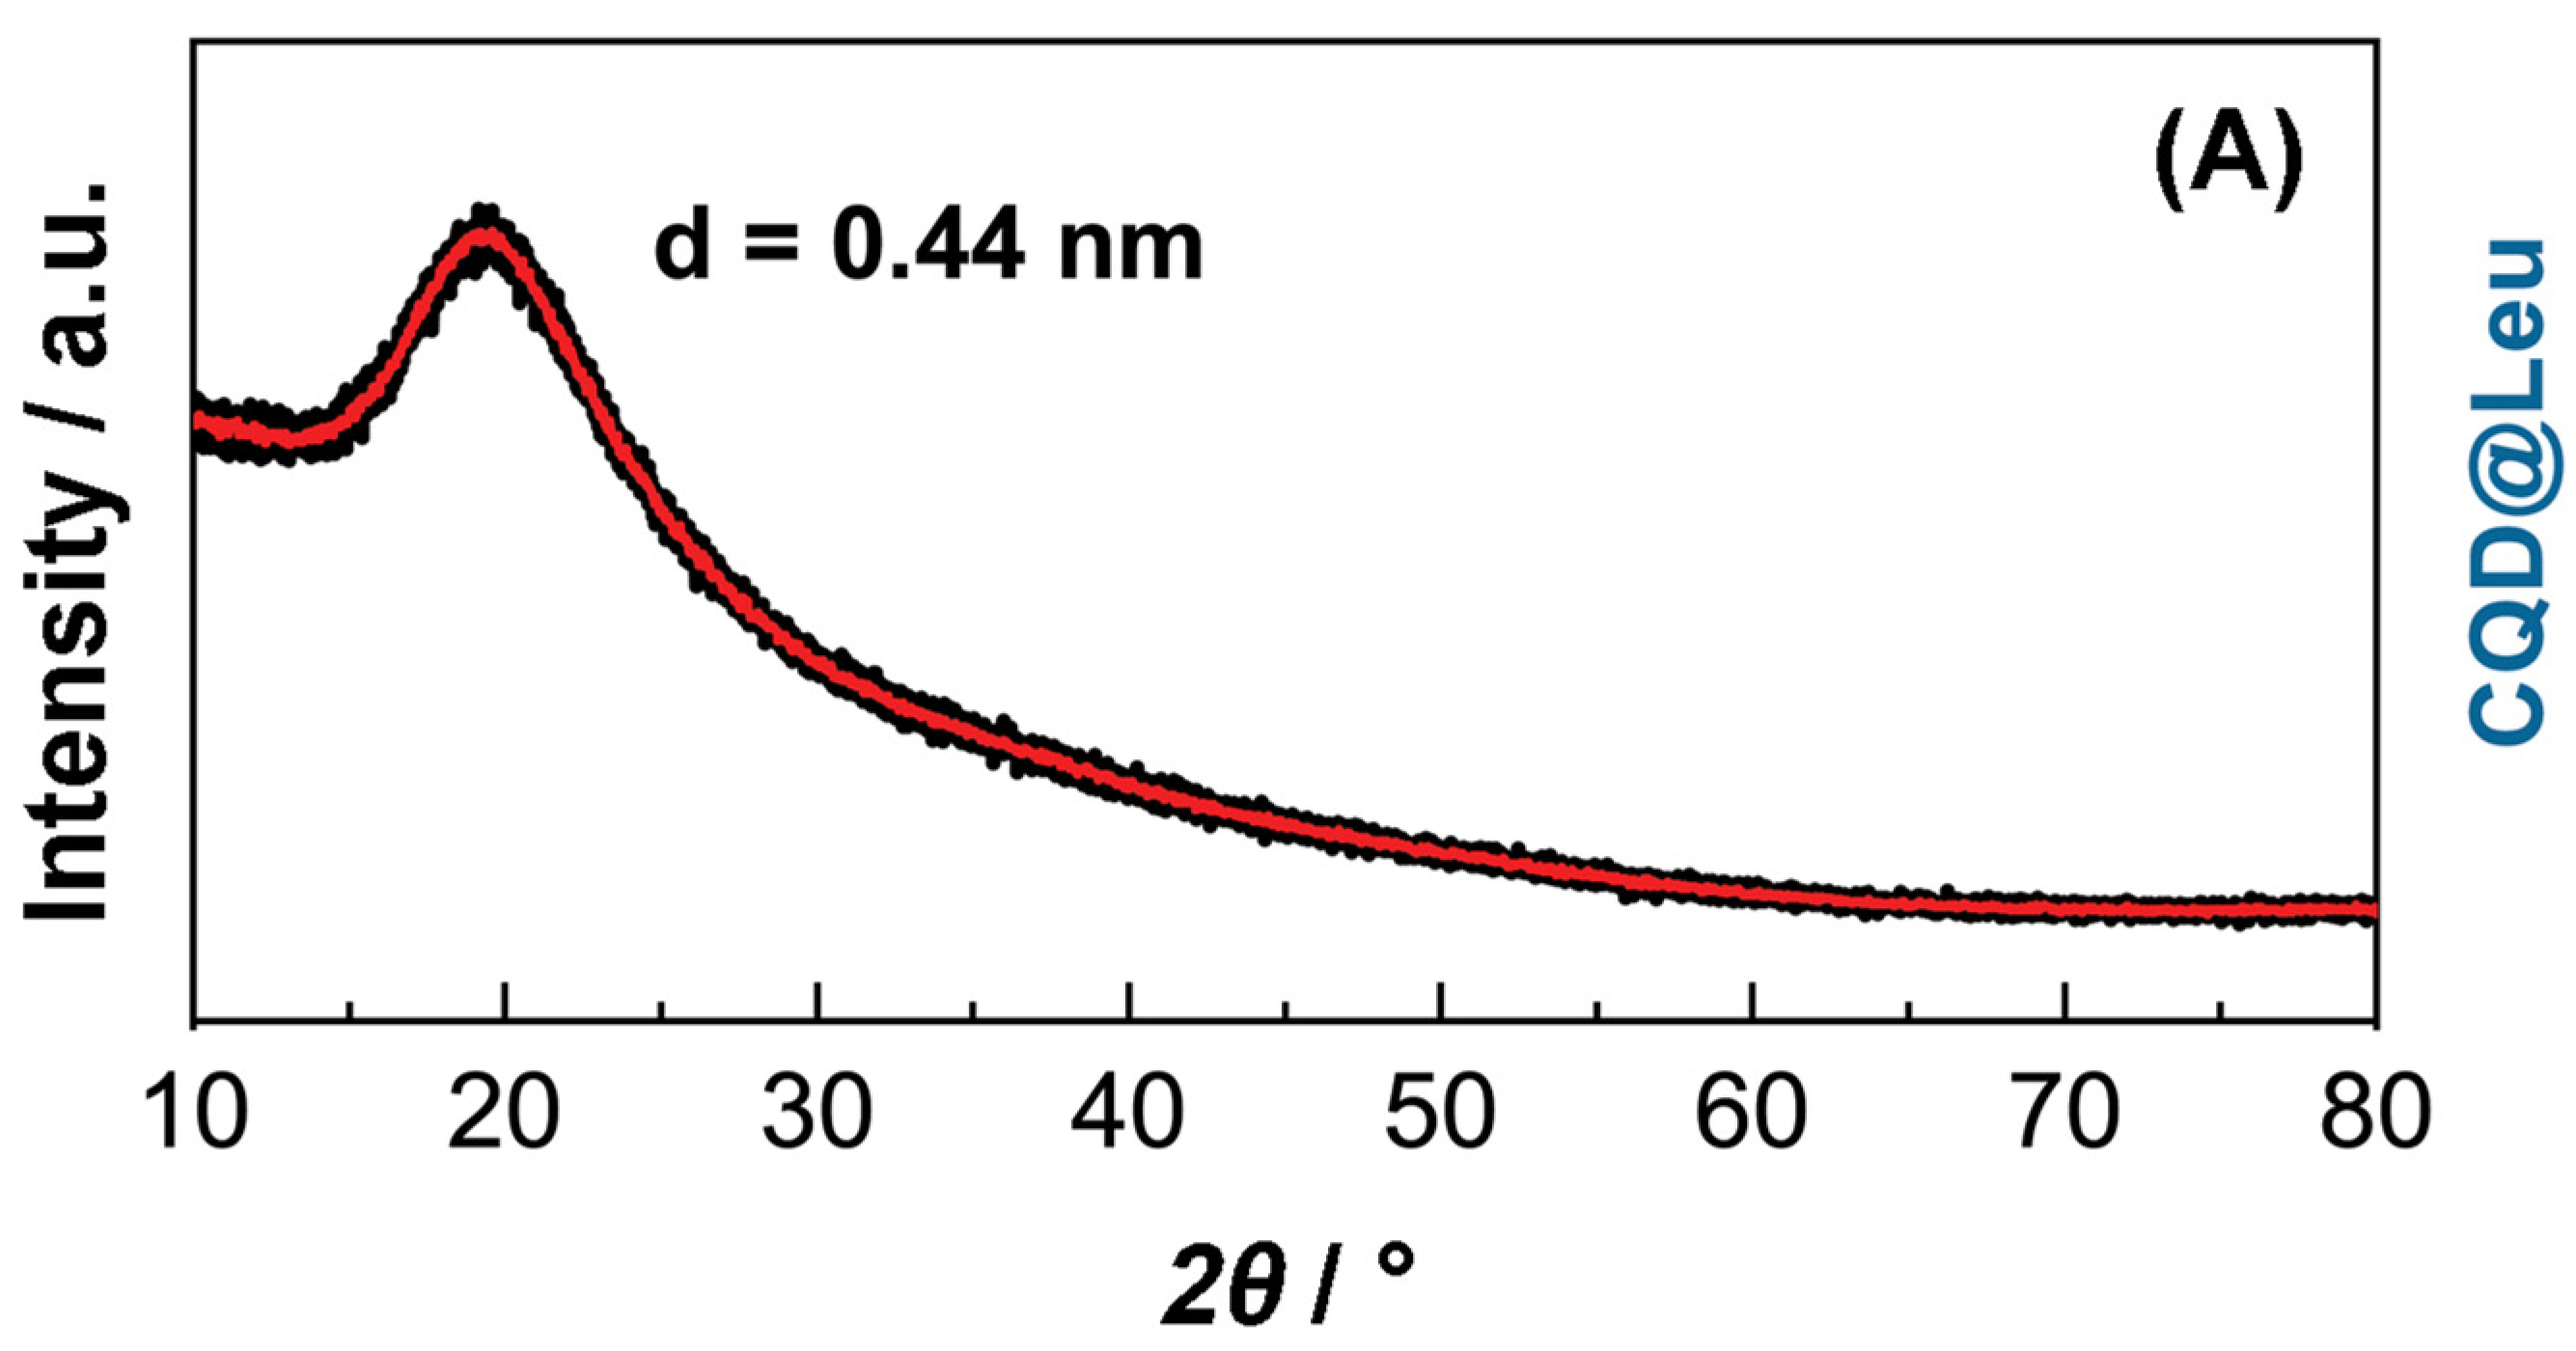
3.1. Chemical and Structural Characterization of CQDs
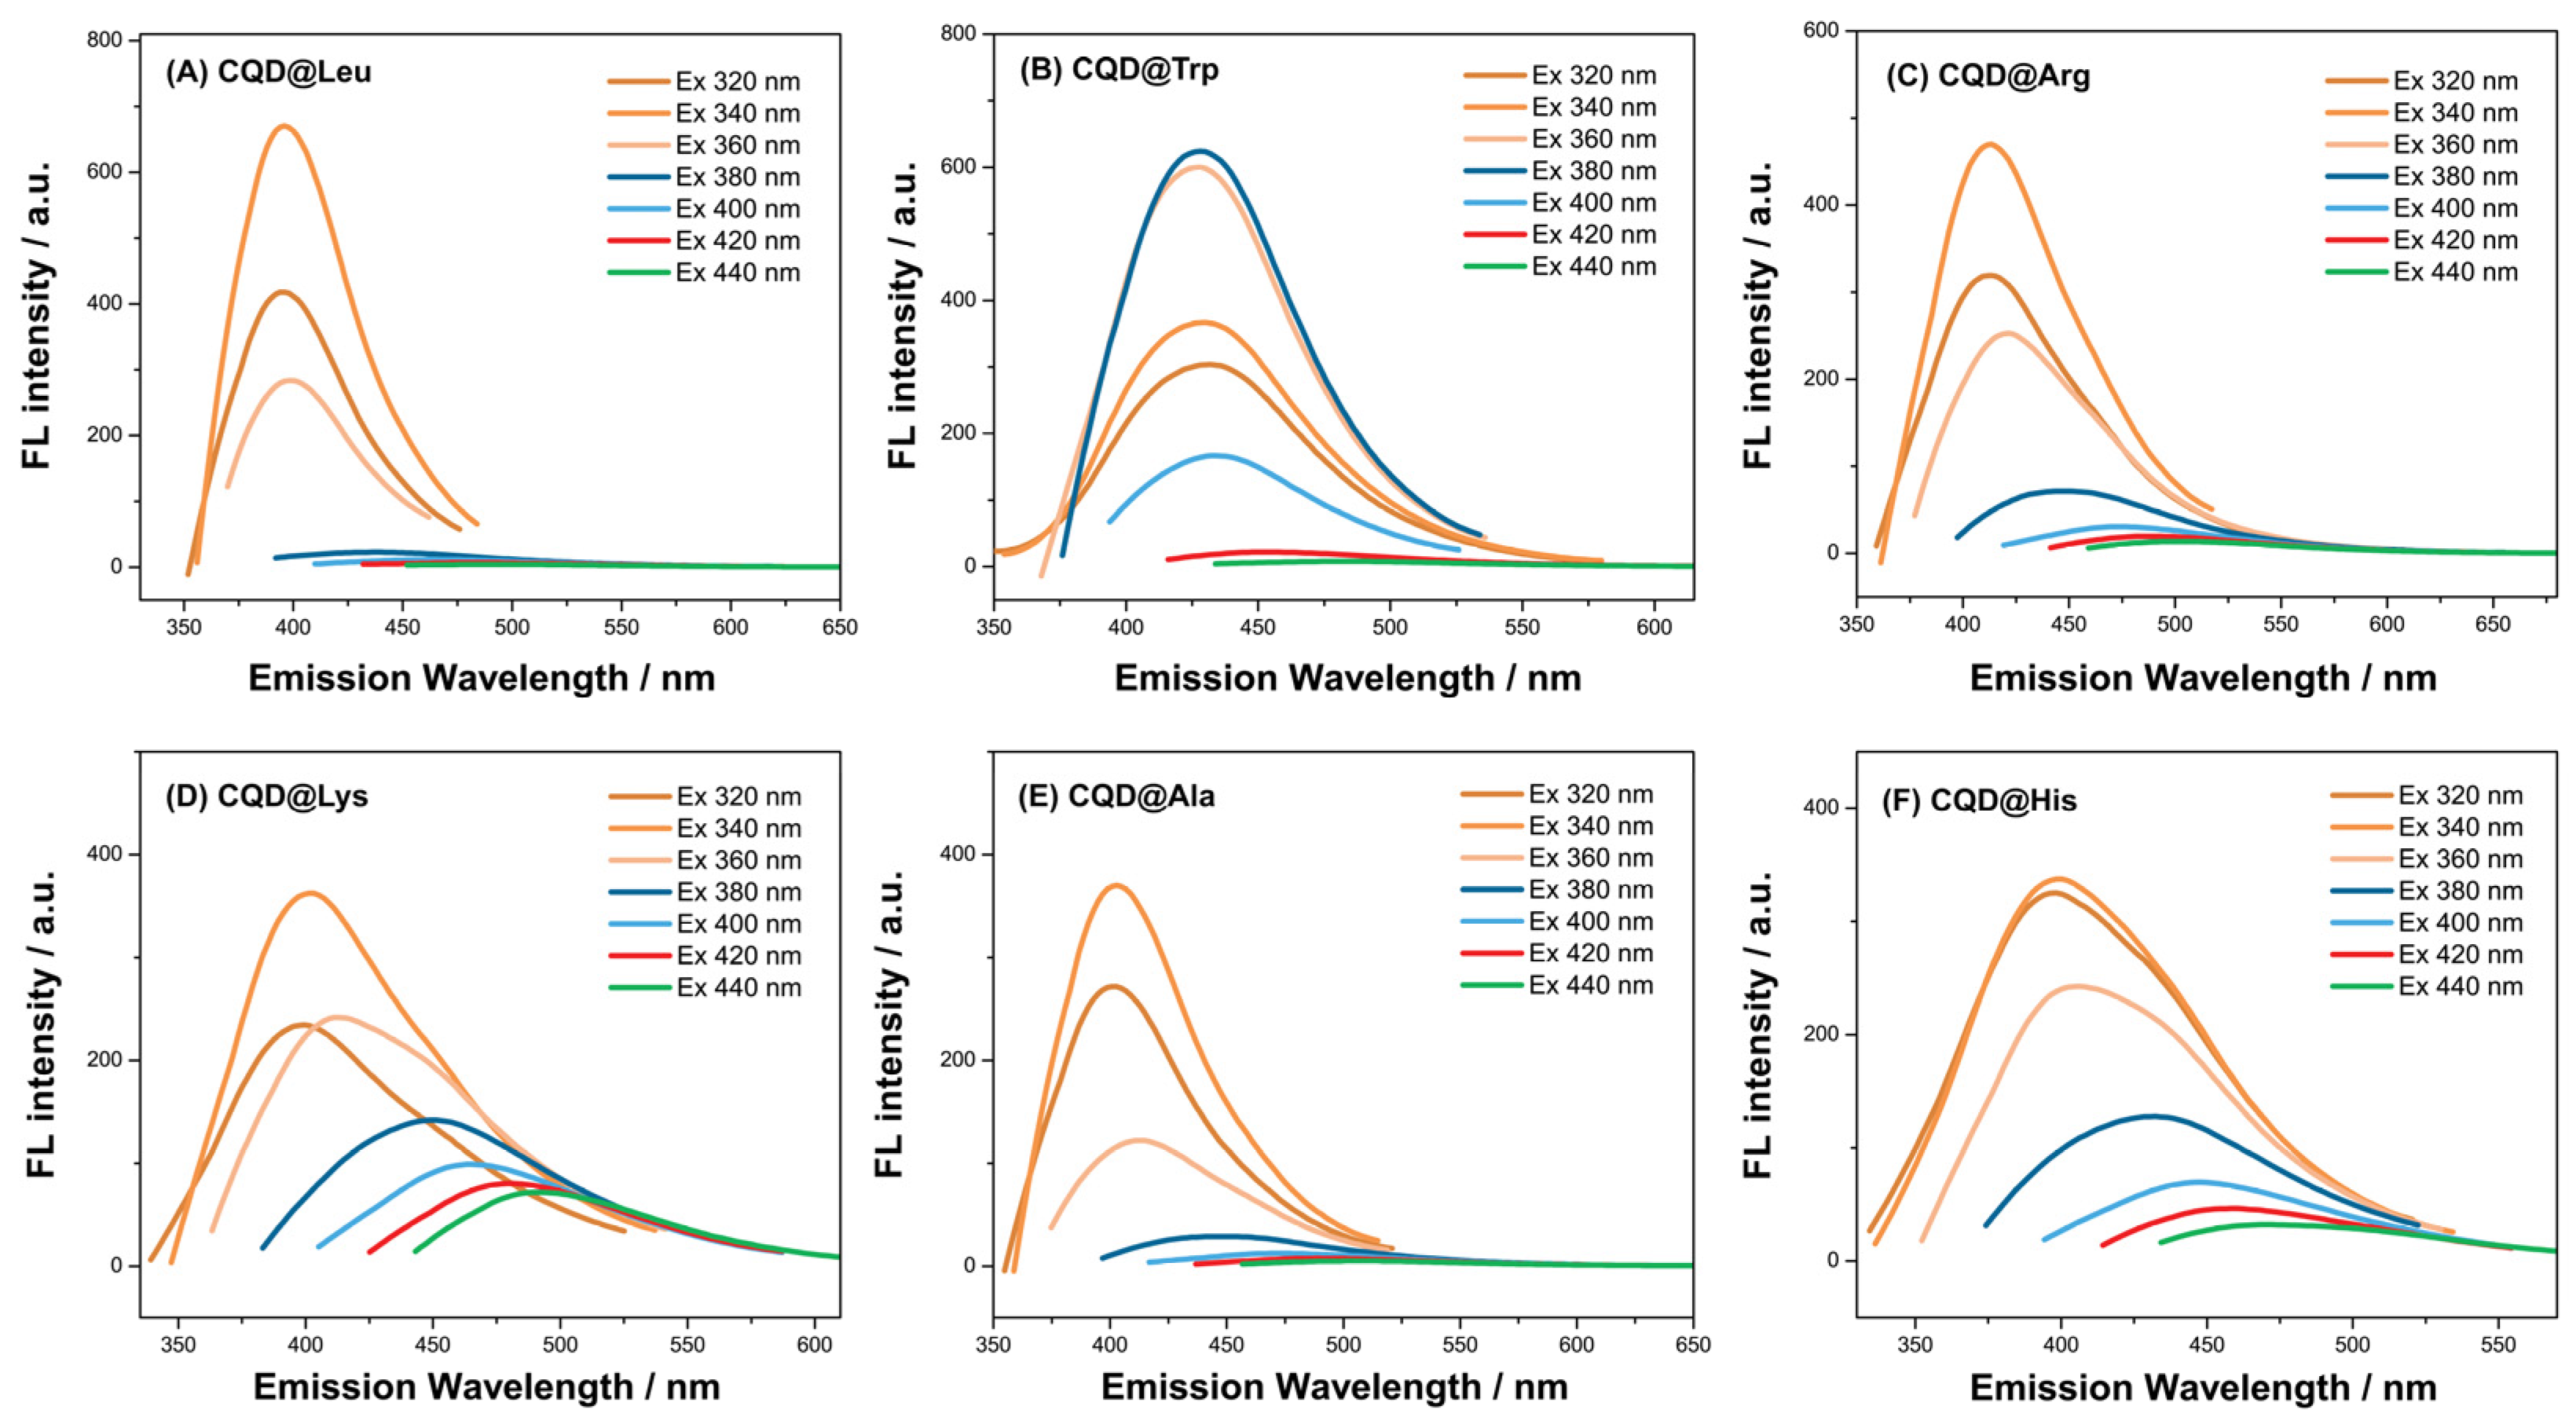
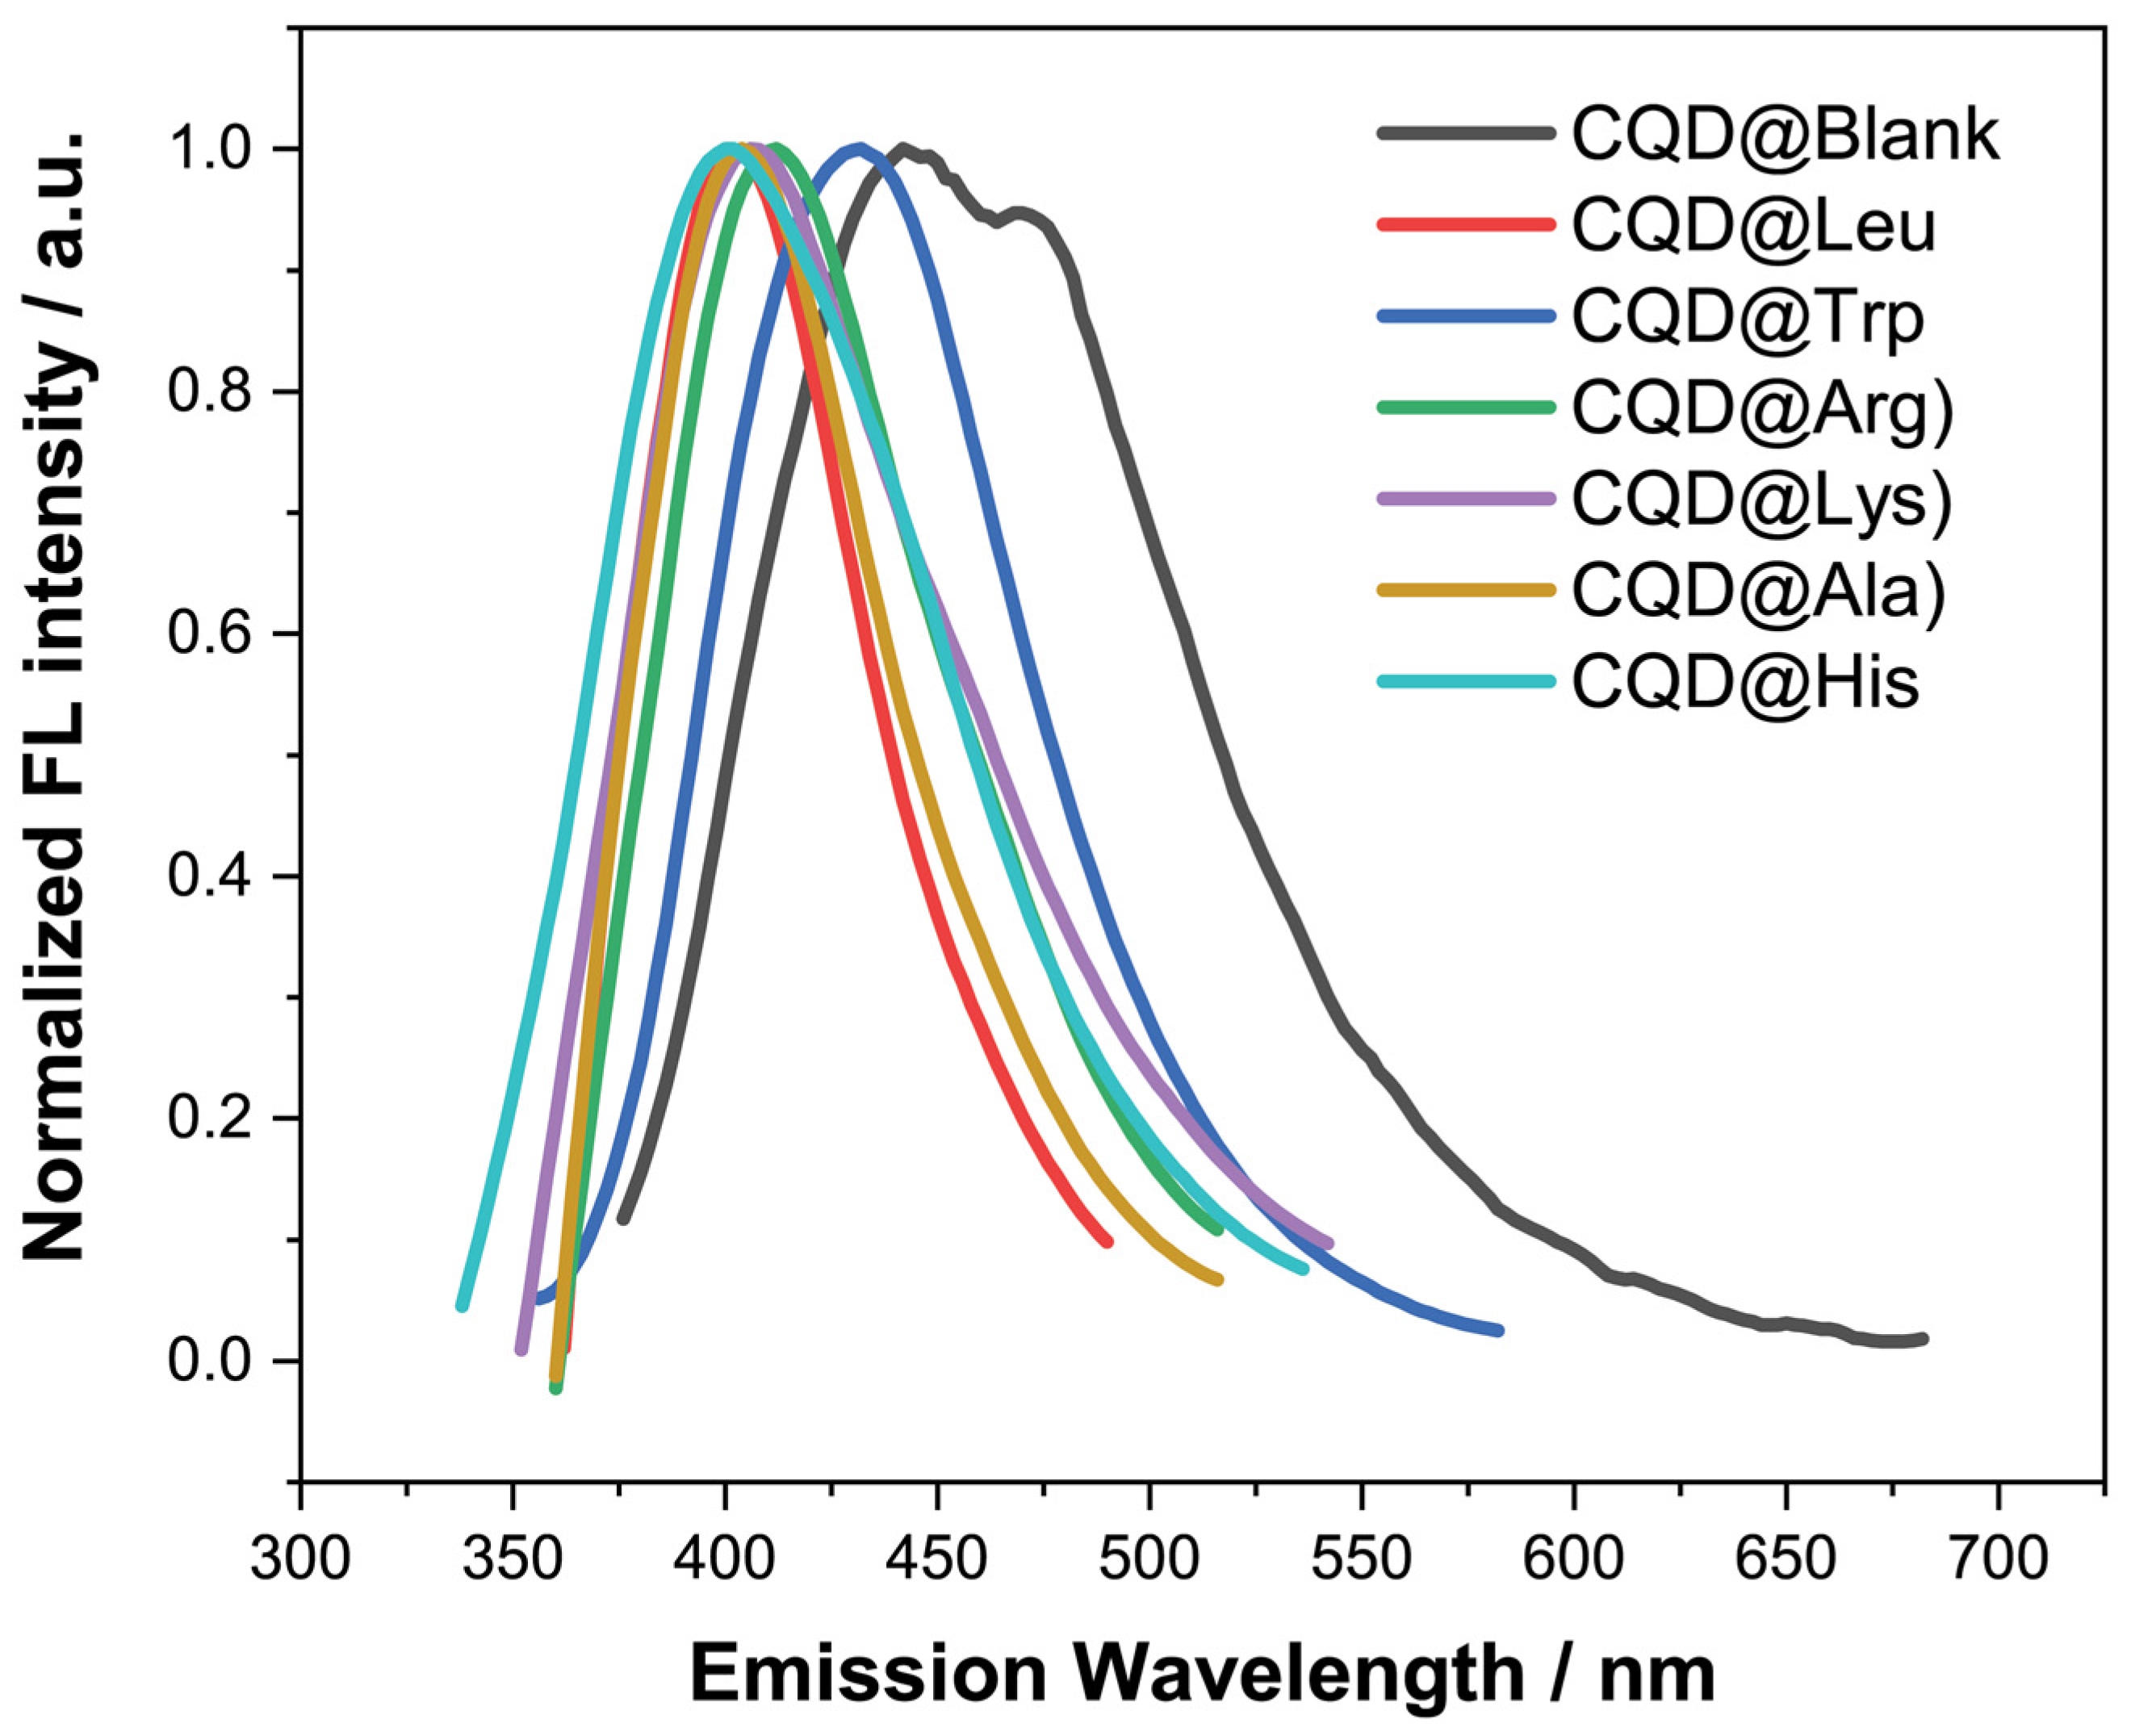
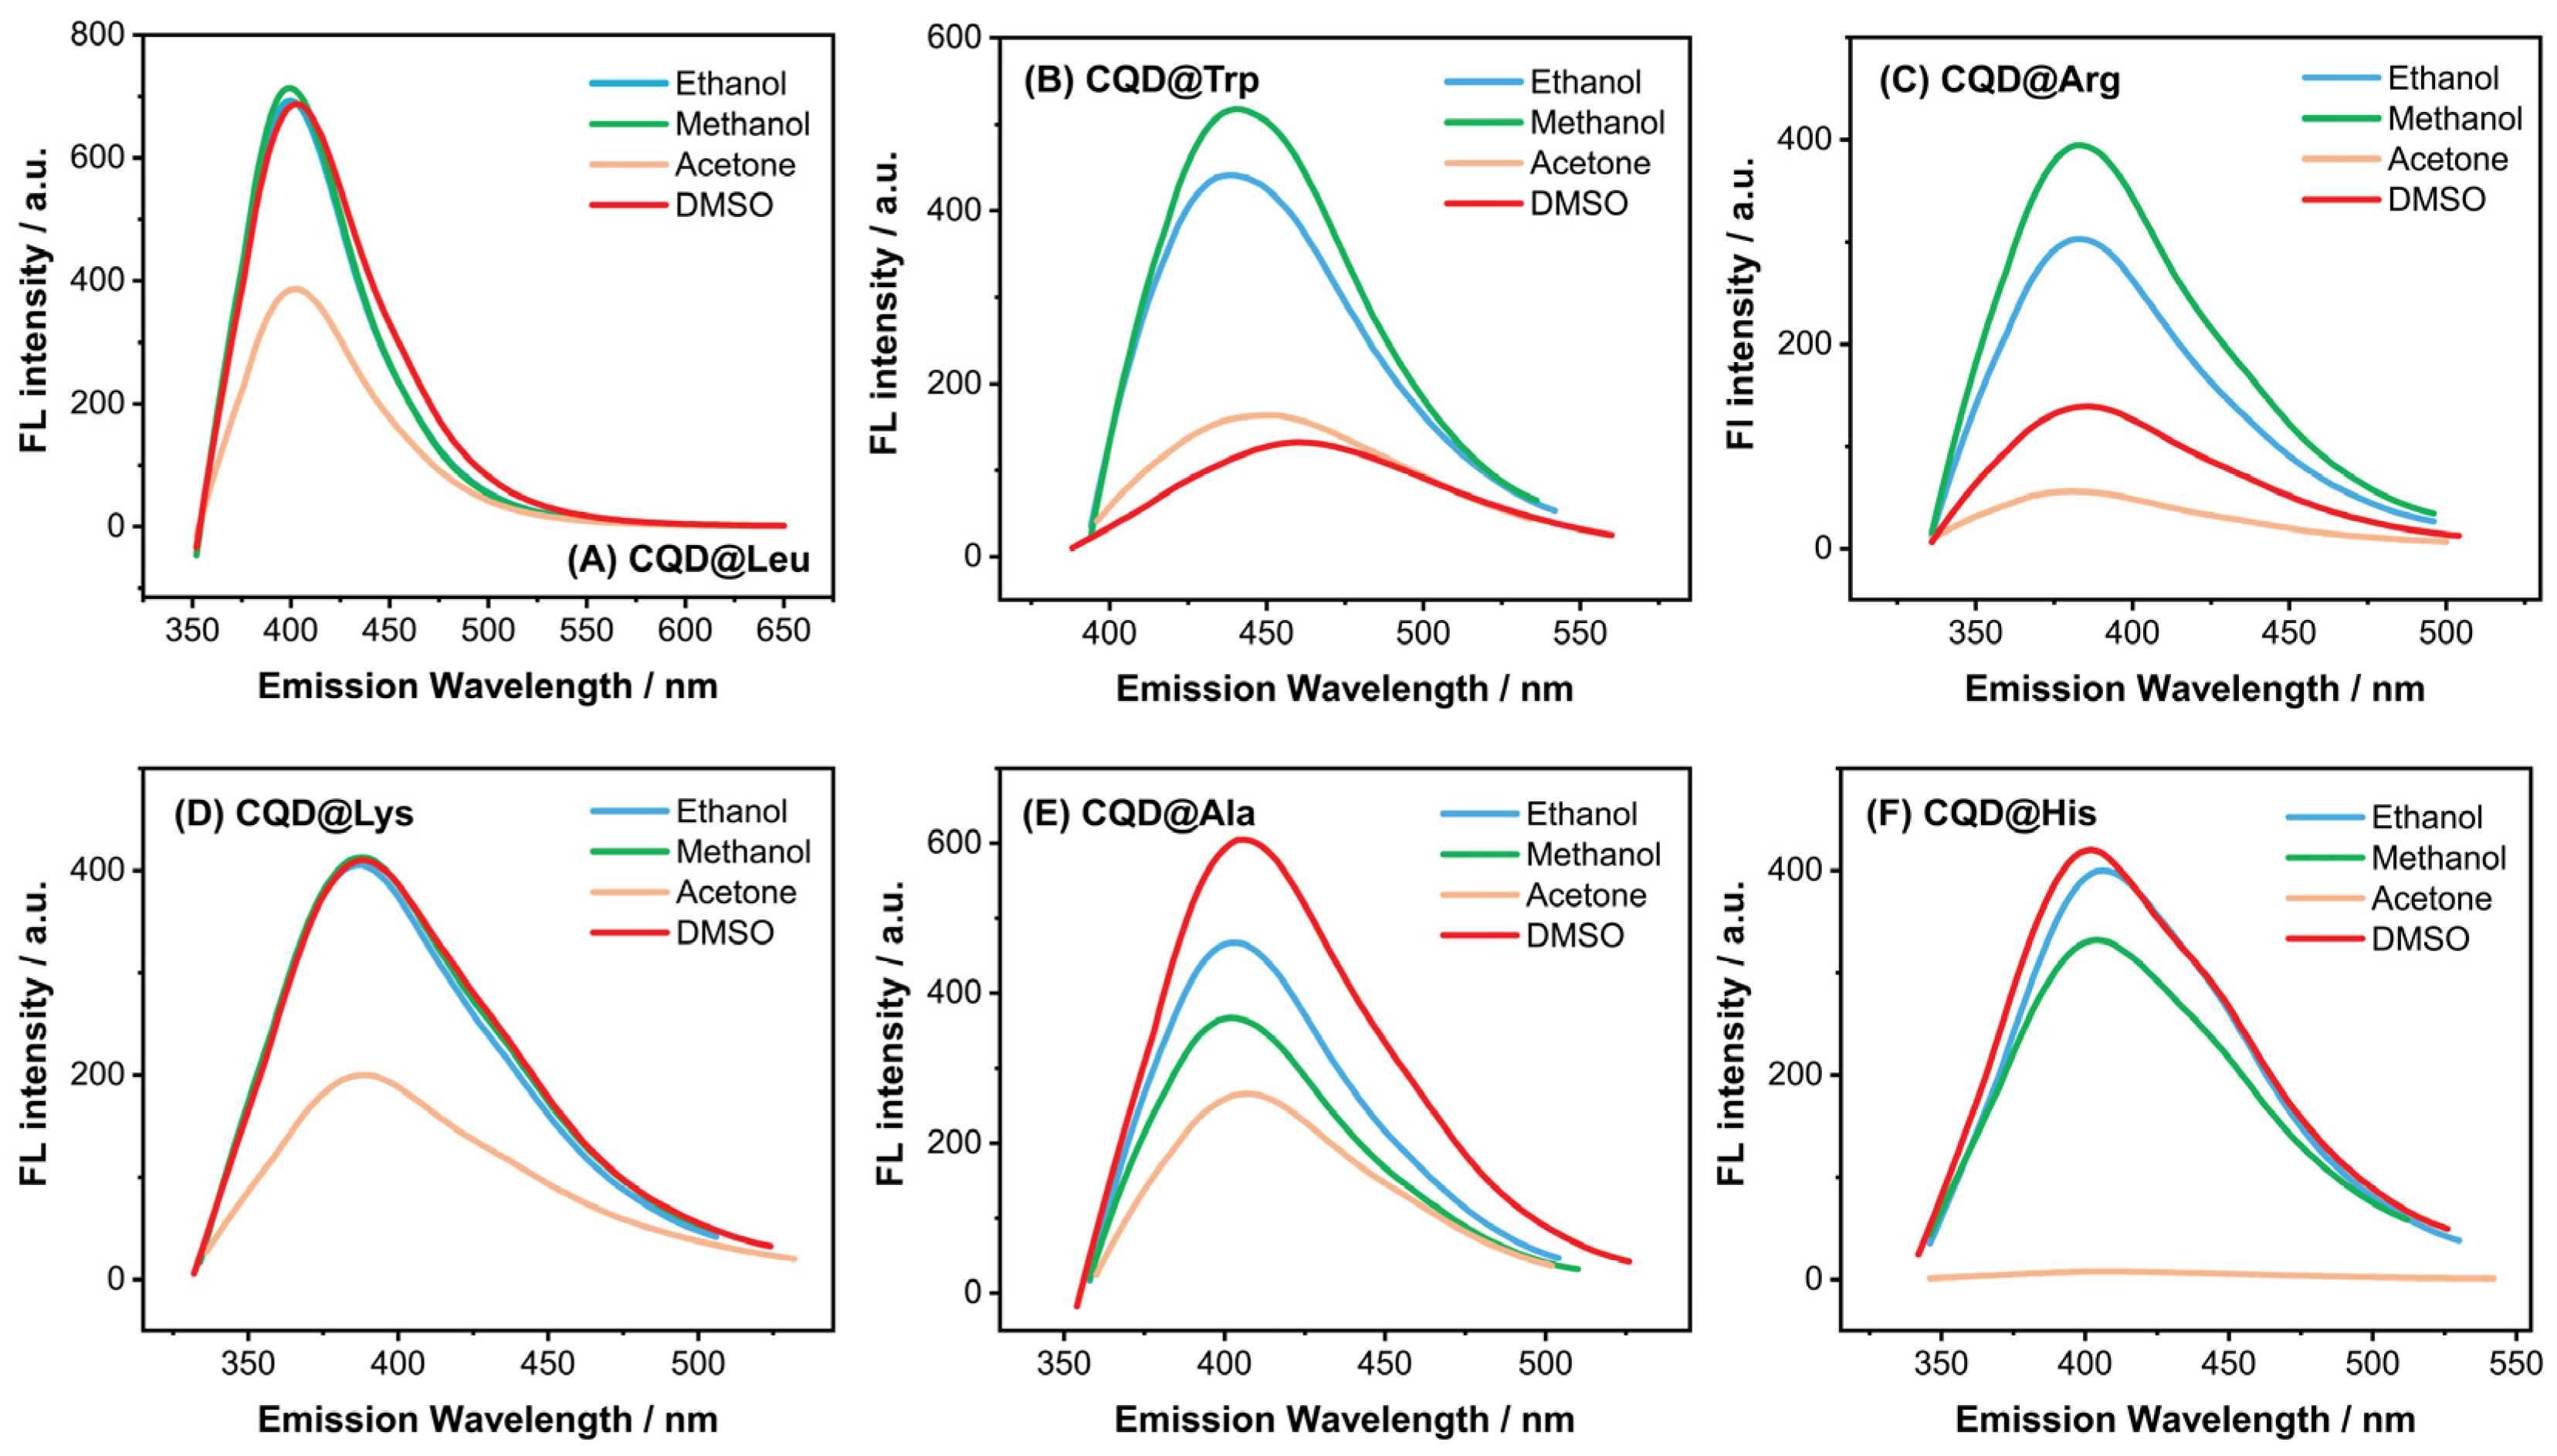
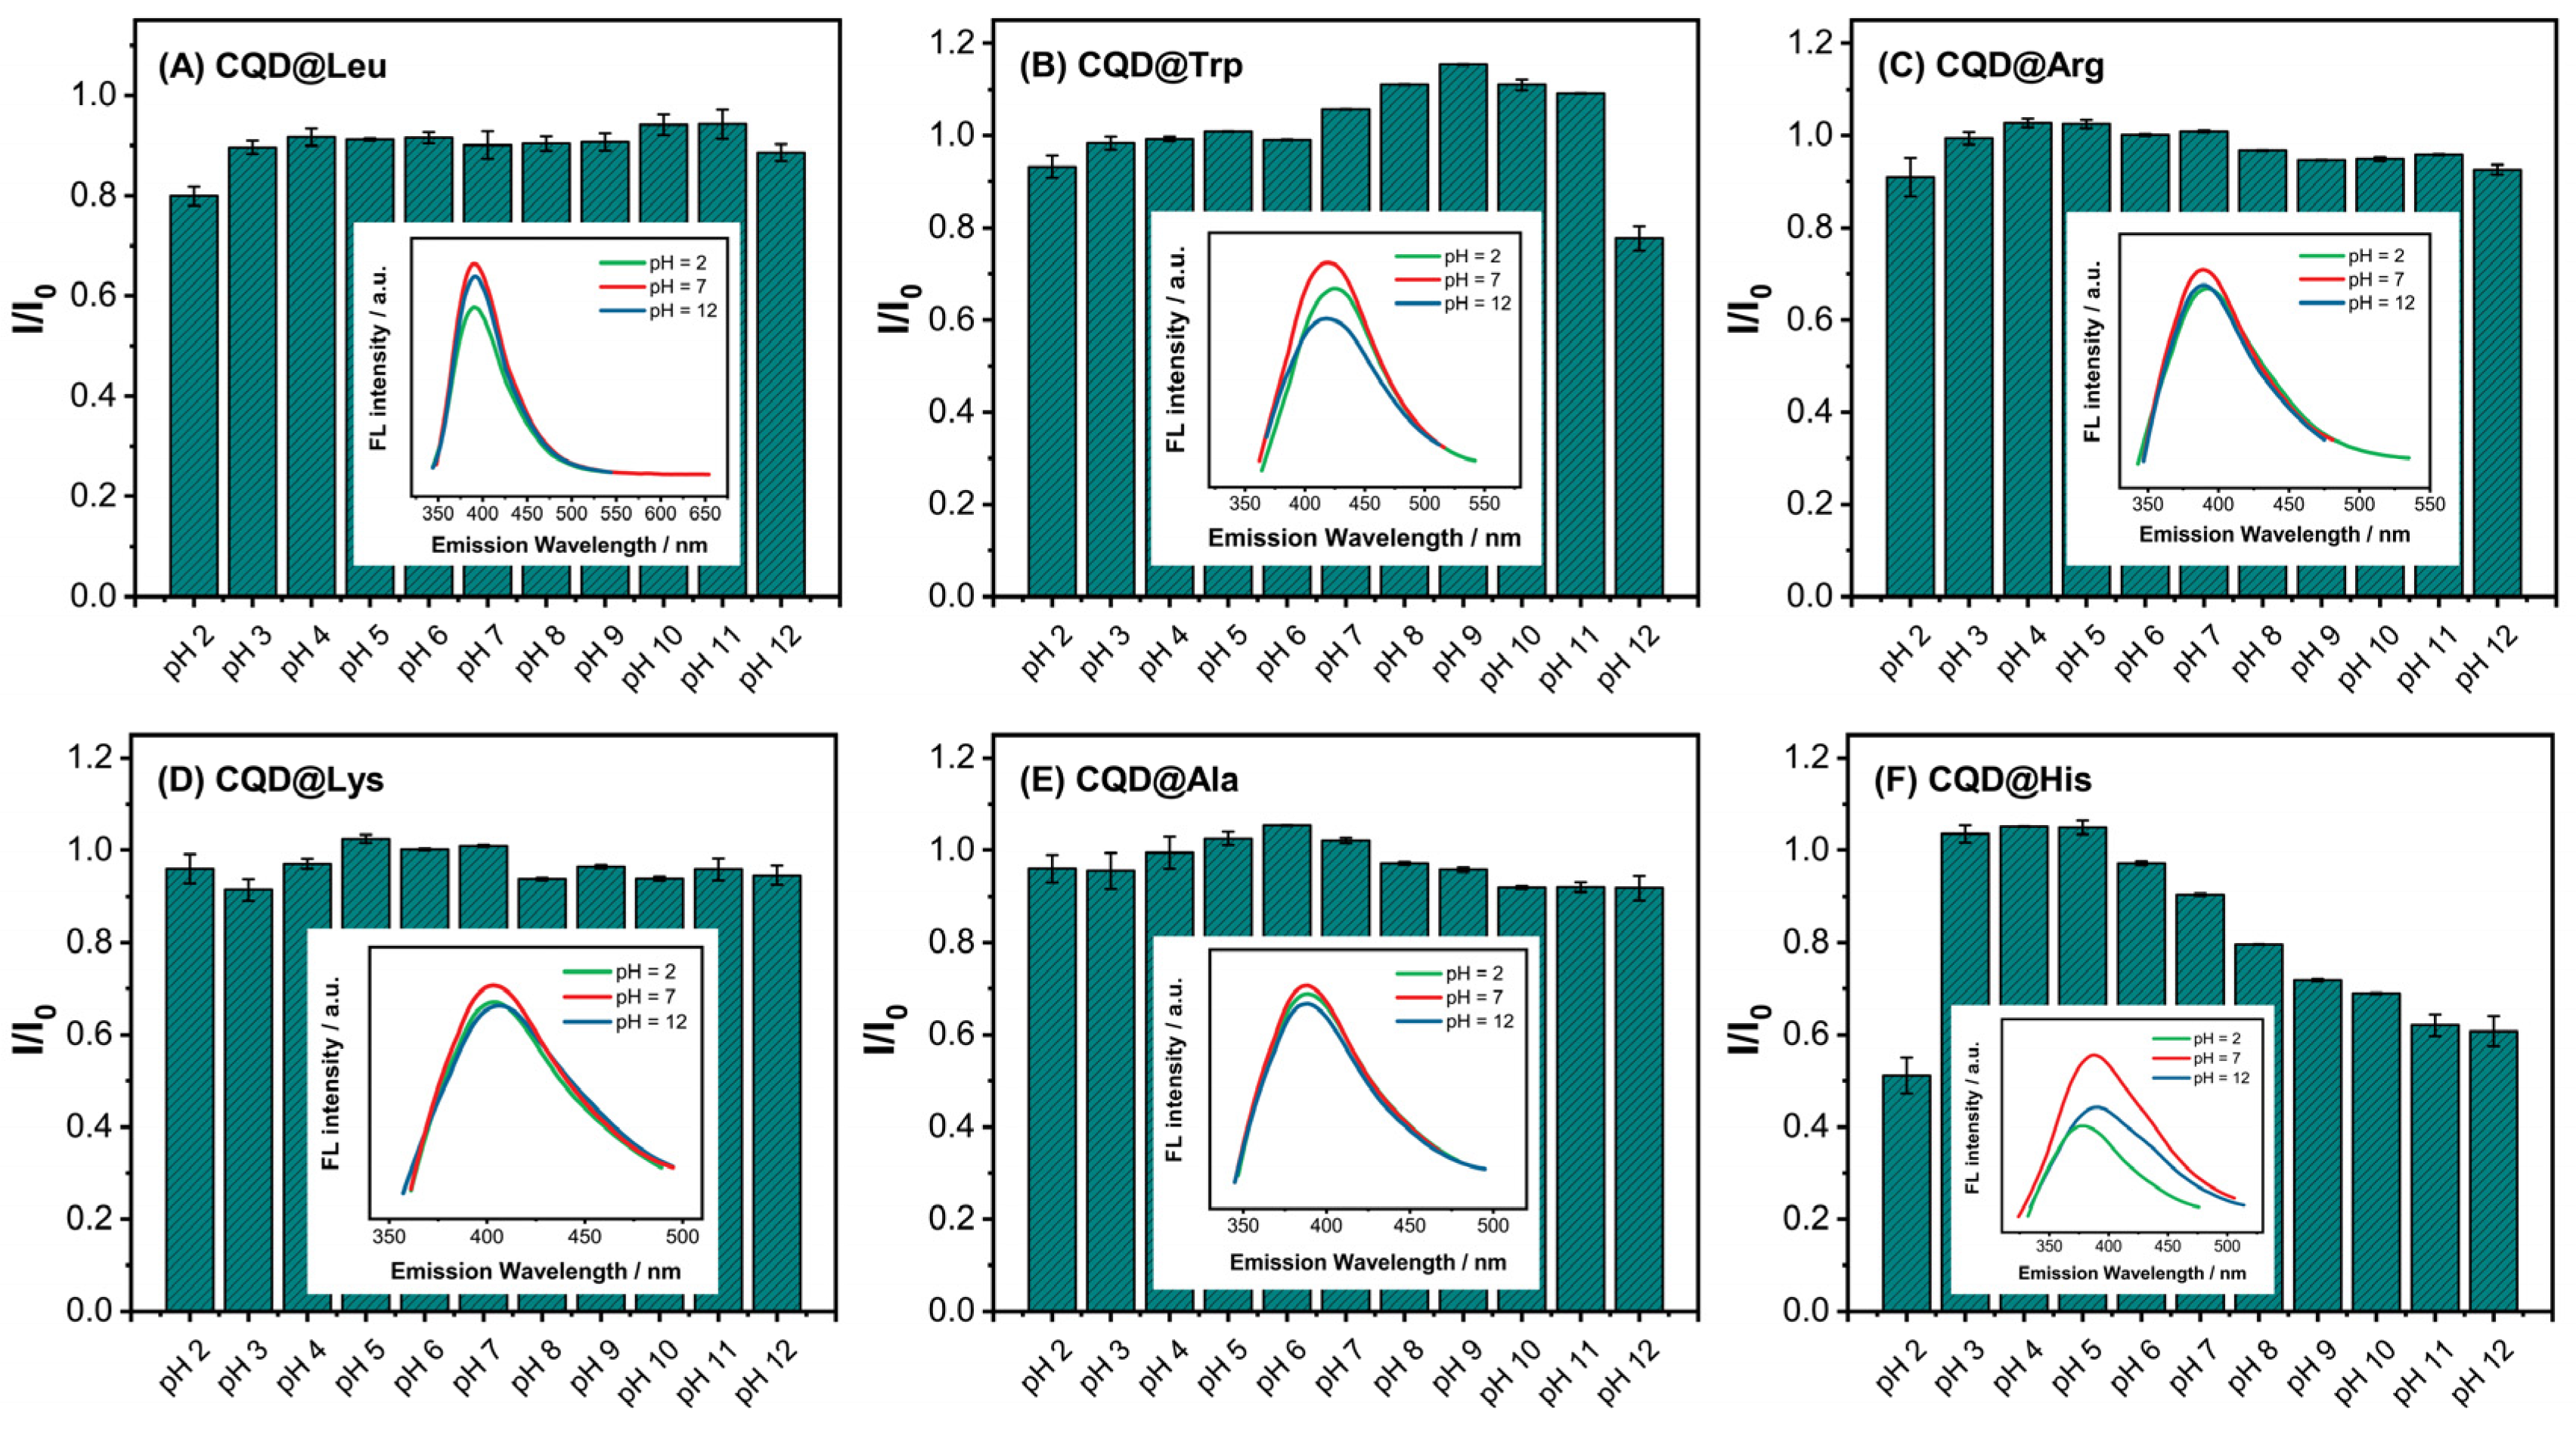
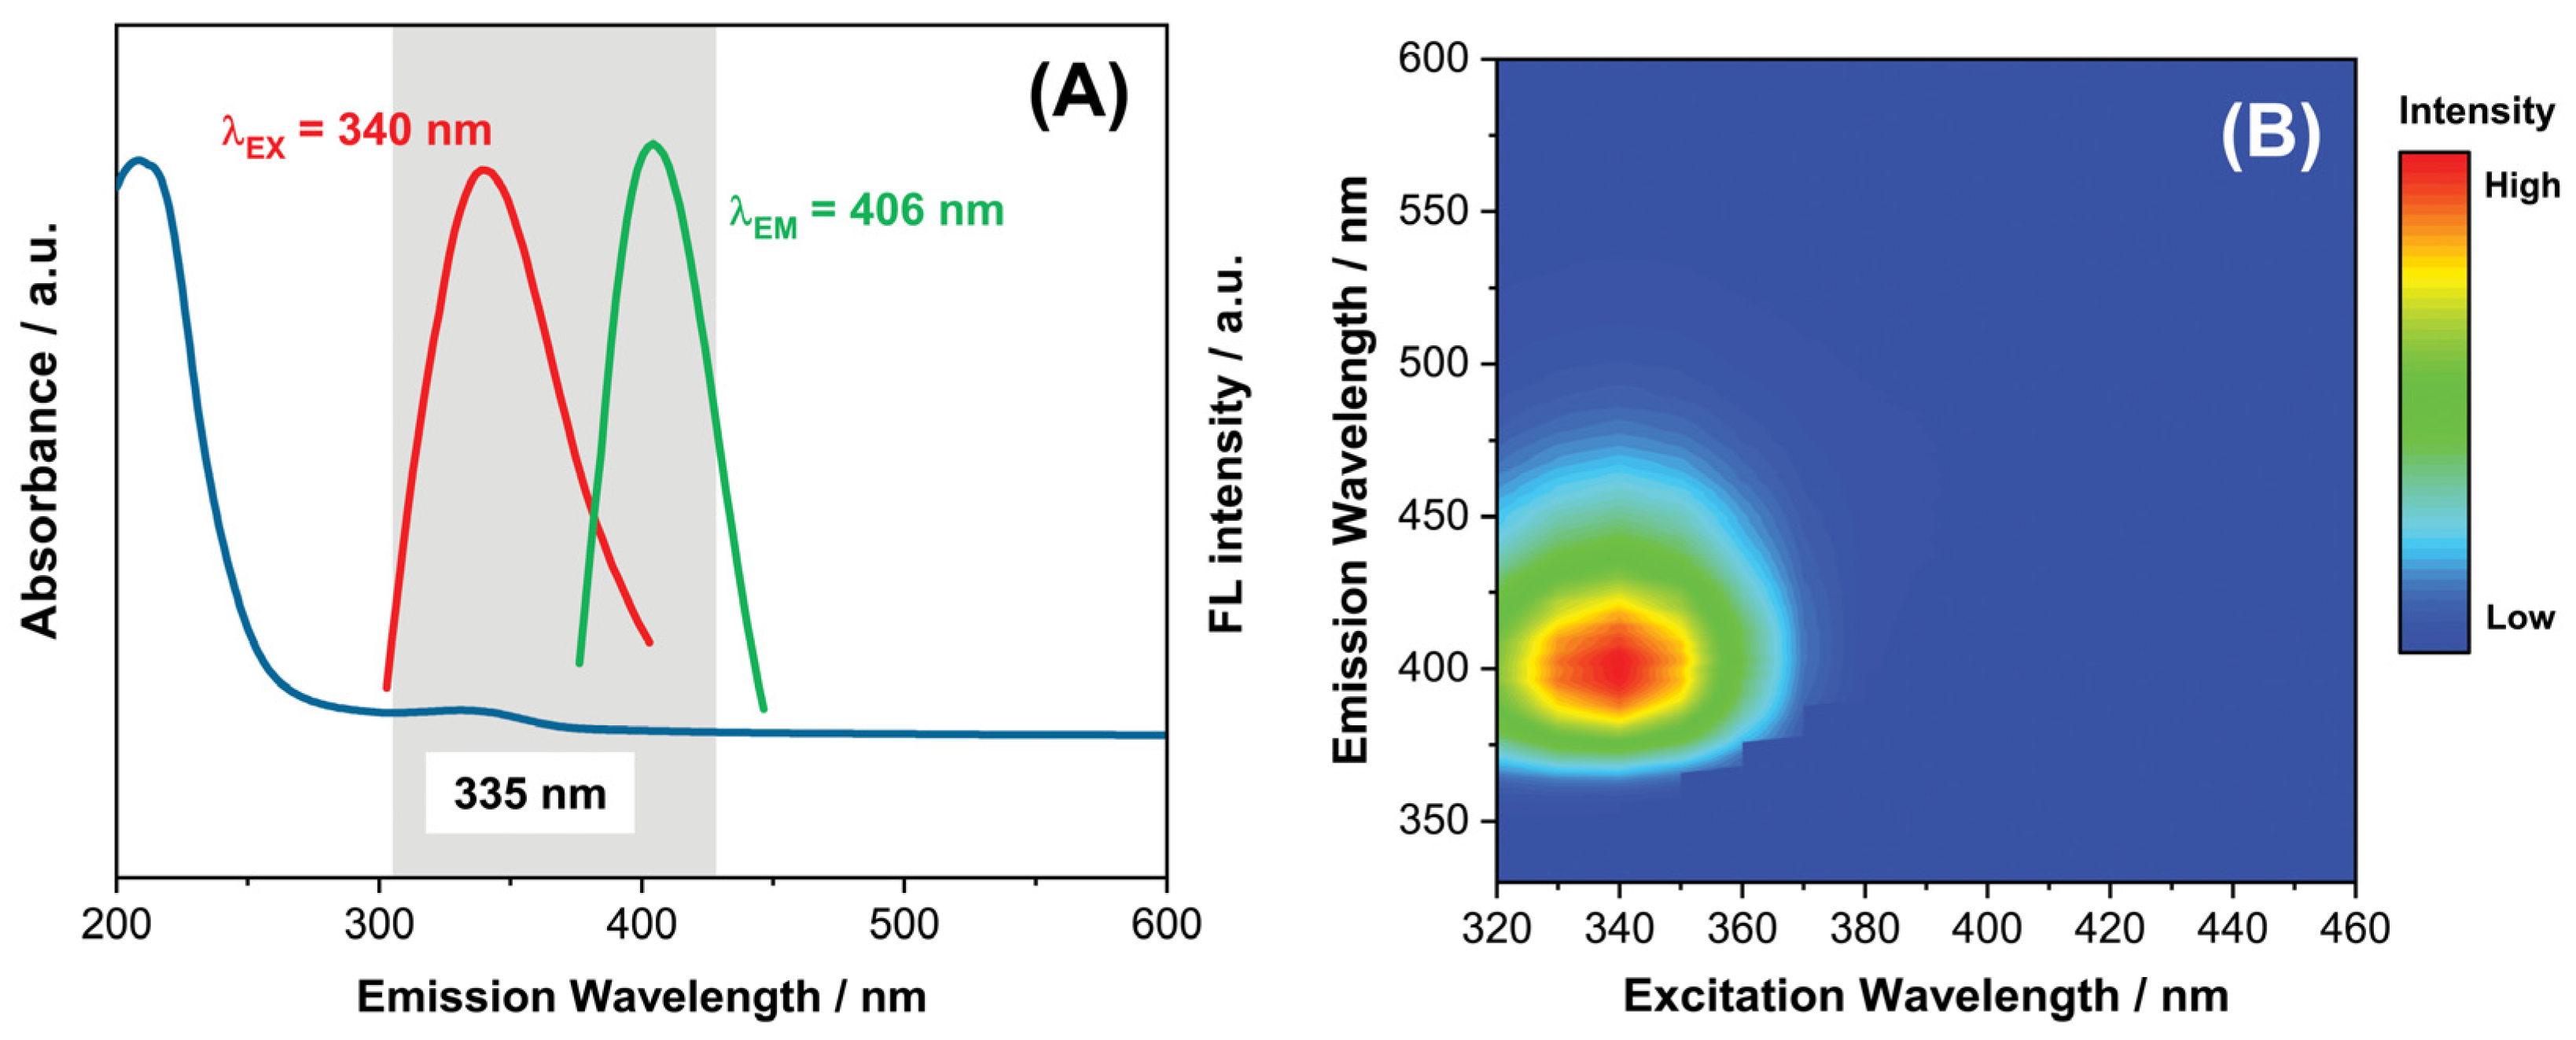
3.2. Optical Characterization of CQDs
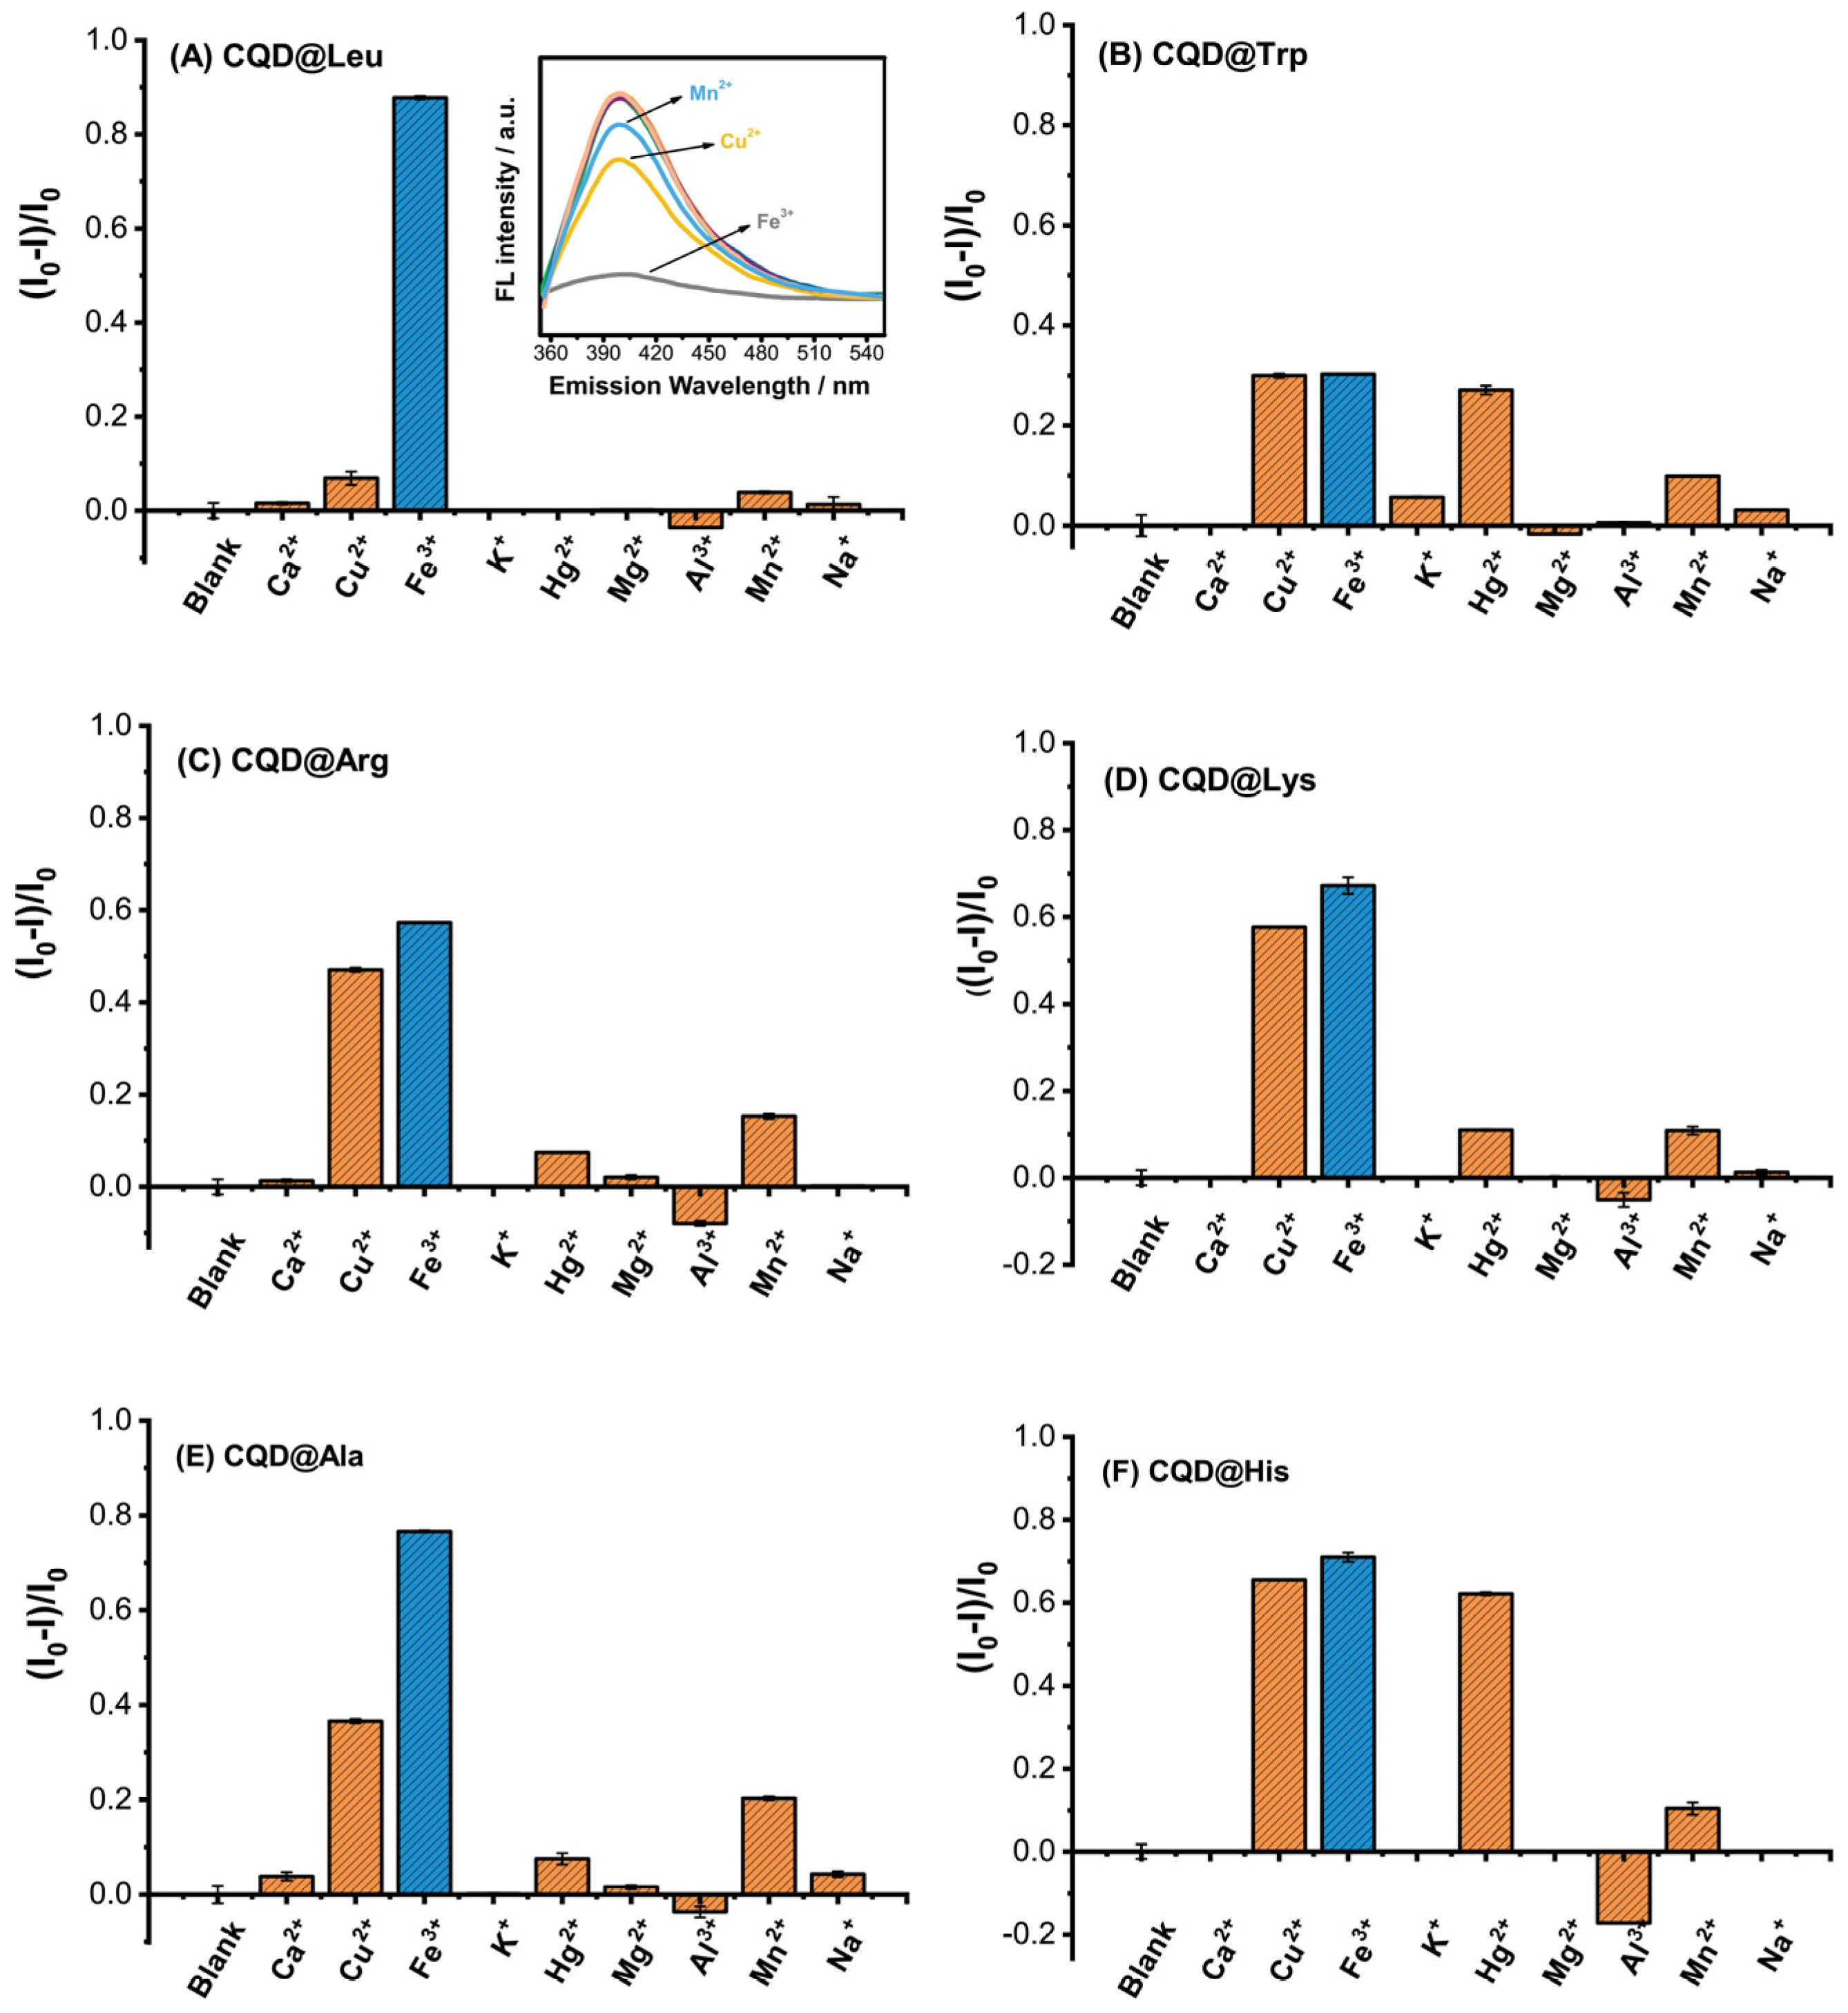
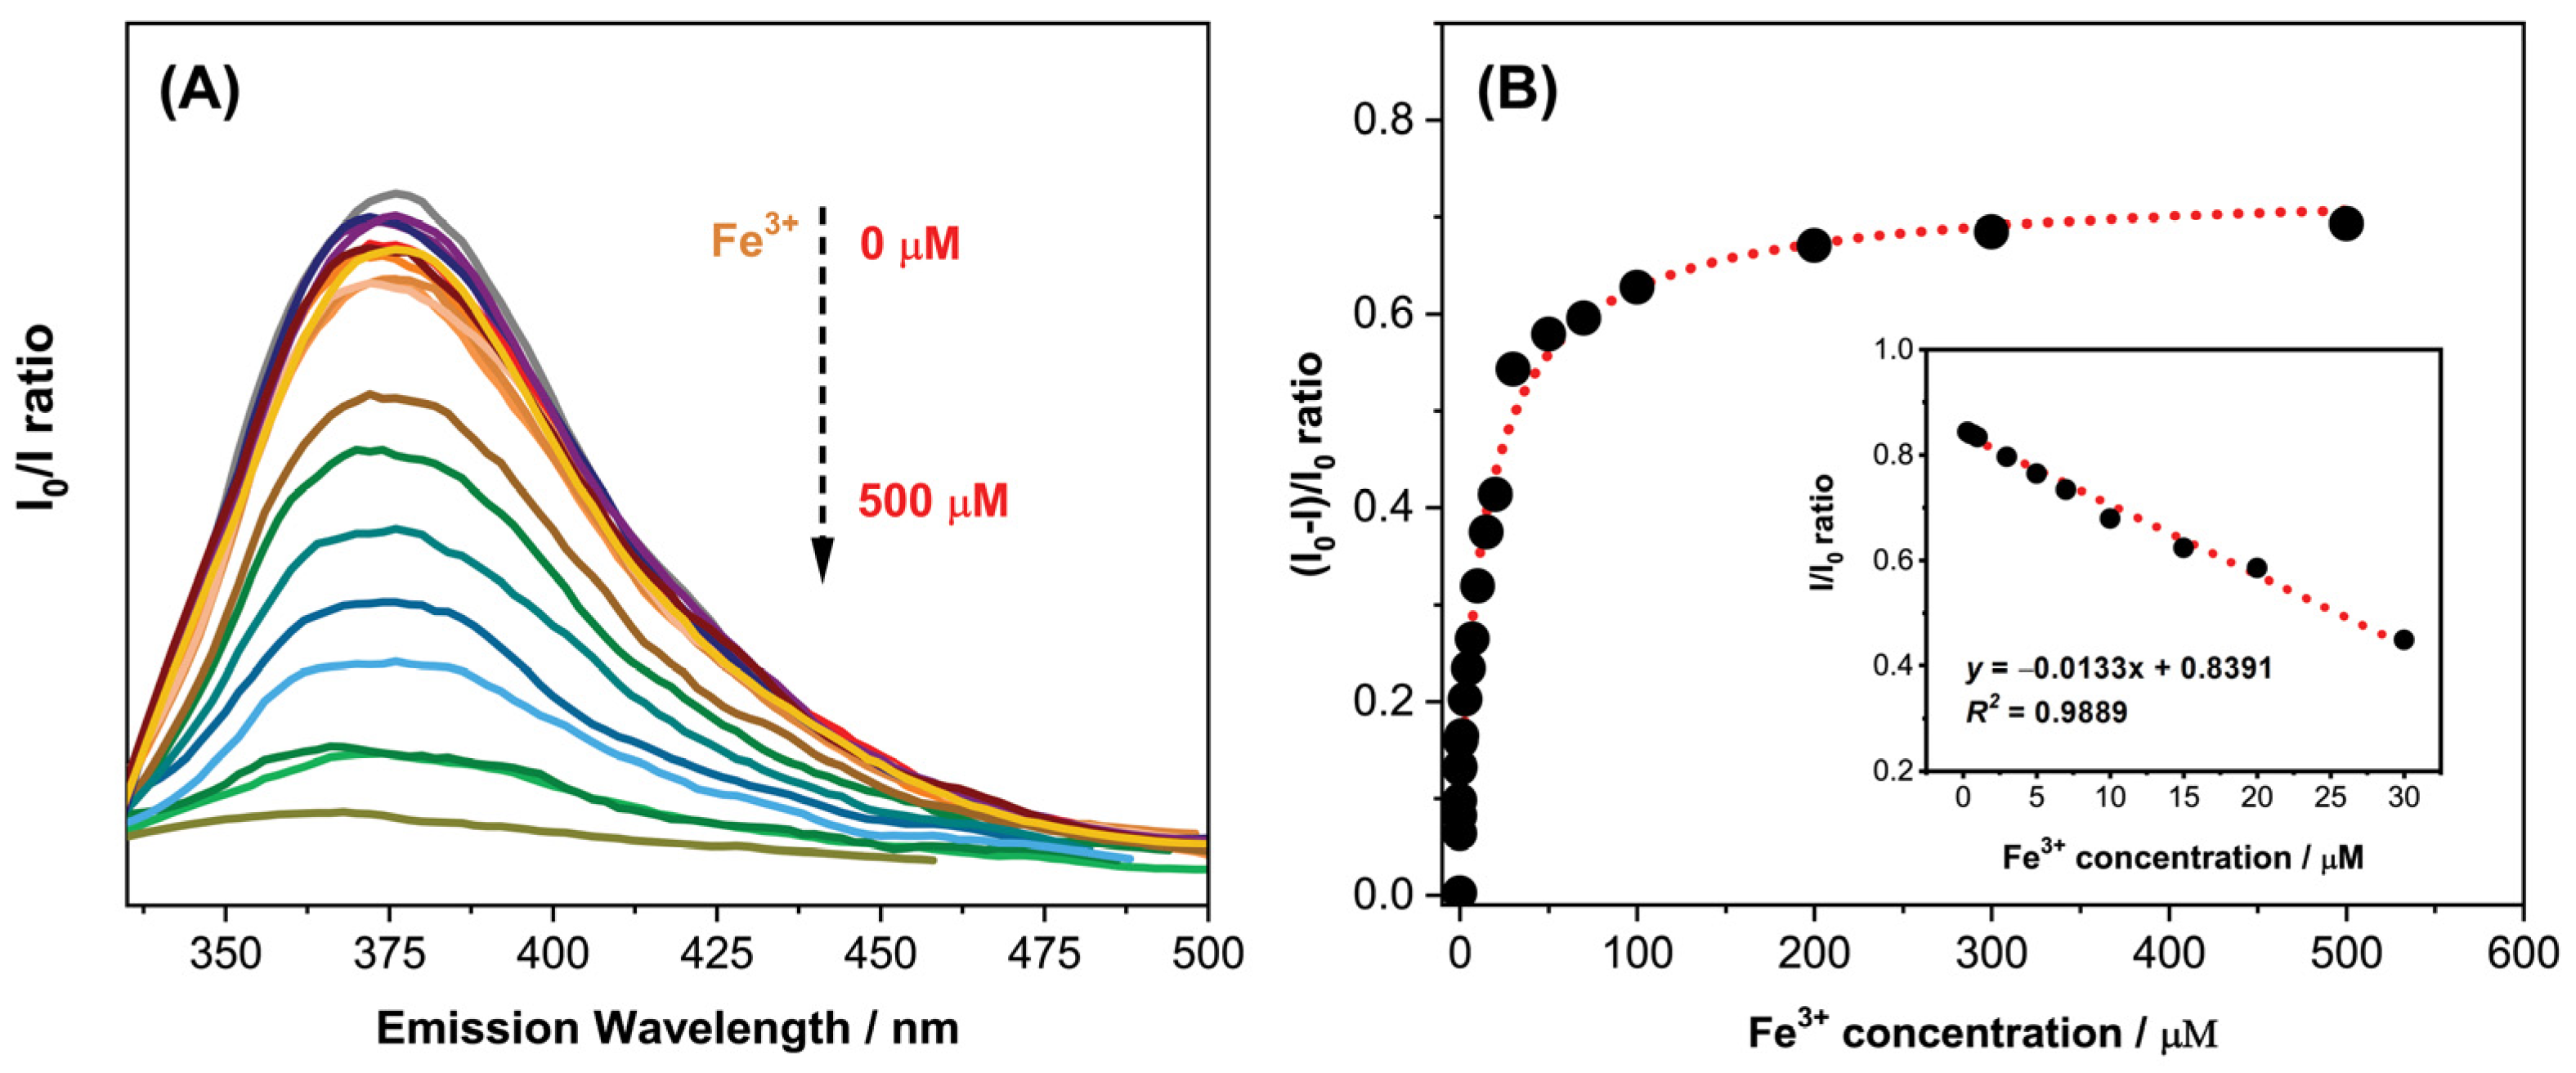
3.3. The Application of CQD@Leu in Sensing and Fe3+ Ions Detection
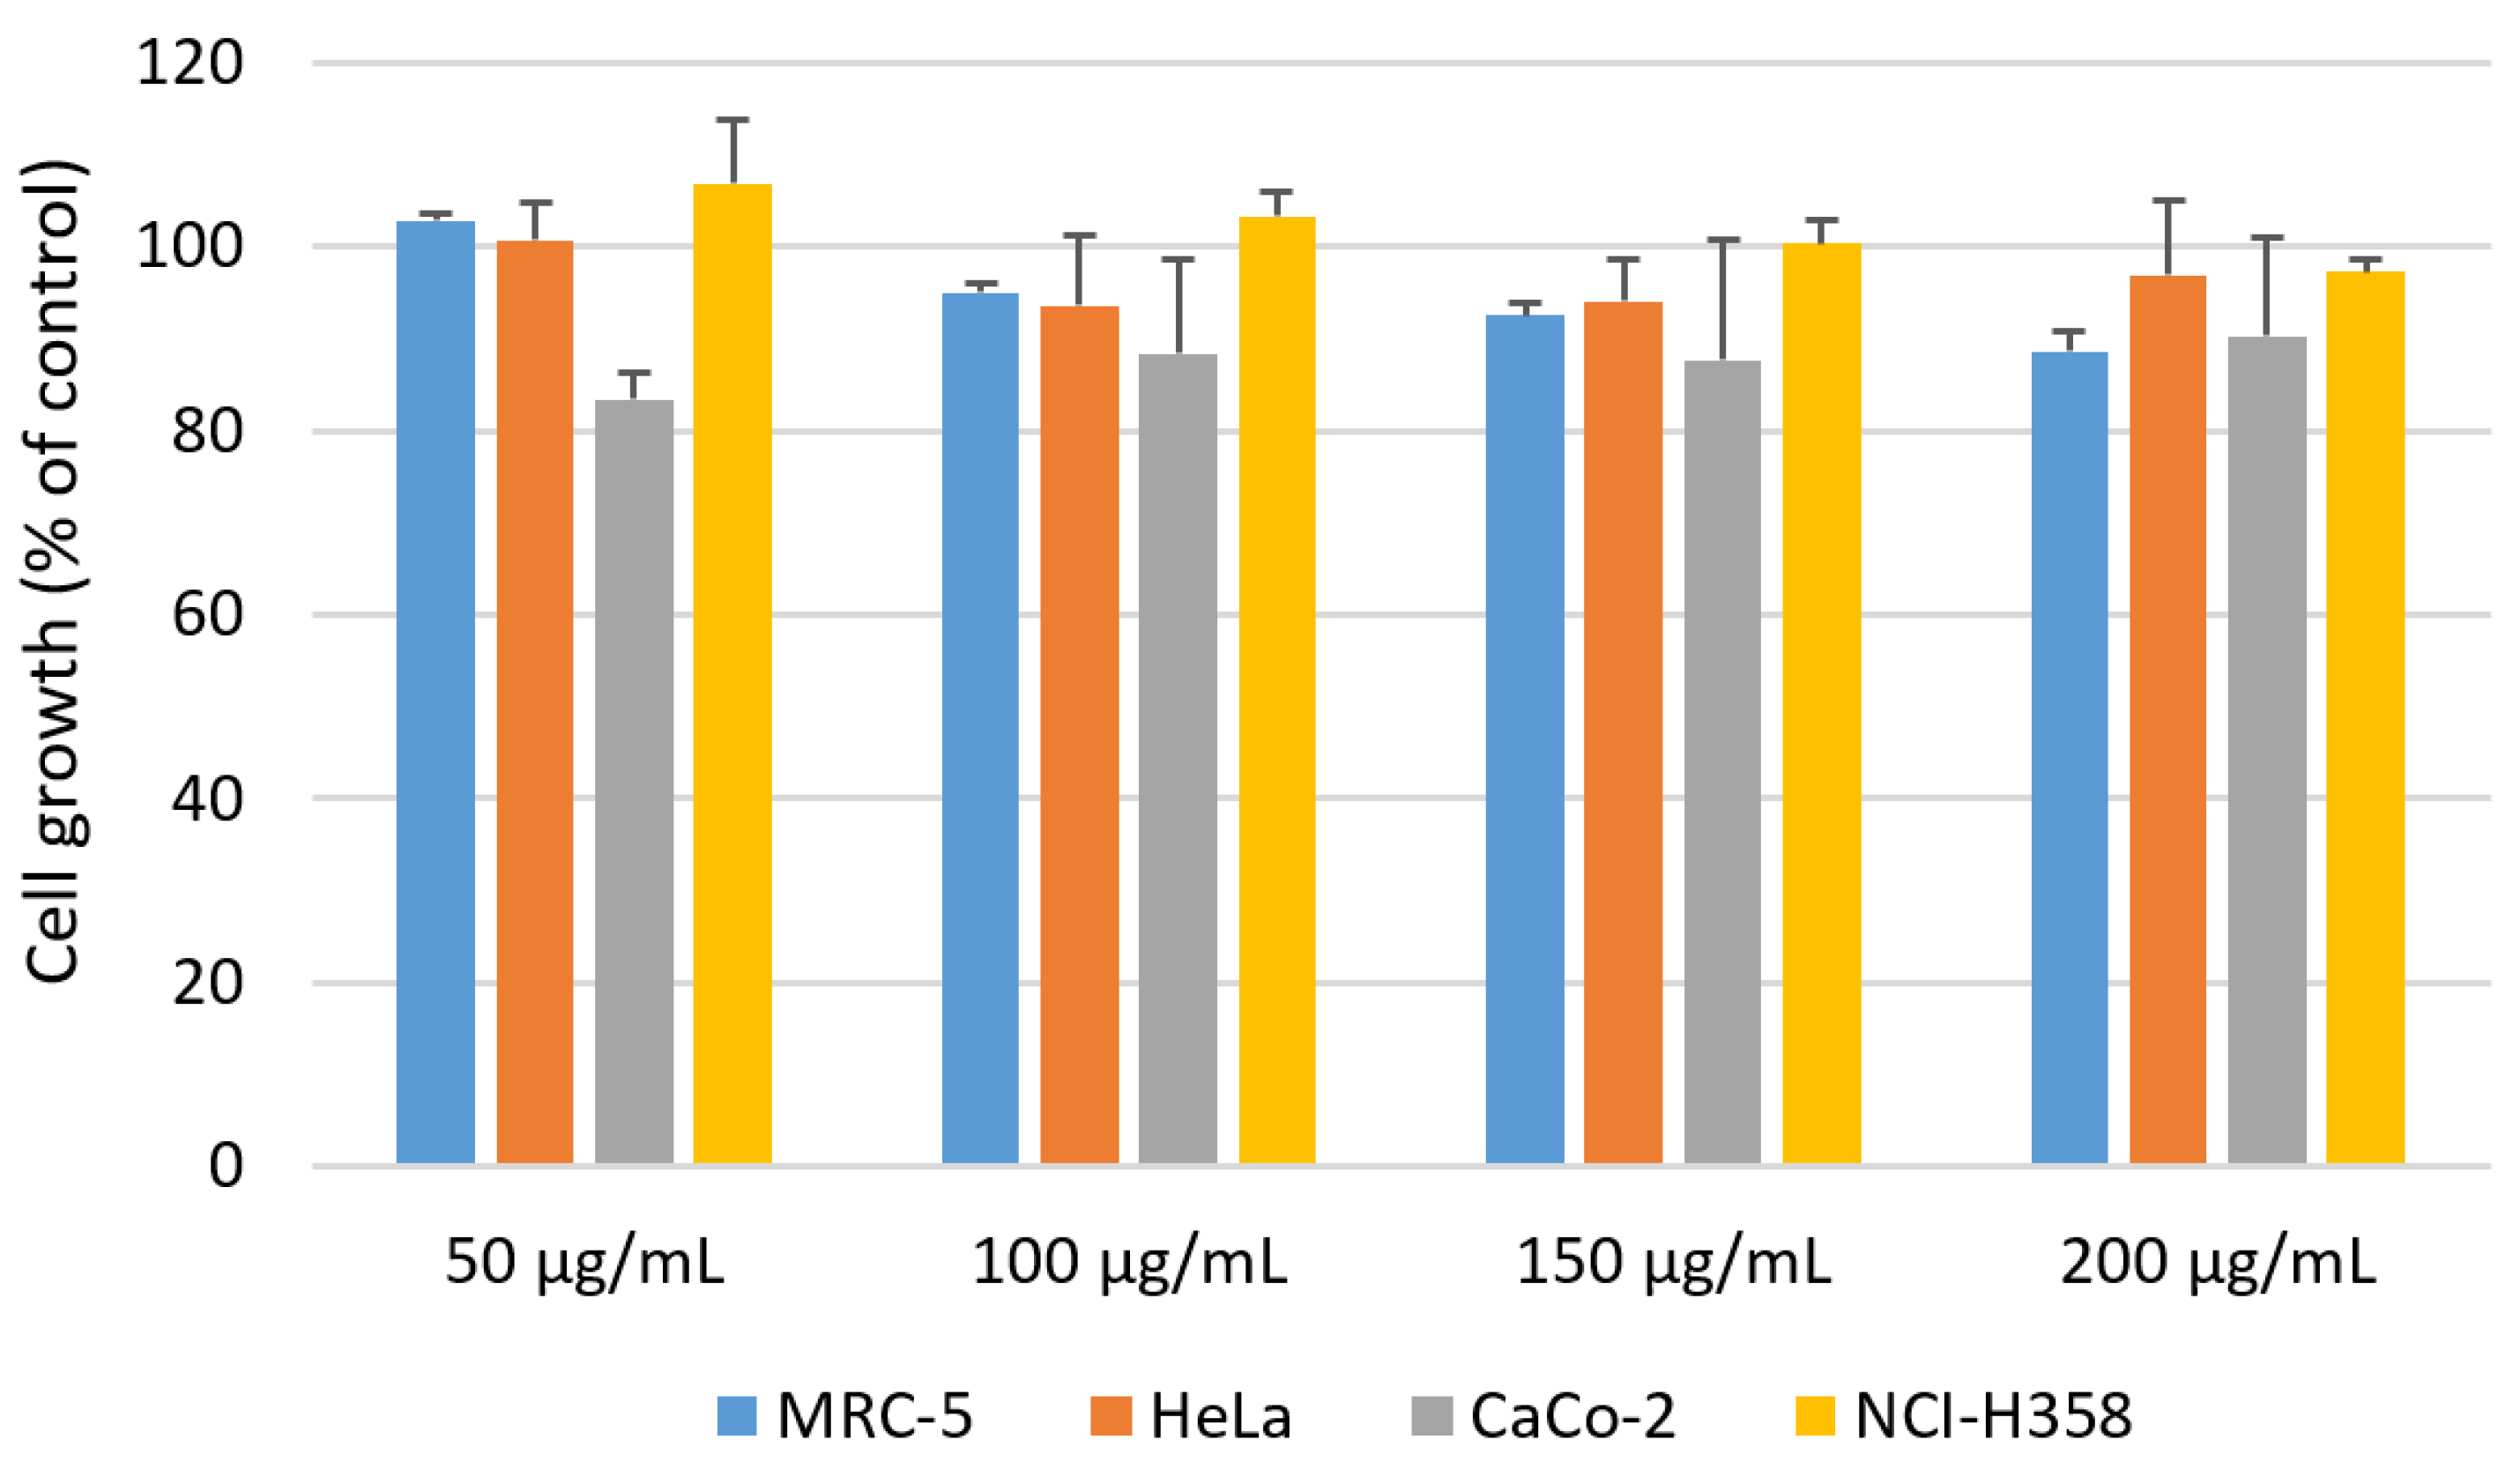
3.4. Cytotoxicity Evaluation of CQD@Leu
4. Conclusions
Supplementary Materials
Author Contributions
Funding
Institutional Review Board Statement
Informed Consent Statement
Data Availability Statement
Acknowledgments
Conflicts of Interest
References
- Mintz, K.J.; Zhou, Y.; Leblanc, R.M. Recent Development of Carbon Quantum Dots Regarding Their Optical Properties, Photoluminescence Mechanism, and Core Structure. Nanoscale 2019, 11, 4634–4652. [Google Scholar] [CrossRef] [PubMed]
- Zhang, L.; Yang, X.; Yin, Z.; Sun, L. A Review on Carbon Quantum Dots: Synthesis, Photoluminescence Mechanisms and Applications. Luminescence 2022, 37, 1612–1638. [Google Scholar] [CrossRef]
- Ji, C.; Zhou, Y.; Leblanc, R.M.; Peng, Z. Recent Developments of Carbon Dots in Biosensing: A Review. ACS Sens. 2020, 5, 2724–2741. [Google Scholar] [CrossRef]
- Safari, M. Recent Advances in Quantum Dots-Based Biosensors. In Quantum Dots—Recent Advances, New Perspectives and Contemporary Applications. IntechOpen 2022. [Google Scholar] [CrossRef]
- Wang, B.; Cai, H.; Waterhouse, G.I.N.; Qu, X.; Yang, B.; Lu, S. Carbon Dots in Bioimaging, Biosensing and Therapeutics: A Comprehensive Review. Small Sci. 2022, 2, 2200012. [Google Scholar] [CrossRef]
- Qi, C.; Yang, A.; Wang, H.; Zhang, Z.; Wang, J. Ultrasensitive Fluorescent “ON-OFF” Label-Free Immunosensor for Detection of Vitellogenin of Marine Medaka. Chemosensors 2022, 10, 510. [Google Scholar] [CrossRef]
- Gao, X.; Du, C.; Zhuang, Z.; Chen, W. Carbon Quantum Dot-Based Nanoprobes for Metal Ion Detection. J. Mater. Chem. C 2016, 4, 6927–6945. [Google Scholar] [CrossRef]
- Chu, H.-W.; Unnikrishnan, B.; Anand, A.; Lin, Y.-W.; Huang, C.-C. Carbon Quantum Dots for the Detection of Antibiotics and Pesticides. J. Food Drug Anal. 2020, 28, 540–558. [Google Scholar] [CrossRef]
- Šafranko, S.; Goman, D.; Stanković, A.; Medvidović-Kosanović, M.; Moslavac, T.; Jerković, I.; Jokić, S. An Overview of the Recent Developments in Carbon Quantum Dots—Promising Nanomaterials for Metal Ion Detection and (Bio)Molecule Sensing. Chemosensors 2021, 9, 138. [Google Scholar] [CrossRef]
- Qin, T.; Wang, J.; Liu, Y.; Guo, S. Carbon Quantum Dots Based Chemosensor Array for Monitoring Multiple Metal Ions. Molecules 2022, 27, 3843. [Google Scholar] [CrossRef]
- Torres Landa, S.D.; Kaur, I.; Agarwal, V. Pithecellobium Dulce Leaf-Derived Carbon Dots for 4-Nitrophenol and Cr(VI) Detection. Chemosensors 2022, 10, 532. [Google Scholar] [CrossRef]
- Sun, S.; Guo, S.; Qin, Q.; Liao, Y.; Li, M.; Du, F. Box–Behnken Design Optimizing Sugarcane Bagasse-Based Nitrogen-Doped Carbon Quantum Dots Preparation and Application in Ferric Ion Detection. Chemosensors 2022, 10, 453. [Google Scholar] [CrossRef]
- Guo, Y.; Zhang, L.; Cao, F.; Leng, Y. Thermal treatment of hair for the synthesis of sustainable carbon quantum dots and the applications for sensing Hg2+. Sci. Rep. 2016, 6, 35795. [Google Scholar] [CrossRef] [Green Version]
- Nair, A.N.; Chava, V.S.; Bose, S.; Zheng, T.; Pilla, S.; Sreenivasan, S.T. In situ doping-enabled metal and nonmetal codoping in graphene quantum dots: Synthesis and application for contaminant sensing. ACS Sustain. Chem. Eng. 2020, 8, 16565–16576. [Google Scholar] [CrossRef]
- Azam, N.; Najabat Ali, M.; Javaid Khan, T. Carbon Quantum Dots for Biomedical Applications: Review and Analysis. Front. Mater. 2021, 8, 700403. [Google Scholar] [CrossRef]
- Shen, C.-L.; Liu, H.-R.; Lou, Q.; Wang, F.; Liu, K.-K.; Dong, L.; Shan, C.-X. Recent Progress of Carbon Dots in Targeted Bioimaging and Cancer Therapy. Theranostics 2022, 12, 2860–2893. [Google Scholar] [CrossRef] [PubMed]
- Fernando, K.A.S.; Sahu, S.; Liu, Y.; Lewis, W.K.; Guliants, E.A.; Jafariyan, A.; Wang, P.; Bunker, C.E.; Sun, Y.-P. Carbon Quantum Dots and Applications in Photocatalytic Energy Conversion. ACS Appl. Mater. Interfaces 2015, 7, 8363–8376. [Google Scholar] [CrossRef] [PubMed]
- Heng, Z.W.; Chong, W.C.; Pang, Y.L.; Koo, C.H. An Overview of the Recent Advances of Carbon Quantum Dots/Metal Oxides in the Application of Heterogeneous Photocatalysis in Photodegradation of Pollutants towards Visible-Light and Solar Energy Exploitation. J. Environ. Chem. Eng. 2021, 9, 105199. [Google Scholar] [CrossRef]
- Domingo-Tafalla, B.; Martínez-Ferrero, E.; Franco, F.; Palomares-Gil, E. Applications of Carbon Dots for the Photocatalytic and Electrocatalytic Reduction of CO2. Molecules 2022, 27, 1081. [Google Scholar] [CrossRef] [PubMed]
- Zhao, J.; Liu, C.; Li, Y.; Liang, J.; Liu, J.; Qian, T.; Ding, J.; Cao, Y.-C. Preparation of carbon quantum dots based high photostability luminescent membranes. Luminescence 2017, 32, 625–630. [Google Scholar] [CrossRef]
- Molaei, M.J. Carbon Quantum Dots and Their Biomedical and Therapeutic Applications: A Review. RSC Adv. 2019, 9, 6460–6481. [Google Scholar] [CrossRef] [PubMed]
- Su, W.; Wu, H.; Xu, H.; Zhang, Y.; Li, Y.; Li, X.; Fan, L. Carbon Dots: A Booming Material for Biomedical Applications. Mater. Chem. Front. 2020, 4, 821–836. [Google Scholar] [CrossRef]
- Alaghmandfard, A.; Sedighi, O.; Tabatabaei Rezaei, N.; Abedini, A.A.; Malek Khachatourian, A.; Toprak, M.S.; Seifalian, A. Recent Advances in the Modification of Carbon-Based Quantum Dots for Biomedical Applications. Mater. Sci. Eng. C 2021, 120, 111756. [Google Scholar] [CrossRef] [PubMed]
- Adam, G.O.; Sharker, S.M.; Ryu, J.H. Emerging Biomedical Applications of Carbon Dot and Polymer Composite Materials. Appl. Sci. 2022, 12, 10565. [Google Scholar] [CrossRef]
- Boakye-Yiadom, K.O.; Kesse, S.; Opoku-Damoah, Y.; Filli, M.S.; Aquib, M.; Joelle, M.M.B.; Farooq, M.A.; Mavlyanova, R.; Raza, F.; Bavi, R.; et al. Carbon Dots: Applications in Bioimaging and Theranostics. Int. J. Pharm. 2019, 564, 308–317. [Google Scholar] [CrossRef]
- Wang, L.; Choi, W.M.; Chung, J.S.; Hur, S.H. Multicolor Emitting N-Doped Carbon Dots Derived from Ascorbic Acid and Phenylenediamine Precursors. Nanoscale Res. Lett. 2020, 15, 222. [Google Scholar] [CrossRef]
- Wang, W.; Zhang, Q.; Zhang, M.; Liu, Y.; Shen, J.; Zhou, N.; Lu, X.; Zhao, C. Multifunctional Red Carbon Dots: A Theranostic Platform for Magnetic Resonance Imaging and Fluorescence Imaging-Guided Chemodynamic Therapy. Analyst 2020, 145, 3592–3597. [Google Scholar] [CrossRef]
- Ross, S.; Wu, R.-S.; Wei, S.-C.; Ross, G.M.; Chang, H.-T. The Analytical and Biomedical Applications of Carbon Dots and Their Future Theranostic Potential: A Review. J. Food Drug Anal. 2020, 28, 678–696. [Google Scholar] [CrossRef]
- Chen, B.B.; Liu, M.L.; Huang, C.Z. Recent Advances of Carbon Dots in Imaging-Guided Theranostics. TrAC 2021, 134, 116116. [Google Scholar] [CrossRef]
- Wang, Y.; Hu, A. Carbon Quantum Dots: Synthesis, Properties and Applications. J. Mater. Chem. C 2014, 2, 6921. [Google Scholar] [CrossRef] [Green Version]
- Bruno, F.; Sciortino, A.; Buscarino, G.; Soriano, M.L.; Ríos, Á.; Cannas, M.; Gelardi, F.; Messina, F.; Agnello, S. A Comparative Study of Top-Down and Bottom-Up Carbon Nanodots and Their Interaction with Mercury Ions. Nanomaterials 2021, 11, 1265. [Google Scholar] [CrossRef] [PubMed]
- Khayal, A.; Dawane, V.; Amin, M.A.; Tirth, V.; Yadav, V.K.; Algahtani, A.; Khan, S.H.; Islam, S.; Yadav, K.K.; Jeon, B.-H. Advances in the Methods for the Synthesis of Carbon Dots and Their Emerging Applications. Polymers 2021, 13, 3190. [Google Scholar] [CrossRef] [PubMed]
- Cui, L.; Ren, X.; Sun, M.; Liu, H.; Xia, L. Carbon Dots: Synthesis, Properties and Applications. Nanomaterials 2021, 11, 3419. [Google Scholar] [CrossRef]
- Meng, W.; Bai, X.; Wang, B.; Liu, Z.; Lu, S.; Yang, B. Biomass-Derived Carbon Dots and Their Applications. Energy Environ. Mater. 2019, 2, 172–192. [Google Scholar] [CrossRef]
- Khairol Anuar, N.K.; Tan, H.L.; Lim, Y.P.; So’aib, M.S.; Abu Bakar, N.F. A Review on Multifunctional Carbon-Dots Synthesized from Biomass Waste: Design/Fabrication, Characterization and Applications. Front. Energy Res. 2021, 9, 626549. [Google Scholar] [CrossRef]
- Ludmerczki, R.; Mura, S.; Carbonaro, C.M.; Mandity, I.M.; Carraro, M.; Senes, N.; Garroni, S.; Granozzi, G.; Calvillo, L.; Marras, S.; et al. Carbon Dots from Citric Acid and Its Intermediates Formed by Thermal Decomposition. Chem. Eur. J. 2019, 25, 11963–11974. [Google Scholar] [CrossRef]
- Chahal, S.; Yousefi, N.; Tufenkji, N. Green Synthesis of High Quantum Yield Carbon Dots from Phenylalanine and Citric Acid: Role of Stoichiometry and Nitrogen Doping. ACS Sustain. Chem. Eng. 2020, 8, 5566–5575. [Google Scholar] [CrossRef]
- Meierhofer, F.; Dissinger, F.; Weigert, F.; Jungclaus, J.; Müller-Caspary, K.; Waldvogel, S.R.; Resch-Genger, U.; Voss, T. Citric Acid Based Carbon Dots with Amine Type Stabilizers: PH-Specific Luminescence and Quantum Yield Characteristics. J. Phys. Chem. C 2020, 124, 8894–8904. [Google Scholar] [CrossRef]
- Ren, J.; Malfatti, L.; Innocenzi, P. Citric Acid Derived Carbon Dots, the Challenge of Understanding the Synthesis-Structure Relationship. C 2020, 7, 2. [Google Scholar] [CrossRef]
- Suner, S.S.; Sahiner, M.; Ayyala, R.S.; Bhethanabotla, V.R.; Sahiner, N. Versatile Fluorescent Carbon Dots from Citric Acid and Cysteine with Antimicrobial, Anti-Biofilm, Antioxidant, and AChE Enzyme Inhibition Capabilities. J. Fluoresc. 2021, 31, 1705–1717. [Google Scholar] [CrossRef]
- Lin, Z.; Zeng, Q.; Deng, Q.; Yao, W.; Deng, H.; Lin, X.; Chen, W. Citric Acid-Derived Carbon Dots as Excellent Cysteine Oxidase Mimics for Cysteine Sensing. Sens. Actuators B Chem. 2022, 359, 131563. [Google Scholar] [CrossRef]
- Egorova, M.N.; Tomskaya, A.E.; Kapitonov, A.N.; Alekseev, A.A.; Smagulova, S.A. Hydrothermal Synthesis of Luminescent Carbon Dots from Glucose and Birch Bark Soot. J. Struct. Chem. 2018, 59, 780–785. [Google Scholar] [CrossRef]
- Cailotto, S.; Amadio, E.; Facchin, M.; Selva, M.; Pontoglio, E.; Rizzolio, F.; Riello, P.; Toffoli, G.; Benedetti, A.; Perosa, A. Carbon Dots from Sugars and Ascorbic Acid: Role of the Precursors on Morphology, Properties, Toxicity, and Drug Uptake. ACS Med. Chem. Lett. 2018, 9, 832–837. [Google Scholar] [CrossRef]
- Lohithakshan, L.C.; Pattarathil, M.S.; Geetha, V.; Kannan, P. Photoluminescent Glucose Derived Carbon Quantum Dots for Photonic and Optoelectronic Applications. In Proceedings of the OSA Advanced Photonics Congress (AP) 2020 (IPR, NP, NOMA, Networks, PVLED, PSC, SPPCom, SOF), Montreal, QC, Canada, 13–16 July 2020; Optica Publishing Group: Washington, DC, USA, 2020; p. JTu4C.12. [Google Scholar]
- Wang, K.; Geng, C.; Wang, F.; Zhao, Y.; Ru, Z. Urea-Doped Carbon Dots as Fluorescent Switches for the Selective Detection of Iodide Ions and Their Mechanistic Study. RSC Adv. 2021, 11, 27645–27652. [Google Scholar] [CrossRef] [PubMed]
- Kumar, M.S.; Yasoda, K.Y.; Das, P.; Malik, S.; Kothurkar, N.K.; Batabyal, S.K. Urea-Mediated Synthesized Carbon Quantum Dots to Tune the Electrochemical Performance of Polyaniline Nanorods for Supercapacitor Device. J. Sci. Adv. Mater. Devices 2022, 7, 100403. [Google Scholar] [CrossRef]
- Qu, F.; Xue, F.; Liu, J.; You, J. Preparation of Carbon Nanodots Capped by Polyethylene Glycol as a Multifunctional Sensor for Temperature and Paracetamol. Anal. Methods 2017, 9, 4533–4538. [Google Scholar] [CrossRef]
- Peng, Z.; Ji, C.; Zhou, Y.; Zhao, T.; Leblanc, R.M. Polyethylene Glycol (PEG) Derived Carbon Dots: Preparation and Applications. Appl. Mater. Today 2020, 20, 100677. [Google Scholar] [CrossRef]
- Sugiarti, S.; Darmawan, N. Synthesis of Fluorescence Carbon Nanoparticles from Ascorbic Acid. Indones. J. Chem. 2015, 15, 141–145. [Google Scholar] [CrossRef] [Green Version]
- Pandit, S.; Behera, P.; Sahoo, J.; De, M. In Situ Synthesis of Amino Acid Functionalized Carbon Dots with Tunable Properties and Their Biological Applications. ACS Appl. Bio Mater. 2019, 2, 3393–3403. [Google Scholar] [CrossRef]
- Lv, X.; Gao, C.; Han, T.; Shi, H.; Guo, W. Improving the Quantum Yields of Fluorophores by Inhibiting Twisted Intramolecular Charge Transfer Using Electron-Withdrawing Group-Functionalized Piperidine Auxochromes. Chem. Commun. 2020, 56, 715–718. [Google Scholar] [CrossRef]
- Omar, N.A.S.; Fen, Y.W.; Irmawati, R.; Hashim, H.S.; Ramdzan, N.S.M.; Fauzi, N.I.M. A Review on Carbon Dots: Synthesis, Characterization and its Application in Optical Sensor for Environmental Monitoring. Nanomaterials 2022, 12, 2365. [Google Scholar] [CrossRef] [PubMed]
- Dimos, K. Carbon Quantum Dots: Surface Passivation and Functionalization. COC 2016, 20, 682–695. [Google Scholar] [CrossRef]
- Shah, H.; Xin, Q.; Jia, X.; Gong, J.R. Single Precursor-Based Luminescent Nitrogen-Doped Carbon Dots and Their Application for Iron (III) Sensing. Arab. J. Chem. 2019, 12, 1083–1091. [Google Scholar] [CrossRef]
- Koç, Ö.K.; Üzer, A.; Apak, R. High Quantum Yield Nitrogen-Doped Carbon Quantum Dot-Based Fluorescent Probes for Selective Sensing of 2,4,6-Trinitrotoluene. ACS Appl. Nano Mater. 2022, 5, 5868–5881. [Google Scholar] [CrossRef]
- Liu, Y.; Jiang, L.; Li, B.; Fan, X.; Wang, W.; Liu, P.; Xu, S.; Luo, X. Nitrogen doped carbon dots: Mechanism investigation and their application for label free CA125 analysis. J. Mater. Chem. B 2019, 7, 3053–3058. [Google Scholar] [CrossRef]
- Chung, J.Y.; Kim, H.-S.; Song, J. Iron Metabolism in Diabetes-Induced Alzheimer’s Disease: A Focus on Insulin Resistance in the Brain. Biometals 2018, 31, 705–714. [Google Scholar] [CrossRef] [Green Version]
- Takeuchi, H.; Kawashima, R. A Prospective Study on the Relationship between Iron Supplement Intake, Hemoglobin Concentration, and Risk of Parkinsonism. Nutrients 2022, 14, 4671. [Google Scholar] [CrossRef]
- Stephenson, D.; Nemkov, T.; Qadri, S.M.; Sheffield, W.P.; D’Alessandro, A. Inductively-Coupled Plasma Mass Spectrometry–Novel Insights from an Old Technology into Stressed Red Blood Cell Physiology. Front. Physiol. 2022, 13, 828087. [Google Scholar] [CrossRef]
- Alam, A.-M.; Park, B.-Y.; Ghouri, Z.K.; Park, M.; Kim, H.-Y. Synthesis of Carbon Quantum Dots from Cabbage with Down- and up-Conversion Photoluminescence Properties: Excellent Imaging Agent for Biomedical Applications. Green Chem. 2015, 17, 3791–3797. [Google Scholar] [CrossRef]
- Bano, D.; Kumar, V.; Singh, V.K.; Hasan, S.H. Green Synthesis of Fluorescent Carbon Quantum Dots for the Detection of Mercury(II) and Glutathione. New J. Chem. 2018, 42, 5814–5821. [Google Scholar] [CrossRef]
- Boyd, M.R.; Paull, K.D. Some Practical Considerations and Applications of the National Cancer Institute In vitro Anticancer Drug Discovery Screen. Drug Dev. Res. 1995, 34, 91–109. [Google Scholar] [CrossRef]
- Mosmann, T. Rapid Colorimetric Assay for Cellular Growth and Survival: Application to Proliferation and Cytotoxicity Assays. J. Immunol. Methods 1983, 65, 55–63. [Google Scholar] [CrossRef] [PubMed]
- Chan, K.K.; Yang, C.; Chien, Y.-H.; Panwar, N.; Yong, K.-T. A Facile Synthesis of Label-Free Carbon Dots with Unique Selectivity-Tunable Characteristics for Ferric Ion Detection and Cellular Imaging Applications. New J. Chem. 2019, 43, 4734–4744. [Google Scholar] [CrossRef]
- Issa, M.A.; Abidin, Z.Z.; Sobri, S.; Rashid, S.A.; Mahdi, M.A.; Ibrahim, N.A. Fluorescent Recognition of Fe3+ in Acidic Environment by Enhanced-Quantum Yield N-Doped Carbon Dots: Optimization of Variables Using Central Composite Design. Sci. Rep. 2020, 10, 11710. [Google Scholar] [CrossRef]
- Lambros, M.; Tran, T.; Fei, Q.; Nicolaou, M. Citric Acid: A Multifunctional Pharmaceutical Excipient. Pharmaceutics 2022, 14, 972. [Google Scholar] [CrossRef]
- Wei, Y.; Chen, L.; Zhao, S.; Liu, X.; Yang, Y.; Du, J.; Li, Q.; Yu, S. Green-Emissive Carbon Quantum Dots with High Fluorescence Quantum Yield: Preparation and Cell Imaging. Front. Mater. Sci. 2021, 15, 253–265. [Google Scholar] [CrossRef]
- Liang, Z.; Zeng, L.; Cao, X.; Wang, Q.; Wang, X.; Sun, R. Sustainable Carbon Quantum Dots from Forestry and Agricultural Biomass with Amplified Photoluminescence by Simple NH4OH Passivation. J. Mater. Chem. C 2014, 2, 9760–9766. [Google Scholar] [CrossRef]
- Li, W.; Wu, S.; Xu, X.; Zhuang, J.; Zhang, H.; Zhang, X.; Hu, C.; Lei, B.; Kaminski, C.F.; Liu, Y. Carbon Dot-Silica Nanoparticle Composites for Ultralong Lifetime Phosphorescence Imaging in Tissue and Cells at Room Temperature. Chem. Mater. 2019, 31, 9887–9894. [Google Scholar] [CrossRef]
- Yahaya Pudza, M.; Zainal Abidin, Z.; Abdul Rashid, S.; Md Yasin, F.; Noor, A.S.M.; Issa, M.A. Eco-Friendly Sustainable Fluorescent Carbon Dots for the Adsorption of Heavy Metal Ions in Aqueous Environment. Nanomaterials 2020, 10, 315. [Google Scholar] [CrossRef] [Green Version]
- Sachdev, A.; Gopinath, P. Green Synthesis of Multifunctional Carbon Dots from Coriander Leaves and Their Potential Application as Antioxidants, Sensors and Bioimaging Agents. Analyst 2015, 140, 4260–4269. [Google Scholar] [CrossRef] [PubMed]
- Kumari, M.; Chaudhary, G.R.; Chaudhary, S.; Umar, A.; Akbar, S.; Baskoutas, S. Bio-Derived Fluorescent Carbon Dots: Synthesis, Properties and Applications. Molecules 2022, 27, 5329. [Google Scholar] [CrossRef]
- Li, F.; Rui, J.; Yan, Z.; Qiu, P.; Tang, X. A Highly Sensitive Dual-Read Assay Using Nitrogen-Doped Carbon Dots for the Quantitation of Uric Acid in Human Serum and Urine Samples. Microchim. Acta 2021, 188, 311. [Google Scholar] [CrossRef]
- Siddique, A.B.; Pramanick, A.K.; Chatterjee, S.; Ray, M. Amorphous Carbon Dots and Their Remarkable Ability to Detect 2,4,6-Trinitrophenol. Sci. Rep. 2018, 8, 9770. [Google Scholar] [CrossRef] [Green Version]
- Qiang, R.; Yang, S.; Hou, K.; Wang, J. Synthesis of Carbon Quantum Dots with Green Luminescence from Potato Starch. New J. Chem. 2019, 43, 10826–10833. [Google Scholar] [CrossRef]
- Guo, F.; Zhu, Z.; Zheng, Z.; Jin, Y.; Di, X.; Xu, Z.; Guan, H. Facile Synthesis of Highly Efficient Fluorescent Carbon Dots for Tetracycline Detection. Environ. Sci. Pollut. Res. 2020, 27, 4520–4527. [Google Scholar] [CrossRef] [PubMed]
- Stachowska, J.D.; Murphy, A.; Mellor, C.; Fernandes, D.; Gibbons, E.N.; Krysmann, M.J.; Kelarakis, A.; Burgaz, E.; Moore, J.; Yeates, S.G. A Rich Gallery of Carbon Dots Based Photoluminescent Suspensions and Powders Derived by Citric Acid/Urea. Sci. Rep. 2021, 11, 10554. [Google Scholar] [CrossRef] [PubMed]
- Javed, N.; O’Carroll, D.M. Long-Term Effects of Impurities on the Particle Size and Optical Emission of Carbon Dots. Nanoscale Adv. 2021, 3, 182–189. [Google Scholar] [CrossRef] [PubMed]
- Javed, N.; O’Carroll, D.M. Carbon Dots and Stability of Their Optical Properties. Part. Part. Syst. Charact. 2021, 38, 2000271. [Google Scholar] [CrossRef]
- Šafranko, S.; Janđel, K.; Kovačević, M.; Dutour Sikirić, M.; Mandić, Š.; Széchenyi, A.; Strelec, I.; Jokić, S. Preparation of Amino Acid Functionalized Carbon Quantum Dots from Citric Acid Efficient Fluorescent Nanoprobe for Selective Detection of Fe3+ Ions in Model Systems and in Well Water Samples (poster presentation). In Proceedings of the 26th International Congress of Chemical and Process Engineering—CHISA 2022—Congress Book, Prague, Czech Republic, 21–25 August 2022. [Google Scholar]
- Zhang, X.; Li, S.; Ma, H.; Wang, H.; Zhang, R.; Zhang, X.-D. Activatable NIR-II Organic Fluorescent Probes for Bioimaging. Theranostics 2022, 12, 3345–3371. [Google Scholar] [CrossRef]
- Yang, G.; Wu, C.; Luo, X.; Gao, Y.; Wu, P.; Cai, C.; Saavedra, S.S. Exploring the Emissive States of Heteroatom-Doped Graphene Quantum Dots. J. Phys. Chem. C 2018, 122, 11–6483. [Google Scholar] [CrossRef]
- Hu, Y.; Neumann, C.; Scholtz, L.; Turchanin, A.; Resch-Genger, U.; Eigler, S. Polarity, Intramolecular Charge Transfer, and Hydrogen Bond Co-Mediated Solvent Effects on the Optical Properties of Graphene Quantum Dots. Nano Res. 2023, 16, 45–52. [Google Scholar] [CrossRef]
- Liu, H.; Yang, J.; Li, Z.; Xiao, L.; Aryee, A.A.; Sun, Y.; Yang, R.; Meng, H.; Qu, L.; Lin, Y.; et al. Hydrogen-Bond-Induced Emission of Carbon Dots for Wash-Free Nucleus Imaging. Anal. Chem. 2019, 91, 9259–9265. [Google Scholar] [CrossRef]
- Wang, M.; Wan, Y.; Zhang, K.; Fu, Q.; Wang, L.; Zeng, J.; Xia, Z.; Gao, D. Green Synthesis of Carbon Dots Using the Flowers of Osmanthus Fragrans (Thunb.) Lour. as Precursors: Application in Fe3+ and Ascorbic Acid Determination and Cell Imaging. Anal. Bioanal. Chem. 2019, 411, 2715–2727. [Google Scholar] [CrossRef] [PubMed]
- Das, G.S.; Shim, J.P.; Bhatnagar, A.; Tripathi, K.M.; Kim, T. Biomass-Derived Carbon Quantum Dots for Visible-Light-Induced Photocatalysis and Label-Free Detection of Fe(III) and Ascorbic Acid. Sci. Rep. 2019, 9, 15084. [Google Scholar] [CrossRef] [PubMed] [Green Version]
- Zhu, J.; Chu, H.; Wang, T.; Wang, C.; Wei, Y. Fluorescent Probe Based Nitrogen Doped Carbon Quantum Dots with Solid-State Fluorescence for the Detection of Hg2+ and Fe3+ in Aqueous Solution. Microchem. J. 2020, 158, 105142. [Google Scholar] [CrossRef]
- Pu, Z.-F.; Wen, Q.-L.; Yang, Y.-J.; Cui, X.-M.; Ling, J.; Liu, P.; Cao, Q.-E. Fluorescent Carbon Quantum Dots Synthesized Using Phenylalanine and Citric Acid for Selective Detection of Fe3+ Ions. Spectrochim. Acta A Mol. Biomol. Spectrosc. 2020, 229, 117944. [Google Scholar] [CrossRef]
- Xiang, Z.; Jiang, Y.; Cui, C.; Luo, Y.; Peng, Z. Sensitive, Selective and Reliable Detection of Fe3+ in Lake Water via Carbon Dots-Based Fluorescence Assay. Molecules 2022, 27, 6749. [Google Scholar] [CrossRef]
- Bao, W.; Lan, Y.; Lu, H.; Li, G.; Yu, M.; Yang, J.; Wei, L.; Su, Q. A Dual-Function Carbon Quantum Dot Fluorescent Probe for the Detection of Fe 3+ and Sunset Yellow. ChemistrySelect 2022, 7, e202202375. [Google Scholar] [CrossRef]
- Zhang, Y.; Qin, H.; Huang, Y.; Zhang, F.; Liu, H.; Liu, H.; Wang, Z.J.; Li, R. Highly Fluorescent Nitrogen and Boron Doped Carbon Quantum Dots for Selective and Sensitive Detection of Fe3+. J. Mater. Chem. B 2021, 9, 4654–4662. [Google Scholar] [CrossRef]
- Yang, Z.; Xu, T.; Zhang, S.; Li, H.; Ji, Y.; Jia, X.; Li, J. Multifunctional N,S-Doped and Methionine Functionalized Carbon Dots for on-off-on Fe3+ and Ascorbic Acid Sensing, Cell Imaging, and Fluorescent Ink Applying. Nano Res. 2022. [Google Scholar] [CrossRef]


| CQD Sample | N-Dopants | QY/% | λEX/nm | λmaxEM/nm | ζ-Potential/mV | |
|---|---|---|---|---|---|---|
| pH = 3 | pH = 7 | |||||
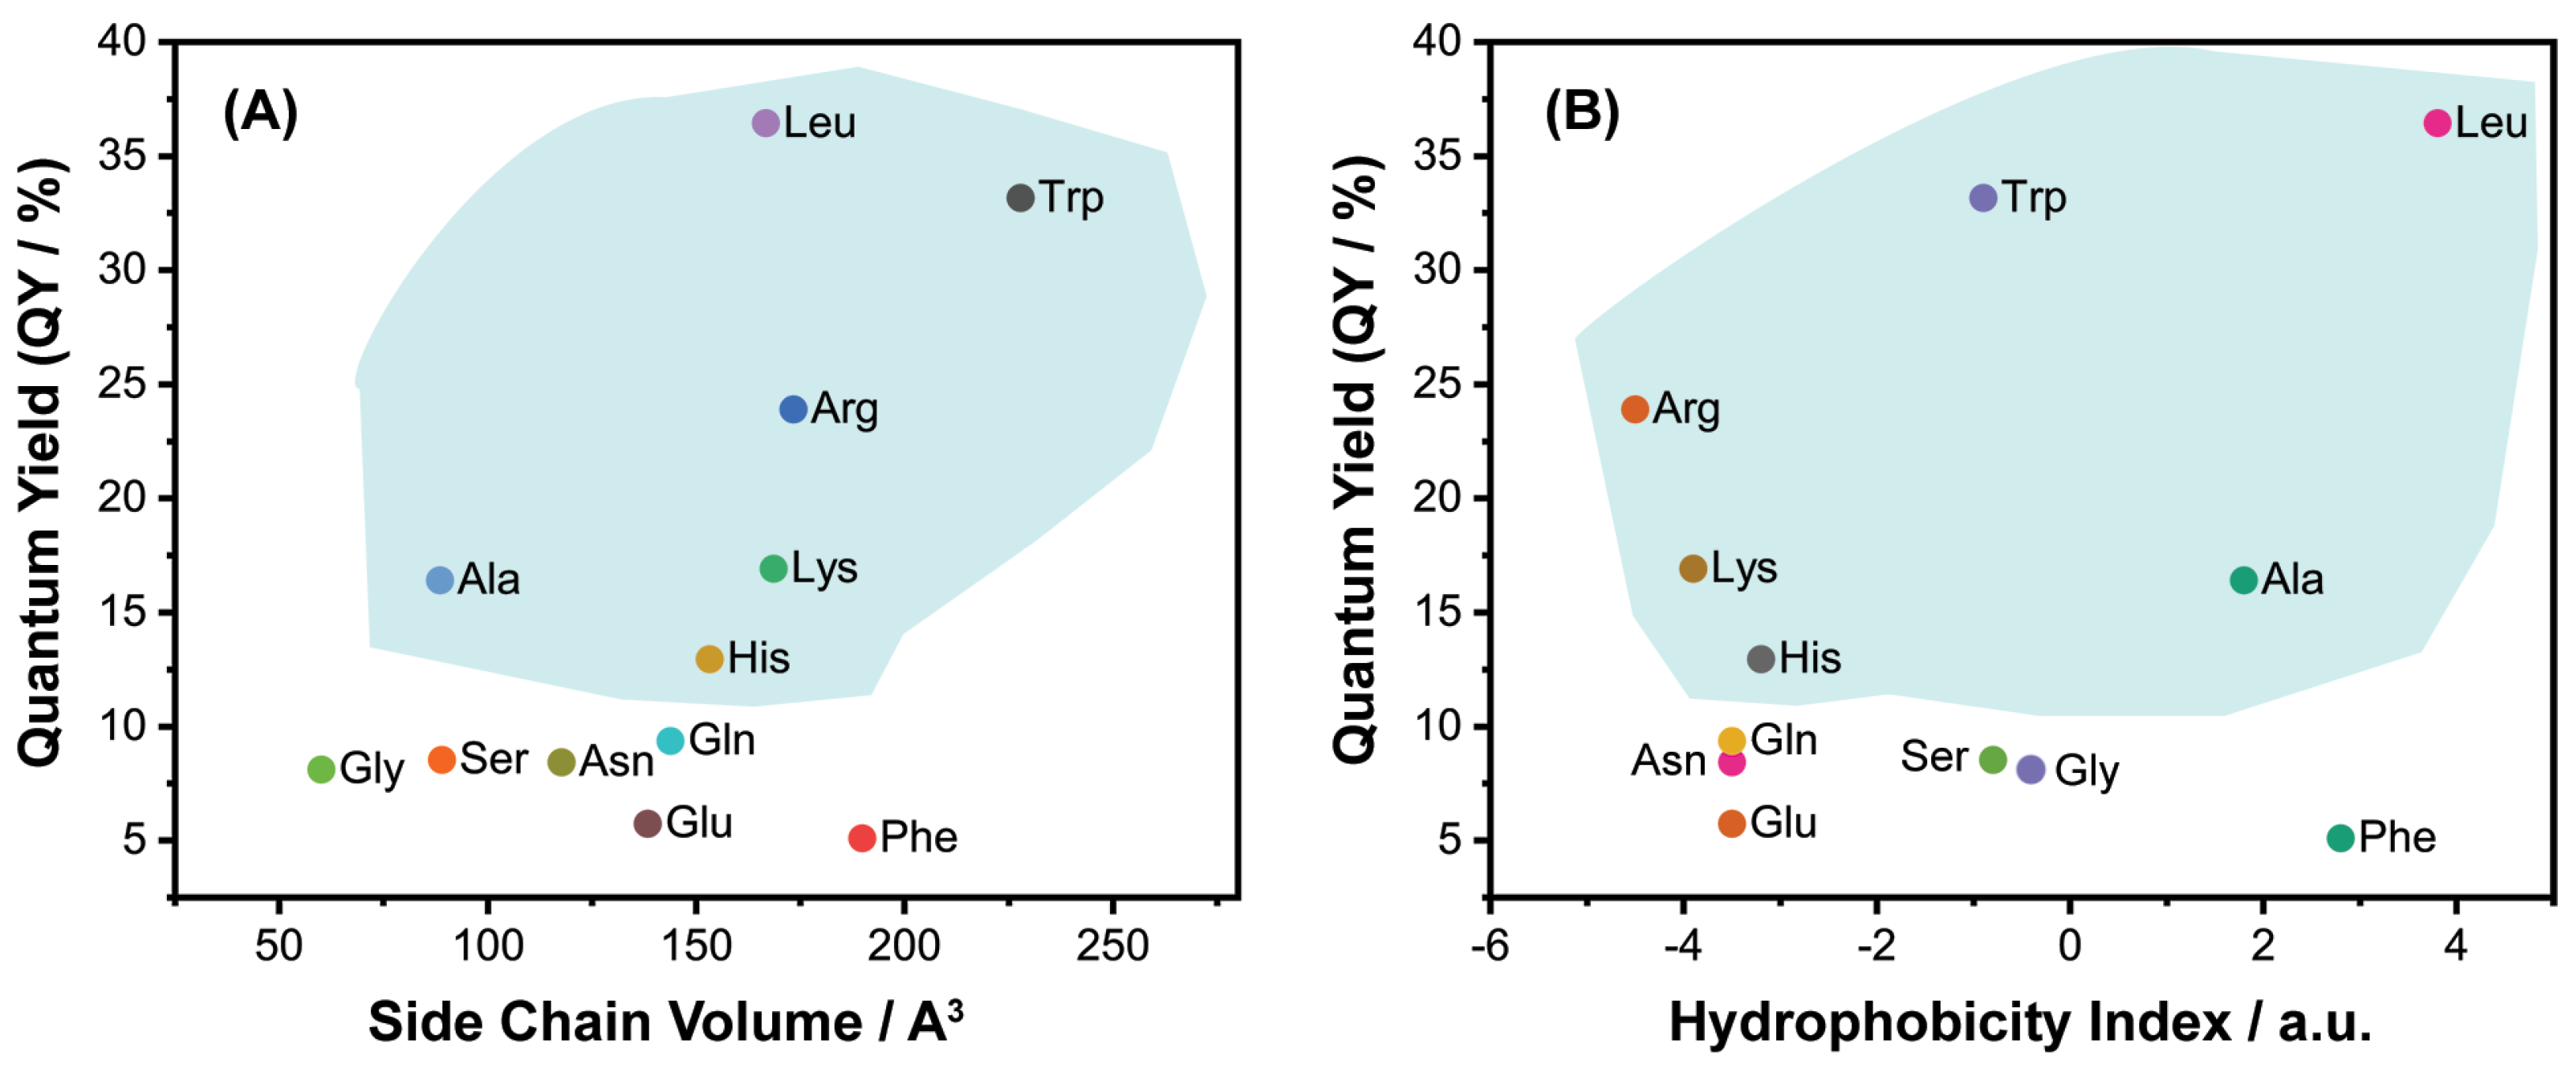
| CQD@Leu | Leu | 36.43 ± 1.42 | 340 | 406 | −5.25 ± 1.12 | −47.7 ± 3.2 |
| CQD@Trp | Trp | 33.17 ± 0.85 | 365 | 423 | −0.91 ± 2.68 | −24.2 ± 2.3 |
| CQD@Arg | Arg | 23.92 ± 2.11 | 335 | 415 | −12.70 ± 0.85 | −14.7 ± 1.7 |
| CQD@Lys | Lys | 16.94 ± 1.94 | 335 | 401 | −13.87 ± 1.38 | −16.87 ± 2.61 |
| CQD@Ala | Ala | 16.42 ± 0.77 | 340 | 408 | −5.37 ± 0.21 | −15.8 ± 1.3 |
| CQD@His | His | 12.97 ± 2.74 | 340 | 398 | −7.86 ± 0.94 | −26.9 ± 2 |
| CQD@Gln | Gln | 9.37 ± 1.71 | 340 | 405 | −9.85 ± 1.01 | −9.29 ± 0.71 |
| CQD@Ser | Ser | 8.54 ± 1.96 | 340 | 415 | −5.43 ± 0.34 | −14.18 ± 0.85 |
| CQD@Asn | Asn | 8.44 ± 2.39 | 340 | 405 | 5.73 ± 0.25 | −10.25 ± 1.12 |
| CQD@Gly | Gly | 8.13 ± 3.07 | 343 | 411 | −9.26 ± 0.26 | −13.5 ± 1.43 |
| CQD@Glu | Glu | 5.75 ± 1.72 | 335 | 406 | −7.08 ± 0.26 | −37.47 ± 2.18 |
| CQD@Phe | Phe | 5.11 ± 2.44 | 340 | 411 | 4.17 ± 0.99 | −18.92 ± 2.29 |
| CQD@Blank | - | 2.02 ± 1.08 | 320 | 405 | 2.18 ± 1.13 | −36 ± 3.4 |
| Mass Weight/% | Atomic Weight/% | |||||
|---|---|---|---|---|---|---|
| CQDs Sample | C/% | O/% | N/% | C/% | O/% | N/% |
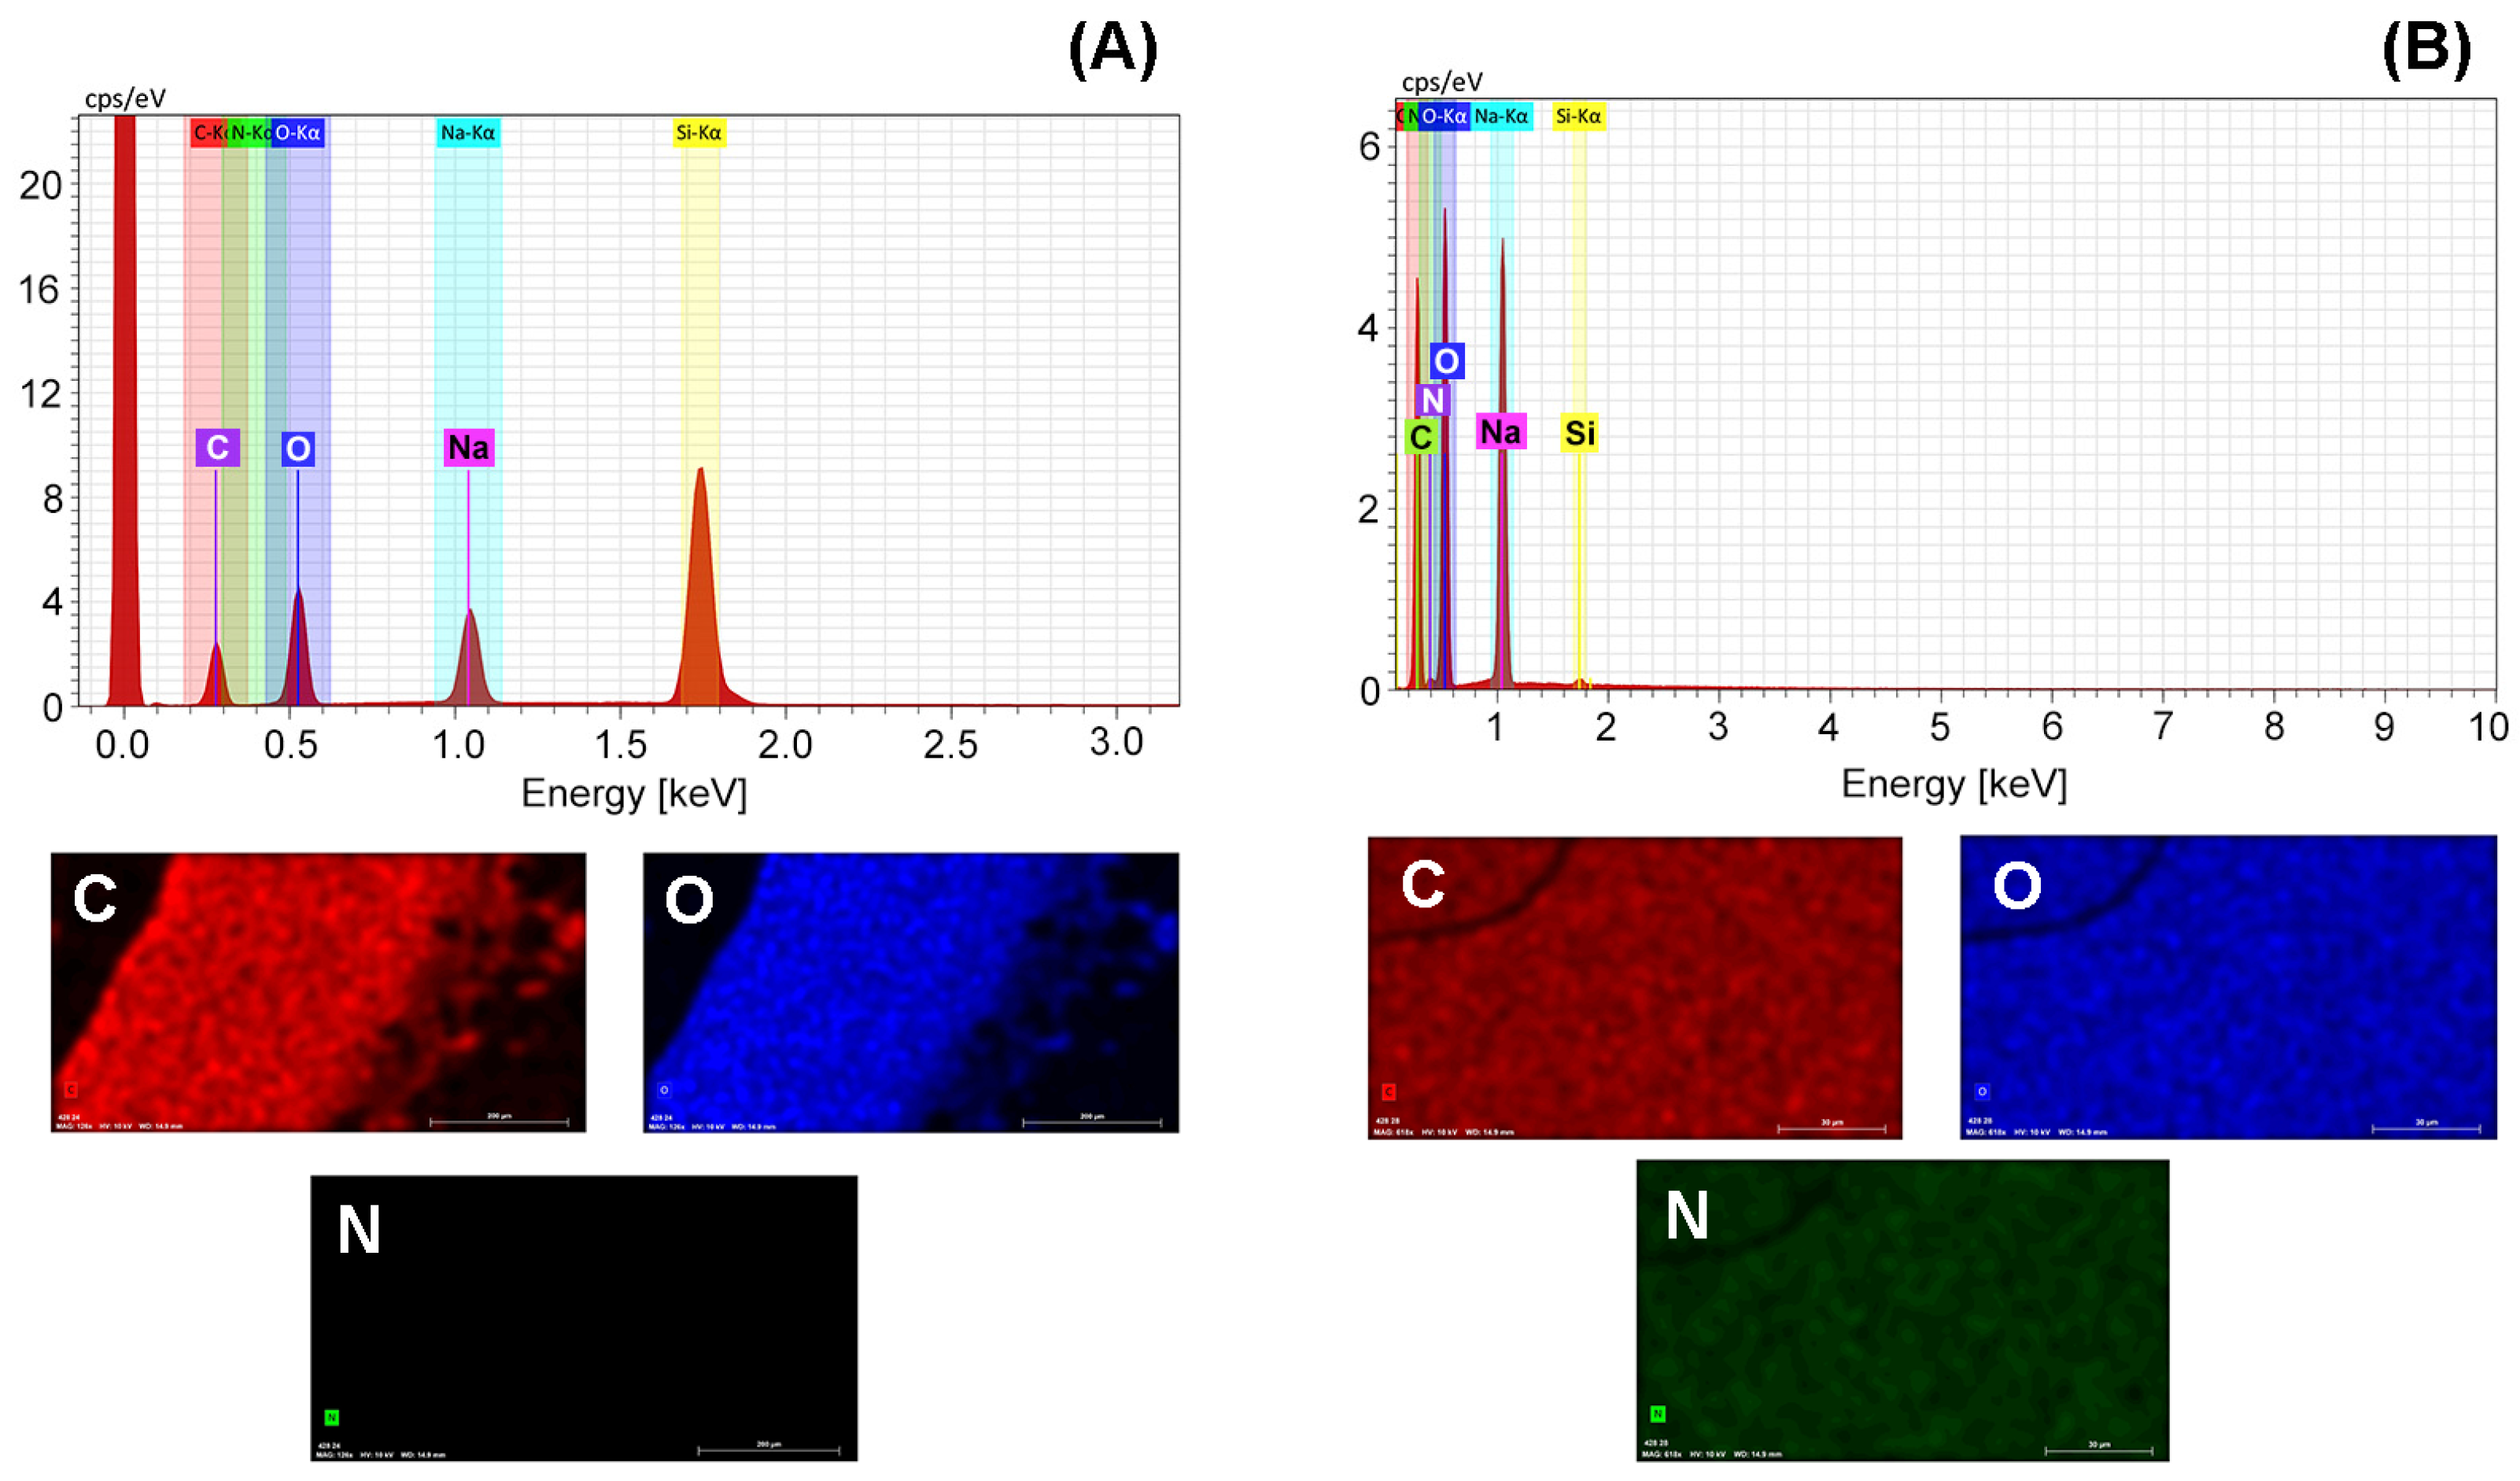
| CQD@Blank | 28.31 | 50.05 | - | 46.55 | 35.07 | - |
| CQD@Leu | 40.48 | 46.44 | 1.60 | 45.11 | 38.85 | 1.53 |
| CQD@Trp | 34.31 | 42.60 | 3.23 | 43.19 | 40.26 | 3.49 |
| CQD@Arg | 37.83 | 46.14 | 5.69 | 42.18 | 38.62 | 5.44 |
| CQD@Lys | 24.01 | 30.14 | 2.04 | 42.42 | 39.98 | 3.09 |
| CQD@Ala | 37.22 | 49.52 | 3.33 | 41.18 | 41.14 | 3.16 |
| CQD@His | 39.82 | 42.63 | 6.21 | 45.50 | 36.57 | 6.09 |
| CQDs Sample | Before Purification | After Purification |
|---|---|---|
| Mean Values of Dispersibility/% | ||
| CQD@Blank | 100.05 ± 0.50 | 99.72 ± 0.49 |
| CQD@Leu | 99.00 ± 1.26 | 99.54 ± 1.33 |
| CQD@Trp | 98.46 ± 0.66 | 99.67 ± 1.49 |
| CQD@Arg | 99.56 ± 0.43 | 99.68 ± 0.55 |
| CQD@Lys | 99.74 ± 0.75 | 99.88 ± 0.44 |
| CQD@Ala | 100.04 ± 0.64 | 100.27 ± 0.76 |
| CQD@His | 98.92 ± 0.55 | 99.80 ± 1.04 |
| Well Water Sample | γ(Fe3+) Determined by Standard Method/µg/L | γexperimental (Fe3+) Determined with CQDs Method/µg/L | Recovery 1/% | RSD/% | ||
|---|---|---|---|---|---|---|
| 1 | 2 | Mean Value of Fe3+ Ions in Sample | ||||
| 16 | 1338.00 | 1449.24 | 1391.08 | 1420.16 ± 41.12 | 106.14 | 2.89 |
| 17 | 2036.00 | 1965.73 | 1989.54 | 1977.63 ± 16.84 | 97.13 | 0.85 |
| 18 | 4960.00 | 5121.45 | 5048.87 | 5085.15 ± 51.31 | 102.52 | 1.01 |
| Precursors | Linear Range/μM | LOD/μM | Application | References |
|---|---|---|---|---|
| Citric acid/Phe | 5−500 | 0.73 | Detection of Fe3+ ions in model and real water systems | [88] |
| Citric acid/ethylenediamine | 0–250, 250–1200 | 1.68 | Detection of Fe3+ ions in model and real water systems | [89] |
| Citirc acid/Phe | 0–50 | 3.5 | Detection of Fe3+ ions in model systems | [37] |
| Citric acid/o-phenylendiamine | 20−200 | 1.52 | Detection of Fe3+ ions in model and real water systems | [90] |
| Citric acid, boric acid and ethylenediamine | 2−160 | 0.08 | Detection of Fe3+ ions in model and real water systems | [91] |
| Citric acid, polyvinylpyrrolidone, and methionine | 1−800 | 0.00026 | Detection of Fe3+ ions and ascorbic acid | [92] |
| Citric acid/amino acids (CQD@Leu) | 0.3−30 | 1.77 | Detection of Fe3+ ions in model and real water systems | This work |
Disclaimer/Publisher’s Note: The statements, opinions and data contained in all publications are solely those of the individual author(s) and contributor(s) and not of MDPI and/or the editor(s). MDPI and/or the editor(s) disclaim responsibility for any injury to people or property resulting from any ideas, methods, instructions or products referred to in the content. |
© 2023 by the authors. Licensee MDPI, Basel, Switzerland. This article is an open access article distributed under the terms and conditions of the Creative Commons Attribution (CC BY) license (https://creativecommons.org/licenses/by/4.0/).
Share and Cite
Šafranko, S.; Janđel, K.; Kovačević, M.; Stanković, A.; Dutour Sikirić, M.; Mandić, Š.; Széchenyi, A.; Glavaš Obrovac, L.; Leventić, M.; Strelec, I.; et al. A Facile Synthetic Approach toward Obtaining N-Doped Carbon Quantum Dots from Citric Acid and Amino Acids, and Their Application in Selective Detection of Fe(III) Ions. Chemosensors 2023, 11, 205. https://doi.org/10.3390/chemosensors11040205
Šafranko S, Janđel K, Kovačević M, Stanković A, Dutour Sikirić M, Mandić Š, Széchenyi A, Glavaš Obrovac L, Leventić M, Strelec I, et al. A Facile Synthetic Approach toward Obtaining N-Doped Carbon Quantum Dots from Citric Acid and Amino Acids, and Their Application in Selective Detection of Fe(III) Ions. Chemosensors. 2023; 11(4):205. https://doi.org/10.3390/chemosensors11040205
Chicago/Turabian StyleŠafranko, Silvija, Kristina Janđel, Monika Kovačević, Anamarija Stanković, Maja Dutour Sikirić, Šimun Mandić, Aleksandar Széchenyi, Ljubica Glavaš Obrovac, Marijana Leventić, Ivica Strelec, and et al. 2023. "A Facile Synthetic Approach toward Obtaining N-Doped Carbon Quantum Dots from Citric Acid and Amino Acids, and Their Application in Selective Detection of Fe(III) Ions" Chemosensors 11, no. 4: 205. https://doi.org/10.3390/chemosensors11040205