Article

Detection of Low-Level Adulteration of Hungarian Honey Using near Infrared Spectroscopy

by
Zsanett Bodor
1,
Mariem Majadi
2,
Csilla Benedek
1,*,
John-Lewis Zinia Zaukuu
3,
Márta Veresné Bálint
1,
Éva Csajbókné Csobod
1 and
Zoltan Kovacs
2
1
Department of Dietetics and Nutrition, Faculty of Health Sciences, Semmelweis University, 17 Vas Street, H-1088 Budapest, Hungary
2
Department of Measurements and Process Control, Institute of Food Science and Technology, Hungarian University of Agriculture and Life Sciences, 14–16 Somlói Street, H-1118 Budapest, Hungary
3
Department of Food Science and Technology, Kwame Nkrumah University of Science and Technology (KNUST), Kumasi AK-039-5028, Ghana
*
Author to whom correspondence should be addressed.
Chemosensors 2023, 11(2), 89; https://doi.org/10.3390/chemosensors11020089
Submission received: 30 November 2022 / Revised: 28 December 2022 / Accepted: 20 January 2023 / Published: 24 January 2023

Abstract

:
Honey adulteration is a worldwide problem; however, its detection is a challenge for researchers and authorities. There are numerous ways of honey counterfeiting; amongst them, direct adulteration is one of the most common methods. Correlative techniques, such as near-infrared spectroscopy (NIRS), are useful tools in the detection of honey adulteration; however, this method has not been applied to Hungarian honeys. The aim of this research was to investigate the performance of NIRS for the detection of sugar syrup addition to Hungarian honeys at lower concentration levels (<10% w/w). Acacia, rape, forest, sunflower, and linden honeys were mixed with high-fructose-content sugar syrup, rice syrup, or self-made glucose fructose syrup in 3%, 5%, and 10% w/w. NIRS analysis was performed in the spectral range of 950–1650 nm. Principal component analysis was coupled with linear discriminant analysis and partial least square regression models were built for the classification and prediction of adulteration levels, respectively. Our results showed that the performance of NIRS highly depends on both type of syrup and honey. PCA-LDA models provided the 100% correct classification of control in the case of all the models, while PLSR results could predict the added sugar syrup content in the case of rice and F40 syrup models, obtaining >2.2 RPDCV value.

1. Introduction

Honey is a well-known nutritious food, mostly used as a sweetener and nutraceutical product. It is a supersaturated solution of sugars in water matrix. Fructose, glucose, monosaccharides, disaccharides, and other sugars make up more than 80% of the total weight of honey [1,2,3]. In addition to sugars, water is the other principal compound; according to legislation, its amount should generally not exceed 20% (with some exceptions) [4,5,6]. Honey has a high value for consumers and on the market, owing to its high nutritional value and health benefits [7].
Recently, the increasing market value and price of some foods have accelerated the problem of food adulteration. Amongst these foods, honey is considered to be one of the most frequently counterfeited foods [8]. Honey fraud has many aspects, such as mislabeling of botanical or geographical origin, direct adulteration with sugar syrups, indirect adulteration by feeding bees with sugar in the collection period, and resin filtration [9,10]. During direct adulteration, different types of sugar syrups are used, such as corn, rice, invert sugar, glucose, beet, and other syrups. The exact methods and protocols used for the detection of this honey fraud are challenging; meanwhile, accuracy highly depends on the type of syrups and method. Lately, different analytical techniques have been tested and found to be useful in honey authentication; however, there is still demand for a reliable and accurate method [9,10]. Recently, the use of correlative techniques, such as near-infrared spectroscopy (NIRS) has increased in the field of food products, including honey adulteration detection [11,12]. NIRS coupled with chemometric analysis methods, such as principal component analysis (PCA), PCA-coupled linear discriminant analysis (PCA-LDA), artificial neural network (ANN) or partial least square regression (PLSR) have been used in studies outside of Hungary for the detection and quantification of honey adulteration. Chinese researchers analyzed mixtures of pure acacia, vitex, and jujube honey with rice and corn syrup at 5%, 10%, 20%, and 40% w/w. In this study the NIRS provided 100% correct classification of all the samples and levels [13]. Bázár et al. [14], studied the effect of high-fructose-content corn syrup addition, and found that the structure of water in honey sample changes as a result of adulteration. In another Chinese study, the NIRS was found to be effective in the detection of adulterants in honey; the average correct classification was 85.71% [15]. Spanish researchers could also predict the level of syrup addition in honey with high accuracy using PLSR (R2 > 0.9) using NIRS in the range of 5–40% w/w adulteration [16]. These results show that the NIRS is a promising technology in the detection of honey adulteration. Moreover, it is non-destructive and does not require any reagents; therefore, it can be considered a sustainable green technology [13,17,18,19,20,21]. In Hungary, the application of NIRS for the detection and quantification of honey adulteration has not been studied deeply. On the other hand, studies around the world focusing on the detection and quantification of honey adulteration have generally used higher syrup concentration levels (≥5% w/w). Based on these findings, it can be concluded that there is a lack of research in adulteration detection of specific Hungarian honey types, especially below the 5% w/w adulteration level.
Therefore, in this study, our aim was to analyze the applicability of NIRS for the detection (PCA-LDA) and quantification (PLSR) of glucose–fructose, high-fructose-content corn syrup, and rice syrup addition to acacia, forest, sunflower, rape, and linden honeys from Hungary. A further aim was to apply concentration levels of 3%, 5%, and 10% that had not been studied in depth in Hungary prior to this research.

2. Materials and Methods

The whole experimental setup was performed in two sets, including a preliminary set (PS), and an extended set (ES).

2.1. Samples and Sample Preparation

In the preliminary set acacia (RP—Robinia pseudoacacia) and linden (TI—Tilia spp.) honey were mixed with F40 high-fructose-content corn syrup, (HFCS—Kall Ingredients, Tiszapüspöki, Hungary) and rice syrup (RI—dm; drogerie markt GmbH & Co. KG, Karlsruhe, Germany) in 3%, 5%, and 10%. Prior to the current study, the concentration range of 0% ,5%, 50% was studied and—based on those results—the levels below 10% were chosen [22]. The concentrations were chosen based on the results of Bodor et al. (2019), where the levels below 10% were most challenging ones to detect. Moreover, based on the available studies, adulterations below 5% w/w were not typically applied [13,14,15,16], as this was mentioned in the introduction.
The extended study set was completed with rape (BN—Brassica napus), sunflower (HA—Helianthus annuus), and forest (HD) honeys. The authentic samples were mixed with the same rice and HFCS syrups and, additionally, with a self-made glucose–fructose syrup (GS). The GS syrup was prepared as follows: using an analytical balance, 240 g of fructose and 160 g of glucose were weighed and transferred into a volumetric flask of 500 mL. The flask was filled up to volume with distilled water, before putting it in a water bath at 60 °C to ensure and force the solvation of the sugars. The solution was then cooled down to room temperature prior to further steps.
In the case of both sets, a total of 20 g of the sample were prepared to provide three replicates (R1, R2, R3), resulting in a total of 141 samples, including three replicates of the controls and the sugar syrups. The coding of the samples was generated with the concatenation of the type of honey (RP, TI, BN, HA, and HD), the syrup added (RI, F40, GF), and the level of syrup (3%, 5%, and 10%).

2.2. Determination of the Main Physical Properties

The determination of the main physical parameters, such as moisture, pH, and electrical conductivity was performed according to the guidebook of the International Honey Commission [23]. Moisture content was determined using Abbé-type refractometer, pH and electrical conductivity were measured with a Mettler Toledo SevenMulti analyzer with the respective probes (Mettler Toledo, Columbus, OH, USA). Moisture content readings were performed in two replicates, the pH and electrical conductivity in three–three replicates per sample.

2.3. Near-Infrared Spectroscopy Measurements

Near-infrared spectra (NIRS) were recorded using the benchtop MetriNIR spectrophotometer (MetriNIR Research, Development and Service Co., Budapest, Hungary) in the spectral range of 740–1700 with 2 nm spectral resolution. The instrument is equipped with an InGaAs two-beam detector. The spectral recording was performed using a transflectance setup with a temperature-controlled cuvette at 25 °C. The layer thickness of the sample was 0.5 mm in the cuvette. All the samples were measured in randomized order. In the preliminary set five and in the extended set three consecutive scans were recorded per sample. This resulted in 15 and 9 spectra for the preliminary and the extended sample set, respectively, in the case of all adulteration levels.

2.4. Statistical Evaluation

2.4.1. Evaluation of the Physical Parameters

Statistical evaluation of the quality indicators was performed with descriptive statistics: mean and standard deviation of the different adulteration levels were calculated separately for the different honey types. One-way analysis of variance (ANOVA) was performed to check the significant differences among the different adulteration levels and control. The evaluation was performed separately for the different honey types. Prior to the analysis, the assumptions of ANOVA were tested such as the normality (Shapiro–Wilk test) and the homogeneity of the variances (Levene’s test). As in most of the cases the homogeneity of the variances did not assume, the pairwise comparison was tested using the Games–Howell test, which is not sensitive to inhomogeneity [24].

2.4.2. Spectral Preprocessing

Evaluation of the NIR spectra was performed in the spectral range of 950–1650 nm. The pretreatment of the spectra was optimized using different pretreatments and their combinations. Single, double, or triple combination of
  • Savitzky–Golay smoothing (different window sizes 13, 17, 21, and/or derivation levels—0, 1st, 2nd);
  • Multiplicative scatter correction (MSC);
  • Standard normal variate (SNV) or;
  • Detrending (detr).
The list and abbreviation of the pretreatments can be found in Supplementary Table S1. In total 41 pretreatment combinations were tested during the model optimization of the following methods.
For the spectral presentation, the averaged spectra of the different sample groups were chosen, where the spectra of one sample was averaged (coming from the 9 or 15 consecutives). In the case of the preprocessed spectra, the averaging was performed after the pretreatment.

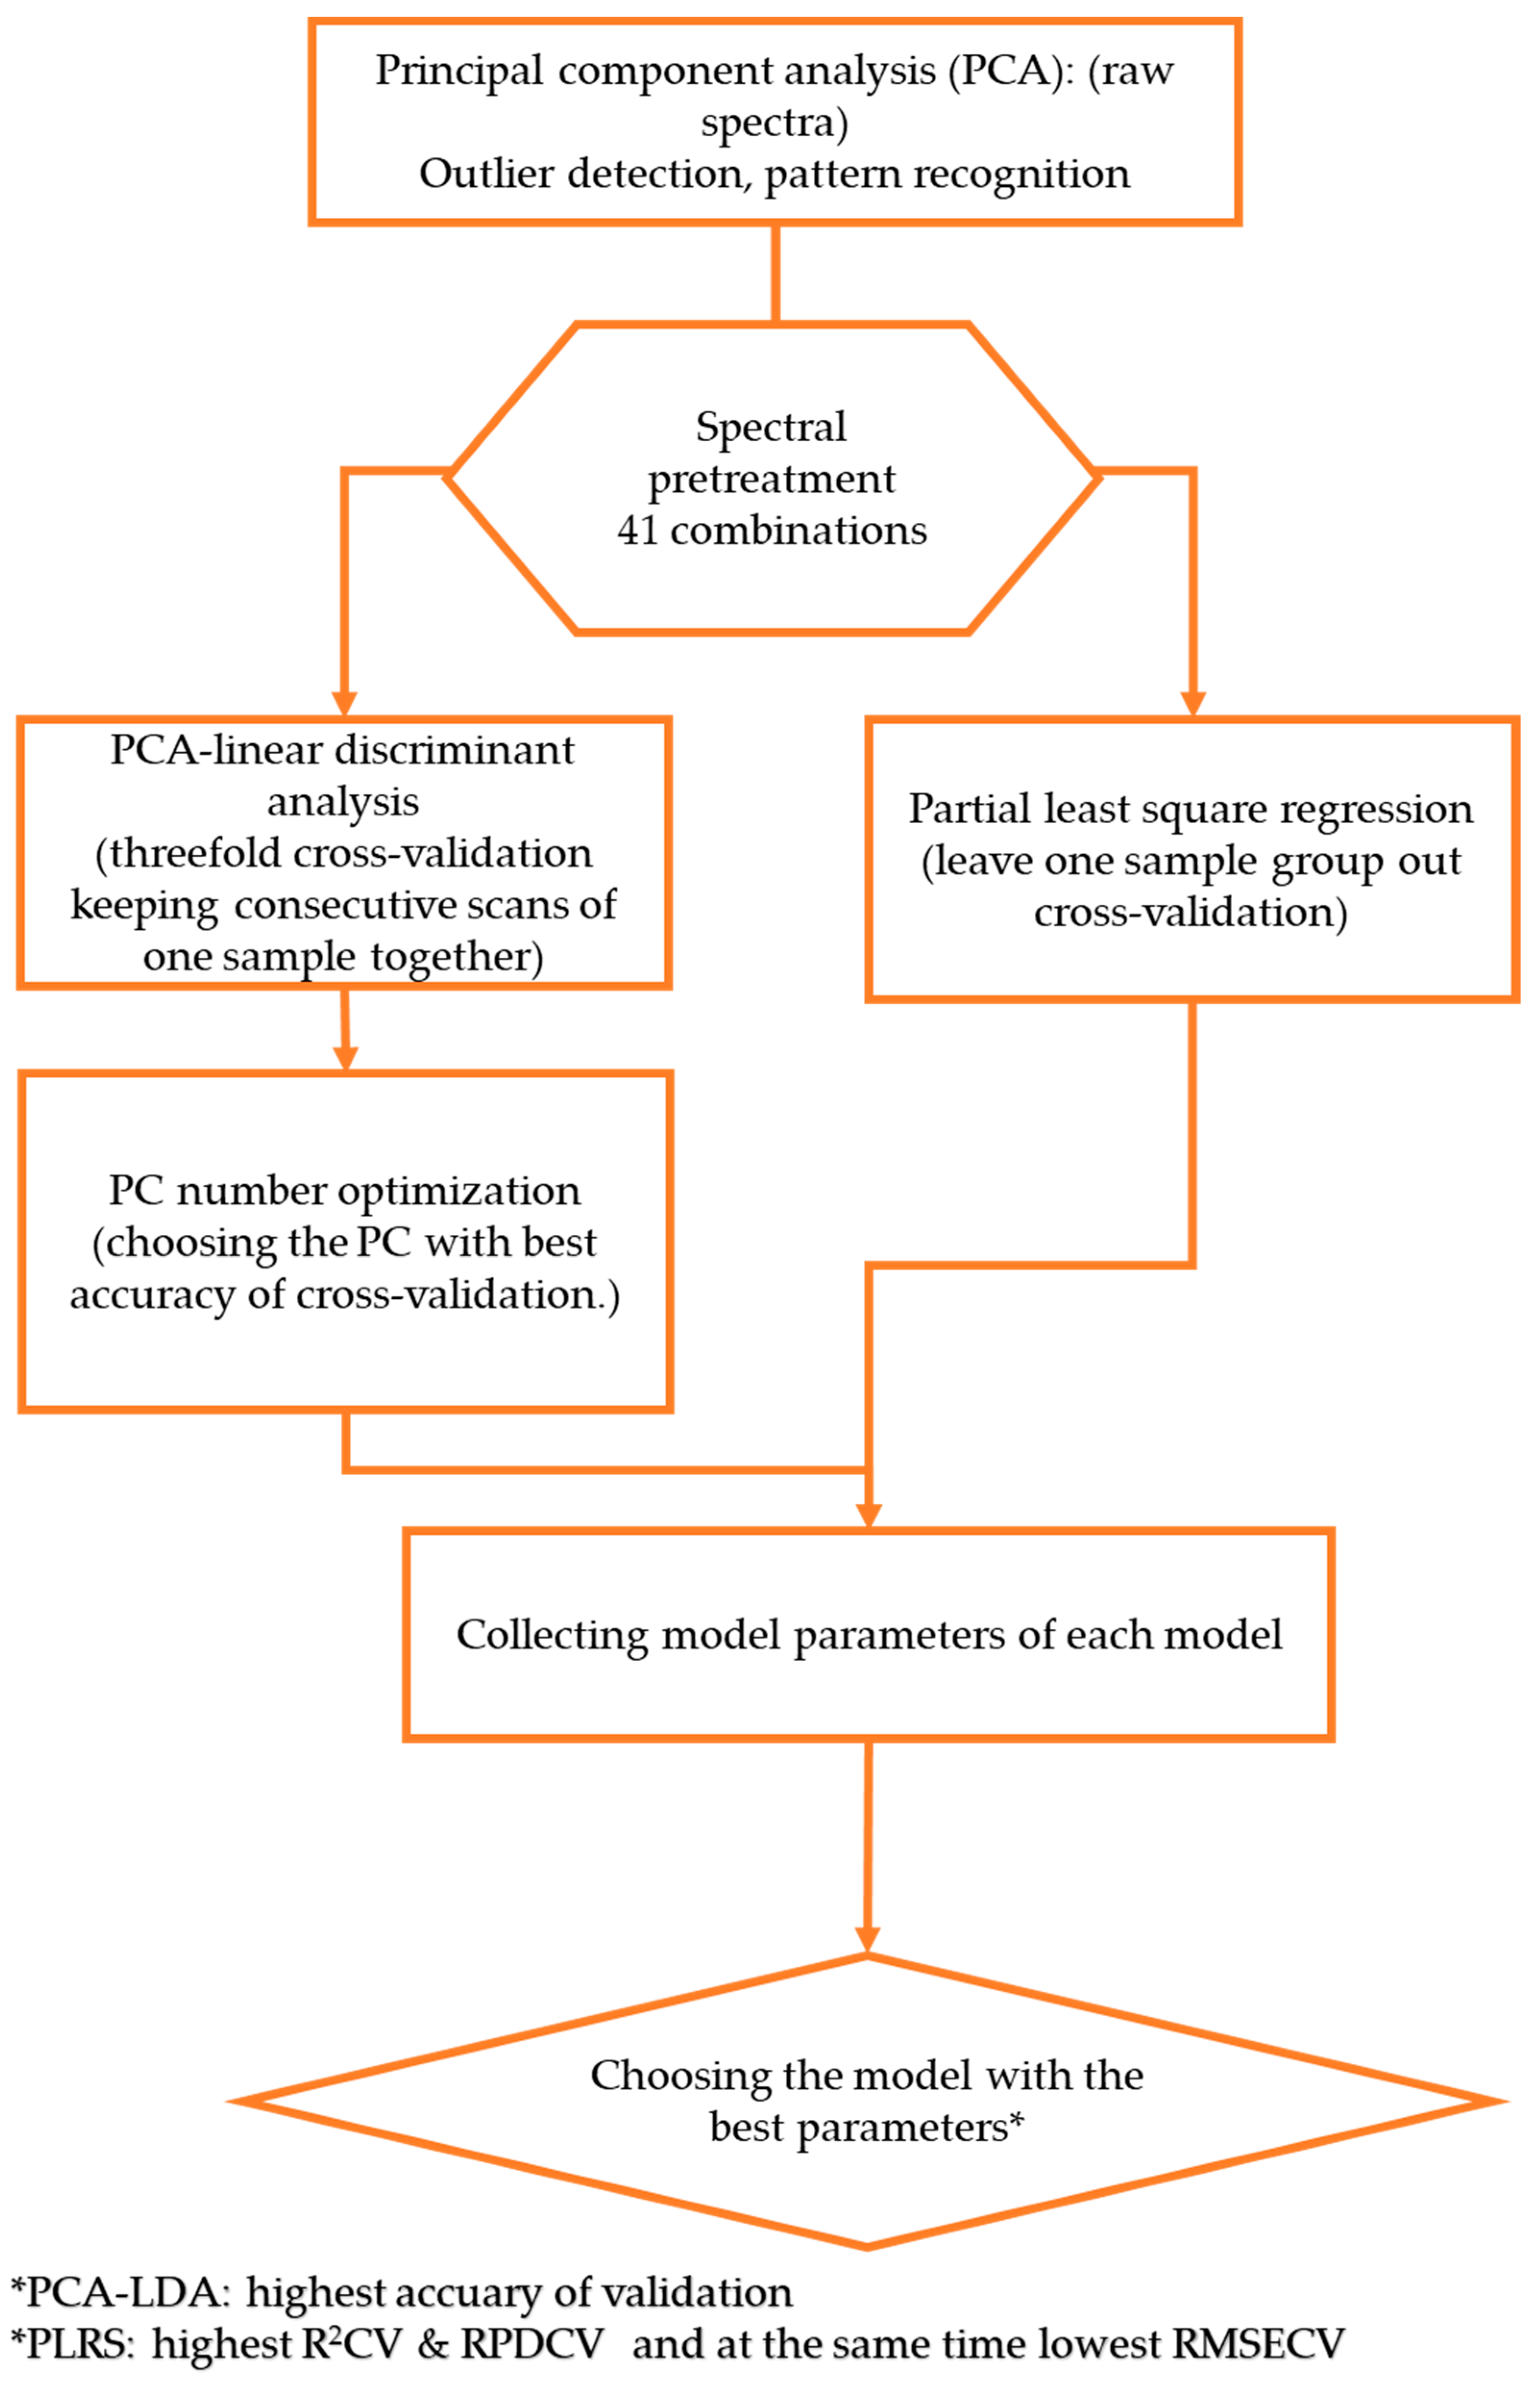
2.4.3. Chemometric Analysis of the near-Infrared Spectra

During the chemometric analysis—in the case of all the models—consecutive spectra of different samples were used (without averaging).
As a first step, principal component analysis (PCA) was used for pattern recognition and extreme outlier detection of the spectral data. The flow of the chemometric analysis can be found in Figure 1.
Classification models were built using PCA-coupled linear discriminant analysis (PCA-LDA). The models were built for the different honey types separately. In the case of each honey type, models were constructed for the classification of different adulteration levels. Two types of models were built:
(1)
including the results of all the syrups (all syrup models, one model per honey type)
(2)
and separately, including only data of one syrup mixture set and control (resulting in two models in the case of linden and acacia, and three models in the case of rape, sunflower, and forest honeys).
During the analysis, threefold cross-validation was applied. Each model was built using all the pretreatments. After the pretreatment, the PCA-LDA model was built using principal component (PC) number optimization. The model with the highest cross-validation accuracy after choosing the optimal pretreatment was chosen for data interpretation. During the analysis, the correct classification of control after training and validation, and the average correct classification of all the groups for training and validation were computed.
Partial least square regression models (PLRS) were built for the prediction of the added syrup concentration. Models were also computed using the data of different honey types separately. Predictions were performed on the total data set of one honey type (all syrup models, one model per honey type) and separately for the different sugar syrups (resulting in two models in the case of linden and acacia, and three models in the case of rape, sunflower, and forest honeys). During the model construction leave-one-group-out validation was used where one replicate of one sample was left out for validation in each iteration. During the evaluation, the following model parameters were calculated:
  • Determination coefficient of training (R2C) and validation (R2CV)—the higher the value, the better the model;
  • Root mean square error of training and RMSEC validation (RMSECV)—the lower the value, the better the model;
  • Residual prediction deviation training (RPDC) and validation (RPDCV).
The benefit of RPD is that it considers the variation of the dataset at the same time with the prediction error. Therefore, RPD provides more detailed information about the reliability, robustness, and validity of the model [25]. The higher the RPD value, the better the model. Based on the work of Muncan et al. [26,27], we considered PLSR satisfactory if the RPD values were above 1.5 [28].
Statistical evaluation was performed using Microsoft Office Excel and R-project software with the package Aquap2 designed for NIRS analysis [29].

3. Results and Discussion

3.1. Results of the Physical Analysis

The moisture contents of the three syrups were the following, in decreasing order: F40 syrup: 21.88 ± 0.44%, GF syrup: 18.4 ± 0.54%, and RI syrup: 17.53 ± 0.66%. In the case of all the honey types, an increasing tendency in moisture content was observed with the increase in the amount of the added syrup. The exception was the forest honey mixed with the RI syrup where a slight, but not significant decrease was observed compared to the control (17.30%) Table 1). However, it can be seen that at these levels the moisture content did not increase above 20%, which is the legislation limit [4,5]. Moreover, the increase of moisture content of acacia, forest, and linden honeys was not significant compared to the authentic honeys. In the case of rape honey, only the honey mixed with the F40 syrup in 10% showed a significant increase, while in the case of sunflower honey, almost all the mixed honeys had significantly higher moisture contents.
The pH of sugar syrups was similar to the pH of honey samples in general. The F40 syrup had a pH of 4.02 ± 0.12 and the RI syrup had pH of 4.48 ± 0.37. Higher pH was observed in the case of the GF syrup (5.33 ± 0.19). Despite this, the pH of the different honey samples did not increase significantly in most of the cases (Table 1).
On the contrary, the electrical conductivity results showed a significant decrease in most of the cases due to the fact that the electrical conductivity of the sugar syrups was very low: F40 18.72 ± 1.42 μS/cm, GF 3.42 ± 0.55 μS/cm, and RI 10.73 ± 1.33 μS/cm. It can be observed that the highest decrease occurred at the highest sugar syrup addition level.
In a Romanian study, a similar increase in moisture and a decrease in electrical conductivity was observed in acacia honey upon the addition of sugar syrups at 5% and 10% w/w level [30]. Moreover, in another Hungarian study, similar results were found, where 30% and 40% w/w of sugar syrup was mixed with acacia honey [31].

3.2. Results of Near-Infrared Spectroscopy

In this section, the results of the chemometric analysis are going to be introduced.

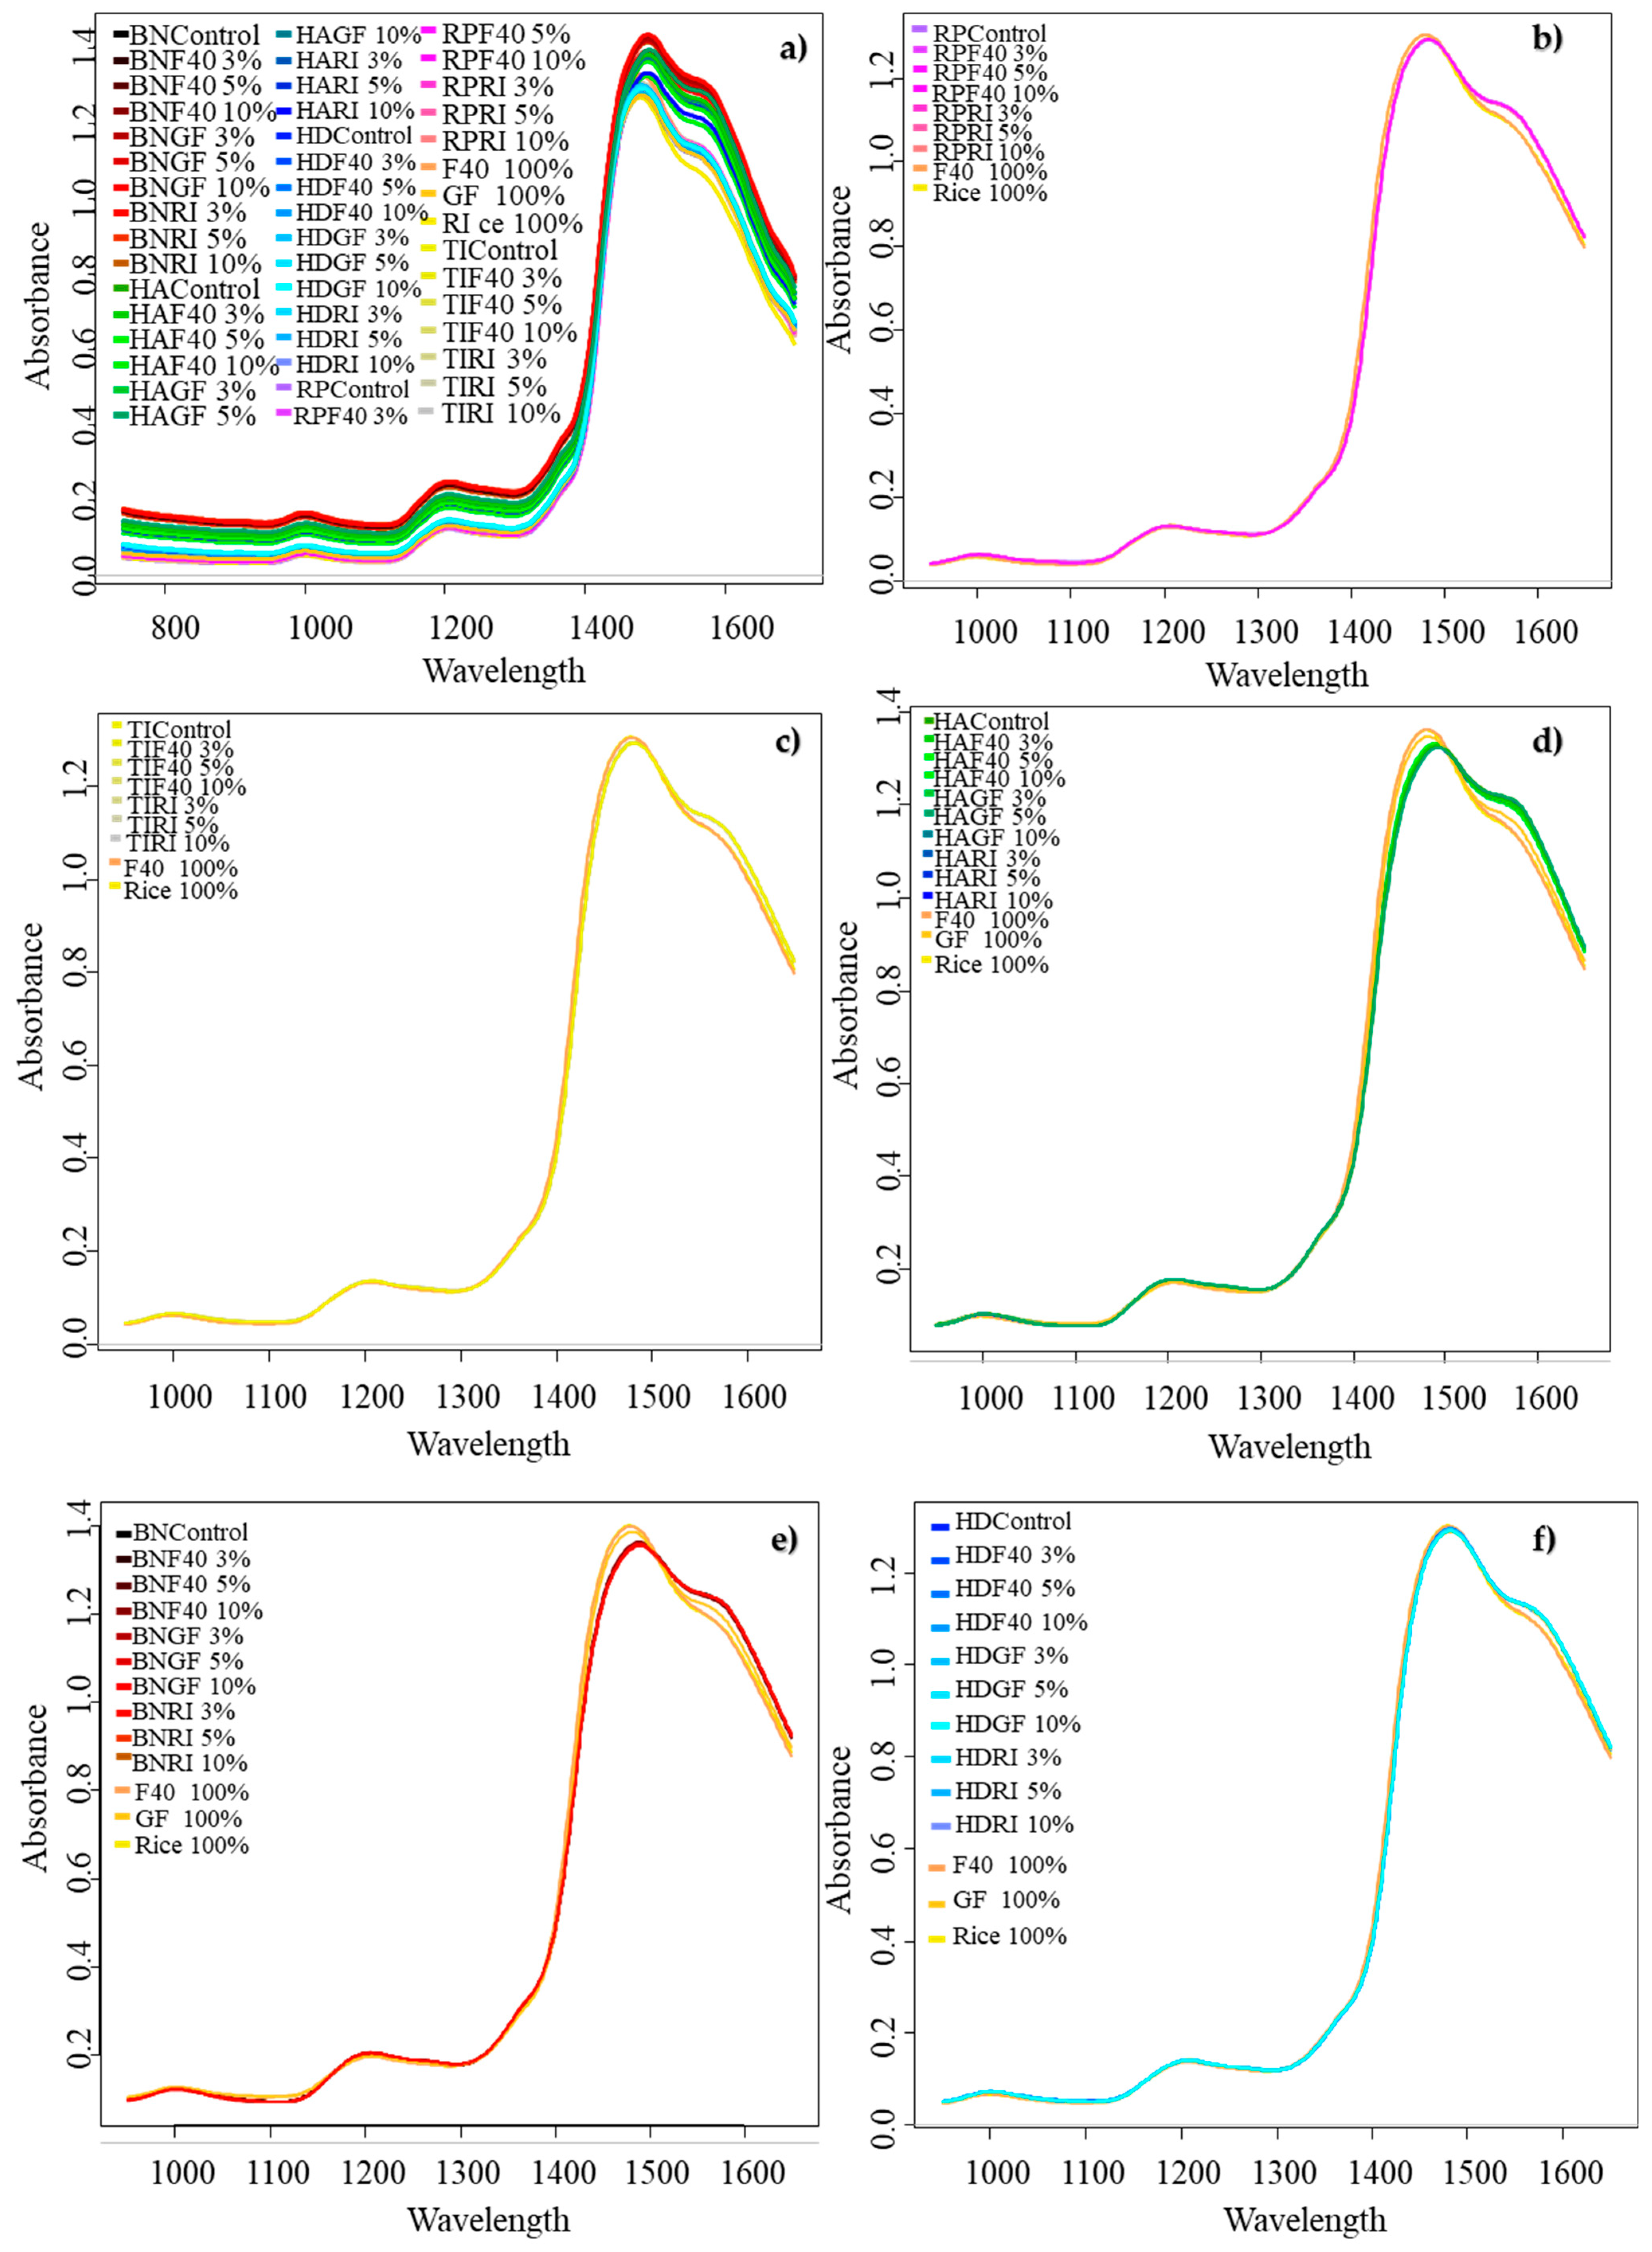
3.2.1. Introduction of the Spectra

For the interpretation of the raw spectra, the entire wavelength range was used (Figure 2a). In the case of the individual honey types (Figure 2b–f), the same preprocessing method was chosen. In this case, the Saviztky–Golay smoothing (2nd order polynomial with 21-window size) coupled with multiplicative scatter correction was chosen, as this preprocessing had the best results in the case of the all syrup models of PCA-LDA for all the honey types.
The recorded spectra of the different samples showed similar pattern in the case of all the honey types and their mixtures. Peaks were found around wavelength range of 950–1050 nm, 1200 nm, and 1450 nm (Figure 2). Another underlying peak was found around 1550–1600 nm. The spectral assignation is discussed in Section 3.2.4. Based on the raw and the pretreated spectra, the large water peak can be found in the range of 1400–1500 nm [14]. In this region, the highest absorbance values were found for the sugar syrups, followed by the sunflower (Figure 2d), rape (Figure 2e), forest (Figure 2f), acacia (Figure 2b), and linden (Figure 2c) honeys. This can be attributed to the higher water content of the sugar syrups. Moreover, in the case of all the honeys, it can be observed that the sugar syrups had a lower absorbance value in the range of the 1550–1600 nm region, which was the region assigned to the sugar content of the samples [14].

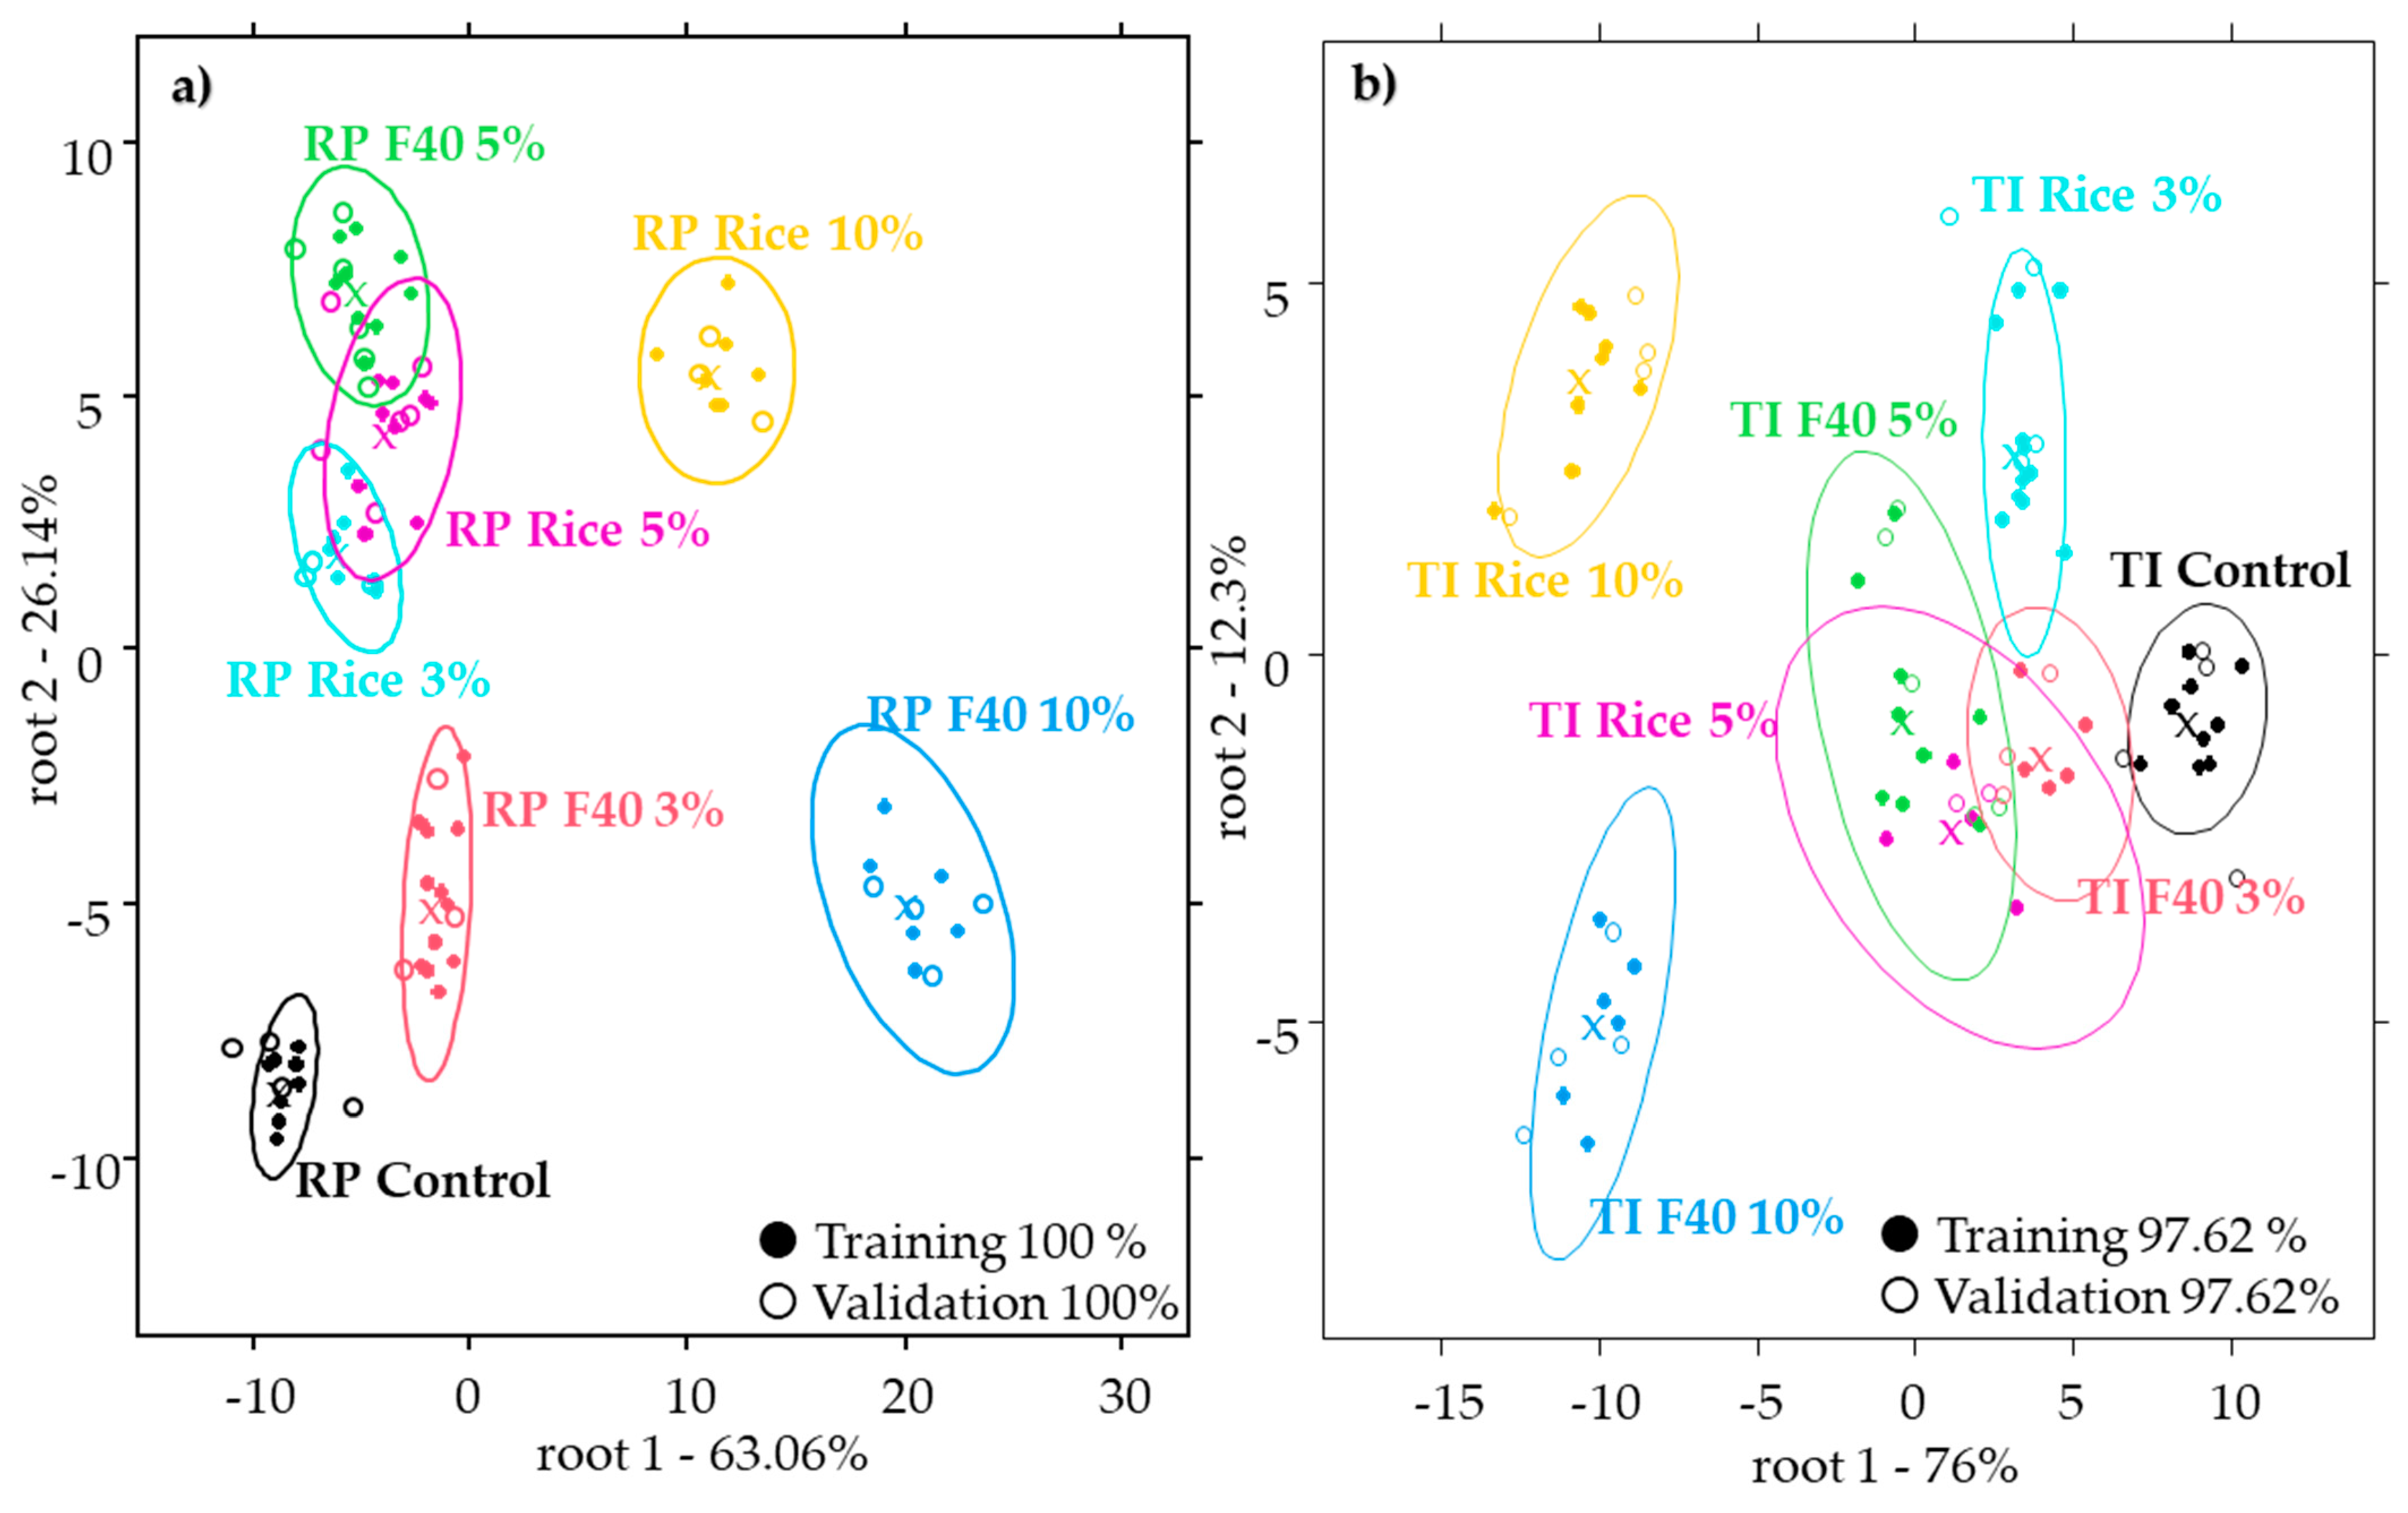
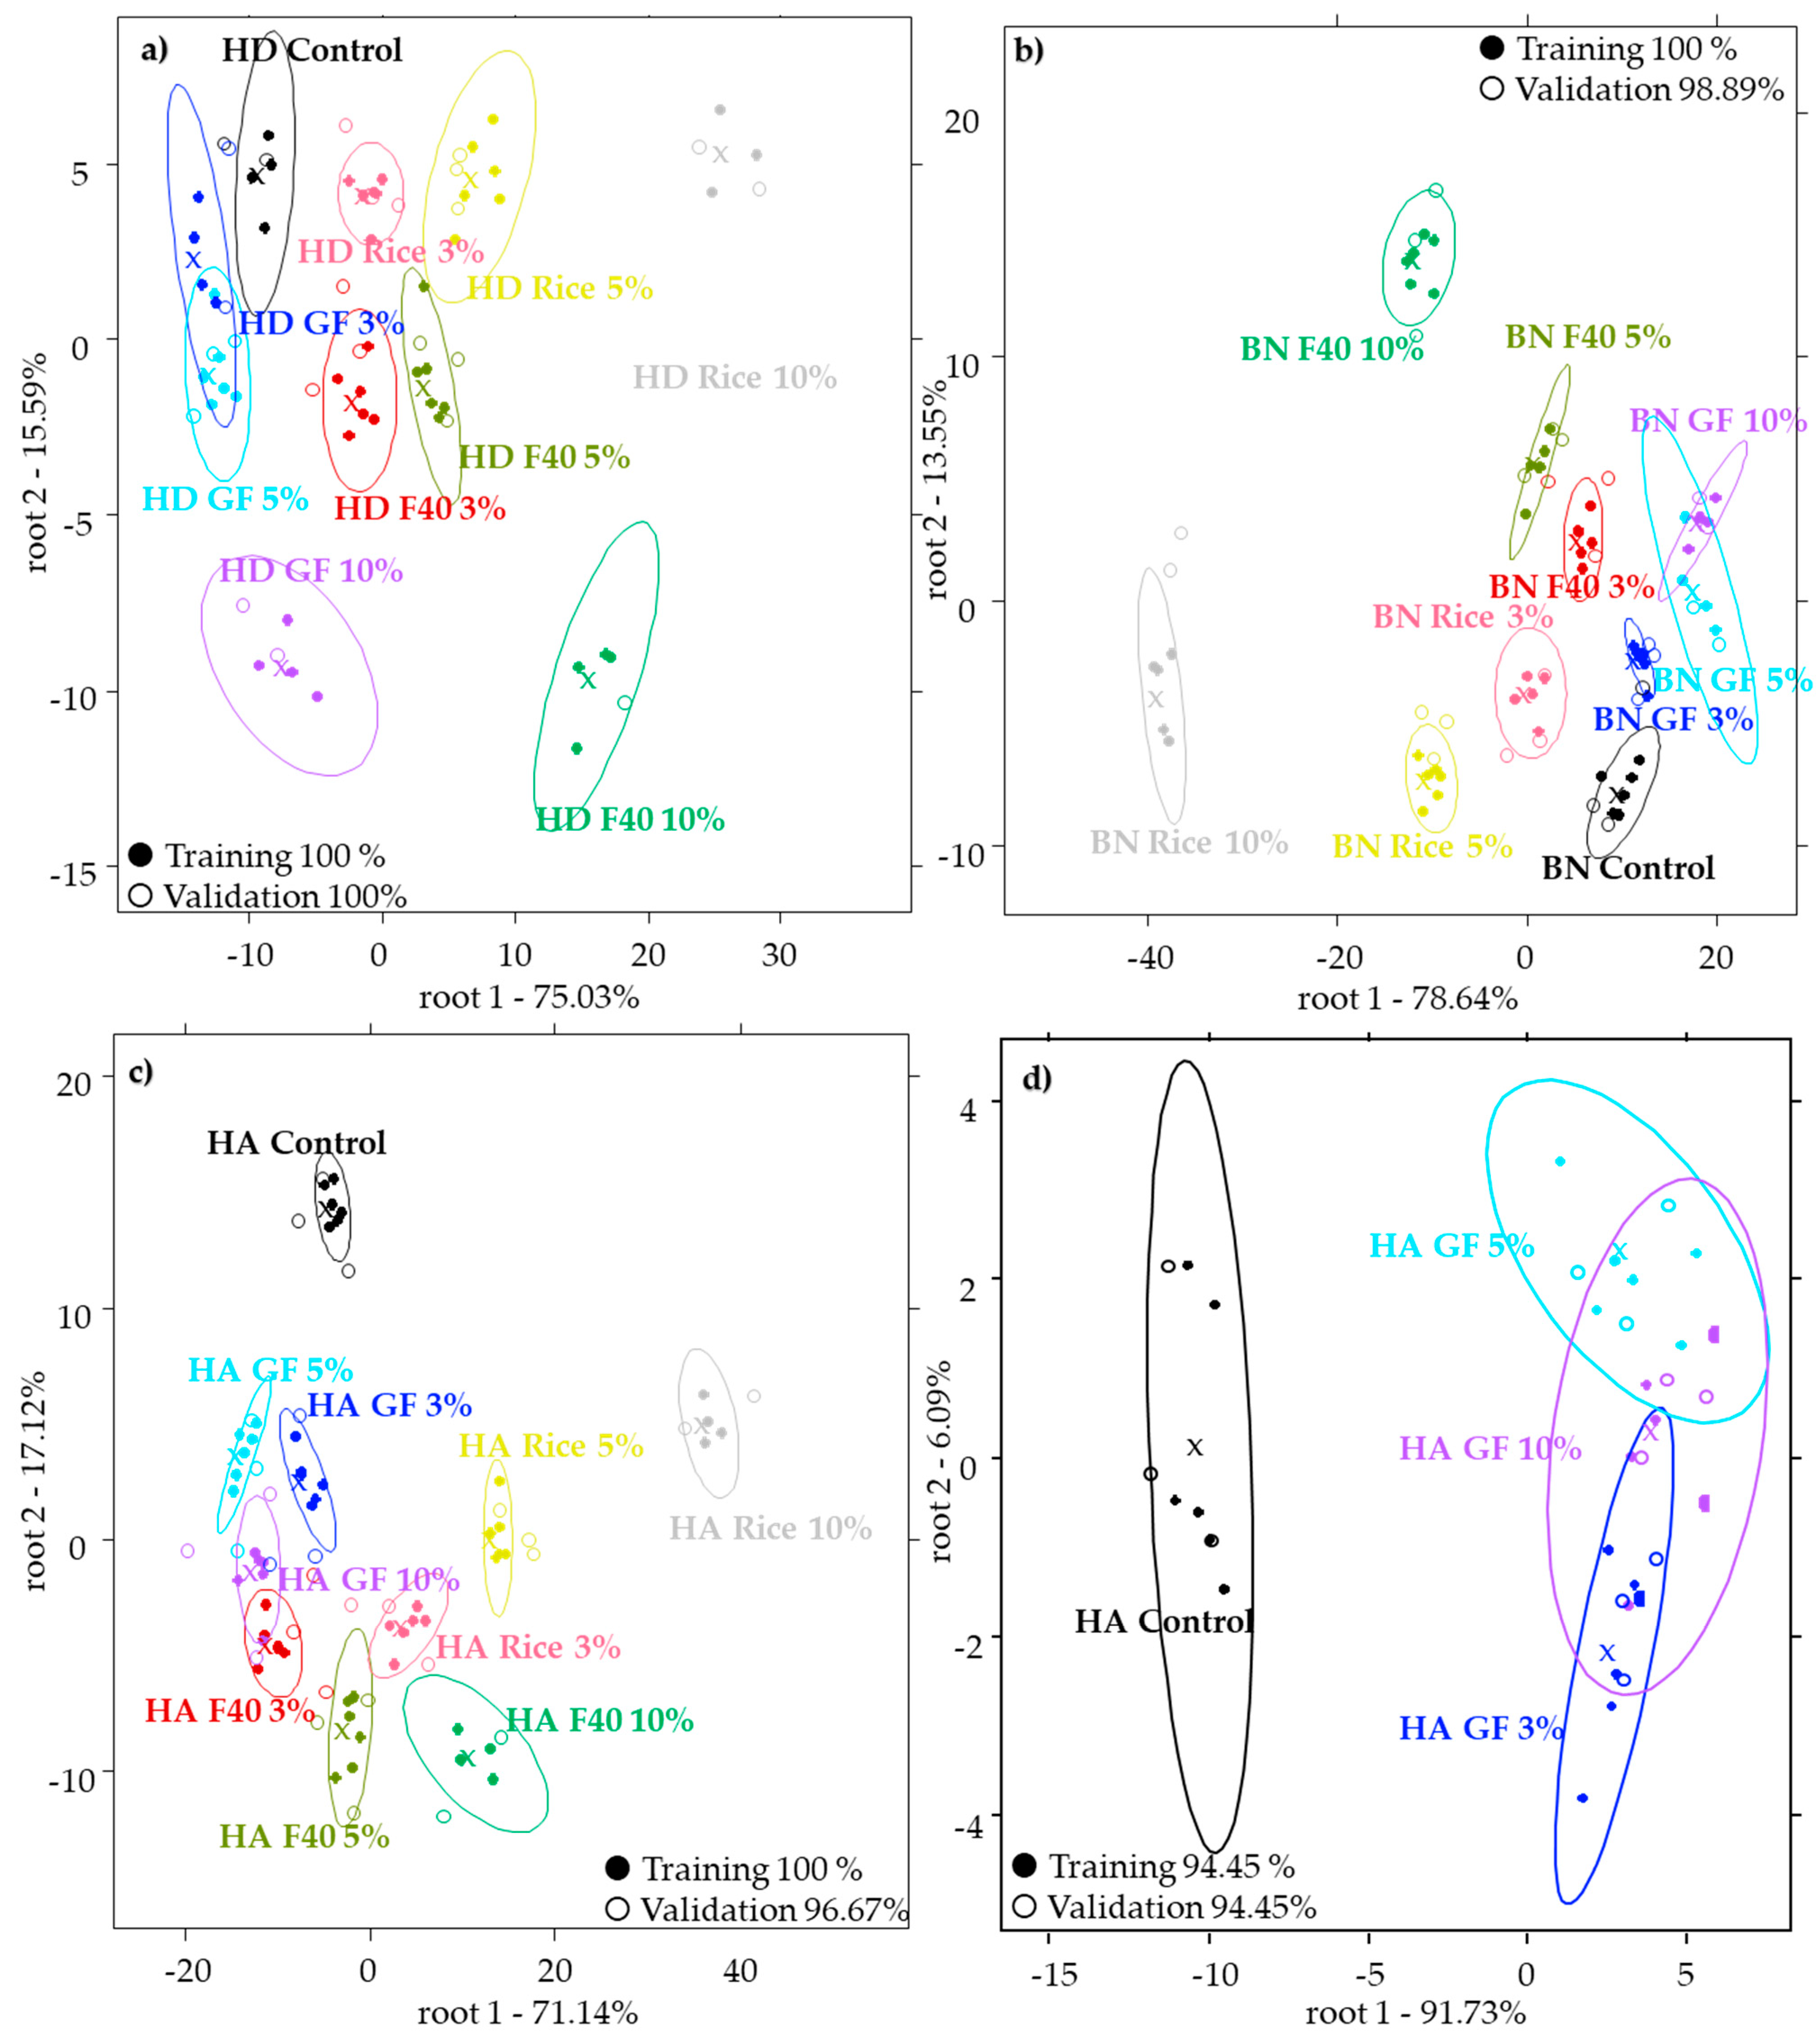
3.2.2. Results of the PCA-LDA Analysis

The results of the PCA-LDA analysis performed on the different honeys with different sugar syrup additions provided promising results. Different honeys and sugar syrup models needed different spectral pretreatment in most of the cases. For the interpretation of the results, we chose models containing all the syrups and models where 100% classification was not achieved. The model of acacia honey provided 100% correct classification of all the groups in the case of all the models. This shows that not only the adulterant, but also the type of adulterant could be discriminated based on the model including both syrups (Figure 3a).
Similar results were obtained for the linden honey in the case of the models of F40 and rice syrup mixtures. However, when the two syrups were included in the model, the average correct classification was 97.62% in both training and validation (Figure 3b). The confusion tables showed correct classification of the control, 3%, and 10% mixtures. The honey mixed with rice syrup in 5% (TI Rice 5%) was misclassified as belonging to the 5% F40 mixture in 16.67% (TI F40 5%).
The model of the forest honey was like the model of acacia honey, where all the models showed 100% correct classification. Figure 4a shows the model built for the classification of forest honeys including all the sugar syrups. In the figure, the control group separates from the rest of the models, also providing 100% classification of the control. The result of the rape honey model was similar to the model of linden where the models built separately for the different syrups provided the 100% classification. The model including results of all the syrups altogether provided the average correct classification of the training model and 98.89% correct classification of validation model, as can be seen in Figure 4b. A misclassification was found in the case of the sample mixed with F40 syrup in 3% (BNF40 3%), which was misclassified as belonging to the 5% F40 mixture (BNF40 5%) in 11.11%.
The “weakest” model was obtained for the sunflower honey where the models of honeys mixed with the rice and F40 syrups provided 100% correct classification for all the sample groups. The model of the GF syrup mixtures and model including data of all the samples (Figure 4c) provided a correct classification of the control, but misclassifications were found for the mixtures. The model of the GF syrup mixtures showed average correct classification of 94.45%; its score plot can be seen in Figure 4d. The honey mixtures of 3% w/w and 5% w/w were classified correctly, while the honey mixed with 10% w/w using the GF syrup (HA GF 10% w/w) was classified as honey mixed with 5% w/w GF syrup (HA GF 5% w/w) in 22.22%. Similar results were obtained by Chinese researchers, where honeys mixed with 5% w/w and 10% w/w sugar syrups were misclassified as belonging to each other [13]. The PCA-LDA of sunflower honey built for all the samples classified all the samples correctly during the training; however, in the case of validation, the average correct classification was 96.67%. In this model, the sample containing F40 syrup at 3% w/w lead to misclassification as belonging to the honey mixed with 5% w/w of F40 syrup at 11.11%. In our study, compared with the Chinese and other studies, the detection of adulterants could be achieved not only on the levels presented in those studies (5–40% w/w), but also at a lower level of 3% w/w [13,14,15,16]. Moreover, for the results of PCA-LDA, in all cases, the control could be discriminated from the adulterated samples, which was not assumed in the case of the physical parameters (Table 1).

3.2.3. Results of the Partial Least Square Regression Models

Similar to the PCA-LDA results, the model parameters were different in the case of the different honeys and syrup models within honeys (Table 2). Moreover, the accuracy highly depended on the applied pretreatment, which was also different in the case of the models.
Results of acacia, linden, and forest honeys were better than models obtained for the rape and sunflower honeys.
The prediction model of acacia provided >0.94 R2CV with RMSECV values lower than 0.9% for the syrup addition. Moreover, the RPDCV values were also good, with >4.22 values. The best model was obtained in this case for the prediction of F40 and all syrups together, while the model built for the prediction of rice syrup was slightly weaker, however still very good.
The results obtained in the case of the linden honey were similarly good; during the cross validation, the R2CV values were >0.80, with an RMSECV error lower than 1.65%. Similar to acacia, the models built for the prediction of syrup concentration including results of all the samples and prediction of F40 was better than in the case of the rice syrup model.
The models of the forest honey provided satisfactory results based on the RPDCV values. In this case, the best model was obtained for the prediction of the rice and the F40 model with R2CV ≥0.95 and RPDCV higher than 4.5. The model built for all the syrups was also quite satisfactory; in this case, the R2CV value was higher than 0.8, with an RMSECV of 1.07%. The worst results were obtained in the case of the GF syrup prediction model, this resulting in R2CV of 0.71 and RMSECV of 1.85%.
In the case of the PLSR models of rape honey, the trend was similar to the results of the forest honey. The best results were obtained for the prediction of the F40 syrup, where the R2CV was above 0.96 and the RPDCV value was 4.91, and lower than 1% RMSECV. Slightly worse values were obtained for the prediction of rice syrup, while the worst model was obtained for the GF syrup prediction. In this case, based on the RPDCV values, the models could not be considered satisfactory.
Similar results were provided by the model of the sunflower honey. The prediction of rice and F40 syrup could be considered good, with R2CV > 0.92 and RPDCV > 3.5. The error of prediction based on the RMSECV values was lower than 1.01%. The models built for the prediction of all the syrups and for the prediction of GF syrup reached lower performance. In these cases, the RPDCV values were below 1.5; therefore, these could not be considered satisfactory.
Results showed that the accuracy of prediction highly depends on the type of honey and type of syrup. PLRS model parameters of acacia, linden, and forest honeys were better than models obtained for the rape and sunflower honeys. Moreover, the results obtained for the prediction of rice and F40 were also better than those obtained for the GF syrup. Chinese researchers also found different accuracies of prediction between HFCS and maltose syrups [31].

3.2.4. Regression Vectors and Spectral Assignations

Based on the regression vectors of the different PLSR models and spectra (Figure 2), it can be concluded that in the case of the models, similar wavelength ranges contributed to the PLSR models (Table 3), which are in line with the peaks found during the observation of the raw and pretreated spectra (Figure 2). Mostly all of the models showed the contributing range of 950–1000 nm, which can be assigned to the O–H stretches of the second overtone. The second overtone O–H (1000–1130) and C–H stretches (1150–1220) were also affected in most of the models. Moreover, all the models provided the changes in the range of the 1300–1600 nm region, which is known as the region of the O–H stretches of the first overtone. Based on the latest aquaphotomics-related studies, the water spectral pattern changes can be well-discovered in the 1300–1600 nm range. A wavelength range of 1320–1420 nm can be assigned to the water with less or no hydrogen bonds. Within this range, the water solvation shells OH–(H2O)1,2,4 (1360–1366 nm), free water (1412 nm), and free OH– bond were affected (1398–1418 nm) the most [33,34,35].
The spectral range of 1432–1444 nm can be assigned to water molecules with one hydrogen bond, and the range of 1458–1495 nm is connected to water molecules with 2–4 hydrogen bonds [35,36,37]. The range of around 1490–1520 nm is assigned to ν1, ν2, symmetrical stretching fundamental vibrations and strongly bonded water (1516 nm). Moreover, as honey is mainly composed of sugars and water, the changes in the sugar composition were also reflected in the spectra. Studies showed that the 1439 nm wavelength can be assigned to the sucrose molecules, and higher wavelengths, such as 1520 nm and 1590 nm, to the glucose [37]. The changes in the spectra can be explained by the fact that the sugar profile of the sugar syrups differs highly from that of the honeys, and also the water structure of these sugars is different. Therefore, the addition of these sugars syrups is well-reflected in the spectra [14,33,35,36,37,38,39,40,41,42,43]. Previous Hungarian research has shown that the addition of sugar syrup to honey results an in the increase in the absorbance in the range of 1342–1480 nm, while the decrease in absorbance can be observed at 1512 nm. This shows that the addition of sugar syrups increased the free water and decreased the amount of highly bonded water molecules, which was also proven in the current study [22].
Table 3. Spectral assignation based on the regression vectors contributing to the PLSR models of all the models and syrups.
Spectral Region nmModelsSpectral Assignation Based on [14,33,37,38,39,40,41,42,43]
950–1000Acacia—all syrups, F40
Linden—Rice syrup
Forest—All models
Rape—all syrups, GF
Sunflower—Rice
N–H stretches of second overtone
1000–1130All the models except sunflower GF modelO–H stretches of second overtone
1150–1220Acacia—all syrups, F40
Linden, forest, rape, all models
Sunflower—all syrups, rice, and GF
C–H (CH2, CH3) stretches of second overtone, C–H combination stretch of first overtone (CH2, CH3)
1300–1600All the models1st overtone O–H stretches

4. Conclusions

Our study focused on the adulteration detection of different honey types using three types of sugar syrup. The changes resulting from the syrup addition were evaluated with physical methods and near-infrared spectroscopy.
The results showed that at these levels (3%, 5%, and 10% w/w) the moisture and the pH did not provide sufficient support for detection of adulteration while, conductivity seemed to be a good indicator. The electrical conductivities of sugar-blended and control honeys were significantly different from each other in most of the cases (Table 1). Still, these differences are not relevant enough, as in the Hungarian and international legislation there are no specific limits for all the honey types in terms of electrical conductivity.
The results of the NIRS analysis showed that pretreatment and PC number optimization have a high importance in the model parameters and robustness. Following correct model optimization, promising results could be achieved for both the detection and quantification of adulteration even at the lowest level (3% w/w), which is lower than the most commonly studied sugar syrup concentration in such studies. The results of the PCA-LDA models showed a high accuracy of classification in the case of the optimized models. Control honeys were classified correctly in the case of all the models. The worst average classification accuracy was ~94%, obtained for the model of the sunflower honeys containing GF sugar syrup. However, in this case misclassifications were found among the 5% and 10% w/w mixtures. With the model optimization 100% correct classification could be achieved for the control for all the studied syrup concentrations (3, 5, 10% w/w). PLSR results of the acacia, linden, and forest honeys could also be considered good based on the obtained model parameters: the R2CV values were above 0.80 for the prediction of F40 and rice syrup, and the added syrup concentration was predicted with lower than 1% of error based on the RMSECV values. Similarly good models were obtained for the prediction of the F40 and rice syrup addition (R2CV >0.8 and RPDCV > 2.97) of the rape, sunflower, and forest honeys. Based on the results, we can conclude that the model accuracy highly depends on both the honey and syrup type. These observations were more obvious in the case of the PLSR models. In most of the cases the worst model parameters were obtained for the self-made glucose–fructose syrups. Based on our research, it can be concluded that it is very important to build specific models using the NIRS method on different honey types and with different sugar syrup adulterants. The main limitation of the study was that the applied NIR instruments worked only in the spectral range of 740–1700 nm, therefore lacking the region of higher wavelengths where chemical bounds can be found for the sugars (1800 nm) [14]. Another limitation and possibility of further work could be the analysis of more physicochemical parameters and sugar properties of the honeys. Moreover, the applicability of this in an authority level could be achieved only with a large database. This should be built containing numerous spectra of authentic honeys; furthermore, spectra of honeys that were syrup added with different type of syrups and at different concentrations. Nonetheless, based on the results, NIRS applied together with well-optimized models can be an effective tool in the detection of adulteration with sugar syrups even at low levels. In the future, these models could be further improved by the extension of the database with more honey and syrup types.

Supplementary Materials

The following supporting information can be downloaded at: https://www.mdpi.com/article/10.3390/chemosensors11020089/s1, Table S1. Near-infrared spectroscopy pretreatment combinations used for the spectral preprocessing.

Author Contributions

Conceptualization, Z.B., Z.K., J.-L.Z.Z. and C.B.; methodology, Z.B., Z.K., M.M. and C.B; resources, Z.K., Z.B., C.B., M.V.B. and É.C.C.; writing—original draft preparation, Z.B., Z.K. and C.B.; writing—review and editing, Z.B., Z.K., C.B., M.V.B., É.C.C., J.-L.Z.Z. and M.M.; visualization, Z.B.; supervision, Z.K. and C.B.; project administration, Z.K.; funding acquisition, Z.B., Z.K. and C.B. All authors have read and agreed to the published version of the manuscript.

Funding

This paper was supported by the TKP2021-NVA-22 project of the Hungarian University of Agriculture and Life Sciences. This project was supported by the Doctoral School of Food Science of MATE.

Institutional Review Board Statement

Not applicable.

Informed Consent Statement

Not applicable.

Data Availability Statement

Not applicable.

Acknowledgments

Authors are grateful to Vanessza Nóra Tamás for her contribution to the analysis.

Conflicts of Interest

The authors declare no conflict of interest.

References

  1. Ciulu, M.; Solinas, S.; Floris, I.; Panzanelli, A.; Pilo, M.I.; Piu, P.C.; Spano, N.; Sanna, G. RP-HPLC Determination of Water-Soluble Vitamins in Honey. Talanta 2011, 83, 924–929. [Google Scholar] [CrossRef]
  2. Zamora, M.C.; Chirife, J. Determination of Water Activity Change Due to Crystallization in Honeys from Argentina. Food Control 2006, 17, 59–64. [Google Scholar] [CrossRef] [Green Version]
  3. Da Silva, P.M.; Gauche, C.; Gonzaga, L.V.; Costa, A.C.O.; Fett, R. Honey: Chemical Composition, Stability and Authenticity. Food Chem. 2016, 196, 309–323. [Google Scholar] [CrossRef] [PubMed]
  4. Codex Alimentarius Hungaricus 1-3-2001/110 számú Előírás Méz (1-3-2001/110 Regulation Honey). In Codex Alimentarius Hungaricus; Codex Alimentarius Hungaricus (Ed.) Magyar Élelmiszerkönyv Bizottság: Budapest, Hungary, 2002; pp. 1–7. [Google Scholar]
  5. The European Council. Council Directive 2001/110/EC of 20 December 2001 Relating to Honey. Off. J. Eur. Union 2001, L 10, 47–52. [Google Scholar]
  6. Codex Alimentarius Commission. Codex Standard for Honey, CODEX STAN 12-1981; FAO: Rome, Italy, 2001; Volume 11, p. 7. [Google Scholar]
  7. Benedek, C.; Zaukuu, Z.J.-L.; Bodor, Z.; Kovacs, Z. Honey-Based Polyphenols: Extraction, Quantification, Bioavailability, and Biological Activities. In Plant-Based Functional Foods and Phytochemicals; Goyal, R.M., Nath, A., Suleria, R.H.A., Eds.; Apple Academic Press: New York, NY, USA, 2021; pp. 35–63. [Google Scholar]
  8. National Food Crime Unit; Scottish Food Crime Unit. Food Crime Strategic Assesment 2020; Food Standards Agency: London, UK, 2020. [Google Scholar]
  9. Zábrodská, B.; Vorlová, L. Adulteration of Honey and Available Methods for Detection—A Review. Acta Vet. Brno 2014, 83, S85–S102. [Google Scholar] [CrossRef] [Green Version]
  10. European Commission. Technical Round Table on Honey Authentication; European Commission: Brussels, Belgium, 2018. [Google Scholar]
  11. Lohumi, S.; Lee, S.; Lee, H.; Cho, B.-K. A Review of Vibrational Spectroscopic Techniques for the Detection of Food Authenticity and Adulteration. Trends Food Sci. Technol. 2015, 46, 85–98. [Google Scholar] [CrossRef]
  12. Aouadi, B.; Zaukuu, J.L.Z.; Vitális, F.; Bodor, Z.; Fehér, O.; Gillay, Z.; Bazar, G.; Kovacs, Z. Historical Evolution and Food Control Achievements of Near Infrared Spectroscopy, Electronic Nose, and Electronic Tongue—Critical Overview. Sensors 2020, 20, 5479. [Google Scholar] [CrossRef] [PubMed]
  13. Gan, Z.; Yang, Y.; Li, J.; Wen, X.; Zhu, M.; Jiang, Y.; Ni, Y. Using Sensor and Spectral Analysis to Classify Botanical Origin and Determine Adulteration of Raw Honey. J. Food Eng. 2016, 178, 151–158. [Google Scholar] [CrossRef]
  14. Bázár, G.; Romvári, R.; Szabó, A.; Somogyi, T.; Éles, V.; Tsenkova, R. NIR Detection of Honey Adulteration Reveals Differences in Water Spectral Pattern. Food Chem. 2016, 194, 873–880. [Google Scholar] [CrossRef]
  15. Huang, F.; Song, H.; Guo, L.; Guang, P.; Yang, X.; Li, L.; Zhao, H.; Yang, M. Detection of Adulteration in Chinese Honey Using NIR and ATR-FTIR Spectral Data Fusion. Spectrochim. Acta Part A Mol. Biomol. Spectrosc. 2020, 235, 118297. [Google Scholar] [CrossRef]
  16. Aliaño-González, M.J.; Ferreiro-González, M.; Espada-Bellido, E.; Palma, M.; Barbero, G.F. A Screening Method Based on Visible-NIR Spectroscopy for the Identification and Quantification of Different Adulterants in High-Quality Honey. Talanta 2019, 203, 235–241. [Google Scholar] [CrossRef] [PubMed]
  17. Grassi, S.; Jolayemi, O.S.; Giovenzana, V.; Tugnolo, A.; Squeo, G.; Conte, P.; De Bruno, A.; Flamminii, F.; Casiraghi, E.; Alamprese, C. Near Infrared Spectroscopy as a Green Technology for the Quality Prediction of Intact Olives. Foods 2021, 10, 1042. [Google Scholar] [CrossRef] [PubMed]
  18. Lang, J.; McNitt, L.; Inc, P.; CT, S. Detection of Honey Adulteration Using FT-NIR Spectroscopy; PerkinElmer, Inc.: Waltham, MA, USA, 2015. [Google Scholar]
  19. Shafiee, S.; Polder, G.; Minaei, S.; Moghadam-Charkari, N.; van Ruth, S.; Kuś, P.M. Detection of Honey Adulteration Using Hyperspectral Imaging. IFAC-PapersOnLine 2016, 49, 311–314. [Google Scholar] [CrossRef]
  20. Longin, L.; Jurinjak Tusek, A.; Valinger, D.; Benkovic, M.; Jurina, T.; Gajdos Kljusuric, J. Application of Artificial Neural Networks (ANN) Coupled with Near-InfraRed(NIR) Spectroscopy for Detection of Adulteration in Honey. Biodivers. Inf. Sci. Stand. 2019, 3, e38048. [Google Scholar] [CrossRef]
  21. Yang, X.; Chen, J.; Jia, L.; Yu, W.; Wang, D.; Wei, W.; Li, S.; Tian, S.; Wu, D. Rapid and Non-Destructive Detection of Compression Damage of Yellow Peach Using an Electronic Nose and Chemometrics. Sensors 2020, 20, 1866. [Google Scholar] [CrossRef] [Green Version]
  22. Bodor, Z.; Zaukuu, J.Z.; Aouadi, B.; Benedek, C.; Kovacs, Z. Application of NIRS and Aquaphotomics for the Detection of Adulteration of Honey, Paprika and Tomato Paste. In Proceedings of the SZIEntific Meeting for Young Researchers—Ifjú Tehetségek Találkozója, Szent István University, Budapest, Hungary, 9 December 2019; pp. 76–91. Available online: http://itt.budaicampus.szie.hu/sites/default/files/files/ITT_2019_konferencia.pdf (accessed on 20 January 2020).
  23. Bogdanov, S. Harmonised Methods of the International Honey Commission. Swiss Bee Research Centre, FAM: Liebefeld, Switzerland, 2009; ISBN 9780874216561. [Google Scholar]
  24. Tabachnick, B.G.; Fidell, L.S. Using Multivariate Statistics, 6th ed.; Pearson Education: London, UK, 2013; ISBN 9780205849574. [Google Scholar]
  25. Luedeling, E. RPD: Residual Prediction Deviation (RPD) in ChillR: Statistical Methods for Phenology Analysis in Temperate Fruit Trees. Available online: https://rdrr.io/cran/chillR/man/RPD.html (accessed on 28 July 2021).
  26. Muncan, J.; Tsenkova, R. Aquaphotomics—From Innovative Knowledge to Integrative Platform in Science and Technology. Molecules 2019, 24, 2742. [Google Scholar] [CrossRef] [Green Version]
  27. Muncan, J.; Kovacs, Z.; Pollner, B.; Ikuta, K.; Ohtani, Y.; Terada, F.; Tsenkova, R. Near Infrared Aquaphotomics Study on Common Dietary Fatty Acids in Cow’s Liquid, Thawed Milk. Food Control 2021, 122, 107805. [Google Scholar] [CrossRef]
  28. Munawar, A.A.; Zulfahrizal; Meilina, H.; Pawelzik, E. Near Infrared Spectroscopy as a Fast and Non-Destructive Technique for Total Acidity Prediction of Intact Mango: Comparison among Regression Approaches. Comput. Electron. Agric. 2022, 193, 106657. [Google Scholar] [CrossRef]
  29. Pollner, B.; Kovacs, Z. R-Package Aquap2—Multivariate Data Analysis Tools for R Including Aquaphotomics Methods. Available online: https://www.aquaphotomics.com/aquap2/ (accessed on 28 July 2021).
  30. Ciursa, P.; Oroian, M. Influence of Corn and Inverted Sugar Adulteration on Physicochemical Properties of Romanian Acacia Honeys. Sci. Bulletin. Ser. F. Biotechnol. 2020, XXIV, 85–93. [Google Scholar]
  31. Czipa, N.; Phillips, C.J.C.; Kovács, B. Composition of Acacia Honeys Following Processing, Storage and Adulteration. J. Food Sci. Technol. 2019, 56, 1245–1255. [Google Scholar] [CrossRef] [Green Version]
  32. Bodor, Z. Application of Classical and Correlative Analytical Methods for Authentication of Honey. Ph.D. Thesis, Hungarian University of Agriculture and Life Sciences, Budapest, Hungary, 2022. Available online: https://uni-mate.hu/documents/20123/336900/Bodor_Zsanett-ertekezes.pdf/1908f699-17cd-9985-a058-2bc19dbdb5c7?t=1659596636531 (accessed on 22 December 2022).
  33. Li, S.; Zhang, X.; Shan, Y.; Su, D.; Ma, Q.; Wen, R.; Li, J. Qualitative and Quantitative Detection of Honey Adulterated with High-Fructose Corn Syrup and Maltose Syrup by Using near-Infrared Spectroscopy. Food Chem. 2017, 218, 231–236. [Google Scholar] [CrossRef]
  34. Xantheas, S.S. Ab Initio Studies of Cyclic Water Clusters (H2O)n, N = 1–6. III. Comparison of Density Functional with MP2 Results. J. Chem. Phys. 1995, 102, 4505. [Google Scholar] [CrossRef]
  35. Tsenkova, R.; Muncan, J.; Pollner, B.; Kovacs, Z. Essentials of Aquaphotomics and Its Chemometrics Approaches. Front. Chem. 2018, 6, 363. [Google Scholar] [CrossRef] [PubMed]
  36. Bodor, Z.; Benedek, C.; Aouadi, B.; Zsom-Muha, V.; Kovacs, Z. Revealing the Effect of Heat Treatment on the Spectral Pattern of Unifloral Honeys Using Aquaphotomics. Molecules 2022, 27, 780. [Google Scholar] [CrossRef] [PubMed]
  37. Siesler, H.W.; Ozaki, Y.; Kawata, S.; Heise, H.M. (Eds.) Near-Infrared Spectroscopy: Principles, Instruments, Applications; Wiley-VCH Verlag GmbH: Weinheim, Germany, 2001; ISBN 9783527612666. [Google Scholar]
  38. López, M.G.; García-González, A.S.; Franco-Robles, E. Carbohydrate Analysis by NIRS-Chemometrics. In Developments in Near-Infrared Spectroscopy; IntechOpen: London, UK, 2017; ISBN 978-953-51-3018-5. [Google Scholar]
  39. Ozaki, Y.; Genkawa, T.; Futami, Y. Near-Infrared Spectroscopy. In Encyclopedia of Spectroscopy and Spectrometry; Academic Press: Cambridge, MA, USA, 2016; pp. 40–49. [Google Scholar]
  40. Zhang, C.; Liu, F.; He, Y. Identification of Coffee Bean Varieties Using Hyperspectral Imaging: Influence of Preprocessing Methods and Pixel-Wise Spectra Analysis. Sci. Rep. 2018, 8, 2166. [Google Scholar] [CrossRef] [PubMed] [Green Version]
  41. Yang, X.; Guang, P.; Xu, G.; Zhu, S.; Chen, Z.; Huang, F. Manuka Honey Adulteration Detection Based on Near-Infrared Spectroscopy Combined with Aquaphotomics. LWT 2020, 132, 109837. [Google Scholar] [CrossRef]
  42. Farkas, J.; Dalmadi, I. Near Infrared and Fluorescence Spectroscopic Methods and Electronic Nose Technology for Monitoring Foods. Prog. Agric. Eng. Sci. 2009, 5, 1–29. [Google Scholar] [CrossRef]
  43. Muncan, J.; Kuroki, S.; Moyankova, D.; Morita, H.; Atanassova, S.; Djilianov, D.; Tsenkova, R. Protocol for Aquaphotomics Monitoring of Water Molecular Structure in Leaves of Resurrection Plants during Desiccation and Recovery. Protoc. Exch. 2019. [Google Scholar] [CrossRef]
Figure 1. Flowchart of the chemometric analysis of NIRS data.
Chemosensors 11 00089 g001
Figure 2. Near-infrared average spectra of the analyzed samples: (a) raw spectra (740–1700 nm) and spectra after Savitzky–Golay smoothing (2nd order polynomial, 21 window size, no derivation) and multiplicative scatter correction (950–1650 nm) in the case of (b) acacia samples (RP) (c) linden samples (TI), (d) sunflower samples (HA), (e) rape samples (BN), and (f) forest honey samples and their mixtures with rice, F40, and self-made glucose–fructose syrup (GF).
Chemosensors 11 00089 g002
Figure 3. PCA-LDA model score plot of the (a) acacia (RP) and (b) linden (TI) honey samples for the classification of rice and high-fructose corn (F40) syrup addition levels including the results of all the samples.
Chemosensors 11 00089 g003
Figure 4. PCA-LDA model score of the classification model of rice, high-fructose corn (F40), and self-made glucose–fructose (GF) syrup addition levels in the case of models containing results of all the syrups of (a) forest (HD), (b) rape (BN), and (c) sunflower (HA) honey, and (d) classification of sunflower (HA) honeys blended with self-made glucose–fructose syrup.
Chemosensors 11 00089 g004
Table 1. Results of the physical properties of different honey types.
HoneySampleMoisture %pHElectrical conductivity μS/cm
AcaciaRP Control16.60 ± 0.14 a3.59 ± 0.01 a141.40 ± 0.03 a
RP F40 3%17.15 ± 0.35 a3.59 ± 0.02 a137.81 ± 0.40 b
RP F40 5%16.95 ± 0.07 a3.61 ± 0.01 a136.12 ± 1.65 abcd
RP F40 10%17.40 ± 0.00 a3.64 ± 0.04 a132.11 ± 1.66 bcd
RP RI 3%17.00 ± 0.14 a3.60 ± 0.02 a137.69 ± 0.27 bc
RP RI 5%17.05 ± 0.07 a3.60 ± 0.02 a135.77 ± 0.52 c
RP RI 10%17.10 ± 0.00 a3.60 ± 0.02 a130.12 ± 0.44 d
LindenTI Control16.60 ± 0.14 a4.34 ± 0.02 a627.44 ± 3.50 a
TI F40 3%17.15 ± 0.35 a4.32 ± 0.01 a607.44 ± 1.90 b
TI F40 5%16.95 ± 0.07 a4.32 ± 0.01 a593.89 ± 6.26 bcd
TI F40 10%17.40 ± 0.00 a4.32 ± 0.01 a568.00 ± 1.00 c
TI RI 3%17.00 ± 0.14 a4.33 ± 0.01 a607.22 ± 1.50 b
TI RI 5%17.05 ± 0.07 a4.31 ± 0.01 a597.78 ± 0.96 d
TI RI 10%17.10 ± 0.00 a4.34 ± 0.01 a570.33 ± 3.61 c
RapeBN Control17.83 ± 0.08 a3.56 ± 0.01 a180.98 ± 1.16 a
BN F40 3%17.83 ± 0.05 a3.56 ± 0.01 a175.46 ± 0.47 bc
BN F40 5%17.97 ± 0.15 ab3.57 ± 0.01 a172.72 ± 0.74 d
BN F40 10%18.18 ± 0.04 b3.57 ± 0.02 ab165.76 ± 1.46 e
BN GF 3%17.82 ± 0.13 a3.56 ± 0.01 a175.06 ± 0.46 b
BN GF 5%17.83 ± 0.05 a3.61 ± 0.02 b172.18 ± 0.66 d
BN GF 10%17.83 ± 0.05 a3.58 ± 0.04 ab165.17 ± 2.51 ef
BN RI 3%17.82 ± 0.04 a3.55 ± 0.01 ac176.06 ± 0.60 c
BN RI 5%17.92 ± 0.1 a3.53 ± 0.02 cd172.68 ± 0.22 d
BN RI 10%18.22 ± 0.31 ab3.52 ± 0.01 d167.88 ± 0.40 f
SunflowerHA Control16.65 ± 0.08 a3.20 ± 0.01 a416.78 ± 0.67 ab
HA F40 3%17.02 ± 0.04 bc3.19 ± 0.01 ab421.11 ± 1.27 c
HA F40 5%17.17 ± 0.20 bcd3.19 ± 0.01 ab415.78 ± 1.09 a
HA F40 10%17.25 ± 0.12 b3.19 ± 0.01 ab395.44 ± 0.73 d
HA GF 3%16.85 ± 0.08 d3.18 ± 0.01 b418.56 ± 1.24 b
HA GF 5%16.82 ± 0.18 acd3.18 ± 0.01 ab407.00 ± 2.60 e
HA GF 10%17.07 ± 0.10 bcd3.19 ± 0.01 ab387.33 ± 1.32 f
HA RI 3%16.90 ± 0.11 cd3.28 ± 0.08 abc425.56 ± 1.33 g
HA RI 5%16.75 ± 0.18 acd3.23 ± 0.02 c417.78 ± 0.97 b
HA RI 10%16.98 ± 0.04 cd3.23 ± 0.02 c397.78 ± 1.20 h
ForestHD Control17.30 ± 0.17 abcd3.87 ± 0.01 a508.78 ± 3.07 a
HD F40 3%17.25 ± 0.12 abc3.88 ± 0.00 ab493.33 ± 1.58 b
HD F40 5%17.38 ± 0.04 abd3.88 ± 0.00 a483.56 ± 1.51 c
HD F40 10%17.60 ± 0.18 ad3.88 ± 0.01 ab461.22 ± 2.17 d
HD GF 3%17.27 ± 0.10 abc3.89 ± 0.01 bc496.89 ± 2.15 e
HD GF 5%17.37 ± 0.08 abd3.88 ± 0.01 ab485.89 ± 2.52 cf
HD GF 10%17.53 ± 0.10 d3.88 ± 0.01 ab462.11 ± 2.89 d
HD RI 3%17.13 ± 0.10 c3.89 ± 0.01 abc496.00 ± 2.55 be
HD RI 5%17.17 ± 0.15 bc3.87 ± 0.01 a488.22 ± 1.39 f
HD RI 10%17.13 ± 0.15 bc3.90 ± 0.01 c472.11 ± 1.05 g
Letters denote the significant differences among the different samples within one honey type due to the ANOVA Games–Howell post-hoc test. Bold letters denote the samples of values significantly different from control honeys. RI: rice syrup; F40: high fructose-content corn syrup; GF: self-made glucose–fructose syrup.
Table 2. Result of the partial least square regression models built to regress on the added syrup concentration of sugar syrups adapted from Bodor Z. (2022) [32].
HoneySyrupPretreatmentNumber of Latent VariablesR2CRMSEC
%
RPDCR2CVRMSECV
%
RPDCV
AcaciaAll syrupssgol@2-13-0+sgol@2-17-140.990.2911.420.980.496.70
Ricesgol@2-13-0+deTr20.980.526.790.940.844.22
F40sgol@2-17-0+sgol@2-21-140.990.369.690.980.506.83
LindenAll syrupsdeTr+snv40.970.685.490.921.073.50
Ricesgol@2-21-030.960.715.250.801.642.27
F40deTr30.940.934.030.861.372.73
ForestAll syrupssgol@2-17-0+snv40.920.893.530.881.072.95
Ricesgol@2-17-0+sgol@2-17-241.000.2214.700.950.724.52
F40sgol@2-21-0+sgol@2-21-140.990.369.320.970.546.20
GFsgol@2-21-0+sgol@2-13-240.980.546.460.711.851.89
RapeAll syrupsmsc30.771.532.090.681.801.78
Ricesgol@2-17-0+sgol@2-21-230.960.694.800.881.132.93
F40deTr20.980.497.140.960.724.91
GFsgol@2-13-0+sgol@2-21-240.920.993.700.462.621.39
SunflowerAll syrupsmsc40.602.111.600.362.691.26
Ricesgol@2-17-0+sgol@2-17-140.990.409.290.921.013.67
F40sgol@2-13-040.990.418.360.940.804.27
GFmsc40.831.502.490.392.891.29
R2C and R2CV determination coefficient of training and validation; RMSEC and RMSECV root mean square error of training and validation; RPDC and RPDCV residual prediction deviation training and validation.
Disclaimer/Publisher’s Note: The statements, opinions and data contained in all publications are solely those of the individual author(s) and contributor(s) and not of MDPI and/or the editor(s). MDPI and/or the editor(s) disclaim responsibility for any injury to people or property resulting from any ideas, methods, instructions or products referred to in the content.

