
Influence of Isovalent ‘W’ Substitutions on the Structure and Electrical Properties of La2Mo2O9 Electrolyte for Intermediate-Temperature Solid Oxide Fuel Cells


Abstract
:1. Introduction
2. Materials and Methods
3. Results and Discussion
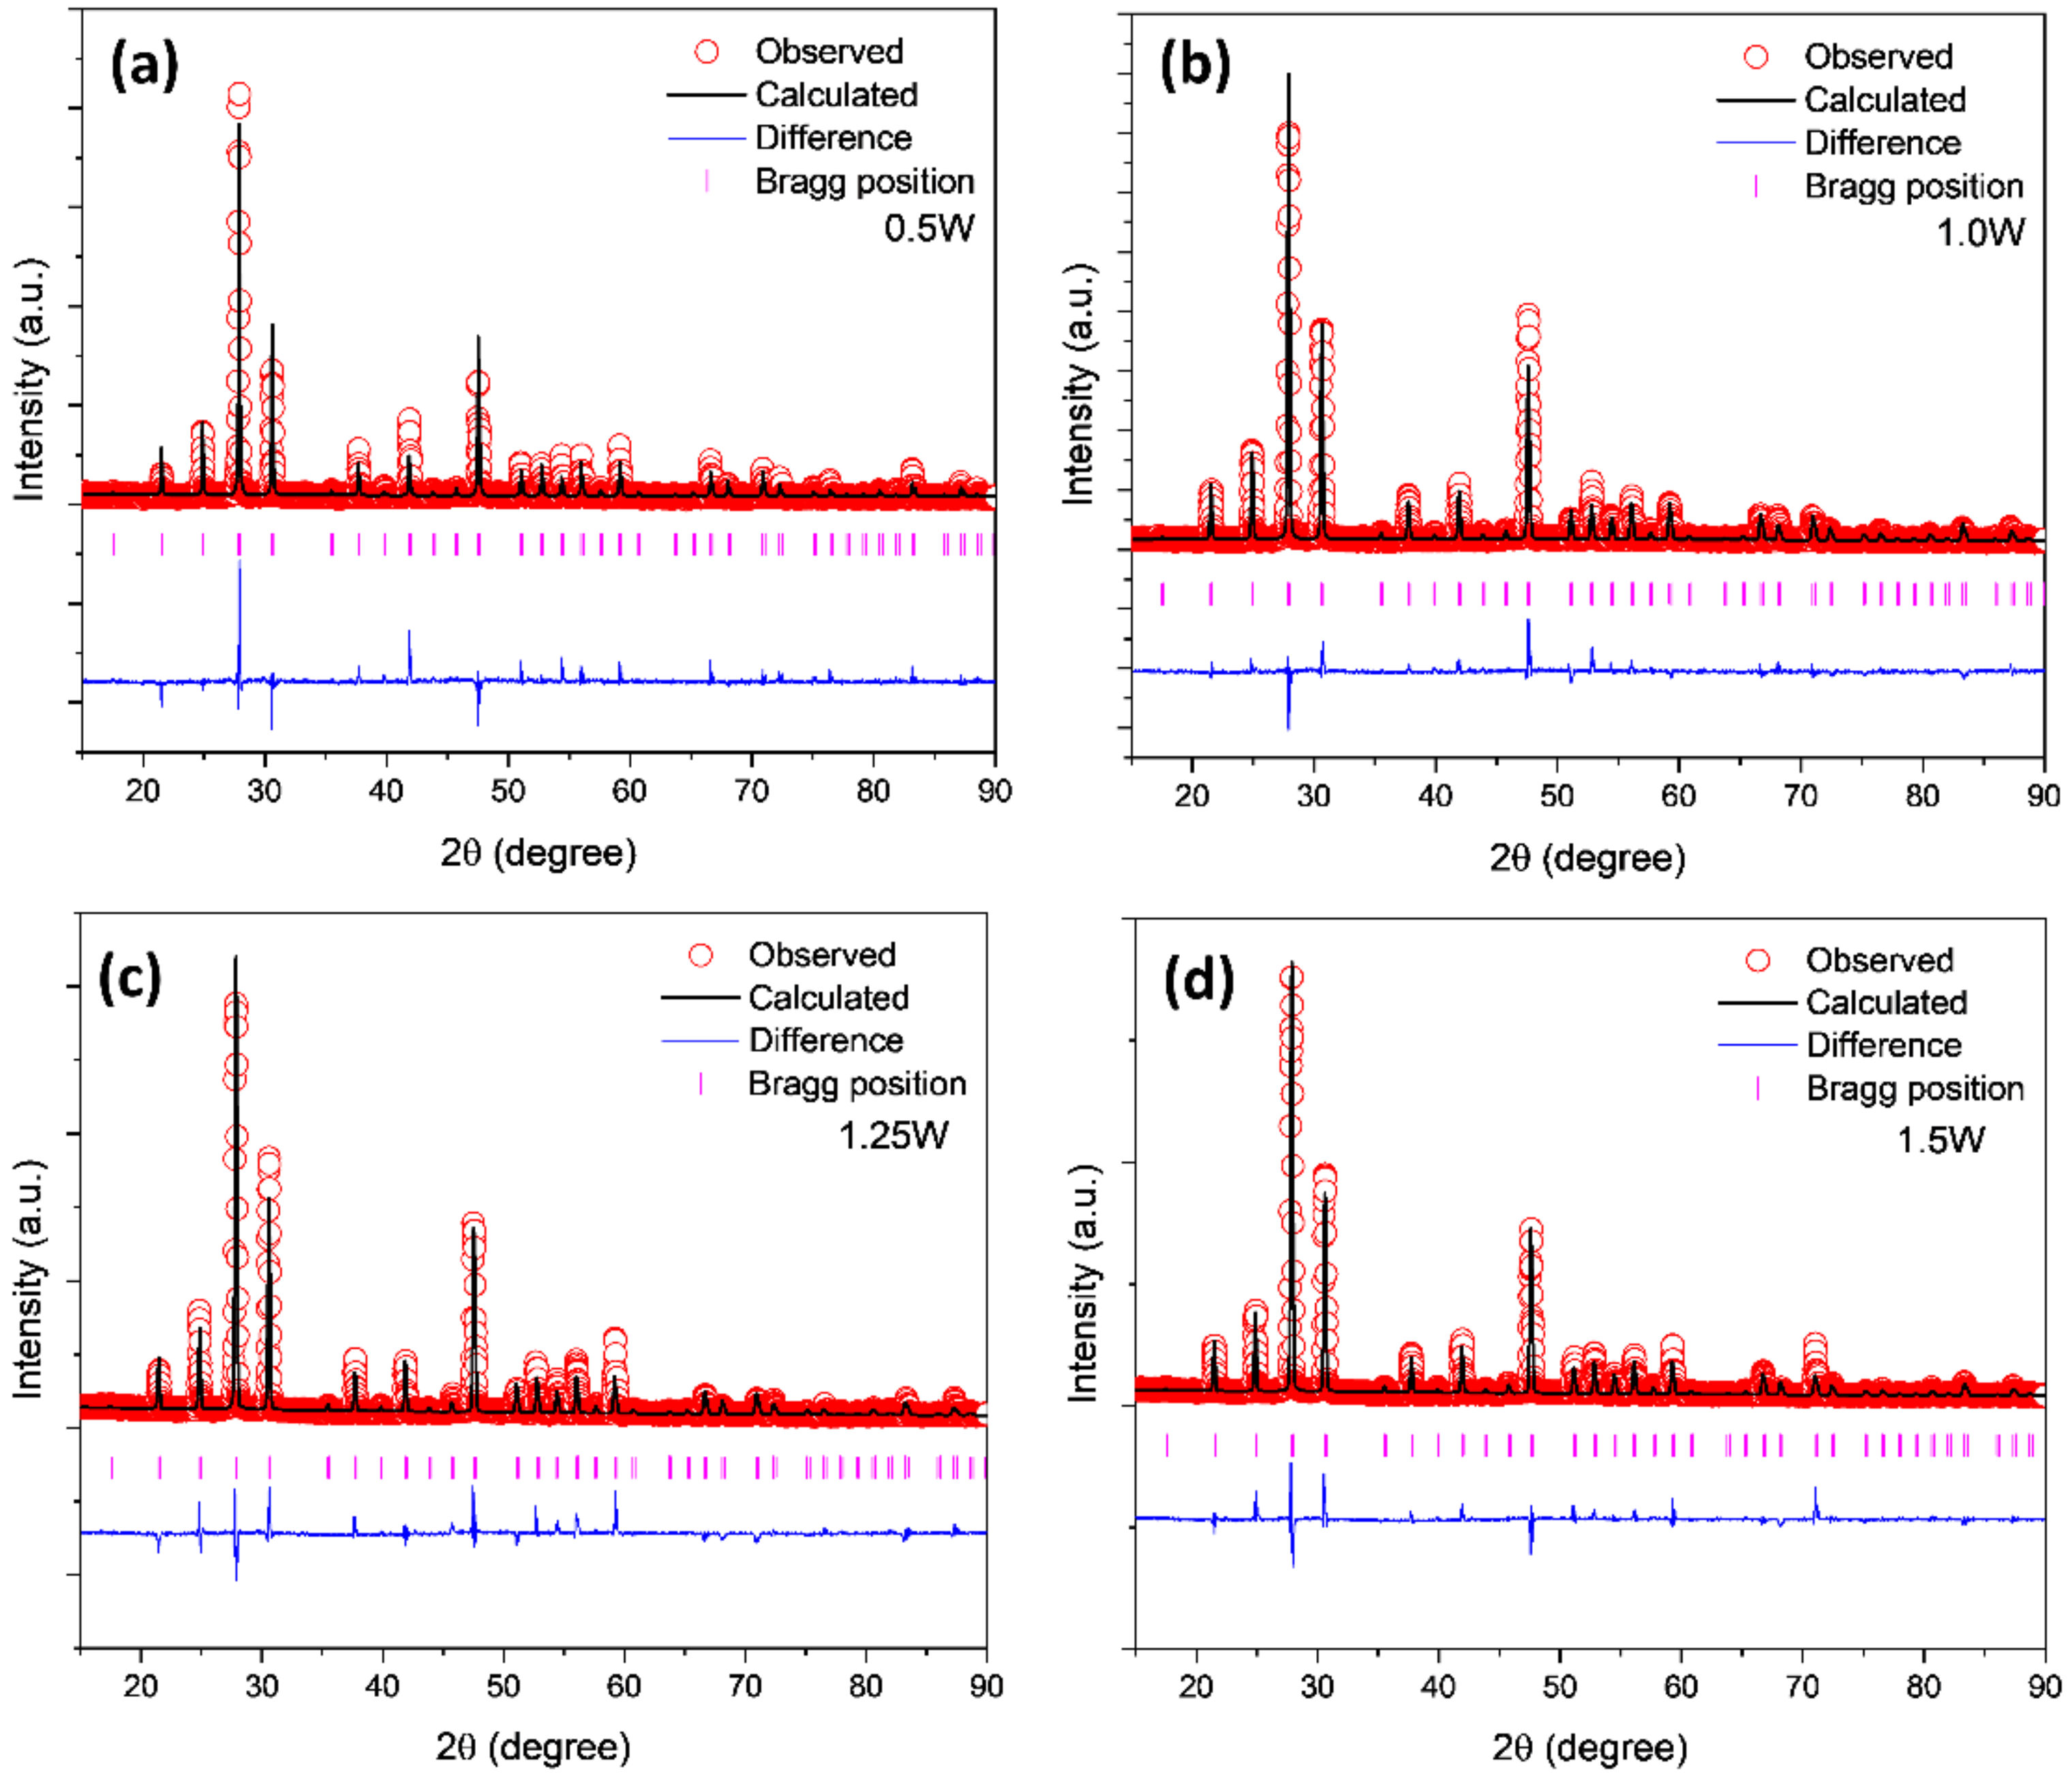
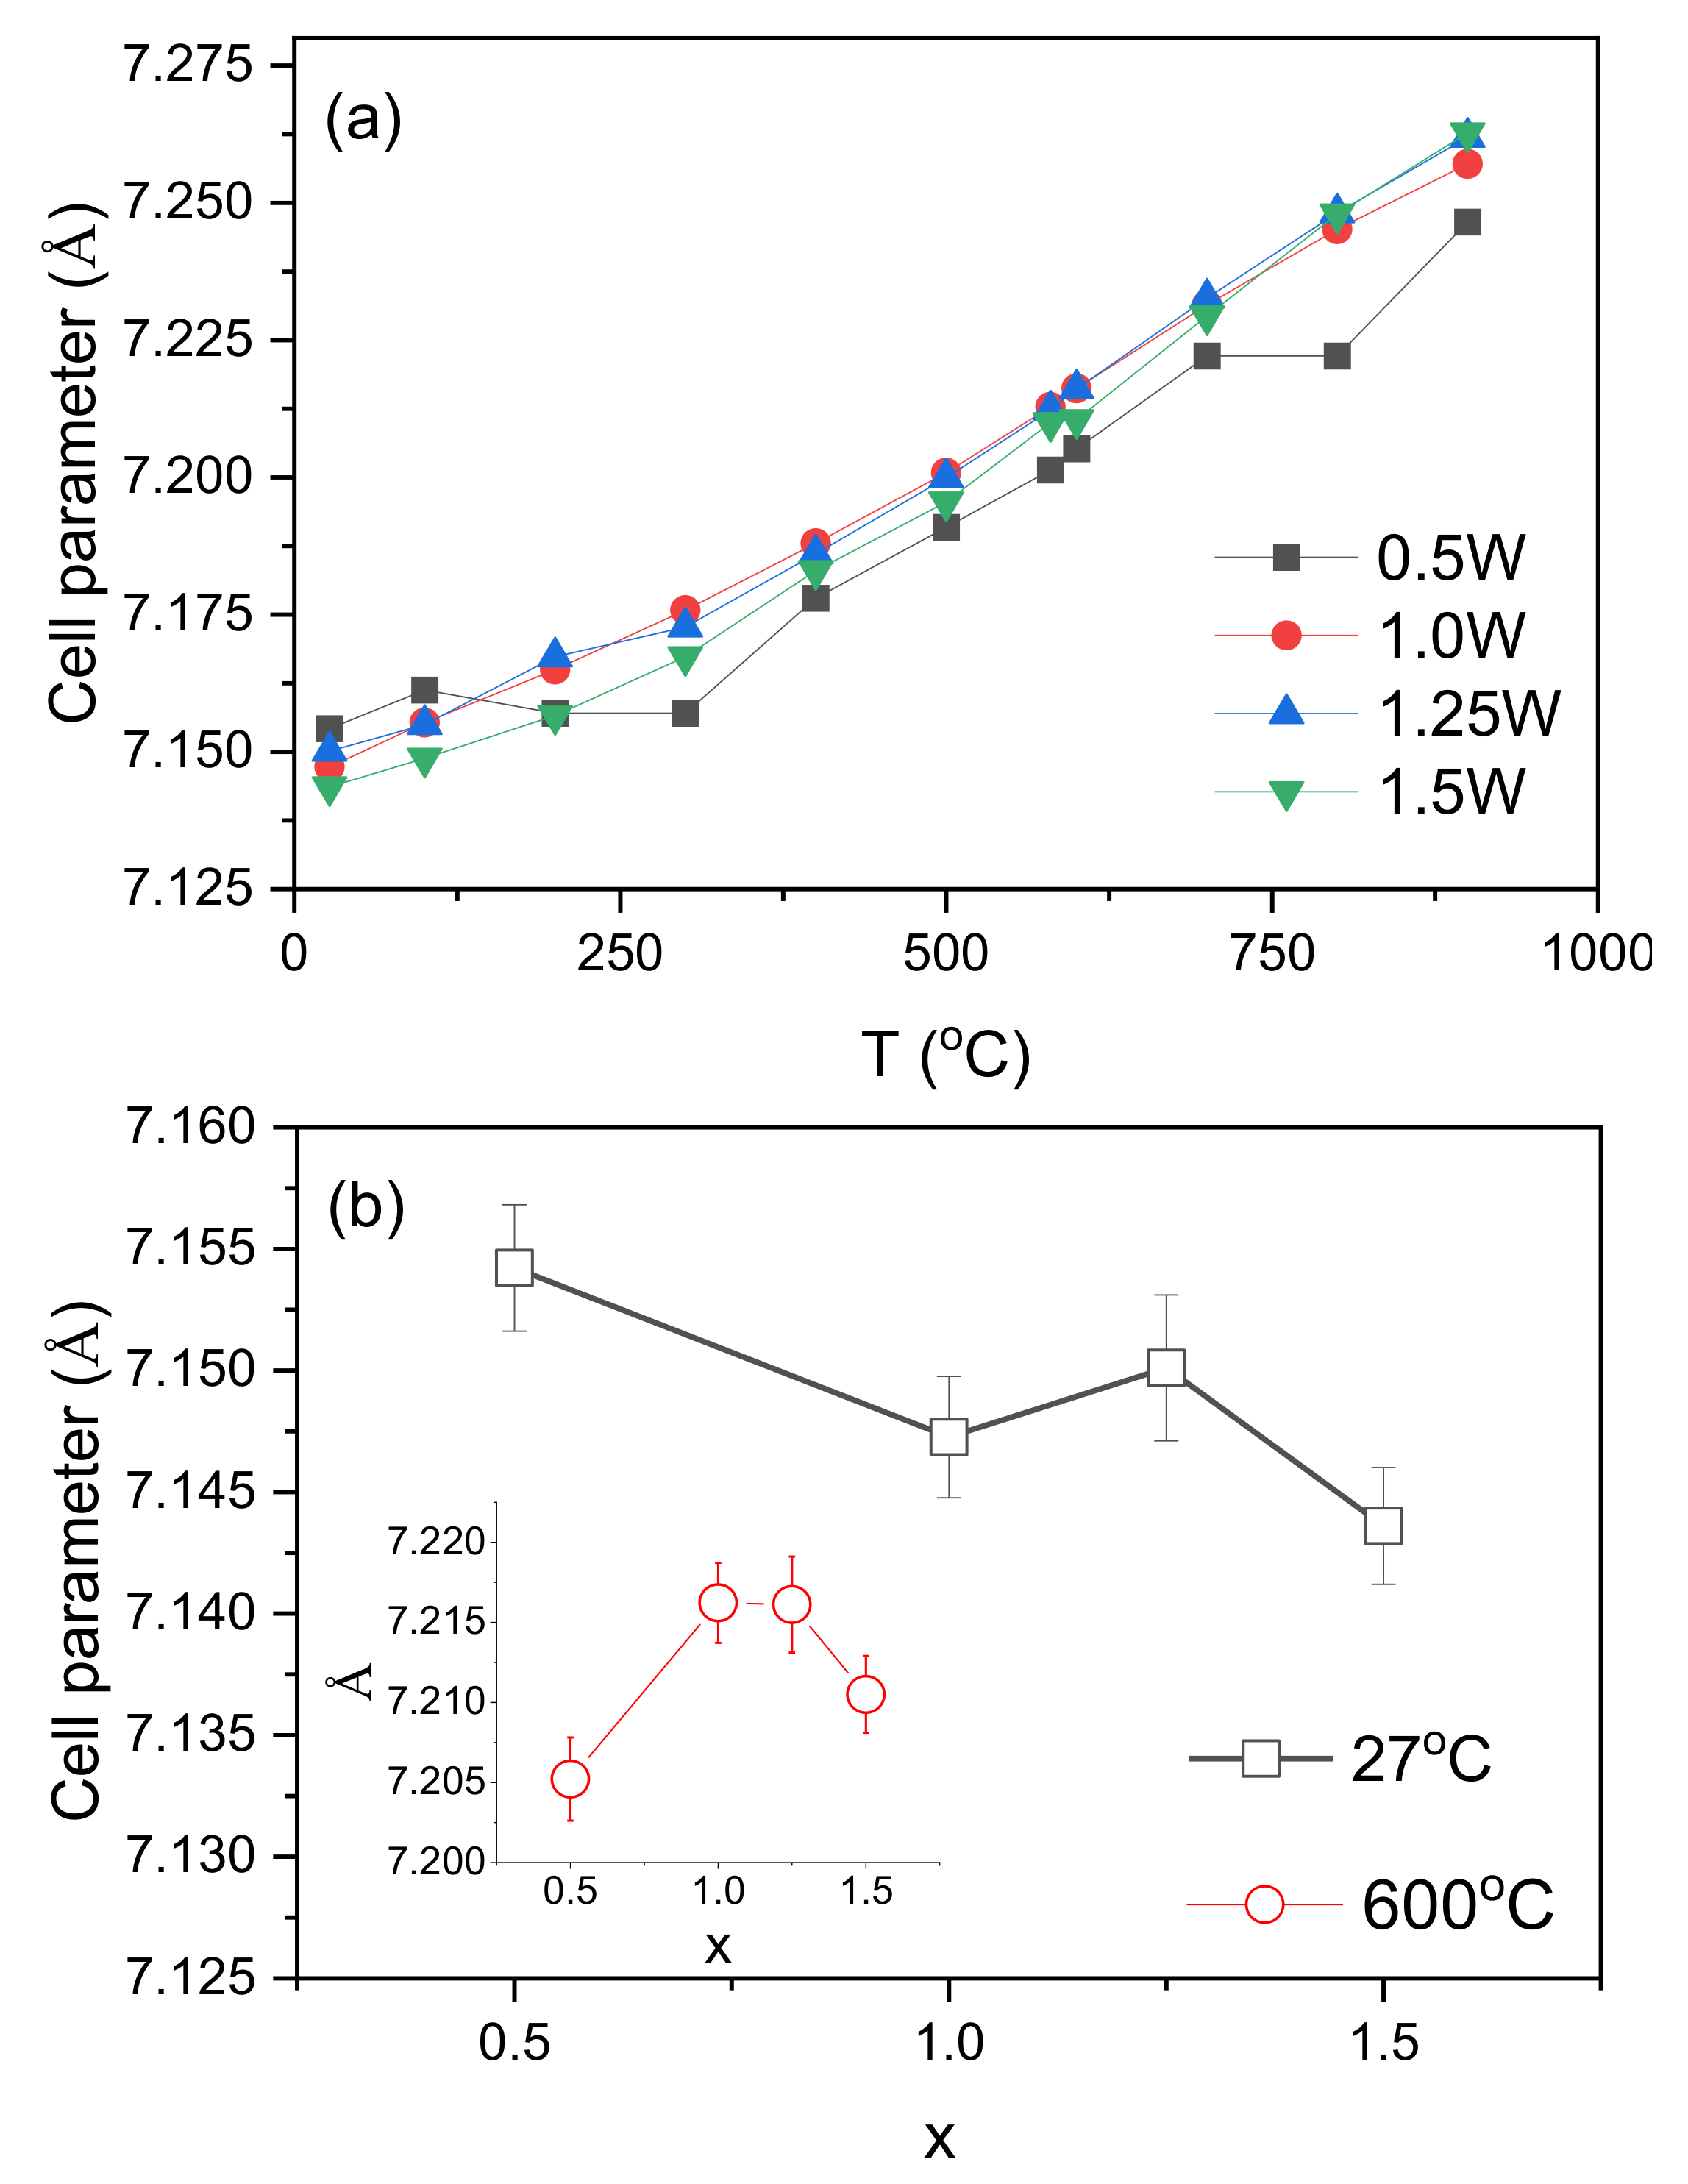
3.1. X-ray Diffraction
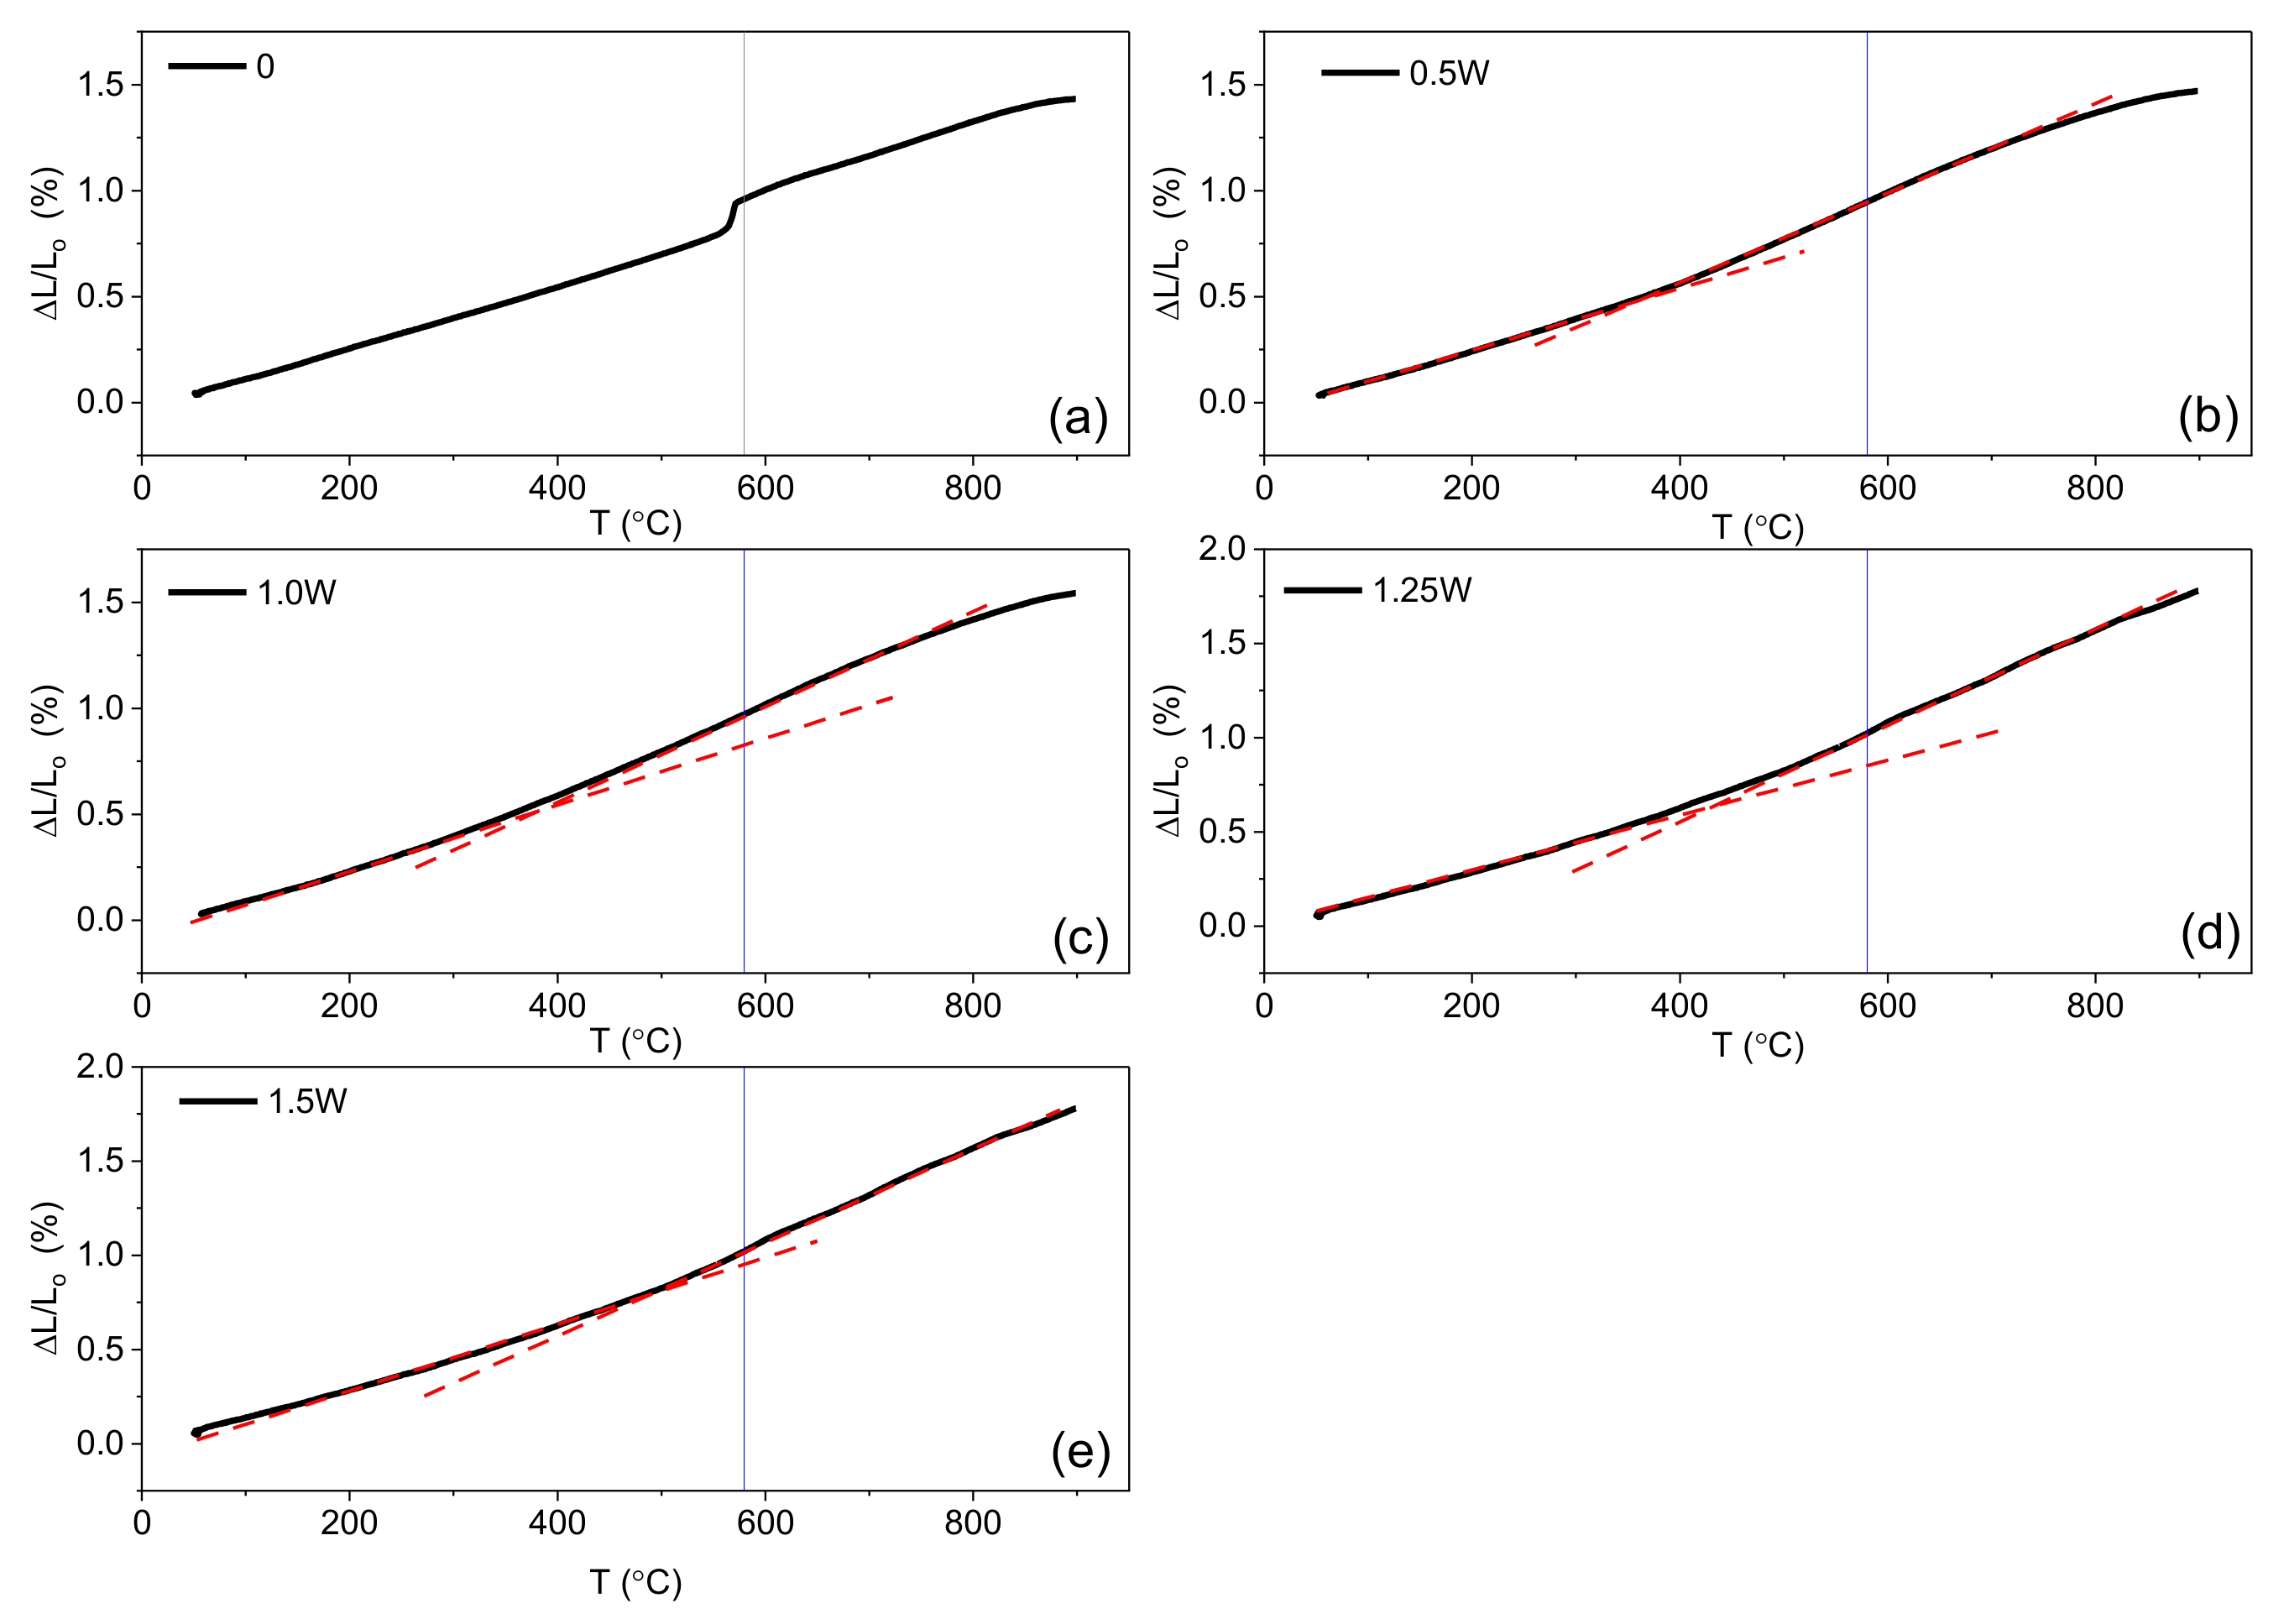
3.2. Dilatometry
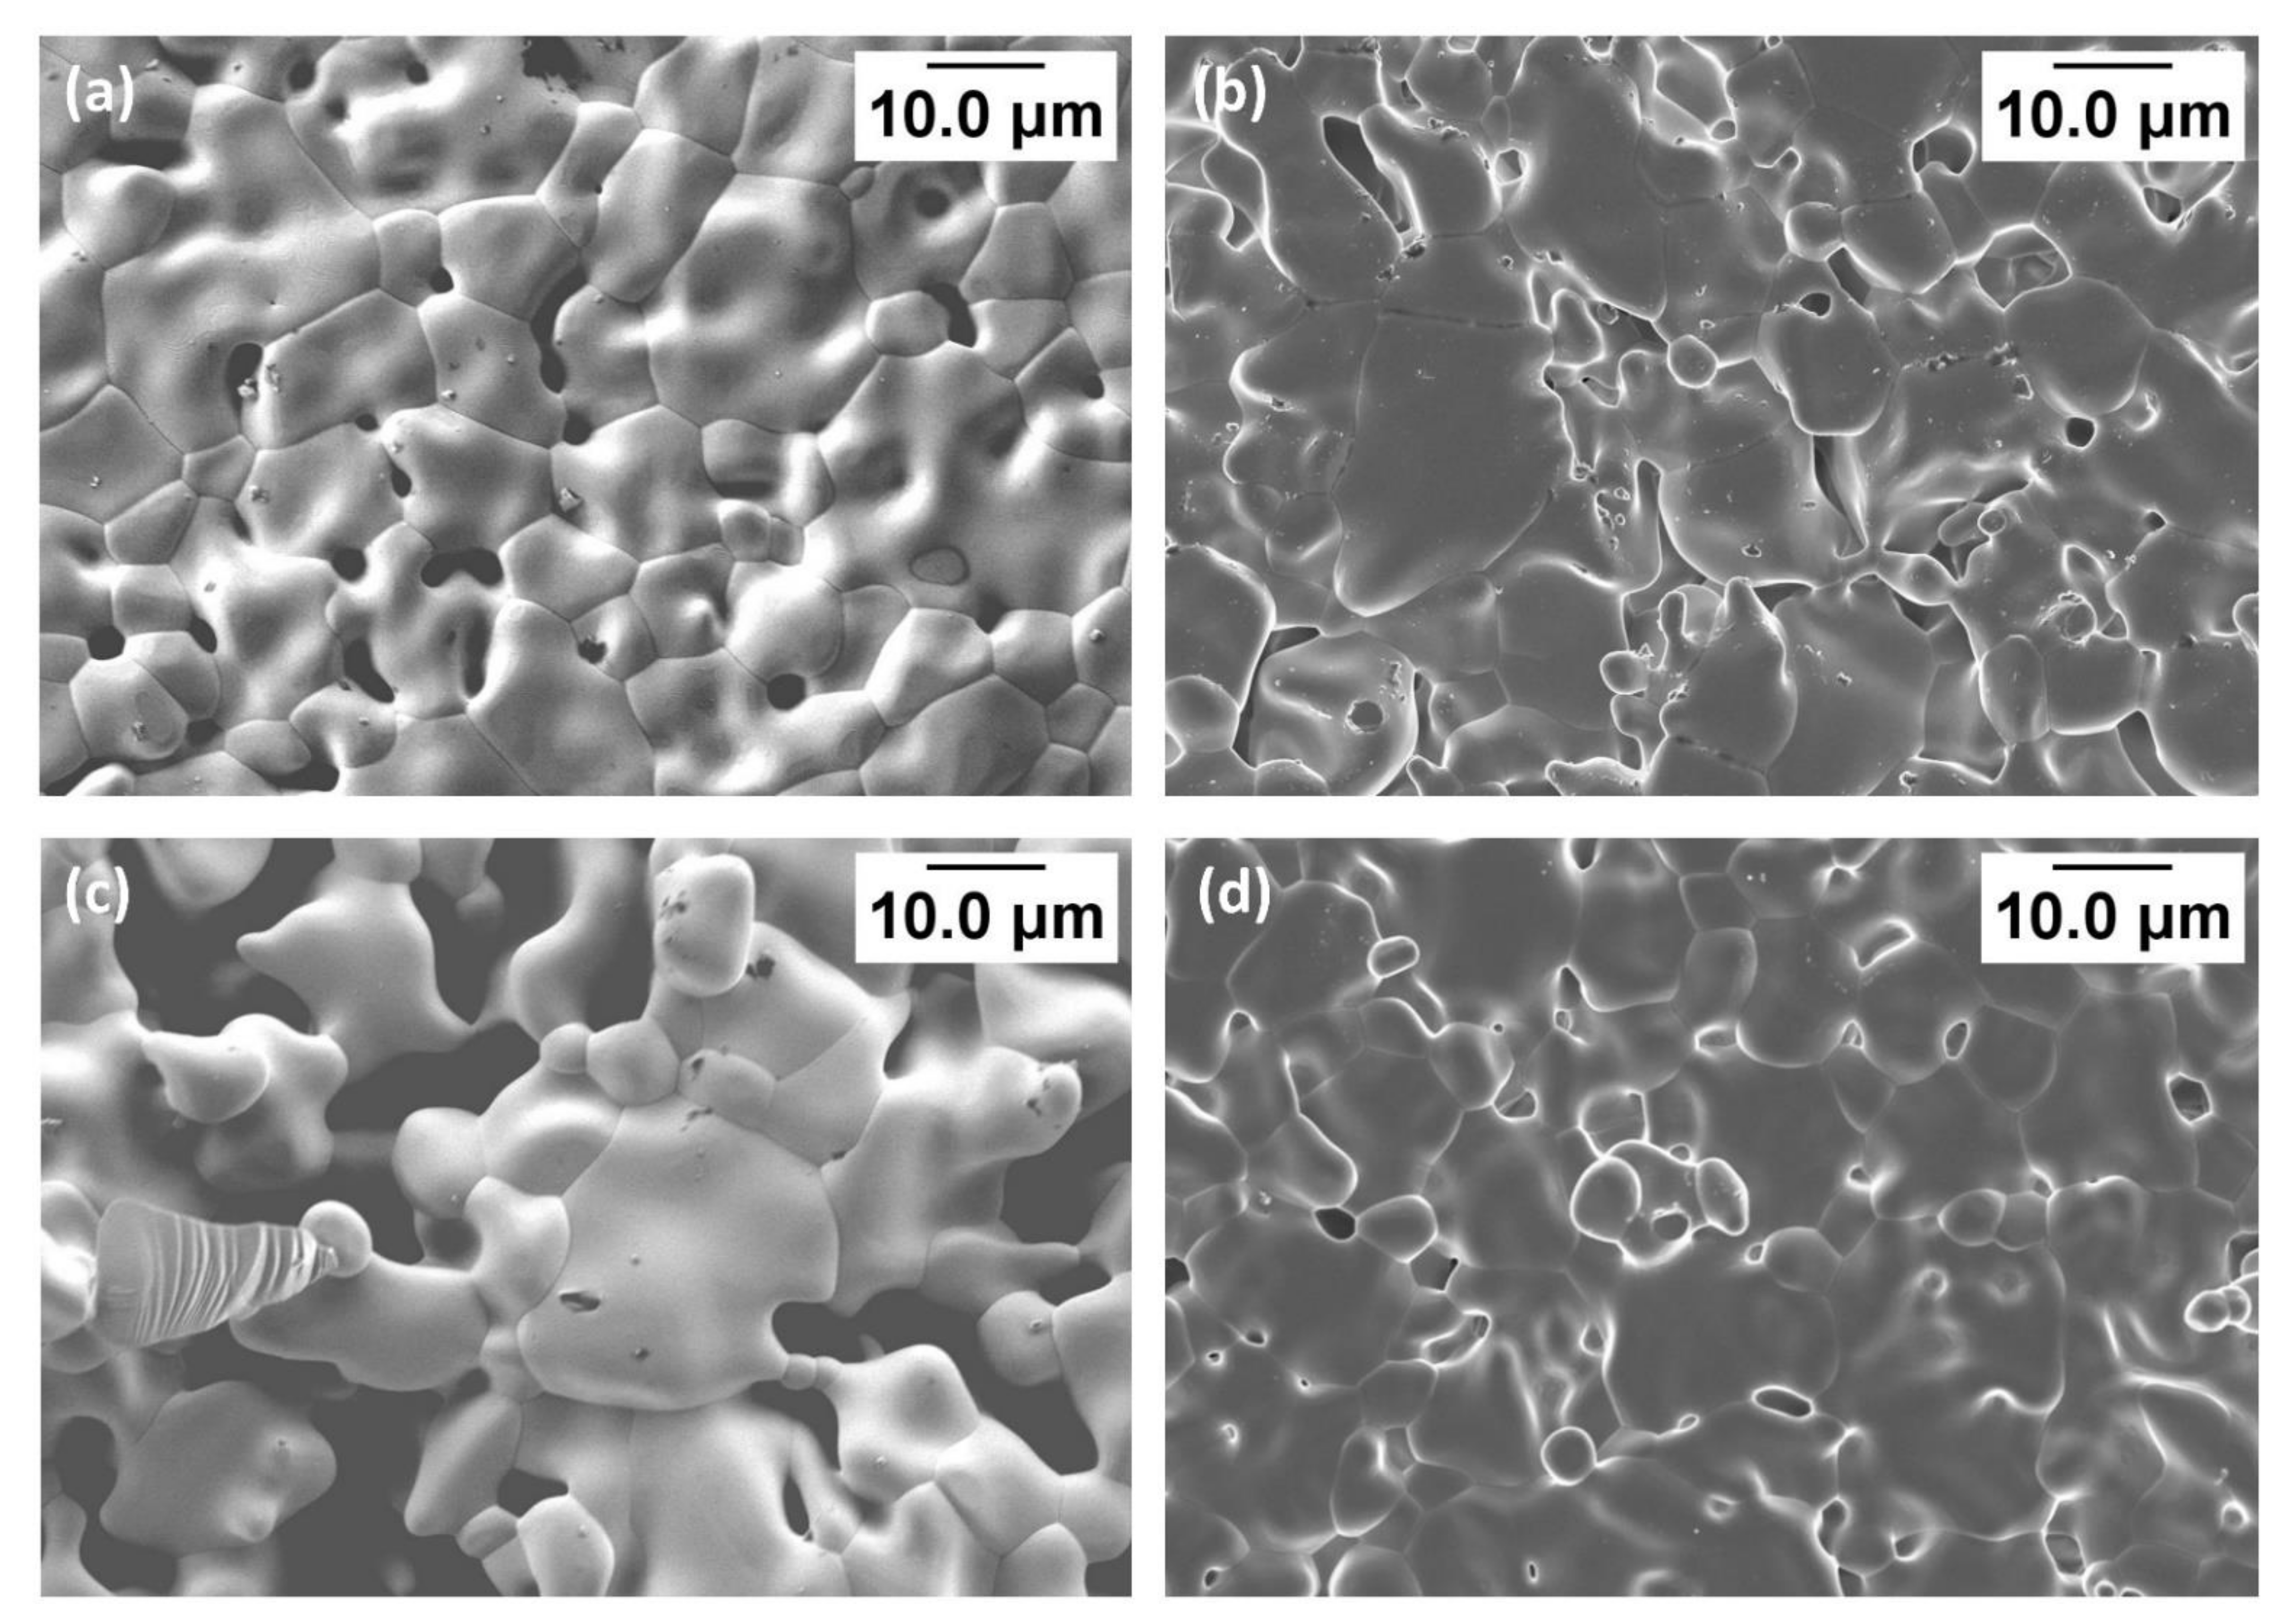
3.3. Microstructure
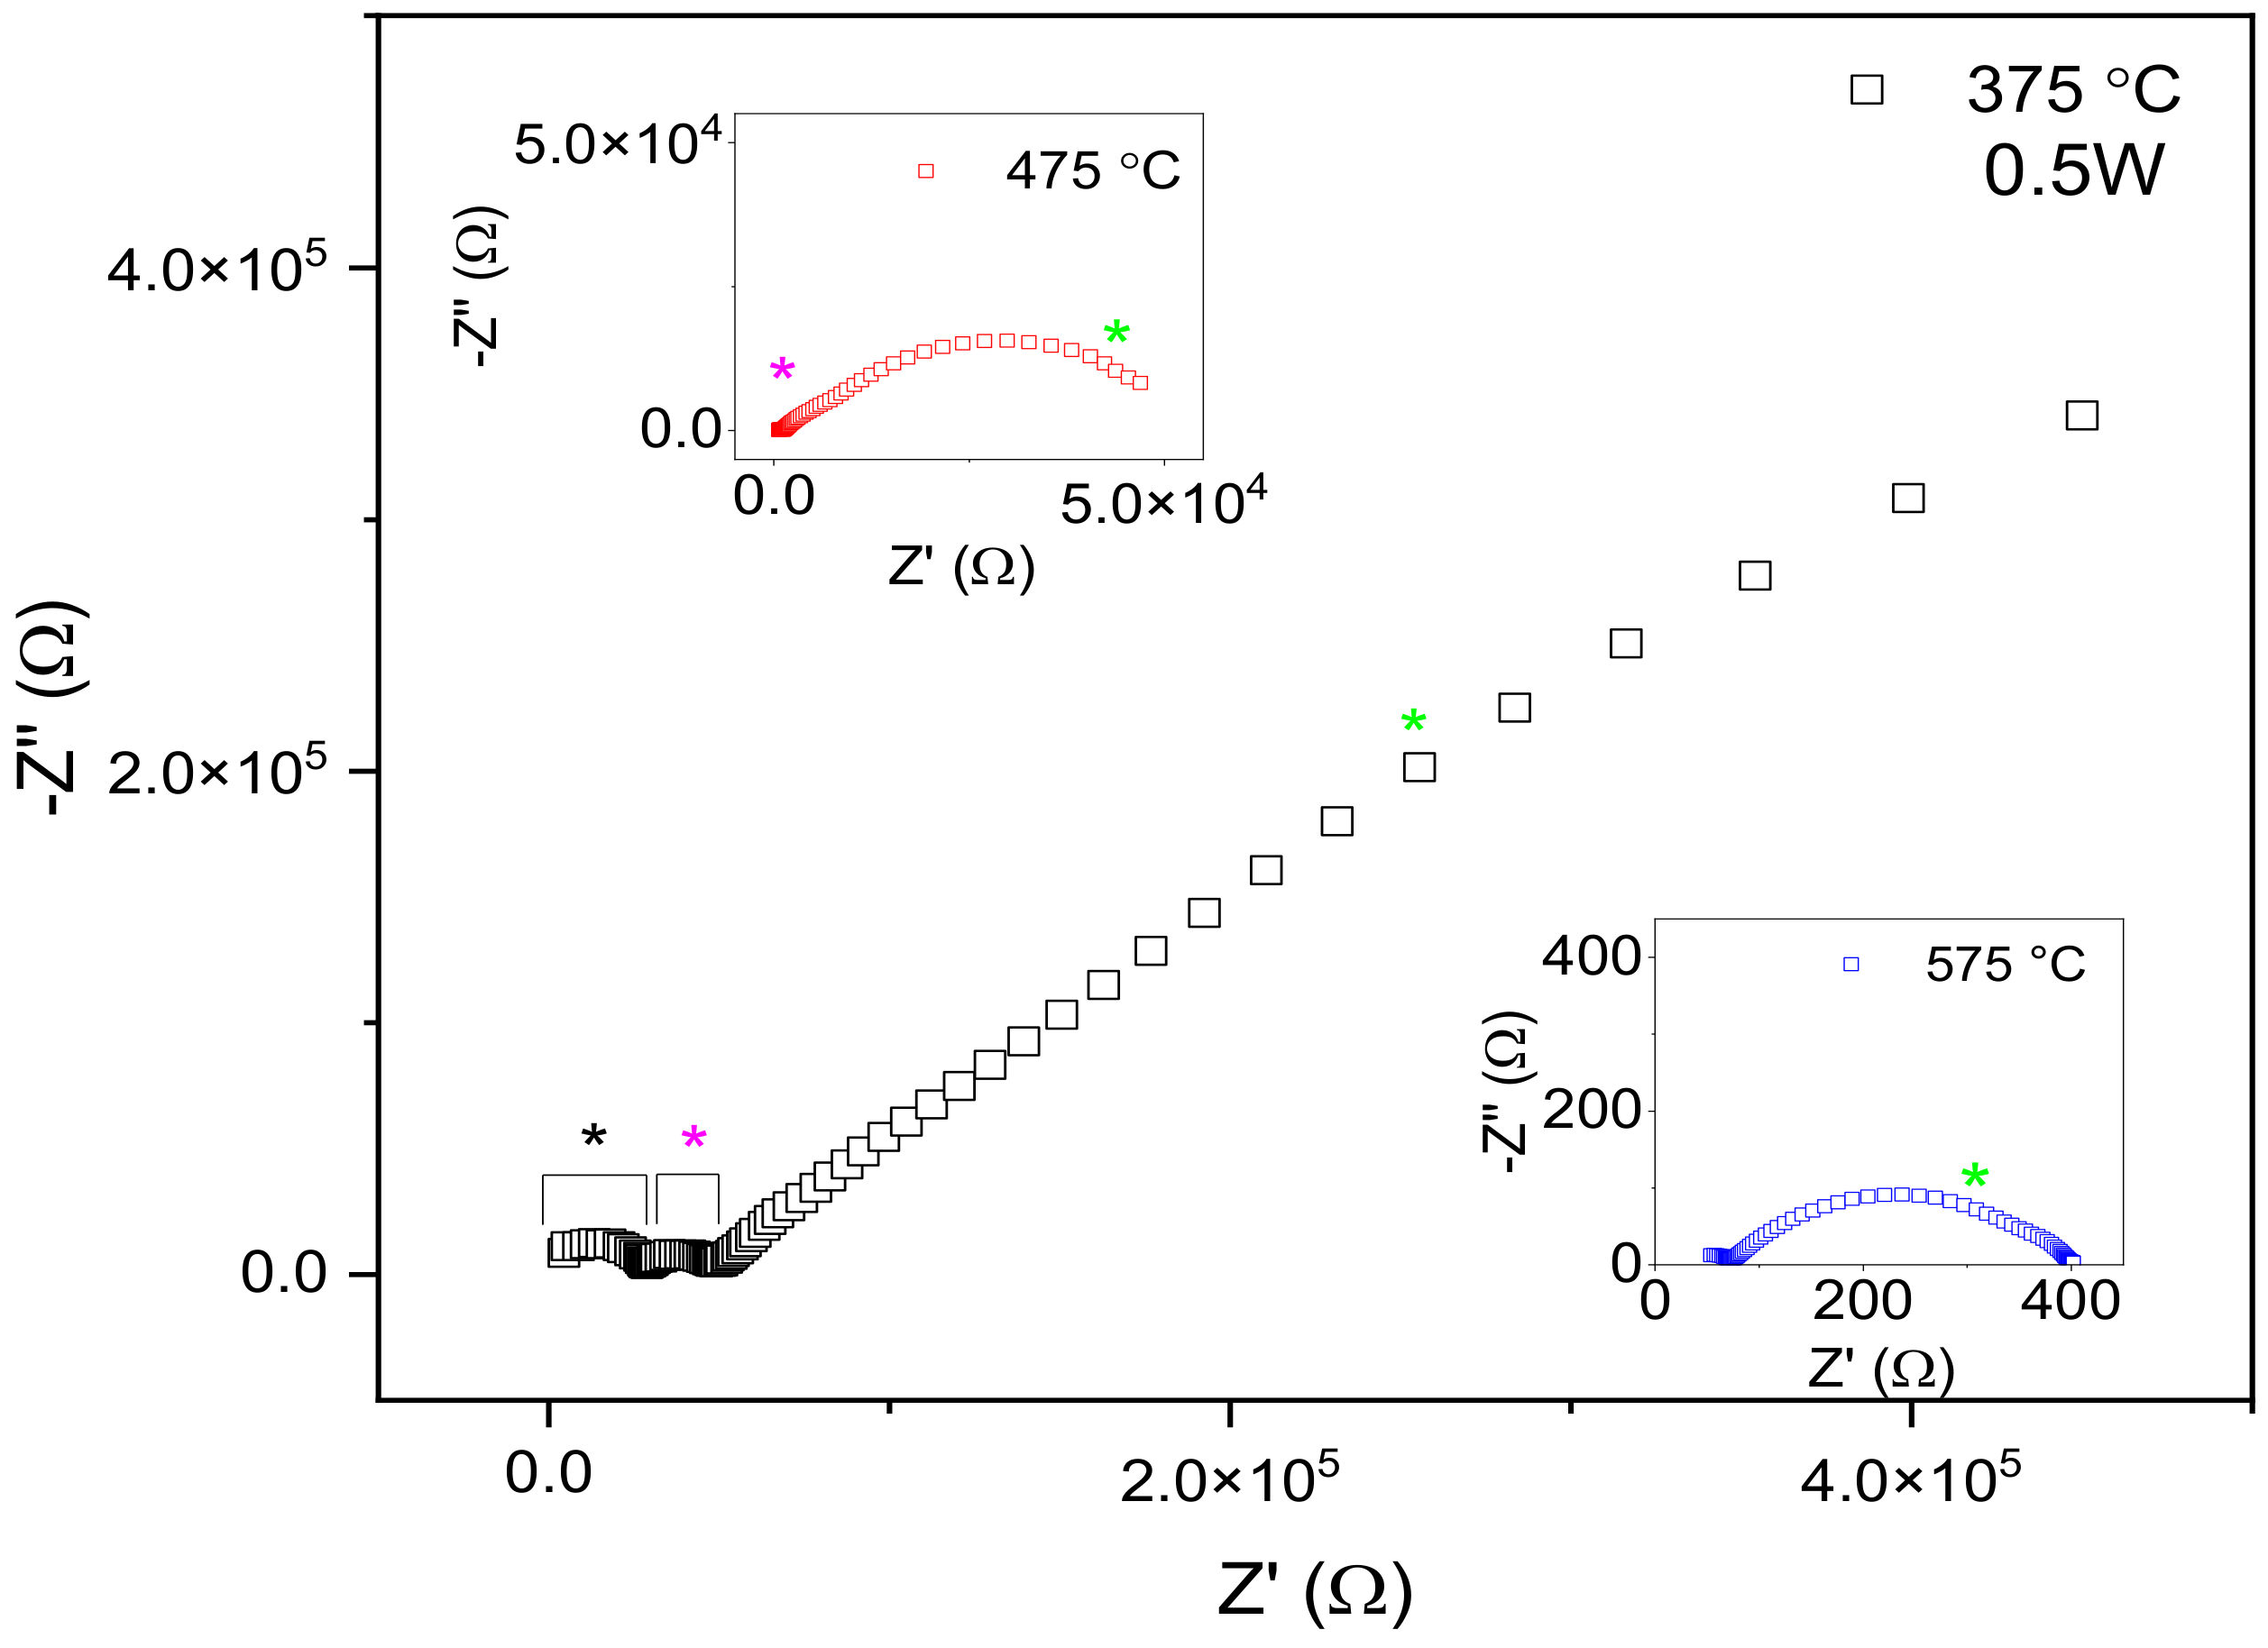
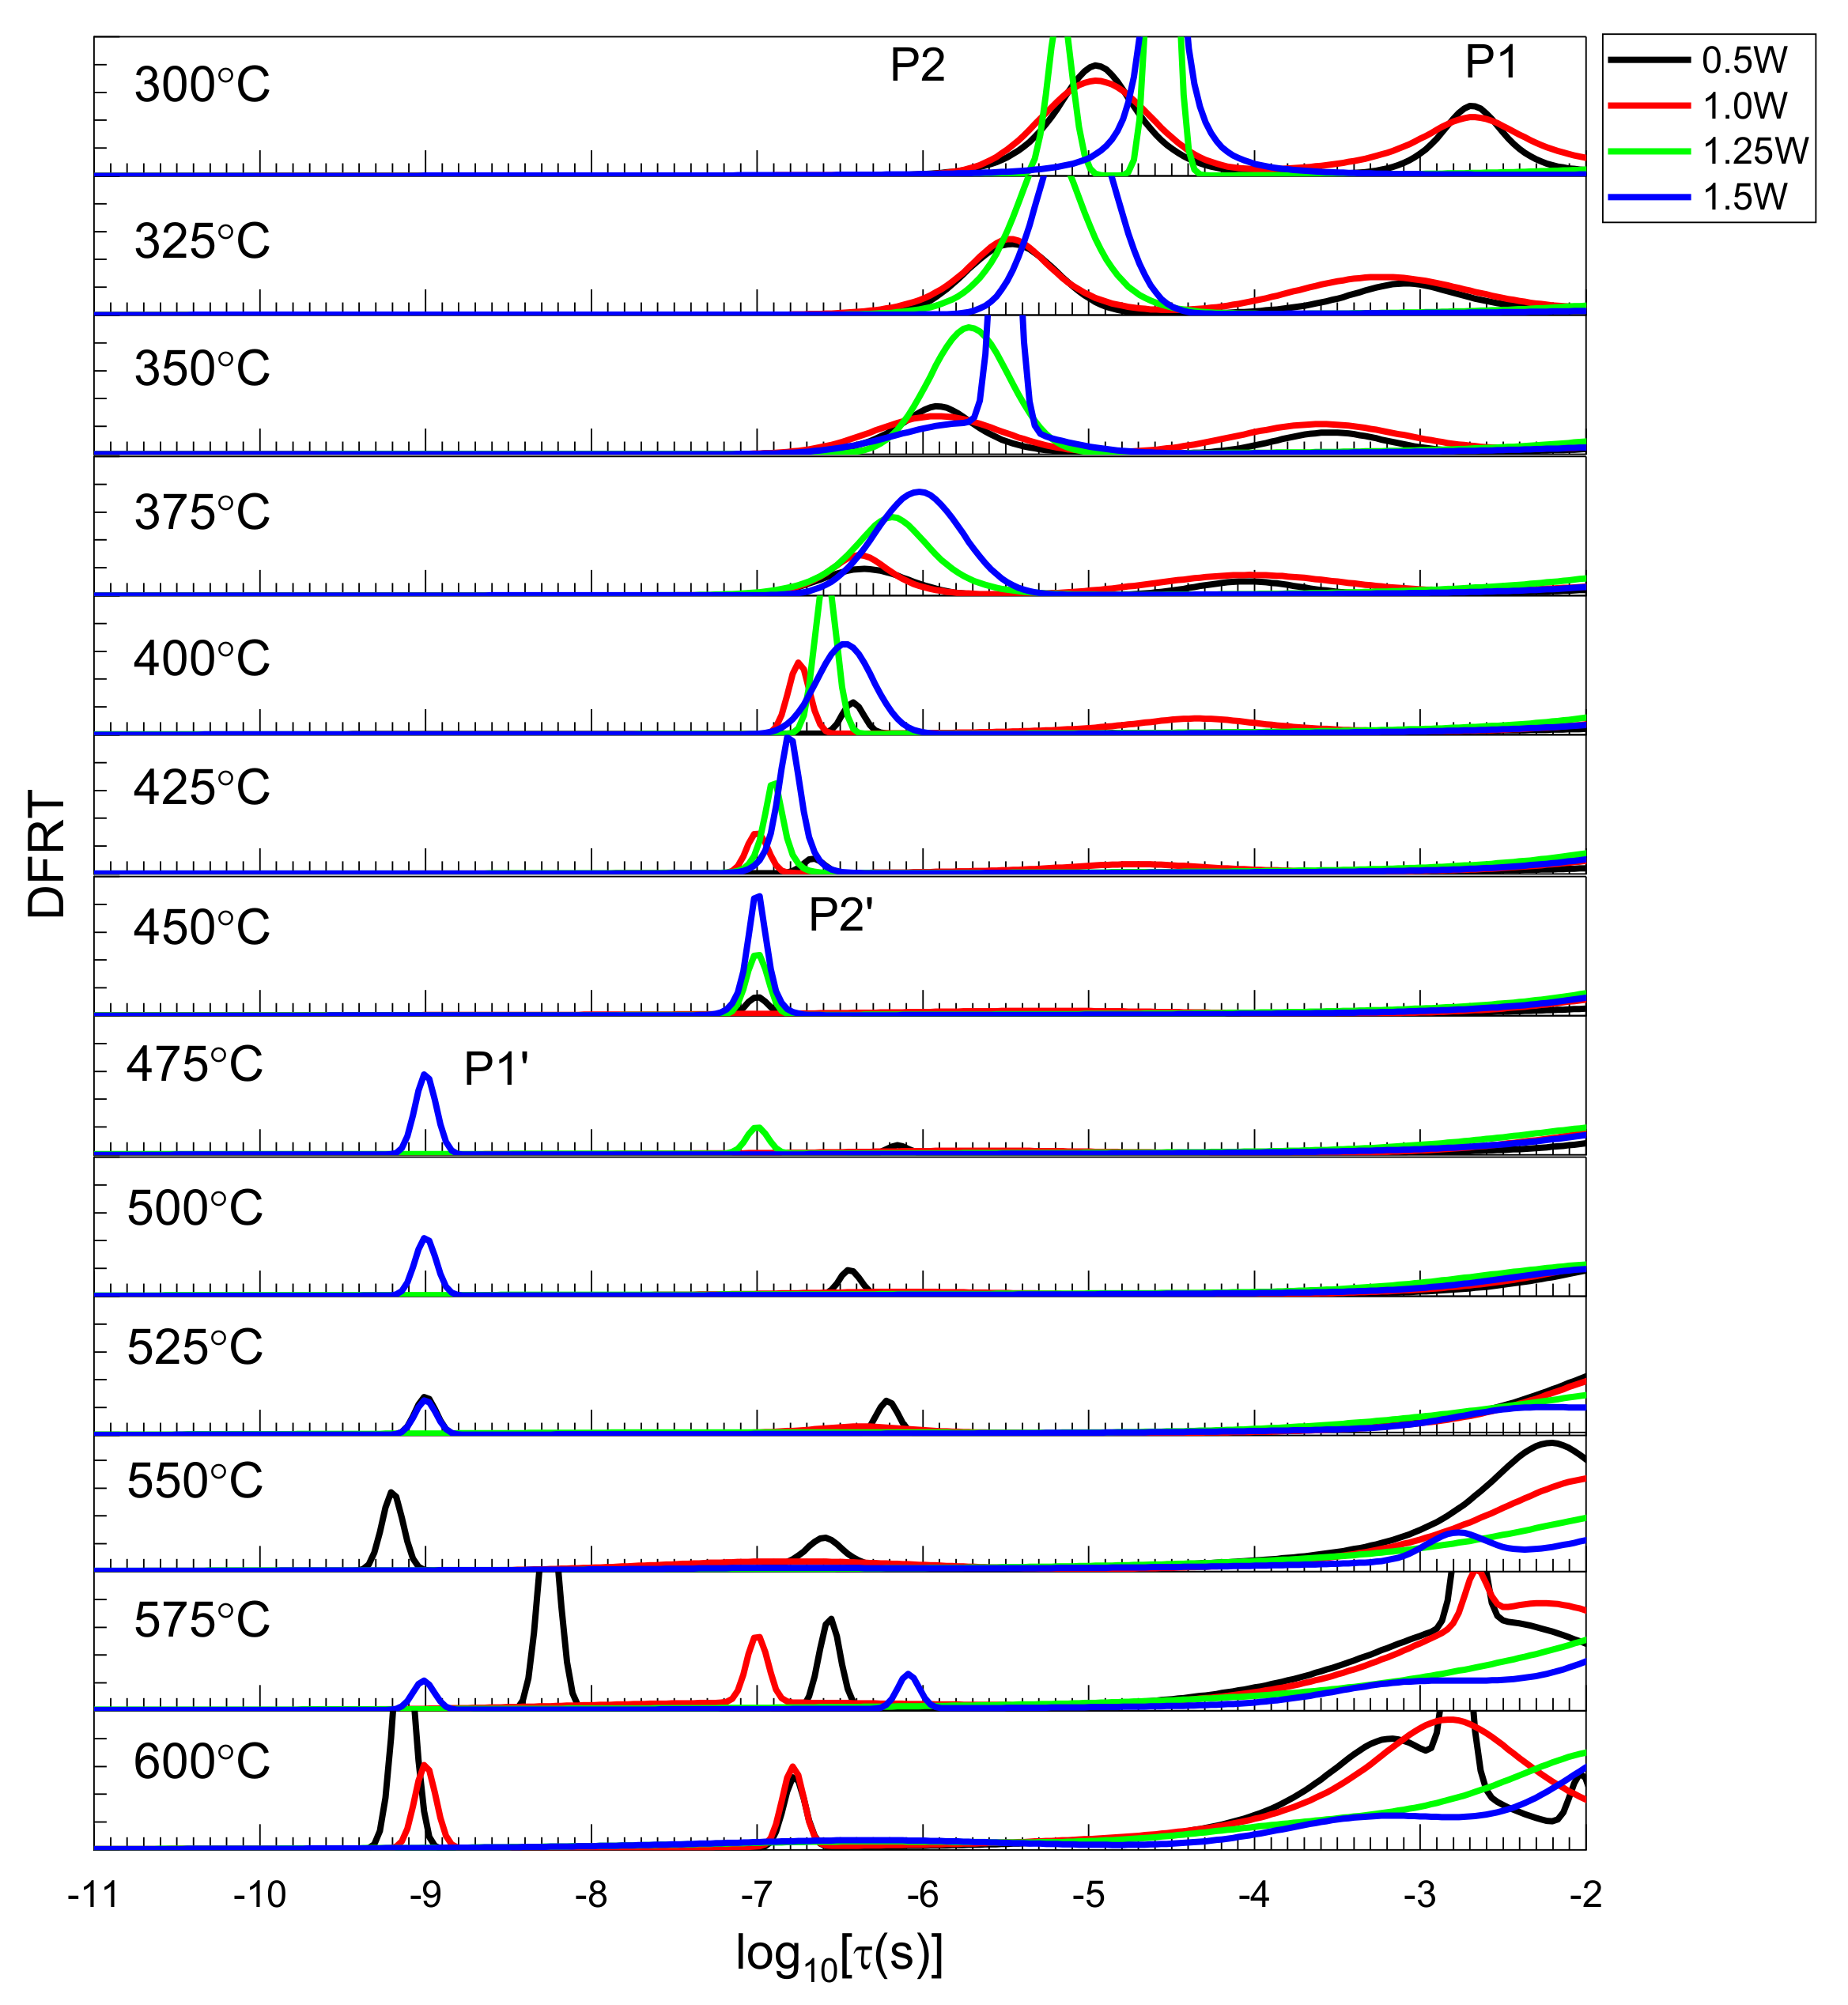
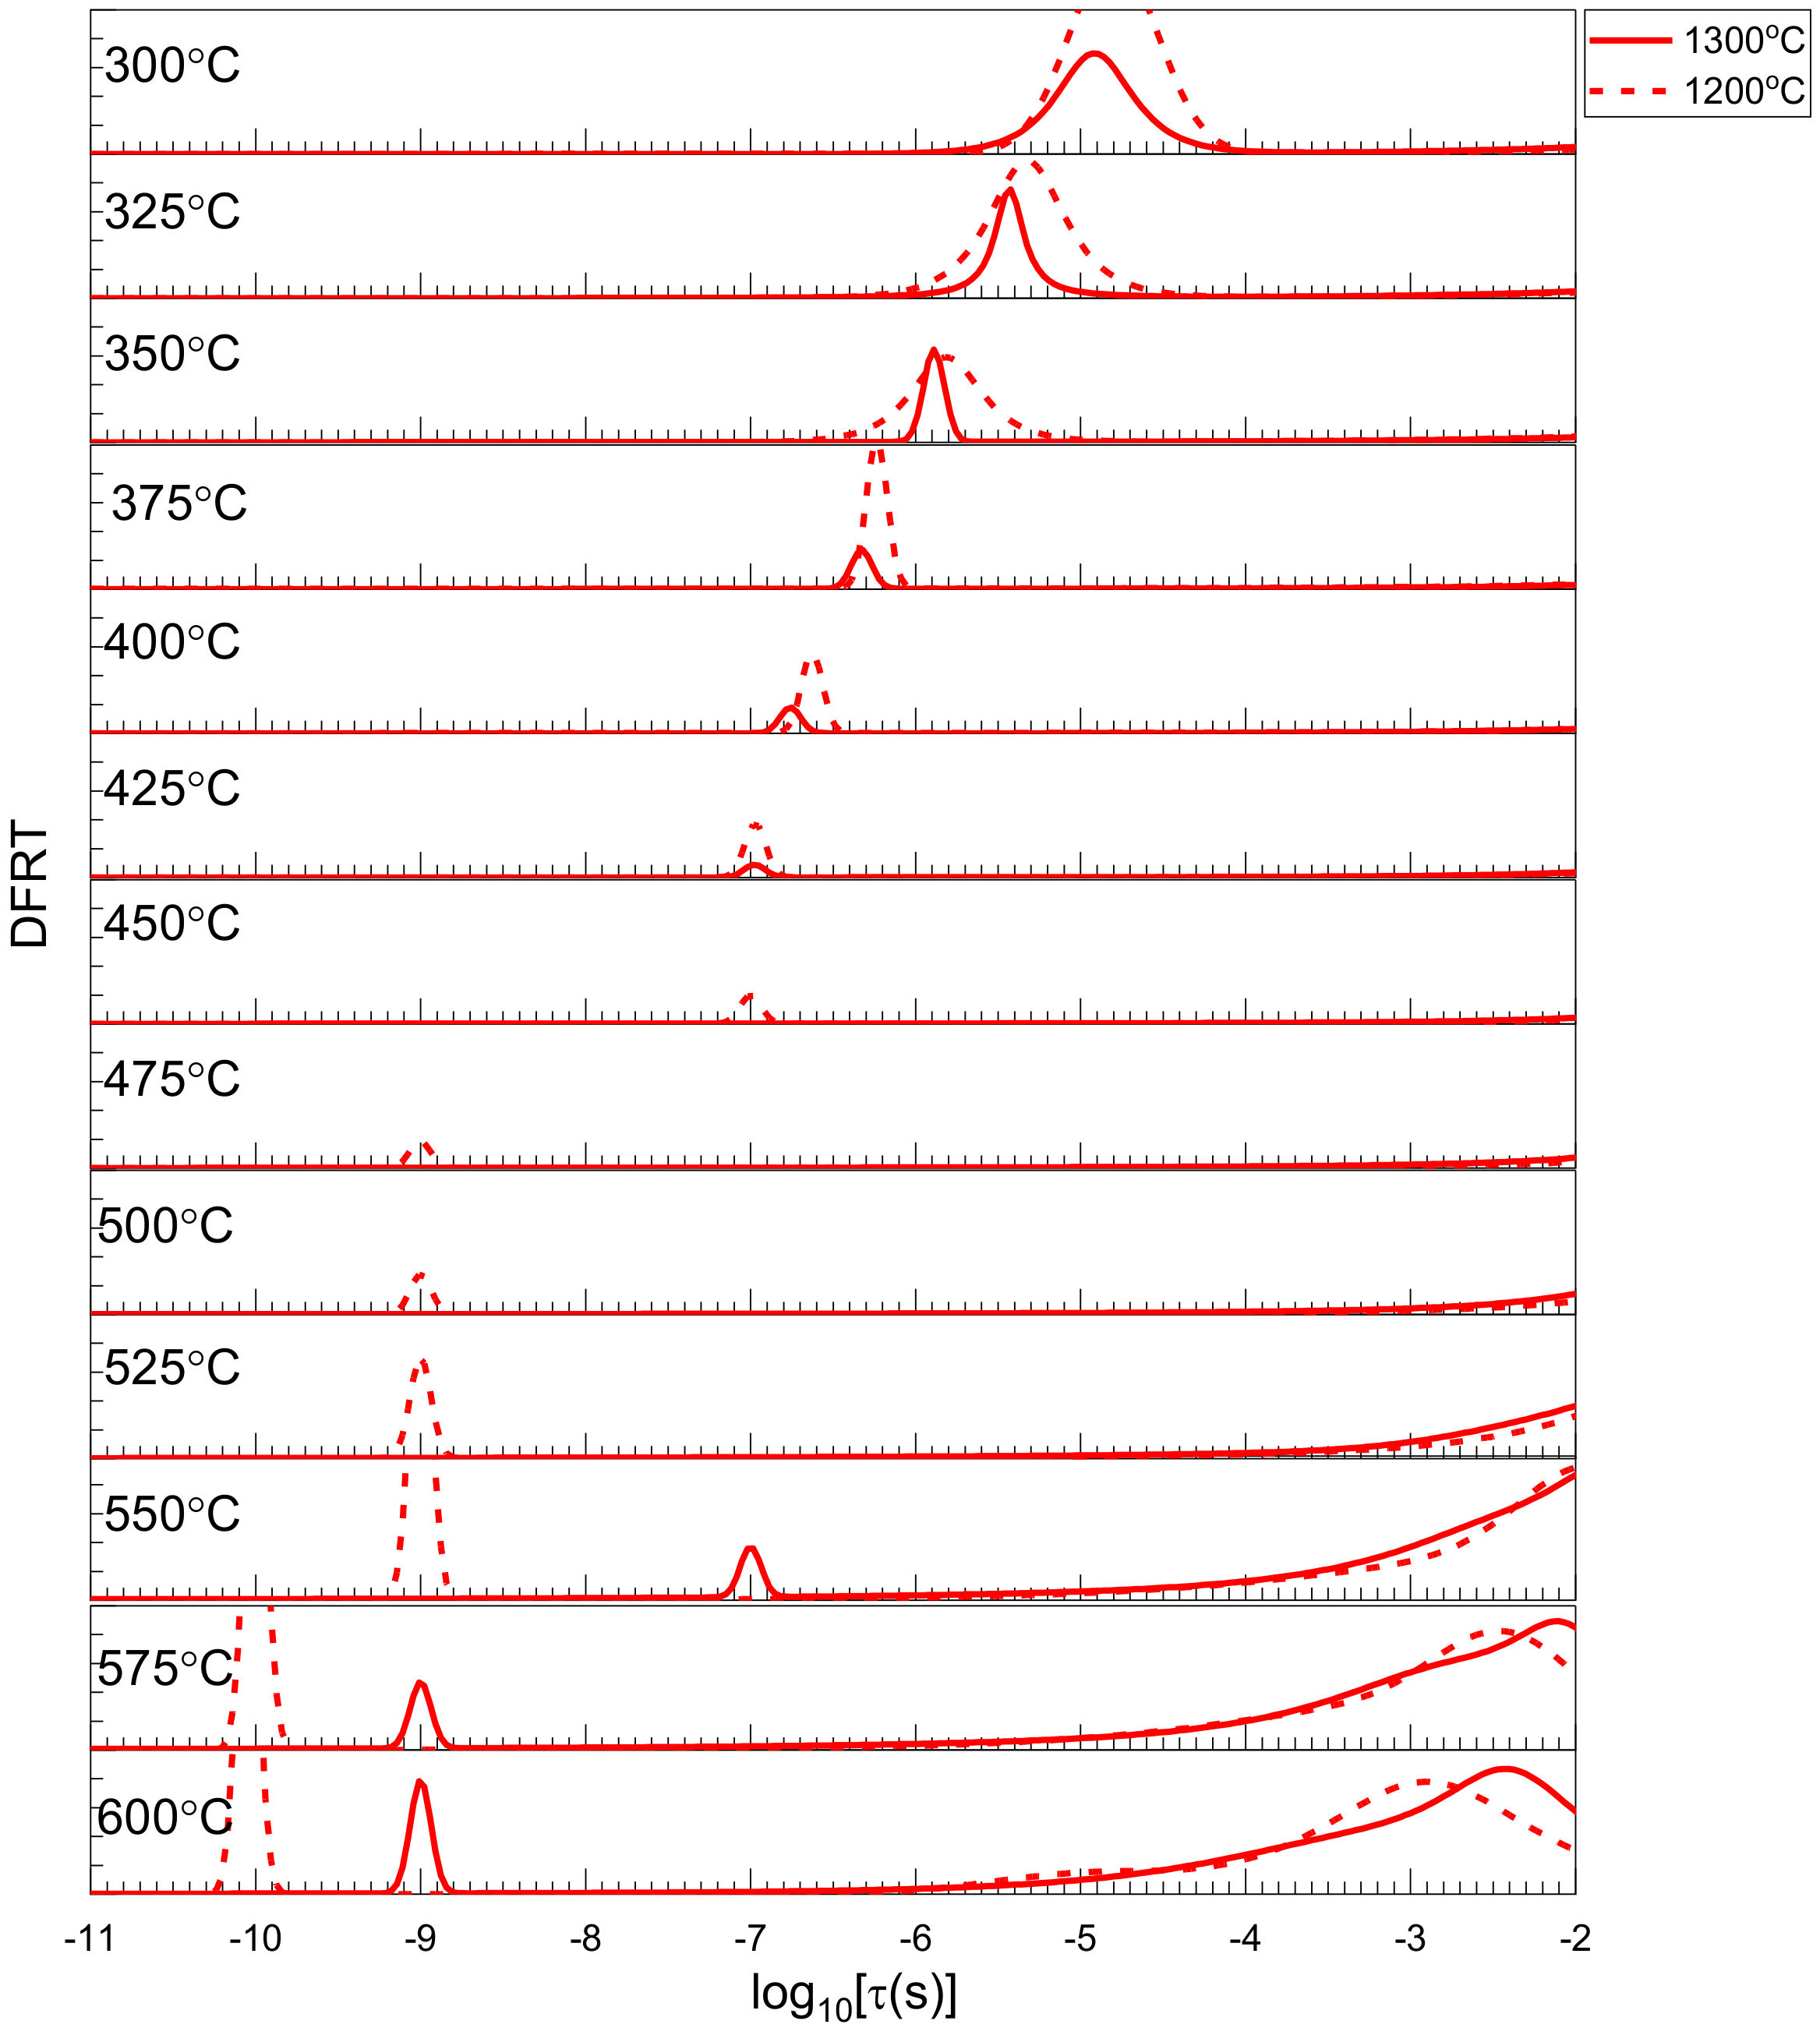
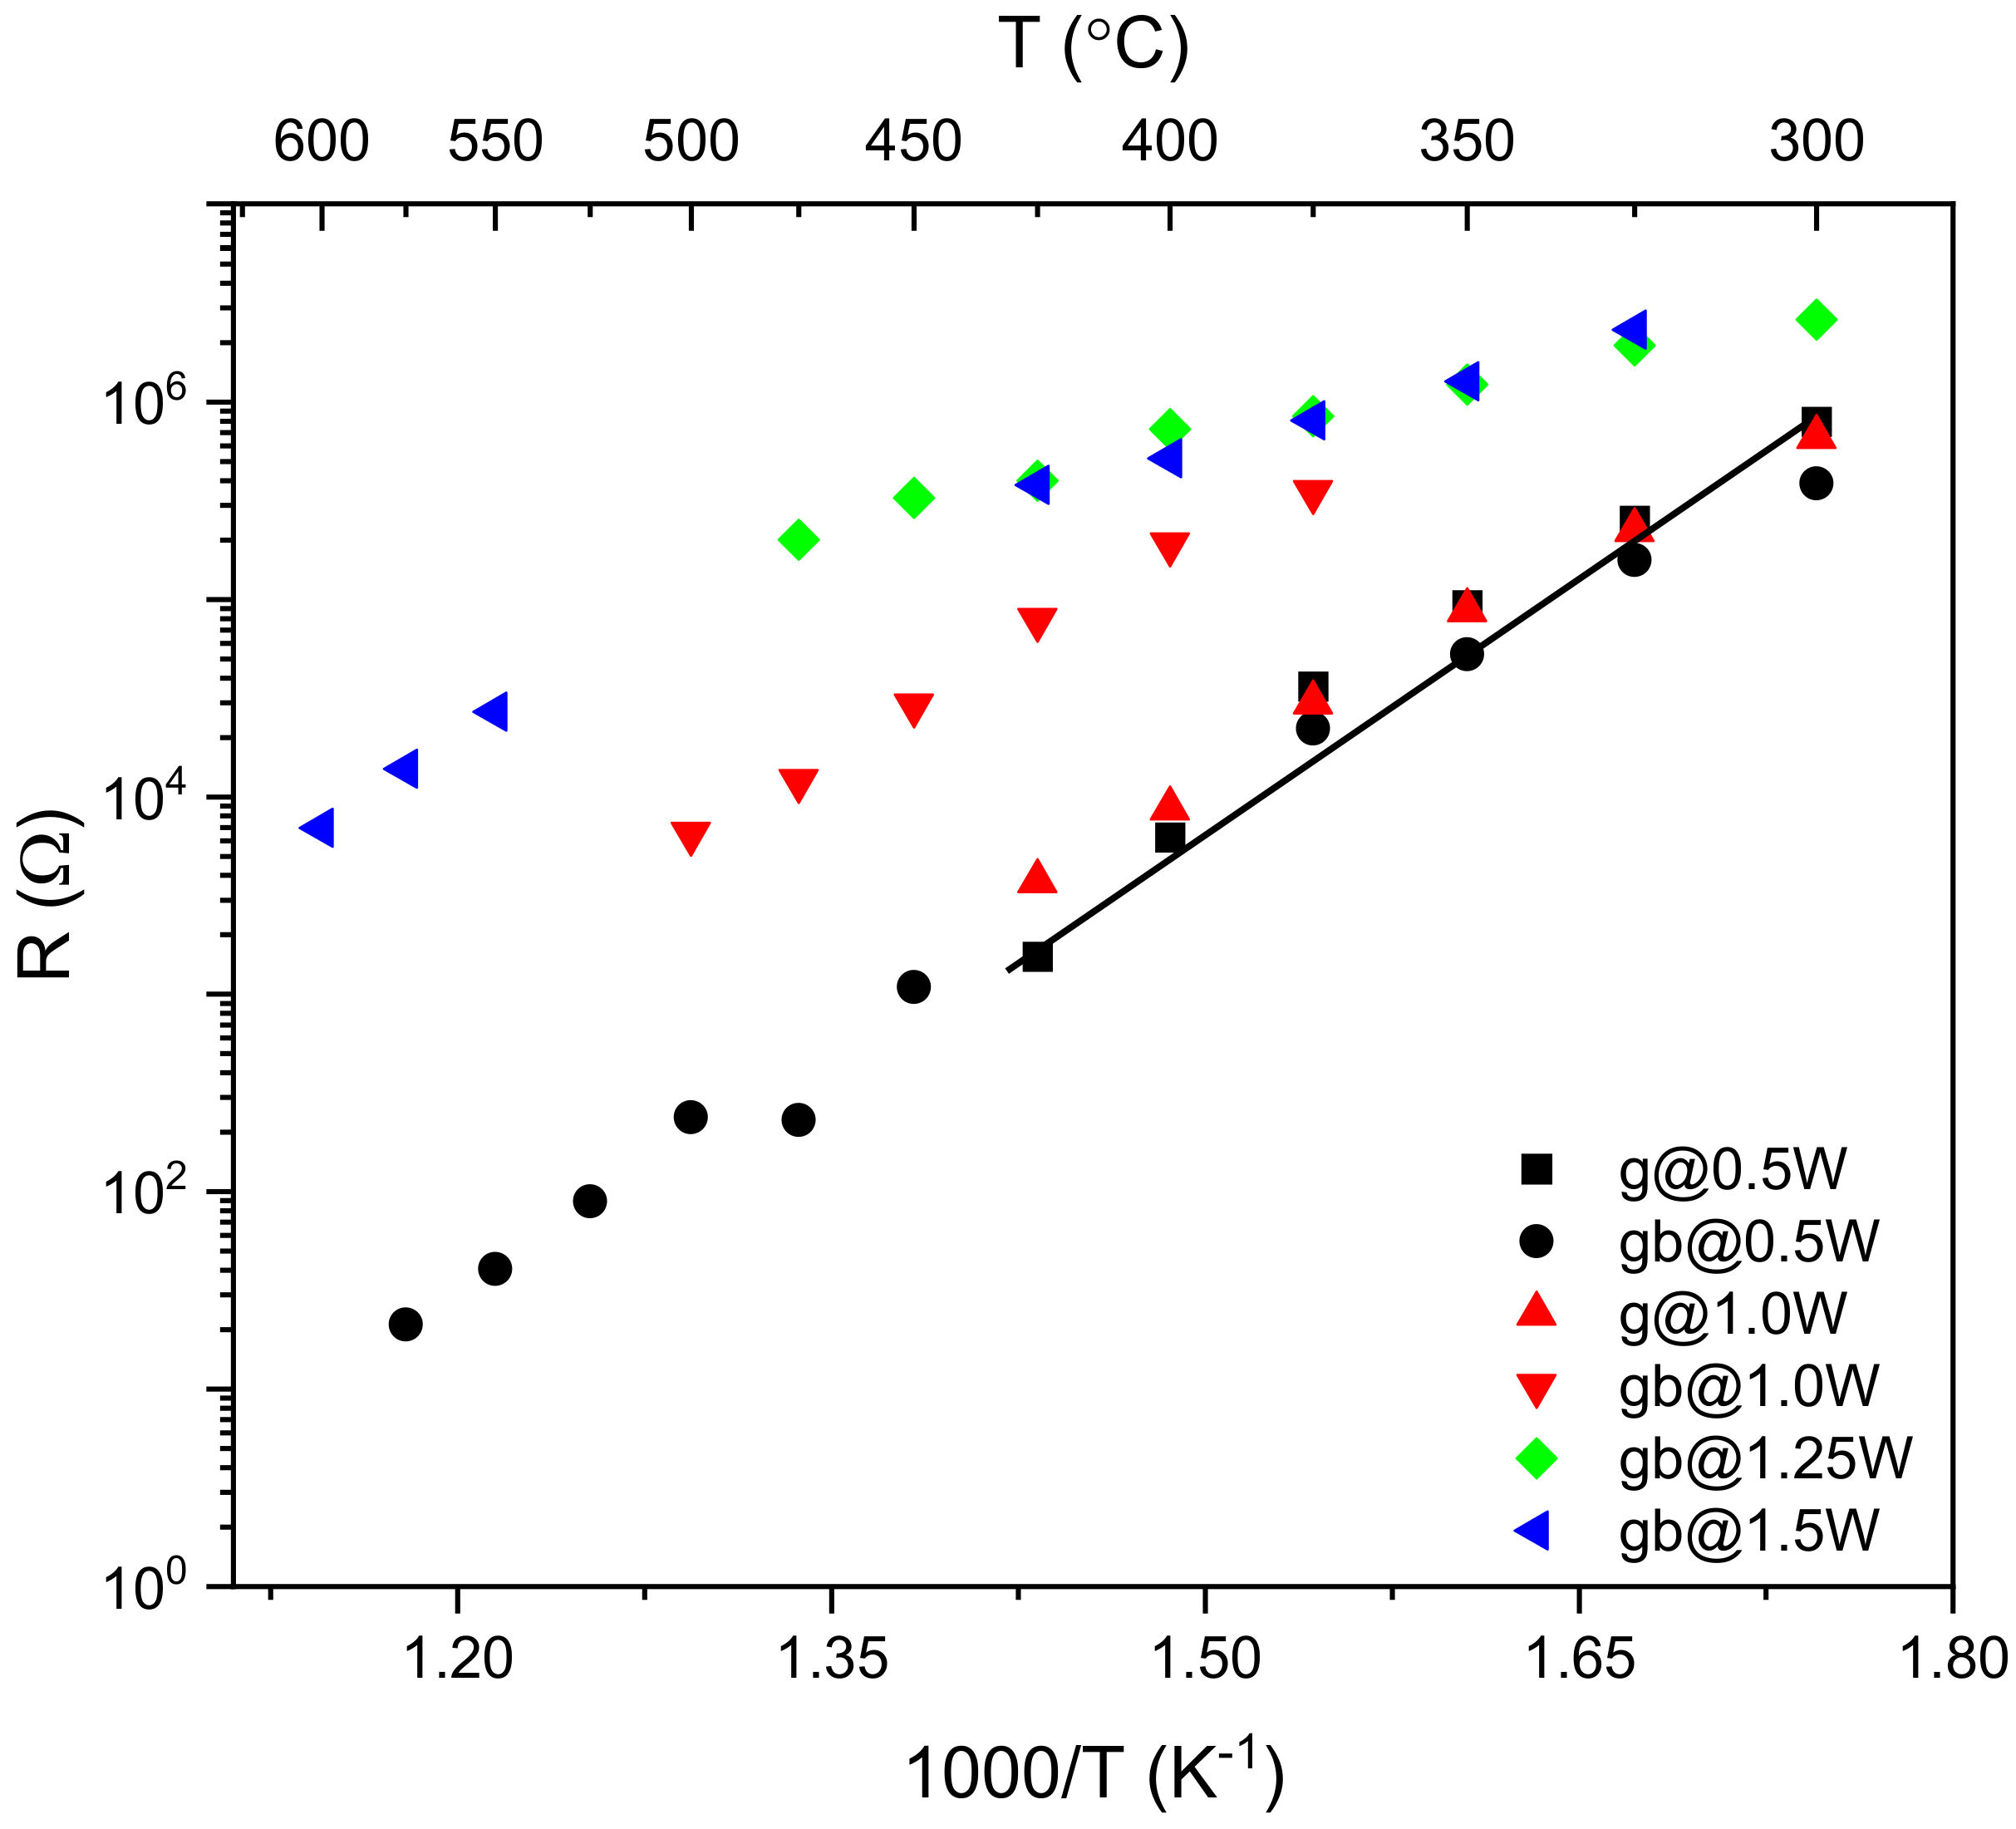
3.4. Impedance Spectroscopy
4. Conclusions
Supplementary Materials
Author Contributions
Funding
Data Availability Statement
Conflicts of Interest
References
- Lacorre, P.; Goutenoire, F.; Bohnke, O.; Retoux, R.; Laligant, Y. Designing Fast Oxide-Ion Conductors Based on La2Mo2O9. Nature 2000, 404, 856–858. [Google Scholar] [CrossRef]
- Vega-Castillo, J.E.; Ravella, U.K.; Corbel, G.; Lacorre, P.; Caneiro, A. Thermodynamic Stability of La2Mo2−yWyO9, La2Mo2−yWyO8.96+0.02y and La7Mo7(2−y)/2W7y/2O30 (y = 0, 0.5). Dalton Trans. 2014, 43, 2661–2669. [Google Scholar] [CrossRef]
- Sellemi, H.; Coste, S.; Ben, A.; Retoux, R.; Samia, L.; Lacorre, P. Synthesis of La2Mo2O9 Powders with Nanodomains Using Polyol Procedure. Ceram. Int. 2013, 39, 8853–8859. [Google Scholar] [CrossRef]
- Malavasi, L.; Fisher, C.A.; Islam, M.S. Oxide-Ion and Proton Conducting Electrolyte Materials for Clean Energy Applications: Structural and Mechanistic Features. Chem. Soc. Rev. 2010, 39, 4370–4387. [Google Scholar] [CrossRef] [PubMed]
- Georges, S.; Goutenoire, F.; Laligant, Y.; Lacorre, P. Reducibility of Fast Oxide-Ion Conductors La2−xRxMo2−yWyO9 (R = Nd, Gd). J. Mater. Chem. 2003, 13, 2317. [Google Scholar] [CrossRef]
- Paul, T.; Ghosh, A. Ionic Conductivity and Dielectric Relaxation in Y Doped La2Mo2O9 Oxide-Ion Conductors. J. Appl. Phys. 2014, 116, 144102. [Google Scholar] [CrossRef]
- Paul, T.; Tsur, Y. Data for New Protocol to Detect the Monoclinic Phase of La2Mo2O9 and Related Oxide Ion Conductors. Data Br. 2018, 18, 1637–1641. [Google Scholar] [CrossRef]
- Basu, S.; Sujatha Devi, P.; Maiti, H.S.; Lee, Y.; Hanson, J.C. Lanthanum Molybdenum Oxide: Low-Temperature Synthesis and Characterization. J. Mater. Res. 2006, 21, 1133–1140. [Google Scholar] [CrossRef]
- Basu, S.; Devi, P.S.; Maiti, H.S.; Bandyopadhyay, N.R. Synthesis, Thermal and Electrical Analysis of Alkaline Earth Doped Lanthanum Molybdate. Solid State Ion. 2013, 231, 87–93. [Google Scholar] [CrossRef]
- Paul, T.; Ghosh, A. Conduction and Relaxation Mechanisms in Bismuth Doped La2Mo2O9 Ionic Conductors. J. Appl. Phys. 2013, 114, 164101. [Google Scholar] [CrossRef]
- Paul, T.; Ghosh, A. Correlation of Structure and Ion Conduction in La2−xYxMo2O9 (0 ≤ x ≤ 0.2) Oxygen Ion Conductors. J. Appl. Phys. 2015, 117, 235101. [Google Scholar] [CrossRef]
- Basu, S.; Sujatha Devi, P.; Bandyopadhyay, N.R. Sintering and Densification Behavior of Pure and Alkaline Earth (Ba2+, Sr2+ and Ca2+) Substituted La2Mo2O9. J. Eur. Ceram. Soc. 2013, 33, 79–85. [Google Scholar] [CrossRef]
- Selmi, A.; Corbel, G.; Kojikian, S.; Voronkova, V.; Kharitonova, E.; Lacorre, P. Complex Effect of Partial Substitution of La3+ by Ca2+ on the Stability of Fast Oxide-Ion Conductor La2Mo2O9. Eur. J. Inorg. Chem. 2008, 2008, 1813–1821. [Google Scholar] [CrossRef]
- Marozau, I.; Marrero-López, D.; Shaula, A.L.; Kharton, V.; Tsipis, E.; Núñez, P.; Frade, J. Ionic and Electronic Transport in Stabilized β-La2Mo2O9 Electrolytes. Electrochim. Acta 2004, 49, 3517–3524. [Google Scholar] [CrossRef]
- Corbel, G.; Durand, P.; Lacorre, P.; Cedex, L.M. Comprehensive survey of Nd3+ substitution in La2Mo2O9 oxide-ion conductor. J. Solid State Chem. 2009, 182, 1009–1016. [Google Scholar] [CrossRef] [Green Version]
- Pavlova, S.; Bespalko, Y.; Krieger, T.; Sadykov, V.; Uvarov, N. Genesis, Structural, and Transport Properties of La2Mo2−xWxO9 Prepared via Mechanochemical Activation. Ionics 2016, 23, 877–887. [Google Scholar] [CrossRef]
- Voronkova, V.I.; Yanovski, V.K.; Kharitonova, E.P. Oxygen-Conducting Crystals of La2Mo2O9: Growth and Main Properties. Crystallogr. Rep. 2005, 50, 874–876. [Google Scholar] [CrossRef]
- Marrero-López, D.; Canales-Vázquez, J.; Ruiz-Morales, J.C.; Irvine, J.T.S.; Núñez, P. Electrical Conductivity and Redox Stability of La2Mo2−xWxO9 Materials. Electrochim. Acta 2005, 50, 4385–4395. [Google Scholar] [CrossRef]
- Marrero-López, D.; Peña-Martínez, J.; Ruiz-Morales, J.C.; Pérez-Coll, D.; Martín-Sedeño, M.C.; Núñez, P. Applicability of La2Mo2−yWyO9 Materials as Solid Electrolyte for SOFCs. Solid State Ion. 2007, 178, 1366–1378. [Google Scholar] [CrossRef]
- Corbel, G.; Laligant, Y.; Goutenoire, F.; Suard, E.; Lacorre, P. Effects of Partial Substitution of Mo6+ by Cr6+ and W6+ on the Crystal Structure of the Fast Oxide-Ion Conductor Structural Effects of W6+. Chem. Mater. 2005, 17, 4678–4684. [Google Scholar] [CrossRef]
- Kong, X.-S.; Hou, C.J.; Hao, Q.-H.; Liu, C.S.; Wang, X.P.; Fang, Q.F. First Principle Study of Structural, Phase Stabilization and Oxygen-Ion Diffusion Properties of β-La2−xLxMo2O9 (L = Gd, Sm, Nd and Bi) and β-La2Mo2−yMyO9 (M = Cr, W). Solid State Ion. 2009, 180, 946–951. [Google Scholar] [CrossRef]
- Marrero-López, D.; Canales-Vázquez, J.; Zhou, W.; Irvine, J.T.S.; Núñez, P. Structural Studies on W6+ and Nd3+ Substituted La2Mo2O9 Materials. J. Solid State Chem. 2006, 179, 278–288. [Google Scholar] [CrossRef]
- Ruan, B.; Yan, B.; Zhang, J. Effect of Oxygen Partial Pressure on the Electrical Conductivity of La2Mo2−xWxO9−δ (x = 0.0, 0.5, 0.7) Materials. Solid State Sci. 2012, 14, 840–848. [Google Scholar] [CrossRef]
- Siddharth; Bysakh, S.; Sil, A. X-ray Photoelectron Spectroscopy and Ion Dynamics Study of W6+ Doped La2Mo2O9 as SOFC Electrolyte. Mater. Res. Bull. 2018, 105, 36–44. [Google Scholar] [CrossRef]
- Jin, T.Y.; Madhava Rao, M.V.; Cheng, C.L.; Tsai, D.S.; Hung, M.H. Structural Stability and Ion Conductivity of the Dy and W Substituted La2Mo2O9. Solid State Ion. 2007, 178, 367–374. [Google Scholar] [CrossRef]
- Pandey, R.; Singh, S.; Singh, P. Modified Polyol-Mediated Synthesis of Sr- and W-Substituted La2Mo2O9 Solid Electrolyte for Solid Oxide Fuel Cells. J. Mater. Sci. Mater. Electron. 2020, 31, 11325–11335. [Google Scholar] [CrossRef]
- Tian, C.; Shao, L.; Ji, D.; Yang, J.; Xie, J.; Yin, Q.; Le, H. Synthesis and Characterization of Tungsten and Barium Co-Doped La2Mo2O9 by Sol-Gel Process for Solid Oxide Fuel Cells. J. Rare Earths 2019, 37, 984–988. [Google Scholar] [CrossRef]
- Georges, S.; Bohnke, O.; Goutenoire, F.; Laligant, Y.; Fouletier, J.; Lacorre, P. Effects of Tungsten Substitution on the Transport Properties and Mechanism of Fast Oxide-Ion Conduction in La2Mo2O9. Solid State Ion. 2006, 177, 1715–1720. [Google Scholar] [CrossRef]
- Rodríguez-Carvajal, J. Recent Advances in Magnetic Structure Determination by Neutron Powder Diffraction. Phys. B Condens. Matter 1993, 192, 55–69. [Google Scholar] [CrossRef]
- Borenstein, A.; Hershkovitz, S.; Oz, A.; Luski, S.; Tsur, Y.; Aurbach, D. Use of 1,10-Phenanthroline as an Additive for High-Performance Supercapacitors. J. Phys. Chem. C 2015, 119, 12165–12173. [Google Scholar] [CrossRef]
- Susai, F.A.; Talianker, M.; Liu, J.; Paul, T.; Grinblat, Y.; Erickson, E.; Noked, M.; Burstein, L.; Frenkel, A.I.; Tsur, Y.; et al. Electrochemical Activation of Li2MnO3 Electrodes at 0 °C and Its Impact on the Subsequent Performance at Higher Temperatures. Materials 2020, 13, 4388. [Google Scholar] [CrossRef]
- Mishuk, E.; Ushakov, A.; Makagon, E.; Cohen, S.R.; Wachtel, E.; Paul, T.; Tsur, Y.; Shur, V.Y.; Kholkin, A.; Lubomirsky, I. Electro-chemomechanical Contribution to Mechanical Actuation in Gd-Doped Ceria Membranes. Adv. Mater. Interfaces 2019, 6, 1801592. [Google Scholar] [CrossRef]
- Tesler, A.B.; Lewin, D.R.; Baltianski, S.; Tsur, Y. Analyzing Results of Impedance Spectroscopy Using Novel Evolutionary Programming Techniques. J. Electroceram. 2010, 24, 245–260. [Google Scholar] [CrossRef]
- Hershkovitz, S.; Tomer, S.; Baltianski, S.; Tsur, Y. ISGP: Impedance Spectroscopy Analysis Using Evolutionary Programming Procedure. In Proceedings of the ECS Transactions, Las Vegas, NV, USA, 10–15 October 2010; Volume 33. [Google Scholar] [CrossRef]
- Baltianski, S.; Tsur, Y. Analysis of Impedance Spectroscopy Data—Finding the Best System Function. J. Electroceram. 2003, 10, 89–94. [Google Scholar] [CrossRef]
- Su, K.H.; Chi, P.W.; Paul, T.; Chung, C.H.; Chen, W.M.; Su, Y.S.; Wu, P.M.; Su, C.Y.; Wu, M.K. Lithiation and Delithiation Induced Magnetic Switching and Electrochemical Studies in α-LiFeO2 Based Li Ion Battery. Mater. Today Phys. 2021, 18, 100373. [Google Scholar] [CrossRef]
- Paul, T.; Ghosh, A. Structure and Electrical Conductivity of Ta Doped La2Mo2O9 Oxide Ion Conductors. J. Appl. Phys. 2018, 124, 225102. [Google Scholar] [CrossRef]
- Paul, T.; Yavo, N.; Lubomirsky, I.; Tsur, Y. Determination of Grain Boundary Conductivity Using Distribution Function of Relaxation Times (DFRT) Analysis at Room Temperature in 10 Mol% Gd Doped Ceria: A Non-Classical Electrostrictor. Solid State Ion. 2019, 331, 18–21. [Google Scholar] [CrossRef]
- Paul, T.; Tsur, Y. Effect of Isovalent Doping on Grain Boundary Conductivity for La2Mo2O9 Oxide Ion Conductor: A Distribution Function of Relaxation Times Approach. Solid State Ion. 2018, 323, 37–43. [Google Scholar] [CrossRef]
- Shannon, R.D. Revised Effective Ionic Radii and Systematic Studies of Interatomie Distances in Halides and Chaleogenides. Acta Crystallogr. 1976, 32, 751. [Google Scholar] [CrossRef]
- Subramania, A.; Saradha, T.; Muzhumathi, S. Synthesis and Characterization of Nanocrystalline La2Mo2O9 Fast Oxide-Ion Conductor by an in-Situ Polymerization Method. Mater. Res. Bull. 2008, 43, 1153–1159. [Google Scholar] [CrossRef]
- Natoli, A.; Arias-Serrano, B.I.; Rodríguez-Castellón, E.; Żurawska, A.; Frade, J.R.; Yaremchenko, A.A. Mixed Ionic-Electronic Conductivity, Redox Behavior and Thermochemical Expansion of Mn-Substituted 5ysz as an Interlayer Material for Reversible Solid Oxide Cells. Materials 2021, 14, 641. [Google Scholar] [CrossRef] [PubMed]
- Evans, I.R.; Howard, J.A.K.; Evans, J.S.O. The Crystal Structure of R-La2Mo2O9 and the Structural Origin of the Oxide Ion Migration Pathway. Chem. Mater. 2005, 17, 4074–4077. [Google Scholar] [CrossRef]
- Sen, S.; Paul, T. Electronic Structures of Trivalent Cations Doped Bulk and Cubic La2Mo2O9 Oxide Ion Conductors. J. Solid State Chem. 2021, 295, 121918. [Google Scholar] [CrossRef]
- Pinet, P.; Fouletier, J.; Georges, S. Conductivity of Reduced La2Mo2O9 Based Oxides: The Effect of Tungsten Substitution. Mater. Res. Bull. 2007, 42, 935–942. [Google Scholar] [CrossRef]
- Shewmon, P. (Ed.) Diffusion in Solids; Springer: Berlin/Heidelberg, Germany, 2016. [Google Scholar] [CrossRef]


| Composition (x) | Experimental Density (g cm−3) | Theoretical Density (g cm−3) | Grain Size (µm) |
|---|---|---|---|
| 0 | 5.498 | 5.561 | 12 1 |
| 0.5 | 5.547 | 6.739 | 7.9 |
| 1.0 | 6.344 | 6.759 | 7.06 |
| 1.25 | 6.508 | 6.751 | 7.45 |
| 1.50 | 6.821 | 6.769 | 7.16 |
| Composition | From Figure 4 | From Ref. [18] | ||
|---|---|---|---|---|
| (x) | T (°C) | TEC × 10−6 (°C−1) | T (°C) | TEC × 10−6 (°C−1) |
| 0 | 100–520 | 14.7 | 25–550 | 13.5 |
| 600–795 | 15.8 | 625–800 | 16.8 | |
| 0.5 | 110–365 | 15.3 | 25–450 | 15.2 |
| 490–710 | 21.6 | 550–800 | 19.9 | |
| 1.0 | 57–317 | 15.3 | 25–500 | 15.4 |
| 350–765 | 21.4 | 550–800 | 20.7 | |
| 1.25 | 70–445 | 16.5 | - | - |
| 550–870 | 24.3 | - | - | |
| 1.50 | 90–400 | 16.5 | 25–500 | 13.9 |
| 600–895 | 23.2 | 550–800 | 21.0 | |
| Composition | From Resistance Plot (Figure 8) | From Conductivity Plot (Figure S8) | ||
|---|---|---|---|---|
| (x) | (Eg) (eV) | (Egb) (eV) | (Eg) (eV) | (Egb) (eV) |
| 0 | 1.03 (±0.05) | 1.22 (±0.01) | 1.03 (±0.05) | 1.22 (±0.01) |
| 0.5 | 1.68 (±0.05) | 1.53 (±0.05) | 1.68 (±0.05) | 1.53 (±0.05) |
| 1.0 | 1.41 (±0.02) | 1.43 (±0.03) | 1.41 (±0.05) | 1.43 (±0.05) |
| 1.25 | - | 0.53 (±0.12) | - | 0.53 (±0.10) |
| 1.50 | - | 0.65 (±0.06) | - | 0.65 (±0.06) |
Publisher’s Note: MDPI stays neutral with regard to jurisdictional claims in published maps and institutional affiliations. |
© 2021 by the authors. Licensee MDPI, Basel, Switzerland. This article is an open access article distributed under the terms and conditions of the Creative Commons Attribution (CC BY) license (https://creativecommons.org/licenses/by/4.0/).
Share and Cite
Paul, T.; Tsur, Y. Influence of Isovalent ‘W’ Substitutions on the Structure and Electrical Properties of La2Mo2O9 Electrolyte for Intermediate-Temperature Solid Oxide Fuel Cells. Ceramics 2021, 4, 502-515. https://doi.org/10.3390/ceramics4030037
Paul T, Tsur Y. Influence of Isovalent ‘W’ Substitutions on the Structure and Electrical Properties of La2Mo2O9 Electrolyte for Intermediate-Temperature Solid Oxide Fuel Cells. Ceramics. 2021; 4(3):502-515. https://doi.org/10.3390/ceramics4030037
Chicago/Turabian StylePaul, Tanmoy, and Yoed Tsur. 2021. "Influence of Isovalent ‘W’ Substitutions on the Structure and Electrical Properties of La2Mo2O9 Electrolyte for Intermediate-Temperature Solid Oxide Fuel Cells" Ceramics 4, no. 3: 502-515. https://doi.org/10.3390/ceramics4030037