Article

Catalytic Activity of Mono- and Bi-Metallic Nanoparticles Synthesized via Microemulsions

by
Ramona Y.G. König
1,
Michael Schwarze
2,
Reinhard Schomäcker
2 and
Cosima Stubenrauch
1,*
1
Institut für Physikalische Chemie, Universität Stuttgart, Pfaffenwaldring 55, Stuttgart 70569, Germany
2
Fakultät II, Institut für Chemie, Technische Universität Berlin, Straße des 17. Juni 124, Berlin 10623, Germany
*
Author to whom correspondence should be addressed.
Catalysts 2014, 4(3), 256-275; https://doi.org/10.3390/catal4030256
Submission received: 19 March 2014 / Revised: 9 May 2014 / Accepted: 13 June 2014 / Published: 1 July 2014
(This article belongs to the Special Issue Synthesis of Nanostructured Catalytic Materials from Microemulsions)

Abstract

:
Water-in-oil (w/o) microemulsions were used as a template for the synthesis of mono- and bi-metallic nanoparticles. For that purpose, w/o-microemulsions containing H2PtCl6, H2PtCl6 + Pb(NO3)2 and H2PtCl6 + Bi(NO)3, respectively, were mixed with a w/o-microemulsion containing the reducing agent, NaBH4. The results revealed that it is possible to synthesize Pt, PtPb and PtBi nanoparticles of ~3–8 nm in diameter at temperatures of about 30°C. The catalytic properties of the bimetallic PtBi and PtPb nanoparticles were studied and compared with monometallic platinum nanoparticles. Firstly, the electrochemical oxidation of formic acid to carbon monoxide was investigated, and it was found that the resistance of the PtBi and PtPb nanoparticles against the catalyst-poisoning carbon monoxide was significantly higher compared to the Pt nanoparticles. Secondly, investigating the reduction of 4-nitrophenol to 4-aminophenol, we found that the bimetallic NPs are most active at 23 °C, while the order of the activity changes at higher temperatures, i.e., that the Pt nanoparticles are the most active ones at 36 and 49 °C. Furthermore, we observed a strong influence of the support, which was either a polymer or Al2O3. Thirdly, for the hydrogenation of allylbenzene to propylbenzene, the monometallic Pt NPs turned out to be the most active catalysts, followed by the PtPb and PtBi NPs. Comparing the two bimetallic nanoparticles, one sees that the PtPb NPs are significantly more active than the respective PtBi NPs.

1. Introduction

Platinum is one of the most efficient catalyst materials for the reduction, as well as the oxidation of small organic molecules and is commonly used in fuel cells. For a large-scale application of platinum, for example in fuel cells, great cost and supply constraints exist, and thus, the catalytic activity per mass of precious metal needs to be increased by a factor of >4 [1,2]. This can be done by increasing the surface area of the platinum (Pt), e.g., by using platinum nanoparticles (NPs) as the electrode material. Furthermore, the support can increase the catalytic activity significantly, and hence, an ideal support for the electrode material needs to be found. Studies have found carbon black to be the ideal support material for platinum in fuel cells. On the other hand, studies have further shown that the reduction of the activity/selectivity of the Pt/C catalyst due to deactivation processes is still a great challenge [3,4]. The most problematic deactivation is caused by impurities in the reactants, especially carbon monoxide and sulfur, which poison the platinum surface greatly. It has been shown that certain metal combinations—with or without Pt—are much more effective than pure Pt and less affected (or even unaffected) by the presence of impurities in the reactants [1]. Therefore, Di Salvo et al. tested different intermetallic bulk phases for their catalytic activity towards possible fuels, i.e., formic acid, ethanol, etc. [5]. Furthermore, they have shown that the current densities of PtPb and PtBi electrodes are superior to those of a pure platinum catalyst [6,7,8] and that those intermetallics are almost immune against CO and S poisoning [9,10]. Thus, PtPb and PtBi intermetallic phases are promising materials to replace monometallic platinum nanoparticles in fuel cells.
However, one has to keep in mind that not just the composition, but also the size of the nanoparticles influences the catalytic activity [11]. It is thus essential to have a technique to synthesize nanoparticles of a certain composition and a specific size. An ideal way to accomplish this is the synthesis of nanoparticles via water-in-oil microemulsions (w/o µE) [12]. The main advantage of using water-in-oil microemulsions as reaction media over common colloidal synthesis is the fact that the size and shape of the microemulsion droplet sizes can be controlled by varying the temperature and composition of the microemulsion.
In previous work, it has been shown that it is possible to synthesize monometallic and bimetallic nanoparticles in microemulsions at room temperature [13,14,15]. Measurements have proven that it is possible to control the size of the NPs by varying the size of the microemulsion droplet prior to the synthesis [15]. It is further possible to change the composition of the NPs by changing the concentration of the reducing agent and or the metal salt ratios [13].
In the paper at hand, we want to present the results on the catalytic properties of the mono- and bi-metallic (Pt, PtBi and PtPb) nanoparticles synthesized via water-in-oil microemulsions. An ideal system to study the potential poisoning of carbon monoxide on an electrode’s surface is the electrochemical oxidation of formic acid, because this follows a dual-path mechanism [16], where CO can be formed as a poisonous species. Furthermore, the catalytic activity of the different nanoparticles can be tested and compared via different, simple model reactions, like the reduction of 4-nitrophenol, as well as the non-selective hydrogenation of allylbenzene. Additionally, a comparison to the catalytic activity of commercially available catalysts is also possible, since these model reactions have been carried out with a broad variety of catalysts.

2. Results and Discussion

In this paper, we address the catalytic activity of the mono- and bi-metallic platinum (Pt), platinum-bismuth (PtBi) and platinum-lead (PtPb) nanoparticles (NPs) synthesized via water-in-oil microemulsions. The synthesis of the mono- and bi-metallic nanoparticles via the microemulsion route has been described elsewhere [13,14] and will thus not be explained. Furthermore, a detailed characterization of the composition of the bimetallic PtBi and PtPb nanoparticles has been previously published [13,14]. The main results of this study are as follows: (1) using the microemulsion route, it is possible to synthesize bimetallic nanoparticles, rather than core-shell structures, even of metals with great differences in the reduction potentials of their respective metal salts; (2) it is possible to influence their composition via a variation in the metal salt ratio, as well as the amount of reducing agent; and (3) the resulting nanoparticles consist of a mixture of phases rather than of a single bimetallic phase, including oxide phases.

2.1. Cyclic Voltammetry

Cyclic voltammetry (CV) was used to study the electrochemical activity of the mono- and bi-metallic (Pt, PtBi and PtPb) nanoparticles stabilized onto ethoxylated polyethylene imine (PEIPEO). A special focus is on the poisoning of the catalysts by carbon monoxide, and for this, the electrochemical oxidation of formic acid can be studied (see 
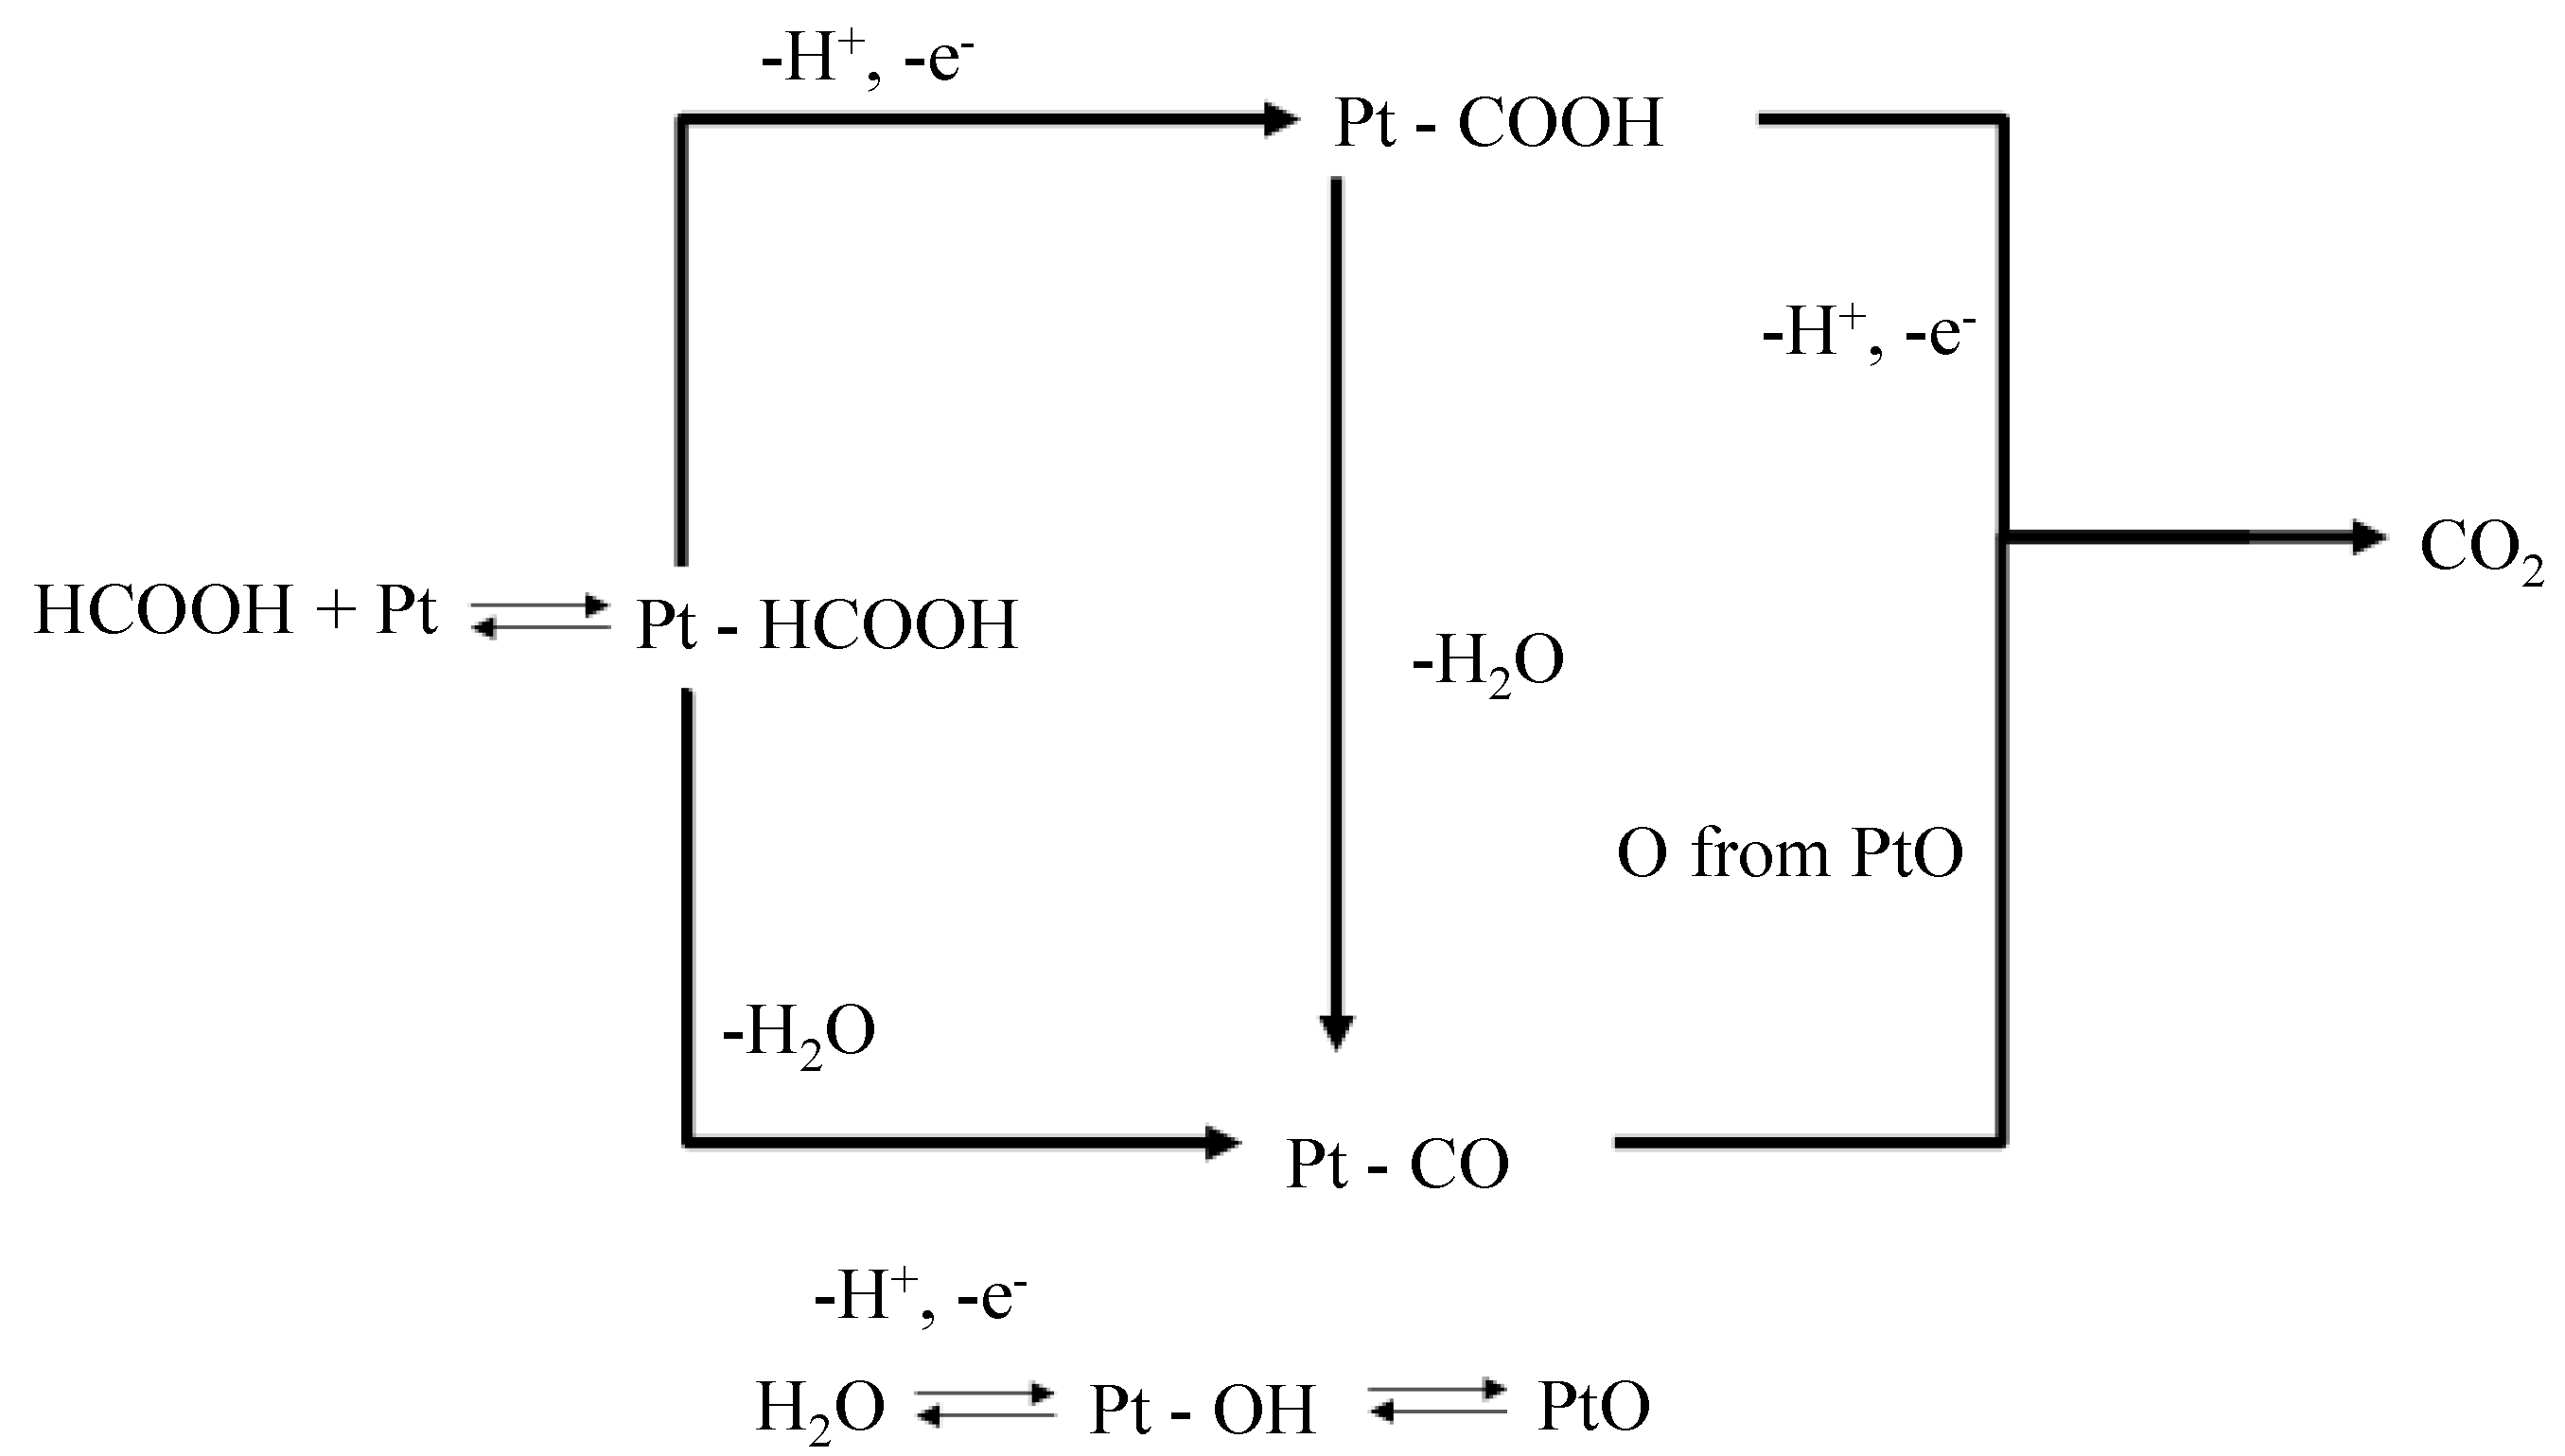
Scheme 1). There are two paths in which formic acid (HCOOH) can be oxidized on the surface of a Pt electrode, namely dehydrogenation and dehydration [6,16]. As shown in Scheme 1, these processes involve either the formation of a reactive intermediate that yields CO2 as the final product (dehydrogenation) or the formation of CO via the dehydration of formic acid. The adsorbed CO is then oxidized to CO2. Thus, the electrode can only be poisoned by CO if the formic acid is decomposed via the dehydration path. Taking this into account, valuable information about the oxidation of formic acid on different electrodes can be obtained by a cyclic voltammogram.
In 
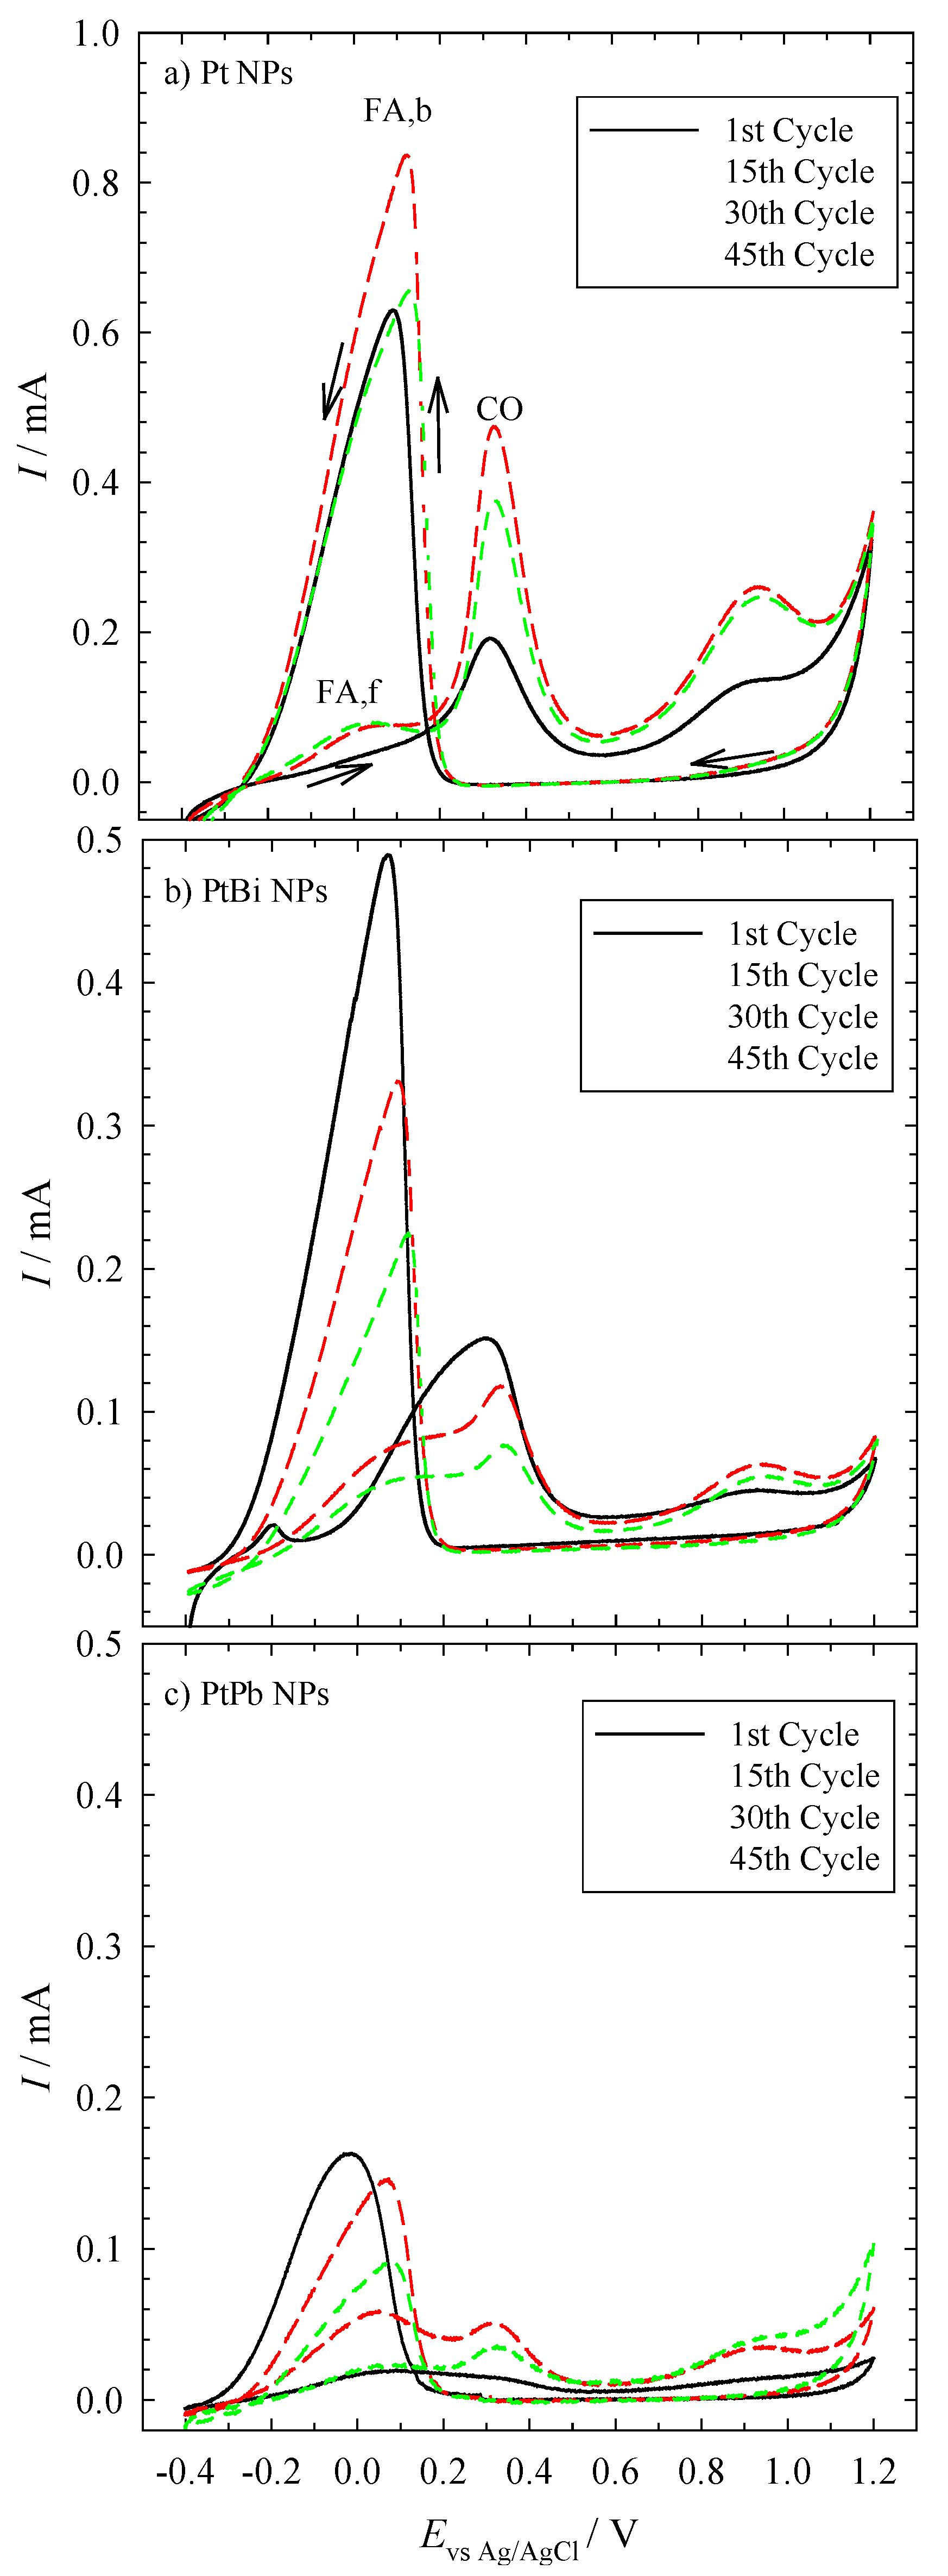
Figure 1, one can see the cyclic voltammograms of the electrochemical oxidation of formic acid on the three different nanoparticles over the course of 45 cycles. The three NP-coated glassy carbon (GC) electrodes show the typical peaks obtained for platinum.
All cyclic voltammograms can be explained in terms of the dual path mechanism, as shown in Scheme 1 [16]. At low potentials, HCOOH is oxidized via both the direct and the indirect pathways. This can be seen in Figure 1, where the first peak occurs at +0.1 V (IFA,f). However, the indirect pathway leads to the formation of CO. Note that at low electrode potentials, CO acts as a surface poisoning species, while at high electrode potentials, it is an active intermediate [17]. The poisoning effect can be seen in the CV, with the reaction rate of the direct path declining as the number of platinum surface sites available for the direct path diminishes [16]. At higher potentials, the CO starts to be oxidized (ICO), giving rise to a clean platinum surface, which results in the oxidation of more formic acid. Simultaneously, the current increases until platinum is oxidized (IPt). PtO, however, is inactive for the oxidation of formic acid. In the backward sweep, the current increases rapidly due to the reduction of the platinum oxide. In addition, the current is much higher than in the forward sweep, due to the absence of the poisonous CO (IFA,b). At too low of a potential, however, CO is formed again, and hence, the current decreases significantly [18]. Looking at the currents of the NP-coated GC electrodes, one sees that the currents measured with the Pt-coated electrode are higher than those measured with the electrodes coated with the bimetallic NPs. However, the available surface area of the nanoparticles on the electrodes very likely was not the same for the three samples, because different amounts of nanoparticles may be present on the glassy carbon disc. Unfortunately, the experimental set-up does not allow quantifying the surface area, and thus, a quantitative analysis of the curves cannot be done at this point.
Scheme 1. Suggested dual-path mechanism of formic acid oxidation on a Pt electrode [6,16]. When formic acid is oxidized on the Pt electrode via the dehydrogenation process, no CO is produced as a side product, and hence, there cannot be any poisoning of the electrode. However, CO is produced via the dehydration of formic acid.
Catalysts 04 00256 g006
Please note that the onset potential (Evs Ag/AgCl = −0.1 V) of the three different electrodes for the oxidation of formic acid is almost the same. This shows that the intermetallic nanoparticles are electrochemically as active as the monometallic platinum nanoparticles.
To gain further information and to study the influence of the poisonous CO on the surface of the electrode, one can compare the ratio of the currents of the oxidation of HCOOH (IFA,b) and of CO (ICO) in the forward sweep and the ratio of the currents of the oxidation of HCOOH in the forward (IFA,f) and in the backward sweep (IFA,b) for the three different electrodes [19]. This allows a direct comparison of the different electrodes, even without knowing the available surface area of the nanoparticles. The first ratio compares the currents of the oxidation of formic acid to CO2 with the currents of the oxidation of CO to CO2, which occurs at higher potentials. This ratio illustrates how much CO is produced via the indirect pathway. The produced CO can block the active sites for the oxidation of the HCOOH of platinum. The second ratio compares the current of the oxidation of formic acid in the forward sweep with the current of the oxidation of formic acid in the backward sweep. While in the forward sweep, the electrode’s surface can be blocked by CO, in the backward sweep, the electrode’s surface is completely reduced, and therefore, all of the active sites can be used to oxidize formic acid [18]. The higher the ratios, the less affected the electrodes are by CO. The results clearly show a superior behavior for the bimetallic NPs compared to the monometallic Pt NPs (see Table 1 and Table 2).
Figure 1. Cyclic voltammograms of a glassy carbon (GC) electrode coated with mono- and bi-metallic NPs. The electrolyte contained 0.5 M formic acid/0.1 M sulfuric acid. The sweep rate is 10 mV∙s−1. The GC electrode was coated with (a) Pt NP, (b) PtBi NP and (c) PtPb NP, and the potentials are measured against an Ag/AgCl electrode. Please note that the y-scale of the upper figure is different from the two lower ones.
Catalysts 04 00256 g001
Table 1. The ratio of the current resulting from the oxidation of HCOOH to CO2 (IFA,f) and from the oxidation of CO to CO2 (ICO) in the forward scan of the cyclic voltammogram of the three different electrodes coated with the mono- and bi-metallic nanoparticles.
CycleIFA,f/ICO
Pt NPsPtBi NPsPtPb NPs
1stCycle0.18 ± 0.010.50 ± 0.102.50 ± 0.02
5thCycle0.14 ± 0.010.75 ± 0.203.00 ± 0.50
10thCycle0.14 ± 0.020.75 ± 0.351.90 ± 0.20
15thCycle0.15 ± 0.030.67 ± 0.201.15 ± 0.01
30thCycle0.17 ± 0.040.51 ± 0.040.64 ± 0.03
45thCycle0.18 ± 0.040.55 ± 0.200.61 ± 0.05
Table 2. The ratio of the current resulting from the oxidation of HCOOH to CO2 (IFA,f) in the forward sweep and from the oxidation of HCOOH to CO2 (IFA,b) in the backward sweep of the cyclic voltammogram of the three different electrodes coated with the mono- and bi-metallic nanoparticles.
CycleIFA,f/IFA,b
Pt NPsPtBi NPsPtPb NPs
1st Cycle0.09 ± 0.020.30 ± 0.050.65 ± 0.15
5th Cycle0.08 ± 0.020.42 ± 0.100.75 ± 0.20
10th Cycle0.08 ± 0.020.28 ± 0.070.84 ± 0.35
15th Cycle0.08 ± 0.010.25 ± 0.050.70 ± 0.50
30th Cycle0.09 ± 0.010.18 ± 0.020.40 ± 0.30
45th Cycle0.10 ± 0.020.20 ± 0.010.36 ± 0.20
Over a run of 45 cycles, however, the selectivity towards the HCOOH oxidation decreases for the intermetallic nanoparticles, which can be explained by the dissolution of the less noble metal from the electrode [20].
Although it is well known in the literature that intermetallic PtBi and PtPb electrodes are less affected by CO poisoning compared to monometallic Pt electrodes [5,6,9,21,22,23], it is interesting to find out whether the mixture of phases present in our nanoparticles [13,24] has an effect on the activity and selectivity of the electrochemical reaction. For this purpose, we compare the ratios discussed above with the ratios calculated from the literature.
Our results are completely in line with data found by Casado-Rivera et al. for their monometallic platinum and bimetallic PtBi electrodes. If one calculates the first ratio IFA,f/ICO based on the data published in [6], one obtains 0.21 for Pt and 0.7 for PtBi. Comparing these figures with those measured in the present work, which are 0.18 ± 0.01 for the GC/Pt NPs and 0.5 ± 0.1 for the glassy carbon electrode coated with the bimetallic PtBi NPs, one clearly sees that the results are in perfect agreement for the first cycle. In other words, the mixture of phases found in the PtBi nanoparticles does not influence the electrochemical activity compared to a pure PtBi phase. The only advantage of the pure intermetallic PtBi phase is the enhanced performance regarding the onset potential, while our data does not show any change in the onset potential in comparison to the monometallic platinum nanoparticles. Furthermore, the CVs measured by Volpe et al. for a pure PtBi phase led to the same value for the second ratio (IFA,f/IFA,b ~ 0.34 [8]) as our measurements for the first cycle (IFA,f/IFA,b = 0.3 ± 0.05).
The results found by Casado-Rivera et al. [5] and Zhang et al. [25] for a bimetallic PtPb electrode, however, show a greater CO tolerance compared to our data, with an IFA,f/IFA,b ratio of around 1.5, which is about twice the value we found for the GC electrode coated with the bimetallic PtPb nanoparticles. From the data measured by Volpe et al., one can calculate an even greater value of IFA,f/IFA,b ~ 2.4. However, this CV was measured at 2000 rpm to reduce the occlusion of the surface by bubble formation [8]. The general trend observed, i.e., that the pure PtPb electrodes show a greater resistance towards CO poisoning than our bimetallic nanoparticles, could be due to the mixture of phases found in our nanoparticles. Furthermore, our bimetallic PtPb NPs do not show any enhanced electrochemical activity, as it is the case for pure PtPb phases [5,8].

2.2. Reduction of 4-Nitrophenol

To learn more about the catalytic activity of the three different nanoparticles, stabilized onto ethoxylated polyethylene imine, the reduction of 4-nitrophenol (NIP) to 4-aminophenol (see Scheme 2) was studied via UV-Vis spectroscopy.
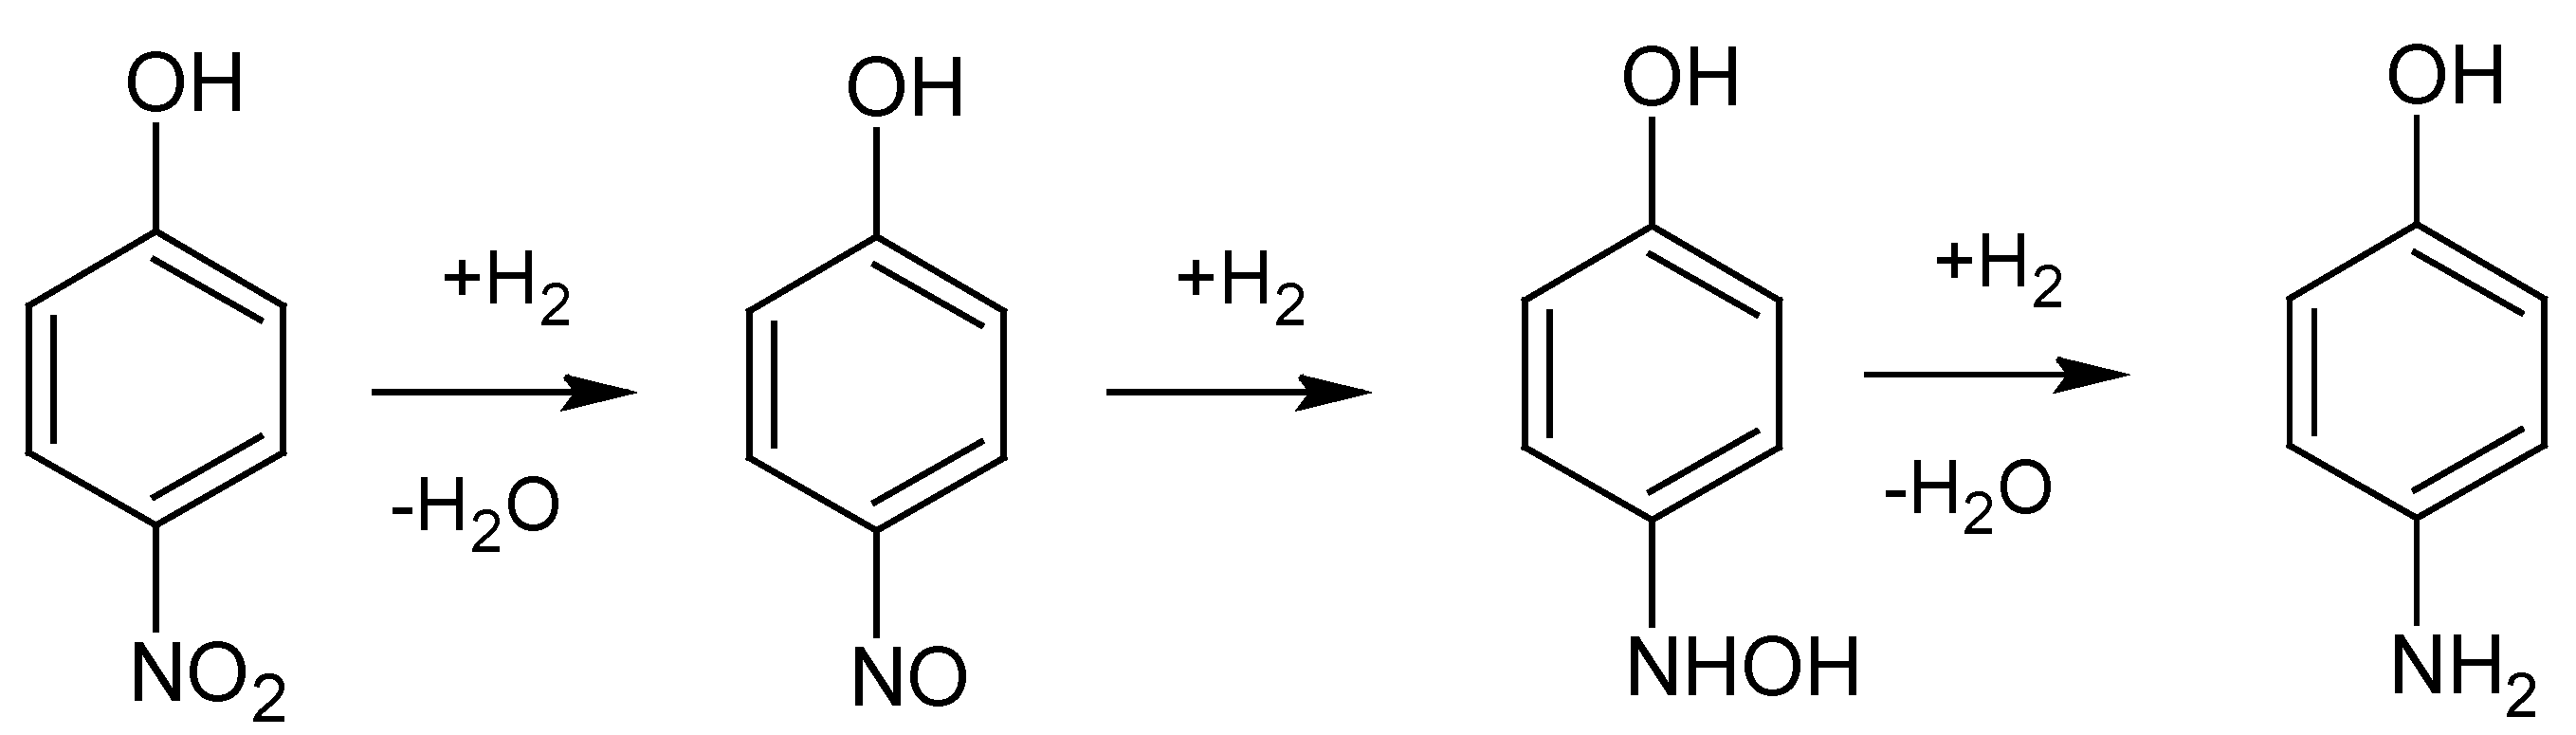
Scheme 2. Reaction mechanism for the reduction of 4-nitrophenol to 4-aminophenol. 4-nitrophenol is first hydrogenated to 4-nitrosophenol, which is further hydrogenated to 4-hydroxyaminophenol. In the last step, 4-hydroxyaminophenol is hydrogenated to the final product, 4-aminophenol [26].
Catalysts 04 00256 g007
The reaction can be described as follows: the catalyst reacts with borohydride ions to form the metal hydride, and at the same time, 4-nitrophenol adsorbs onto the metal surface. Here, 4-nitrophenol is reduced to 4-aminophenol via two intermediates, namely 4-nitrosophenol and 4-hydroxyaminophenol, which desorbs afterwards. As reported in [27], the reaction follows the Langmuir–Hinshelwood mechanism. However, if a large enough amount of NaBH4 is used (at least >100-times more than 4-nitrophenol), the kinetics simplify to a pseudo first-order reaction [28,29,30,31,32]. Thus, to test the catalytic activity of the synthesized nanoparticles, we used an excess of NaBH4 and treated the reaction as a pseudo first-order reaction.
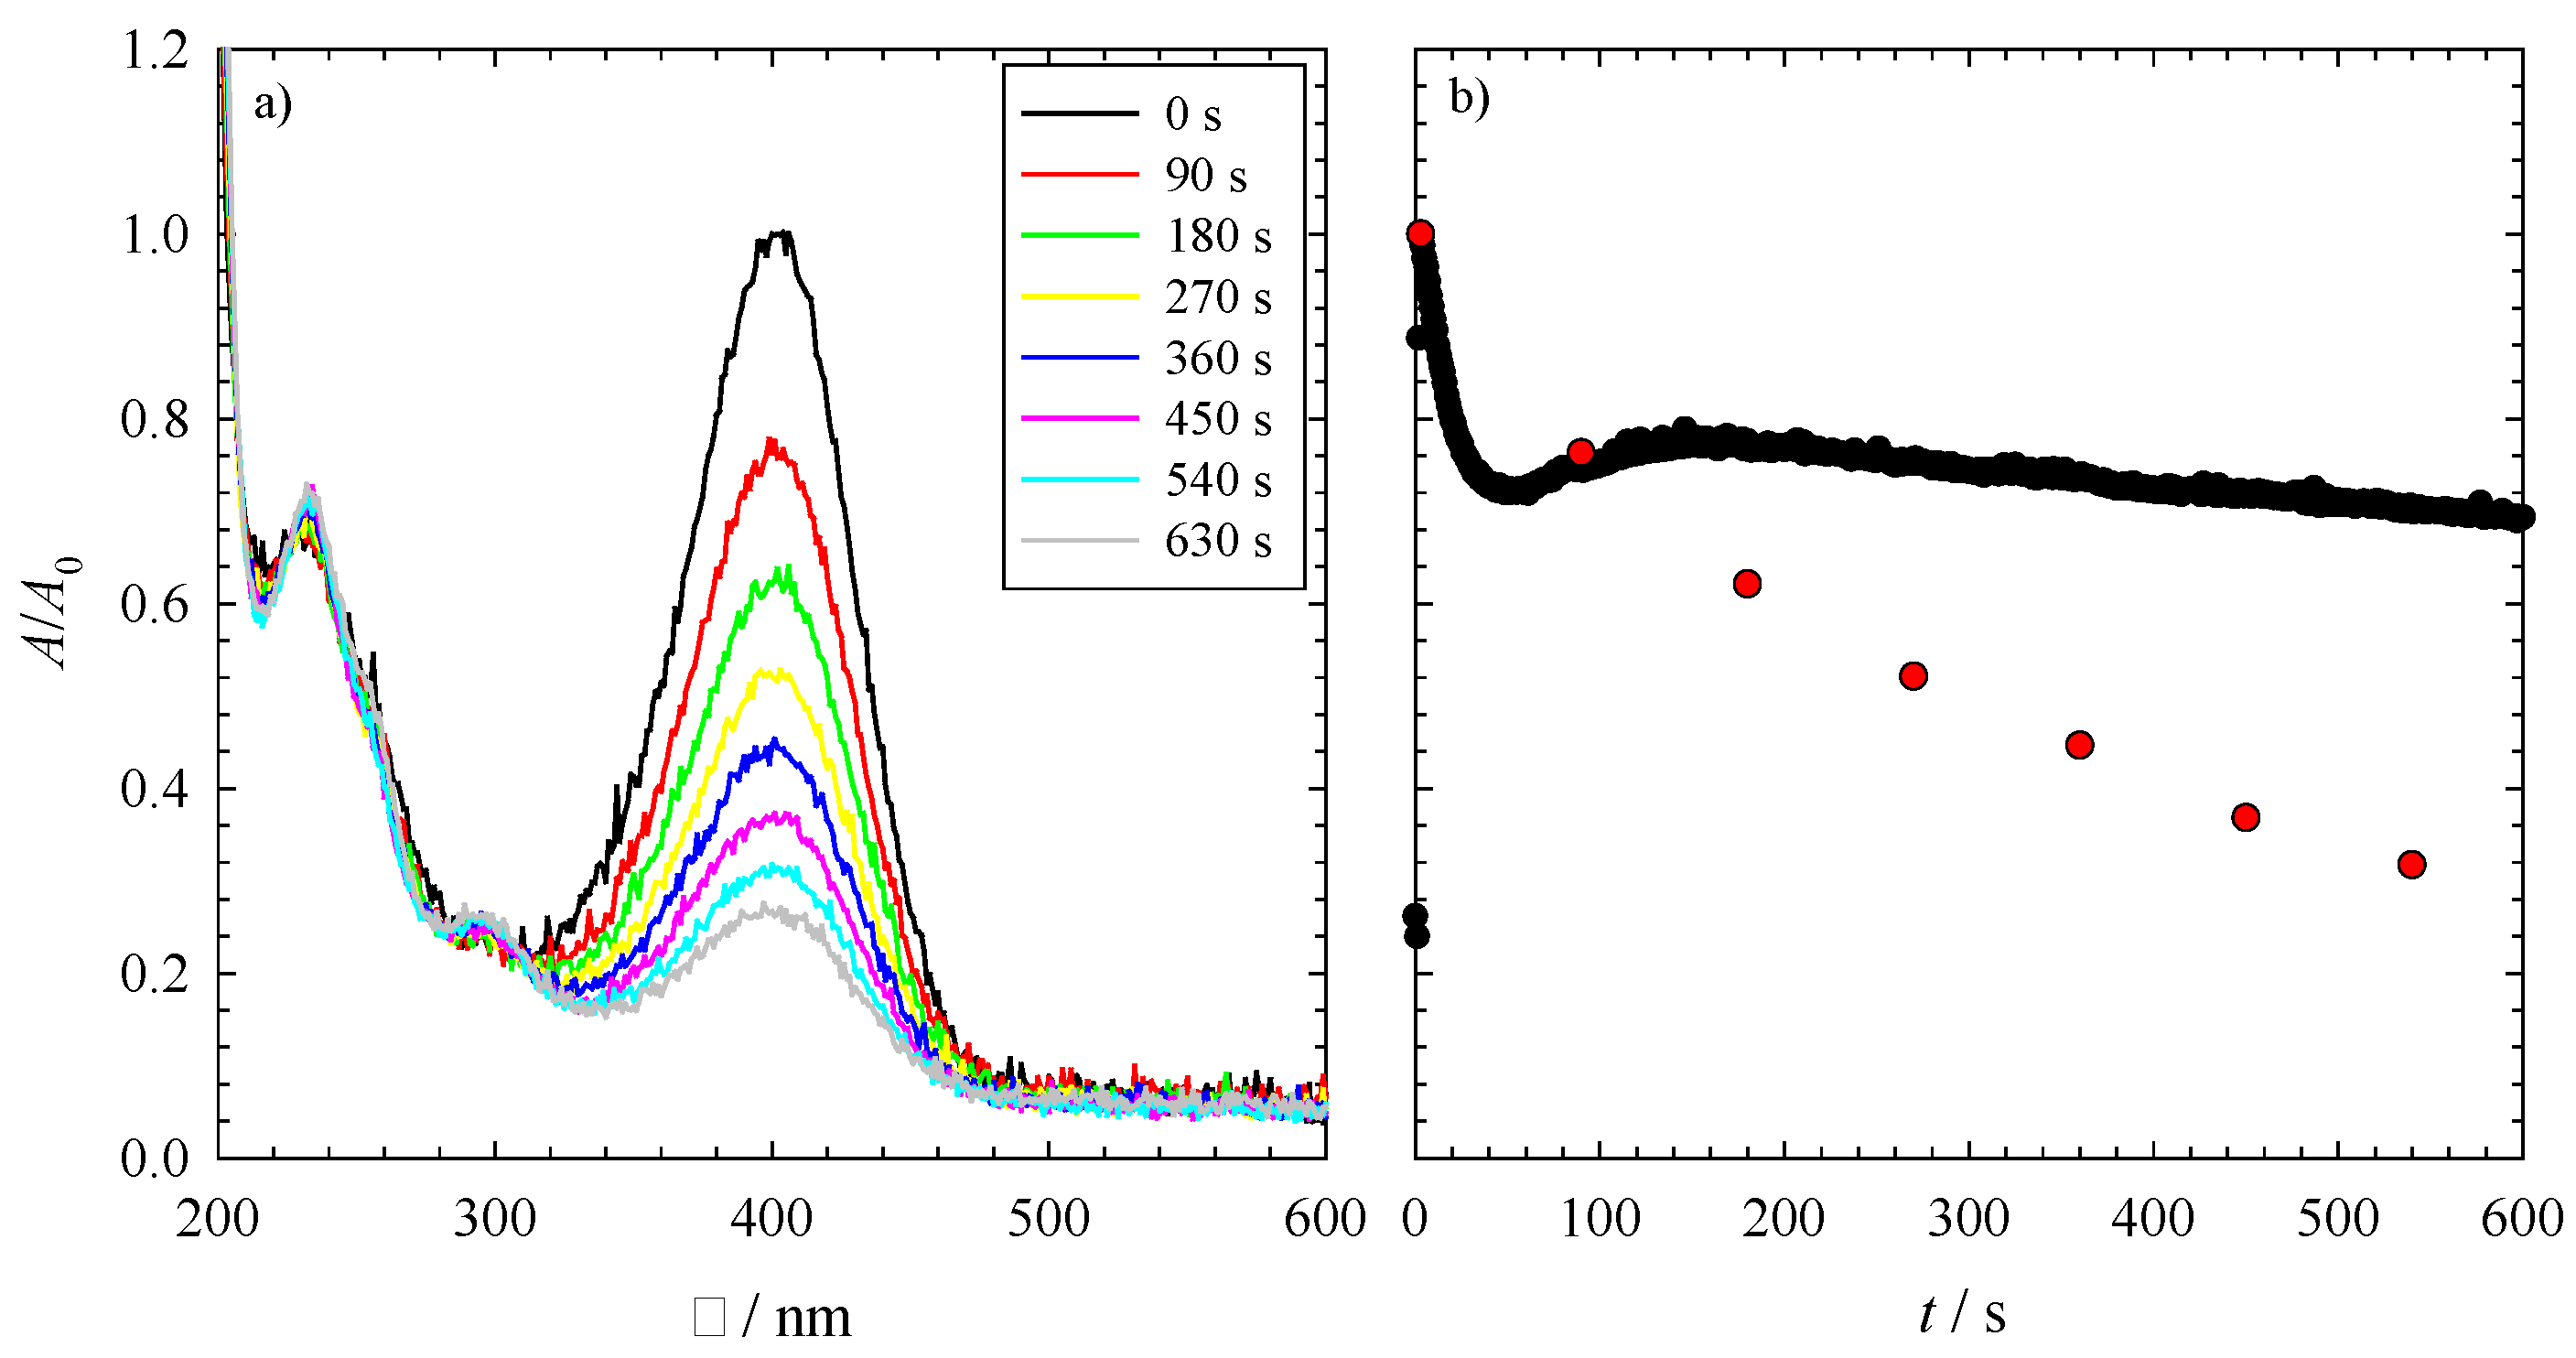
As an example, the UV-Vis spectra of the reduction of 4-nitrophenol with NaBH4 catalyzed by PtPb nanoparticles are displayed in Figure 2a as a function of time. At λ = 400 nm, one can see the decrease of the absorption of the nitrophenolate ion, while the increasing peak at around λ = 300 nm indicates the increasing concentration of 4-aminophenol. Note that rising hydrogen bubbles in the measuring cell disturb the visibility of the three isosbestic points at around 280, 320 and 470 nm. Looking at Figure 2a, one observes that even after 630 s, the reaction is not complete, i.e., not all of the 4-nitrophenol is converted to 4-aminophenol. The time evolution of this reduction can be seen in detail via the red spheres in Figure 2b. However, to monitor the reaction on an adequate time scale, the UV-Vis absorbance spectra were measured directly at λ = 400 nm, i.e., at the position of the nitrophenolate ion peak as a function of time. The resulting time evolution over a range of 600 s of this absorption band is seen in Figure 2b (black spheres). Please note, the deviation between the two sets of data is in the experimental error. However, one can immediately see via the time-resolved data that the reduction of 4-nitrophenol occurs via different steps, which will be discussed in the following. At the very first couple of seconds, one can see a rise in the absorbance at 400 nm. This increase indicates a delay of the dissociation of 4-nitrophenol to the nitrophenolate ion after the addition of NaBH4, which is caused by the mixing of the solutions. The start of the reaction is defined as the time where 4-nitrophenol is completely dissociated, i.e., the highest point of the absorbance spectra. Although some nitrophenolate ions are reduced within these first seconds, this effect will be neglected in the following discussion. After 2 s, the solution is completely mixed, the 4-nitrophenol is deprotonated and the reaction starts. This can be seen by the steep decrease of absorbance within the first couple of seconds. This decrease is followed by an increase of absorbance up until around 150 s after the start of the reaction, before a second, but less steep decrease indicates a slower reduction compared to the initial process. An explanation for these different reaction rates can be given by looking at the reaction mechanism of 4-nitrophenol to 4-aminophenol (see Scheme 2). Firstly, 4-nitrophenol is hydrogenated to 4-nitrosophenol, followed by a hydrogenation to 4-hydroxyaminophenol. This is then hydrogenated to the final product, 4-aminophenol [26]. A possible explanation for the different reaction rates found for the reduction of 4-nitrophenol is thus the stepwise reduction via 4-nitrosophenol (steep decrease) and 4-hydroxyaminophenol (slow increase) before the latter is reduced to 4-aminophenol (slow decrease). We will use the stepwise reduction displayed in Scheme 2 to describe the experimental results.
Figure 2. (a) The UV-Vis absorbance spectrum of the reduction of 4-nitrophenol to 4-aminophenol via PtPb nanoparticles as the catalyst; (b) The UV-Vis absorbance spectrum for the reduction of 4-nitrophenol over 600 s (black spheres), monitored at 400 nm. The red spheres show the absorbance of the measurement from the spectrum displayed in (a). Both reductions were performed at 23 °C with 1 mg of catalyst (i.e., 0.3 mg PtPb NPs and 0.7 mg polymer), an initial NaBH4 concentration of cNABH4 = 6.196 mM and an initial 4-nitrophenol concentration of cNip = 0.0317 mM.
Catalysts 04 00256 g002
Note that amines may poison the catalyst, which is why only the first part of the reaction, i.e., the fast reduction of 4-nitrophenol to 4-nitrosophenol, will be evaluated. This allows not only the exclusion of catalyst poisoning, but also the consideration of the NaBH4 concentration as constant, which, in turn, justifies treating the first step as a reaction of pseudo first order.
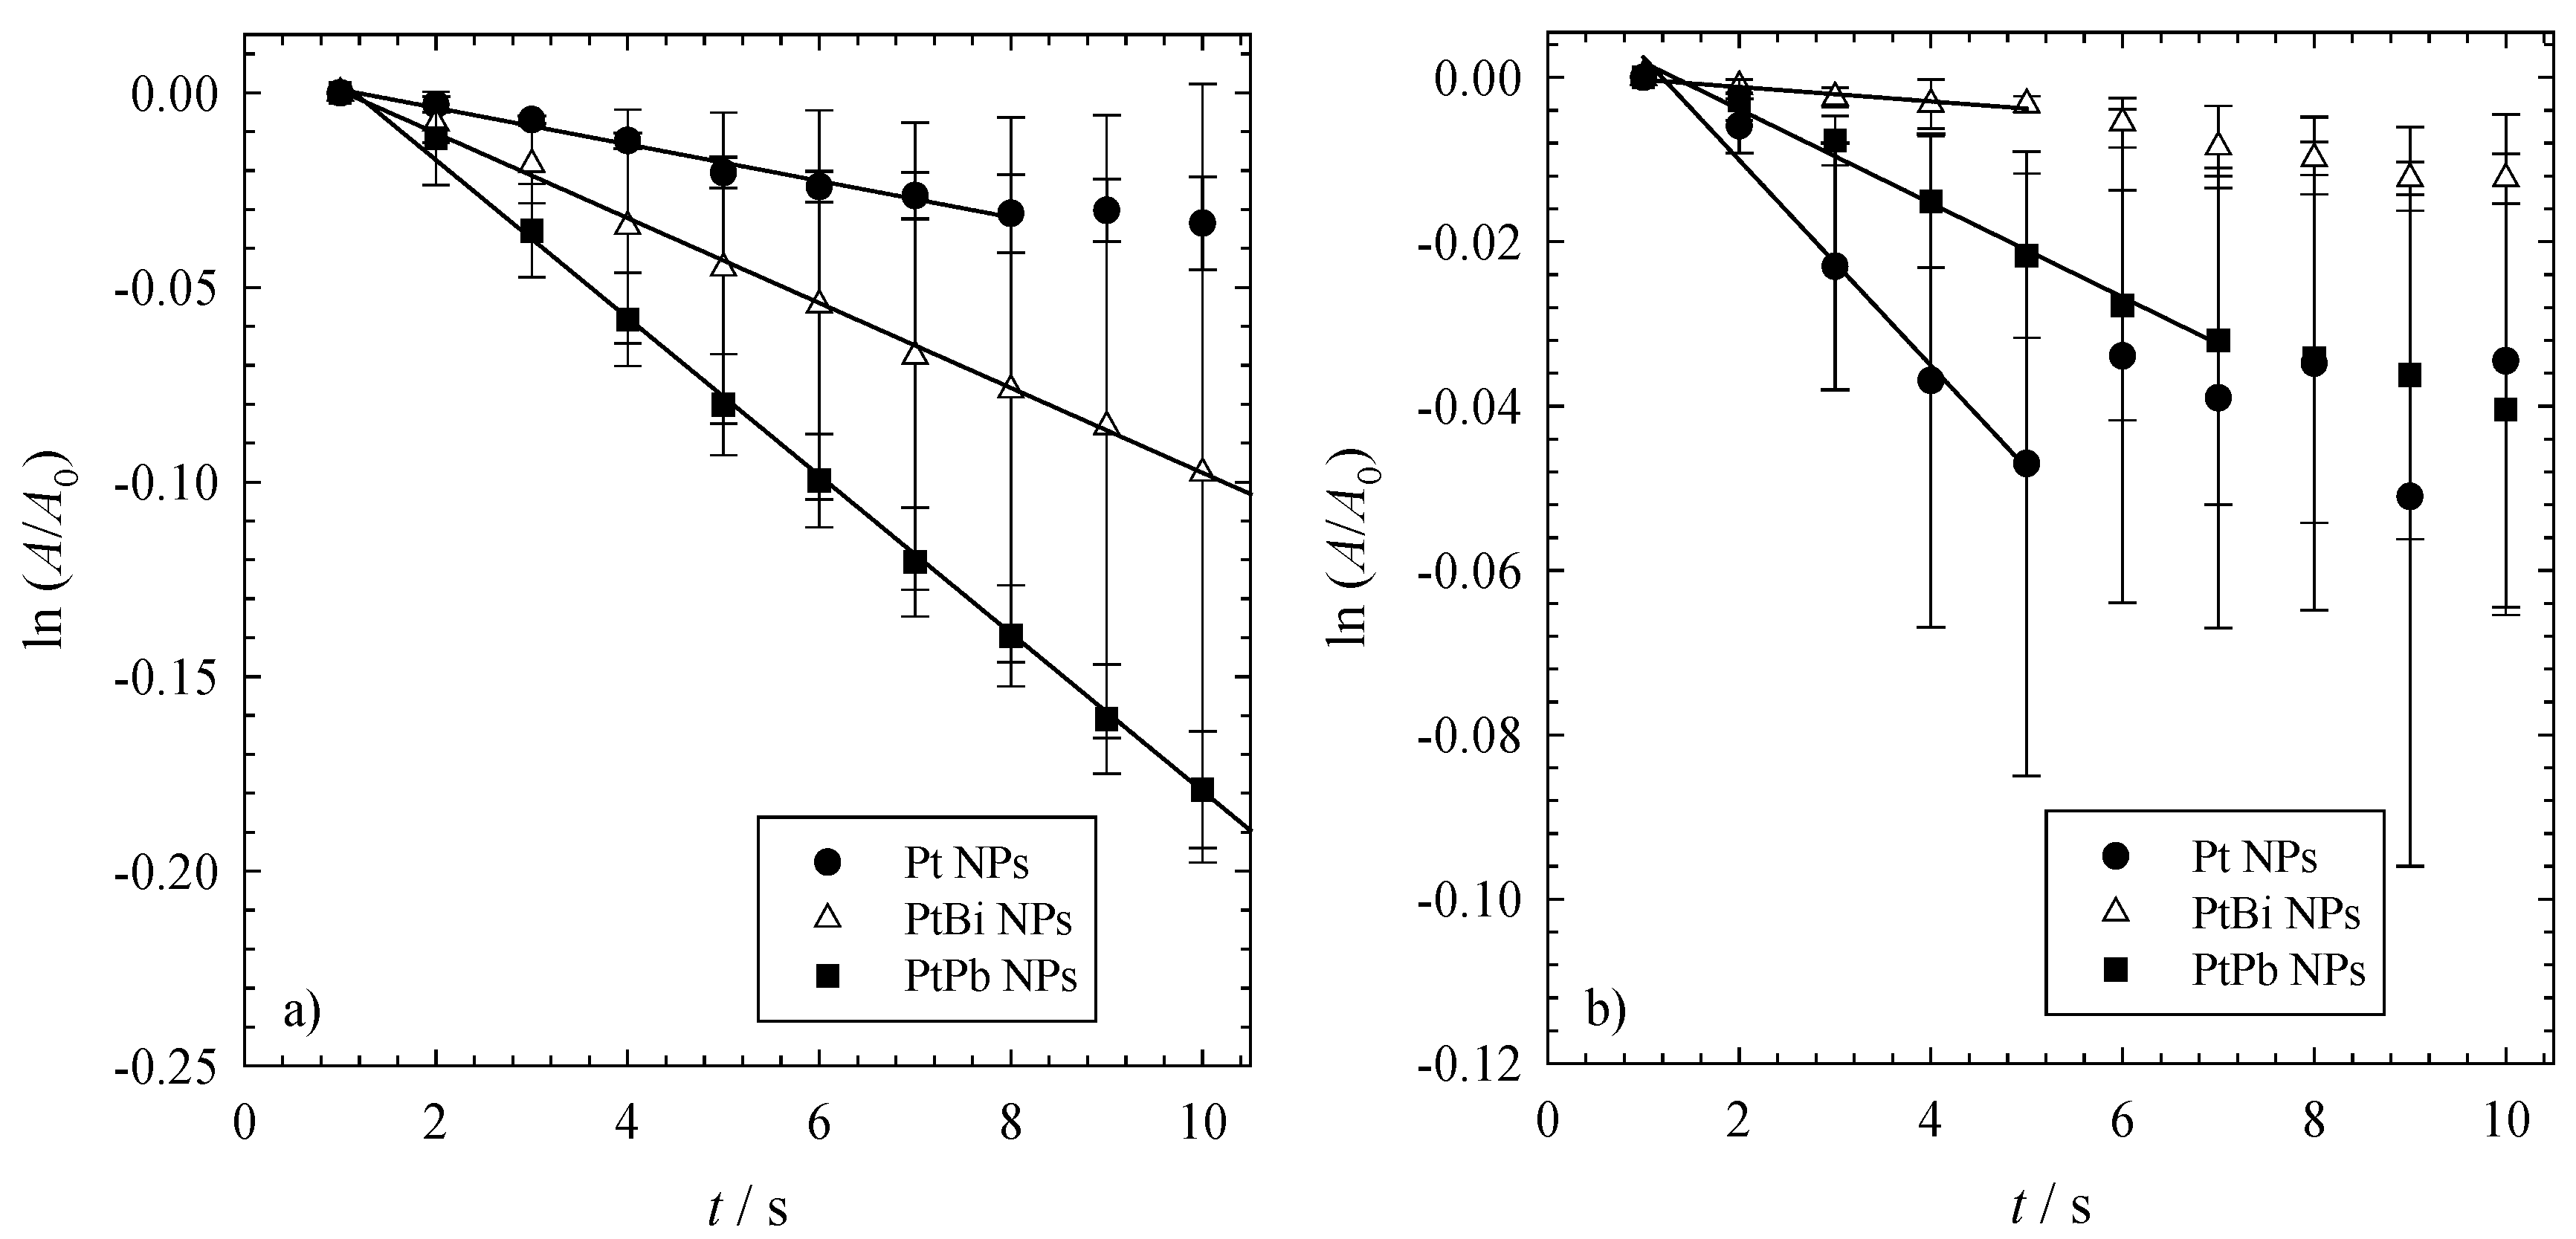
To obtain more information about the kinetics of the reduction of 4-nitrophenol via NaBH4 using the three different nanoparticles as the catalyst, one can plot ln(A/A0) as a function of time for the first 10 s after the start of the reaction (see Figure 3).
Figure 3. The time-dependent change of the concentration of 4-nitrophenol ln(A/A0) versus time t. All reductions were performed with 1mg of catalyst (i.e., 0.3 mg NPs and 0.7 mg polymer), an initial NaBH4 concentration of cNABH4 = 6.196 mM and an initial 4-nitrophenol concentration of cNip = 0.0317 mM at (a) 23 °C and (b) 36 °C.
Catalysts 04 00256 g003
The data shown in Figure 3 allow calculating the rate constants of the first reaction step, i.e., of the hydrogenation of 4-nitrophenol to 4-nitrosophenol using first order kinetics (see Equation (1) in Section 3.4). It is evident that the rate constants of the mono- and bi-metallic nanoparticles change with the temperature at which the reaction is performed. While at ambient temperature (see Figure 3a), one finds that the bimetallic nanoparticles are more active for the reduction of 4-NIP, the monometallic platinum nanoparticles are more active at higher temperatures (see Figure 3b). This can be further seen by the kinetic rate constants shown in 
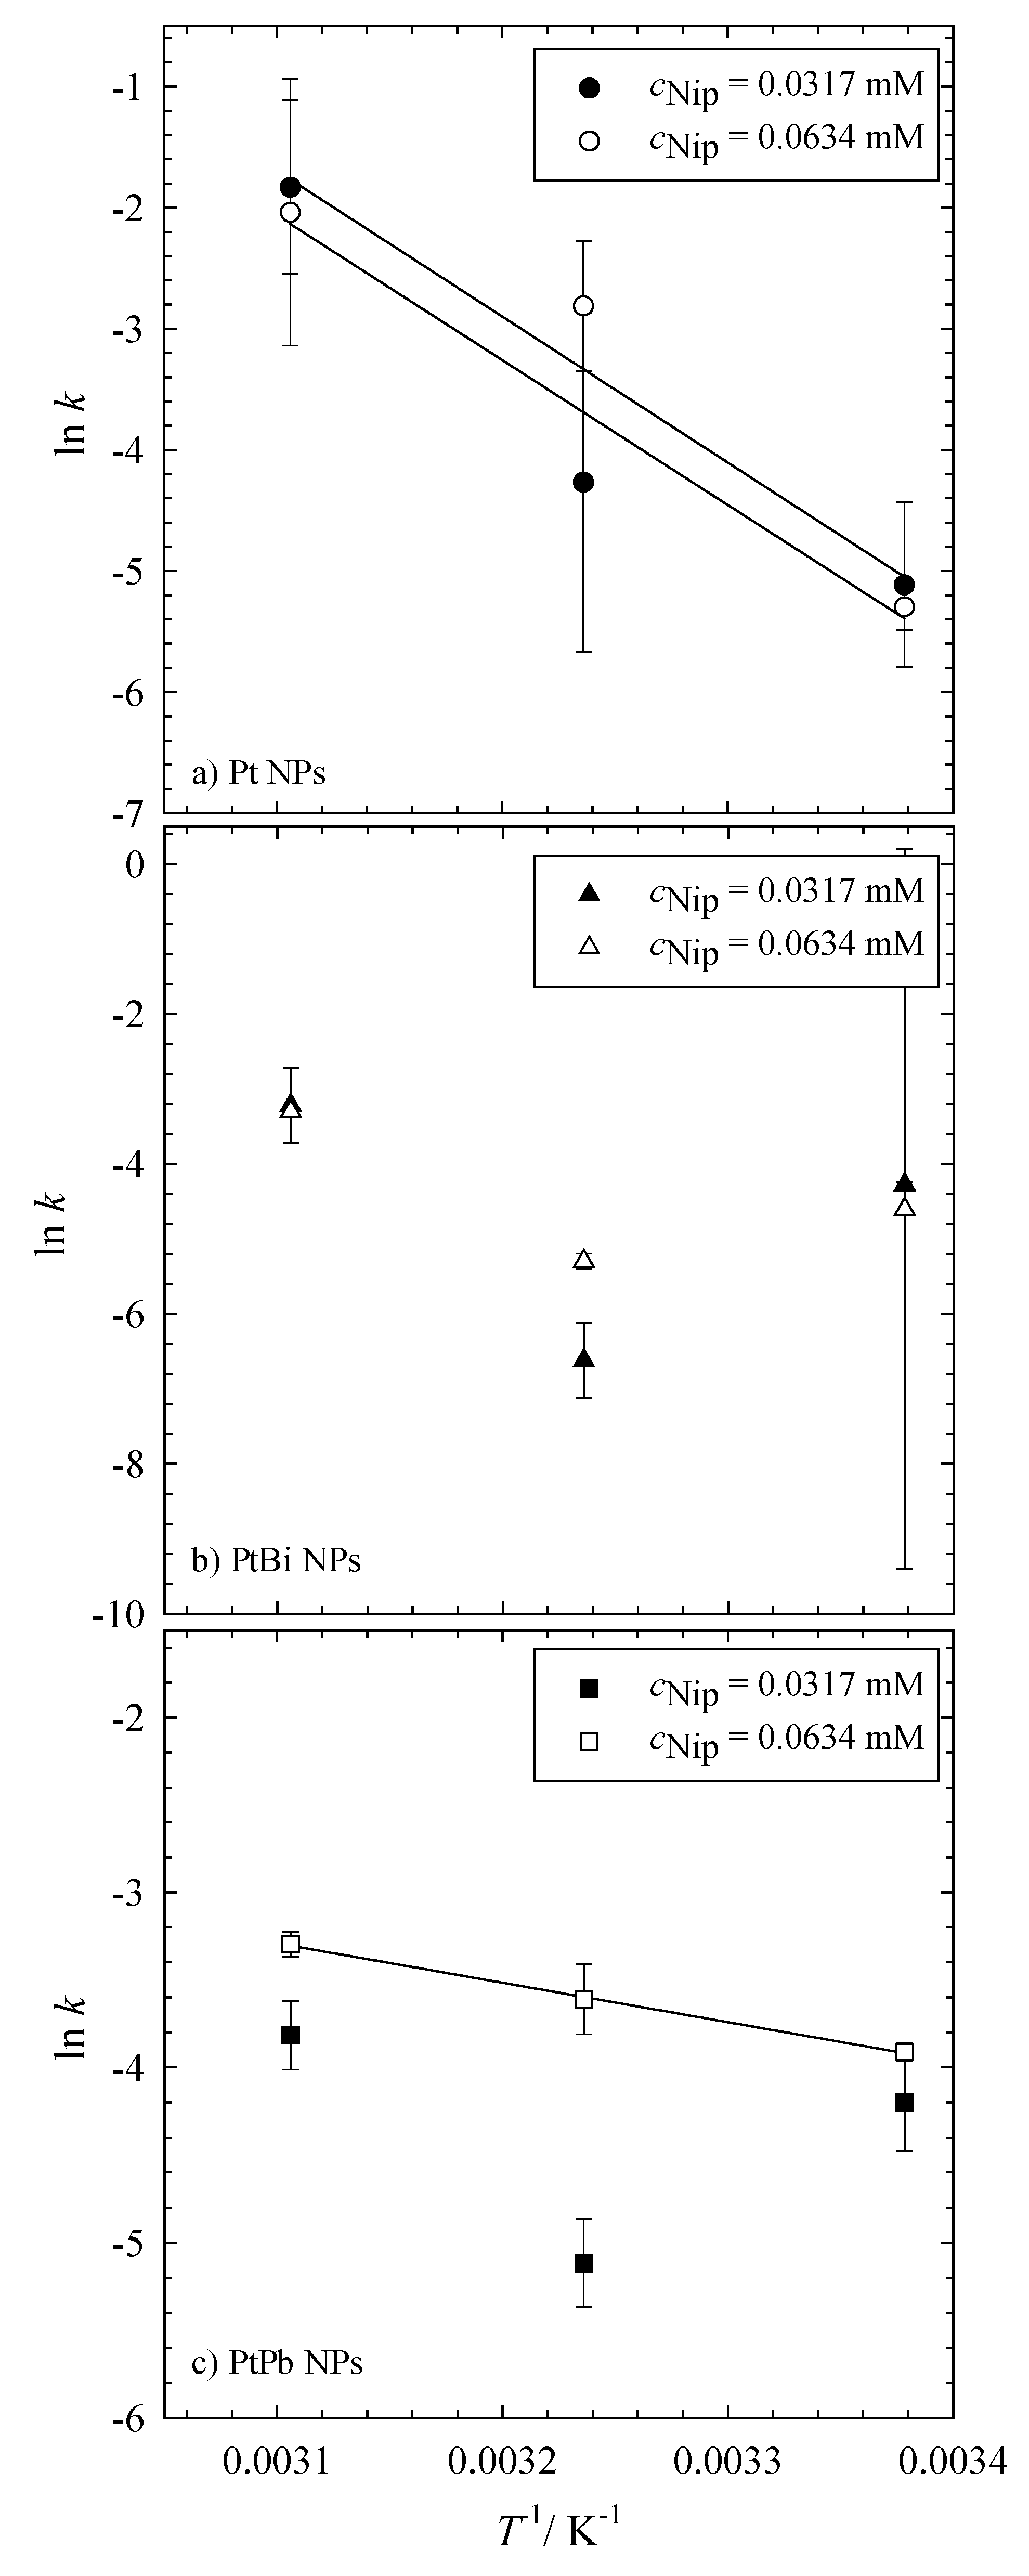
Table 3. For the reaction catalyzed with the monometallic platinum nanoparticles, the kinetic rate constants k' increase with increasing temperature and can be regarded as almost independent of the initial concentration of 4-nitrophenol (see Table 3). A linear increase of the rate constant with temperature, as displayed in Figure 4a, underlines the pseudo first-order reaction kinetics of the reduction of 4-nitrophenol to 4-nitrosophenol via NaBH4 catalyzed by the platinum nanoparticles. Unfortunately, the rate constants calculated for the reaction catalyzed by the bimetallic PtBi and PtPb nanoparticles do not follow this trend (see Figure 4b,c). It is obvious that the calculated rate constants are not independent of the initial concentration of 4-nitrophenol and that their values are not related to each other.
Table 3. The first-order rate constants for the reduction of 4-nitrophenol to 4-nitrosophenol using NaBH4 as the reducing agent and three different nanoparticles as the catalyst. All reductions were performed with 1 mg of catalysts (i.e., 0.3 mg Pt, PtPb, PtBi NPs and 0.7 mg polymer) and a constant concentration of the reducing agent (6.196 mM NaBH4). The reduction was measured at 23 °C, 36 °C and 49 °C.
CatalystsInitial reactant concentration (cNip)/mMRate constants (k'/s−1) at Different temperatures
T = 23 °CT = 36 °CT = 49 °C
Pt/PEIPEO0.03170.006 ± 0.0040.014 ± 0.0120.16 ± 0.11
0.06340.005 ± 0.0010.05 ± 0.020.13 ± 0.09
PtBi/PEIPEO0.03170.014 ± 0.0010.013 ± 0.0090.04 ± 0.015
0.06340.01 ± 0.010.005 ± 0.00050.037 ± 0.003
PtPb/PEIPEO0.03170.015 ± 0.0040.006 ± 0.0020.022 ± 0.004
0.06340.020 ± 0.0010.027 ± 0.0050.037 ± 0.003
The trend seen in Figure 4 for the bimetallic nanoparticles supports the idea that the kinetics of the reduction of 4-nitrophenol cannot be simply described by a pseudo first-order reaction, but more complex mechanisms need to be considered, i.e., the influence of the support material (PEIPEO). A similar trend was seen by Mei et al. and Lu et al. for the reduction of 4-nitrophenol catalyzed by palladium nanoparticles and silver nanoparticles, respectively [31,33]. Their nanoparticles were stabilized on a poly(N-isopropylacrylamide) (PNIPA) network, the structure of which was strongly influenced by the temperature of the reaction. The shrinking of the network, due to an expulsion of water, is followed by a slowing down of the diffusion of the reactants within the polymer network. This process, in turn, lowers the rate of the reaction catalyzed by the nanoparticles. At higher temperatures, the expected increase in the kinetic rate constants is overcompensated by the diffusional barrier. If the temperature is increased further, the density of the network stays constant and the increase of k with T dominates, so that the reaction rate was found to rise again [31]. Their findings could indeed explain the trend seen in our measurements, especially for the reaction catalyzed by the bimetallic nanoparticles.
It is evident that only the reduction of NIP catalyzed by the monometallic platinum nanoparticles shows an Arrhenius-like behavior, and the data can hence be used to calculate an apparent activation energy using the Arrhenius equation (Equation (2) in Section 3.4). In comparison to the results found in the literature, the apparent activation energy EA for the reaction catalyzed via the Pt NPs is rather high with EA = 99 ± 23 kJ∙mol−1 compared to the values between 30 and 45 kJ∙mol−1, which are typical for platinum and platinum-based nanoparticles catalyzed reactions [27,28,31]. This high apparent activation energy could be explained by desorption of the NaBH4 from the catalyst surface at high temperatures. At low temperatures, NaBH4 adsorbs at the surface of the catalyst, leaving less empty active sites for the reduction of 4-nitrophenol. With increasing temperature, NaBH4 desorbs and leaves a higher number of active sites, which, in turn, increases the rate constant significantly.
Since the kinetic analysis of the reduction of 4-nitrophenol is very complex and since our results for the bimetallic nanoparticles do not follow a pseudo first-order kinetic, another model reaction was used to obtain a better picture of the catalytic activity of the nanoparticles.
Figure 4. Arrhenius plot of the reduction of 4-nitrophenol to 4-nitrosophenol using NaBH4 as a reducing agent catalyzed via (a) Pt, (b) PtBi and (c) PtPb nanoparticles. All reductions were performed with 1 mg of catalysts (i.e., 0.3 mg Pt, PtPb, PtBi NPs and 0.7 mg of polymer) and a constant concentration of the reducing agent (6.196 mM NaBH4). The reduction was measured at 23 °C, 36 °C and 49 °C. The filled symbols denote the measurements with an initial concentration of cNip = 0.0317 mM, while the empty symbols denote the measurements with cNip = 0.0634 mM.
Catalysts 04 00256 g004

2.3. Hydrogenation of Allylbenzene

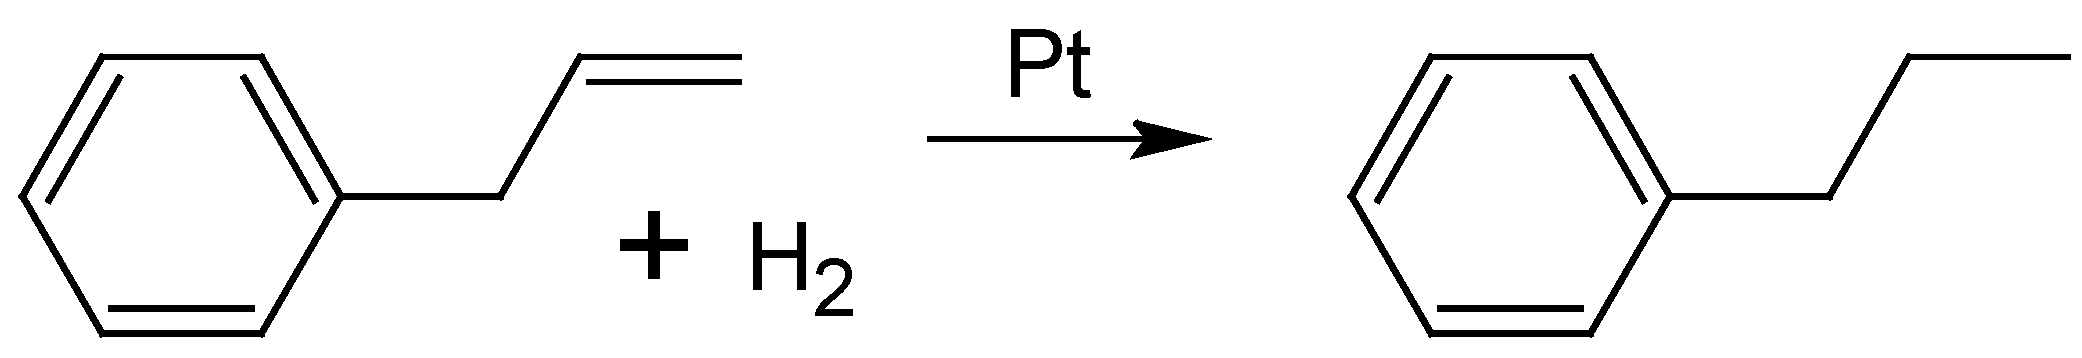
To obtain quantitative information about the catalytic activity of the bimetallic nanoparticles stabilized onto ethoxylated polyethylene imine, the hydrogenation of allylbenzene (AB) to propylbenzene (see Scheme 3) was studied.
Scheme 3. Hydrogenation of allylbenzene to propylbenzene using platinum catalysts.
Catalysts 04 00256 g008
The conversion of allylbenzene can be monitored directly by studying the consumption of hydrogen (see Equation (3) in 
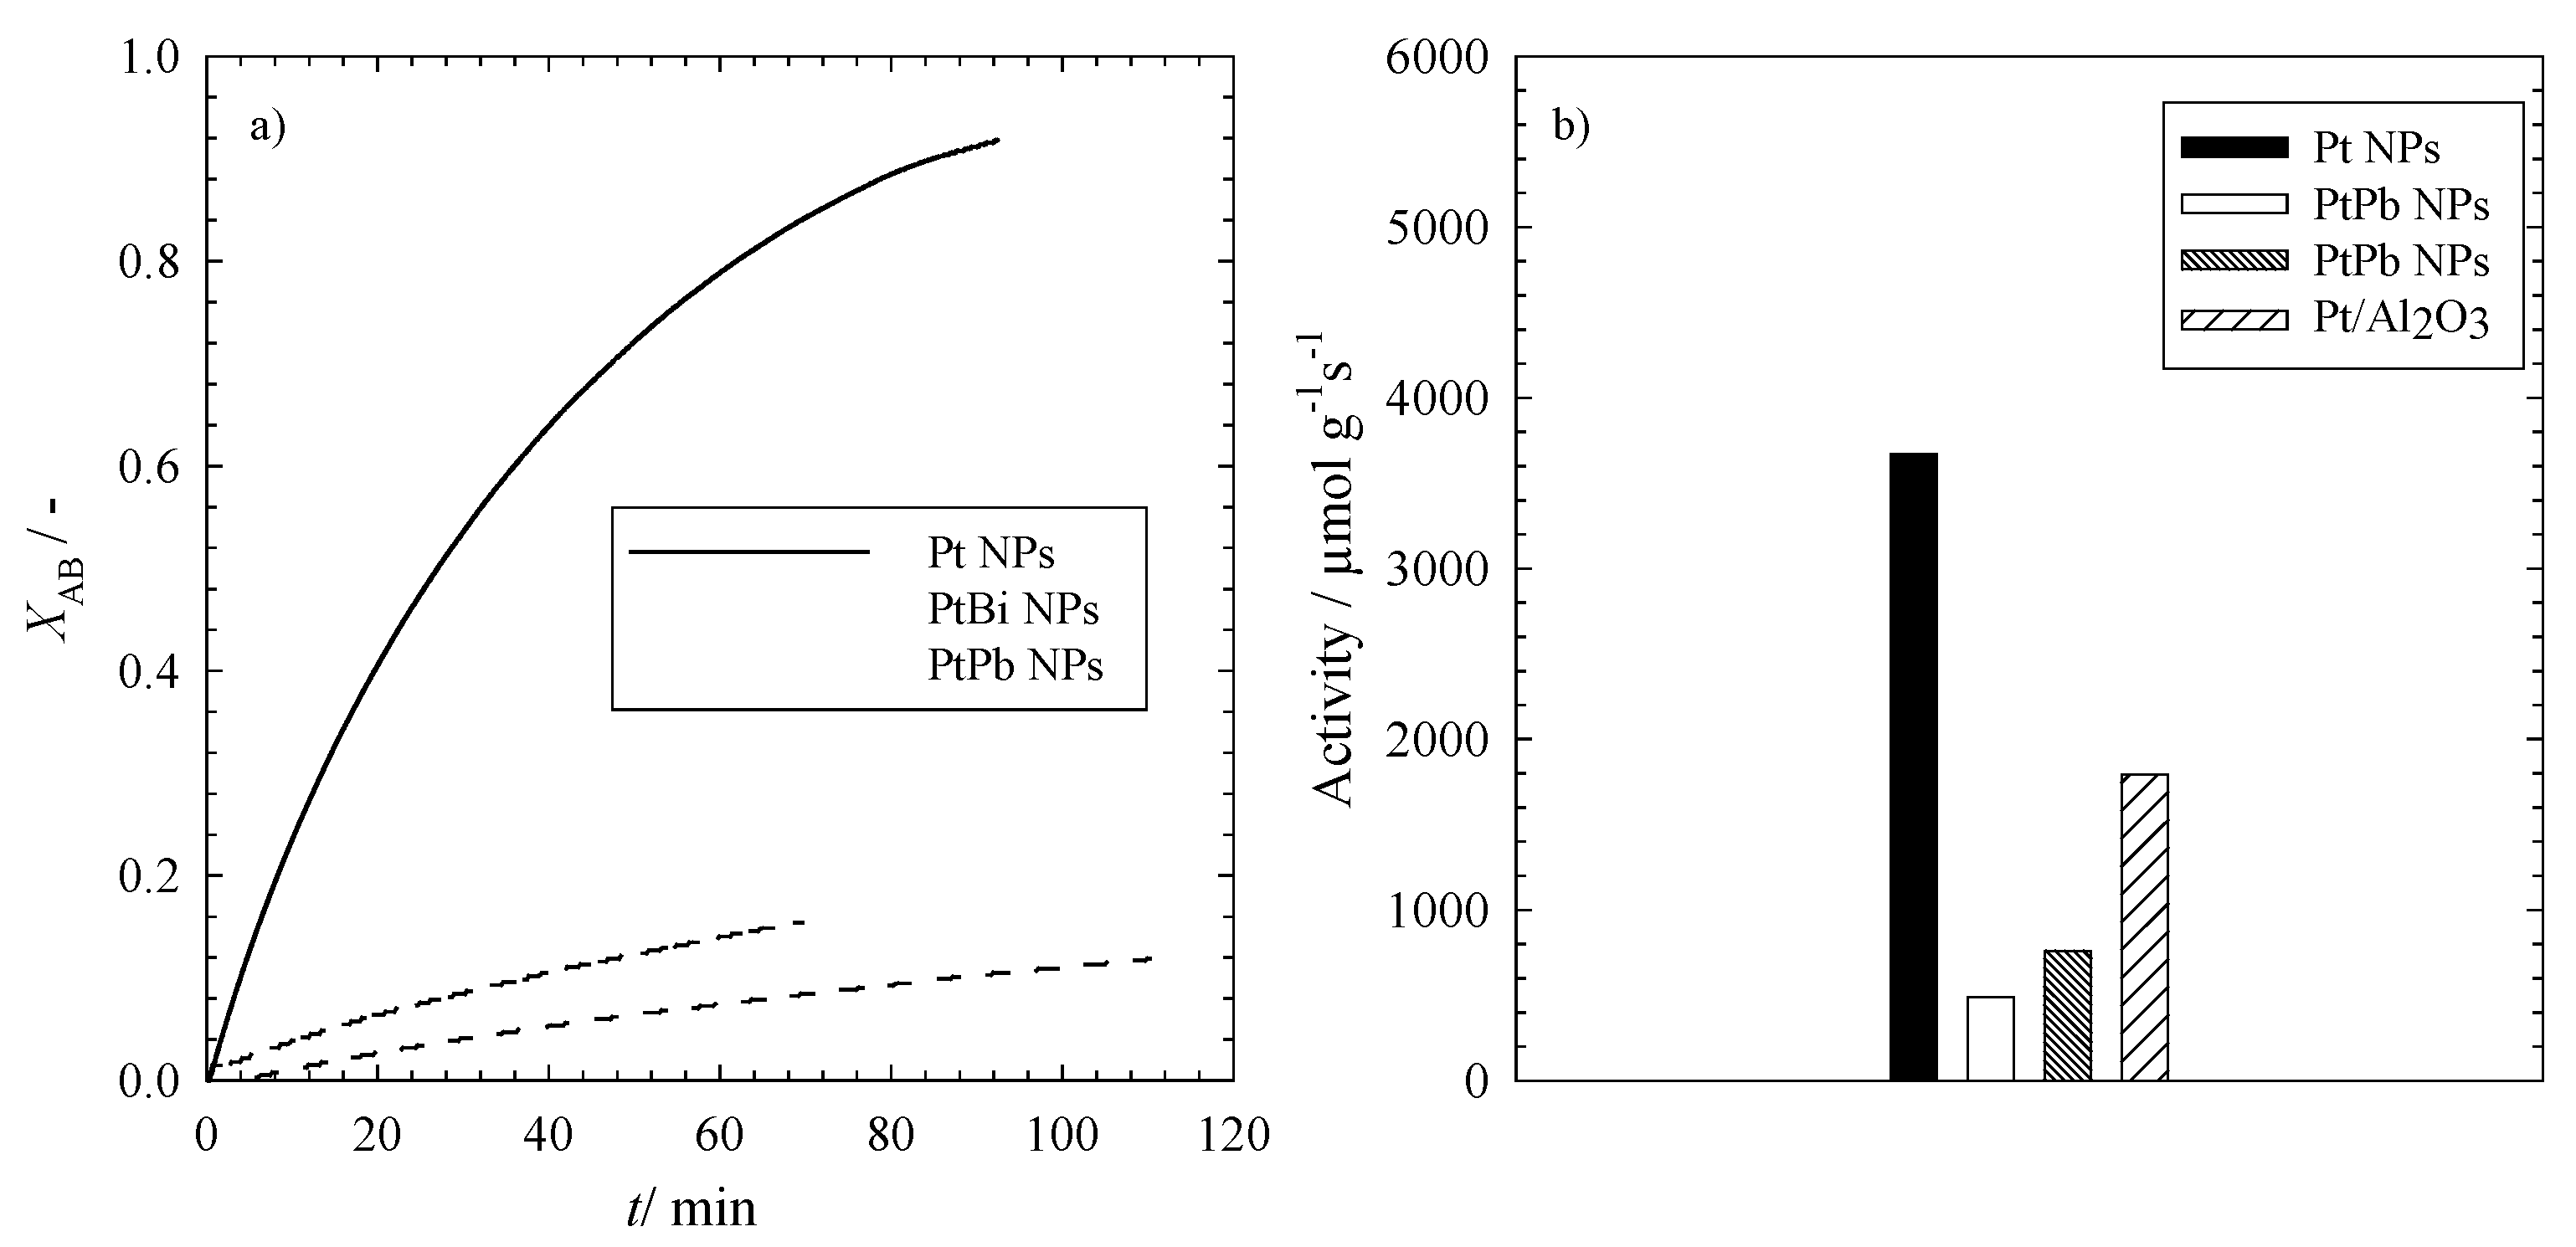
Section 3.4). To obtain the exact conversion of AB, a sample was taken after the reaction and was then analyzed via gas chromatography. In Figure 5a, the conversion of allylbenzene to propylbenzene XAB, calculated from Equation (3), is plotted versus time for the three different nanoparticles. It can be clearly seen that the three different types of nanoparticles convert AB on different time scales. The full conversion via the monometallic Pt NPs takes around 120 min, which is also the best catalyst for this reaction. With the bimetallic nanoparticles containing lead (PtPb NPs), the conversion is significantly slower compared to the former, but it is still faster than the conversion with the bimetallic platinum-bismuth nanoparticles (PtBi NPs). This is in line with the trend observed for the reduction of 4-nitrophenol.
To gain further insight into the kinetics of the reaction, one can calculate the initial reaction rates r0 for the hydrogenation of allylbenzene via Equation (4) in Section 3.4. The first ten percent of the conversion were taken to calculate the initial rate of the hydrogenation.
Figure 5. (a) The conversion of allylbenzene (XAB) to propylbenzene in the presence of monometallic platinum nanoparticles (Pt NPs) and the intermetallic platinum-bismuth (PtBi NPs) and platinum-lead (PtPb NPs) nanoparticles; (b) The activity of the different catalysts of the hydrogenation of allylbenzene to propylbenzene using Pt, PtBi and PtPb nanoparticles and a commercially available Pt catalyst. Please note that the activity refers to the amount of metal in the catalysts (see Equation (5)). All reactions were performed at T = 20 °C, pH2 = 1.1 MPa, n = 1200 rpm and V = 100 mL.
Catalysts 04 00256 g005
It is evident from Figure 5a that the platinum nanoparticles catalyze the reaction much faster with an initial reaction rate of r0 = 2.3 ± 0.9 mM∙min−1, which is 10 times higher than for the bimetallic PtPb nanoparticles (r0 = 0.20 ± 0.05 mM∙min−1), followed by the lowest initial reaction rate r0 = 0.10 ± 0.05 mM∙min−1 for the PtBi nanoparticles.
To compare the performance of our mono- and bi-metallic nanoparticles with that of a commercially available catalyst, it is necessary to calculate the activity of the catalysts a via Equation (5) in Section 3.4. In Figure 5b, the activities of the mono- and bi-metallic nanoparticles (Pt, PtBi and PtPb NPs) and of a commercially available Pt/Al2O3 catalyst are displayed. The activity of the synthesized monometallic platinum nanoparticles supported by ethoxylated polyethylene imine is significantly higher than that of the commercially available platinum nanoparticles supported by Al2O3, but it should be mentioned that a direct comparison of the results for the two supported catalysts is not possible. Although the same amount of Pt was used in the experiments and although the particles had comparable sizes, the activity of the two supported catalysts may differ, due to the following reasons: the impact of the support material, the accessible platinum surface area, pore or film diffusion effects, reactant distribution in the polymer-supported catalyst, oxidized Pt nanoparticles on the surface, etc. Since the focus of our research was the synthesis of nanoparticles via the microemulsion route, we did not carry out a systematic study, which allows comparing the different catalysts quantitatively. What we wanted to show is the fact that this route leads to active mono- and bi-metallic catalysts, clear proof for which is seen in Figure 5. However, the activity of the bimetallic nanoparticles is much lower compared to both the “home-made” and the commercially available monometallic Pt catalyst. Note that for all experiments with the mono- and bi-metallic catalysts, the total amount of metal was kept constant. Consequently, the amount of Pt in the bimetallic catalyst was much lower compared to the monometallic counterparts. It is well known that Pt is a good hydrogenation catalyst; therefore, the lower amount of Pt in the bimetallic catalysts might be the major reason for the lower activity in comparison to the monometallic ones. Consistent with the results found for the reduction of 4-nitrophenol, the bimetallic platinum-lead nanoparticles show slightly higher activities compared to the platinum-bismuth nanoparticles.

3. Experimental Section

3.1. Materials

The microemulsions used to synthesize the mono- and bi-metallic nanoparticles consisted of bidistilled water for the water phase, n-octane (99% purity, Sigma Aldrich, Steinheim, Germany) as the oil phase, tetraethyleneglycol mono-dodecyl ether (Brij 30, Sigma Aldrich, Steinheim, Germany) as the surfactant and n-octanol (≥99% purity, Sigma Aldrich, Steinheim, Germany) as the co-surfactant. The metal salts used were hexachloroplatinic acid hydrate (H2PtCl6·H2O, 99.95% purity, Sigma Aldrich, Steinheim, Germany) for the monometallic platinum nanoparticles and a one-to-one molar ratio of H2PtCl6 with bismuth nitrate (99.95% purity, Sigma Aldrich, Steinheim, Germany) or lead nitrate (99.95% purity, Sigma Aldrich, Steinheim, Germany) for the bimetallic nanoparticles. To solubilize the bismuth nitrate in the aqueous phase, it was first dissolved in nitric acid (≥65%, Merck, Darmstadt, Germany). The reducing agent used is sodium borohydrate (NaBH4, 99% purity, Merck, Darmstadt, Germany). The polymer used to stabilize the nanoparticles is ethoxylated polyethylene imine (PEIPEO, BASF, Ludwigshafen, Germany), which has a molecular weight of about 13,000 g∙mol−1. The polymer originated from a hyperbranched PEI of a molecular weight of around 600 g∙mol−1 and the substitutable hydrogens on the primary and secondary nitrogens were replaced by ethoxylated chains containing, on average, 20 repeating units. The electrolyte for the cyclic voltammetric measurements consisted of formic acid (FA, ≥95% purity, Sigma Aldrich) and sulfuric acid (1M, Fluka, Buchs, Switzerland). The model reactions with 4-nitrophenol (NIP, ≥99.5% purity Fluka, Buchs, Switzerland) and allylbenzene (AB, 98% purity, Sigma Aldrich, Steinheim, Germany) as substrates were performed in methanol (≥99.95% purity, Carl Roth, Karlsruhe, Germany). The hydrogenation of allylbenzene was also performed using a commercial available platinum catalyst (Pt/Al2O3, 1 wt% metal loading, Sigma Aldrich, Steinheim, Germany). All chemicals were used without further purification.

3.2. Nanoparticle Synthesis

The nanoparticles were prepared following the procedure developed by Magno et al. [13,14,34]. First, the metal salts were solubilized in water at the concentrations given in Table 4. It is important to work under a nitrogen atmosphere to avoid the oxidation of the metals. This solution is then used as the aqueous phase in the w/o-microemulsion (H2O/metal solute—n-octane—Brij 30/1-octanol). The main surfactant, Brij 30, is a non-ionic commercially available surfactant containing an average of four ethylene oxide groups.
Table 4. The concentrations of metal salts and the reducing agent solubilized in water.
SoluteConcentration
H2PtCl626 mM (20 mM for Pt NPs)
Bi(NO3)3/HNO326 mM/2 M (40 mM for Bi NPs)
Pb(NO3)226 mM (40 mM for Pb NPs)
NaBH4320 mM
To synthesize the nanoparticles, one has to mix two microemulsions, one containing the metal salt(s) and the other containing the reducing agent NaBH4 in the aqueous phase. Prior to any synthesis, the two microemulsions have to be kept at the same temperature just below the water emulsification failure boundary for about 30 min. While macroscopically, the 1-phase region appears clear, the 2- and 3-phase regions are turbid during stirring. This allows a simple visual detection of the phase boundaries. While both microemulsions are prepared at a constant amount of the aqueous phase (wA = 0.08), the amount of co-surfactant (δ) is different in order to adjust the phase boundary of both systems. To prepare homogeneously-sized NPs, it is important to pour the microemulsion containing the metal salt(s) into the one containing the reducing agent in a single fast step under vigorous stirring [35].
After the synthesis, the resulting mixture has to be kept for about an hour at constant temperature under stirring. To avoid particle agglomeration, the ethoxylated polyethylene imine, PEIPEO, is added to the mixture. Afterwards, the NPs are separated by centrifugation, washed with both ethanol and water three times each and are then stored in ethanol. The size of the resulting nanoparticles have been determined via an HRTEM analysis of over 100 particles to be d = 4.2 ± 1.4 nm for the monometallic platinum NPs, d = 4.8 ± 1.4 nm for the PtBi NPs and d = 3.9 ± 1.5 nm for the bimetallic PtPb nanoparticles. From the literature, a particle size of 3.4 nm was found for a commercial Pt@Al2O3 catalyst with 5 wt% loading [36]. Furthermore, many other supported catalysts show particle sizes in the range of 3–5 nm; therefore, the sizes of our nanoparticles are comparable with those of the commercial ones. The amount of metal in the resulting catalyst, as well as the composition of the bimetallic nanoparticles was studied via inductively-coupled plasma optical emission spectrometry using a Varian Vista-MPX CCD Simultaneous ICP-OES and a Spectro SOP from Spectro Analytical Instruments GmbH (Kleve, Germany). The data was analyzed using the software, Smart Analyzer Vision (Spectro Analytical Instruments GmbH, Kleve, Germany). The compositions of all used catalysts are listed in Table 5.
Table 5. Composition of the mono- and bi-metallic platinum-based catalysts.
CatalystMetal composition in the catalyst/%SupportTotal metal loading/wt %Total Pt loading/wt%
PlatinumOther metal
Pt NPs100-PEIPEO3030
PtBi NPs28.671.4PEIPEO308.6
PtPb NPs62.537.5PEIPEO3018.75
Pt/Al2O3100-Al2O311

3.3. Cyclic Voltammetry

For the cyclic voltammograms, the nanoparticles were brought into solution using ethanol at a concentration of 1 g∙L−1 after the synthesis. This solution was then sonicated in an ultrasonic bath for about 10 min prior to the coating of the electrodes. Glassy Carbon (GC) electrodes were used for all of the experiments. These plain electrodes were polished and washed in acetone before adding the nanoparticle solution (about 5 µL), which is suspended on the polished side of the electrodes. An activation of the electrodes is provided by running 5 cycles in 0.1 M sulfuric acid at a sweep rate of 50 mV∙s−1. All cyclic voltammetry measurements were done with a platinum plate as the counter electrode and a pseudo reference electrode consisting of an AgCl-wire. The potentiostat, Autolab PGSTAT 101, from Metrohm (Utrecht, The Netherlands), and the software, Nova 1.7 (Metrohm, Utrecht, The Netherlands), were used. The sweep rate of all measurements is 10 mV∙s−1, and the reverse potentials are at −0.4 V and +1.2 V, following the procedure described in [21]. All measurements were performed in an open set-up and at ambient temperature. Please note that the surface area of the nanoparticles could not be determined due to the following problem: the experimental set-up did not allow immersing a specific part of the glassy carbon disc into the solution. In other words, during each measurement, a different surface area was accessible. Thus, even knowing the total surface area of the samples would not allow one to specify the immersed (i.e., the relevant) surface area. To circumvent this problem, the data is evaluated according to the manner described by [19]. The advantage of this procedure is the fact that one has a quick, but straightforward method to compare the immunity against CO poisoning of the catalysts.

3.4. Model Reactions

To follow the reduction of 4-nitrophenol to 4-aminophenol, one can use a UV-Vis spectrometer. After the synthesis, the nanoparticles were dried under nitrogen, and 1 mg of the nanoparticles and the polymer (i.e., 0.3 mg NPs plus 0.7 mg polymer) was filled into a quartz glass cuvette. Afterwards, 100 µL of 4-nitrophenol at different concentrations and 3 mL of water were added into the cuvette. The two different initial concentrations of 4-nitrophenol, i.e., cNip = 0.0317 mM and cNip = 0.0634 mM, were reduced at three different temperatures, namely at 23, 36 and 49 °C. The measurements were performed with the UV-Vis spectrometer, Lambda 25 by Perkin Elmer (Rodgau, Germany). All measurements were performed under constant stirring.
The hydrogenation of 4-nitrophenol to 4-nitrosophenol is a pseudo first-order reaction, which means the rate r depends linearly only on one reactant concentration [NIP]. It holds
Catalysts 04 00256 i001
The temperature dependence of the rate constant is given by the Arrhenius equation
Catalysts 04 00256 i002
where A is the so-called frequency factor, Ea the apparent activation energy, R the gas constant and T the temperature of the reaction.
The hydrogenations of allylbenzene were performed in a tempered double-walled 200 mL glass reactor equipped with a gas dispersion stirrer [37]. The sealing of the reactor needs to be checked prior to the reactions. For this, the empty reactor was evacuated and rinsed with nitrogen, and it was verified that the pressure inside the reactor does not change when the vacuum is applied. At the same time, the nanoparticles were dried under nitrogen after their synthesis. Prior to the actual reaction, 98 mL of methanol were bubbled through with nitrogen for 20 min. Afterwards, 1.5 mg of the nanoparticles and the polymer (i.e., 0.5 mg NPs) were dispersed in ca. 5mL methanol, ultrasonicated for around 5 min and then transferred into the reactor. The remaining methanol was then also filled into the reactor. Two grams of the reactant were weighted and then filled into the reactor, which already contained 98 mL of methanol and 1.5 mg of the catalyst (NPs and polymer). The reactor was then evacuated to 0.015 MPa and refilled with nitrogen for four consecutive cycles. The solution was stirred at 600 rpm for 20 min at a reaction temperature of 20 °C. The reaction was initiated by stirring at 1200 rpm after the reactor was evacuated to 0.015 MPa and filled with hydrogen to a total pressure of 0.11 MPa. The reaction was followed by measuring the pressure, the rate of hydrogen consumption and the amount of consumed hydrogen with a pressure controller and a flow meter, respectively.
As only the methylene group of AB is hydrogenated, the conversion X is directly proportional to the hydrogen consumption and can be calculated from [37]:
Catalysts 04 00256 i003
where V(H2)t is the volume of hydrogen at time t and V(H2)t=0 is the initial volume of hydrogen.
To compare the different reaction rates, one can calculate the initial reaction rates r0 of the hydrogenation of allylbenzene using the following formula:
r0 = c0(dX / dt)0
where r0 is the initial reaction rate of the hydrogenation, c0 the initial concentration of allylbenzene and (dX/dt) the initial slope of the conversion process. The first ten percent of the conversion were taken to calculate the initial reaction rate of the hydrogenation.
For a comparison of the mono- and bi-metallic nanoparticles with commercially available platinum catalysts, the overall activity a of the catalysts has to be calculated. The activity of the catalysts is given by:
Catalysts 04 00256 i004
where nproduct is the number of moles of the product (i.e., propylbenzene), mmetal is the amount of metal used as the catalyst (without the polymer) and tc is the time needed to convert the amount nproduct.

4. Conclusions

The catalytic activity of Pt, PtBi and PtPb nanoparticles synthesized via water-in-oil microemulsions was investigated in three different test reactions. Via the electrochemical oxidation of formic acid, it was found that the bimetallic PtBi and PtPb nanoparticles (NPs) are much less affected by CO poisoning than the monometallic Pt nanoparticles. It was also shown that the mixture of phases present in the NPs does not have a significant impact on this tolerance for the PtBi NPs, while it seems to affect the tolerance of the PtPb NPs. Since it was not possible to quantify the catalytic activity of the mono- and bi-metallic nanoparticles for the electrochemical oxidation of formic acid, different model reactions were used to obtain quantitative data. The reduction of 4-nitrophenol via NaBH4 can be catalyzed not only by monometallic Pt nanoparticles, but also by the bimetallic PtBi and PtPb nanoparticles. However, the reduction via the three different catalysts does not follow pseudo first-order kinetics, even with a 200-times excess of the reducing agent, which is the common approach in the literature [28,29,31,32,33]. Our results strongly indicate: (1) the presence of first-order kinetics only for the first step of the reduction mechanism, i.e., the hydrogenation of 4-nitrophenol to 4-nitrosophenol; and (2) a strong influence of the temperature on the kinetics of the reaction, which cannot be described with the Arrhenius equation.
Via the hydrogenation of allylbenzene to propylbenzene, the catalytic activity of the Pt, PtBi and PtPb nanoparticles was studied. It was first shown that all three nanoparticles are able to catalyze the reaction. The monometallic platinum nanoparticles were found to be the best catalyst, followed by the bimetallic PtPb and the bimetallic PtBi nanoparticles. A comparison of the activities of the three different nanoparticles with those of commercially available Pt catalyst supported by Al2O3 revealed that the catalytic activity of the monometallic Pt nanoparticles is significantly higher.
In summary, the great potential of the synthesized bimetallic nanoparticles for catalytic applications was shown. The bimetallic PtPb nanoparticles synthesized in water-in-oil microemulsions can be a real alternative to pure platinum as the catalyst material for several applications. Future work is currently focused on testing the selectivity of the three different nanoparticles in the selective hydrogenation of 1,5-cyclooctadiene. Furthermore, we are working on a general improvement of the catalyst, e.g., by changing the support material.

Acknowledgments

We would like to thank Steffen Link and Sabine Ludwigs for fruitful discussions. Furthermore, we would like to thank Robin Himmelmann and Moritz Heuchel for measuring UV-Vis spectra, Christian Schlick for the synthesis of nanoparticles and Florian Waizenhöfer for measuring the hydrogenation.

Author Contributions

Ramona Y.G. König carried out the CV measurements and the reduction of 4-nitrophenol on her own. The hydrogenation of AB was carried out jointly by Ramona Y.G. König and Michael Schwarze. The results of 4-NIP and AB were discussed and interpreted together (25% for each author). The manuscript was written by Ramona Y.G. König (70%), Cosima Stubenrauch (20%), Michael Schwarze (5%) and Reinhard Schomäcker (5%).

Conflicts of Interest

The authors declare no conflict of interest.

References

  1. Gasteiger, H.A.; Kocha, S.S.; Sompalli, B.; Wagner, F.T. Activity Benchmarks and Requirements for Pt, Pt-Alloys, and Non-Pt Oxygen Reduction Catalysts for PEMFCs. Appl. Catal. B 2005, 56, 9–35. [Google Scholar] [CrossRef]
  2. Gasteiger, H.A.; Markovic, N.M. Just a Dream—Or Future Reality? Advances in Catalyst Development Offer Hope for Commercially Viable Fuel Cells. Science 2009, 324, 48–49. [Google Scholar] [CrossRef]
  3. Yu, X.; Ye, S. Recent advances in activity and durability enhancement of Pt/C catalytic cathode in PEMFC: Part I. Physico-chemical and electronic interaction between Pt and carbon support, and activity enhancement of Pt/C catalyst. J. Power Sources 2007, 172, 133–144. [Google Scholar] [CrossRef]
  4. Yu, X.; Ye, S. Recent advances in activity and durability enhancement of Pt/C catalytic cathode in PEMFC: Part II: Degradation mechanism and durability enhancement of carbon supported platinum catalyst. J. Power Sources 2007, 172, 145–154. [Google Scholar] [CrossRef]
  5. Casodo-Rivera, E.; Volpe, D.J.; Alden, L.; Lind, C.; Downie, C.; Vazquez-Alvarez, T.; Angelo, A.C.D.; DiSalvo, F.J.; Abruna, H.D. Electrocatalytic Activity of Ordered Intermetallic Phases for Fuel Cell Applications. J. Am. Chem. Soc. 2004, 126, 4043–4049. [Google Scholar] [CrossRef]
  6. Casodo-Rivera, E.; Gal, Z.; Angelo, A.C.D.; Lind, C.; DiSalvo, F.J.; Abruna, H.D. Electrocatalytic Oxidation of Formic Acid at an Ordered Intermetallic PtBi Surface. Chem. Phys. Chem. 2003, 4, 193–199. [Google Scholar] [CrossRef]
  7. Roychowdhury, C.; Matsumoto, F.; Zeldovich, V.B.; Warren, S.C.; Mutolo, P.F.; Ballesteros, M.J.; Wiesner, U.; Abruna, H.D.; DiSalvo, F.J. Synthesis, Characterization, and Electrocatalytic Activity of PtBi and PtPb Nanoparticles Prepared by Borohydride Reduction inMethanol. Chem. Mater. 2006, 18, 3365–3372. [Google Scholar] [CrossRef]
  8. Volpe, D.; Casodo-Rivera, E.; Alden, L.; Lind, C.; Hagerdon, K.; Downie, C.; Korzeniewski, C.; DiSalvo, F.J.; Abruna, H.D. Surface Treatment Effects on the Electrocatalytic Activity and Characterization of Intermetallic Phases. J. Electrochem. Soc. 2004, 151, A971–A977. [Google Scholar] [CrossRef]
  9. Alden, L.R.; Han, D.K.; Matsumoto, F.; Abruna, H.D.; DiSalvo, F.J. Intermetallic PtPb NanoparticlesPrepared by Sodium Naphthalide Reduction of Metal-Organic Precursors: Electrocatalytic Oxidation of Formic Acid. Chem. Mater. 2006, 18, 5591–5596. [Google Scholar] [CrossRef]
  10. De-los-Santos-Alvarez, N.; Alden, L.R.; Rus, E.; Wang, H.; DiSalvo, F.J.; Abruna, H.D. CO Tolerance of Ordered Intermetallic Phases. J. Electroanal. Chem. 2009, 626, 14–22. [Google Scholar] [CrossRef]
  11. Mukerjee, S. Particle size and structural effects in platinum electrocatalysis. J. Appl. Electrochem. 1990, 20, 537–548. [Google Scholar] [CrossRef]
  12. Boutonnet, M.; Kizling, J.; Stenius, P.; Maire, G. The Preparation of Monodisperse Colloidal Metal Particles from Microemulsions. Colloid Surf. 1982, 5, 209–225. [Google Scholar] [CrossRef]
  13. Magno, L.M.; Sigle, W.; van Aken, P.A.; Angelescu, D.G.; Stubenrauch, C. Microemulsions as Reaction Media for the Synthesis of Bimetallic Nanoparticles: Size and Composition of Particles. Chem. Mater. 2010, 22, 6263–6271. [Google Scholar] [CrossRef]
  14. Magno, L.M.; Angelescu, D.G.; Sigle, W.; Stubenrauch, C. Microemulsions as reaction media for the synthesis of Pt nanoparticles. Phys. Chem. Chem. Phys. 2011, 13, 3048–3058. [Google Scholar] [CrossRef]
  15. Magno, L.M.; Sigle, W.; van Aken, P.A.; Angelescu, D.; Stubenrauch, C. Size control of PtPb intermetallic nanoparticles prepared via microemulsions. Phys. Chem. Chem. Phys. 2011, 13, 9134–9136. [Google Scholar]
  16. Capon, A.; Parsons, R. The Oxidation of Formic Acid at Noble Metal Electrodes Part III. Intermediates and Mechanism on Platinum Electrodes. J. Electroanal. Chem. Interfacial Electrochem. 1973, 45, 205–231. [Google Scholar] [CrossRef]
  17. Arenz, M.; Stamenkovic, V.; Schmidt, T.J.; Wandelt, K.; Ross, P.N.; Markovic, N.M. The electro-oxidation of formic acid on Pt–Pd single crystal bimetallic surfaces. Phys. Chem. Chem. Phys. 2003, 5, 4242–4251. [Google Scholar]
  18. Yang, H.; Dai, L.; Xu, D.; Fang, J.; Zou, S. Electrooxidation of methanol and formic acid on PtCu nanoparticles. Electrochim. Acta 2010, 55, 8000–8004. [Google Scholar] [CrossRef]
  19. Al-Akraa, I.; Mohammad, A.M.; El-Deab, M.S.; El-Anadouli, B.E. Development of Tailor-Designed Gold-Platinum Nanoparticles Binary Catalysts for Efficient Formic Acid Electrooxidation. Int. J. Electrochem.Sci. 2012, 7, 3939–3946. [Google Scholar]
  20. Blasini, D.R.; Rochefort, D.; Fachini, E.; Alden, L.R.; DiSalvo, F.J.; Cabrera, C.R.; Abruna, H.D. Surface Composition of Ordered Intermetallic Compounds PtBi And PtPb. Surf. Sci. 2006, 600, 2670–2680. [Google Scholar] [CrossRef]
  21. Ghosh, T.; Matsumoto, F.; McInnis, J.; Weiss, M.; Abruna, H.D.; DiSalvo, F.J. PtPb Nanoparticle Electrocatalysts: Control of Activity Through Synthetic Methods. J. Nanopart. Res. 2009, 11, 965–980. [Google Scholar] [CrossRef]
  22. Matsumoto, F.; Roychowdhury, C.; DiSalvo, F.J.; Abruna, H.D. Electrocatalytic Activity of Ordered Intermetallic PtPb Nanoparticles Prepared by Borohydride Reduction toward Formic Acid Oxidation. J. Electrochem. Soc. 2008, 155, B148–B154. [Google Scholar] [CrossRef]
  23. Tripkovic, A.V.; Popovic, K.D.; Stevanovic, R.M.; Socha, R.; Kowal, A. Activity of a PtBi alloy in the electrochemical oxidation of formic acid. Electrochem. Commun. 2006, 8, 1492–1498. [Google Scholar] [CrossRef]
  24. Koenig, R.Y.G. Characterization of Mono- and Bimetallic Nanoparticles synthesized via Microemulsions. Ph.D. Thesis, University of Stuttgart, Stuttgart, Germany, December 2013. [Google Scholar]
  25. Zhang, L.J.; Wang, Z.Y.; Xia, D.G. Bimetallic PtPb for formic acid electro-oxidation. J. Alloy. Compd. 2006, 426, 268–271. [Google Scholar] [CrossRef]
  26. Fenger, R.L. Kinetische Untersuchungen zur Reduktion von Nitroaromaten mit Goldnanopartikeln. Ph.D. Thesis, Physical Chemistry, Humboldt-University Berlin, Berlin, Germany, June 2013. [Google Scholar]
  27. Wunder, S.; Polzer, F.; Lu, Y.; Mei, Y.; Ballauff, M. Kinetic Analysis of Catalytic Reduction of 4-Nitrophenol by Metallic Nanoparticles Immobilized in Spherical Polyelectrolyte Brushes. J. Phys. Chem. C 2010, 114, 8814–8820. [Google Scholar]
  28. Ghosh, S.K.; Mandal, M.; Kundu, S.; Nath, S.; Pal, T. Bimetallic Pt–Ni nanoparticles can catalyze reduction of aromatic nitro compounds by sodium borohydride in aqueous solution. Appl. Catal. A 2004, 268, 61–66. [Google Scholar] [CrossRef]
  29. Kuroda, K.; Ishida, T.; Haruta, M. Reduction of 4-nitrophenol to 4-aminophenol over Au nanoparticles deposited on PMMA. J. Mol. Catal. A 2009, 298, 7–11. [Google Scholar] [CrossRef]
  30. Mei, Y.; Sharma, G.; Lu, Y.; Ballauff, M. High Catalytic Activity of Platinum Nanoparticles Immobilized on Spherical Polyelectrolyte Brushes. Langmuir 2005, 21, 12229–12234. [Google Scholar] [CrossRef]
  31. Mei, Y.; Lu, Y.; Polzer, F.; Ballauff, M.; Drechsler, M. Catalytic Activity of Palladium Nanoparticles Encapsulated in Spherical Polyelectrolyte Brushes and Core-Shell-Microgels. Chem. Mater. 2007, 19, 1062–1069. [Google Scholar] [CrossRef]
  32. Pozun, Z.D.; Rodenbusch, S.E.; Keller, E.; Tran, K.; Tang, W.; Stevenson, K.J.; Henkelman, G. A Systematic Investigation of p-Nitrophenol Reduction by Bimetallic Dendrimer Encapsulated Nanoparticles. J. Phys. Chem. C 2013, 117, 7598–7604. [Google Scholar]
  33. Lu, Y.; Mei, Y.; Drechsler, M.; Ballauff, M. Thermosensitive Core–Shell Particles as Carriers for Ag Nanoparticles: Modulating the Catalytic Activity by a Phase Transition in Networks. Angew. Chem. Int. Ed. 2006, 45, 813–816. [Google Scholar]
  34. Magno, M.; Angelescu, D.G.; Stubenrauch, C. Phase diagrams of non-ionic microemulsions containing reducing agents and metal salts as bases for the synthesis of bimetallic nanoparticles. Colloids Surf. A 2009, 348, 116–123. [Google Scholar] [CrossRef]
  35. Schmidt, J.; Guesdon, C.; Schomäcker, R. Engineering Aspects of Preparation of Nanocrystalline Particles in Microemulsions. J. Nanopart. Res. 1999, 1, 267–276. [Google Scholar] [CrossRef]
  36. Martin, G.; Mäki-Arvela, P.; Murzin, D.Y.; Salmi, T. Kinetics and catalyst deactivation in the enantioselective hydrogenation of ethyl benzoylformate over Pt/Al2O3. Catal. Sci. Technol. 2014, 4, 170–178. [Google Scholar] [CrossRef]
  37. Schwarze, M.; Keilitz, J.; Nowag, S.; Parapat, R.Y.; Haag, R.; Schomäcker, R. Quasi-homogeneous hydrogenation with platinum and palladium nanoparticles stabilized by dendritic core-multishell architectures. Langmuir 2011, 27, 6511–6518. [Google Scholar] [CrossRef]

