
Adsorption Efficiency and Photocatalytic Activity of Silver Sulfide Nanoparticles Deposited on Carbon Nanotubes


1
Department of Chemistry, Prairie View A&M University, Prairie View, TX 77446, USA
2
College of Agriculture and Human Sciences, Prairie View A&M University, Prairie View, TX 77446, USA
*
Author to whom correspondence should be addressed.
Catalysts 2023, 13(3), 476; https://doi.org/10.3390/catal13030476
Submission received: 31 December 2022
/
Revised: 21 February 2023
/
Accepted: 21 February 2023
/
Published: 26 February 2023
(This article belongs to the Special Issue Catalytic Processes for Water and Wastewater Treatment)
Abstract
:A multimode, dual functional nanomaterial, CNTs-Ag2S, comprised of carbon nanotubes (CNTs) and silver sulfide (Ag2S) nanoparticles, was prepared through the facile hydrothermal process. Before the deposition of Ag2S nanoparticles, hydrophobic CNTs were modified to become hydrophilic through refluxing with a mixture of concentrated nitric and sulfuric acids. The oxidized CNTs were employed to deposit the Ag2S nanoparticles for their efficient immobilization and homogenous distribution. The CNTs-Ag2S could adsorb toxic Cd(II) and completely degrade the hazardous Alizarin yellow R present in water. The adsorption efficiency of CNTs-Ag2S was evaluated by estimating the Cd(II) adsorption at different concentrations and contact times. The CNTs-Ag2S could adsorb Cd(II) entirely within 80 min of the contact time, while CNTs and Ag2S could not pursue it. The Cd(II) adsorption followed the pseudo-second-order, and chemisorption was the rate-determining step in the adsorption process. The Weber−Morris intraparticle pore diffusion model revealed that intraparticle diffusion was not the sole rate-controlling step in the Cd(II) adsorption. Instead, it was contributed by the boundary layer effect. In addition, CNTs-Ag2S could completely degrade alizarin yellow R in water under the illumination of natural sunlight. The Langmuir-Hinshelwood (L-H) model showed that the degradation of alizarin yellow R proceeded with pseudo-first-order kinetics. Overall, CNTs-Ag2S performed as an efficient adsorbent and a competent photocatalyst.
1. Introduction
Water pollution engrossed by heavy metals is a primary environmental, ecological, and public health concern [1]. Heavy metals are highly soluble in water and are toxic, carcinogenic, and non-degradable [2,3]. Rapid industrialization and technological development have resulted in the discharge of heavy metal-containing effluents into surface and groundwater [4]. The discharged heavy metals are adsorbed by soil and enter the human body through the food chain. Heavy metals accumulate in various organs and body tissues and can cause irreparable damage, including death [5]. Among the heavy metals, cadmium is enormously used and highly toxic [6]. The source for discharging the cadmium into the environment is industrial activities, such as electroplating, smelting, alloy manufacturing, pigments, plastic, battery, fertilizers, pesticides, pigments, dyes, textile operations, and refining [7]. In water, cadmium exists as bivalent, Cd(II), which is responsible for several adverse effects, such as kidney dysfunction, nephritis, hypertension, renal dysfunction, nervous system dysfunction, bone lesions, digestive system dysfunction, cancer, and reproductive organ damage [8,9,10]. The itai-itai disease, caused by Cd(II)-contaminated water from the Jinzu river in Japan, has instigated severe pain, bone fractures, proteinuria, and osteomalacia [11]. The Cd2+ ions have a high affinity for binding to sulfhydryl (-SH) groups of proteins in biological systems [12]. The presence of Cd(II) in water can lead to severe health and environmental problems. Therefore, its elimination is critically needed. The Cd(II) present in water could be eradicated through chemical precipitation, ion exchange, solvent extraction, membrane separation, electrochemical removal, coagulation, and adsorption [13,14,15,16,17,18,19,20,21]. In these techniques, adsorption is superior because of its high efficiency, relative simplicity in design, easy operation, and low operational cost [20,21]. Because of this, many adsorbents have been developed and tested for their efficiency [20,21,22].
Another class of pollutants that also causes major environmental problems, such as heavy metals, is azo dyes. Azo dyes have attractive colors and are enormously used in industries due to their availability and stability [23]. These dyes contain azo bonds (-N=N-) and substituted aromatic rings [24]. The complex molecular structure of azo dyes has made them recalcitrant and resistant to biodegradation [25]. Azo dyes are mutagenic, teratogenic, and carcinogenic [25]. Moreover, azo dyes can decompose into potentially carcinogenic polychlorinated naphthalenes, benzidine, and amines [26,27]. The toxicity of azo dyes can result in lung cancer, heart diseases, chromosomal aberrations, neurotoxicity, skin disease, and respiratory problems in humans [25]. These dyes can cause disorders of the central nervous system and the inactivation of enzymatic activities [28]. Beyond toxicity, azo dyes are abundantly used in industries because of their cost and advancement in colors that cover the entire spectrum. After their use in industries, about 10-15% of the azo dyes are discharged into the environment through water effluents [29,30]. Releasing azo dyes content water can result in several environmental problems including reduced light penetration in water bodies, which leads to diminished photosynthetic activities, lessened growth and reproduction of aquatic creatures, and aesthetic damage [30,31]. The consequences of the xenobiotic and recalcitrant azo dyes impact the ecosystem’s structure and functioning. Considering the adverse effects, it is essential to completely obliterate azo dyes to prevent severe damage and protect health and the environment. Different techniques have been developed to remove the azo dyes in water, viz., coagulation/flocculation, ultrafiltration and membrane processing, chemical precipitation, electrochemical degradation, and ozonation [32,33,34,35,36,37]. In comparison, photocatalysis is an excellent method for eradicating azo dyes from water in an environmentally friendly approach as the end products of this process are harmless [38,39]. Due to its efficiency in degrading azo dyes, many photocatalysts have been developed to eliminate dyes [37,38,39,40,41,42,43,44,45]. Among azo dyes, alizarin yellow R (AYR) is a prominently used dye in industries. It is a highly water-soluble anionic dye that contains polycyclic aromatic hydrocarbons [25]. AYR is a derivative of salicylic acid and was prepared in 1887 by Rudolf Nietzki through the reaction of m-nitroaniline and salicylic acid [46]. AYR is an industrially important dye and is vastly used in the textile, leather, plastics, paints, and lacquer industries [24]. Furthermore, it is used as an acid-base indicator and employed in histology, stains, and nutrient media preparations [47].
Considering the health and environmental problems associated with Cd(II) and AYR, we designed the dual applicable nanocomposite, CNTs-Ag2S for efficient Cd(II) adsorption and photodegradation of AYR. The multimode CNTs-Ag2S was produced through the facile deposition process of Ag2S nanoparticles over oxidized carbon nanotubes (CNTs) using the hydrothermal method. The adsorption efficiency of CNTs-Ag2S was estimated by evaluating the adsorption rate of Cd(II) from water. The dynamics and controlling mechanisms of Cd(II) adsorption were assessed by pseudo-first- and second-order kinetic models. The reaction pathways and the rate-controlling step underlying Cd(II) adsorption were evaluated using the Weber−Morris intraparticle pore diffusion model. The adsorption equilibrium was determined by fitting the experimental results with Langmuir, Freundlich, and Temkin isotherm models. Furthermore, the catalytic activity of CNTs-Ag2S was determined through the degradation of AYR under exposure to natural sunlight. The photocatalytic activity of CNTs-Ag2S was quantified using the Langmuir-Hinshelwood (L-H) model.
2. Results and Discussion
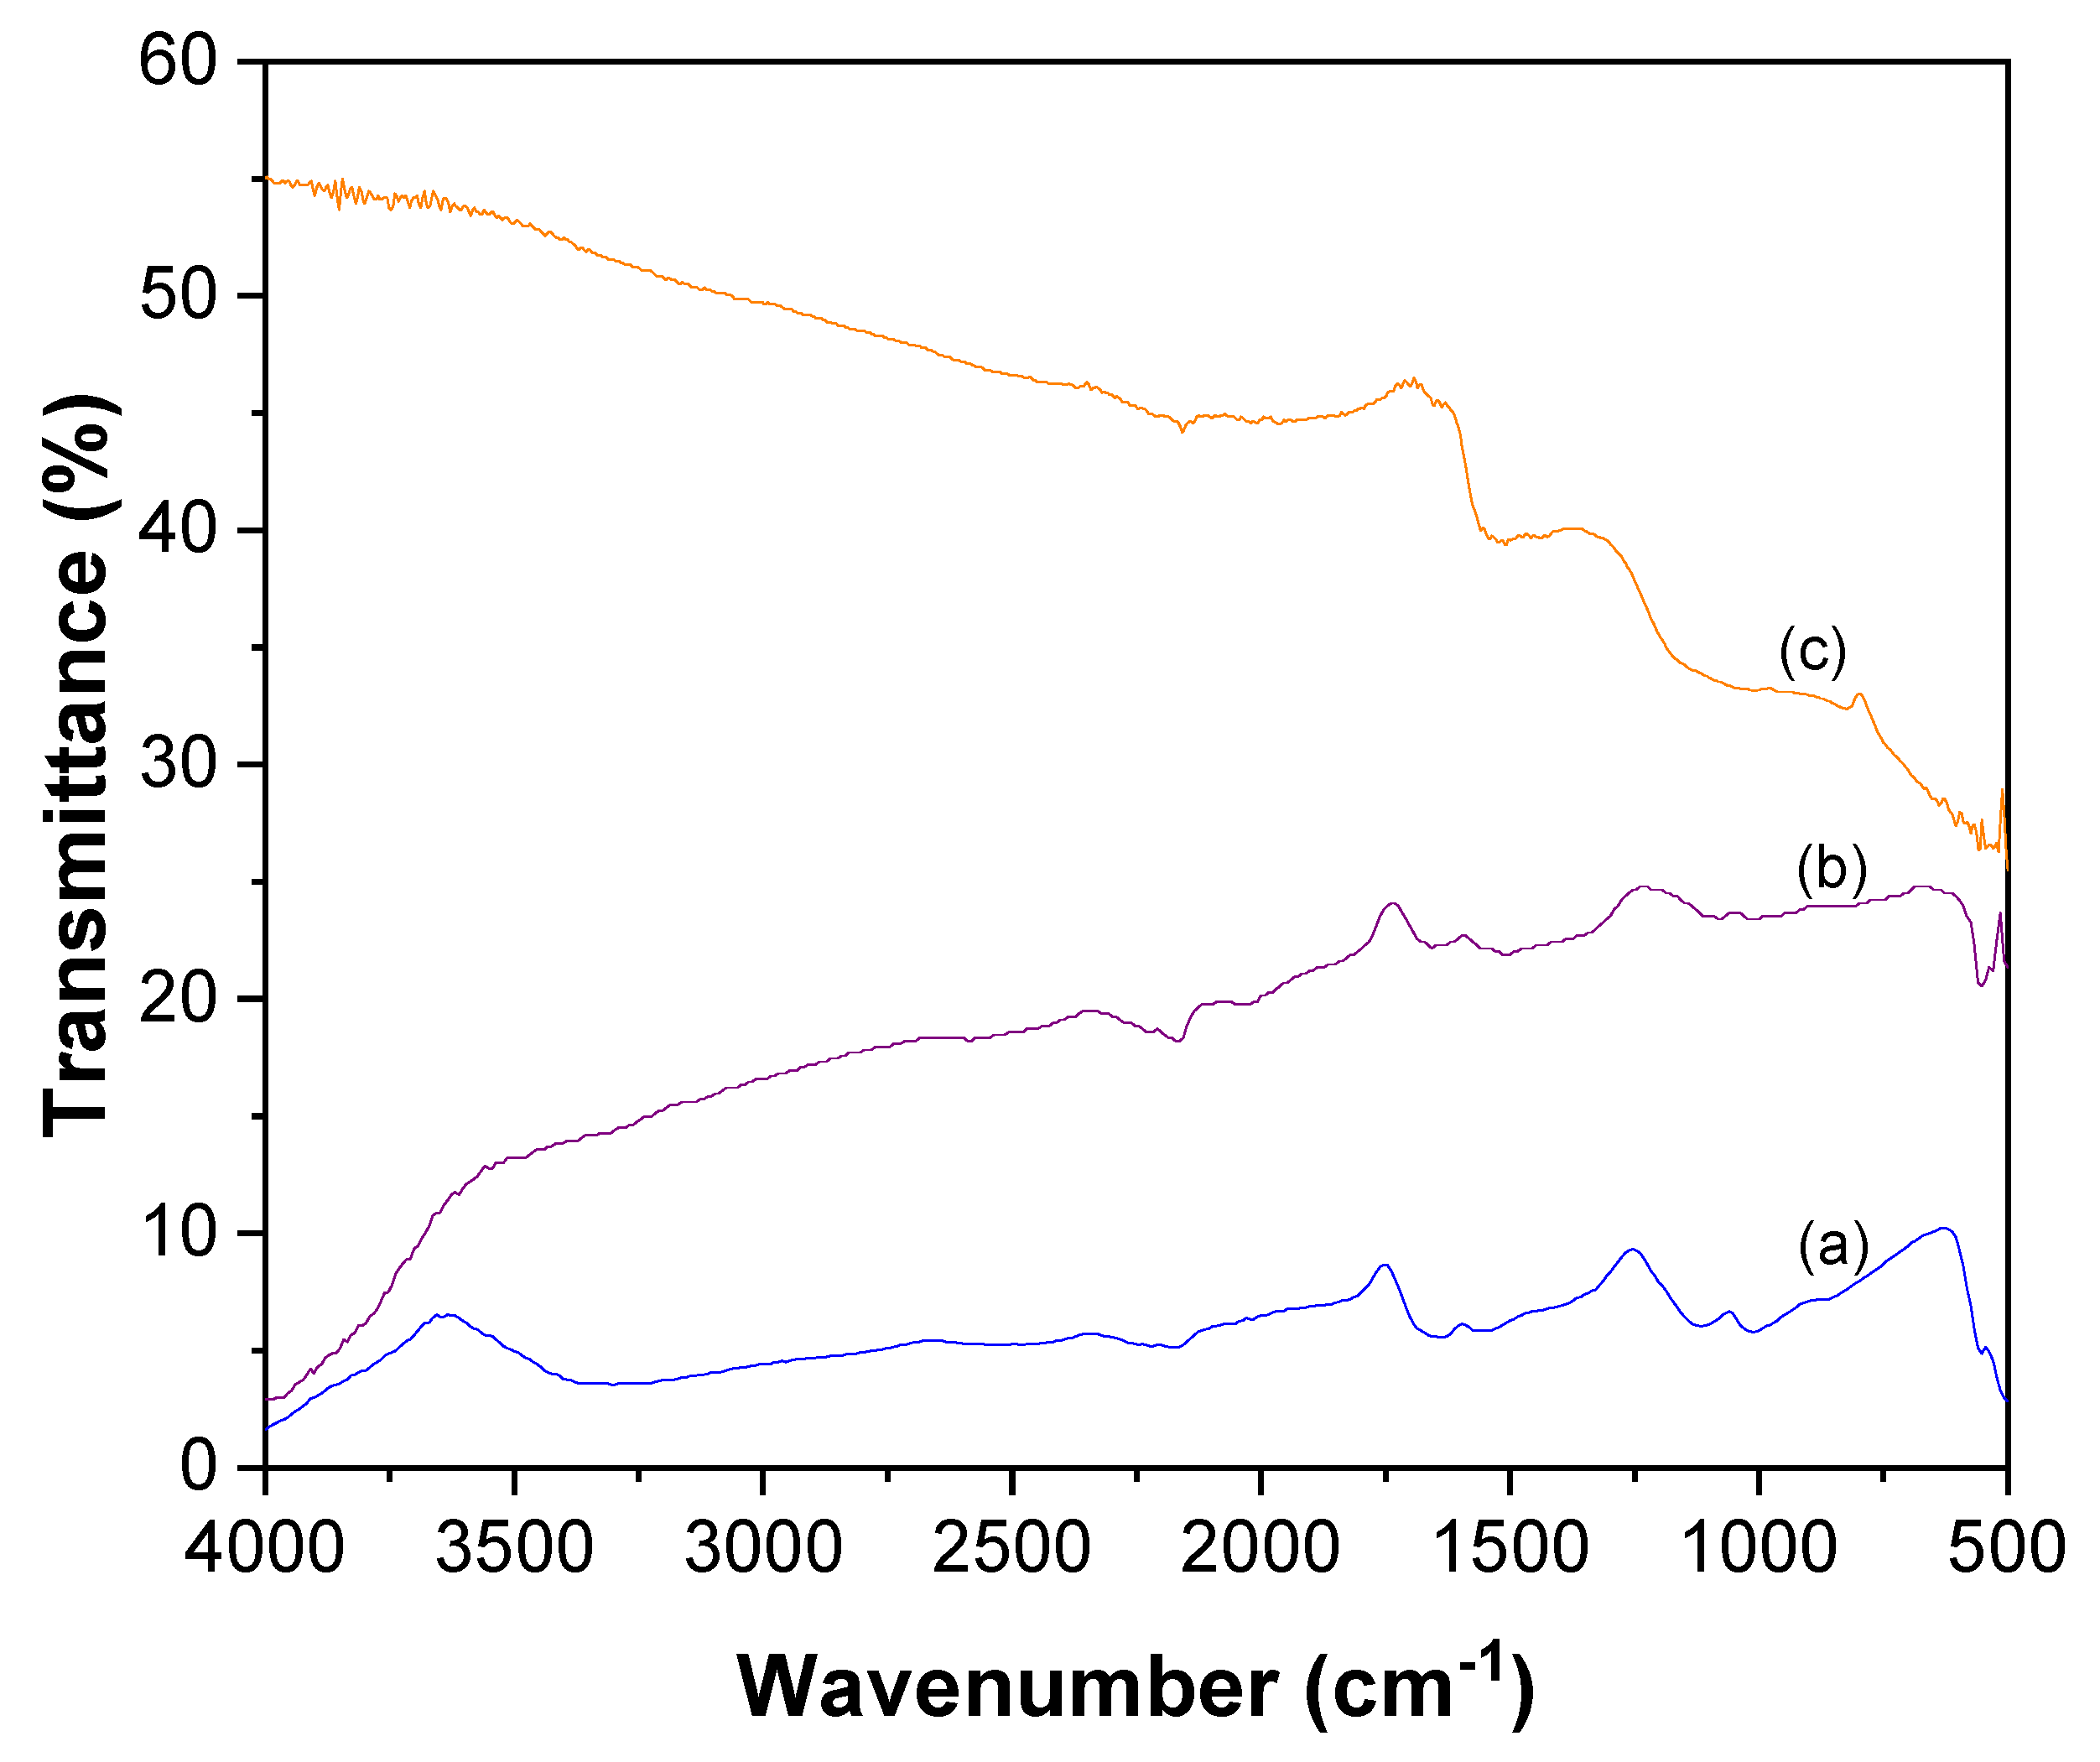
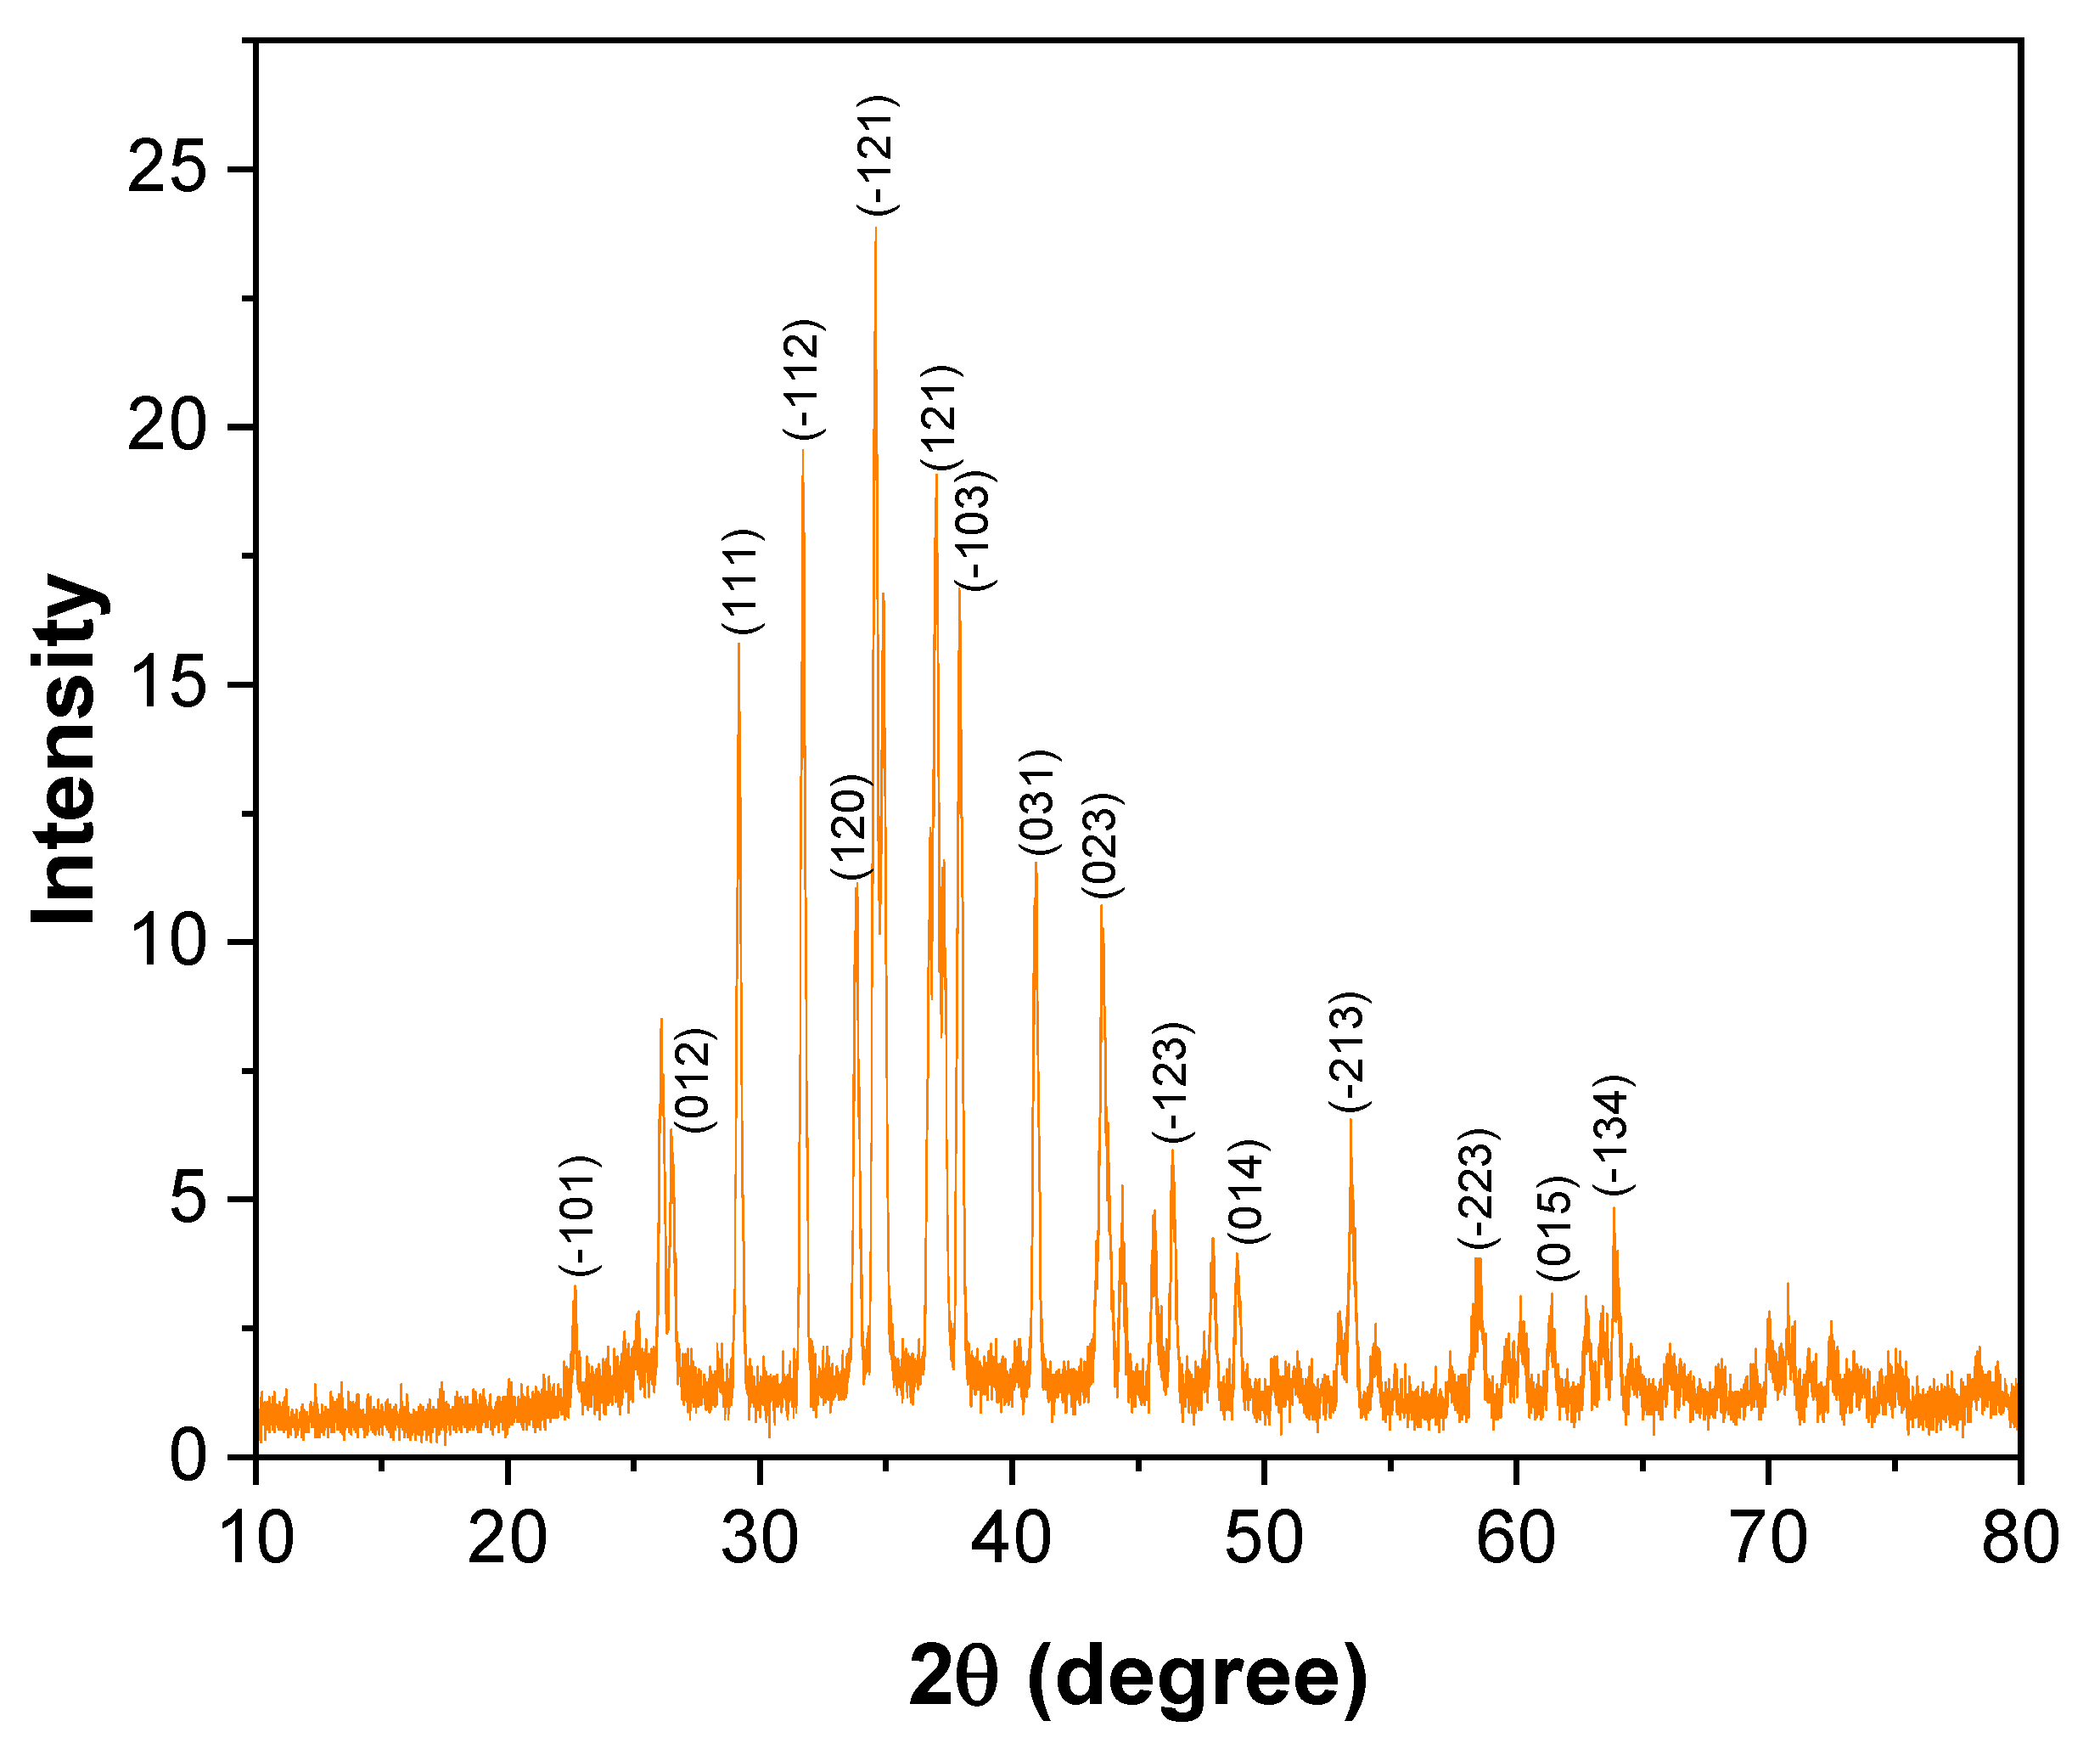
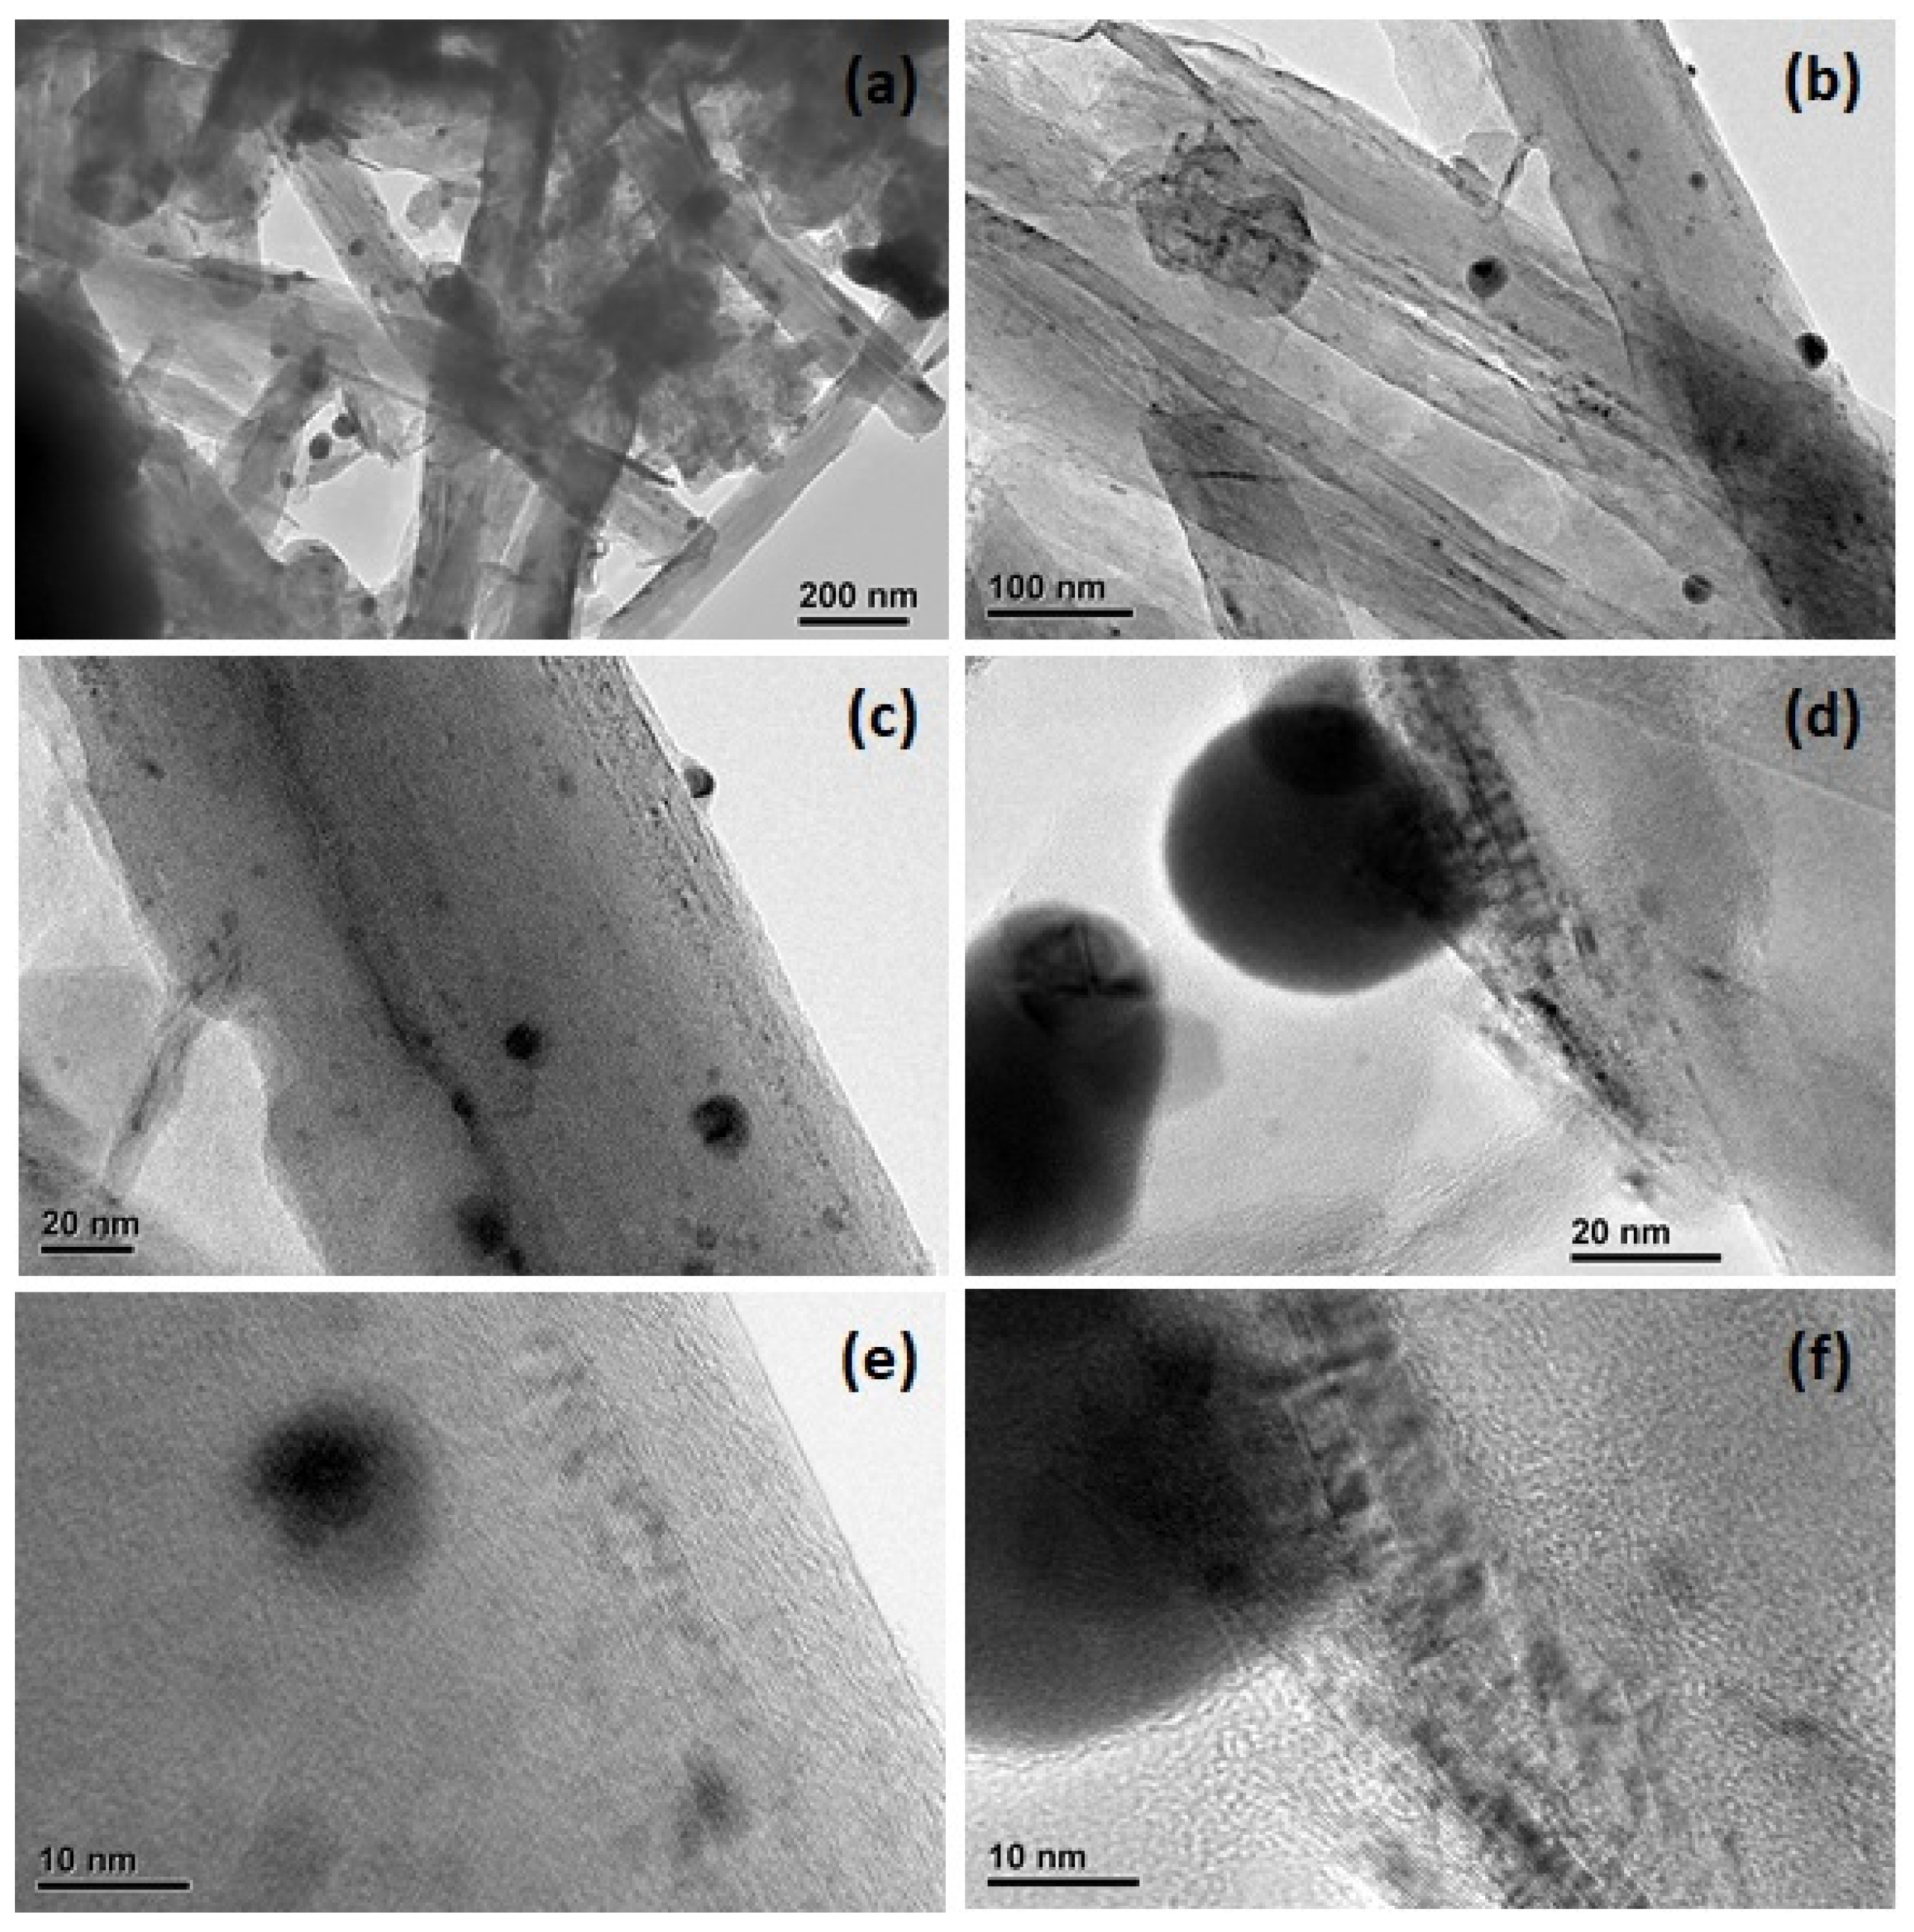
The ATR-FTIR spectrum of CNTs-COOH, shown in Figure 1a, demonstrated a band at 3427 cm−1 corresponding to the O-H bond. The band for the C=O bond of the -COOH groups appeared at 1699 cm−1, and the band for the C=C bonds of CNTs was found at 1554 cm−1 [48,49,50]. The spectrum of Ag2S (Figure 1b) displayed the peak of the Ag-S bond at 552 cm−1 [51]. The spectrum of CNTs-Ag2S (Figure 1c) revealed the characteristic absorption bands related to CNTs and Ag2S. The prominent peaks observed at 1066 and 1096 cm−1 in Figure 1c were attributed to C-O stretching. The peak at 3574 cm−1, was due to the −OH stretching vibrations of adsorbed water molecules. The band due to C=O was observed at 1693 cm−1, and the peak, at 1517 cm−1, was attributed to C-H. The peak related to Ag-S was situated around 550 cm−1. The XRD pattern of CNTs-Ag2S (Figure 2) showed a characteristic (0 0 2) reflection of hexagonal graphite of CNTs at 26.1° [52]. It revealed the reflections related to Ag2S at 22.7 (−1 0 1), 25.2 (−1 1 1), 26.5 (0 1 2), 29.2 (1 1 1), 31.7 (−1 1 2), 33.8 (1 2 0), 34.6 (−1 2 1), 34.9 (0 2 2), 36.8 (1 1 1), 37.0 (1 2 1), 37.3 (0 1 3), 37.9 (−1 0 3), 40.9 (0 3 1), 43.6 (0 2 3), 44.4 (−1 3 1), 46.4 (−1 2 3), 48.0 (−2 1 2), 48.9 (0 1 4), 53.0 (0 4 0), 53.5 (−2 1 3), 58.3 (−1 4 1), 58.4 (−2 2 3), 60.2 (−1 0 5), 61.4 (0 1 5), 62.8 (2 3 1), 63.4 (2 1 3), 63.9 (−1, 3 4), and 68.0° (2 3 2). These values agree with the values found in the standard pattern of acanthite Ag2S (JCPDS file 14-0072) [52]. The TEM images of CNTs-Ag2S presented in Figure 3 explored the deposition of spherical-resembling Ag2S nanoparticles over the surface of tubular-structured CNTs. The proportion of Ag2S nanoparticles was low, possibly due to the low quantity of precursor AgNO3 used in the preparation compared to the ratio of CNTs. The presence of Ag2S nanoparticles over the surface of CNTs is perceptible in Figure 3a–f. It is noticeable in Figure 3a that the few Ag2S nanoparticles have combined and formed clusters. Figure 3b,d reveal the ruptured surface of some CNTs. It could have happened through the harsh treatment of CNTs with the mixture of concentrated HNO3 and H2SO4. This process was required to make the CNTs hydrophilic and provide a suitable environment for the effective deposition of Ag2S nanoparticles. However, the entire surface of the CNTs was not distracted and the smooth surface of the CNT is perceptible in Figure 3e,f. Overall, a few defective sites were formed in CNTs. Figure 3d-f reveals the strong adherence of Ag2S nanoparticles to the smooth-surfaced CNT. The absence of leached or free-standing nanoparticles in the void area shows the strong adherence of Ag2S nanoparticles to the surface of CNTs. The size of the Ag2S nanoparticle present in Figure 3d,e, was around 38 and 15 nm, respectively. Therefore, Ag2S nanoparticles have broad size distribution. The average size of Ag2S nanoparticles, calculated from XRD, was around 29 nm, which agrees with the size determined from the TEM images. The core of the Ag2S nanoparticles (Figure 3d) appears denser than the edge. The CNTs have a width of around 110 nm and a length of several micrometers. Overall, CNTs have effectively exfoliated. Further, the EDS of CNTs-Ag2S (Figure S1, Supplementary Materials) demonstrated the presence of O, Ag, and S in CNTs-Ag2S. The peaks for Cu and Ca were found in Figure S1, those are by the copper grid used in the TEM measurement.
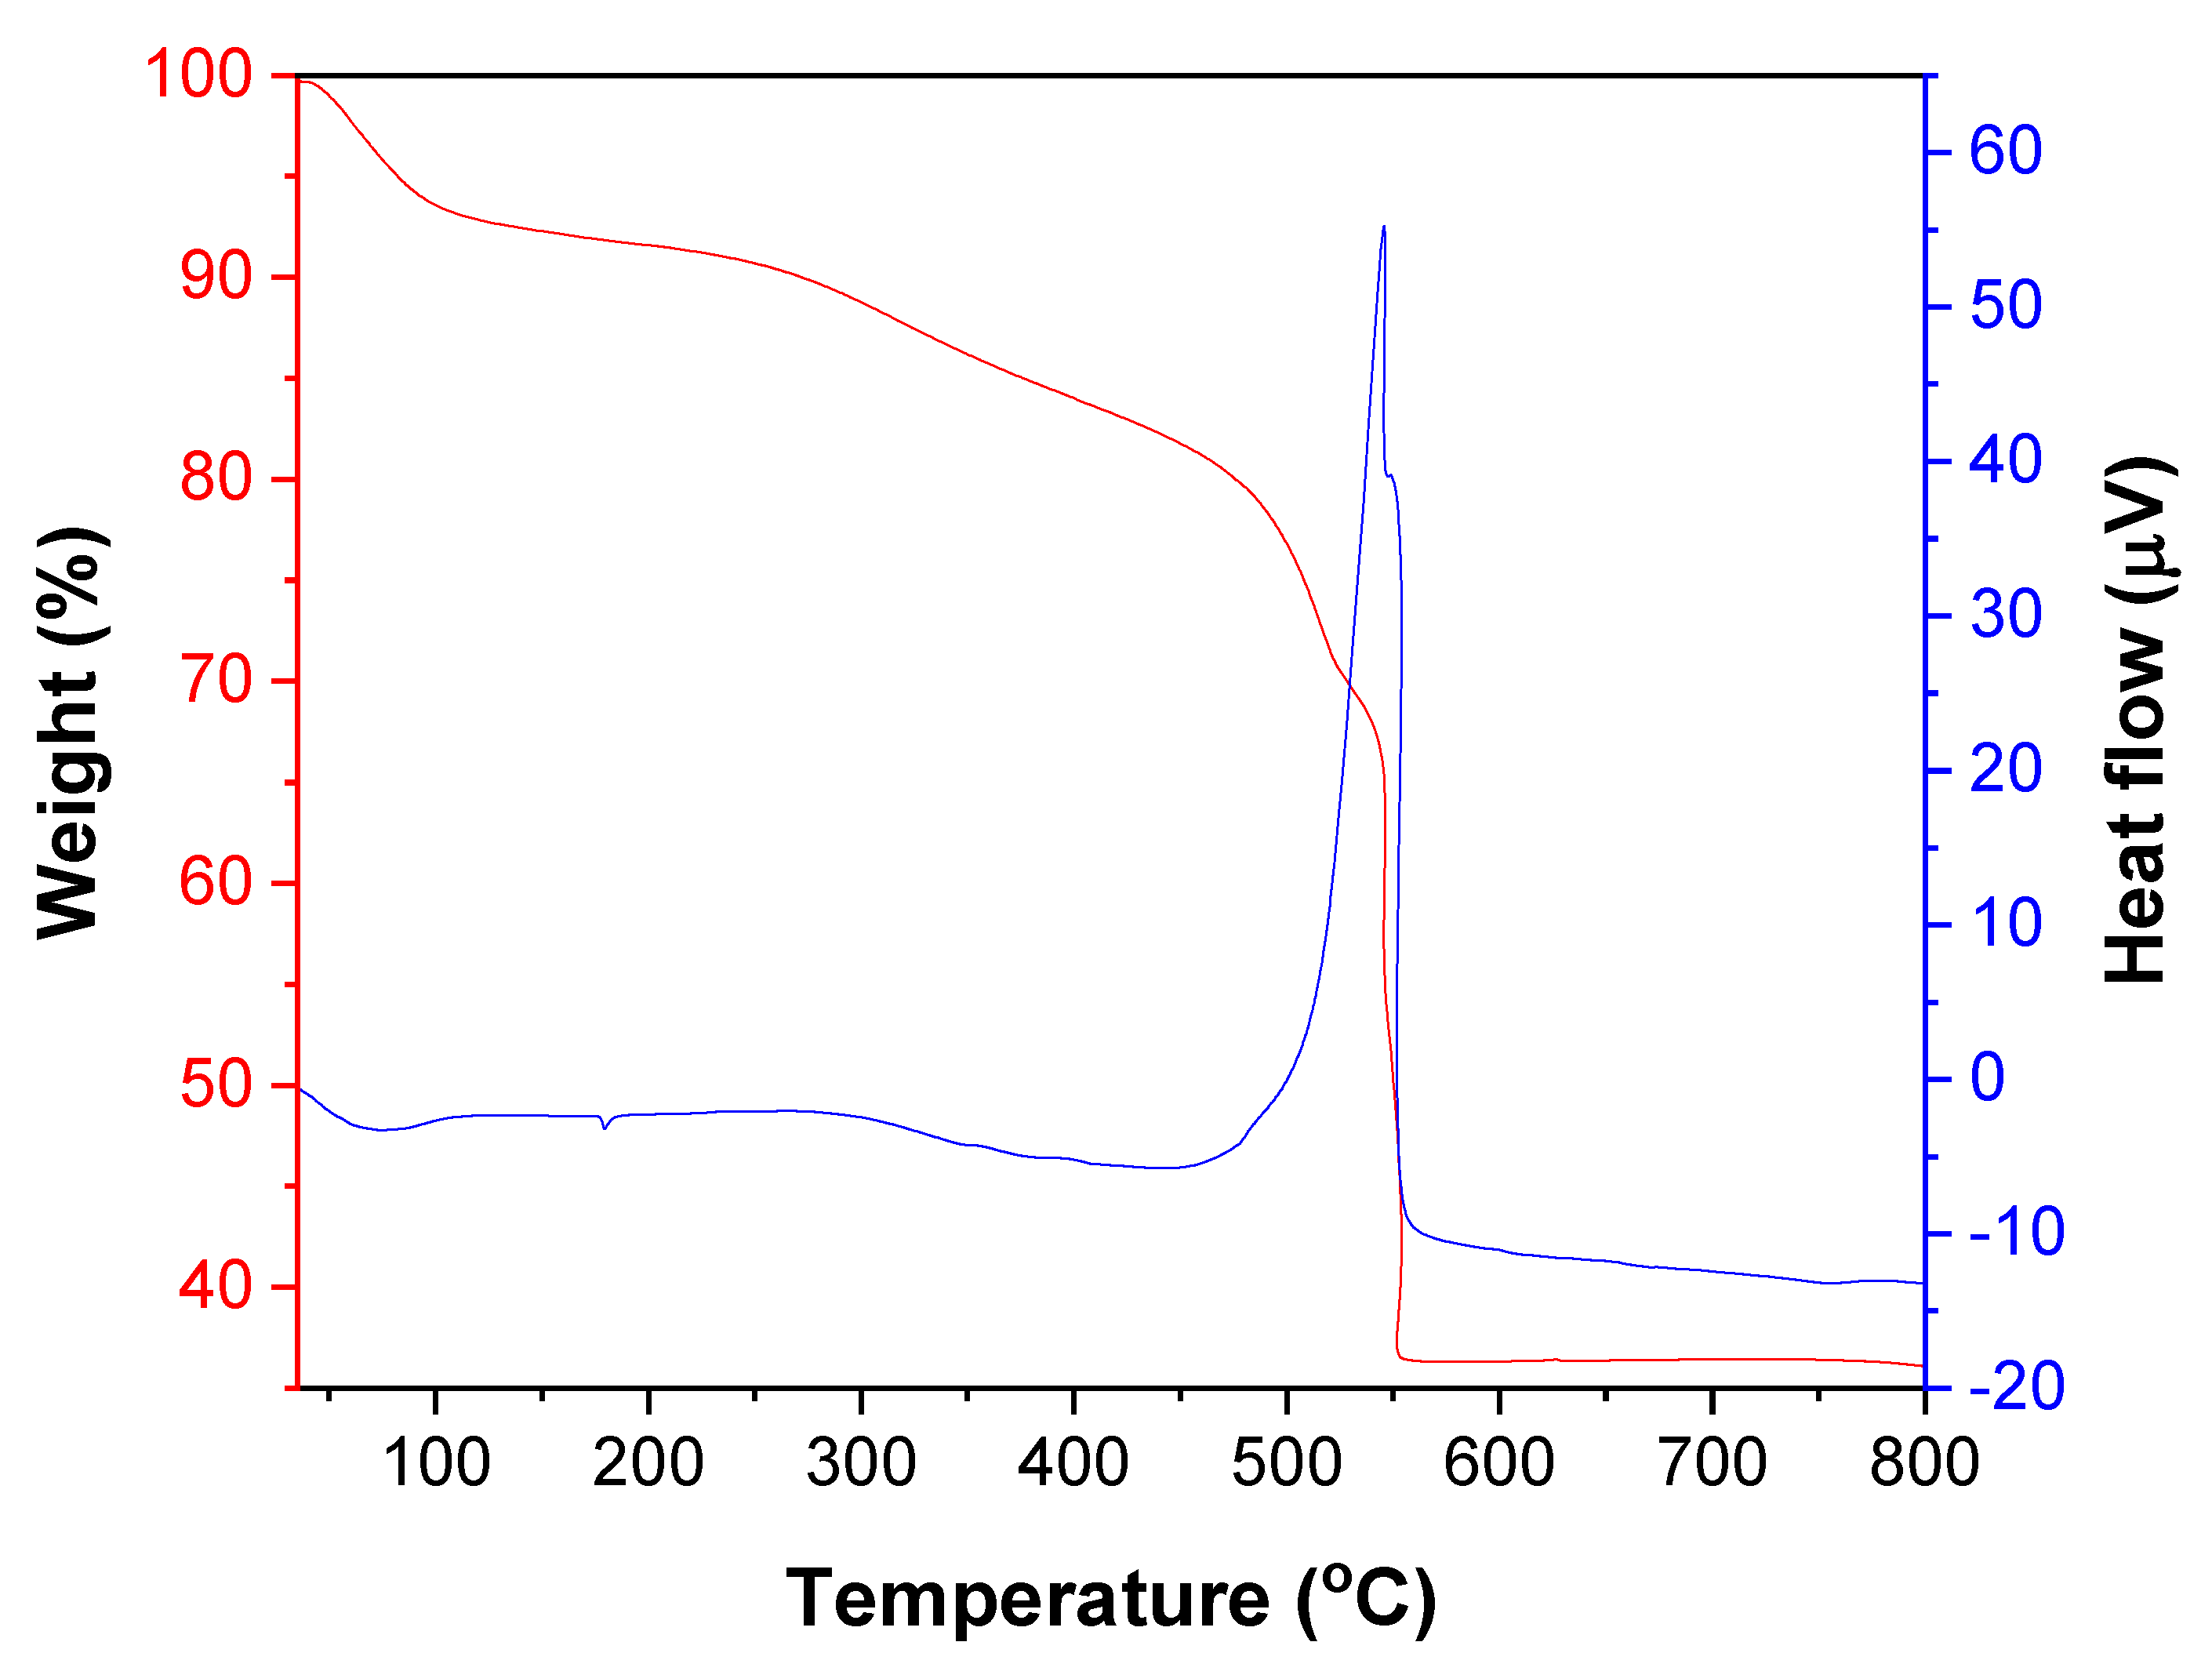
The TGA pattern of CNTs-Ag2S (Figure 4) displayed four weight loss steps. The initial weight loss of 6.5% that occurred before 100 °C was attributed to the desorption of physically adsorbed water molecules over the surface of CNTs-Ag2S. The following weight loss of 15% ensued within the range of 100–490 °C was due to the detachment and decomposition of oxygen-containing functional groups existing on the surface of the CNTs. The subsequent weight loss of 10.5% transpired within the range of 500–540 °C, was owing to the breaking of the bond between silver and sulfide in Ag2S nanoparticles and releasing sulfur. The successive sharp and significant weight loss of 31.5% taken place within the range of 540–550 °C was by the decomposition of sulfur and the formation of metallic silver and silver oxide. The residual weight remained was about 64%. The broad endothermic peak found in the DTA curve around 80 °C was because of the dehydration of the sample. The small endothermic peak found at 170 °C accounted for the removal of functional groups from the surface of the CNTs. The intense exothermic peak at 545 °C was assigned to release sulfur by breaking the bond between silver and sulfide. The UV-vis absorption spectrum of CNTs-Ag2S, shown in Figure 5, exhibited a characteristic absorption band of the C=C bonds of CNTs at 232 nm [52]. In addition, the broad absorption tail corresponding to Ag2S nanoparticles was observed in the visible region [52,53]. If semiconductor nanoparticles are conjugated to CNTs, it shows the charge-transfer band [52,54]. However, no such band was observed in Figure 5, illustrating that the conjugation of Ag2S nanoparticles to CNTs has not altered their energy states [52,54].
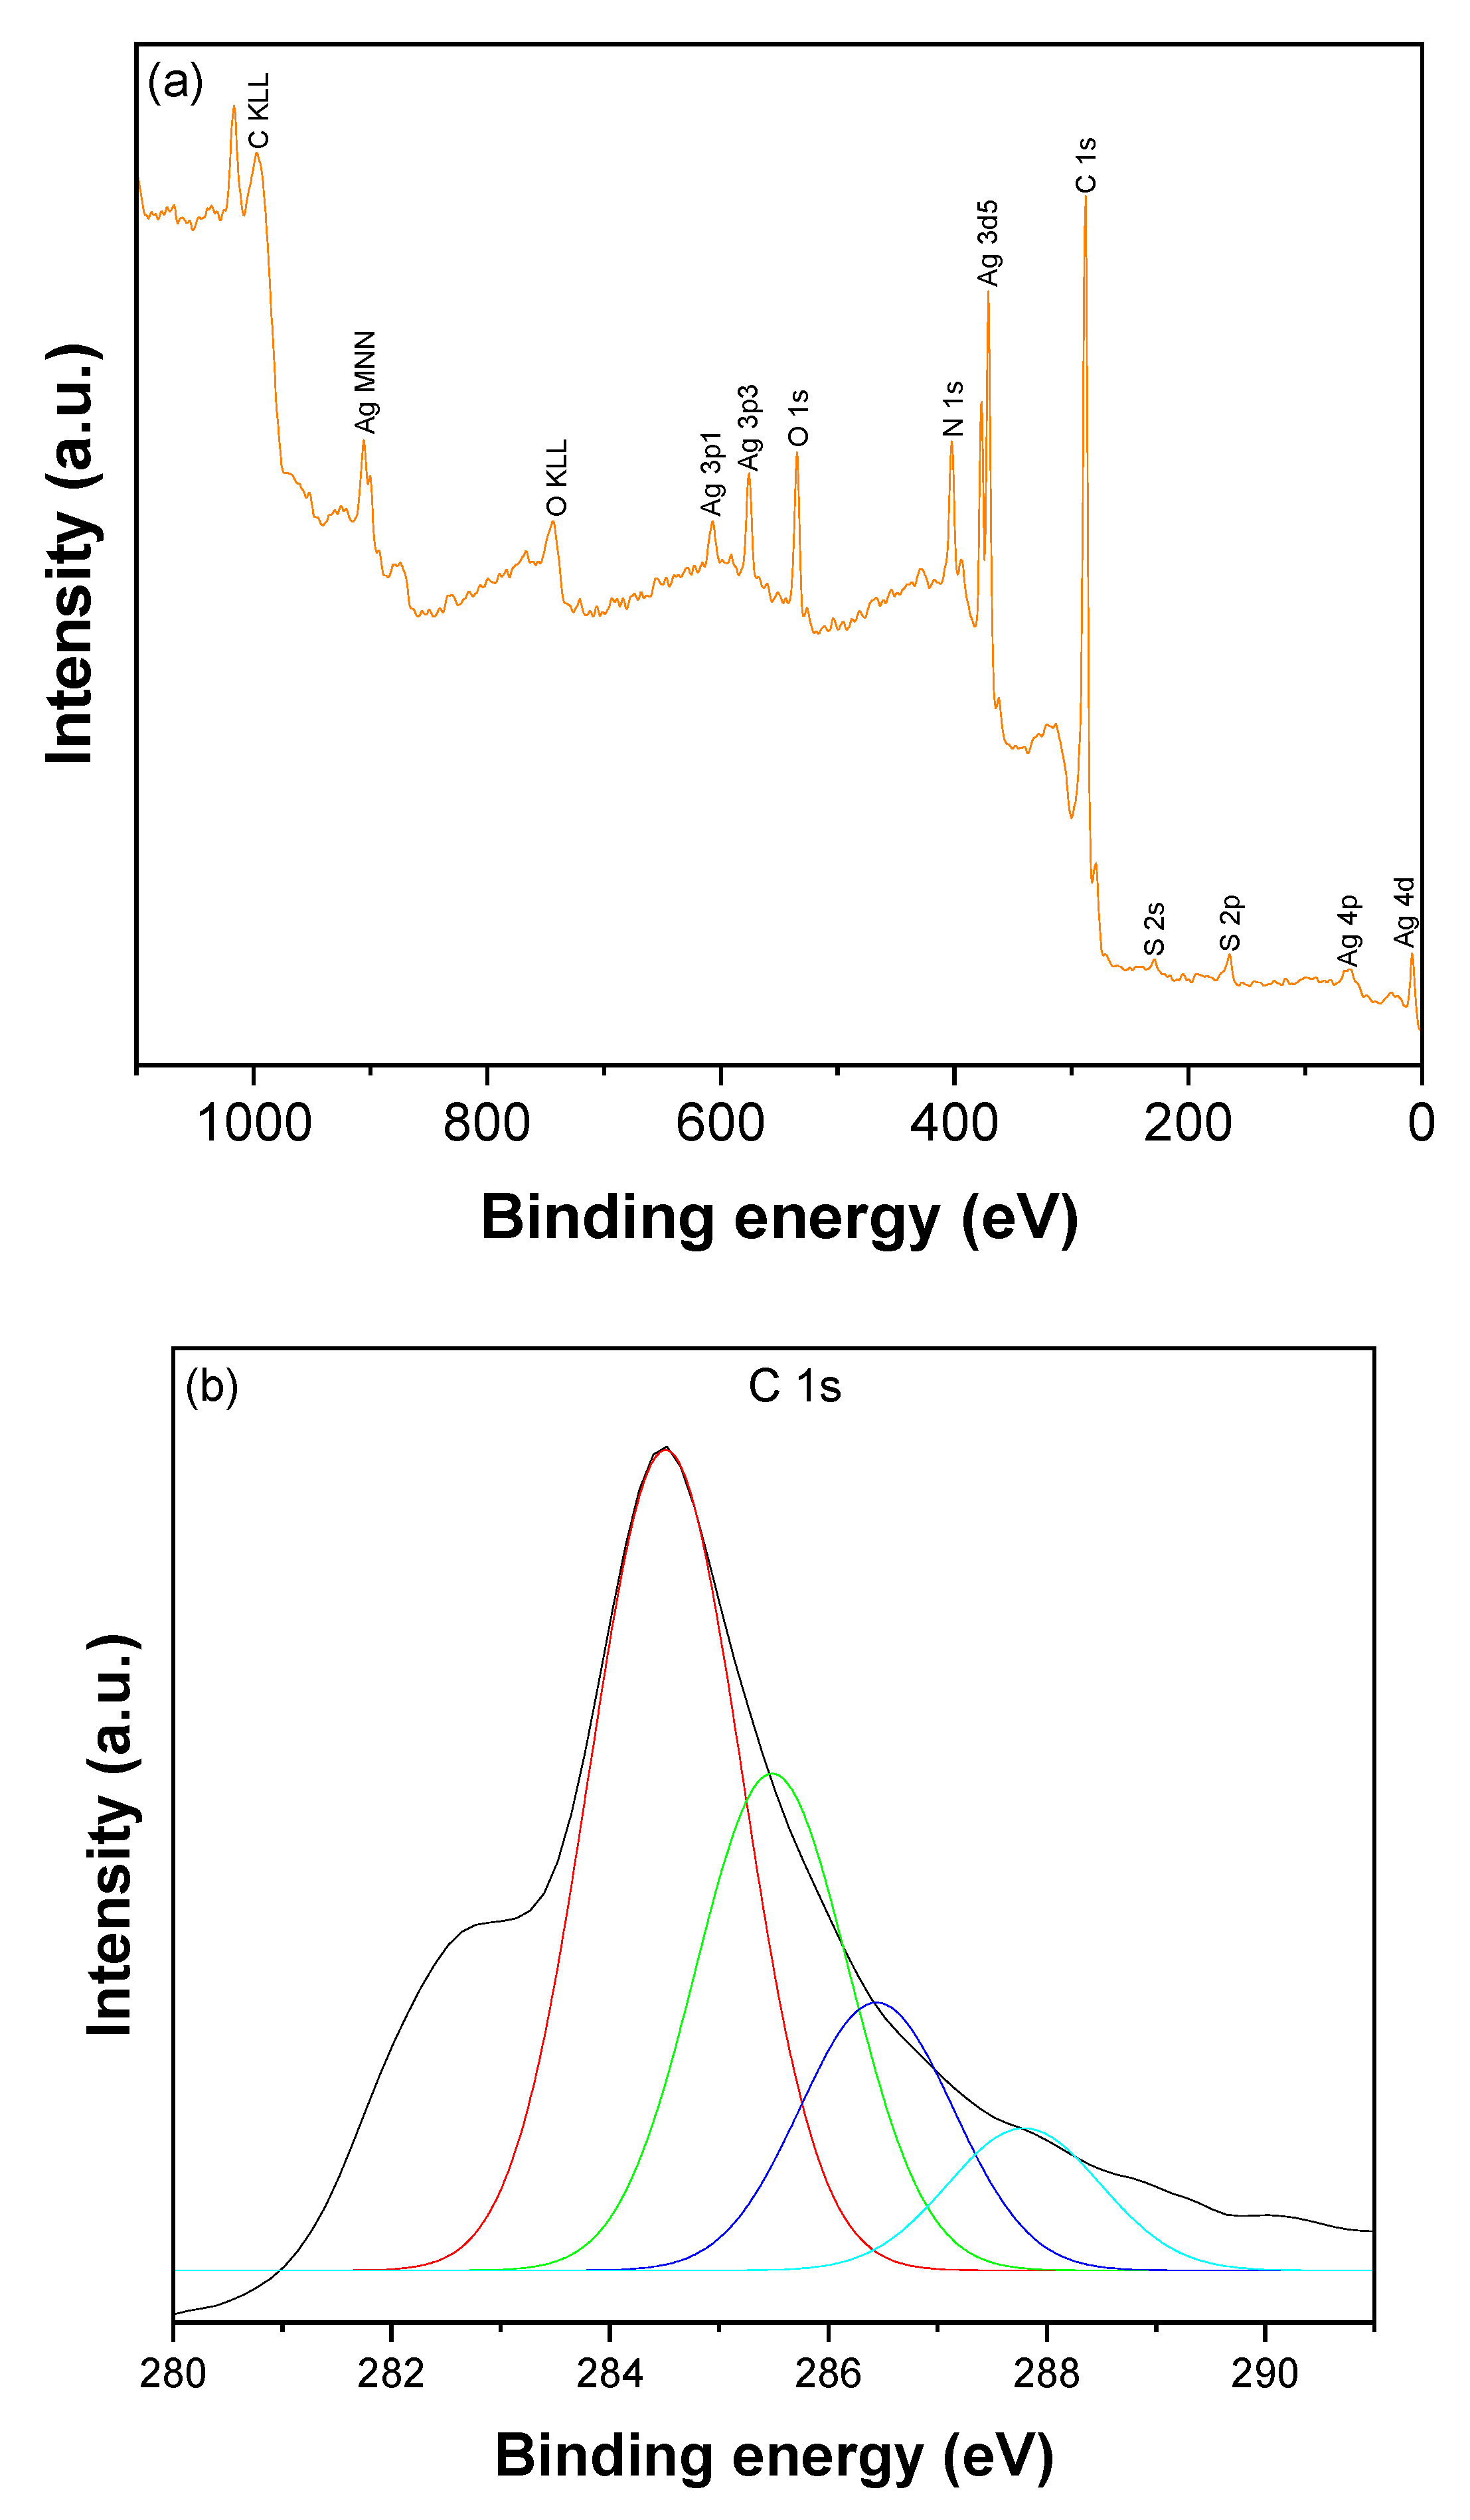
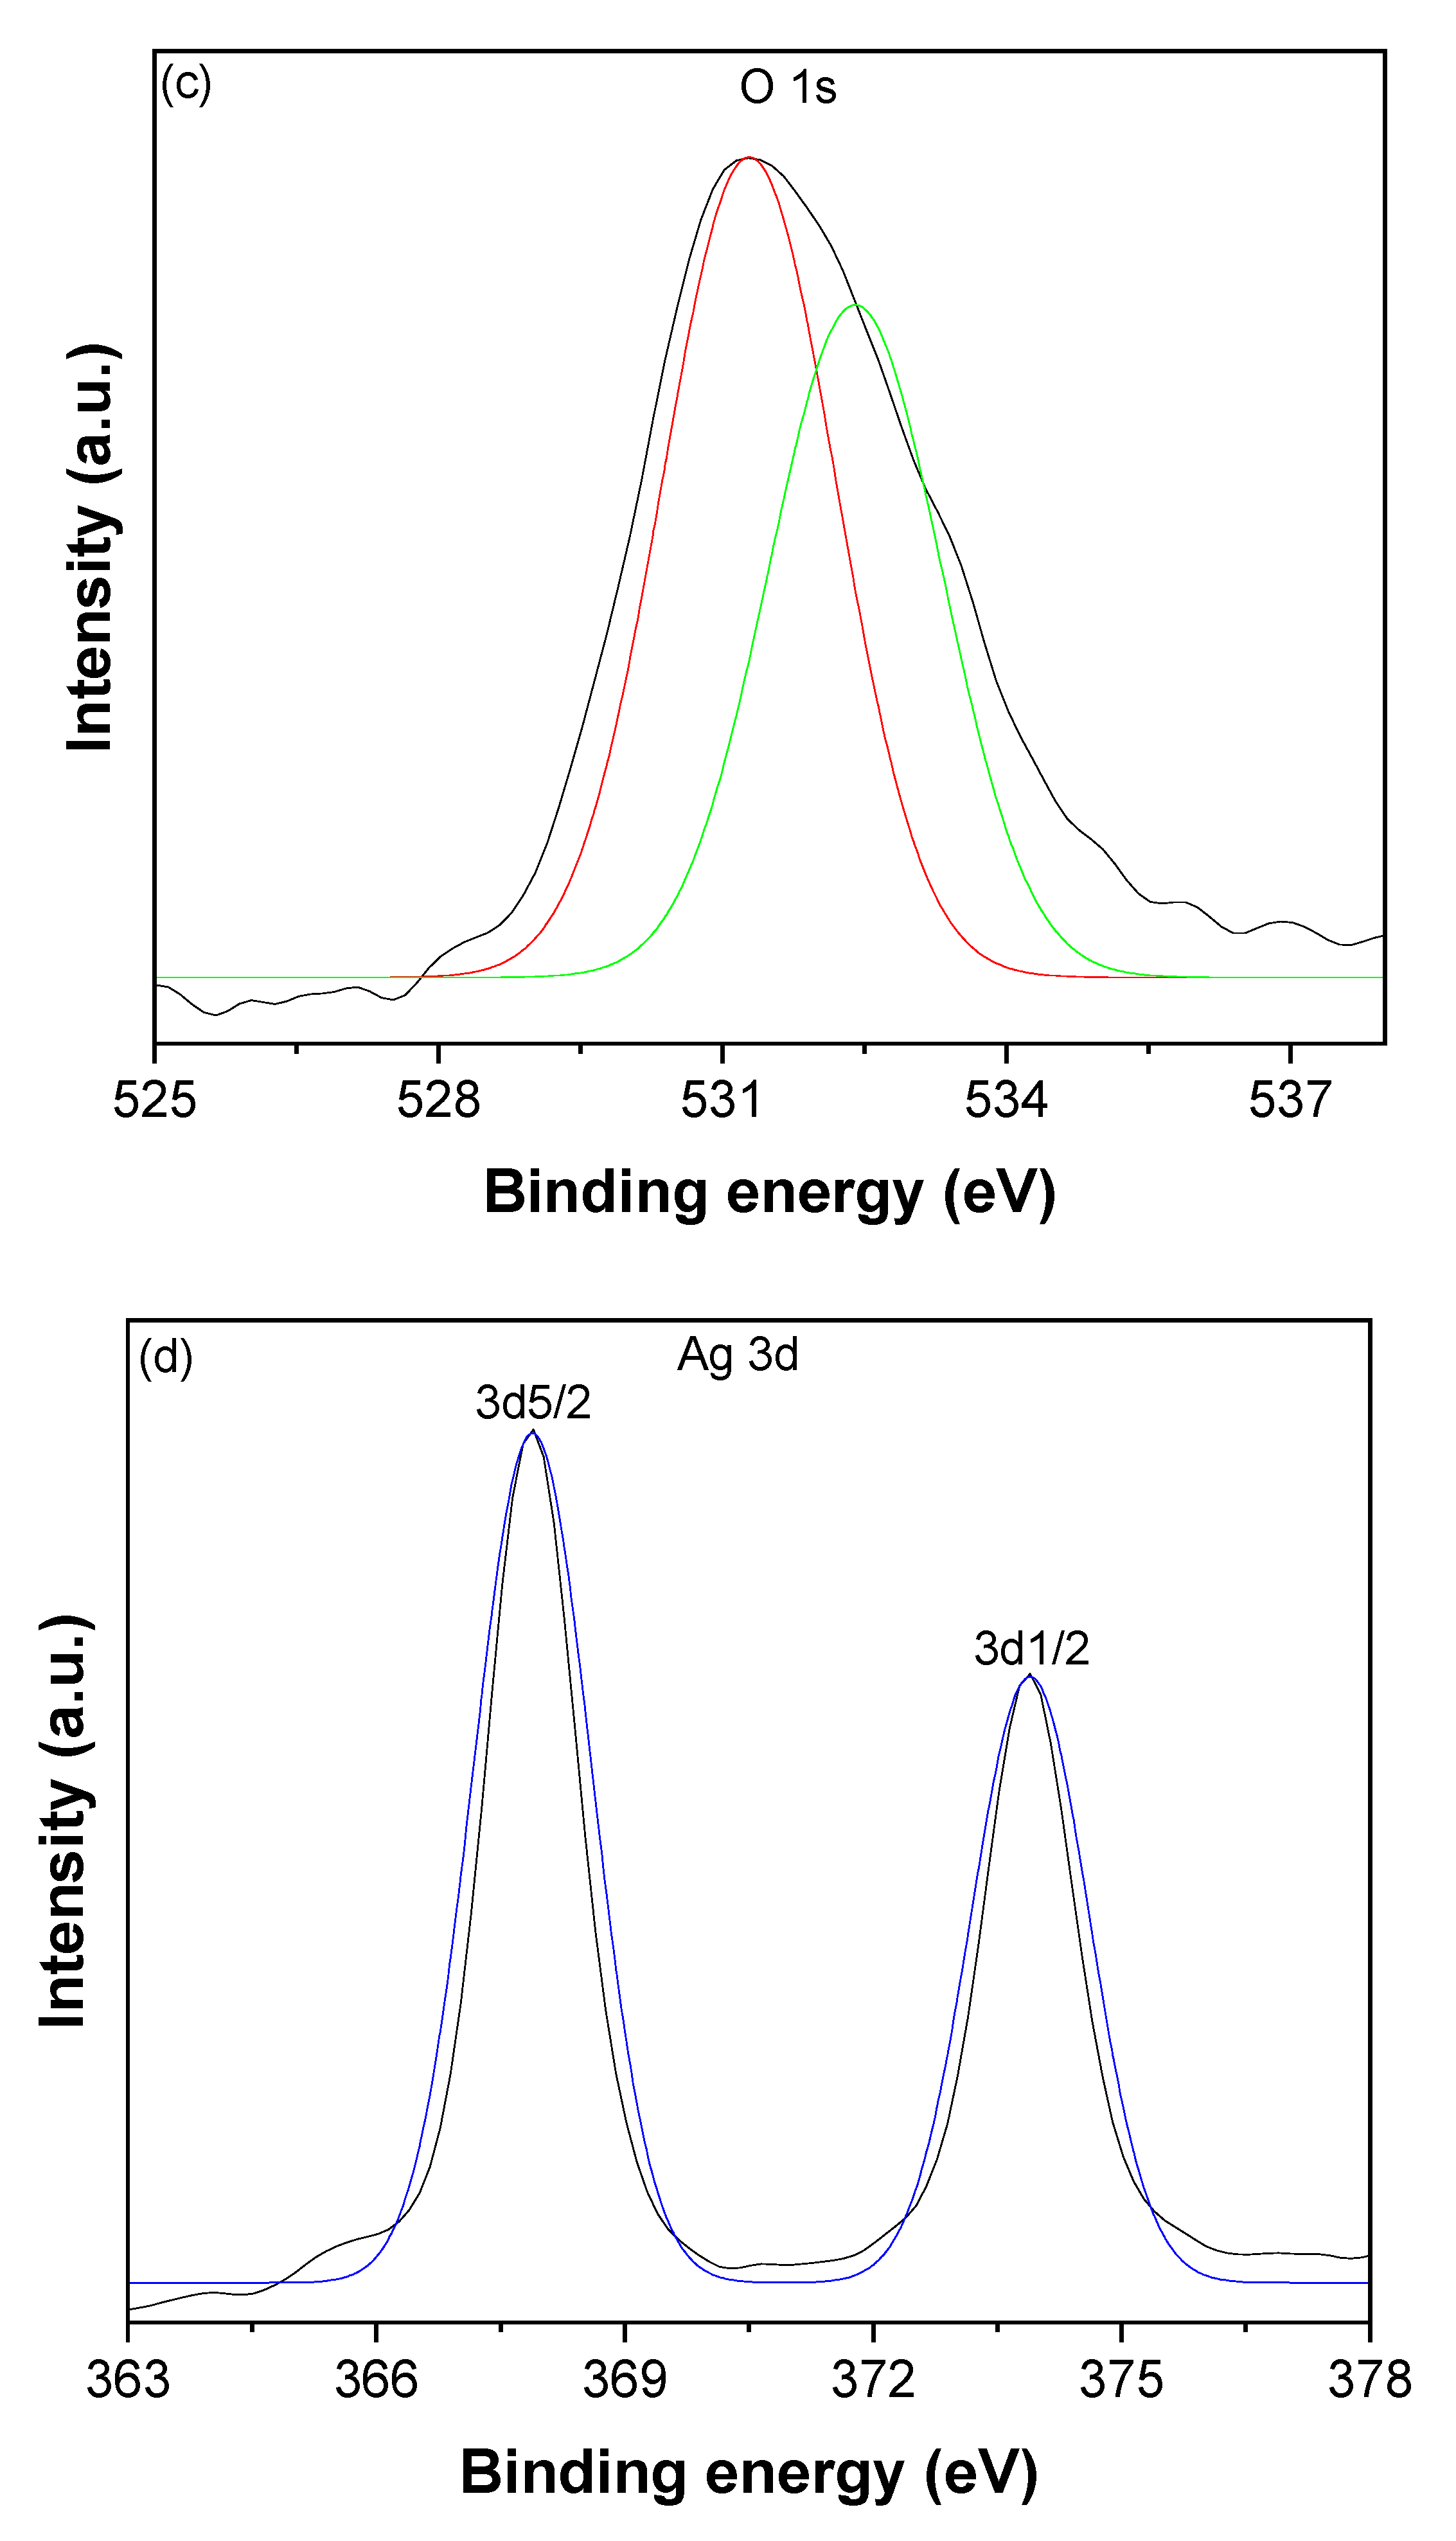
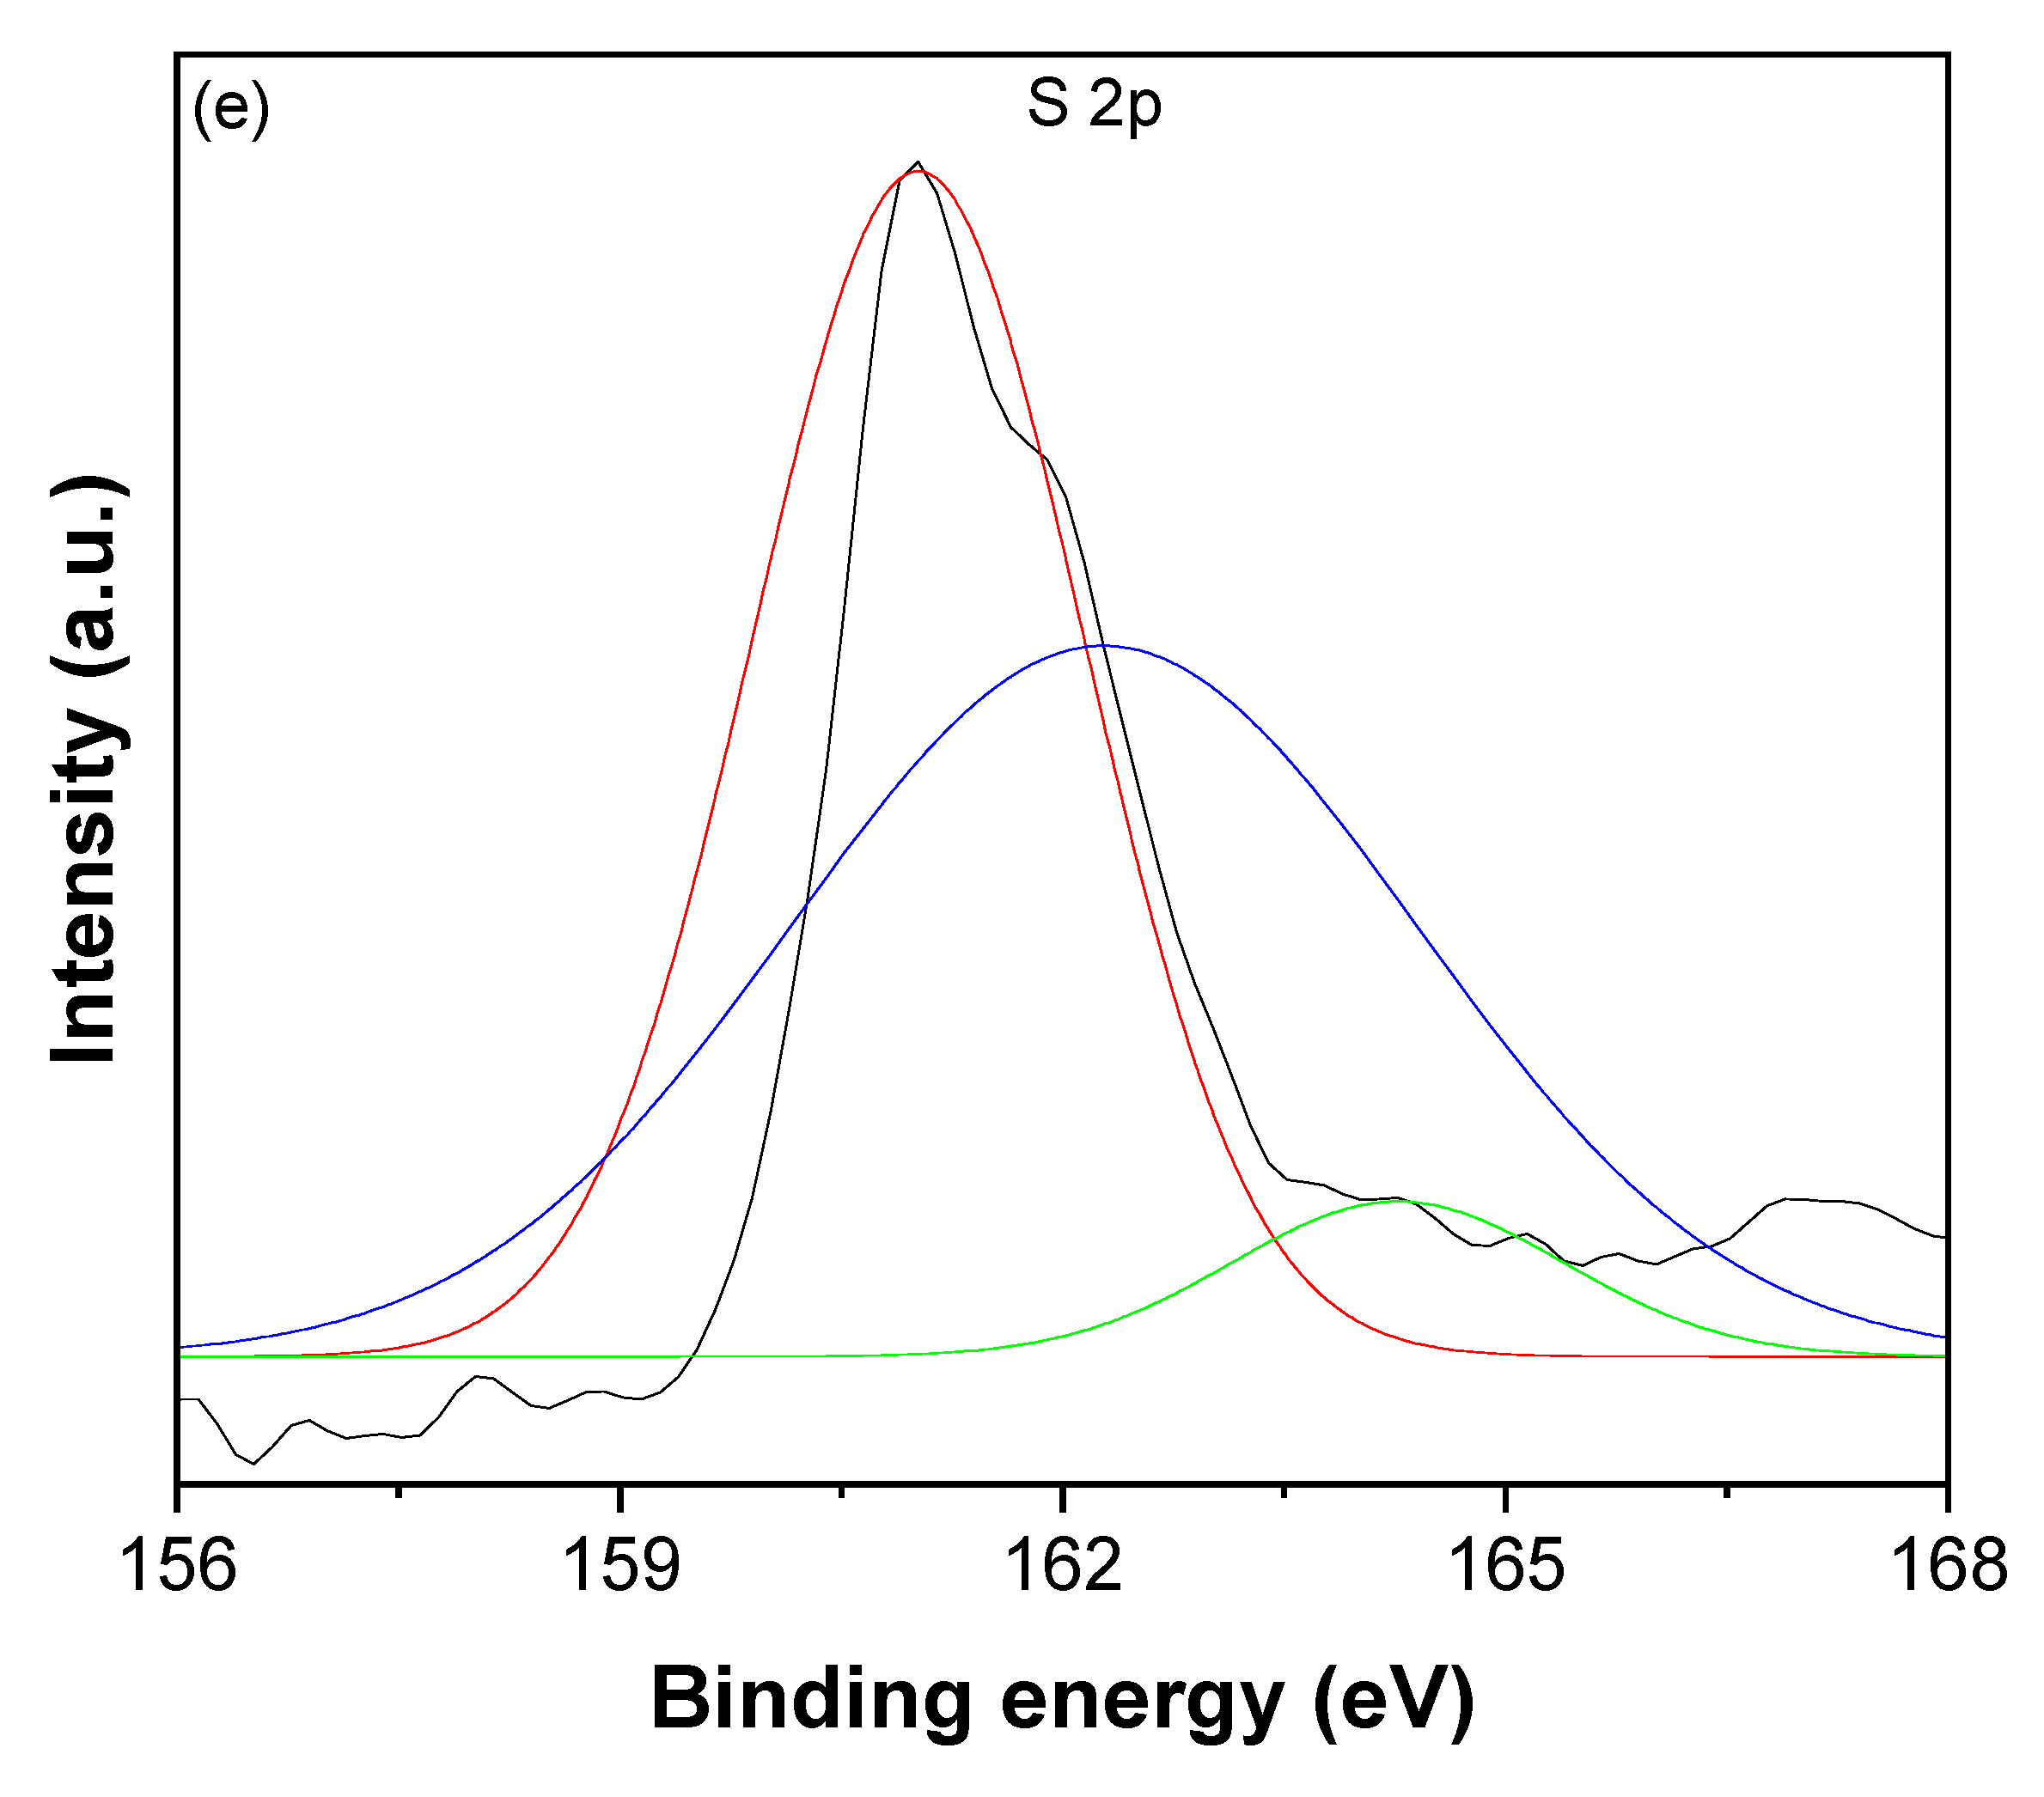
The XPS survey spectrum of CNTs-Ag2S, shown in Figure 6a, confirmed the presence of C, O, Ag, and S. The high-resolution spectrum of C1s (Figure 6b) divulged four distinct peaks by Gaussian fitting situated at 284.5, 285.5, 286.4, and 287.8 eV. Among these, peaks at 284.5 and 285.5 eV were assigned to the C-C bonds of the sp2 and sp3 hybridized carbon atoms of CNTs, respectively [55]. The peaks at 286.4 and 287.8 eV were due to the C-O and C=O bonds of CNTs, respectively [55]. The deconvoluted O 1s peak (Figure 6c) exhibited a peak at 531.3 eV for the lattice oxygen and a peak at 532.4 eV corresponding to the carbonyl (=C-O) functional groups of the CNTs [56]. The core-electron binding energy of Ag 3d3/2 was found at 373.9 eV, and that of Ag 3d5/2 was at 367.9 eV (Figure 6d). The presence of Ag 3d3/2 and Ag 3d5/2 peaks and their positions confirm the Ag+ state of silver [57]. The difference in the position of Ag 3d5/2 and Ag 3d3/2 peaks was 6 eV, and no shoulder or satellite peaks were observed between them. The high-resolution S 2p spectrum (Figure 6e) for the spin-orbit splitting of S2+ was deconvoluted into the 2p3/2 level peak at 161.2 eV, and the 2p1/2 peak at 162.3 eV. These peaks occurred by the Ag-S bonds of the Ag2S nanoparticles [58]. The additional peak at 163.9 eV is related to the presence of sulfur in CNTs-Ag2S [58].
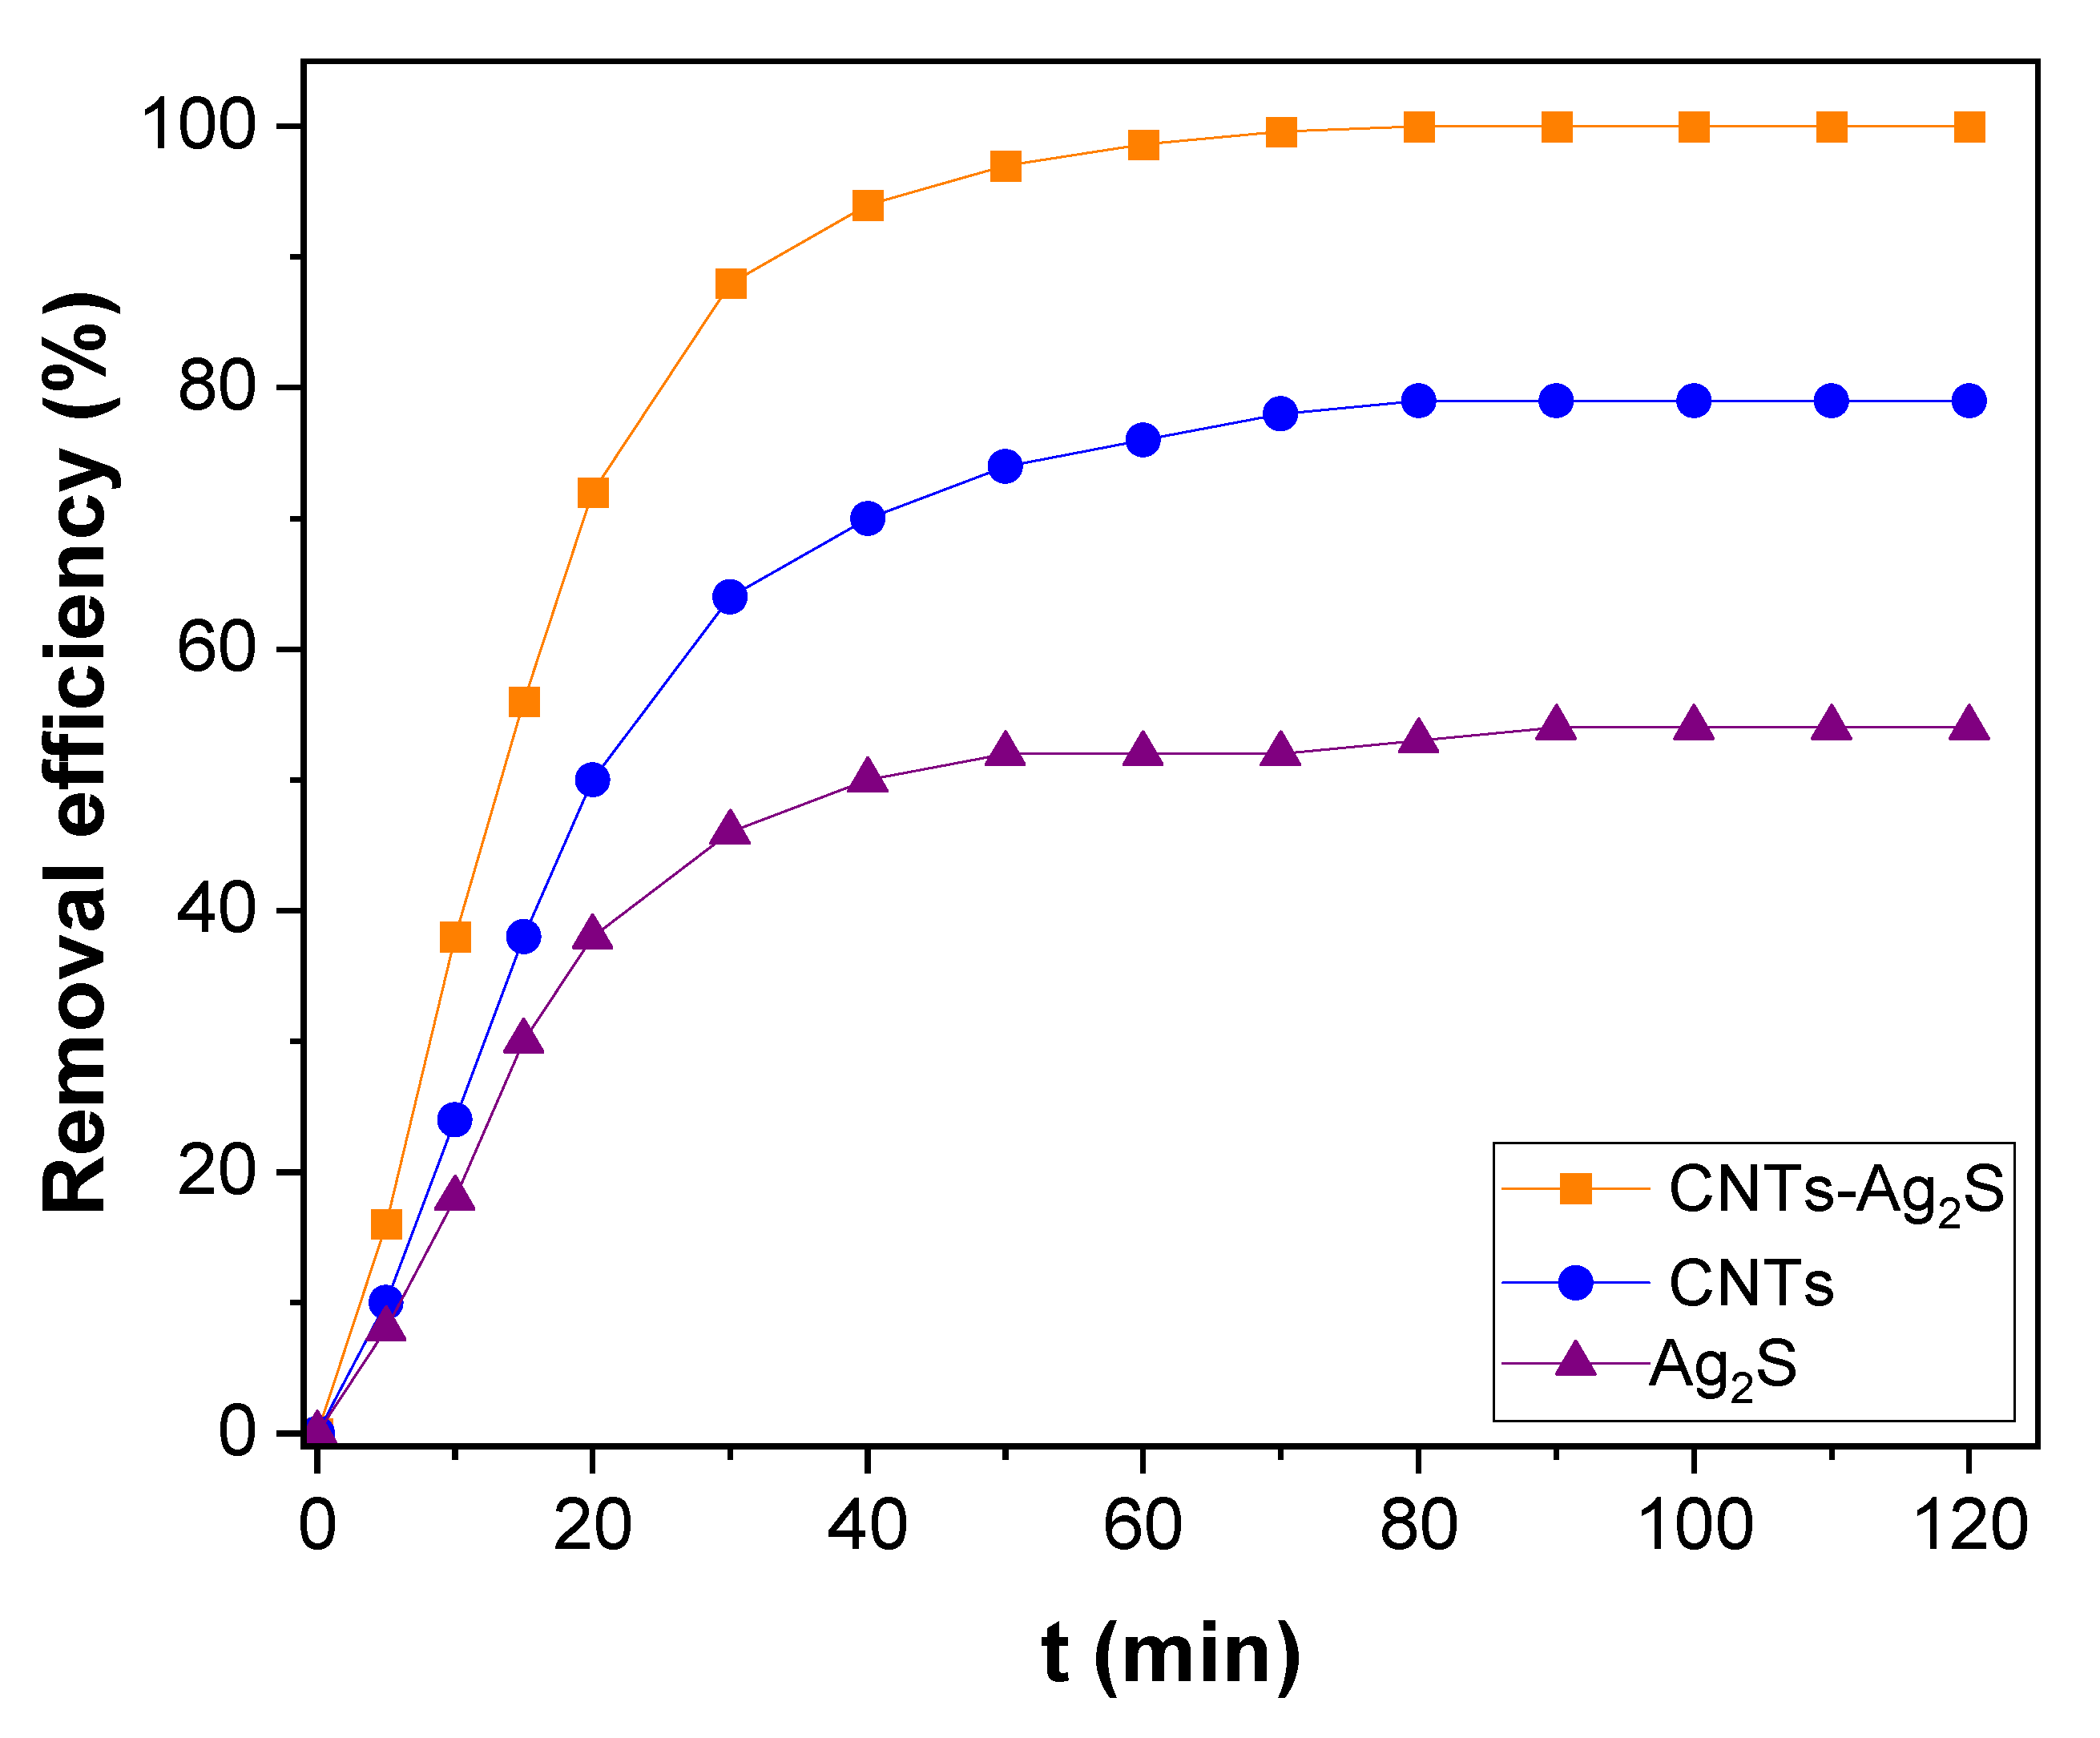
The adsorption ability of CNTs-Ag2S was determined by estimating the Cd(II) adsorption present in water. The contact time between adsorbent and adsorbate is critical and it controls adsorption. Therefore, the Cd(II) adsorption was determined by allowing for contact with CNTs-Ag2S at different times and compared with that of CNTs and Ag2S (Figure 7). The plot of the adsorption capacity, qt versus t, is presented in Figure S2. Cd(II) adsorption is time dependent and occurs as a gradient function of time. Hence, contact time is crucial in controlling the Cd(II) adsorption. The tendency in Cd(II) adsorption by CNTs, Ag2S, and CNTs-Ag2S was identical like the adsorption was rapid, then gradually reduced, and finally attained equilibrium. The initial rapid Cd(II) adsorption could have occurred due to the difference in the concentration of Cd2+ ions in the solution and over the surface of the CNTs-Ag2S, which facilitated the movement of Cd2+ ions from the solution to the surface of the CNTs-Ag2S [8]. Also, in the beginning, many active sites were available on the surface of CNTs-Ag2S to occupy by Cd2+ ions [8]. With the elapsed contact time, the active sites of the CNTs-Ag2S were predominantly occupied by Cd2+ ions. Apart, there is a possibility of repulsion between Cd2+ ions in the solution and Cd2+ ions exist over the surface of CNTs-Ag2S. Owing to these reasons, the adsorption rate could gradually decrease and eventually attain equilibrium [8]. Within 80 min of the contact time, CNTs-Ag2S could adsorb the Cd(II) completely; however, under identical conditions, the adsorption rates of CNTs and Ag2S were 79 and 53%, respectively. Thus, the adsorption efficiency of CNTs and Ag2S was significantly improved by their conjugation in CNTs-Ag2S. Further, to identify the adsorption kinetics of CNTs-Ag2S, the data were simulated with the pseudo-first-order kinetic model using the expression presented in Equation (1).
where qe and qt are the quantity of adsorbate (mg/g) at equilibrium and particular time, t (min), respectively, and k1 (min−1) is the pseudo-first-order rate constant.
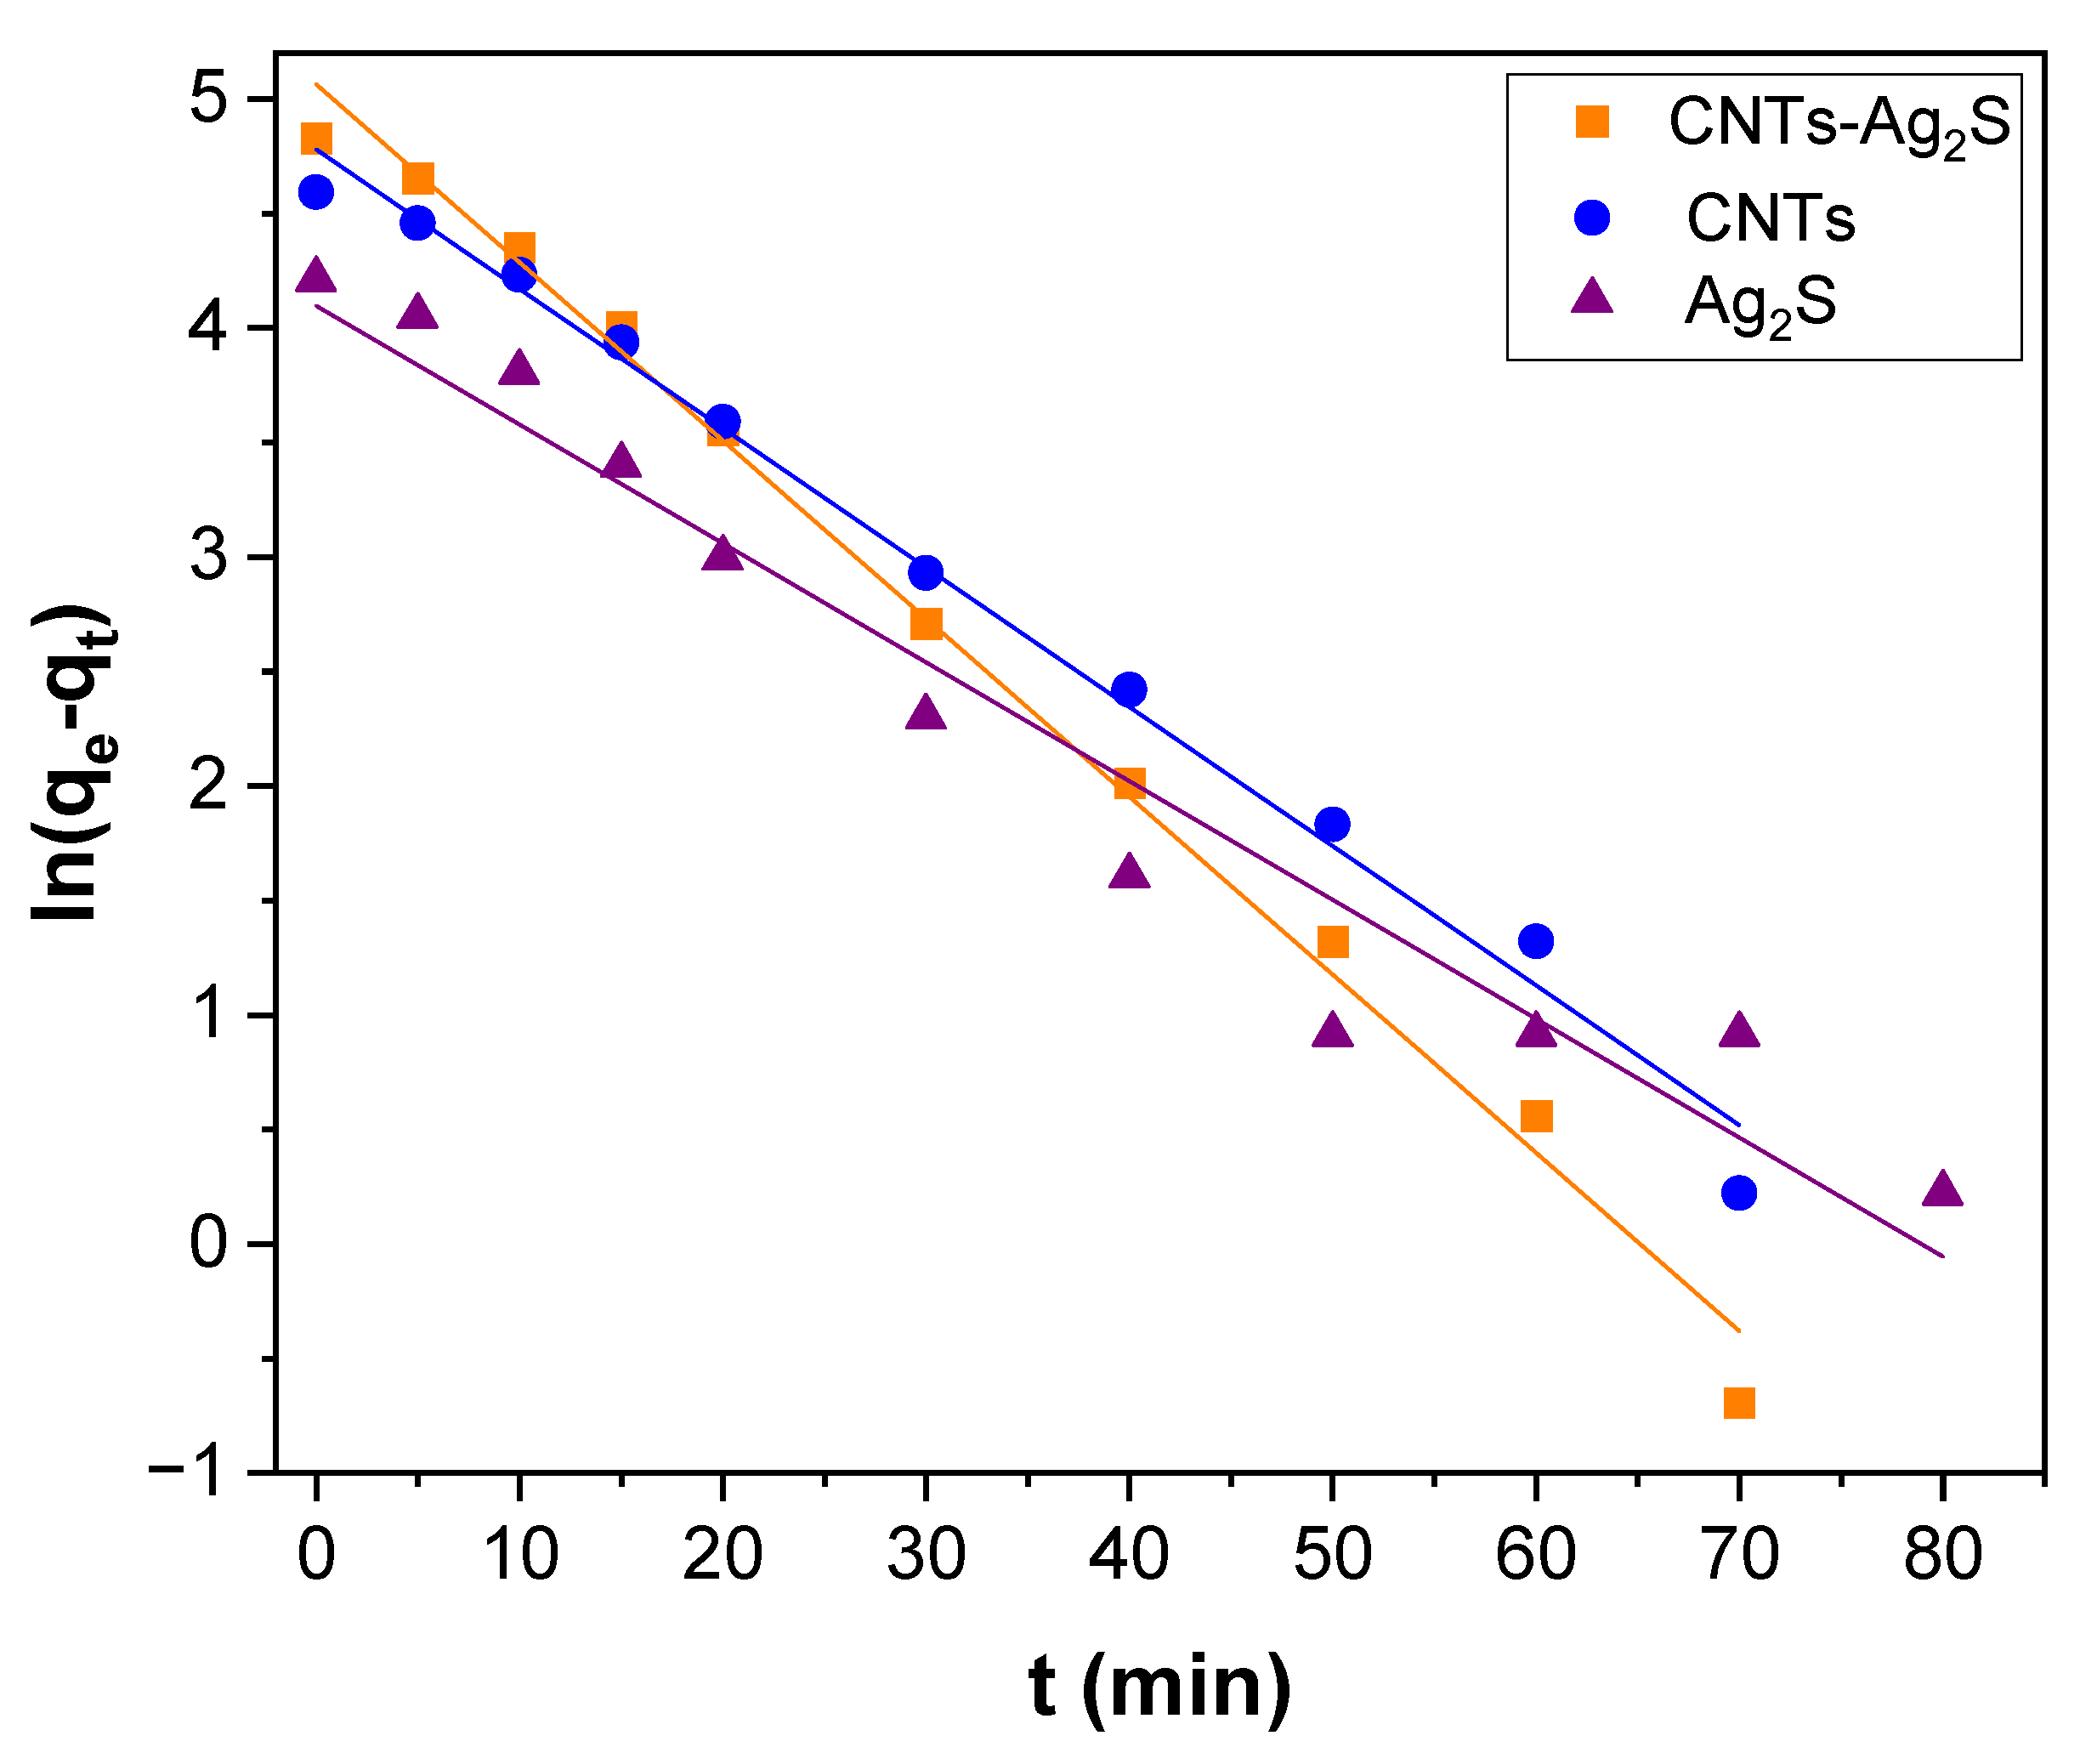
The pseudo-first-order plot obtained for Cd(II) adsorption over CNTs, Ag2S, and CNTs-Ag2S is shown in Figure 8. The correlation coefficients (R2) perceived for CNTs, Ag2S, and CNTs-Ag2S were 0.9906, 0.9540, and 0.9930, respectively. The k1 and qe were computed using the slope and intercept values of the straight lines acquired in Figure 8. The estimated values of k1 and qe is summarized in Table 1. The calculated qe(cal) could not agree with the experimental value qe(exp) for all samples. Thus, the experimental data for the Cd(II) adsorption could not be projected by the pseudo-first-order kinetic model. Alternatively, it was analyzed using the pseudo-second-order kinetic model using Equation (2).
where k2 [g/(mg.min)] is the pseudo-second-order rate constant.
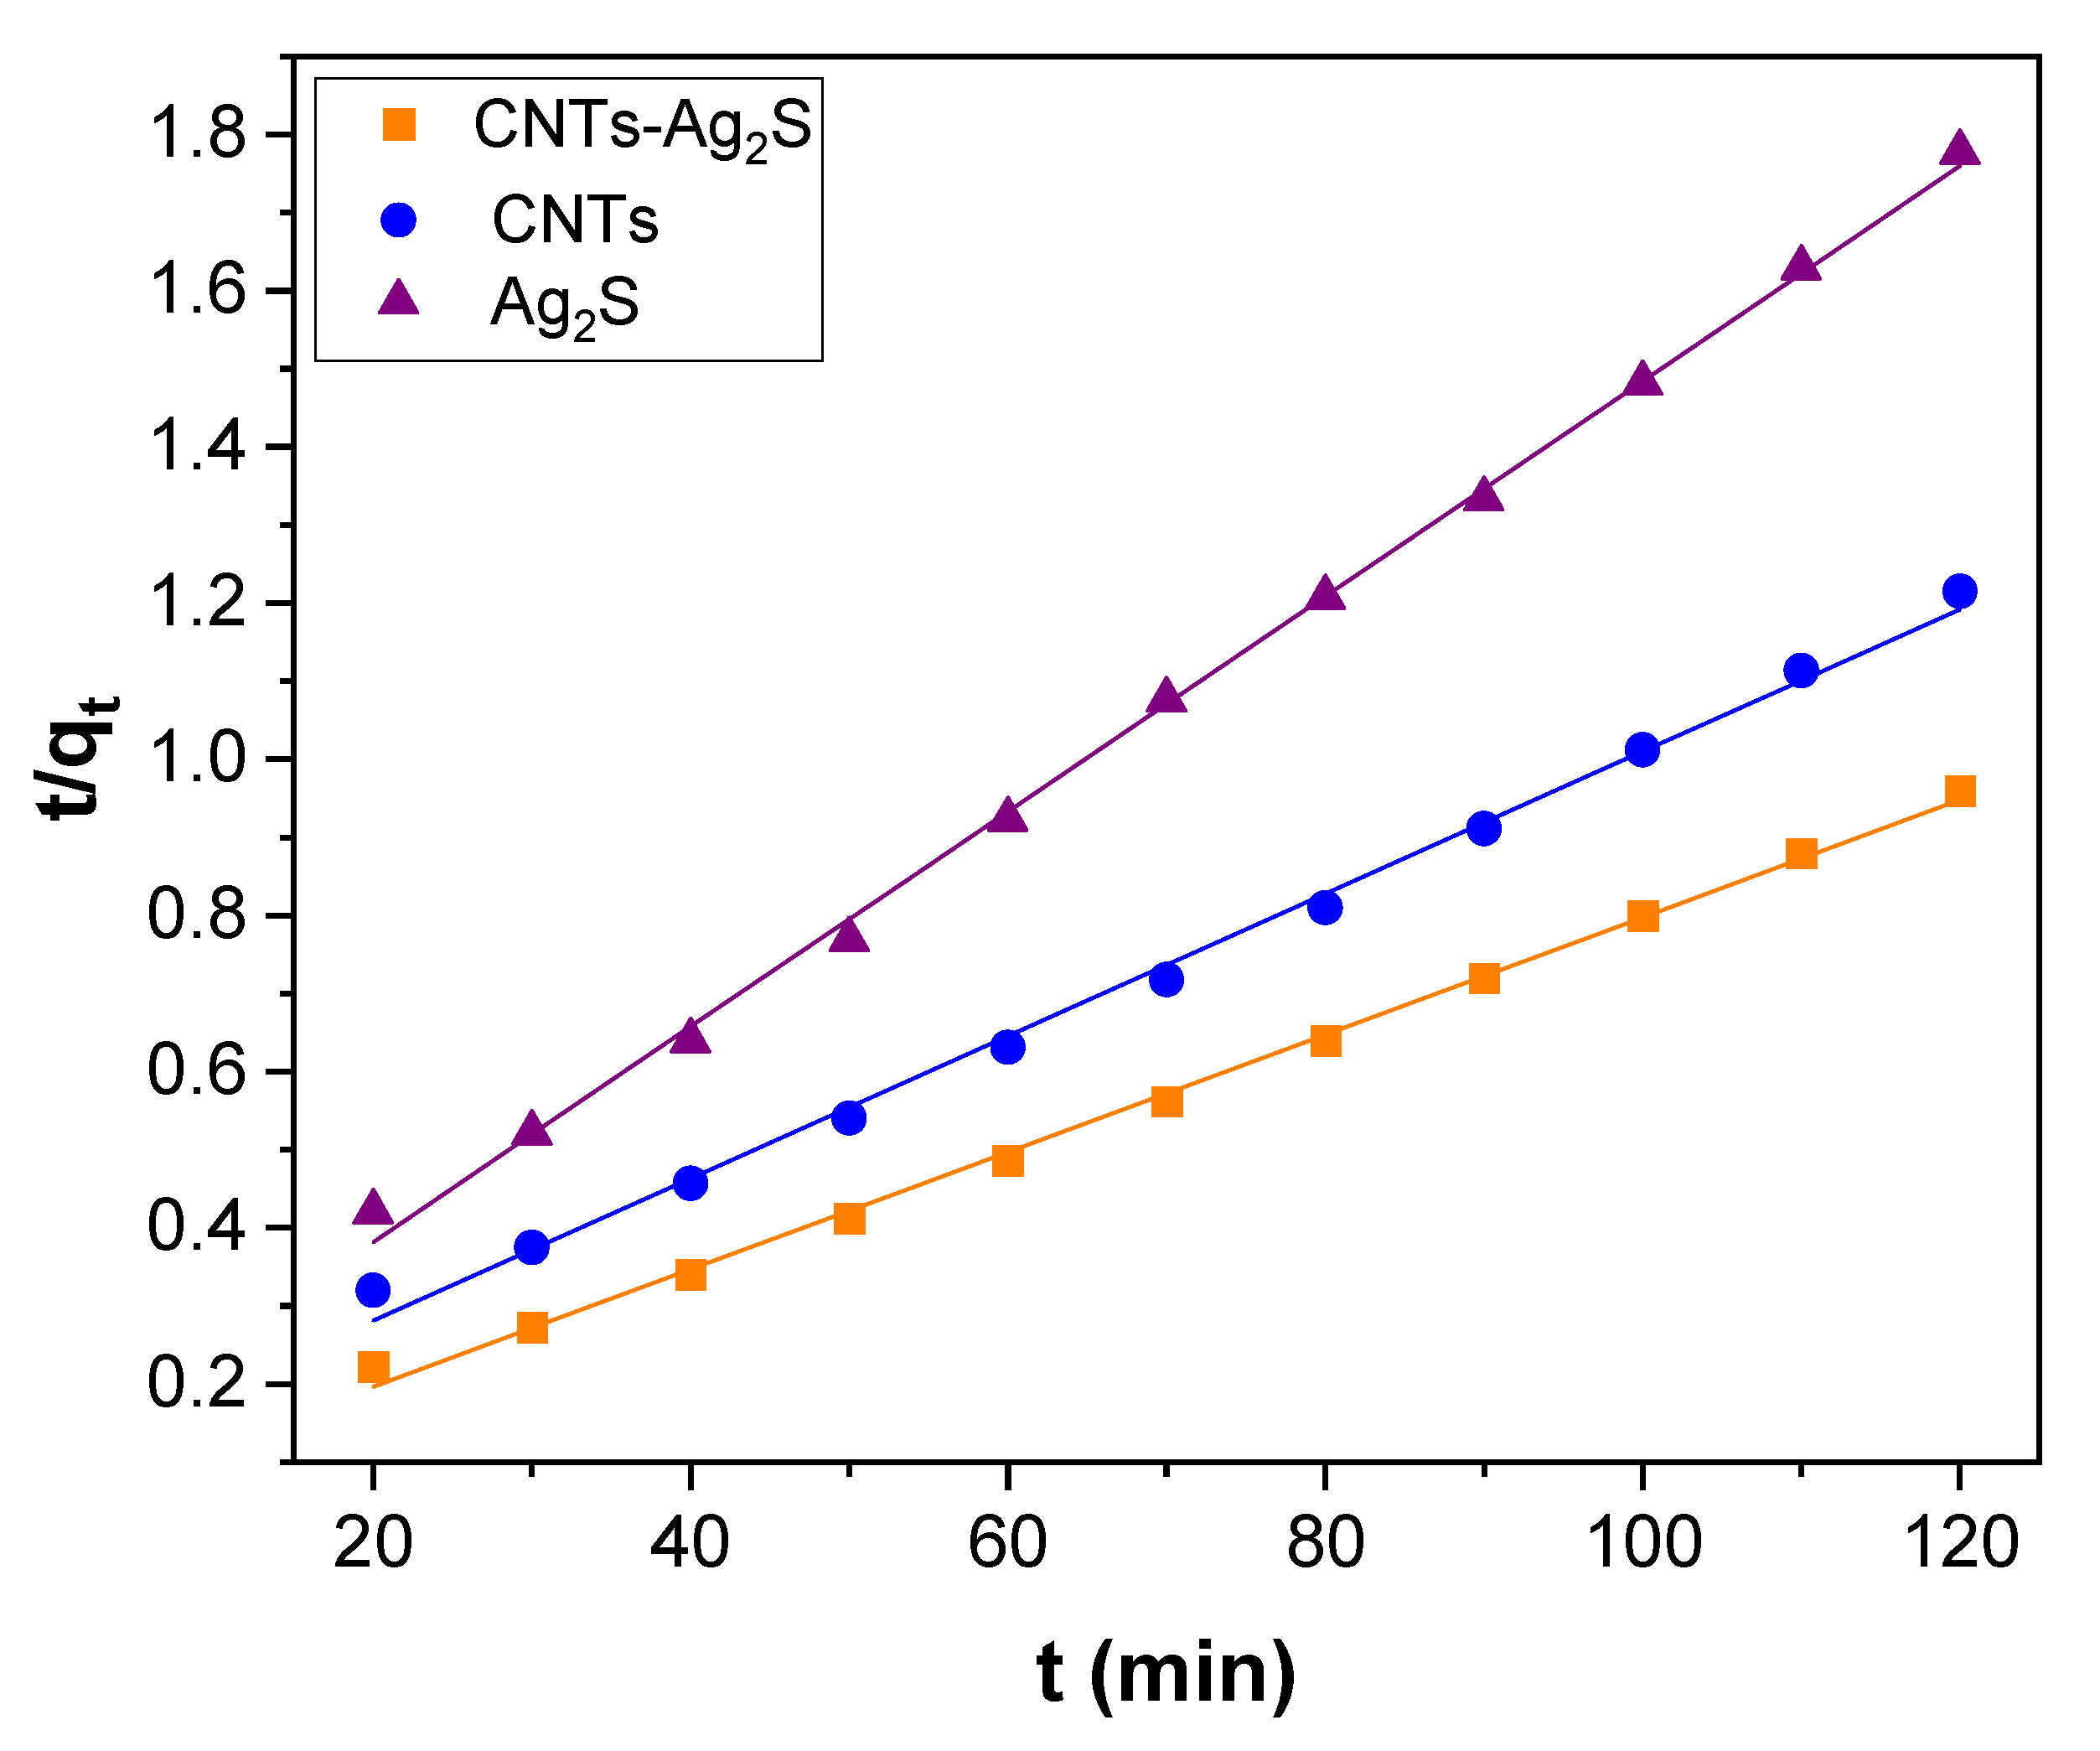
The pseudo-second-order model plot is illustrated in Figure 9, and the determined parameters are presented in Table 1. The R2 values derived from the pseudo-second-order plots for CNTs, Ag2S, and CNTs-Ag2S were 0.9963, 0.9985, and 0.9980, respectively. The R2 value of the second-order plot was relatively higher than that found for the first-order plot, which was close to 1. The qe(cal) of the second-order model matched the qe(exp) for all samples. The linearity of the pseudo-second-order plot and the agreeing values of qe(exp) and qe(cal) show that the Cd(II) adsorption could be analyzed using the pseudo-second-order kinetics rather than the pseudo-first-order kinetics. The agreement of the second-order kinetics demonstrates that chemisorption was the rate-determining step in the Cd(II) adsorption [9]. Moreover, it represents the rapid transfer of Cd(II) from a solution with a lower initial concentration to the surface of the CNTs-Ag2S due to the concentration gradient [9]. Further, the experimental data were explored using the Weber−Morris intraparticle pore diffusion model to evaluate the diffusion mechanism using Equation (3).
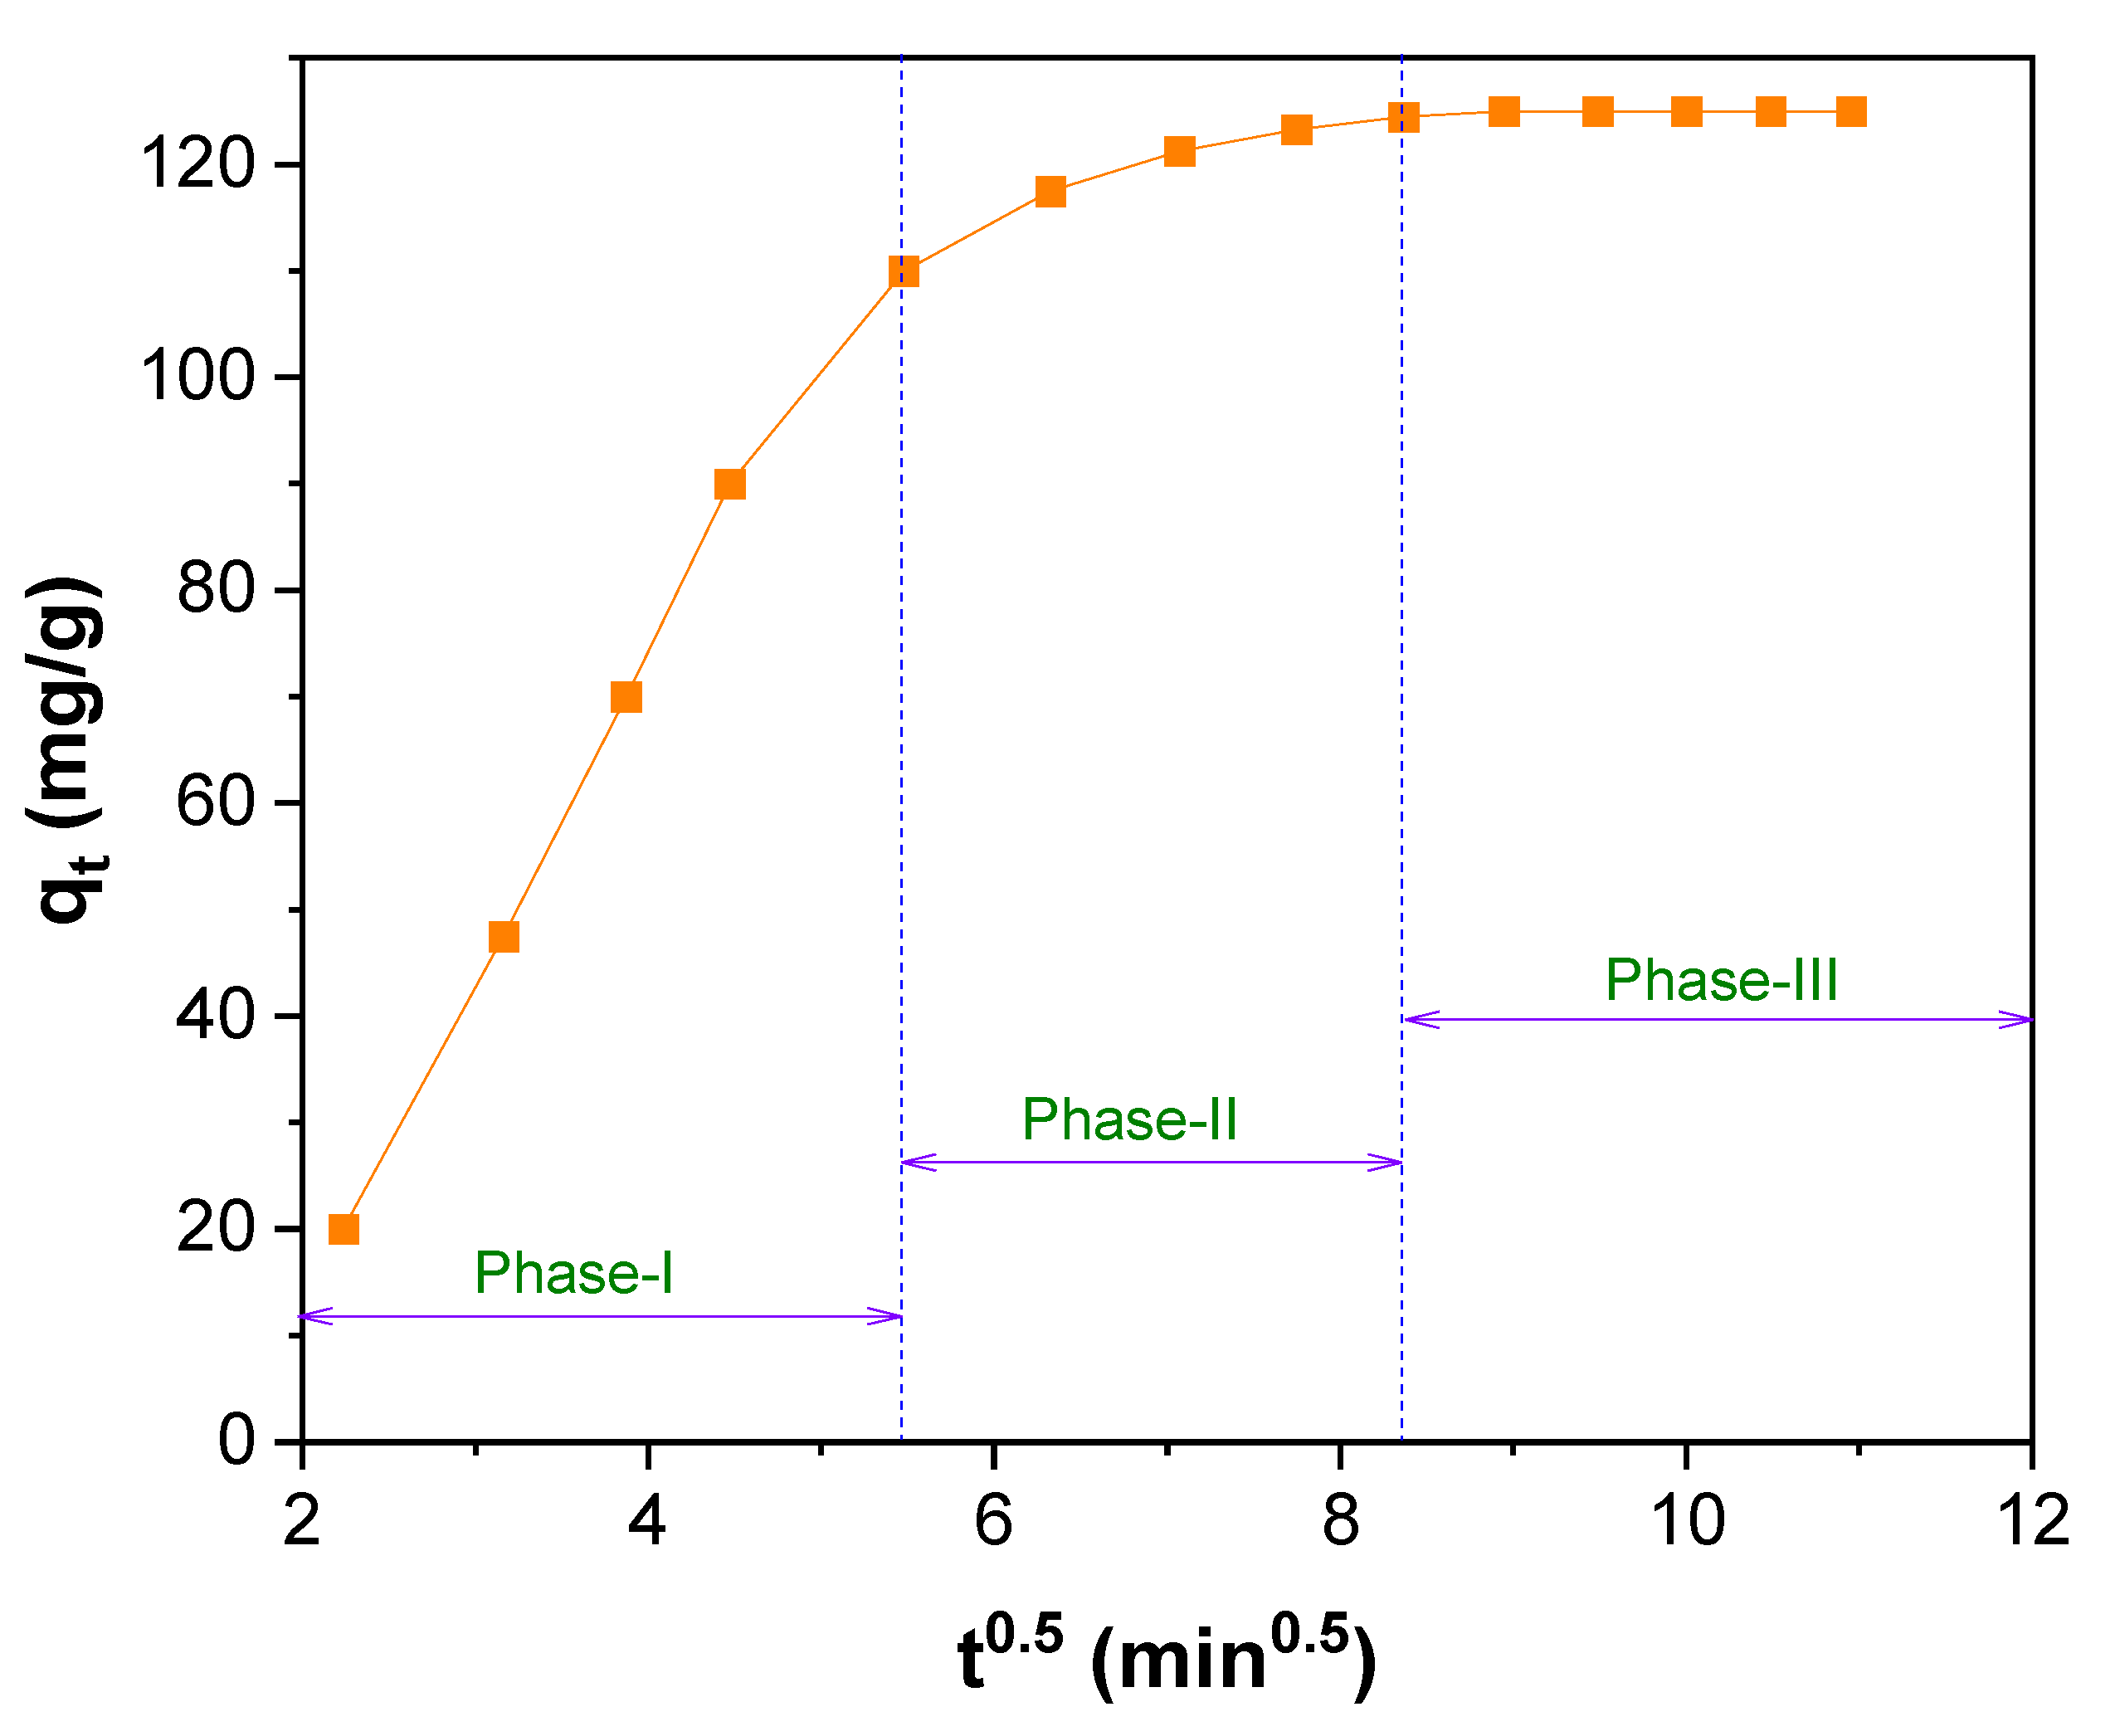
where kid (mg/g.min) is the intraparticle diffusion rate constant, which can be calculated from the linear plot of qt versus t0.5. c (mg/g) is the intraparticle diffusion constant, estimated from the intercept and directly proportional to the boundary layer thickness. It is assumed that the higher the intercept value, the more significant the contribution of the surface adsorption in the rate-controlling step. If the regression of the qt versus t0.5 plot is linear and passes through the origin, intraparticle diffusion plays a significant role in controlling the kinetics of the adsorption process. If it does not pass through the origin, intraparticle diffusion is not the only rate-limiting step. Instead, it is contributed by the boundary layer effect [59]. The intraparticle diffusion plot of qt versus t0.5 acquired for the Cd(II) adsorption on CNTs-Ag2S is demonstrated in Figure 10. The plot in Figure 10 does not pass through the origin of the coordinates (Figure S3). So, intraparticle diffusion is not the sole rate-limiting step in Cd(II) adsorption over CNTs-Ag2S. The association of the two straight lines in the intraparticle diffusion plot (Figure S3) and the intercept values (Table S1) support that the intraparticle diffusion was not only a rate-controlling step in the Cd(II) adsorption; it also contributed through the boundary layer effect [59]. The multilinearity of the plot in Figure 10 (Figure S3) shows that the Cd(II) adsorption transpires through multiple phases [60]. Among these, the initial stage occurred through the rapid adsorption of Cd2+ ions, the second phase was owing to the diffusion of Cd2+ ions into the pores of CNTs-Ag2S, and the third phase was due to equilibrium of the adsorption that caused a chemical reaction/bonding [60].
The experimental equilibrium parameters for Cd(II) adsorption were determined by applying three isotherm models: Langmuir, Freundlich, and Temkin. The Langmuir model predicts that the adsorbed molecules form a monolayer and adsorption emerges at a static number of adsorption sites, each of which is equivalent in efficiency. Moreover, each molecule has a constant enthalpy and adsorption activation energy, it means that all molecules have an affinity equal to entire adsorption sites [61]. With the help of Langmuir isotherm model, it could be find the value of the maximum adsorption capacity of the adsorbent using Equation (4) [62]:
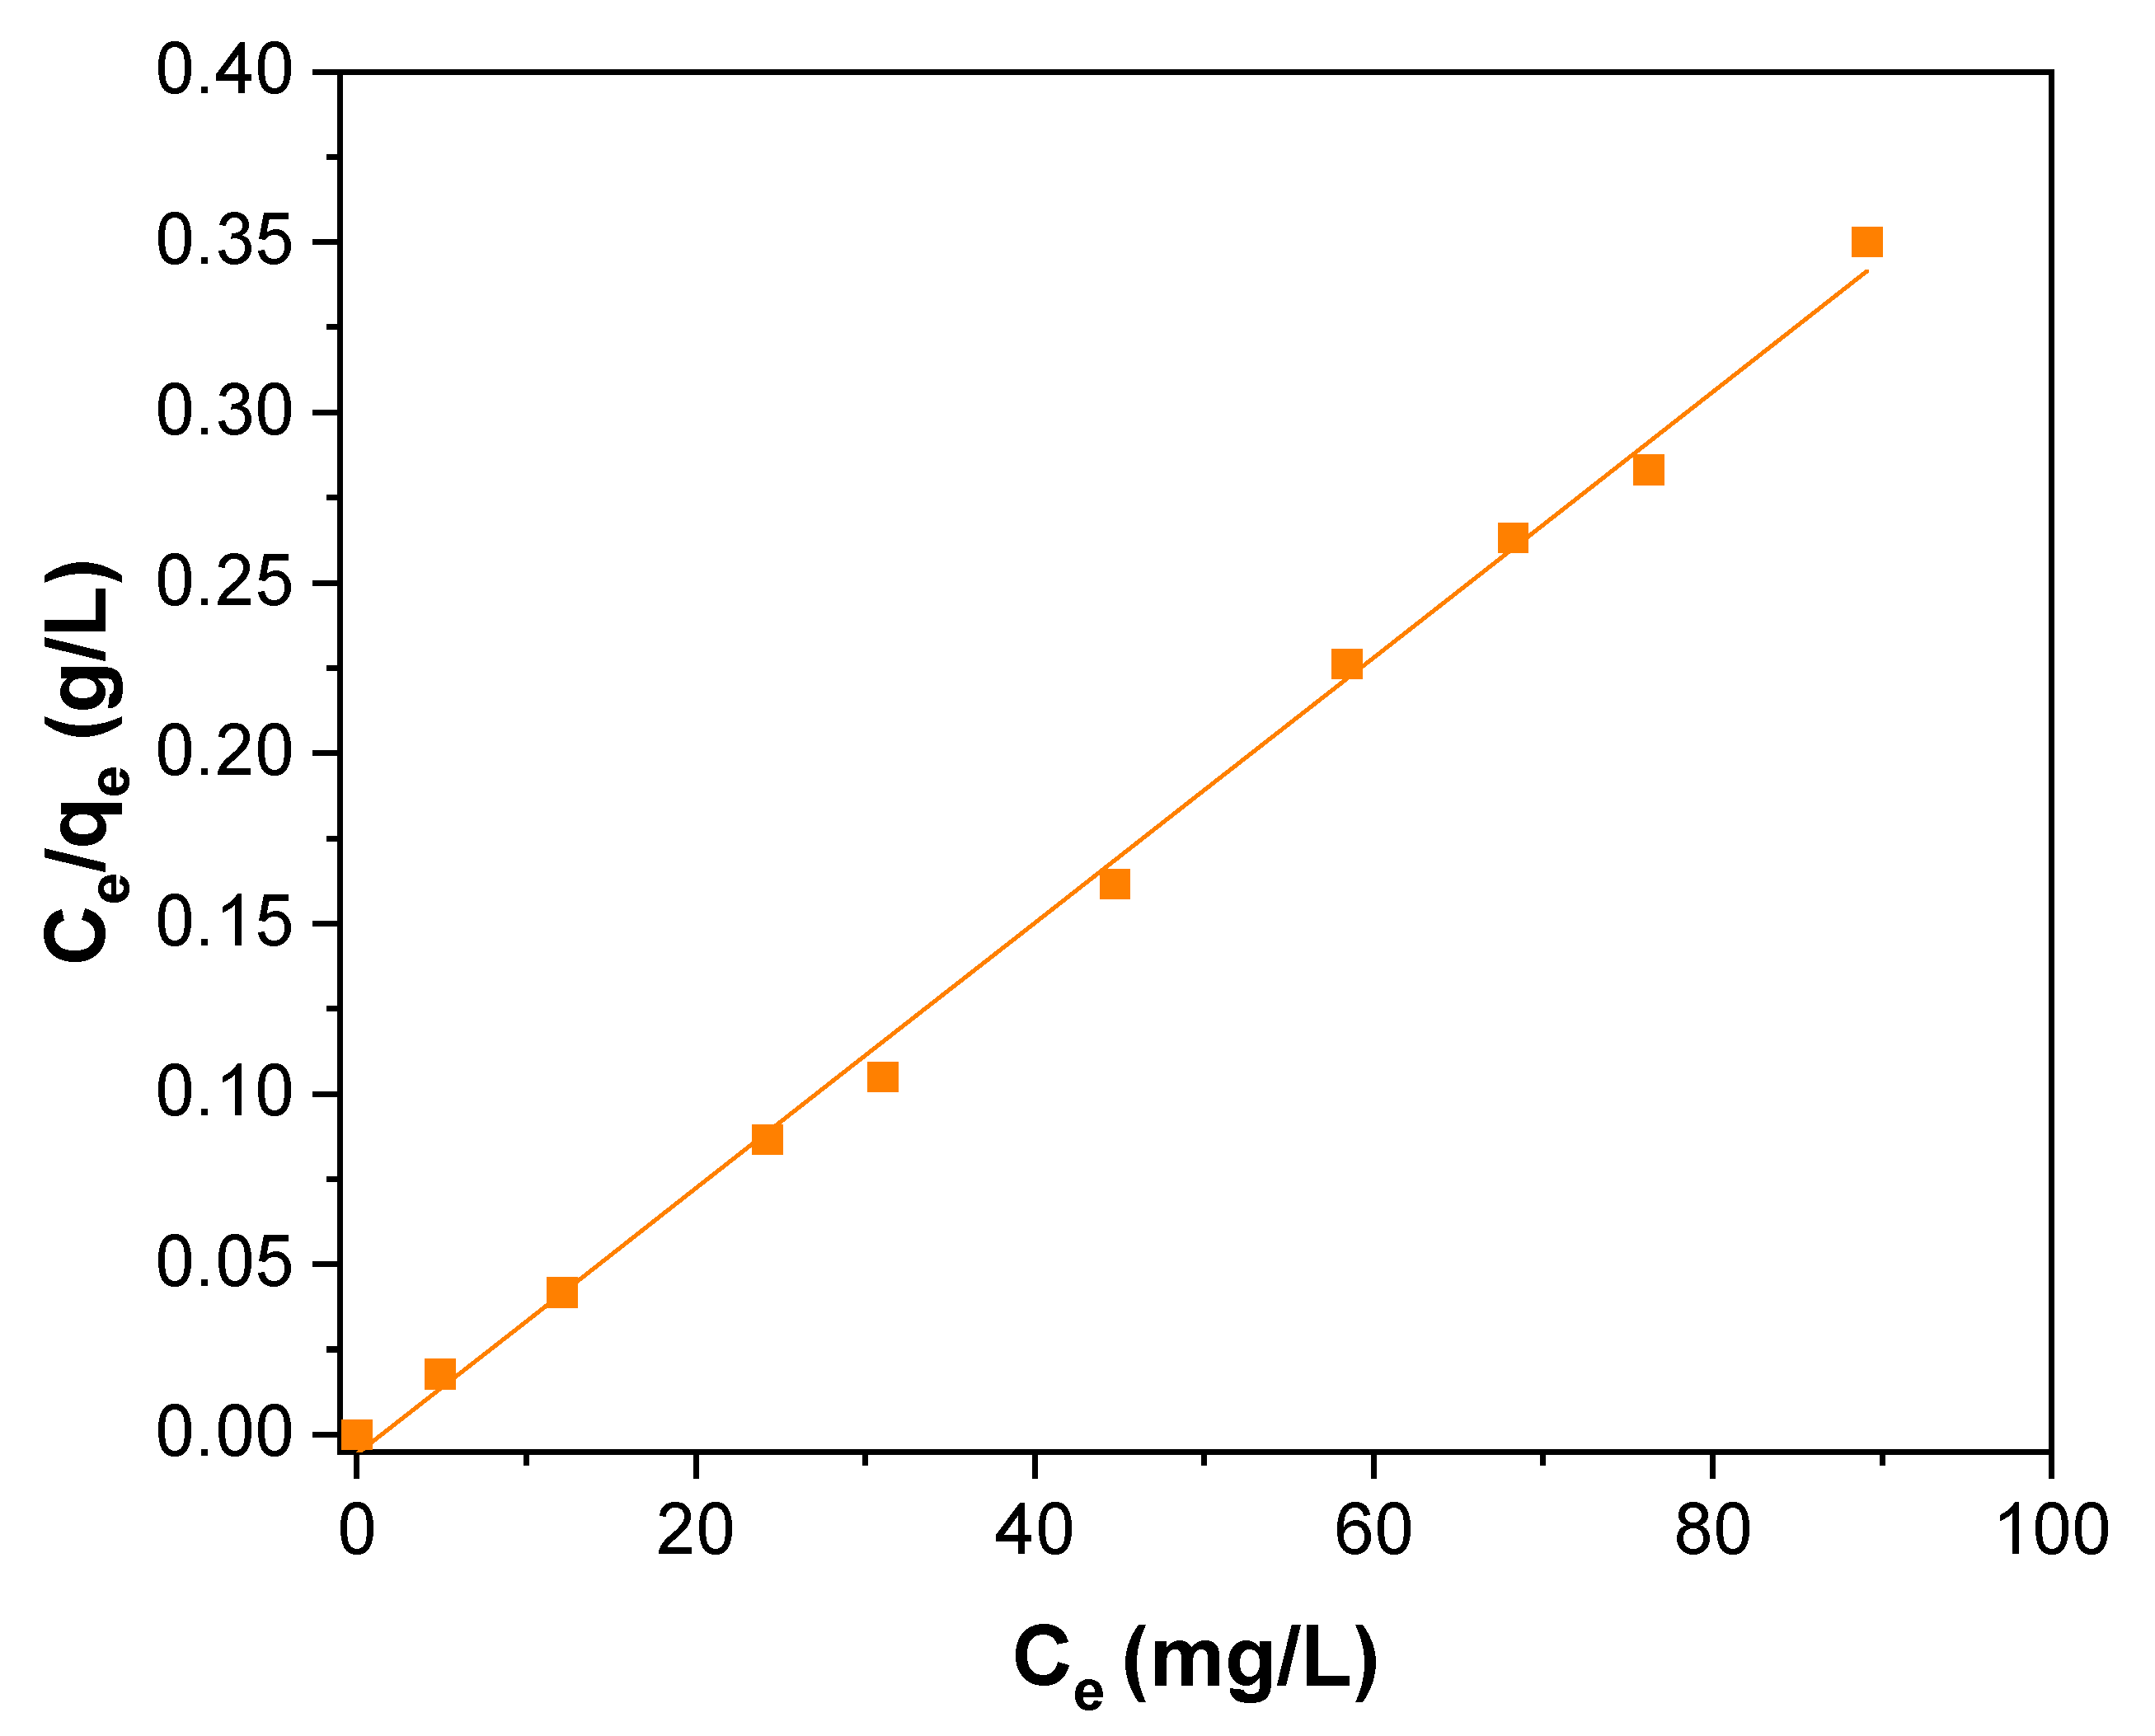
where qe (mg/g) is the amount of adsorbed Cd(II) per unit mass of CNTs-Ag2S; Ce (mg/L) is the concentration of Cd(II) at equilibrium; qm is the maximum amount of the Cd(II) adsorbed per unit mass of CNTs-Ag2S to form a complete monolayer on the surface-bound at high Ce. KL is the Langmuir adsorption constant related to the free energy of adsorption. The Langmuir plot for Cd(II) adsorption over CNTs-Ag2S is presented in Figure 11. The estimated parameters are shown in Table 2. The maximum adsorption capacity (qm) calculated for Cd(II) adsorption over CNTs-Ag2S was 256.4 mg/g.
The Freundlich isotherm is developed based on the assumption that the adsorption sites are distributed exponentially concerning the heat of adsorption [62,63]. It provides the relationship between the equilibrium of liquid and solid phase capacities with multilayer adsorption properties consisting of the heterogeneous surface of the adsorbent. The Freundlich isotherm that supports multilayer adsorption agrees with the Langmuir model over moderate ranges of concentrations but differs at low and high concentrations. The linear form of the Freundlich isotherm can be represented b Equation (5):
where qe (mg/g) is the amount of Cd(II) adsorbed at equilibrium. KF and n are Freundlich constants. KF symbolizes the affinity of the adsorbent, and n signifies the adsorption intensity. Ce (mg/L) is the Cd(II) concentration at equilibrium. The Freundlich isotherm plot attained for Cd(II) adsorption is shown in Figure S4, and the calculated parameters are included in Table 2.
The Temkin isotherm model is based on the fact that, during adsorption, the heat of all molecules decreases linearly with an increase in the coverage of the adsorbent surface and that adsorption is characterized by the uniform distribution of binding energies up to the maximum binding energy [62,64]. The linear form of the Temkin isotherm model is shown in Equation (6):
where B = RT/KT, KT is the Temkin constant related to the heat of adsorption (J/mol); A is the Temkin isotherm constant (L/g), R is the gas constant (8.314 J/mol K), and T is the absolute temperature (K). The Temkin isotherm fitting plot for the Cd(II) adsorption is shown in Figure S5. The values estimated from Figure S5 are illustrated in Table 2.
The R2Lan value found for the Langmuir isotherm plot was 0.9972; for Freundlich and Temkin isotherm plots, the R2Fre and R2Tem values were 0.3562 and 0.0019, respectively. The Freundlich and Temkin isotherm models provided scattered points and failed to accomplish linearity. Therefore, the Freundlich and Temkin isotherm models were unsuitable for explaining Cd(II) adsorption over CNTs-Ag2S. However, the Langmuir isotherm model produced linearity. Therefore, the Langmuir model is appropriate for elucidating the Cd(II) adsorption. The validation of the Langmuir model indicates that the Cd(II) adsorption over CNTs-Ag2S ensued with monolayer molecular covering and chemisorption, together [65].
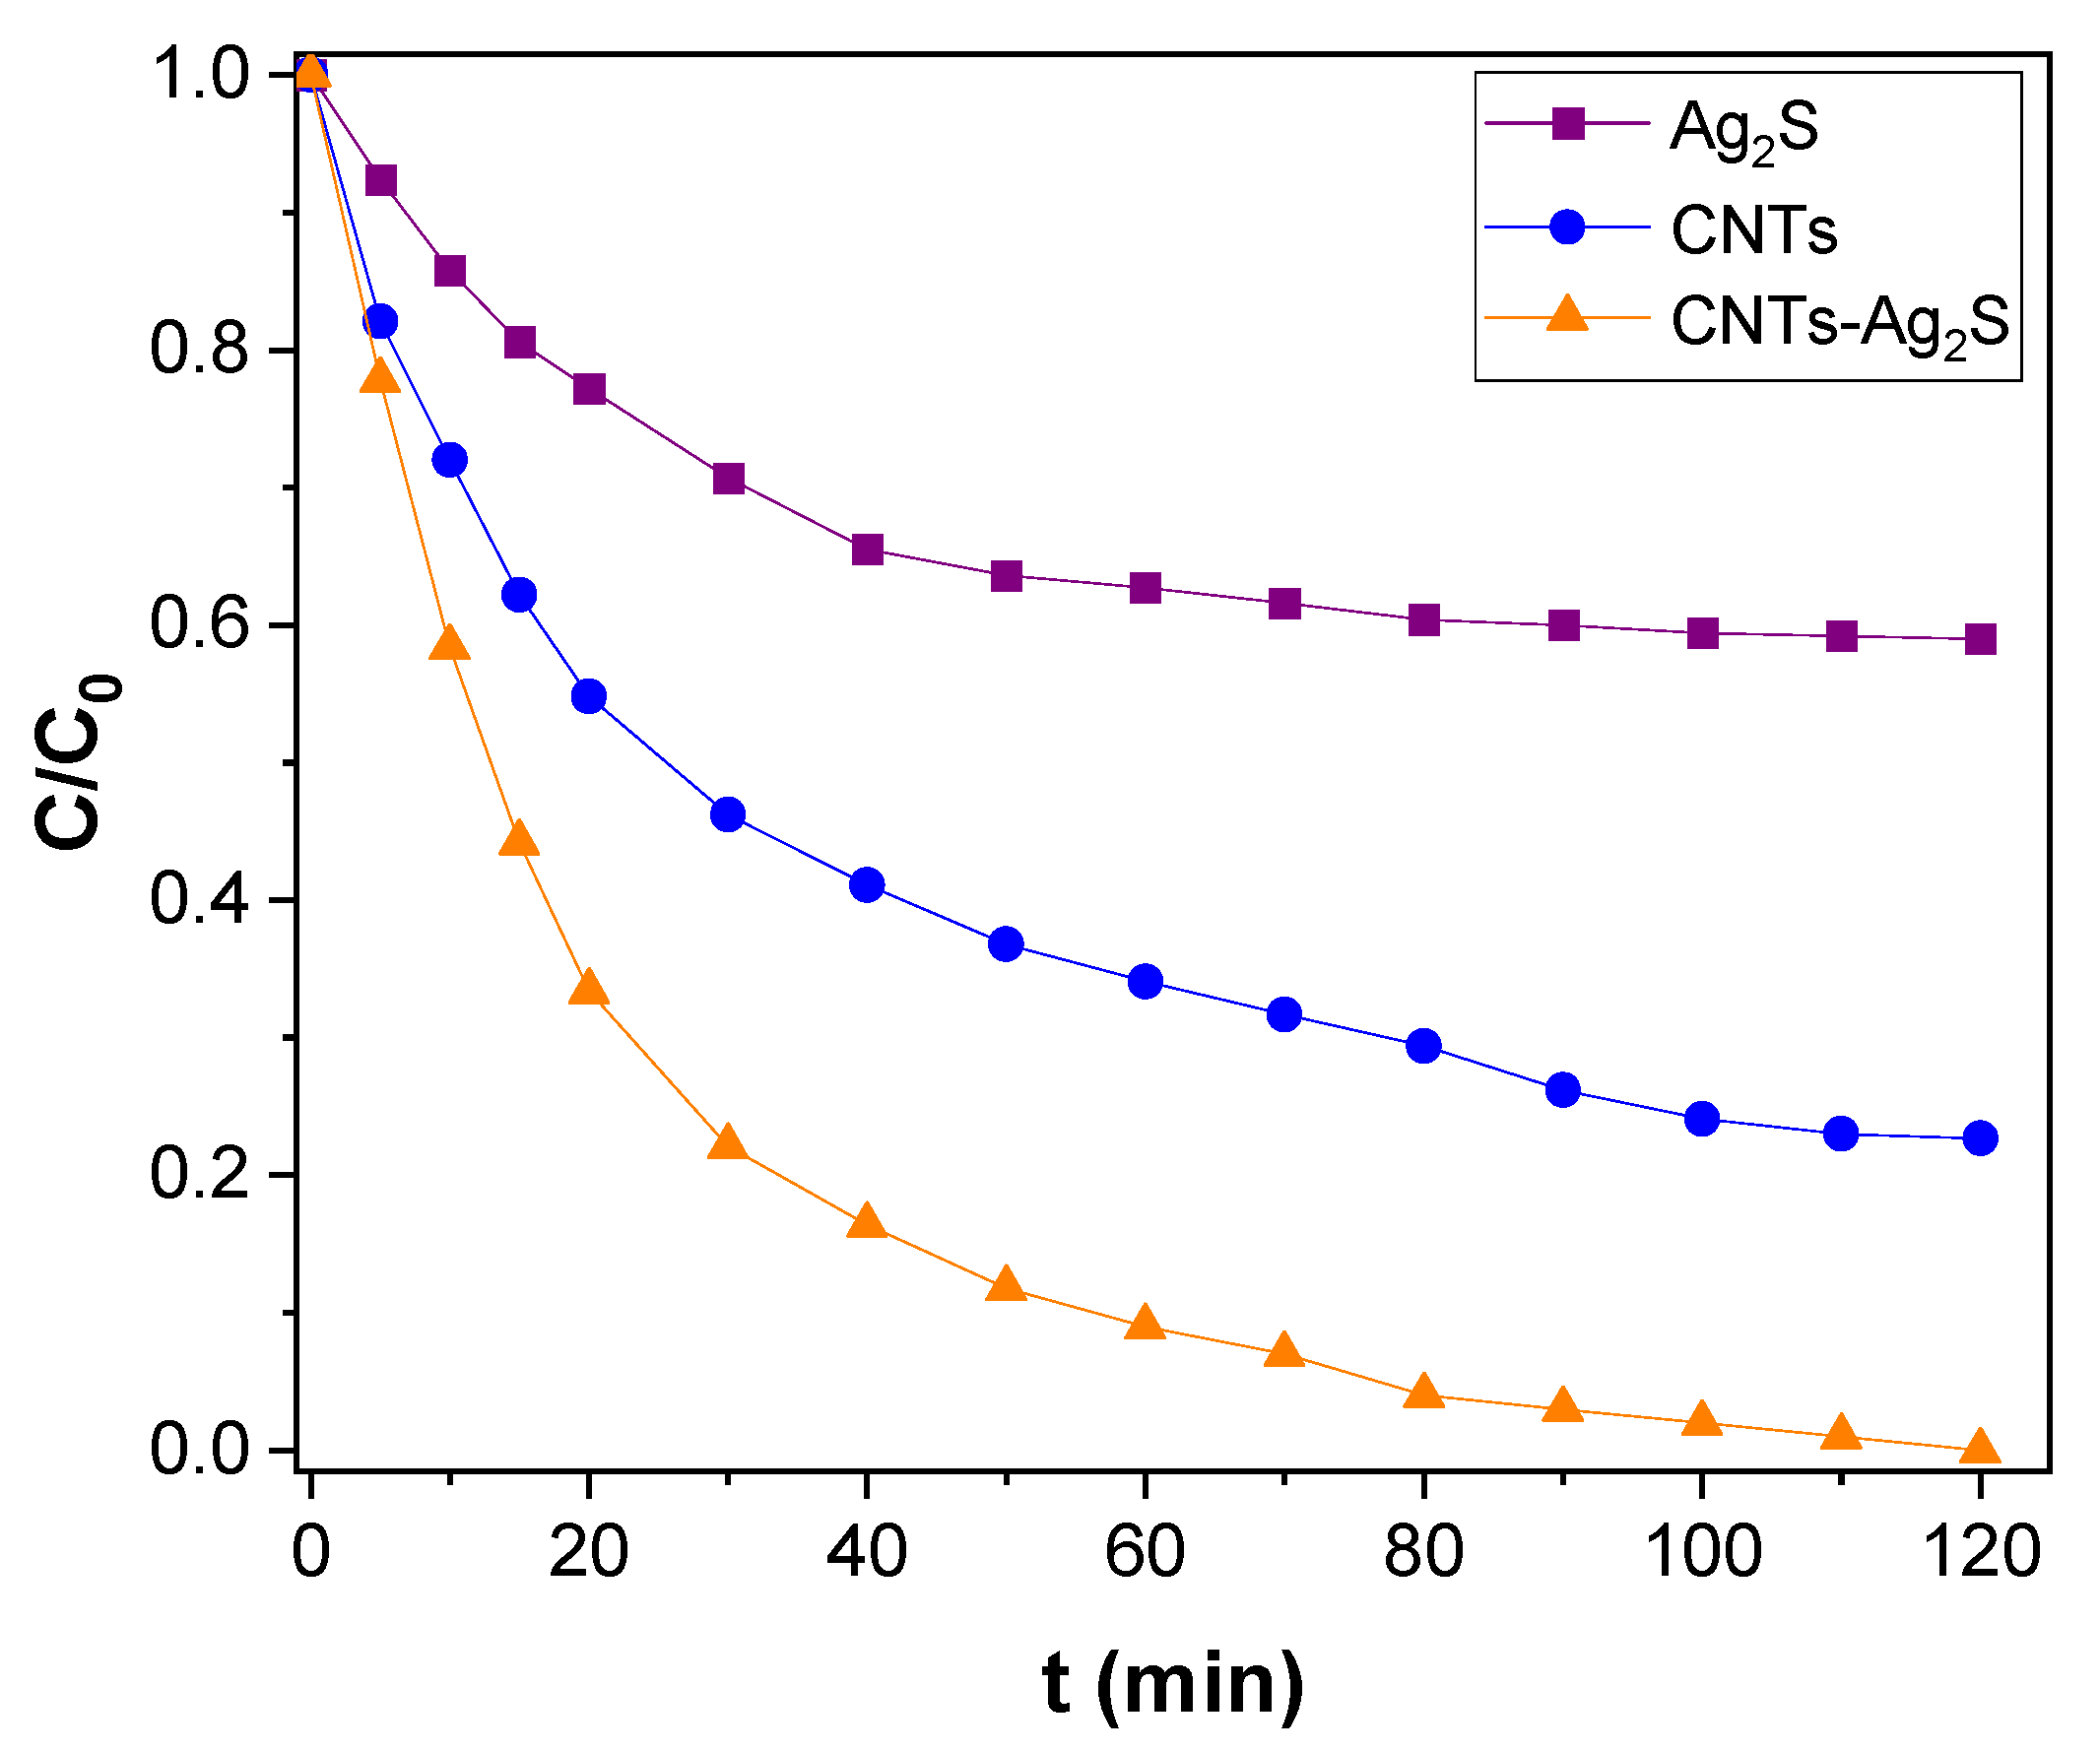
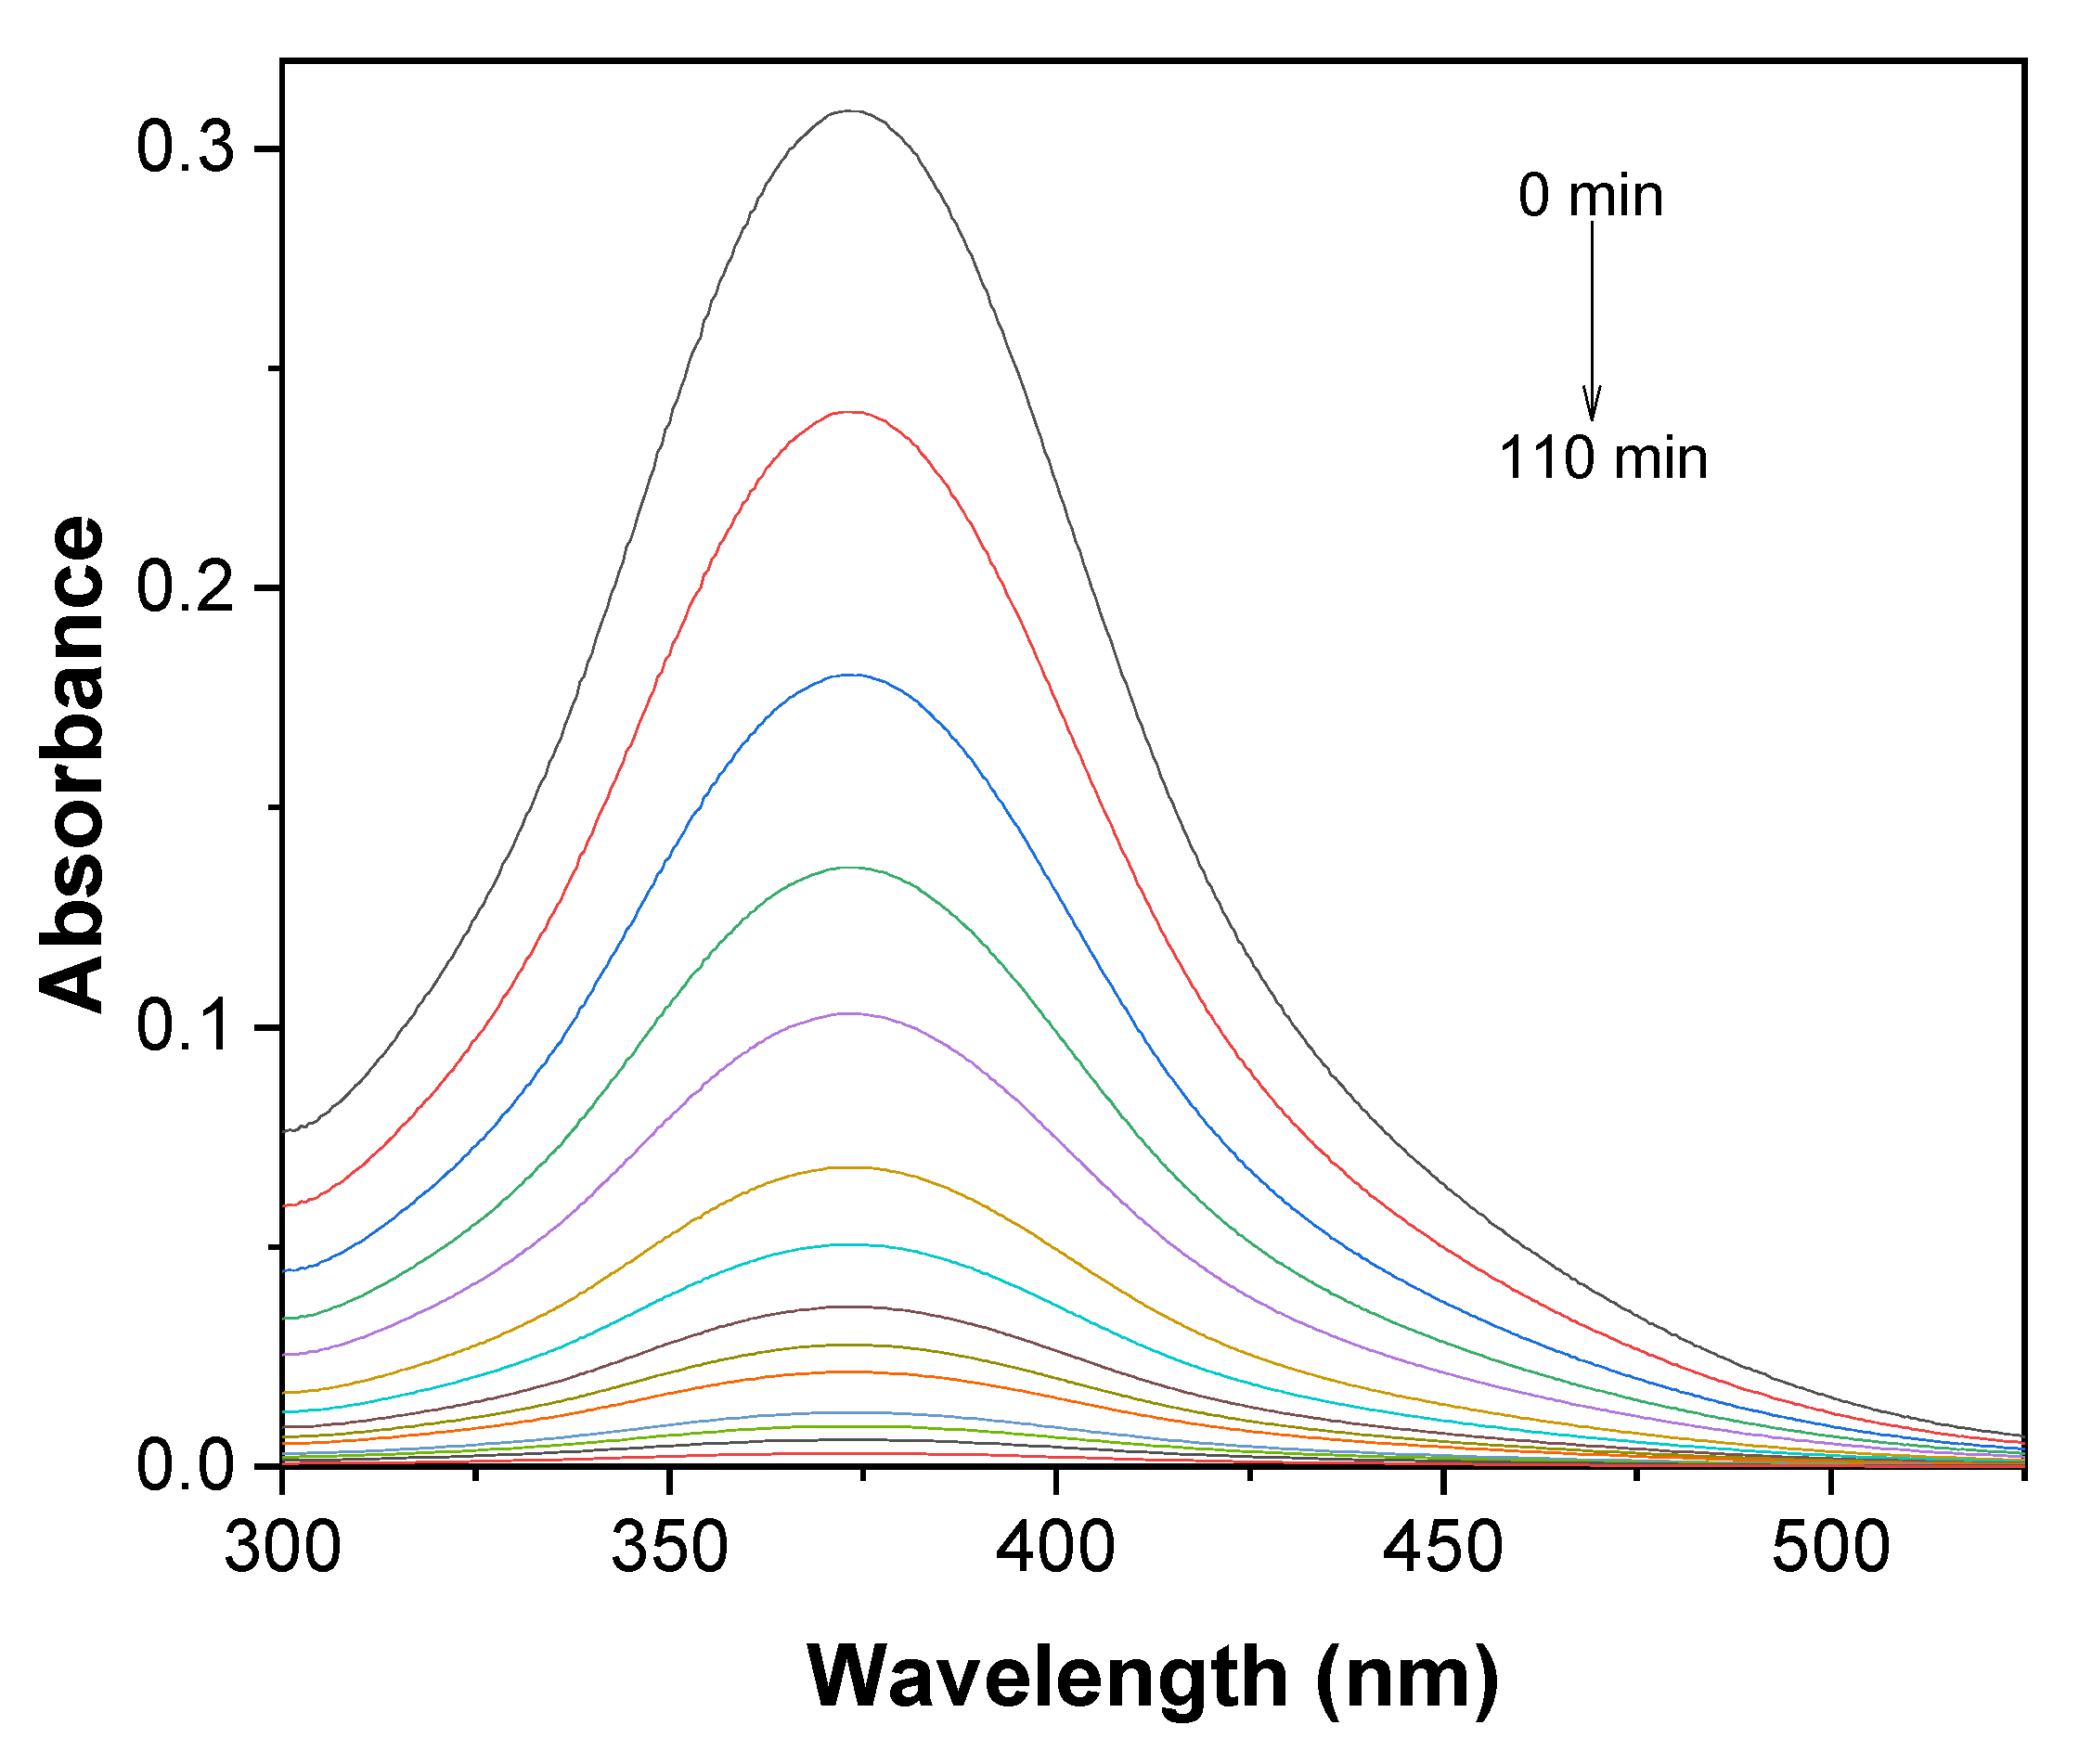
Further, the photocatalytic activity of CNTs-Ag2S was investigated through the degradation of AYR under exposure to sunlight. The degradation of AYR by CNTs-Ag2S is presented in Figure 12. The activity of CNTs-Ag2S was compared with that of CNTs and Ag2S. The CNTs-Ag2S could degrade the AYR completely within 120 min of illumination. However, CNTs and Ag2S were capable to degrade 77.3 and 41% of AYR, respectively, in 120 min. Hence, the conjugation of CNTs and Ag2S was substantially improved the photocatalytic activity in CNTs-Ag2S. The degradation of AYR was quantified by the reduction in the electronic absorption band located at 373 nm (Figure 13). The hybrid nano-architecture of CNTs-Ag2S was proficient in adsorbing higher number of AYR molecules and capable in absorption of sunlight. In addition, the effectual hindrance of recombining of electrons and holes during photocatalysis facilitated the degradation process. The photocatalytic activity of CNTs-Ag2S was further explored by finding the apparent rate constants using the Langmuir-Hinshelwood (L-H) model and with the help of Equation (7) that could be applicable for low concentrations of dyes [38,39,44,45].
where C0 is the initial concentration of AYR and C is the concentration at a particular time of irradiation. kapp is the apparent rate constant of the reaction, and t is the irradiation time.
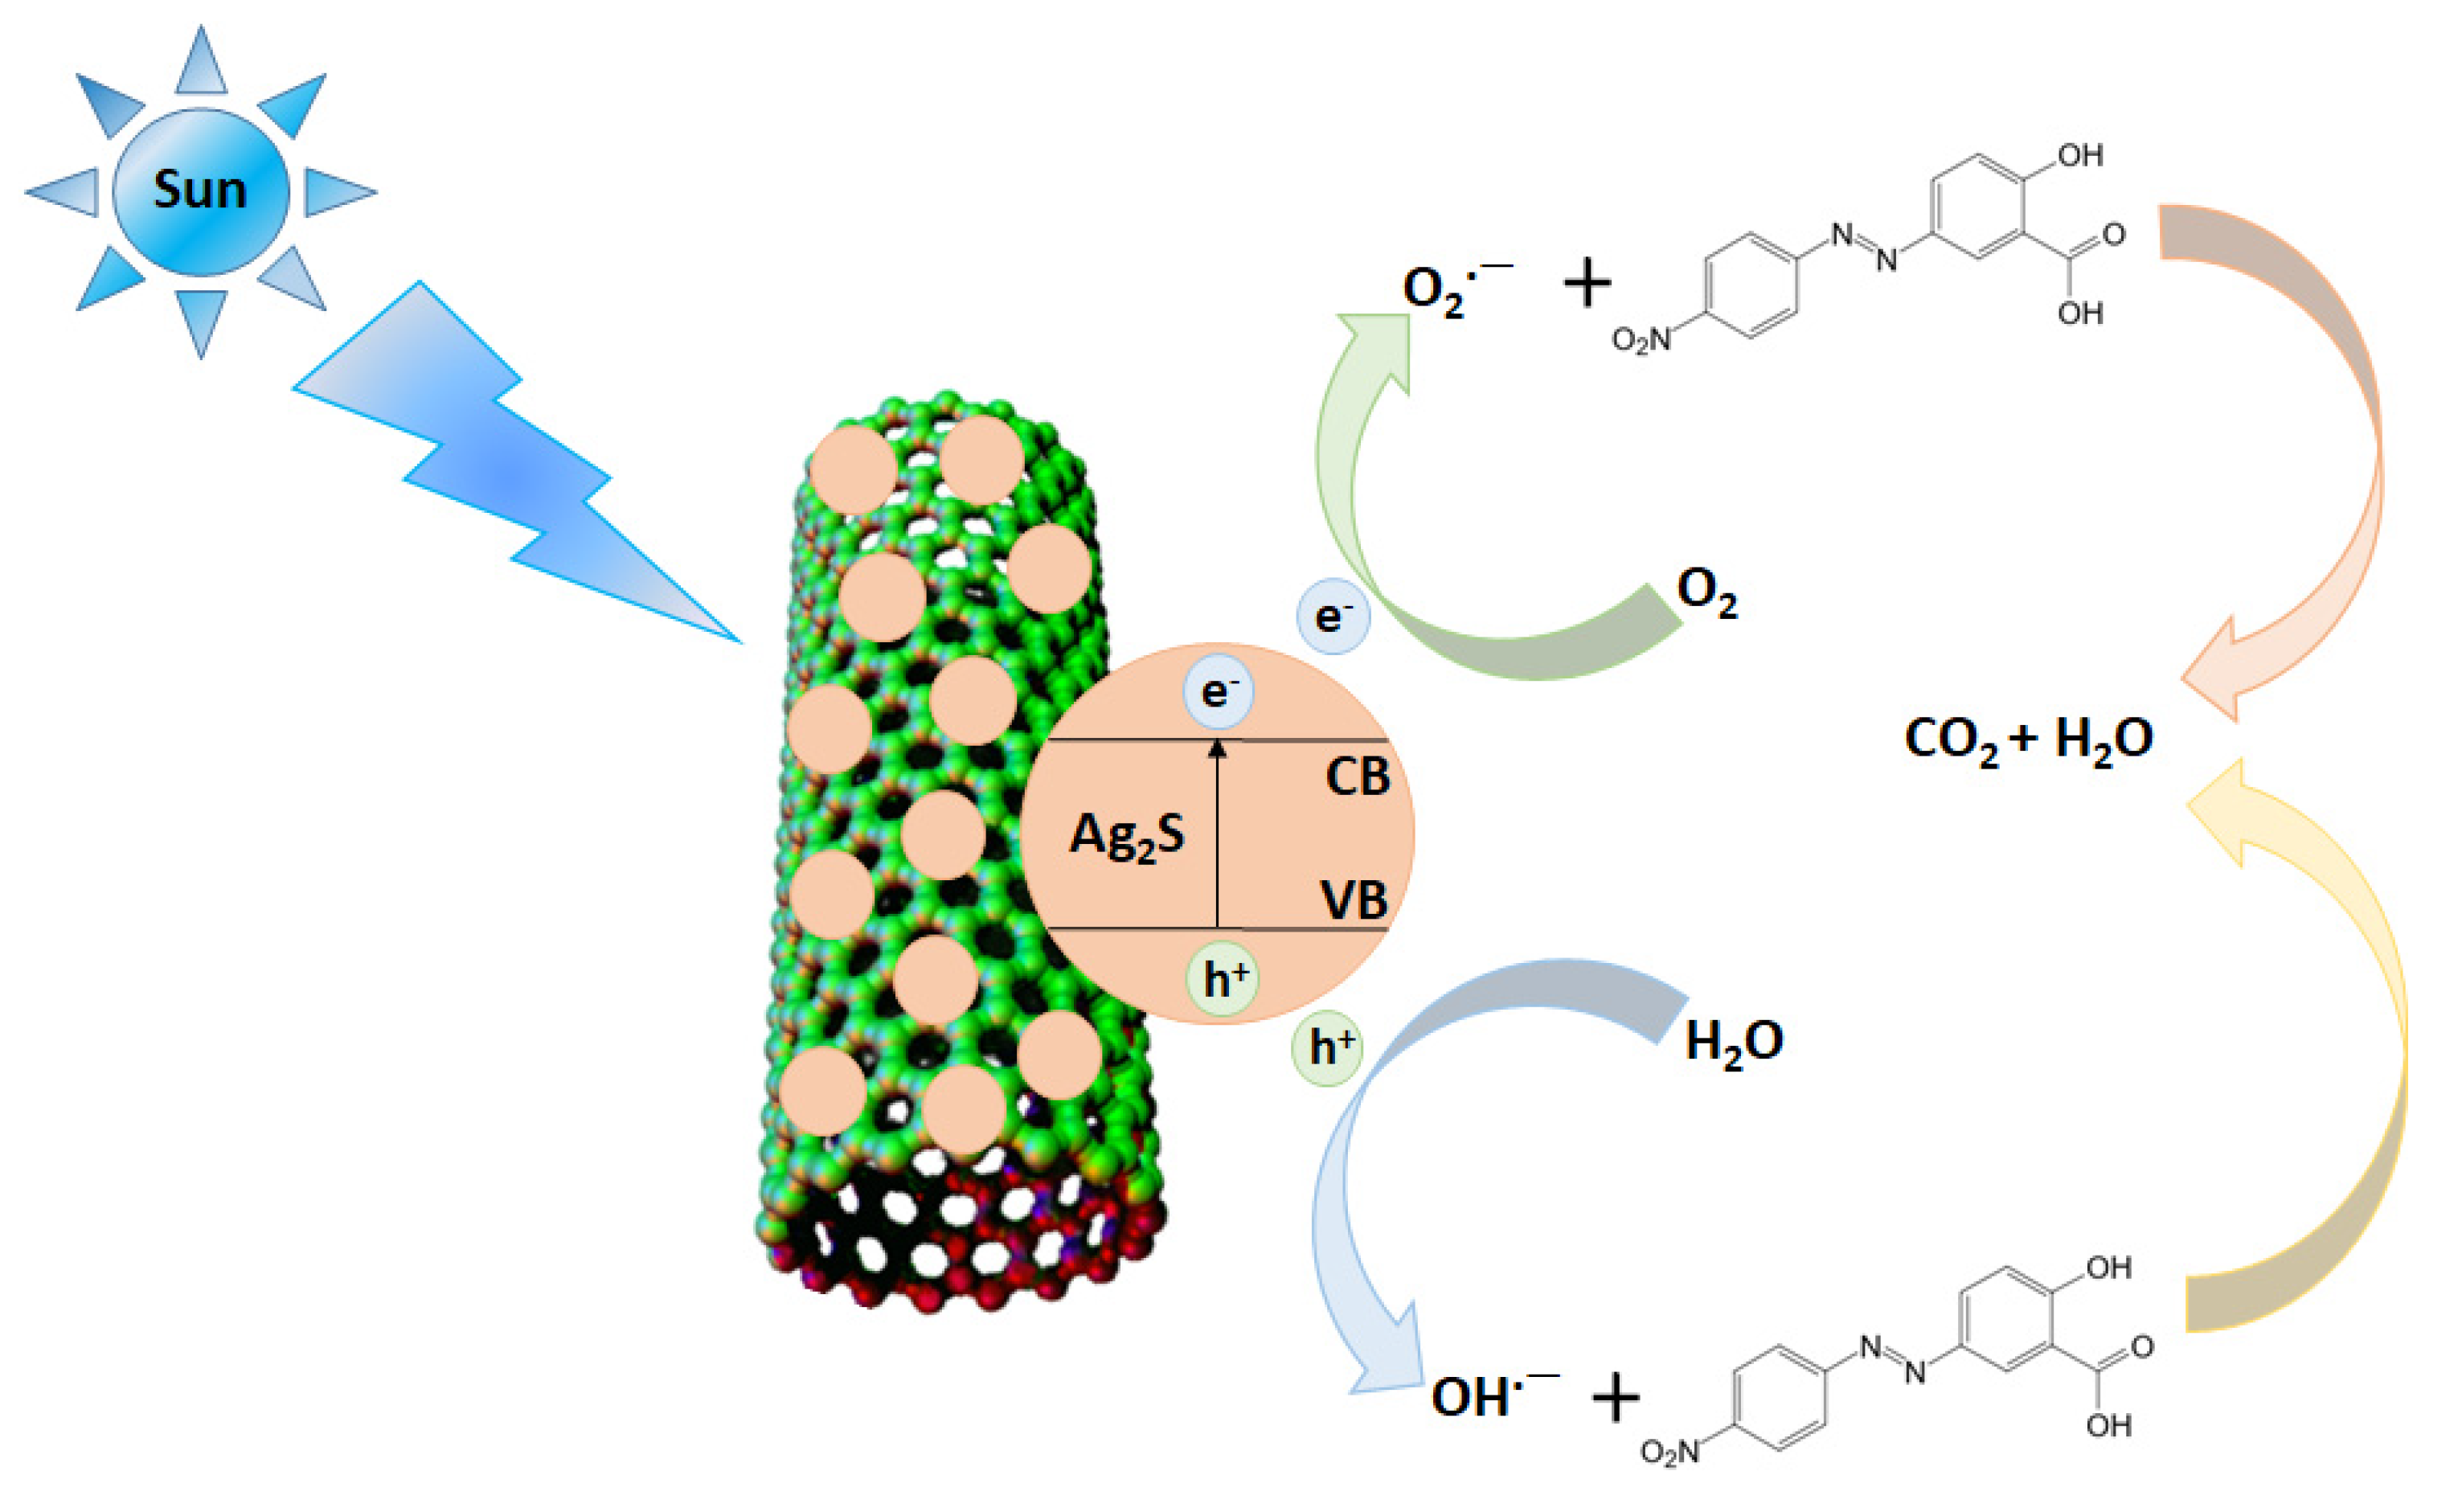
The L-H plots perceived for the degradation of AYR were linear, as depicted in Figure 14. The linearity of the L-H plots reveals that the degradation of AYR ensue with pseudo-first-order kinetics. The apparent rate constants determined by the L-H plots for CNTs, Ag2S, and CNTs-Ag2S were 0.0108, 0.0035, and 0.0378 min−1, respectively. The value determined for CNTs-Ag2S was about four-fold higher than CNTs and eleven-fold greater than Ag2S. Therefore, the conjugation of CNTs and Ag2S has magnificently improved the photocatalytic activity in CNTs-Ag2S. Due to the conjugated structure, containing aromatic, carbonyl, and azo groups, the AYR solution possessed an intense color in water. Accordingly, AYR degradation could happen by breaking the conjugated system in the presence of CNTs-Ag2S under sunlight irradiation. With this assumption, the possible mechanism for the rapid degradation of AYR by CNTs-Ag2S could be explained as follows (Figure 15).
| CNTs-Ag2S + hν → e− + h+ |
| h+ + H2O → HO− + H+ |
| e− + O2 → O2•− |
| O2•− + H+ →HO2• |
| HO2• + H2O → H2O2 + HO• |
| AYR + HO• → H2O + CO2 + nontoxic products |
Further, to find the stability of CNTs-Ag2S, it was recovered by centrifugation after photocatalysis. It was washed with DI water, dried and used in further two cycles of the photocatalysis. The reused CNTs-Ag2S was able to degrade AYR completely in further two cycles without any significant reduction in activity (Figure S6). The XRD of CNTs-Ag2S recorded before and after using in the three degradation cycles of AYR could not show any structural modification or rapture (Figure S7). Consequently, CNTs-Ag2S is table and suitable for reuse.
The CNT/Ag2S nanocomposite prepared by Di et al. and applied it to the degradation of rhodamine B revealed its higher activity than bare Ag2S nanoparticles under illumination to visible and near-infrared (NIR) light [57]. In addition, the recycled CNT/Ag2S nanocomposite could not lost the activity [57]. The Ag2S-CNT nanocomposite, reported by Meng et al. [66], efficiently degraded texbrite BA-L in presence of visible light. In this study, the Ag2S-CNT nanocomposite was for four degradation cycles of texbrite BA-L [66]. Further, the photocatalytic activity of CNTs-Ag2S in the degradation of AYR was compared with different photocatalysts and presented in Table 3 [24,25,46,67,68,69].
3. Experimental
3.1. Materials
The chemicals and CNTs were purchased from Millipore Sigma and used as received. The aqueous solutions were prepared using ultrapure water obtained by the Milli-Q Plus system (Millipore; Burlington, MA, USA).
3.2. Preparation of CNTs-Ag2S
The hydrophobic pristine CNTs were modified to hydrophilic through the oxidization by refluxing in a mixture of 1:3 (v/v) concentrated HNO3 and H2SO4 at 70 °C for 24 h. The resulting oxidized CNTs were collected through centrifugation and purified by washing them with DI water [70,71]. The resulting oxidized CNTs were dried under a vacuum and used to deposit Ag2S nanoparticles. About 40 mg of oxidized CNTs (CNTs-COOH) were dispersed in 40 mL of DI water using sonicator, and a solution of 0.04 mol/L of AgNO3 in 40 mL of DI water was added. The mixture was allowed to stir in room temperature for 30 min, and a freshly prepared 40 mL aqueous solution of 0.02 mol/L sodium sulfide was added slowly. This suspension was stirred for 10 min and transferred to an autoclave. The autoclave was heated at 180 °C for 6 h to yield CNTs-Ag2S. Thus, the formed CNTs-Ag2S was collected by centrifugation and purified with washing with DI water.
3.3. Preparation of Ag2S
For control experiments, Ag2S nanoparticles were prepared using the procedures used for CNTs-Ag2S without CNTs.
3.4. Adsorption Experiments
The stock solution of Cd(II), with a concentration of 1 g/L, was prepared in DI water using cadmium chloride and was diluted to the desired concentrations. The kinetic Cd(II) adsorption experiments were conducted to find the contact time needed to attain equilibrium. In the typical experiment, 100 mg of CNTs-Ag2S was dispersed into 500 mL of a Cd(II) solution with a concentration of 0.5 mg/L and stirred at room temperature. After the required contact time, an adequate sample was collected, and the dispersed CNTs-Ag2S was separated by centrifugation. The concentration of residual Cd(II) in the collected samples was estimated by atomic absorption spectrometer. The amount of Cd(II), adsorbed by CNTs-Ag2S was monitored as a function of time for 120 min. The quantity of Cd(II) adsorbed was calculated using Equation (8).
where qt is the amount of adsorbed Cd(II) (mg/g) at time t; C0 is the initial concentration of the Cd(II) (mg/L), and Ct is the concentration of the Cd(II) (mg/L) at time t; V is the volume of the solution (L), and M is the amount of adsorbent (g).
Further, the efficiency of CNTs-Ag2S in Cd(II) adsorption was estimated using Equation (9).
For adsorption isotherm experiments, 10 mg of CNTs-Ag2S was mixed with 50 mL of the Cd(II) solution and stirred at room temperature for 24 h to reach equilibrium in the concentration between 50 and 140 mg/L. After separating the dispersed CNTs-Ag2S, the concentration of Cd(II) in the solution was measured using an atomic absorption spectrometer. The amount of Cd(II) adsorbed at equilibrium, qe (mg/g), was determined by Equation (10):
where qe is the amount of Cd(II) adsorbed (mg/g) at equilibrium.
3.5. Photocatalytic Activity
To evaluate the photocatalytic activity, 10 mg of CNTs-Ag2S was added to the 100 mL aqueous solution of AYR with a concentration of 10 mg/L. It was allowed to stir in the dark for 30 min to reach adsorption/desorption equilibrium of the AYR molecules over the surface of CNTs-Ag2S. This suspension was transferred to a photocatalytic reactor having a water jacket with a water circulation system to maintain a constant temperature, and the suspension was exposed to sunlight. At the required time, 5 mL of the reaction mixture was withdrawn, and the suspended CNTs-Ag2S was separated using centrifugation. The concentration of AYR after photocatalysis was assessed with UV-vis spectrophotometer by recording the absorbance at 373 nm. The normalized concentration of AYR after photocatalysis was calculated as C/C0, where C0 is the initial concentration of AYR and C is its concentration after photocatalysis. All photocatalytic experiments were conducted in the month of June, between 1 pm and 4 pm. The intensity of sunlight measured during photocatalysis was 800–900 W/m2.
3.6. Characterization
The UV-vis absorption spectra were recorded using a Jasco V-770 UV-vis-NIR spectrophotometer (Easton, MD, USA), and ATR-FTIR spectra were collected with a Smiths ChemID diamond attenuated total reflection (DATR) spectrometer (Smiths Detection, Inc., London, United Kingdom). The XRD was obtained by a Scintag X-ray diffractometer (Cupertino, CA, USA), model PAD X, equipped with a Cu-Kα photon source (45 kV, 40 mA), at a scanning rate of 3°/min. The thermogravimetry differential thermal analysis (TG/DTA) was performed using a Perkin Elmer Diamond TG/DTA instrument (Waltham, MA, USA) at a 10 °C/min heating rate. Transmission electron microscopy (TEM) images and X-ray energy-dispersive spectroscopy (EDS) were perceived by a Hitachi H-8100 microscope (Tokyo, Japan). The X-ray photoelectron spectra (XPS) were acquired by a Perkin Elmer PHI 5600 ci X-ray photoelectron spectrometer (Waltham, MA, USA). The Cd(II) concentration was estimated using a Varian SpectrAA 220FS atomic absorption spectrometer (Lake Forest, CA, USA).
4. Conclusions
The facile hydrothermal process produced an efficient adsorbent and photocatalyst, CNTs-Ag2S. The ATR-FTIR, XRD, EDS, and XPS confirmed the formation of CNTs-Ag2S in the right structure and phase. The TEM explored the deposition of Ag2S nanoparticles over the surface of CNTs. The TG/DTA revealed the high thermal stability of CNTs-Ag2S. The dual-tasking CNTs-Ag2S could accomplish the complete Cd(II) adsorption and the degradation of AYR in water. The agreement of second-order kinetics for Cd(II) adsorption reveals that chemisorption is the rate-determining step of the adsorption process. The Weber−Morris intraparticle pore diffusion model represented that intraparticle diffusion could not be the sole rate-limiting step in Cd(II) adsorption, instead, it occurred through multiple phases. The validation of the Langmuir model illustrates that the Cd(II) adsorption takes place with monolayer molecular covering and chemisorption. Not limiting to Cd(II) adsorption, the CNTs-Ag2S could also be an excellent adsorbent for adsorption of other toxic heavy metals. Apart from excellent adsorbent, CNTs-Ag2S could also be an exceptional photocatalyst as reveled by degradation of AYR. The elevated degradation of AYR demonstrated that CNTs-Ag2S is the strong sunlight-active photocatalyst that could be applied in the degradation of other toxic dyes. The linearity of the L-H plots depicted that the degradation of AYR occurred through pseudo-first-order kinetics. The CNTs-Ag2S could be easily recovered and used for several times without losing its activity. Overall, CNTs-Ag2S is a robust adsorbent as well as photocatalyst that could be employed in the adsorption of different heavy metals and the photodegradation of alternative dyes.
Supplementary Materials
The following supporting information can be downloaded at: https://www.mdpi.com/article/10.3390/catal13030476/s1. Table S1: Parameters calculated for Cd(II) adsorption over CNTs-Ag2S from the intra-particle diffusion plot; Figure S1: EDS spectrum of CNTs-Ag2S; Figure S2: Plot perceived qt as a function of time for Cd(II) adsorption over CNTs- Ag2S; Figure S3: Intraparticle diffusion model for Cd(II) adsorption over CNTs- Ag2S; Figure S4: Freundlich isotherm plot for Cd(II) adsorption over CNTs- Ag2S; Figure S5: Temkin isotherm plot for Cd(II) adsorption over CNTs- Ag2S; Figure S6: Degradation of alizarin yellow R in presence of CNTs- Ag2S for successive three cycles under illumination to sunlight; Figure S7: XRD of CNTs- Ag2S (a) before and (b) after using in successive three cycles of photodegradation of alizarin yellow R under illumination to sunlight.
Author Contributions
G.M.N.: data curation, writing original draft, review, and editing funding acquisition. S.F.A.: investigation, data curation. E.A.J.: investigation, data curation. R.L.R.: writing, review, and editing. All authors have read and agreed to the published version of the manuscript.
Funding
The author (GMN) acknowledges the support of the National Academy of Sciences of the U.S.-Egypt Science and Technology Joint Fund and the Welch Foundation, Texas, United States, for departmental grant L-0002-20181021.
Institutional Review Board Statement
Not applicable.
Informed Consent Statement
Not applicable.
Data Availability Statement
Not applicable.
Conflicts of Interest
The authors declare no conflict of interest.
References
- Xie, K.; Fang, J.; Li, L.; Deng, J.; Chen, F. Progress of graphite carbon nitride with different dimensions in the photocatalytic degradation of dyes: A review. J. Alloy. Compd. 2022, 901, 163589. [Google Scholar] [CrossRef]
- Zhan, S.; Wu, Y.; Wang, L.; Zhan, X.; Zhou, P. A mini-review on functional nucleic acids-based heavy metal ion detection. Biosens. Bioelectron. 2016, 86, 353–368. [Google Scholar] [CrossRef] [PubMed]
- Pang, Y.; Zhao, C.; Li, Y.; Li, Q.; Bayongzhong, X.; Peng, D.; Huang, T. Cadmium adsorption performance and mechanism from aqueous solution using red mud modified with amorphous MnO2. Sci. Rep. 2022, 12, 1–18. [Google Scholar] [CrossRef] [PubMed]
- Wang, J.; Chen, C. Biosorbents for heavy metals removal and their future. Biotechnol. Adv. 2009, 27, 195–226. [Google Scholar] [CrossRef]
- Bailey, S.E.; Olin, T.J.; Bricka, R.; Adrian, D. A review of potentially low-cost sorbents for heavy metals. Water Res. 1999, 33, 2469–2479. [Google Scholar] [CrossRef]
- Drush, G. Increase of cadmium body burden for this century. Sci. Total Environ. 1993, 67, 75–89. [Google Scholar]
- Elkhatib, E.; Mahdy, A.; Sherif, F.; Elshemy, W. Competitive adsorption of cadmium (II) from aqueous solutions onto nano-particles of water treatment residual. J. Nanomater. 2016, 2016, 8496798. [Google Scholar] [CrossRef] [Green Version]
- Lei, T.; Li, S.-J.; Jiang, F.; Ren, Z.-X.; Wang, L.-L.; Yang, X.-J.; Tang, L.-H.; Wang, S.-X. Adsorption of Cadmium Ions from an Aqueous Solution on a Highly Stable Dopamine-Modified Magnetic Nano-Adsorbent. Nanoscale Res. Lett. 2019, 14, 1–17. [Google Scholar] [CrossRef] [Green Version]
- Yusuff, A.S.; Popoola, L.T.; Babatunde, E.O. Adsorption of cadmium ion from aqueous solutions by copper-based metal organic framework: Equilibrium modeling and kinetic studies. Appl. Water Sci. 2019, 9, 106. [Google Scholar] [CrossRef] [Green Version]
- Masoudi, R.; Moghimi, H.; Azin, E.; Taheri, R. Adsorption of cadmium from aqueous solutions by novel Fe3O4- newly isolated Actinomucor sp. bionanoadsorbent: Functional group study. Artif. Cells Nanomed. Biotechnol. 2018, 46, S1092–S1101. [Google Scholar] [CrossRef] [Green Version]
- Tran, H.N.; You, S.-J.; Chao, H.-P. Effect of pyrolysis temperatures and times on the adsorption of cadmium onto orange peel derived biochar. Waste Manag. Res. J. Sustain. Circ. Econ. 2015, 34, 129–138. [Google Scholar] [CrossRef]
- Asuquo, E.; Martin, A.; Nzerem, P.; Siperstein, F.; Fan, X. Cd(II) adsorption and Pb(II) ions from aqueous solutions using mesoporous activated carbon adsorbent: Equilibrium, kinetics and characterization studies. J. Environ. Chem. Eng. 2017, 5, 679–698. [Google Scholar] [CrossRef] [Green Version]
- Bulut, V.; Demirci, H.; Ozdes, D.; Gundogdu, A.; Bekircan, O.; Soylak, M.; Duran, C. A novel carrier element-free coprecipi-tation method for separation/preconcentration of lead and cadmium ions from environmental matrices. Environ. Prog. Sustain. Energy 2016, 35, 1709–1715. [Google Scholar] [CrossRef]
- Wong, C.-W.; Barford, J.P.; Chen, G.; McKay, G. Kinetics and equilibrium studies for the removal of cadmium ions by ion exchange resin. J. Environ. Chem. Eng. 2014, 2, 698–707. [Google Scholar] [CrossRef]
- Kumar, P.R.; Swathanthr, P.A.; Rao, V.B.; Rao, S.R.M. Adsorption of Cadmium and Zinc Ions from Aqueous Solution Using Low Cost Adsorbents. J. Appl. Sci. 2014, 14, 1372–1378. [Google Scholar] [CrossRef] [Green Version]
- Li, Y.; Yang, L.; Xu, Z.; Sun, Q. Separation and recovery of heavy metals from waste water using synergistic solvent extraction. In Proceedings of the IOP Conference Series: Materials Science and Engineering, Sanya, China, 19–21 November 2016; Volume 167, p. 12005. [Google Scholar] [CrossRef] [Green Version]
- Meng, Q.; Nan, J.; Wang, Z.; Ji, X.; Wu, F.; Liu, B.; Xiao, Q. Study on the efficiency of ultrafiltration technology in dealing with sudden cadmium pollution in surface water and ultrafiltration membrane fouling. Environ. Sci. Pollut. Res. 2019, 26, 16641–16651. [Google Scholar] [CrossRef]
- Bhadrinarayana, N.S.; Basha, C.A.; Anantharaman, N. Electrochemical Oxidation of Cyanide and Simultaneous Cathodic Removal of Cadmium Present in the Plating Rinse Water. Ind. Eng. Chem. Res. 2007, 46, 6417–6424. [Google Scholar] [CrossRef]
- Kim, H.S.; Seo, B.-H.; Kuppusamy, S.; Lee, Y.B.; Lee, J.-H.; Yang, J.-E.; Owens, G.; Kim, K.-R. A DOC coagulant, gypsum treatment can simultaneously reduce As, Cd and Pb uptake by medicinal plants grown in contaminated soil. Ecotoxicol. Environ. Saf. 2018, 148, 615–619. [Google Scholar] [CrossRef]
- Lan, Z.; Lin, Y.; Yang, C. Lanthanum-iron incorporated chitosan beads for adsorption of phosphate and cadmium from aqueous solutions. Chem. Eng. J. 2022, 448. [Google Scholar] [CrossRef]
- Foroutan, R.; Peighambardoust, S.; Mohammadi, R.; Peighambardoust, S.; Ramavandi, B. Cadmium ion removal from aqueous media using banana peel biochar/ Fe3O4/ZIF-67. Envir. Res. 2022, 211, 113020. [Google Scholar] [CrossRef]
- Dou, D.; Wei, D.; Guan, X.; Liang, Z.; Lan, L.; Lan, X.; Liu, P.; Mo, H.; Lan, P. Adsorption of copper (II) and cadmium (II) ions by in situ doped nano-calcium carbonate high-intensity chitin hydrogels. J. Hazard. Mater. 2021, 423, 127137. [Google Scholar] [CrossRef] [PubMed]
- Alsantali, R.I.; Alam Raja, Q.; Alzahrani, A.Y.; Sadiq, A.; Naeem, N.; Mughal, E.U.; Al-Rooqi, M.M.; El Guesmi, N.; Moussa, Z.; Ahmed, S.A. Miscellaneous azo dyes: A comprehensive review on recent advancements in biological and industrial applications. Dye. Pigment. 2022, 199, 110050. [Google Scholar] [CrossRef]
- Narayanasamy, L.; Murugesan, T. Degradation of Alizarin Yellow R using UV/H2O2 Advanced Oxidation Process. Environ. Prog. Sustain. Energy 2014, 33, 482–489. [Google Scholar] [CrossRef]
- Ahmed, A.; Usman, M.; Yu, B.; Ding, X.; Peng, Q.; Shen, Y.; Cong, H. Efficient photocatalytic degradation of toxic Alizarin yellow R dye from industrial wastewater using biosynthesized Fe nanoparticle and study of factors affecting the degradation rate. J. Photochem. Photobiol. B Biol. 2020, 202, 111682. [Google Scholar] [CrossRef] [PubMed]
- Suteu, D.; Zaharia, C.; Muresan, A.; Muresan, R.; Popescu, A. Textile wastewater treatment by homogenous oxidation with hydrogen peroxide. Environ. Eng. Manage. J. 2009, 8, 1359–1369. [Google Scholar]
- Jiao, X.; Yu, H.; Kong, Q.; Luo, Y.; Chen, Q.; Qu, J. Theoretical mechanistic studies on the degradation of alizarin yellow R initiated by hydroxyl radical. J. Phys. Org. Chem. 2014, 27, 519–526. [Google Scholar] [CrossRef]
- Lellis, B.; Fávaro-Polonio, C.Z.; Pamphile, J.A.; Polonio, J.C. Effects of textile dyes on health and the environment and bioremediation potential of living organisms. Biotechnol. Res. Innov. 2019, 3, 275–290. [Google Scholar] [CrossRef]
- Al Nafiey, A.; Addad, A.; Sieber, B.; Chastanet, G.; Barras, A.; Szunerits, S.; Boukherroub, R. Reduced graphene oxide deco-rated with Co3O4 nanoparticles (rGO-Co3O4) nanocomposite: A reusable catalyst for highly efficient reduction of 4-nitrophenol, and Cr(VI) and dye removal from aqueous solutions. Chem. Eng. J. 2017, 322, 375–384. [Google Scholar] [CrossRef]
- Zhu, C.; Mahmood, Z.; Siddique, M.S.; Wang, H.; Anqi, H.; Sillanpää, M. Structure-Based Long-Term Biodegradation of the Azo Dye: Insights from the Bacterial Community Succession and Efficiency Comparison. Water 2021, 13, 3017. [Google Scholar] [CrossRef]
- Zhang, Y.; He, P.; Jia, L.; Li, C.; Liu, H.; Wang, S.; Zhou, S., F. Dong Ti/PbO2-Sm2O3 composite based electrode for highly effi-cient electrocatalytic degradation of alizarin yellow R. J. Colloid Interface Sci. 2019, 533, 750–761. [Google Scholar] [CrossRef]
- Mcyotto, F.; Wei, Q.; Macharia, D.K.; Huang, M.; Shen, C.; Chow, C.W. Effect of dye structure on color removal efficiency by coagulation. Chem. Eng. J. 2020, 405, 126674. [Google Scholar] [CrossRef]
- Lee, J.-W.; Choi, S.-P.; Thiruvenkatachari, R.; Shim, W.-G.; Moon, H. Evaluation of the performance of adsorption and coagulation processes for the maximum removal of reactive dyes. Dye. Pigment. 2006, 69, 196–203. [Google Scholar] [CrossRef]
- Unsal, Y.E.; Tuzen, M.; Soylak, M. Separation and Preconcentration of Sudan Blue II Using Membrane Filtration and UV-Visible Spectrophotometric Determination in River Water and Industrial Wastewater Samples. J. AOAC Int. 2015, 98, 213–217. [Google Scholar] [CrossRef]
- Kadirvelu, K.; Kavipriya, M.; Karthika, C.; Radhika, M.; Vennilamani, N.; Pattabhi, S. Utilization of various agricultural wastes for activated carbon preparation and application for the removal of dyes and metal ions from aqueous solutions. Bioresour. Technol. 2002, 87, 129–132. [Google Scholar] [CrossRef]
- Rajkumar, D.; Song, B.J.; Kim, J.G. Electrochemical degradation of Reactive Blue 19 in chloride medium for the treatment of textile dyeing wastewater with identification of intermediate compounds. Dye. Pigment. 2007, 72, 1–7. [Google Scholar] [CrossRef]
- Mahmoodi, N. Photocatalytic ozonation of dyes using multiwalled carbon nanotube. J. Mol. Catal. A 2013, 366, 254–260. [Google Scholar] [CrossRef]
- Neelgund, G.; Bliznyuk, V.; Oki, A. Photocatalytic activity and NIR laser response of polyanilineconjugated graphene nano-composite prepared by a novel acid-less method. Appl. Catal. B 2016, 187, 357–366. [Google Scholar] [CrossRef] [Green Version]
- Neelgund, G.M.; Oki, A. Folic acid and CuS conjugated graphene oxide: An efficient photocatalyst for explicit degradation of toxic dyes. Appl. Surf. Sci. 2021, 566, 150648. [Google Scholar] [CrossRef]
- Singh, S.; Rao, C.; Nandi, C.K.; Mukherjee, T.K. Quantum Dot-Embedded Hybrid Photocatalytic Nanoreactors for Visible Light Photocatalysis and Dye Degradation. ACS Appl. Nano Mater. 2022, 5, 7427–7439. [Google Scholar] [CrossRef]
- Chouke, P.; Dadure, K.; Potbhare, A.; Bhusari, G.; Mondal, A.; Chaudhary, K.; Singh, V.; Desimone, M.; Chaudhary, R.; Masram, D. Biosynthesized δ-Bi2O3 nanoparticles from crinum viviparum flower extract for photocatalytic dye degradation and molecular docking. ACS Omega 2022, 7, 20983–20993. [Google Scholar] [CrossRef]
- Neelgund, G.M.; Oki, A. Photocatalytic activity of hydroxyapatite deposited graphene nanosheets under illumination to sunlight. Mater. Res. Bull. 2021, 146, 111593. [Google Scholar] [CrossRef]
- Hamd, A.; Shaban, M.; AlMohamadi, H.; Dryaz, A.R.; Ahmed, S.A.; Abu Al-Ola, K.A.; El-Mageed, H.R.A.; Soliman, N.K. Novel Wastewater Treatment by Using Newly Prepared Green Seaweed–Zeolite Nanocomposite. ACS Omega 2022, 7, 11044–11056. [Google Scholar] [CrossRef] [PubMed]
- Neelgund, G.M.; Oki, A. ZnO conjugated graphene: An efficient sunlight driven photocatalyst for degradation of organic dyes. Mater. Res. Bull. 2020, 129, 110911. [Google Scholar] [CrossRef]
- Neelgund, G.; Oki, A. Photothermal effect: An important aspect for the enhancement of photocatalytic activity under illumi-nation by NIR radiation. Mater. Chem. Front. 2018, 2, 64–75. [Google Scholar] [CrossRef]
- Abass, A.K.; Raoof, S.D. Photocatalytic Removal of Alizarin Yellow R from Water using Modified Zinc Oxide Catalyst. Asian J. Chem. 2016, 28, 312–316. [Google Scholar] [CrossRef]
- Ramamoorthy, S.; Das, S.; Balan, R.; Lekshmi, I. TiO2-ZrO2 nanocomposite with tetragonal zirconia phase and photocatalytic degradation of Alizarin Yellow GG azo dye under natural sunlight. Mater. Today: Proc. 2021, 47, 4641–4646. [Google Scholar] [CrossRef]
- Mawhinney, D.B.; Naumenko, V.; Kuznetsova, A.; Yates, J.J.T.; Liu, J.; Smalley, R.E. Infrared Spectral Evidence for the Etching of Carbon Nanotubes: Ozone Oxidation at 298 K. J. Am. Chem. Soc. 2000, 122, 2383–2384. [Google Scholar] [CrossRef]
- Chingombe, P.; Saha, B.; Wakeman, R. Surface modification and characterization of a coal-based activated carbon. Carbon 2005, 43, 3132–3143. [Google Scholar] [CrossRef]
- Neelgund, G.M.; Oki, A.R. Influence of carbon nanotubes and graphene nanosheets on photothermal effect of hydroxyapatite. J. Colloid Interface Sci. 2016, 484, 135–145. [Google Scholar] [CrossRef] [Green Version]
- Zamiri, R.; Ahangar, H.A.; Zakaria, A.; Zamiri, G.; Shabani, M.; Singh, B.K.; Ferreira, J.M.F. The structural and optical constants of Ag2S semiconductor nanostructure in the Far-Infrared. Chem. Central J. 2015, 9, 1–6. [Google Scholar] [CrossRef] [Green Version]
- Neelgund, G.M.; Oki, A. Photocatalytic activity of CdS and Ag2S quantum dots deposited on poly(amidoamine) functionalized carbon nanotubes. Appl. Catal. B: Environ. 2011, 110, 99–107. [Google Scholar] [CrossRef] [Green Version]
- Hota, G.; Jain, S.; Khila, K. Synthesis of CdS-Ag2S core-shell/composite nanoparticles using AOT/n-heptane/water micro-emulsions. Colloids Surf. A 2004, 232, 119–127. [Google Scholar] [CrossRef]
- Wu, H.; Cao, W.; Chen, Q.; Liu, M.; Qian, S.; Jia, N.; Yang, H.; Yang, S. Metal sulfide coated multiwalled carbon nanotubes synthesized by an in situ method and their optical limiting properties. Nanotechnology 2009, 20, 195604–195613. [Google Scholar] [CrossRef]
- Kim, B.-J.; Kim, J.-P.; Park, J.-S. Effects of Al interlayer coating and thermal treatment on electron emission characteristics of carbon nanotubes deposited by electrophoretic method. Nanoscale Res. Lett. 2014, 9, 236. [Google Scholar] [CrossRef] [Green Version]
- Lin, Y.; Wu, S.; Yang, C.; Chen, M.; Li, X. Preparation of size-controlled silver phosphate catalysts and their enhanced pho-tocatalysis performance via synergetic effect with MWCNTs and PANI. Appl. Catal. B 2019, 245, 71–86. [Google Scholar] [CrossRef]
- Di, L.; Xian, T.; Sun, X.; Li, H.; Zhou, Y.; Ma, J.; Yang, H. Facile Preparation of CNT/Ag2S Nanocomposites with Improved Visible and NIR Light Photocatalytic Degradation Activity and Their Catalytic Mechanism. Micromachines 2019, 10, 503. [Google Scholar] [CrossRef] [Green Version]
- Zhang, Y.; Xia, J.; Li, C.; Zhou, G.; Yang, W.; Wang, D.; Zheng, H.; Du, Y.; Li, X.; Li, Q. Near-infrared-emitting colloidal Ag2S quantum dots excited by an 808 nm diode laser. J. Mater. Sci. 2017, 52, 9424–9429. [Google Scholar] [CrossRef]
- Hameed, B.; Salman, J.; Ahmad, A. Adsorption isotherm and kinetic modeling of 2,4-D pesticide on activated carbon derived from date stones. J. Hazard. Mater. 2009, 163, 121–126. [Google Scholar] [CrossRef]
- Zeng, H.; Zhai, L.; Qiao, T.; Yu, Y.; Zhang, J.; Li, D. Efficient removal of As(V) from aqueous media by magnetic nanoparticles prepared with Iron-containing water treatment residuals. Sci. Rep. 2020, 10, 1–12. [Google Scholar] [CrossRef]
- Langmuir, I. The constitution and fundamental properties of solids and liquids. Part I. Solids. J. Am. Chem. Soc. 1916, 38, 2221–2295. [Google Scholar] [CrossRef] [Green Version]
- Neelgund, G.M.; Aguilar, S.F.; Kurkuri, M.D.; Rodrigues, D.F.; Ray, R.L. Elevated Adsorption of Lead and Arsenic over Silver Nanoparticles Deposited on Poly(amidoamine) Grafted Carbon Nanotubes. Nanomaterials 2022, 12, 3852. [Google Scholar] [CrossRef] [PubMed]
- Freundlich, H. Over the adsorption in solution. J. Phys. Chem. 1906, 57, 385–471. [Google Scholar]
- Temkin, M.; Pyzhev, V. Recent modifications to Langmuir isotherms. Acta Physiochim. USSR 1940, 12, 217–222. [Google Scholar]
- Tabuchi, A.; Ogata, F.; Uematsu, Y.; Toda, M.; Otani, M.; Saenjum, C.; Nakamura, T.; Kawasaki, N. Granulation of nick-el-aluminum-zirconium complex hydroxide using colloidal silica for adsorption of chromium(VI) ions from the liquid phase. Molecules 2022, 27, 2392. [Google Scholar] [CrossRef]
- Meng, Z.; Sarkar, S.; Zhu, L.; Ullah, K.; Ye, S.; Oh, W. Facile preparation of Ag2S-CNT nanocomposites with enhanced pho-to-catalytic activity. J. Korean Ceram. Soc. 2014, 51, 1–6. [Google Scholar] [CrossRef] [Green Version]
- Ahmed, K.A.M.; Peng, H.; Wu, K.; Huang, K. Hydrothermal preparation of nanostructured manganese oxides (MnOx) and their electrochemical and photocatalytic properties. Chem. Eng. J. 2011, 172, 531–539. [Google Scholar] [CrossRef]
- Iqbal, S.; Iqbal, M.; Sibtain, A.; Iqbal, A.; Farooqi, Z.; Ahmad, S.; Mustafa, K.; Musaddiq, S. Solar driven photocatalytic deg-radation of organic pollutants via Bi2O3@reduced graphene oxide nanocomposite. Desalination Water Treat. 2021, 216, 140–150. [Google Scholar] [CrossRef]
- Mashentseva, A.A.; Aimanova, N.A.; Parmanbek, N.; Temirgaziyev, B.S.; Barsbay, M.; Zdorovets, M.V. Serratula coronata L. Mediated Synthesis of ZnO Nanoparticles and Their Application for the Removal of Alizarin Yellow R by Photocatalytic Degradation and Adsorption. Nanomaterials 2022, 12, 3293. [Google Scholar] [CrossRef]
- Neelgund, G.M.; Oki, A. Deposition of silver nanoparticles on dendrimer functionalized multiwalled carbon nanotubes: Synthesis, characterization and antimicrobial activity. J. Nanosci. Nanotechnol. 2011, 11, 3621–3629. [Google Scholar] [CrossRef] [Green Version]
- Neelgund, G.M.; Oki, A. Pd nanoparticles deposited on poly(lactic acid) grafted carbon nanotubes: Synthesis, characterization and application in Heck C–C coupling reaction. Appl. Catal. A Gen. 2011, 399, 154–160. [Google Scholar] [CrossRef] [Green Version]
Figure 1.
ATR-FTIR spectra of (a) CNTs-COOH, (b) Ag2S, and (c) CNTs-Ag2S.

Figure 2.
XRD of CNTs-Ag2S.

Figure 3.
(a–f) TEM images of CNTs-Ag2S.

Figure 4.
TG/DTA of CNTs-Ag2S.

Figure 5.
UV-vis absorption spectrum of CNTs-Ag2S.

Figure 6.
(a) XPS survey spectrum of CNTs-Ag2S. (b) High-resolution spectrum of C1s. (c) High-resolution spectrum of O1s. (d) High-resolution spectrum of Ag3d. (e) High-resolution spectrum of S2p.
Figure 6.
(a) XPS survey spectrum of CNTs-Ag2S. (b) High-resolution spectrum of C1s. (c) High-resolution spectrum of O1s. (d) High-resolution spectrum of Ag3d. (e) High-resolution spectrum of S2p.


Figure 7.
Adsorption kinetics of Cd(II) over CNTs, Ag2S, and CNTs-Ag2S.

Figure 8.
Pseudo-first-order kinetics for Cd(II) adsorption over CNTs, Ag2S, and CNTs-Ag2S.

Figure 9.
Pseudo-second-order kinetics for Cd(II) adsorption over CNTs, Ag2S, and CNTs-Ag2S.

Figure 10.
Weber-Morris intraparticle diffusion plot for the Cd(II) adsorption over CNTs-Ag2S.

Figure 11.
Langmuir isotherm plot for Cd(II) adsorption over CNTs-Ag2S.

Figure 12.
The degradation of alizarin yellow R in the presence of CNTs, Ag2S, and CNTs-Ag2S under the illumination to sunlight.
Figure 12.
The degradation of alizarin yellow R in the presence of CNTs, Ag2S, and CNTs-Ag2S under the illumination to sunlight.

Figure 13.
Reduction in the electronic absorption of alizarin yellow R in the presence of CNTs-Ag2S under the irradiation to sunlight.
Figure 13.
Reduction in the electronic absorption of alizarin yellow R in the presence of CNTs-Ag2S under the irradiation to sunlight.

Figure 14.
Langmuir-Hinshelwood plot for the degradation of alizarin yellow R in the presence of CNTs-Ag2S under illumination to sunlight.
Figure 14.
Langmuir-Hinshelwood plot for the degradation of alizarin yellow R in the presence of CNTs-Ag2S under illumination to sunlight.

Figure 15.
A possible mechanism for the degradation of alizarin yellow R in the presence of CNTs-Ag2S under exposure to sunlight.
Figure 15.
A possible mechanism for the degradation of alizarin yellow R in the presence of CNTs-Ag2S under exposure to sunlight.


Table 1.
Parameters calculated for the Cd(II) adsorption using adsorption kinetic models.
| Adsorbent | qe (exp) mg g−1 | Pseudo-First-Order Kinetic Model | Pseudo-Second-Order Kinetic Model | ||||
|---|---|---|---|---|---|---|---|
| qe (cal) mg g−1 | k1(min−1) | R2 | qe (cal) mg g−1 | k2 × 10−3 (g mg−1 min−1) | R2 | ||
| CNTs-Ag2S | 125.0 | 5.0633 | 0.0778 | 0.9930 | 133.2 | 1.2140 | 0.9980 |
| CNTs | 98.75 | 4.7785 | 0.0608 | 0.9906 | 109.8 | 0.8360 | 0.9963 |
| Ag2S | 67.50 | 4.0970 | 0.0519 | 0.9540 | 72.62 | 1.7750 | 0.9985 |
Table 2.
Parameters calculated for Cd(II) adsorption over CNTs-Ag2S using Langmuir, Freundlich, and Temkin adsorption isotherm models.
Table 2.
Parameters calculated for Cd(II) adsorption over CNTs-Ag2S using Langmuir, Freundlich, and Temkin adsorption isotherm models.
| Langmuir Isotherm | Freundlich Isotherm | Temkin Isotherm | ||||||
|---|---|---|---|---|---|---|---|---|
| qm (mg g−1) | KL (L mg−1) | R2Lan | KF (mg g−1) | n | R2Fre | A | B | R2Tem |
| 256.4 | −0.6830 | 0.9972 | 305.0 | −31.21 | 0.3562 | 1.1 × 10256 | 0.4565 | 0.0019 |
Table 3.
Comparison of the degradation rate of AYR by CNTs-Ag2S with reported photocatalysts.
| Photocatalyst | Source of Irradiation | Degradation Rate (%) | Ref |
|---|---|---|---|
| CNTs-Ag2S | Sunlight | 100 | This work |
| Fe nanoparticles | Sunlight | 93.7 | 25 |
| H2O2 | UV | 100 | 24 |
| Zinc oxide | UV | 92.5 | 46 |
| β-MnO2 nanowires | Mercury lamp | 98.0 | 69 |
| Mn3O4 | Mercury lamp | 62.0 | 69 |
| MnO(OH) nanorods | Mercury lamp | 54.0 | 69 |
| Bi2O3@RGO | Sunlight | 41.5 | 70 |
| ZnO nanoparticles | UV | 95.0 | 71 |
| ZnO nanoparticles | Sunlight | 13.2 | 71 |
| ZnO nanoparticles | Visible | 06.2 | 71 |
Disclaimer/Publisher’s Note: The statements, opinions and data contained in all publications are solely those of the individual author(s) and contributor(s) and not of MDPI and/or the editor(s). MDPI and/or the editor(s) disclaim responsibility for any injury to people or property resulting from any ideas, methods, instructions or products referred to in the content. |
© 2023 by the authors. Licensee MDPI, Basel, Switzerland. This article is an open access article distributed under the terms and conditions of the Creative Commons Attribution (CC BY) license (https://creativecommons.org/licenses/by/4.0/).
Share and Cite
MDPI and ACS Style
Neelgund, G.M.; Aguilar, S.F.; Jimenez, E.A.; Ray, R.L. Adsorption Efficiency and Photocatalytic Activity of Silver Sulfide Nanoparticles Deposited on Carbon Nanotubes. Catalysts 2023, 13, 476. https://doi.org/10.3390/catal13030476
AMA Style
Neelgund GM, Aguilar SF, Jimenez EA, Ray RL. Adsorption Efficiency and Photocatalytic Activity of Silver Sulfide Nanoparticles Deposited on Carbon Nanotubes. Catalysts. 2023; 13(3):476. https://doi.org/10.3390/catal13030476
Chicago/Turabian StyleNeelgund, Gururaj M., Sanjuana Fabiola Aguilar, Erica A. Jimenez, and Ram L. Ray. 2023. "Adsorption Efficiency and Photocatalytic Activity of Silver Sulfide Nanoparticles Deposited on Carbon Nanotubes" Catalysts 13, no. 3: 476. https://doi.org/10.3390/catal13030476
Note that from the first issue of 2016, this journal uses article numbers instead of page numbers. See further details here.