Article

Water-Active Titanium/Molybdenum/Mixed-Oxides: Removal Efficiency of Organic Water Pollutants by Adsorption and Photocatalysis and Toxicity Assessment

by
Tamara B. Ivetić
1,*,†,
Nina L. Finčur
2,†,
Daniela V. Šojić Merkulov
2,
Vesna N. Despotović
2,
Dragana D. Četojević-Simin
3,4,
Sanja J. Armaković
2,
Maria M. Uzelac
2,
Szabolcs I. Bognár
2,
Nataša J. Zec
5,
Svetlana R. Lukić-Petrović
1 and
Biljana F. Abramović
2
1
Department of Physics, University of Novi Sad Faculty of Sciences, Trg Dositeja Obradovića 4, 21000 Novi Sad, Serbia
2
Department of Chemistry, Biochemistry and Environmental Protection, University of Novi Sad Faculty of Sciences, Trg Dositeja Obradovića 3, 21000 Novi Sad, Serbia
3
Oncology Institute of Vojvodina, Dr Goldmana 4, 21204 Sremska Kamenica, Serbia
4
Department of Pharmacy, Singidunum University, Danijelova 32, 11000 Belgrade, Serbia
5
Technical College of Applied Sciences in Zrenjanin, Đorđa Stanimirovića 23, 23000 Zrenjanin, Serbia
*
Author to whom correspondence should be addressed.
Equal contribution.
Catalysts 2021, 11(9), 1054; https://doi.org/10.3390/catal11091054
Submission received: 31 July 2021 / Revised: 26 August 2021 / Accepted: 27 August 2021 / Published: 31 August 2021
(This article belongs to the Special Issue Innovative Functional Materials in Photocatalysis)

Abstract

:
A new titanium/molybdenum/mixed-oxides (TMO) contact-type heterojunction photocatalyst was prepared by a simple, low-cost, and environmentally-friendly mixing-calcination solid-state method. A microstructural investigation by scanning electron microscopy (SEM) showsirregularly shaped agglomerated morphology of TMO that consists of firmly connected globular TiO2 and rod-like MoO3 particles. The detailed structure and optical bandgap investigation by X-ray diffraction, Raman, and UV-Vis spectroscopy revealed the TMO’s composition of ~37 wt.% rutile TiO2, ~25 wt.% of anatase TiO2, and ~38 wt.% of molybdite MoO3 phase and an absorption threshold of around 380 nm, which implies more probability of desirable higher visible light absorption. The removal efficiency of pesticides quinmerac (QUI) and tembotrione (TEM), and pharmaceuticals metoprolol (MET), amitriptyline (AMI), ciprofloxacin (CIP),and ceftriaxone (CEF) from water in the presence of starting pure TiO2, MoO3, and prepared TMO were investigated under different pH values and UV irradiation/simulated sunlight (SS). Each starting metal-oxide precursors and prepared TMO showed a different affinity for adsorption of tested pesticides and pharmaceuticals, and, in general, better photocatalytic degradation efficiency under UV irradiation than under simulated sunlight. The highest photocatalytic degradation efficiency under UV irradiation was 81.6% for TEM using TMO; using TiO2 was 65.0% for AMI, and using MoO3 was 79.3% for CEF after 135 min. However, TMO showed a very high synergic adsorption/photocatalytic under-SS efficiency in the removal of CIP of almost 80% and under UV irradiation of 90% CIP removal after 75 min. The toxicity of catalysts, starting compounds, and their intermediates formed during the removal process was assessed using a rat hepatoma cell line (H-4-II-E). The highest hepatotoxic effects were obtained by using UV irradiated QUI and MET suspension with TMO for up to 60 min.

1. Introduction

Despite a long-time awareness of increasing water pollution and a batch of more or less efficient solutions for the purification of waters, it remains one of the biggest challenges of today’s environmental protection field [1]. The growing need for clean waters just adds up more weight to this problem. The sources of water pollution are untreated industrial and municipal wastewaters. Besides, the number of environmentally toxic substances grows by the day. A variety of hazardous pollutants have been identified in the aquatic environment, including pesticides, pharmacologically active compounds, textile dyes, surfactants, and heavy metals [2,3]. Quinmerac (QUI) belongs to the class of quinoline carboxylic acids, which are highly selective herbicides. QUI is quite effective in controlling dicotyledonous weeds in sugar beet, oilseed rape, and wheat [4]. According to the European Food Safety Authority, QUI exhibits high to very high mobility in soil and is stable to hydrolysis over the pH range 5–9. It is degraded slowly under artificial light simulating summer sunlight [5]. Tembotrione (TEM) is one of the β-triketone pesticides made by Bayer CropScience (Laudis®) and used in the early treatments of cornfields. As a part of the benzoylcyclohexane-1,3-dione group, it prohibits the functionality of the 4-hydroxyphenyl pyruvate dioxygenase enzyme, which results in necrosis and death of the target plants [6]. Due to its persistence in the environment, TEM can accumulate in nature, which could lead to undesirable effects directly on aquatic and indirectly on other organisms [7,8].Metoprolol (MET) is a medicament used for treating high blood pressure, chest pain caused by poor blood flow to the heart, and several other conditions involving an abnormally fast heart rate, and it is highly soluble in water, stable in aquatic solution, and as such, has a detrimental impact on the environment. It has been detected in natural waters at concentrations ranging from 3 ng/cm3 to 4.9 μg/cm3 [9,10]. Based on the literature data, direct photolysis is not an effective way to remove MET from water and one alternative for its removal from water is the process of photocatalysis [11]. Amitriptyline (AMI) is a tricyclic antidepressant from the class of dibenzocycloheptadiene, which is the most commonly used in the treatment of depressive disorders, including clinical/endogenous depression [12]. It has been detected in the environment in drinking water [13] and in river water [14], as well as in the sludge remaining after treatment [15]. Ciprofloxacin (CIP) and ceftriaxone (CEF) are antibiotics that belong to the fluoroquinolones [16,17] andthe third generation of cephalosporins [18], respectively. Nowadays, these antibiotics are often used when the body becomes immune to commonly used antibiotics such as amoxicillin and penicillin. It was reported that CEF was detected in influent wastewater samples with a concentration at 334 μg/dm3 [19], in groundwater with concentrations at 58.3 and 59.5 μg/dm3 [20], and in wastewater with concentrations at 2.03 ± 1.11 μg/dm3 [21].
Adsorption belongs to the conventional wastewaters treatment technologies that are characterized by simplicity, low cost, and very high reliability and efficiency. However, in some cases, certain drawbacks appear, like the transformation of pollutants from one phase to another, slow kinetics, limited adsorption capacity, and the regeneration of adsorbing materials, etc. [22]. Similarly, photocatalysis is considered an alternative, simple, cheap, and environmentally friendly water purification treatment and has been the subject of intensive research [23,24] for almost 40 years or so. Typically, photocatalysis implies the use of semiconductor material as a catalyst to which surface the reactant species firstly need to be adsorbed. Therefore, adsorption is also a very important step-process in photocatalysis, and so, the adsorption ability of a photocatalyst directly affects the photocatalytic efficiency. After the initial adsorption, the photocatalysis continues by the formation of the photo-induced reactive species upon the absorption of photons of light with energy equal to or greater than the used semiconductor catalyst’s bandgap [25]. If the separated electron–hole pair, i.e., the created electrons in the conduction band and holes in the valence band of the semiconductor catalyst, reaches the surface of the catalyst before its recombination, it gets involved in the surface reactions with electron acceptors or donors from the surrounding contaminated waters. The produced highly reactive oxygen species in the consequent chain of reactions degrade the organic contaminants in water to less or completely harmless compounds, usually in a very short time. The synergic use of all the advantages that both technologies (adsorption and photocatalysis) possess often leads to much more economical, efficient, and cleaner environmental protection water treatment.
Metal-oxide semiconductors with a wide bandgap are usually used as photocatlysts but only if activated by ultraviolet (UV) irradiation, like the most used TiO2 (n-type semiconductor with energy bandgap of 3.3–3.5 eV) that degrade various organics [26]. However, making stable, inexpensive semiconductor metal-oxide-based photocatalysts with improved properties for efficient visible (Vis) light absorption would be the biggest progress in this research field, as it contributes to greater practicality of the process and more economical application. Constructing a phase junction between the two metal-oxide semiconductors is one of the methods for effective improvement of the photocatalytic performances of these materials under visible irradiation [27,28,29]. Calcination-induced phase junctions are usually prepared in a step-by-step manner. The energy state of starting metal-oxides changes by the temperature rise, which enables close contact-type heterostructure formation, where the potential difference between the two types of starting metal-oxide semiconductors accelerates and improves the photocatalytic reaction [30]. There are only a few reports on TiO2 coupling with MoO3 (n-type semiconductor with an energy bandgap of 2.9 eV) for heterojunction formation and improved photocatalysis [26,30,31].
Here, we present the (1) preparation procedure; (2) structure; (3) optical properties; (4) efficiencies of a new TMO heterojunction photocatalyst, as well as the efficiencies of starting pure TiO2 and MoO3, in the degradation of potential contaminants of waters—selected pesticides (QUI and TEM) and pharmaceuticals (MET, AMI, CIP, and CEF); and (5) evaluation of cytotoxicity of catalysts, the starting compounds, and their reaction mixtures.

2. Results and Discussion

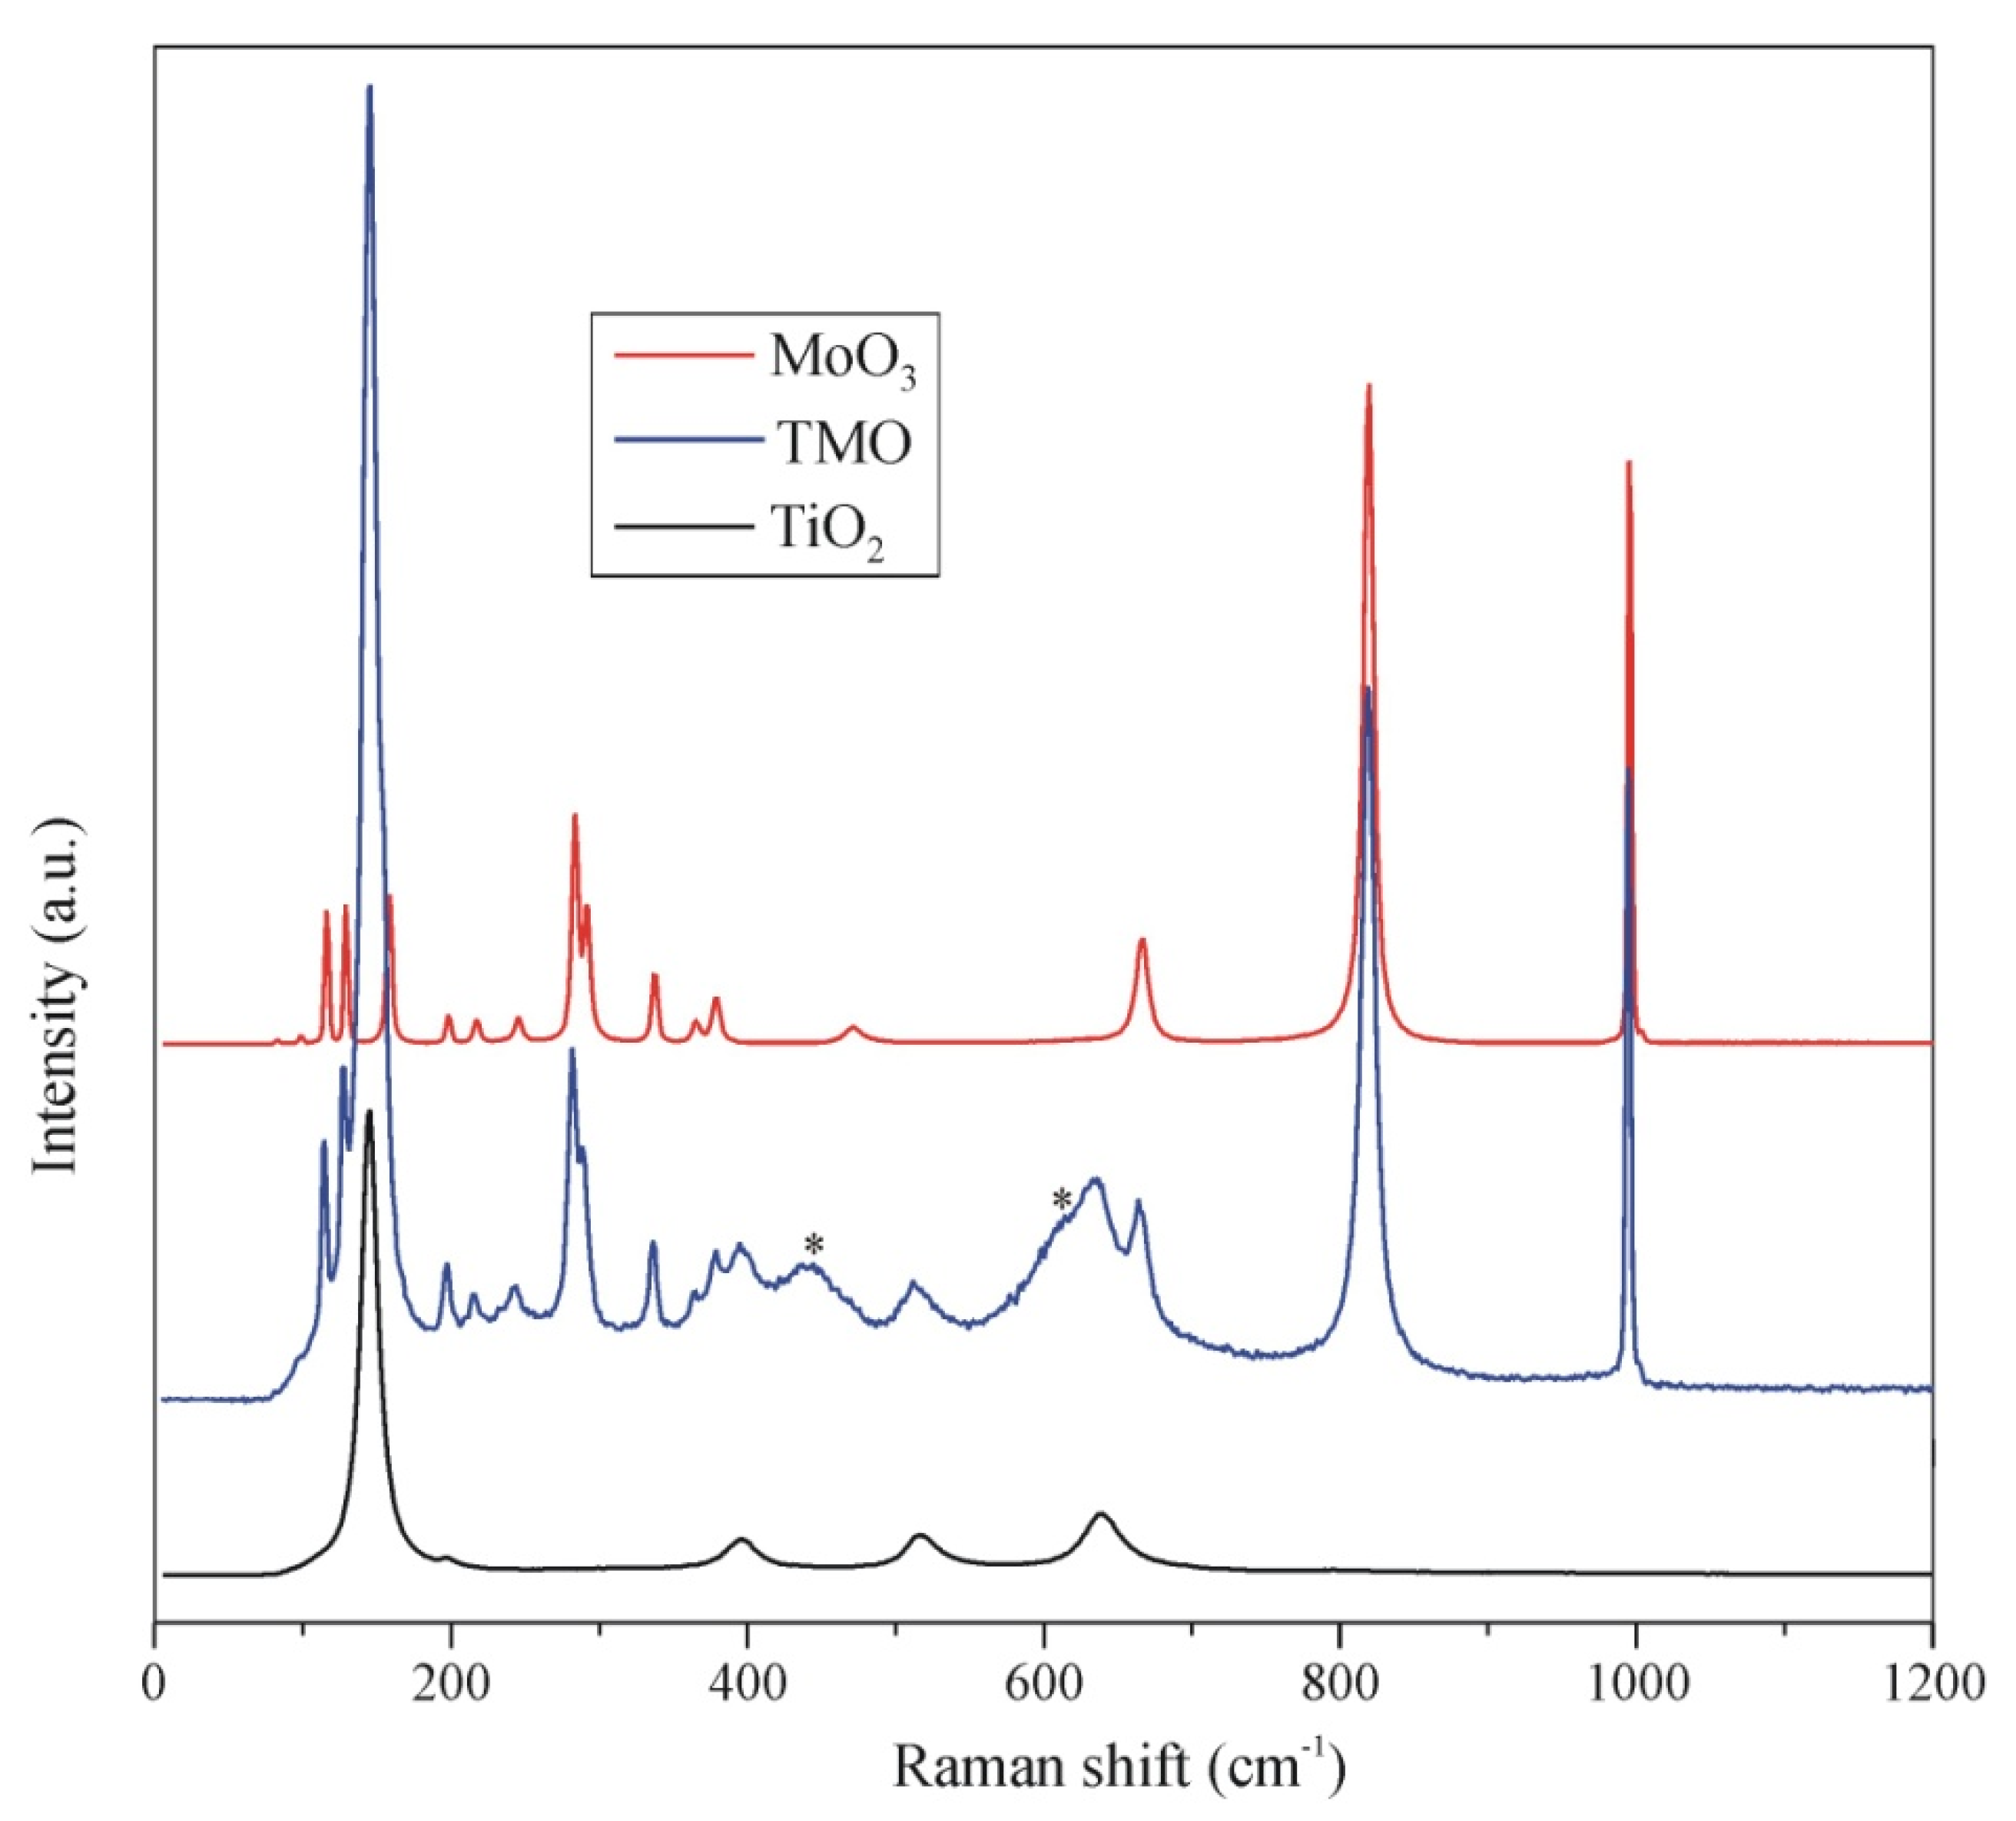
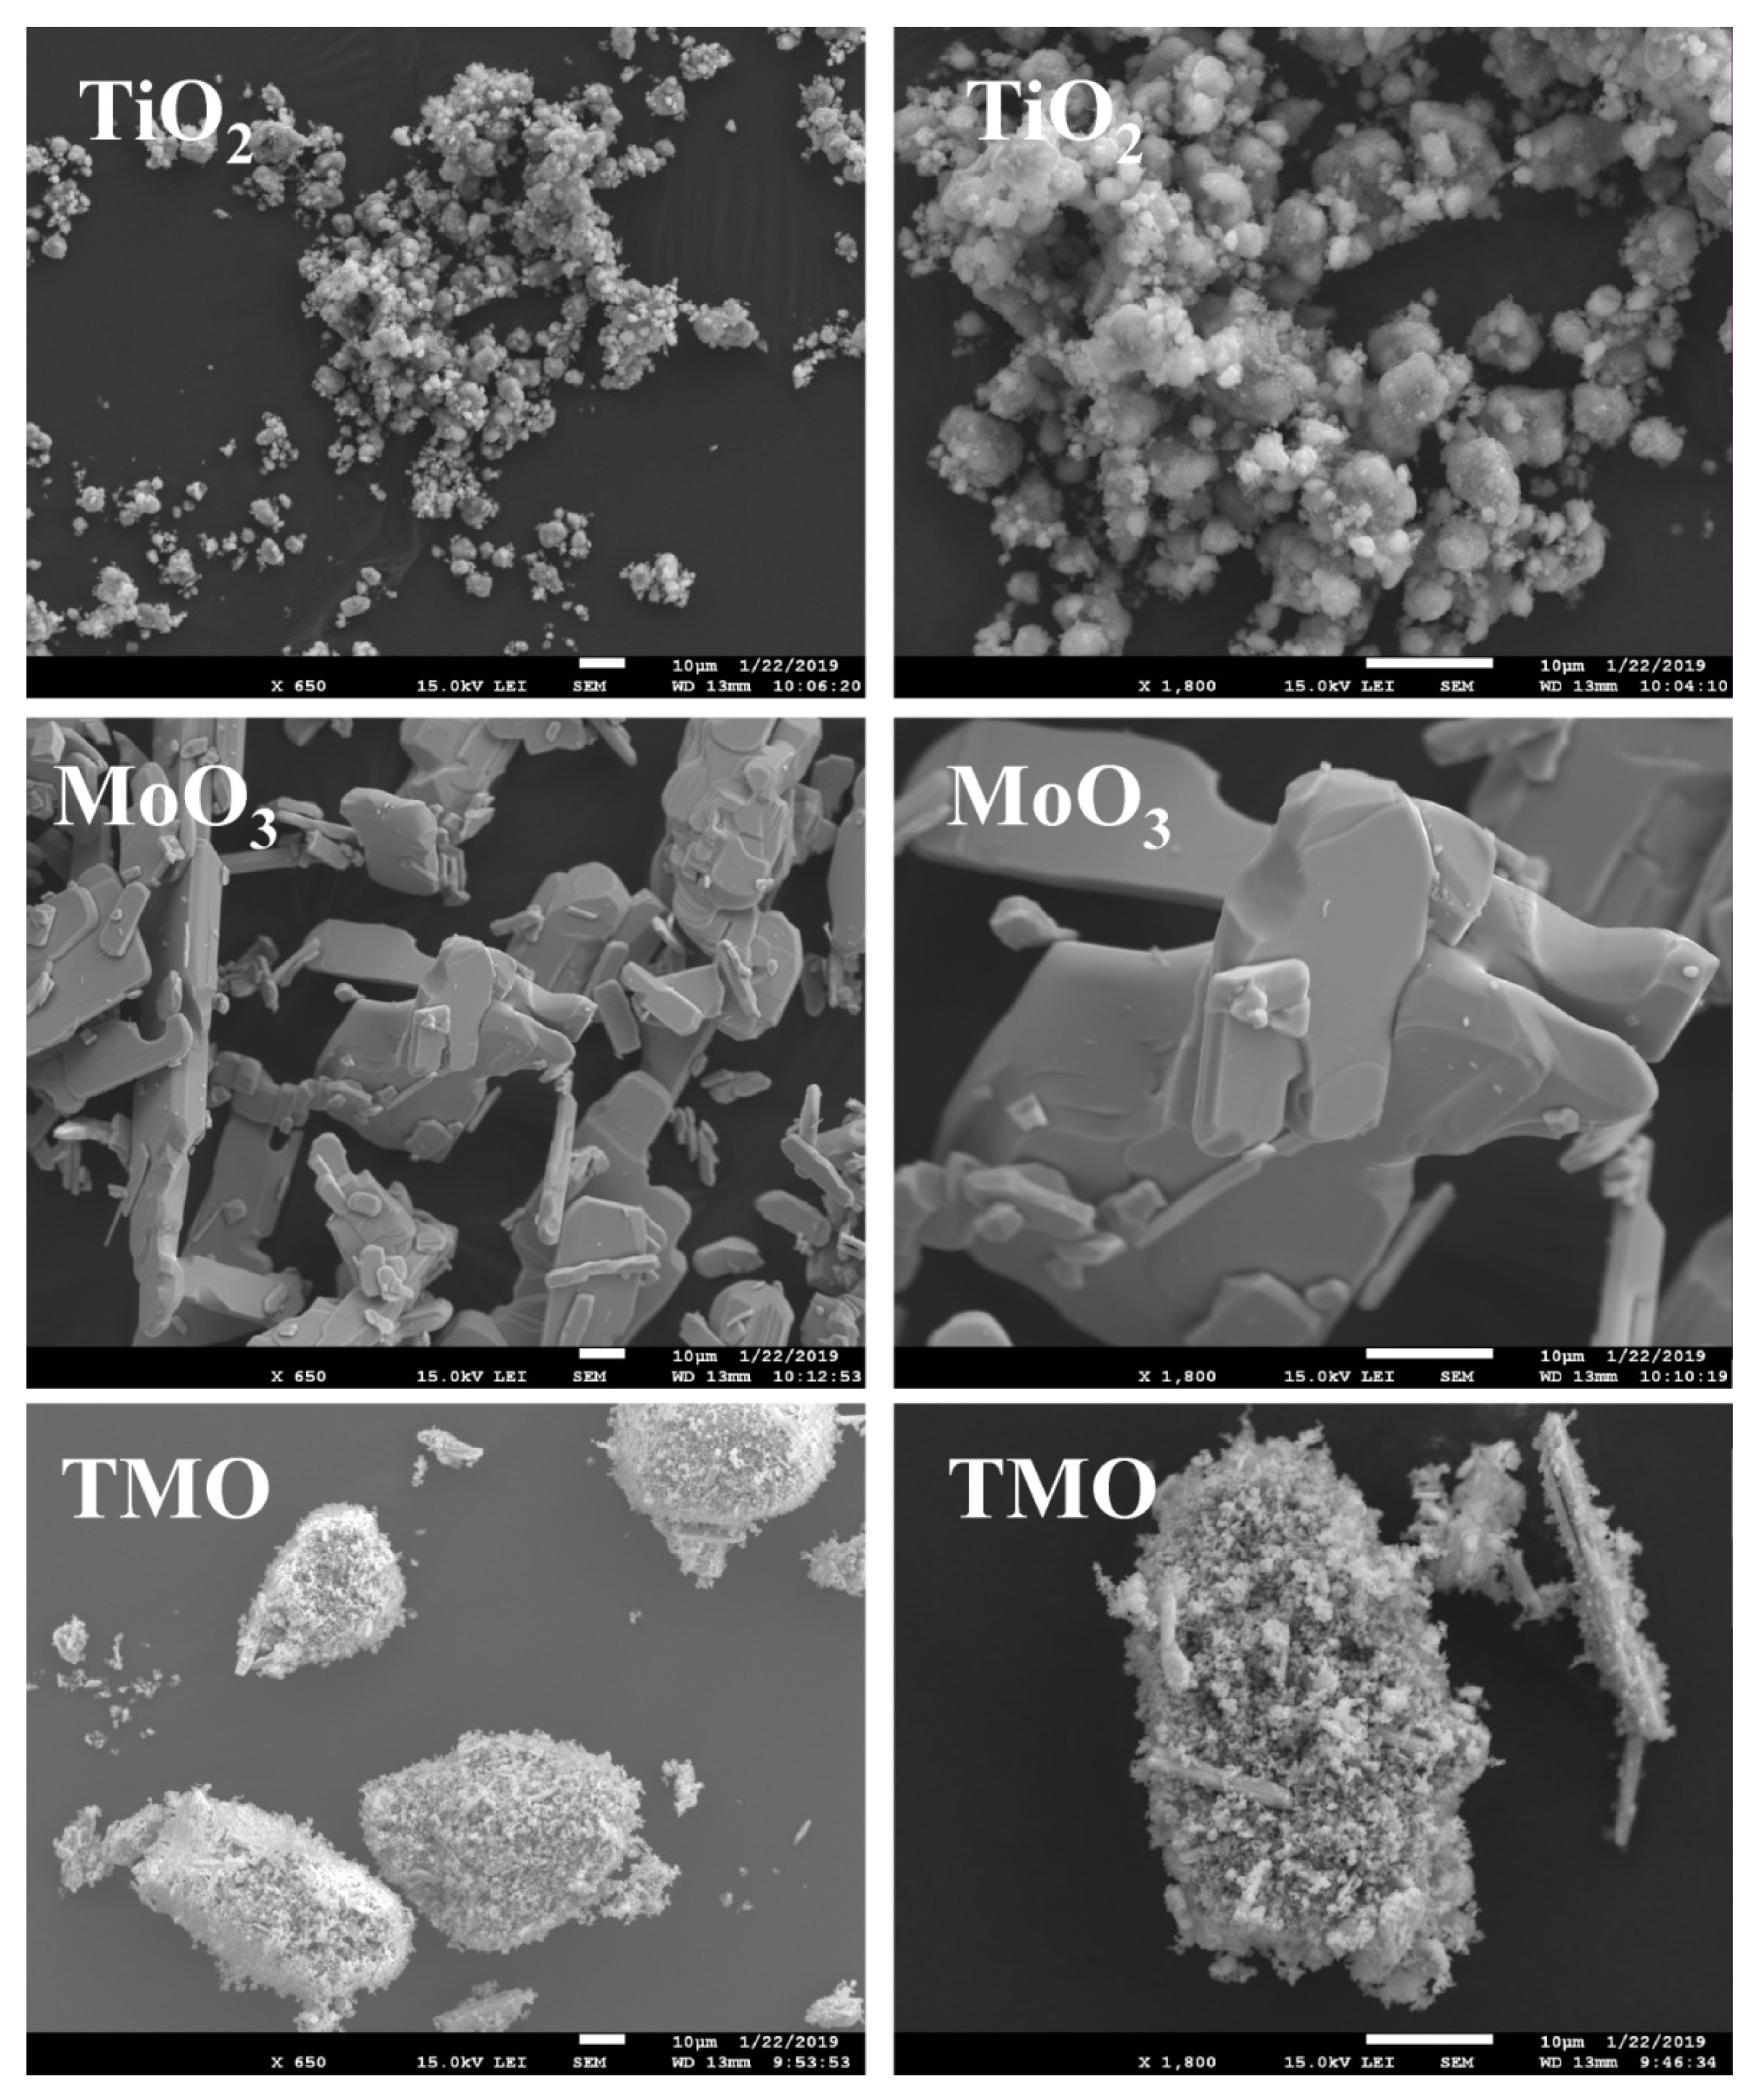
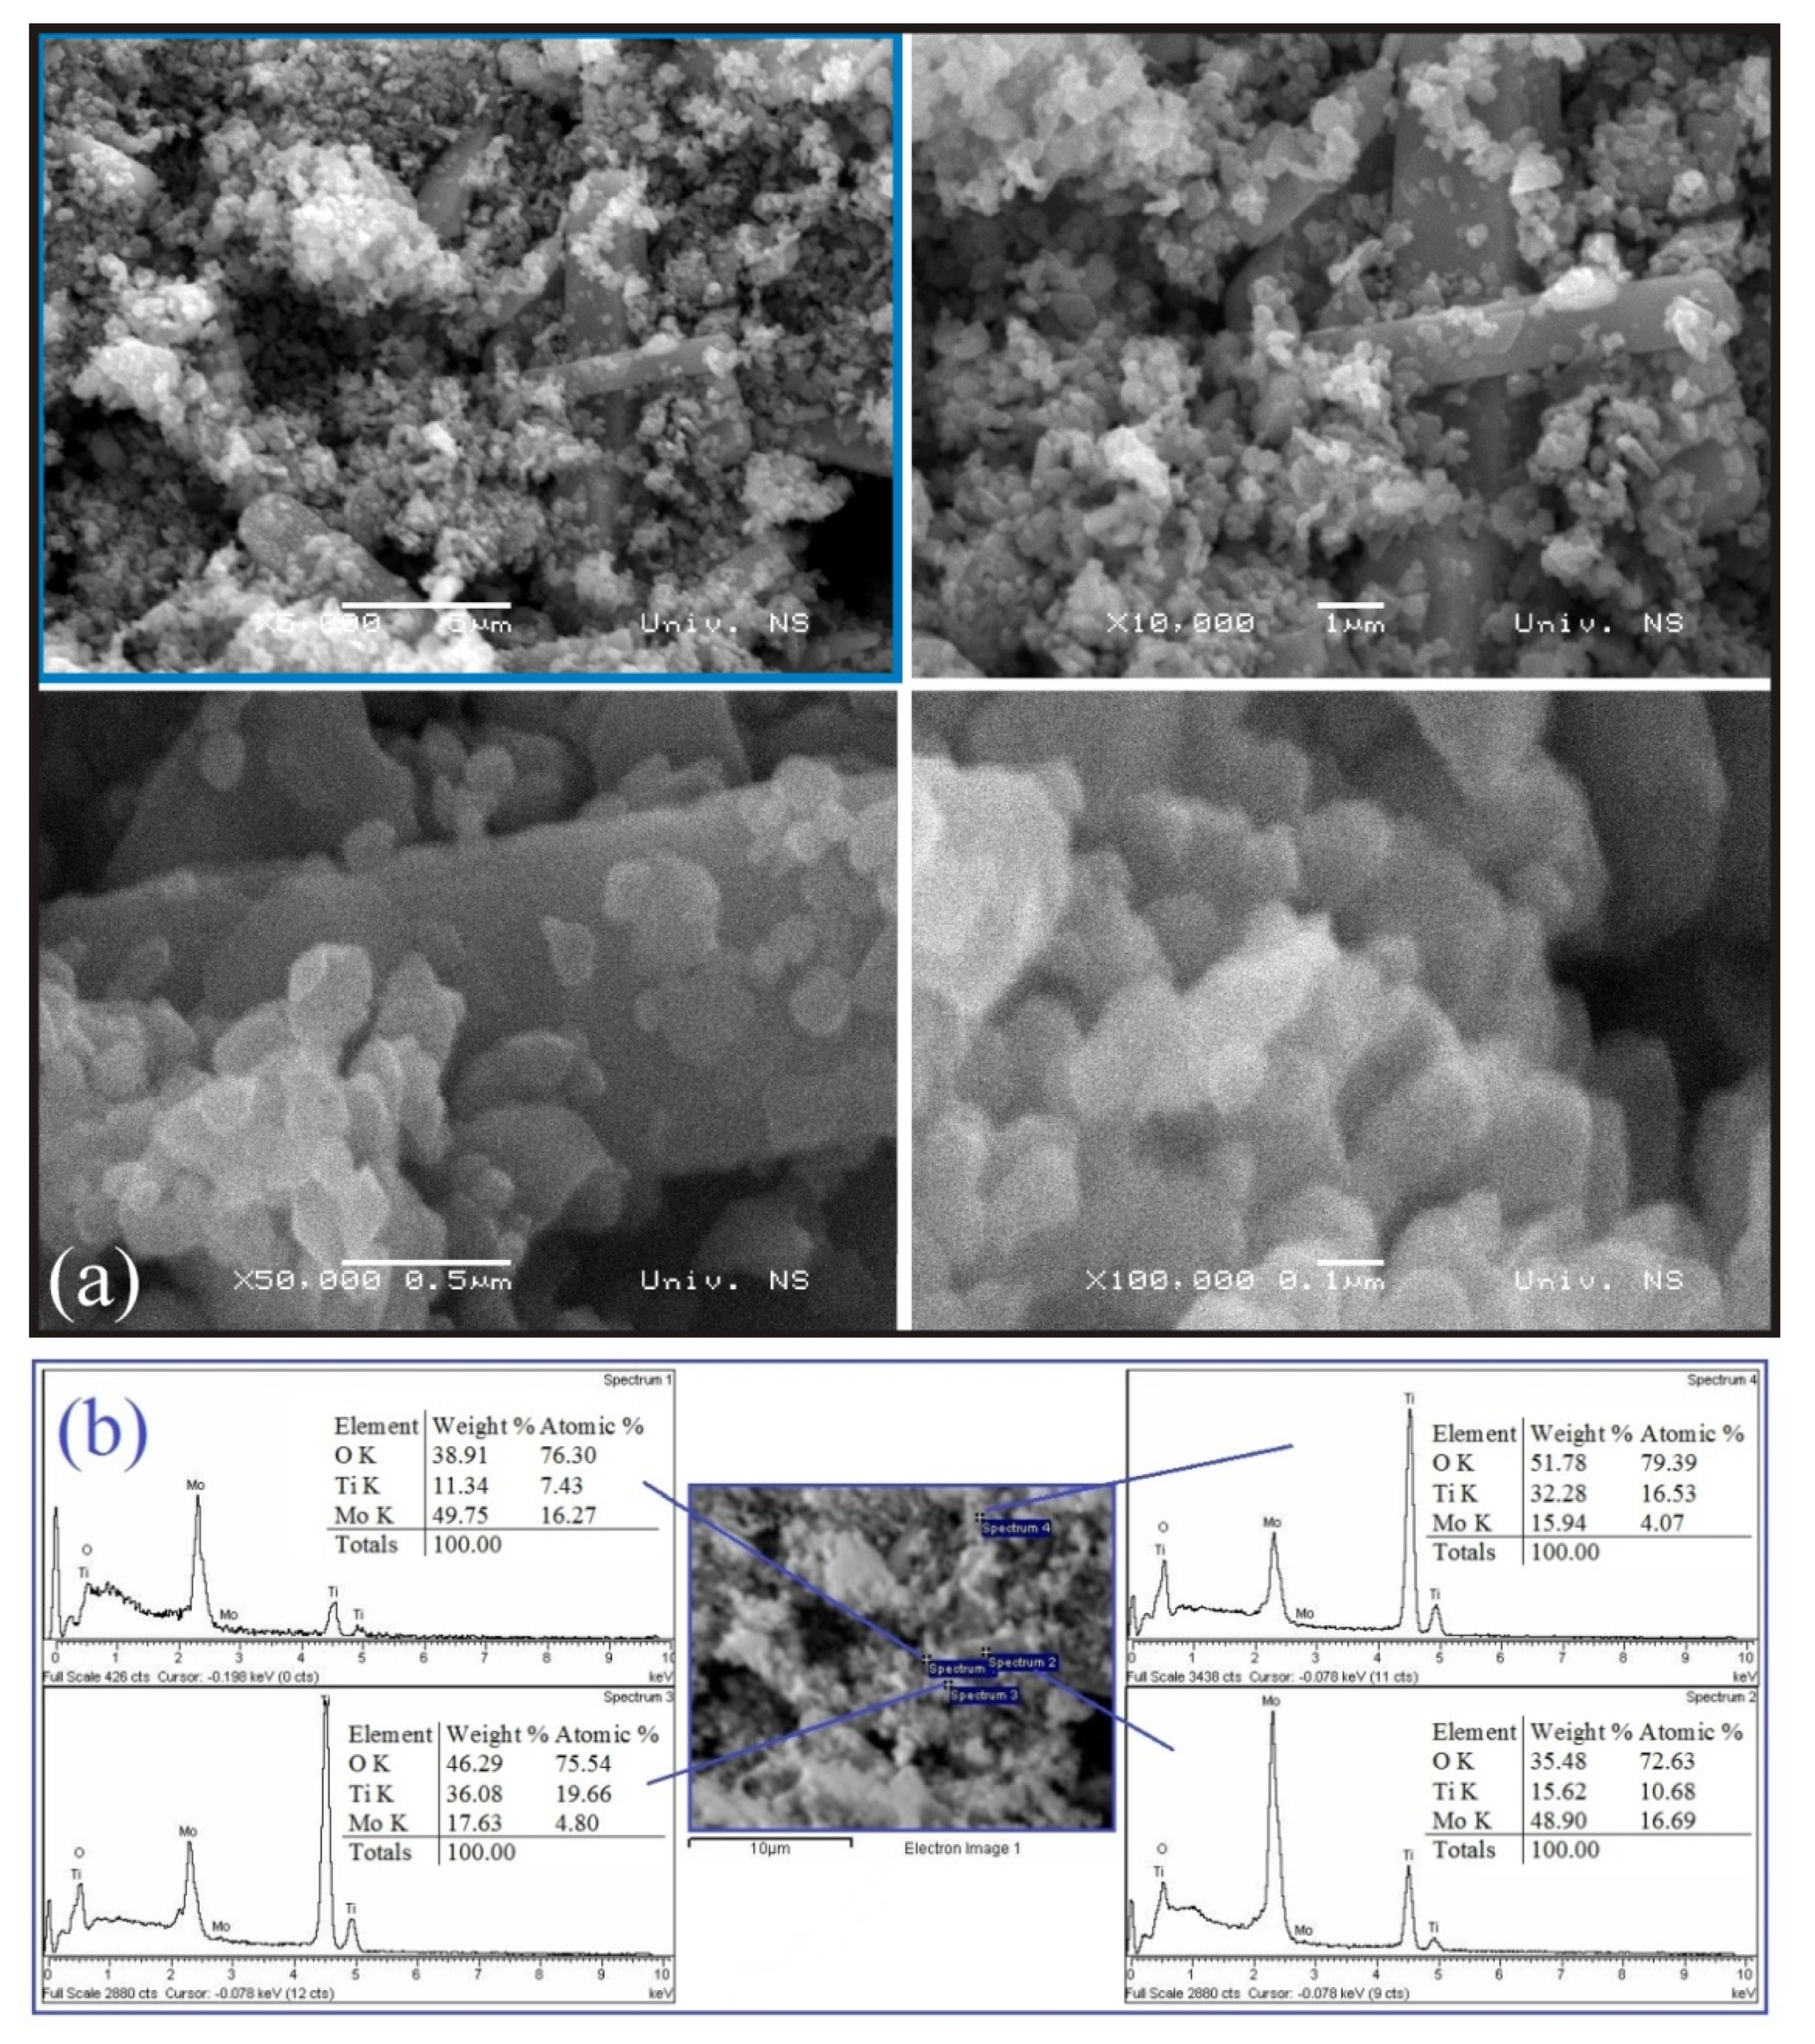
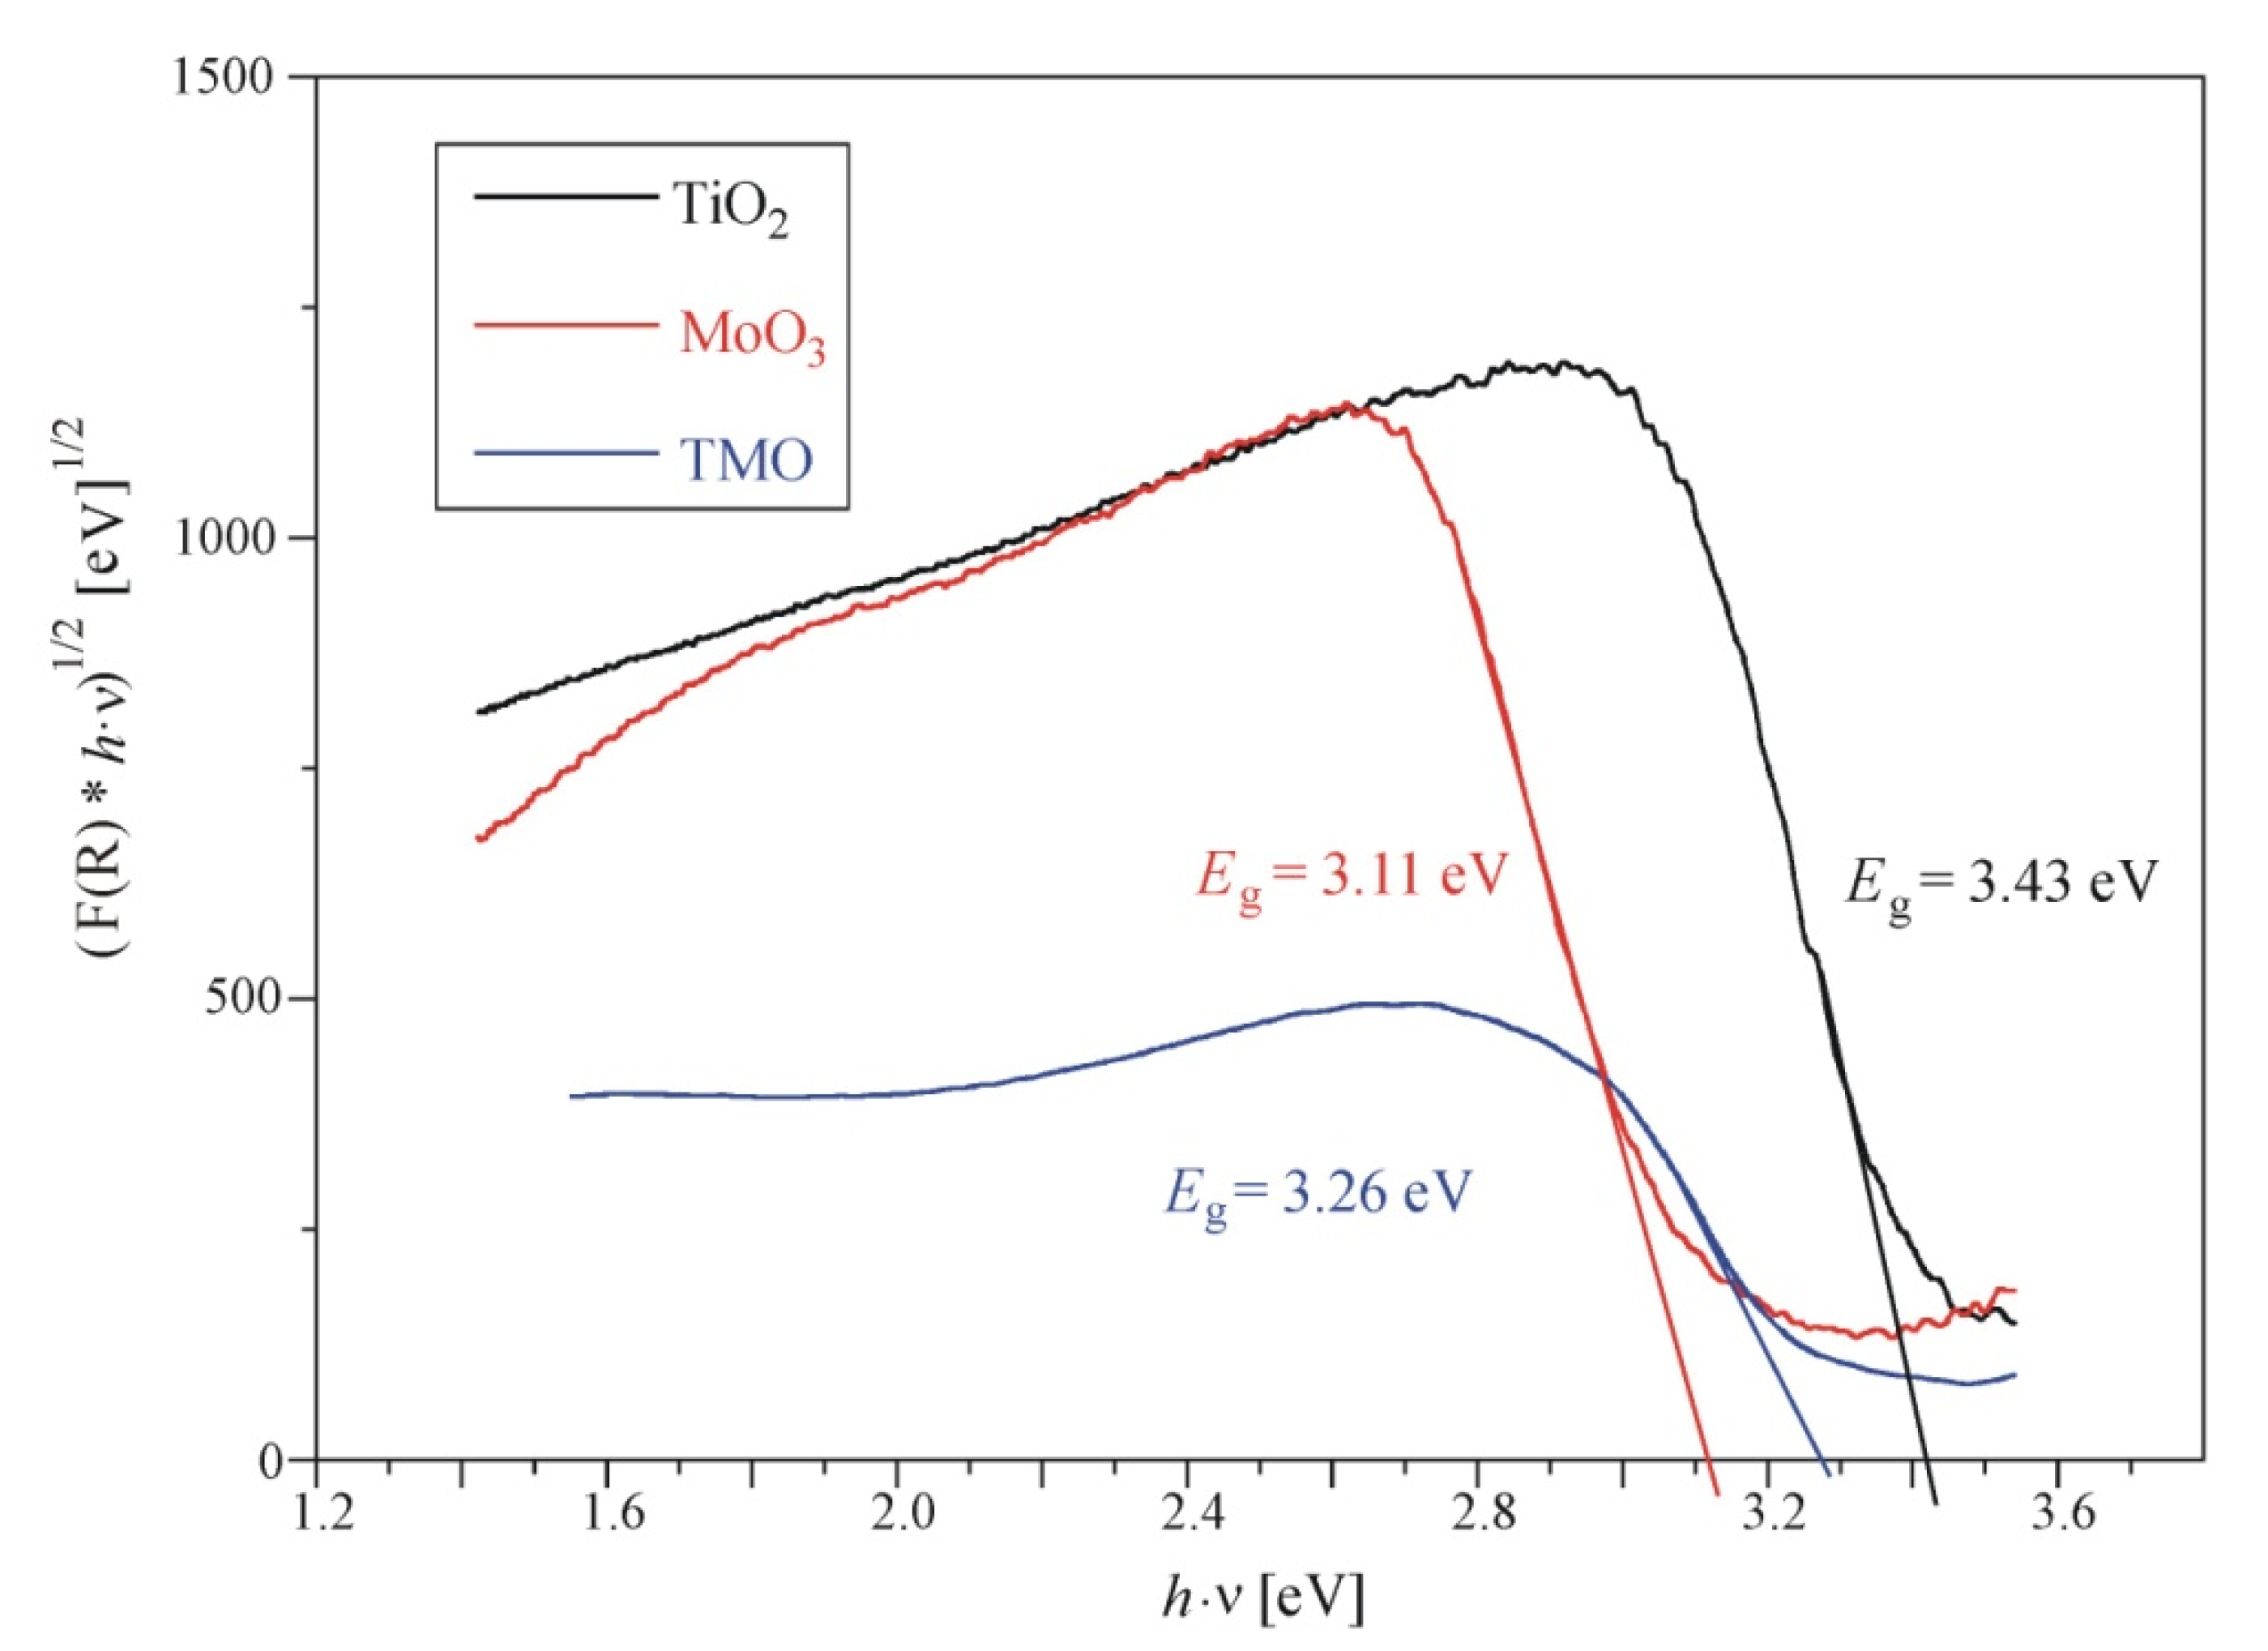
2.1. Structure, Morphology, and Optical Bandgap Characterization

Figure 1 shows the XRD pattern of the TMO, along with its Rietveld refinement. The refined unit cell parameters are presented in Table 1. According to these results, the prepared TMO is a powder mixture consisting of 36.8 wt.% of rutile TiO2, 24.6 wt.% of anatase TiO2, and 38.6 wt.% of the molybdite MoO3 phase. The average crystallite size of both TiO2-type phases is almost the same (214 nm and 221 nm for rutile TiO2 and anatase TiO2 phases, respectively) while the average crystallite size of the molybdite phase (MoO3) is much higher (~1.5 μm).
Figure 2 shows the Raman spectra of the starting powders and the multiple-magnified (for a clearer comparison) Raman spectrum of the TMO (blue-solid line), inserted in between those two. The TMO Raman spectrum confirms its mixed nature, as it shows the modes of both precursor’s crystal structure vibrations, plus the vibration motions of the rutile TiO2 phase (P42/mnm), which was formed during the annealing processing step at 700 °C and, therefore, was present in the TMO, as the XRD confirmed. It is well-known that the fine anatase TiO2 powder of high purity shows phase transformation to its rutile TiO2 polymorph at temperatures starting from ~600 to 700 °C, depending on the synthesis method applied [32]. The starting TiO2 powder shows (Figure 2) the Raman peaks assign to Eg (145 cm−1), Eg (196 cm−1), B1g (395 cm−1), B1g/A1g (516 cm−1), and Eg (639 cm−1) vibrations of the anatase TiO2 crystal structure, as expected, which fits the previous reports [33]. The Raman spectrum of the starting MoO3 (Figure 2, red line) reports a total of 18 peaks at 83 cm−1, 98 cm−1, 115 cm−1, 129 cm−1, 158 cm−1, 198 cm−1, 217 cm−1, 246 cm−1, 283 cm−1, 292 cm−1, 336 cm−1, 365 cm−1, 379 cm−1, 471 cm−1, 667 cm−1, 745 cm−1, 819 cm−1, and 994 cm−1 [34,35]. These peaks are predicted by the group theory and assign to the 5Ag + 4B1g + 5B2g + 4B3g modes of the molybdite orthorhombic crystal structure in the Pbnm space group [36]. All of these MoO3 vibration modes show also in the TMO sample’s Raman spectrum together with the Raman modes of the anatase TiO2 structure. Additionally, the TMO’s Raman spectrum shows the Raman features of the rutile TiO2 structure as well. Those are the peaks marked with an asterisk in Figure 2 at 445 cm−1 and 614 cm−1 and are assigned to the Eg and A1g vibration modes of the rutile TiO2 structure, respectively [33].
Figure 3 shows the comparative SEM images of the starting anatase TiO2 and MoO3 and prepared TMO. Starting anatase TiO2 particles have spherical shapes with an average size of ~5 μm, while starting MoO3 particles show a plate-like morphology with much bigger particle sizes (up to 50 μm and more). The prepared TMO mixture consists of pear-shaped agglomerates (Figure 3) of mixed morphology, with much smaller particle sizes than the sizes of the starting precursor’s powders. Better insight into the TMO microstructures is seen from Figure 4a, where the spherical particles with the sizes ~ 100 nm, are sort of glued to much bigger-sized elongated rod-shaped structures. By comparing the morphology of starting powders and the TMO, it is concluded that spherical smaller particles of TMO belong to the TiO2 phases, while elongated bigger particles belong to the MoO3 phase. These conclusions follow up the Rietveld refinement results shown before, where the highest average crystallite sizes were calculated for the MoO3 phase. The elemental analysis by EDS of TMO (Figure 4b) confirms the higher concentration of molybdenum (Mo) in elongated particles (spectrums 1 and 2).
The measured UV-Vis reflectance spectra are used for the optical bandgap energy (Eg) estimation by plotting the (F(R)⋅hν)1/n vs. photon energy (hν) (Figure 5), where F(R) is the Kubelka-Munk transformation of the measured reflectance R(%) defined as (1 − R)2/2R. The model for the indirect bandgap transition is used and a value of n = 2 in (F(R)⋅hν)1/n vs. photon energy (hν) plot [30]. The estimated value of the optical bandgap energy of TMO (3.26 eV) was between the estimated optical energy band values of the starting anatase TiO2 and MoO3 (3.43 eV and 3.11 eV, respectively). The optical absorption threshold, calculated by λ = 1240/Eg, of around 380 nm, 360 nm, and 398 nm for TMO, TiO2, and MoO3, respectively, indicates the potential for the visible absorption of these individual semiconductors in photocatalysis.

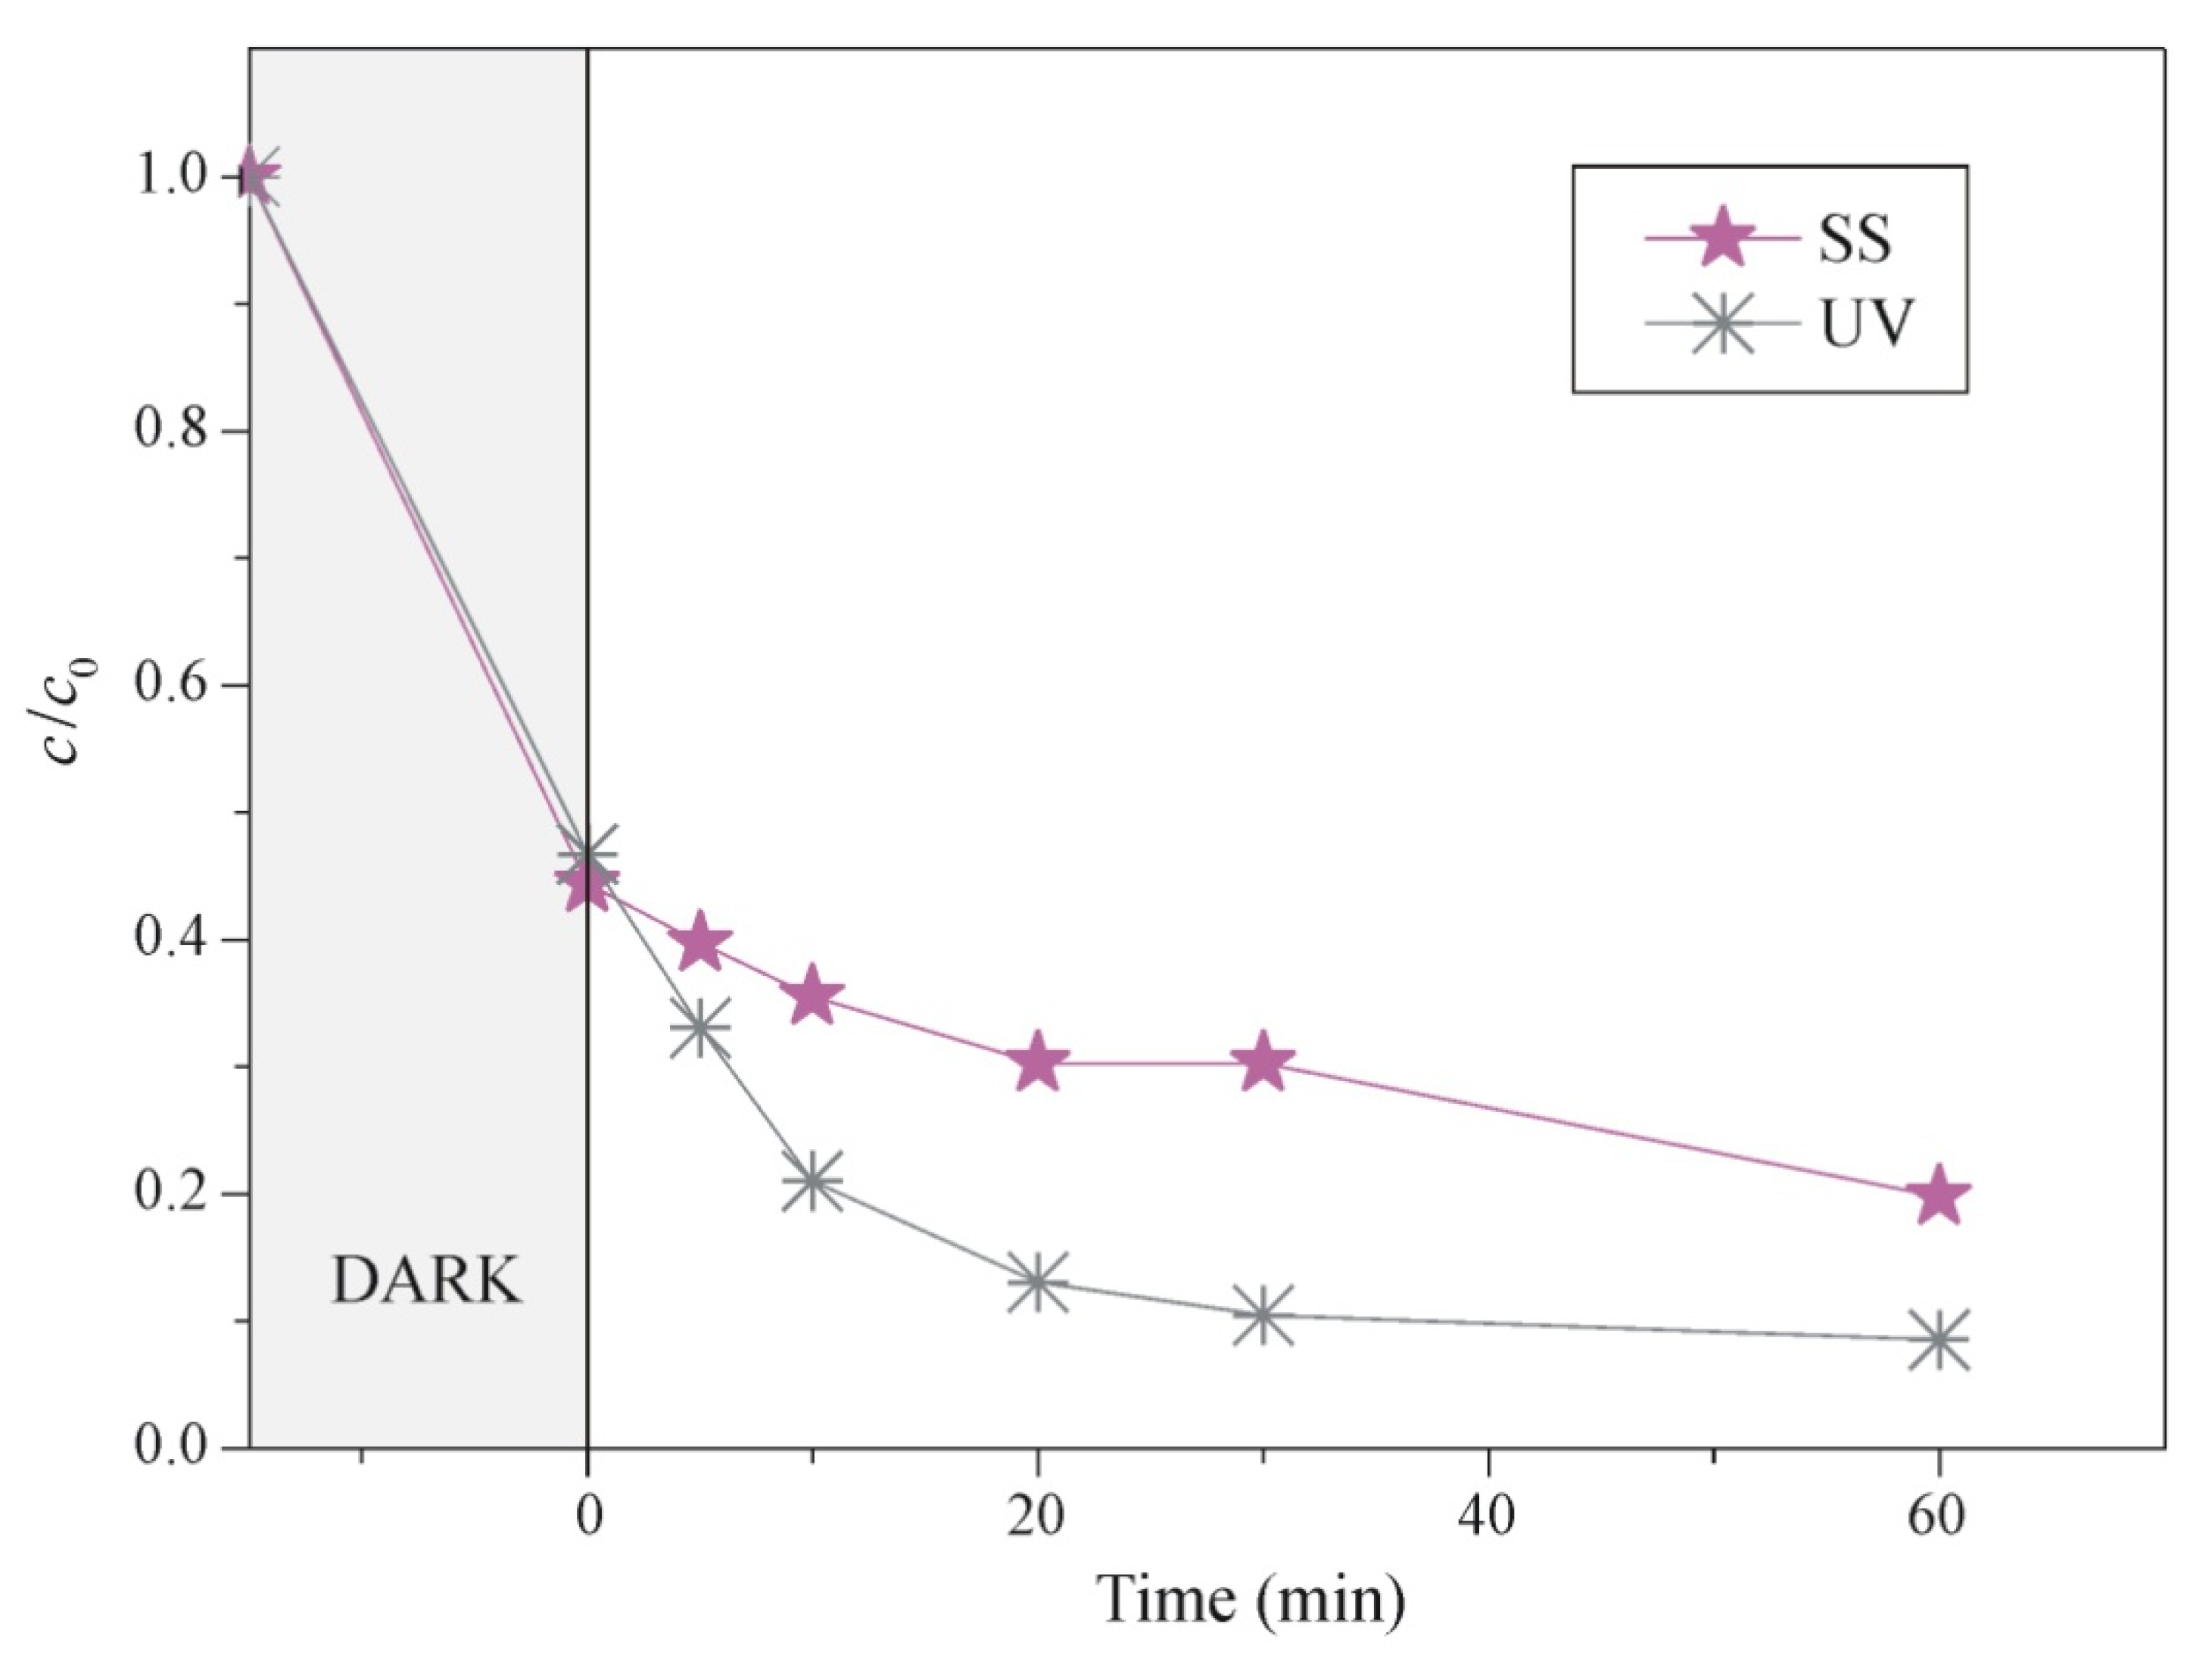
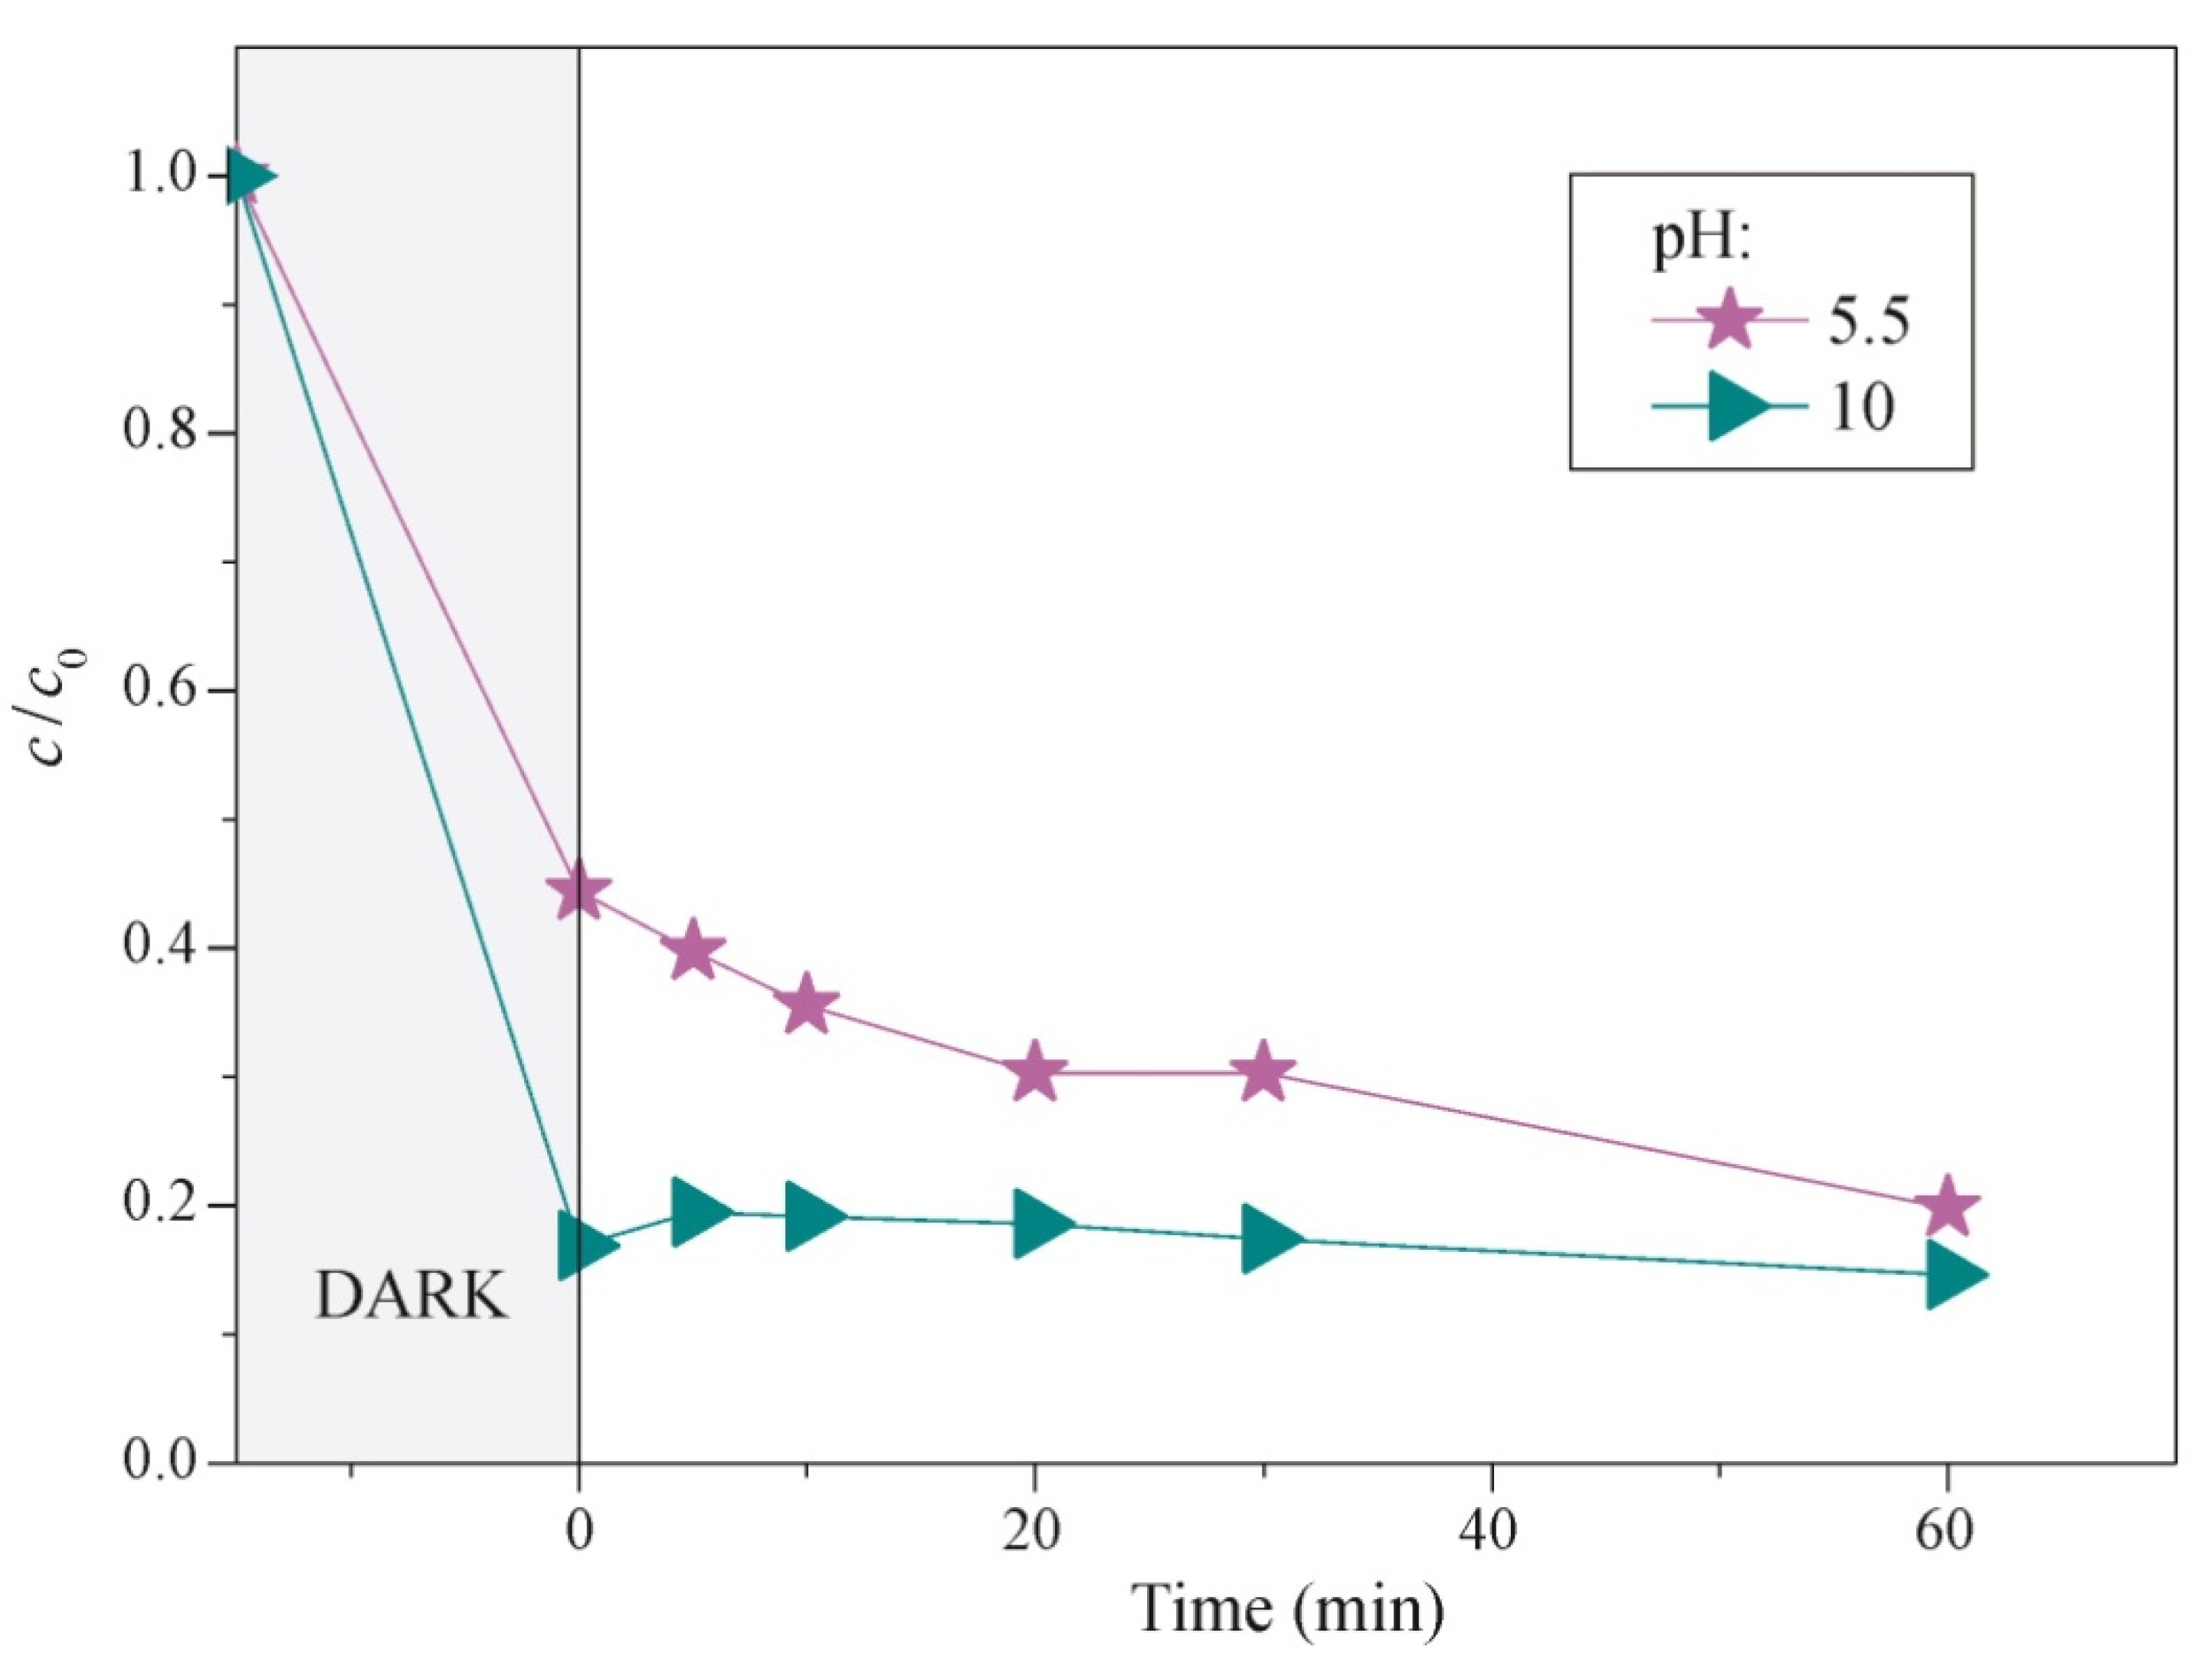
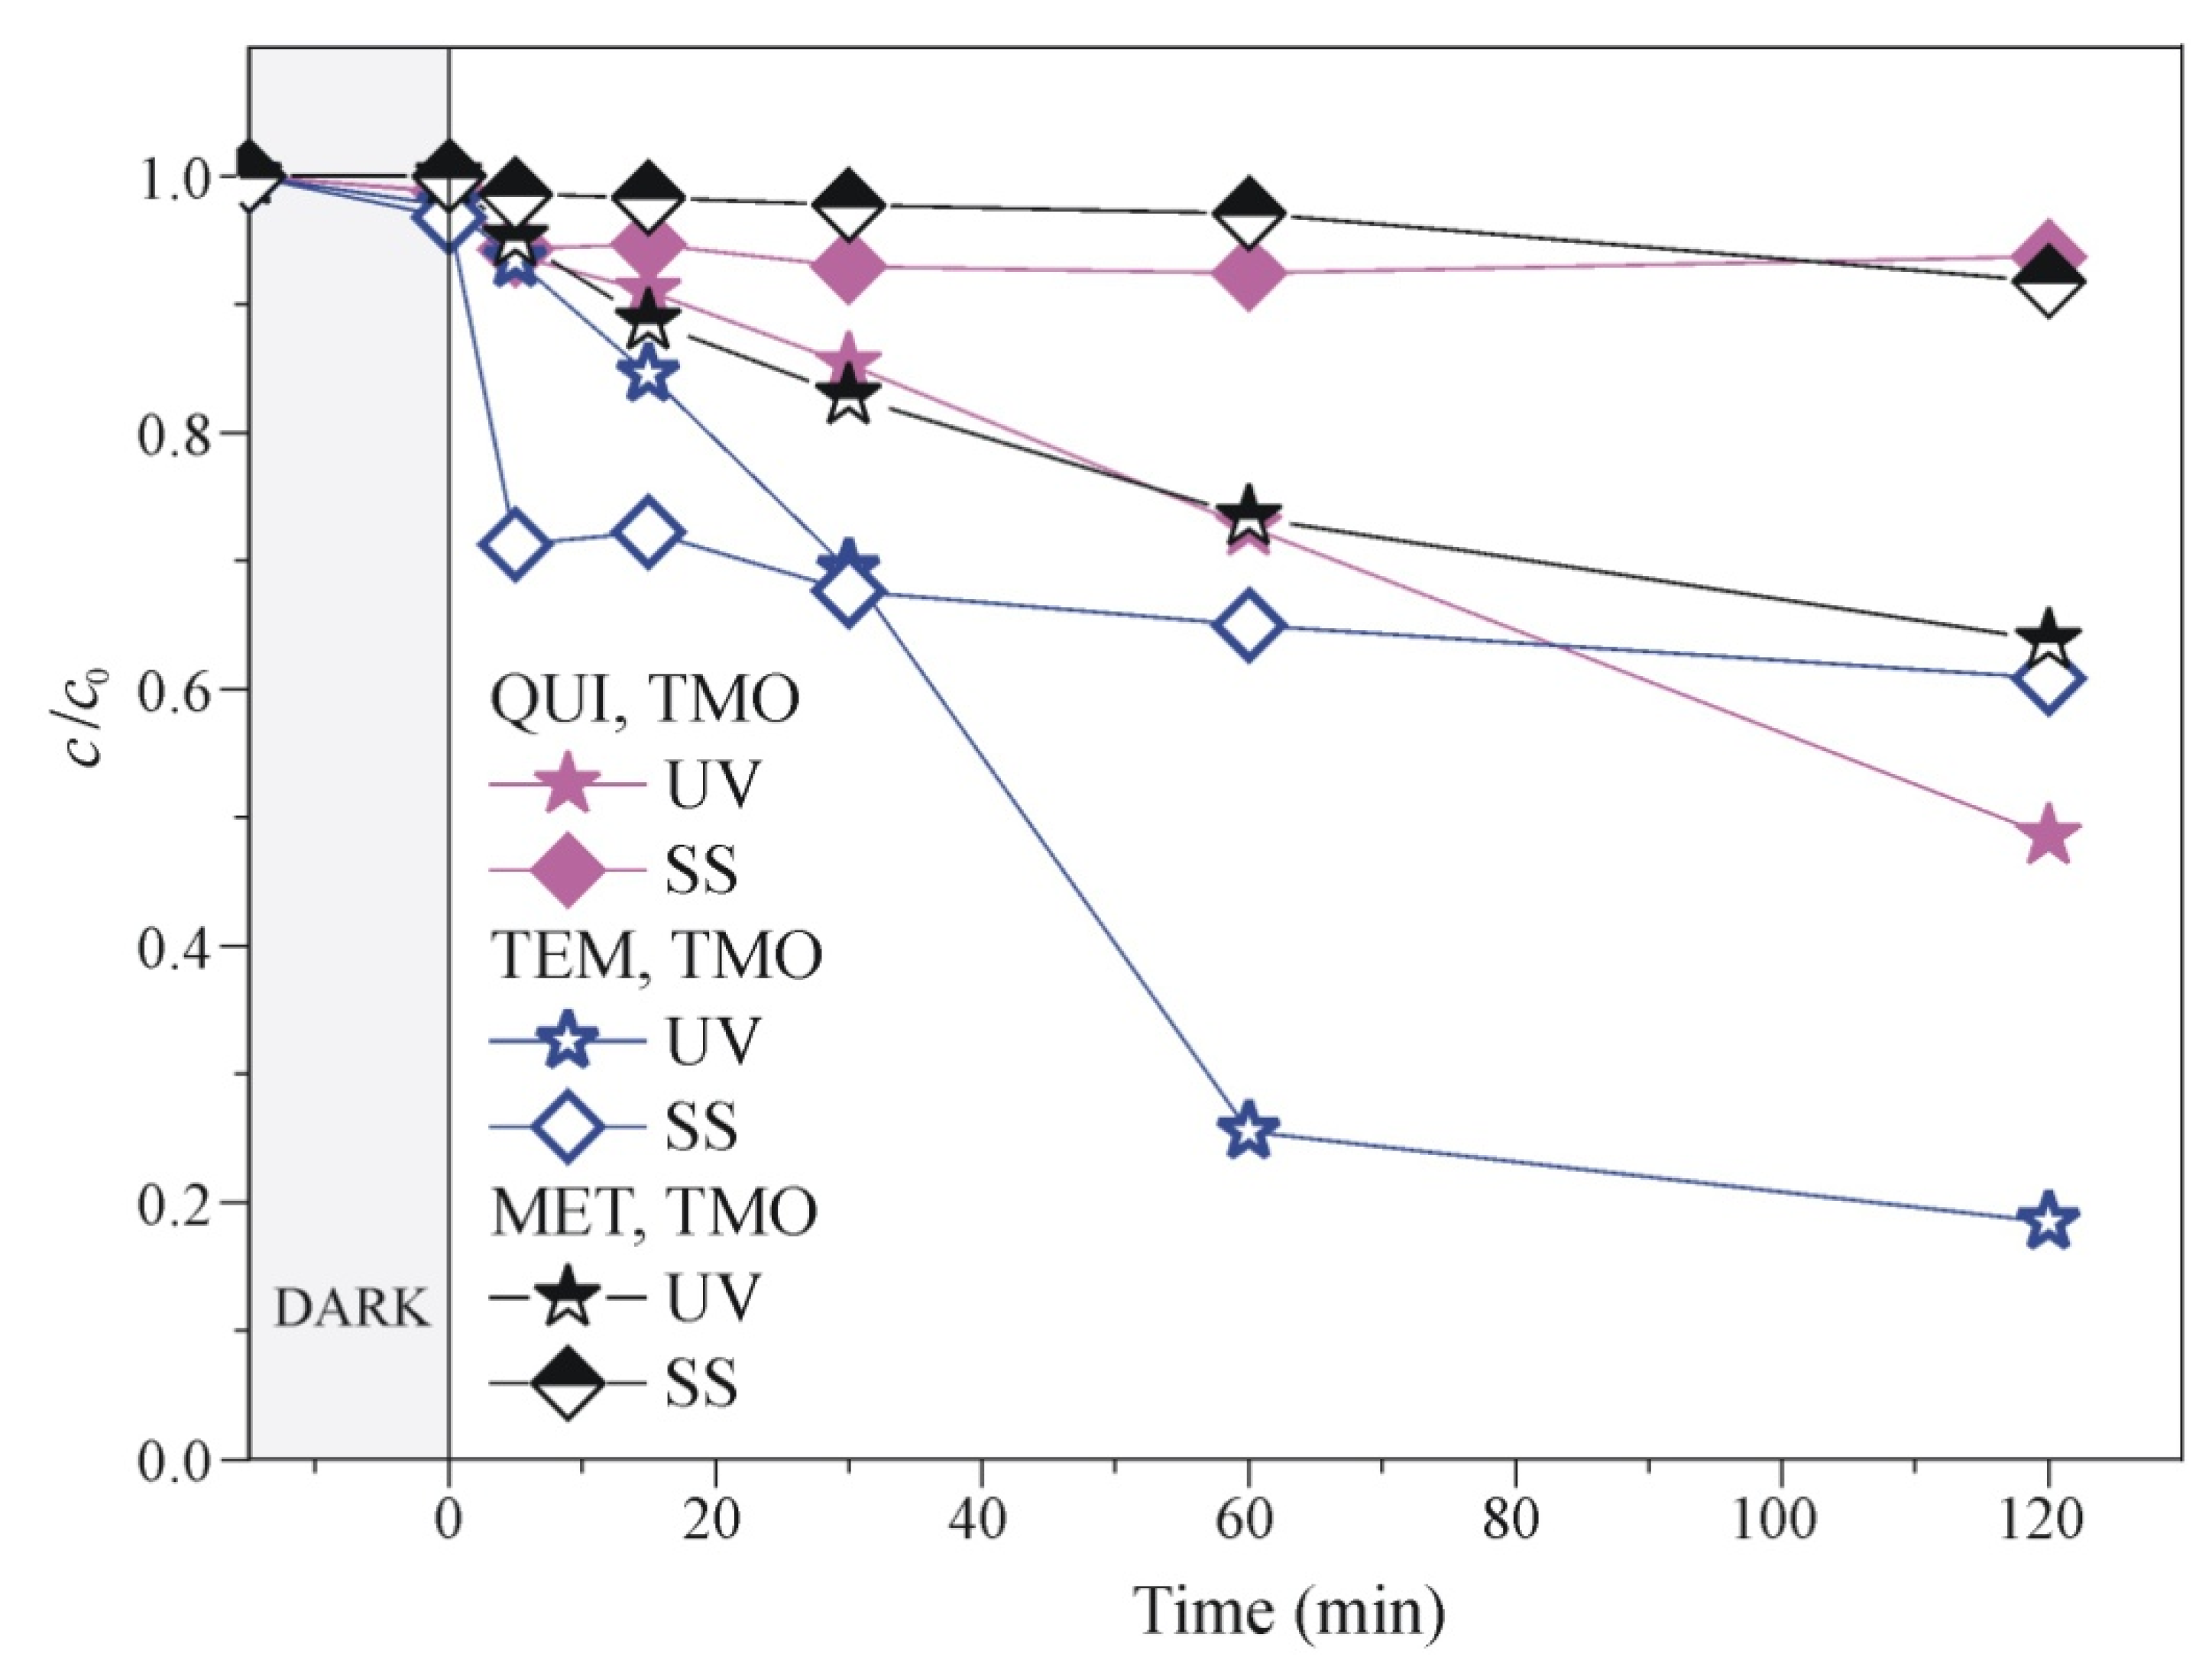
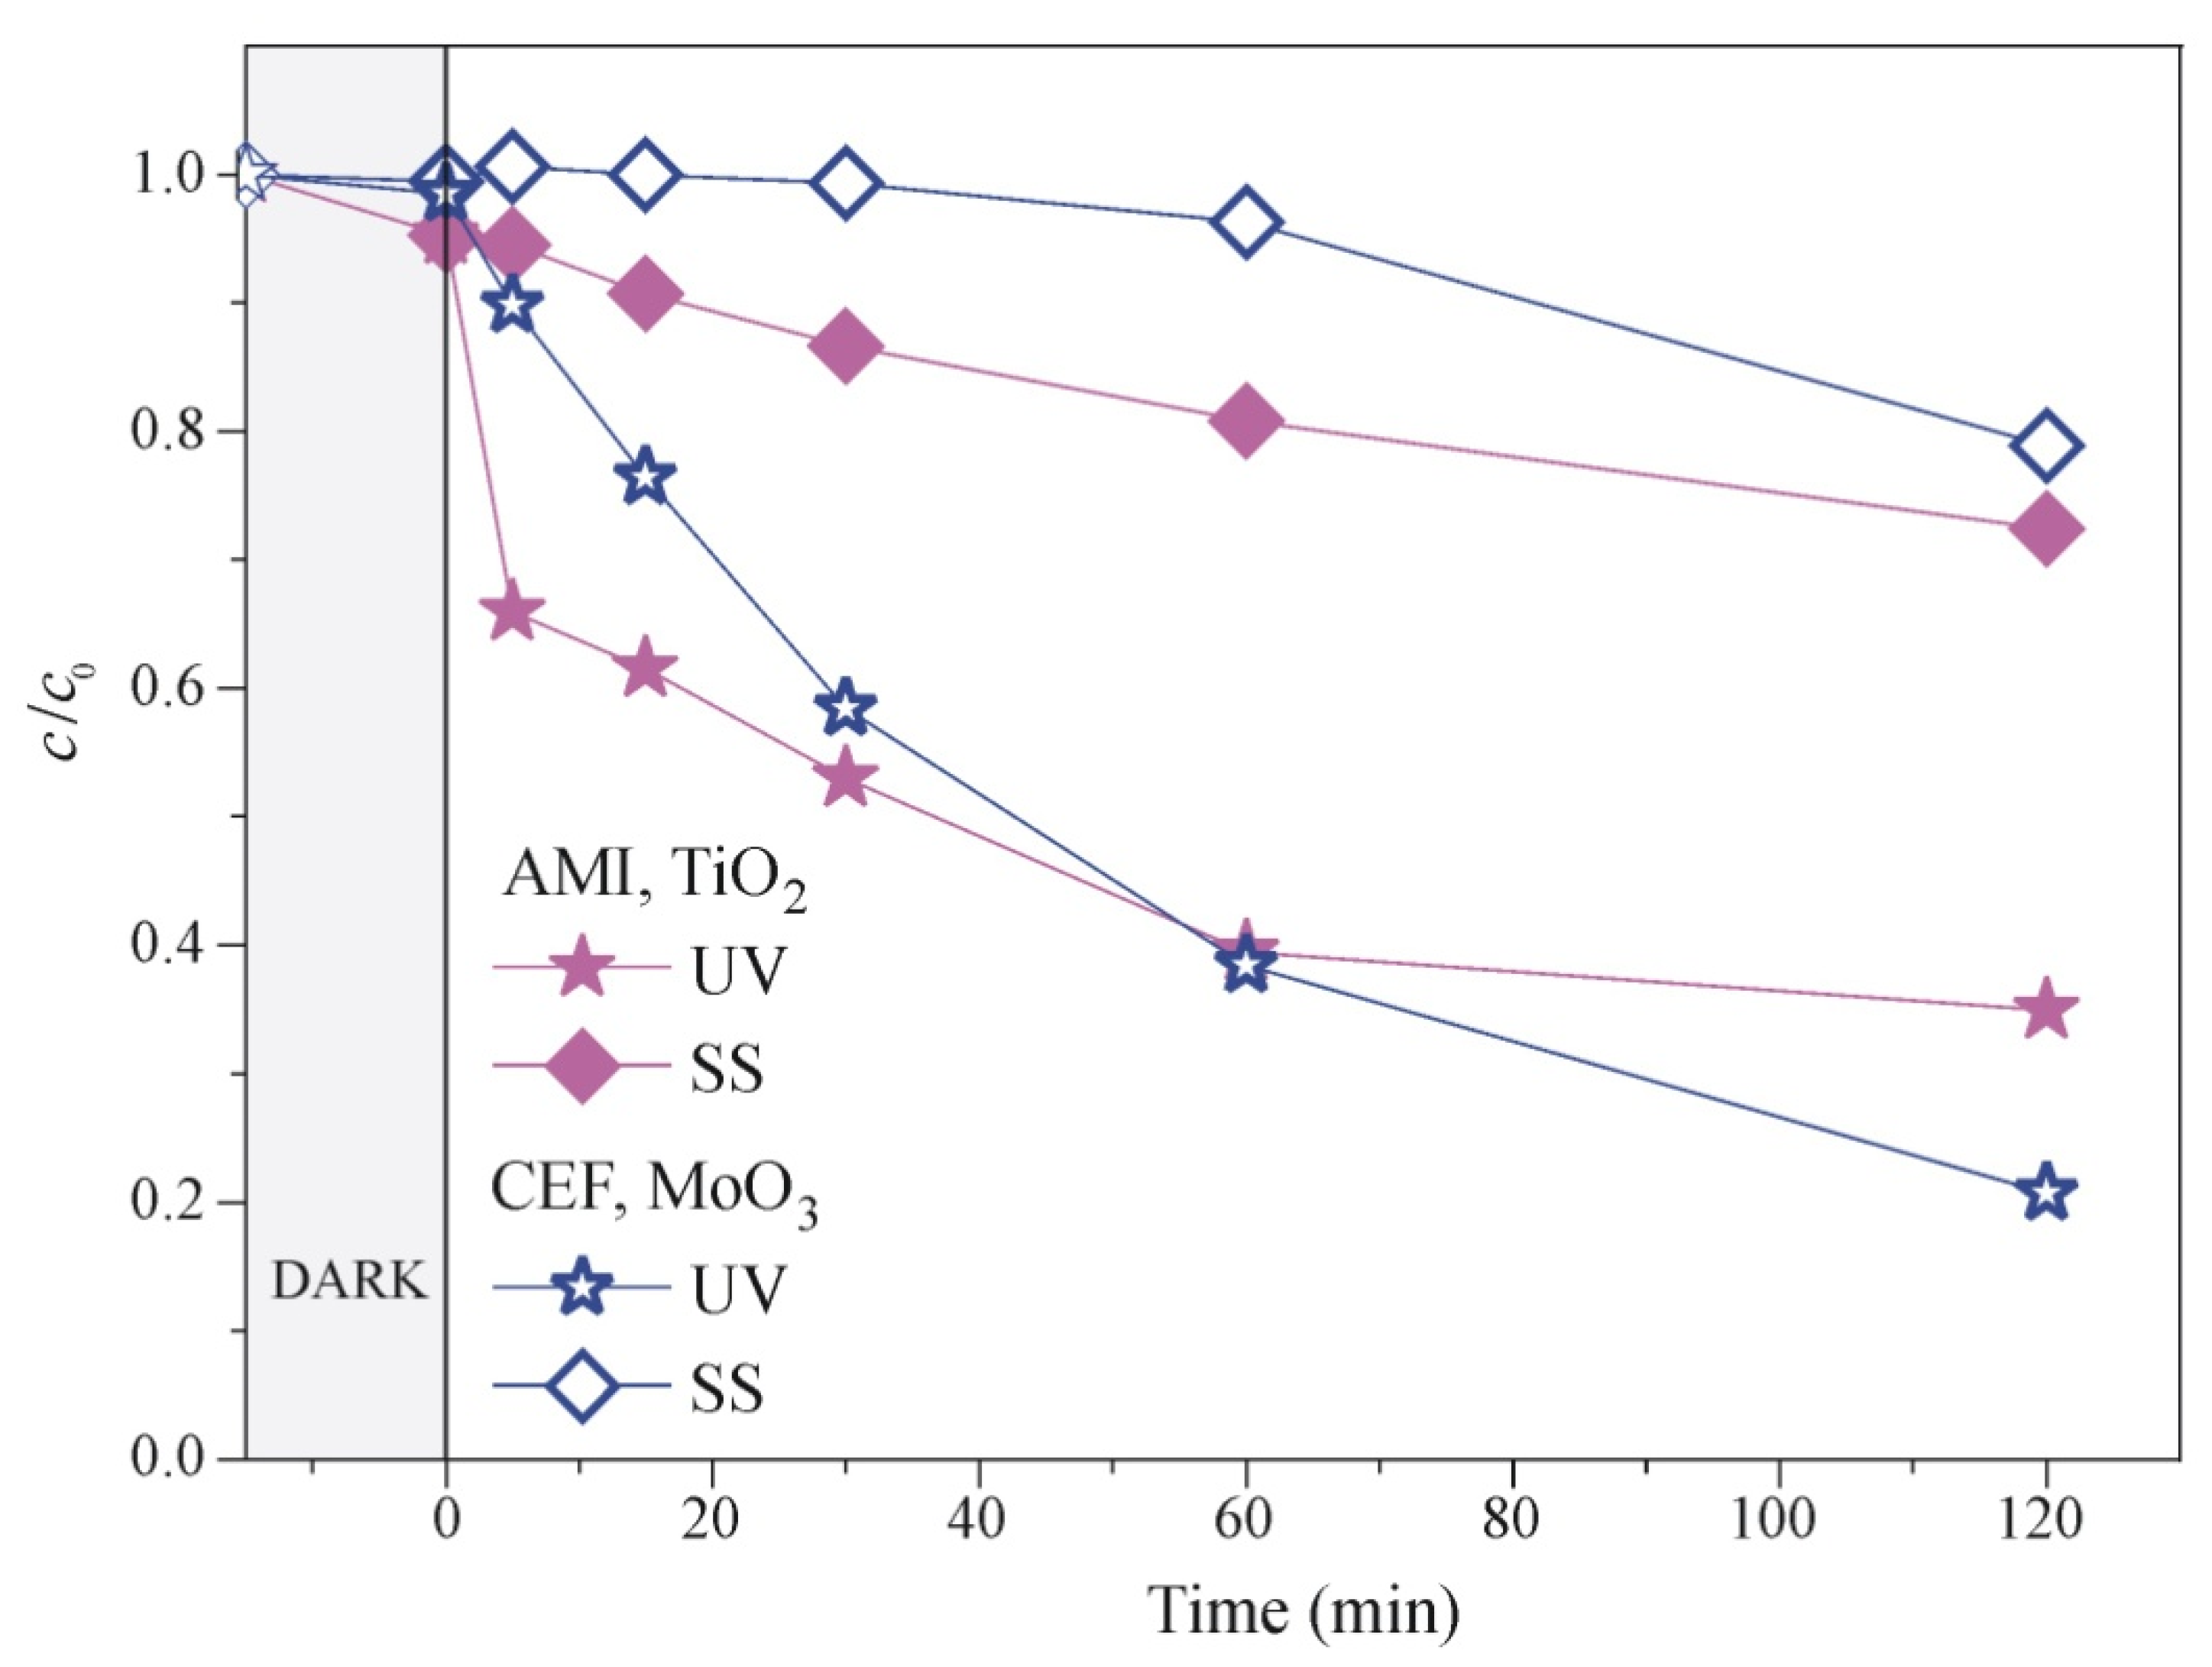
2.2. Application of Titanium/Molybdenum/Mixed-Oxides Catalysts for the Removal of Organic Water Contaminants

It is known that the pH value affects the adsorption efficiency of pollutants on the surface of powder photocatalysts, as the surface charge of the catalyst and the ionic form of the reactant cause greater or less electrostatic interactions between the reactant and the catalyst surface [37,38]. Due to the above-mentioned, the influence of pH on the adsorption of pesticides and pharmaceutically active compounds using photocatalysts TiO2, MoO3, and TMO was firstly investigated but also to establish conditions for separate investigation of adsorption and photocatalysis contributions in the removal of the selected organic pollutants in waters by using-TiO2, MoO3, and TMO. The tests were performed at three different pH values (Table 2) by stirring in the dark for 90 min. Each photocatalyst showed a different affinity for the adsorption of the tested compounds at different pH values.
The adsorption in the dark of suspension of QUI and MET on the surface of the tested catalysts (TiO2, MoO3, and TMO) after 90 min of stirring is almost independent of the examined pH values. Moreover, the adsorption of MET is negligible and insignificant, especially on the TMO catalyst surface, and is only 0.1%.
TEM adsorption affinity shows also moderate, mostly low, values. An exception that may be pointed out is the TEM adsorption by TiO2 at a natural pH (19.6%) and by MoO3 at pH ~ 9.0 (11.5%).
A significant increase in AMI adsorption on TiO2 was observed by a pH increase with the highest percentage at pH ~ 9 (74.5%). Similar results were obtained by Finčur et al. [39]. When MoO3 was applied after equilibration, the adsorption of AMI reached the highest rate of 52.9% at pH ~ 9. TMO has almost uniform values for adsorption efficiency in the case of AMI at all measured pH of an average of 50%.
As regarding the CEF, the highest adsorption of all was noticed in the case of TiO2 at natural pH 5.4 (91.6%) and pH adjusted to ~7 (91.0%), but when the pH value was increased to pH ~ 9, the adsorption efficiency of CEF on the TiO2 surface decreased to 43.1%. The adsorption of CEF using MoO3 and TMO was not so significant.
To summarize, a very high adsorption efficiency of TiO2 for CEF at a natural pH and pH ~ 7 and, for AMI at pH ~ 9 and, also, mid-efficiency of adsorption in the case of MoO3 for AMI at pH ~ 9 and of AMI in the presence of TMO at a natural pH and pH ~ 9, Table 2, are the facts to highlight, and these catalysts to be considered as good candidates for the successful CEF and AMI removal from water by an efficient two-step synergistic adsorption-photocatalytic degradation approach [40]. Moreover, such an approach was applied for the investigation of the TMO removal efficiency under different experimental conditions (pH and irradiation type) in the case of CIP, and the results are shown in Figure 6 and Figure 7.
The high efficiency of TMO was achieved under UV irradiation when around 90% of CIP was removed (Figure 6) in 75 min. TMO also showed an excellent removal efficiency under SS for CIP (Figure 6) when about 80%of CIP was removed, so an additional experiment was performed to establish the influence of pH on CIP degradation by TMO under SS (Figure 7), but only a small improvement, of a couple of percentages was achieved at pH 10.
Based on the adsorption efficiency assessment shown previously, and to investigate only the photocatalytic contribution to the removal of organic water pollutants, further tested compounds were the ones that showed the lowest affinity for adsorption in the dark at a selected pH (Table 2). Accordingly, the TMO material was selected for investigating the photocatalytic degradation of QUI, TEM, and MET; TiO2 for AMI degradation; and photocatalyst MoO3 for CEF (Figure 8 and Figure 9). As it can be seen, after 135 min of the process, 51.5% of QUI was removed from the aquatic suspension using UV irradiation, while only 6.3% was removed using SS (Figure 8). Findings also showed that the highest efficiency of TEM removal was reached under UV irradiation when 81.6% of the TEM was removed after 135 min (Figure 8). However, in the case of SS, 39.2% of the TEM was removed after the same time. Using a coupled catalyst, TMO, under UV light, the removal of MET was 36.2% after 135 min, while under the influence of SS, the TMO is not effective in the degradation of MET, i.e., only ~8% of MET was removed after 135 min.
Since TMO was proven to be the most efficient in TEM removal under UV irradiation, the reutilization study was tested for this system in three successive runs while keeping the experimental conditions unchanged. The obtained results showed that there was no loss of the photocatalytic capability of TMO. Hence, the mentioned photocatalyst showed a very stable activity after three runs. The removal efficiency after 135 min of process in each run was unchanged (~80%) and stayed effective after being investigated for three uses.
AMI, removal efficiency was investigated using a TiO2 catalyst at a pH of ~5 (Figure 9) when applying UV radiation after 135 min of the process 65.0% of AMI was removed by applying SS 27.6%. Since a very small percentage of adsorption after 15 min of stirring in the dark was observed, it is obvious that the dominant process in the removal of AMI using TiO2 as a catalyst at a natural pH is photocatalytic degradation.
Photocatalytic degradation of CEF under the influence of UV irradiation and SS presented in Figure 9 shows a 79.3% CEF removal under UV irradiation after 135 min. By applying SS, the degradation efficiency of CEF was significantly lower, as 21.1% of CEF was degraded.
Better removal efficiency using UV irradiation can be correlated to UV-Vis reflectivity results and estimated values of the catalysts’ optical absorption thresholds that just reach the Vis region, so when the reaction system is exposed to simulated sunlight, there is a smaller number of photons from the UV part of the spectrum, and thus, a smaller number of highly reactive species formed.

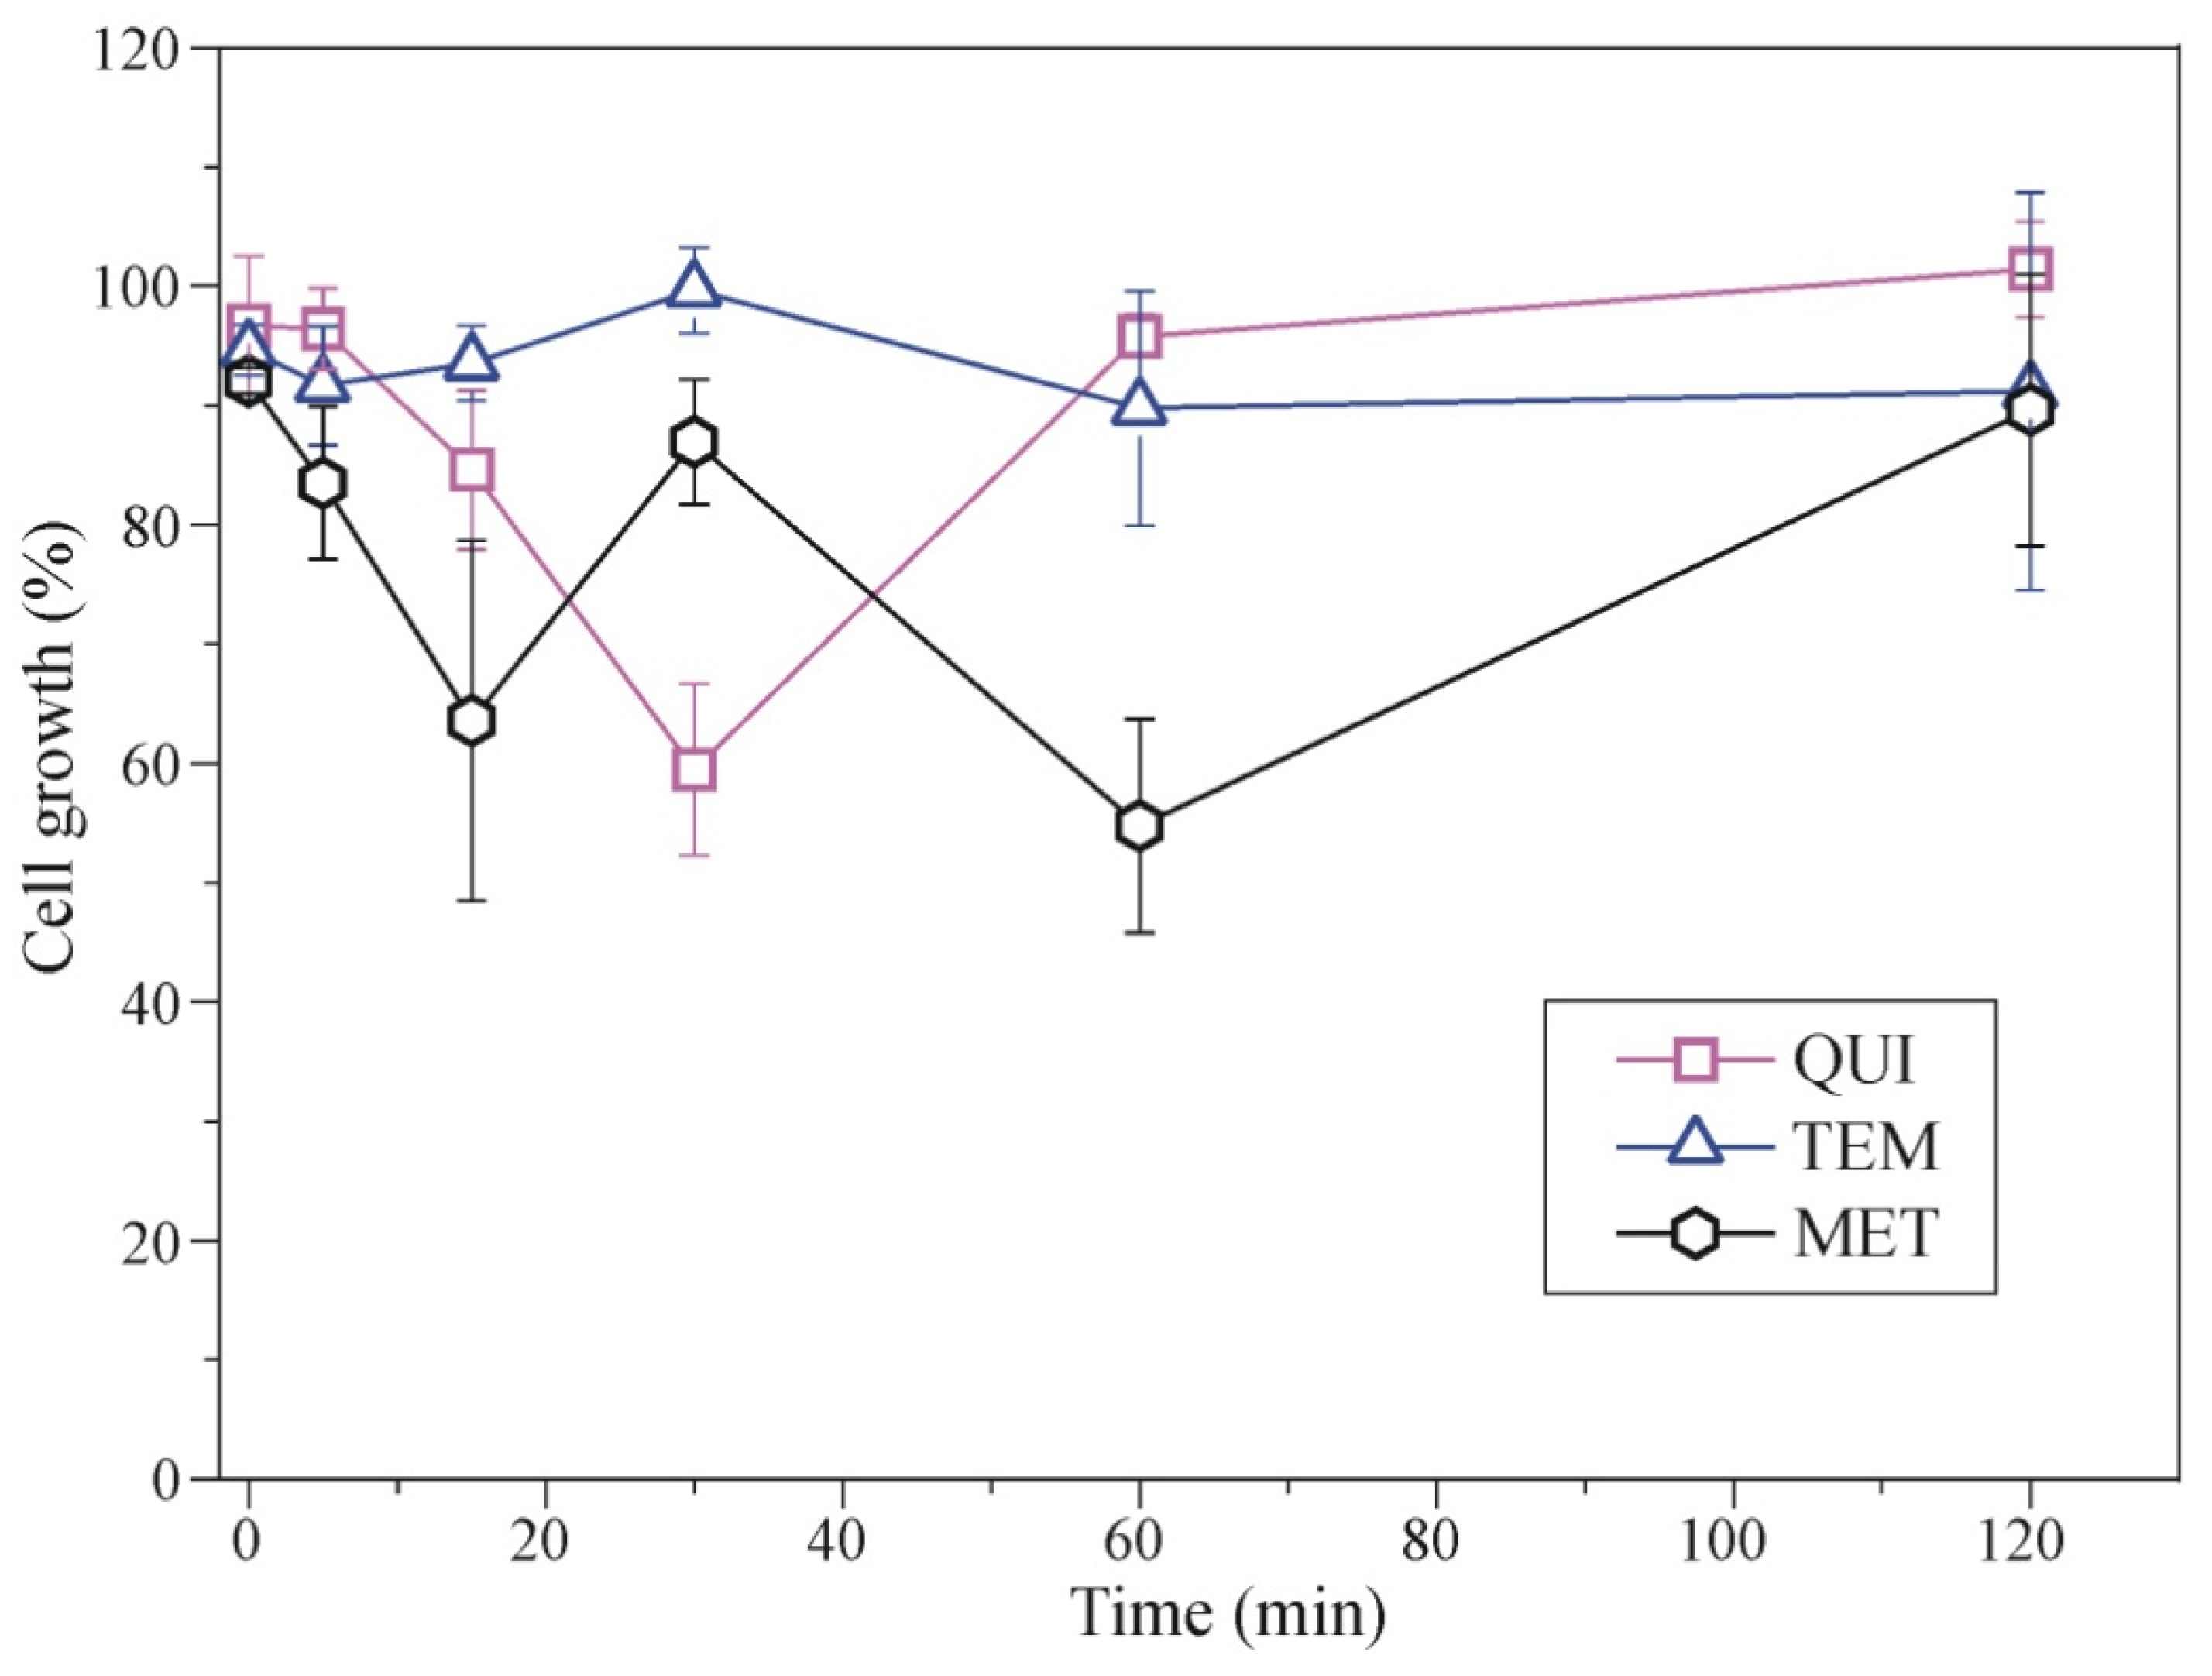
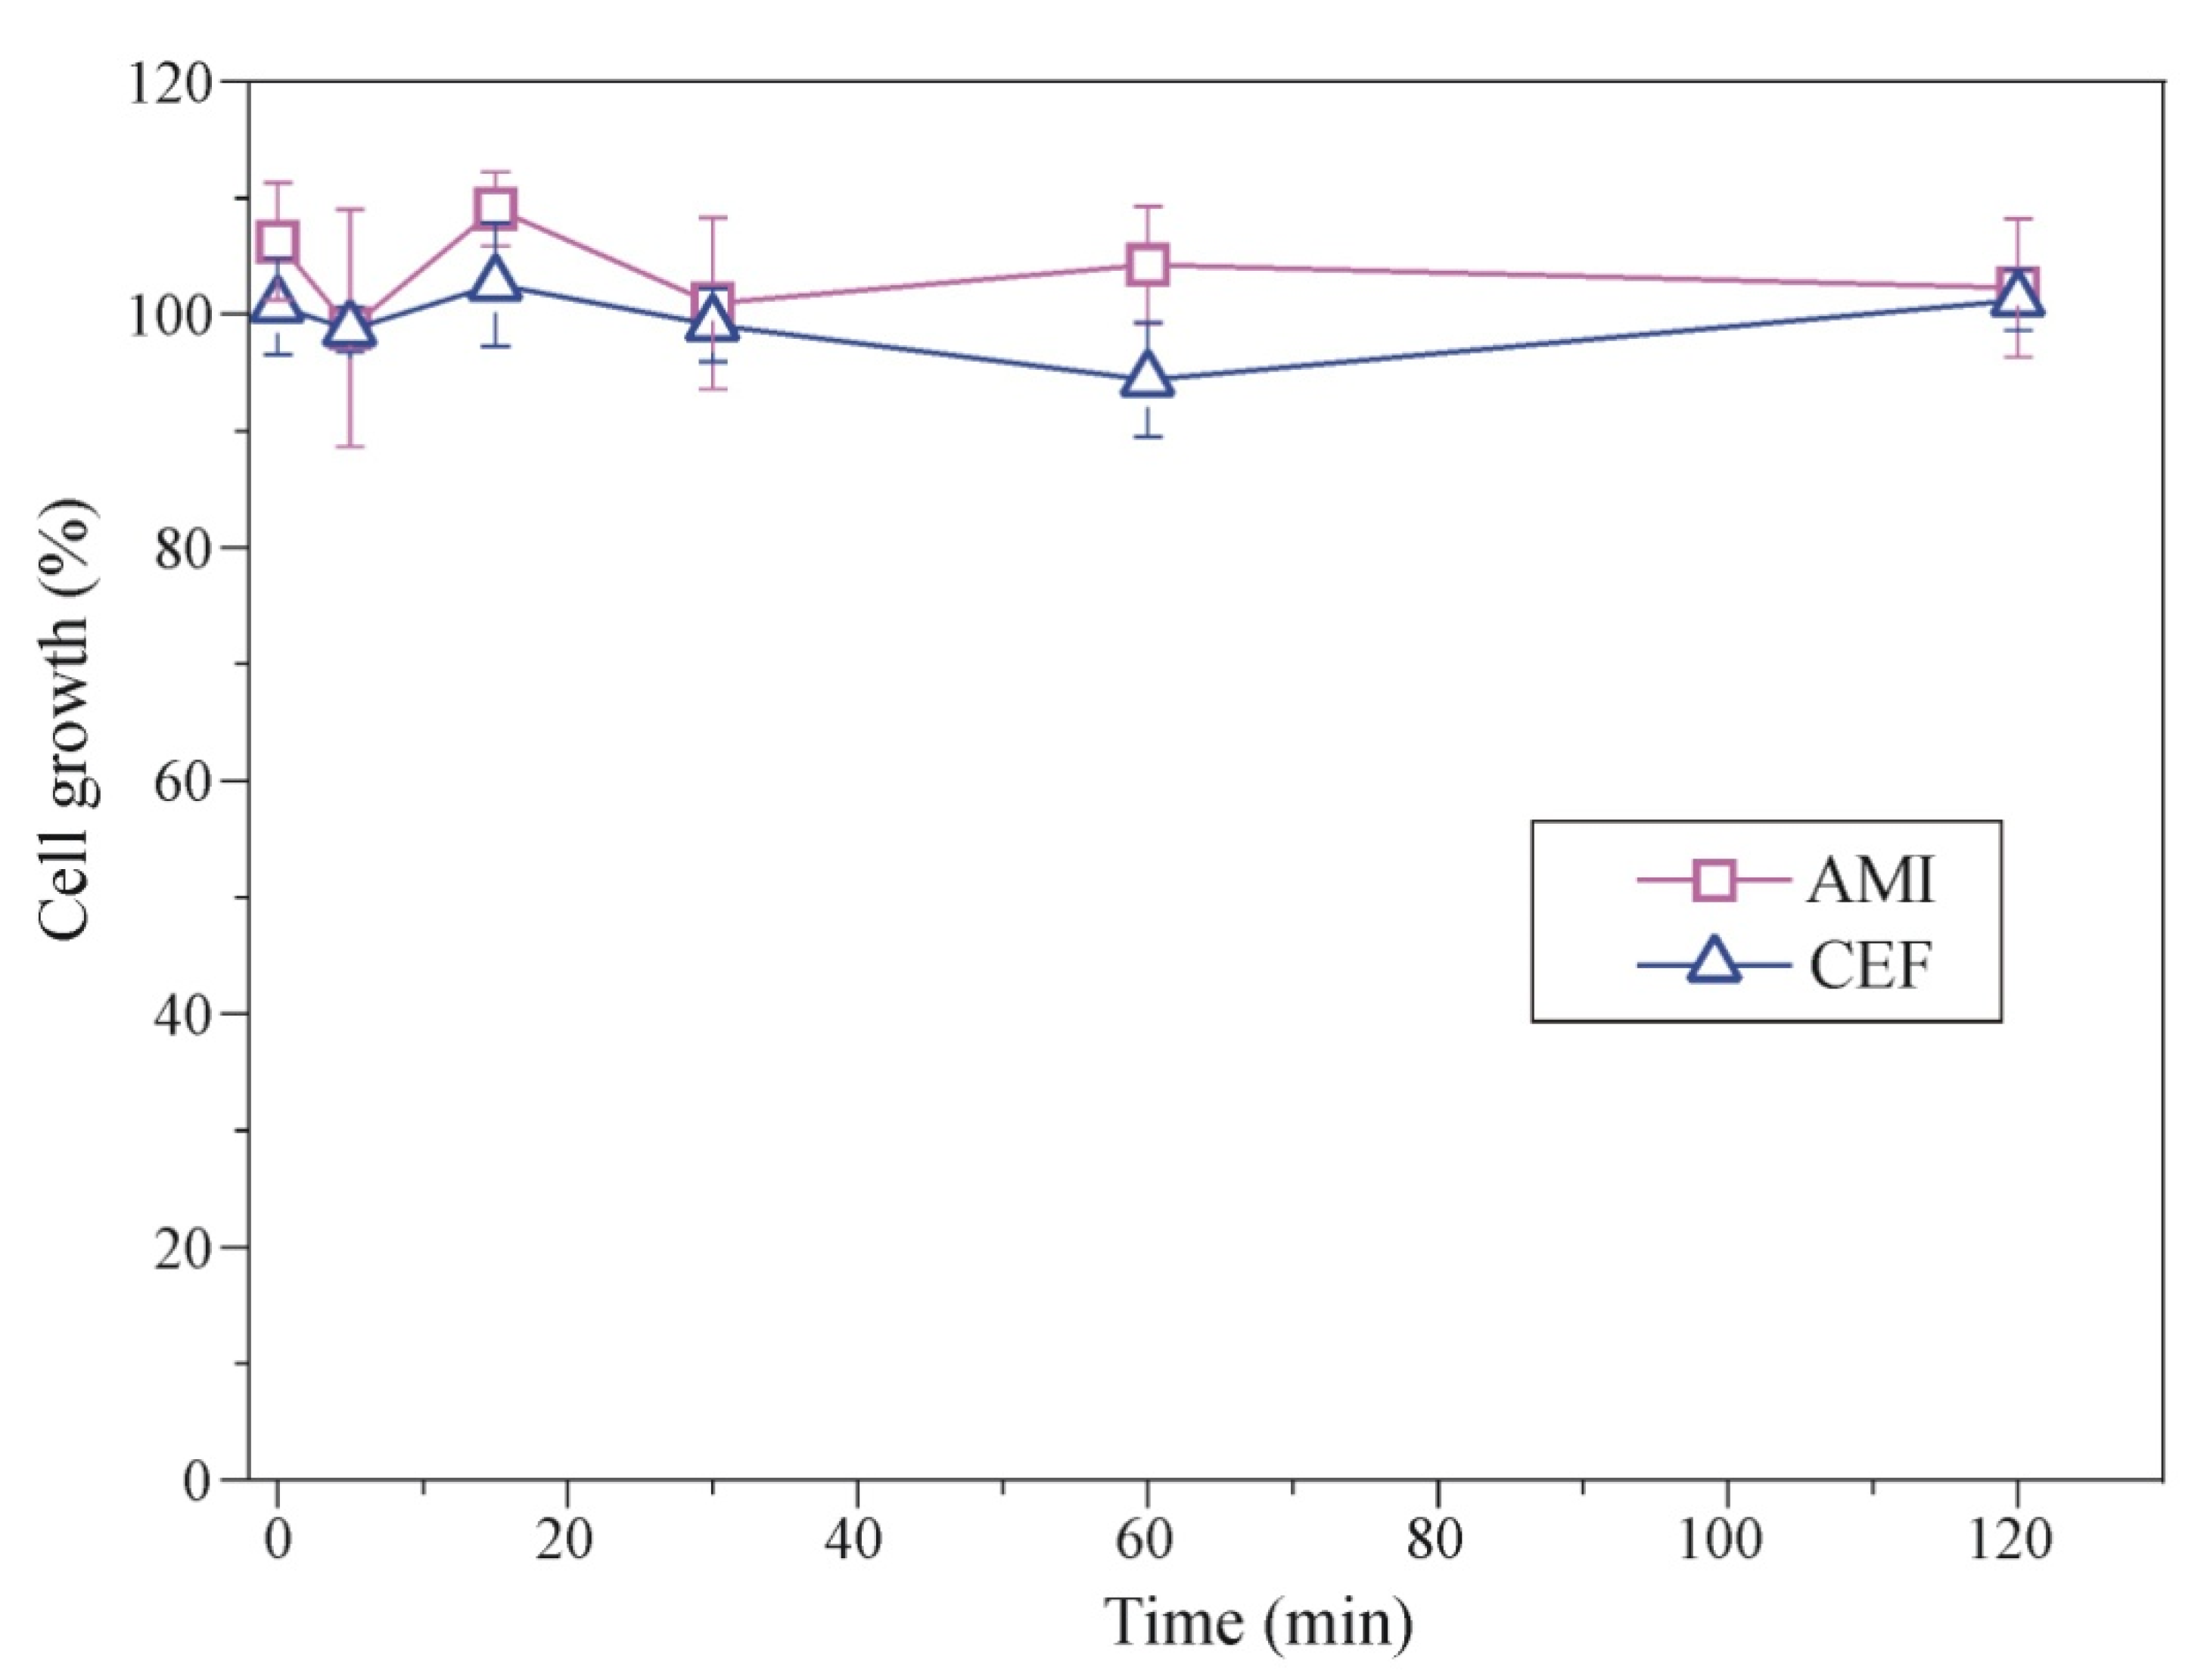
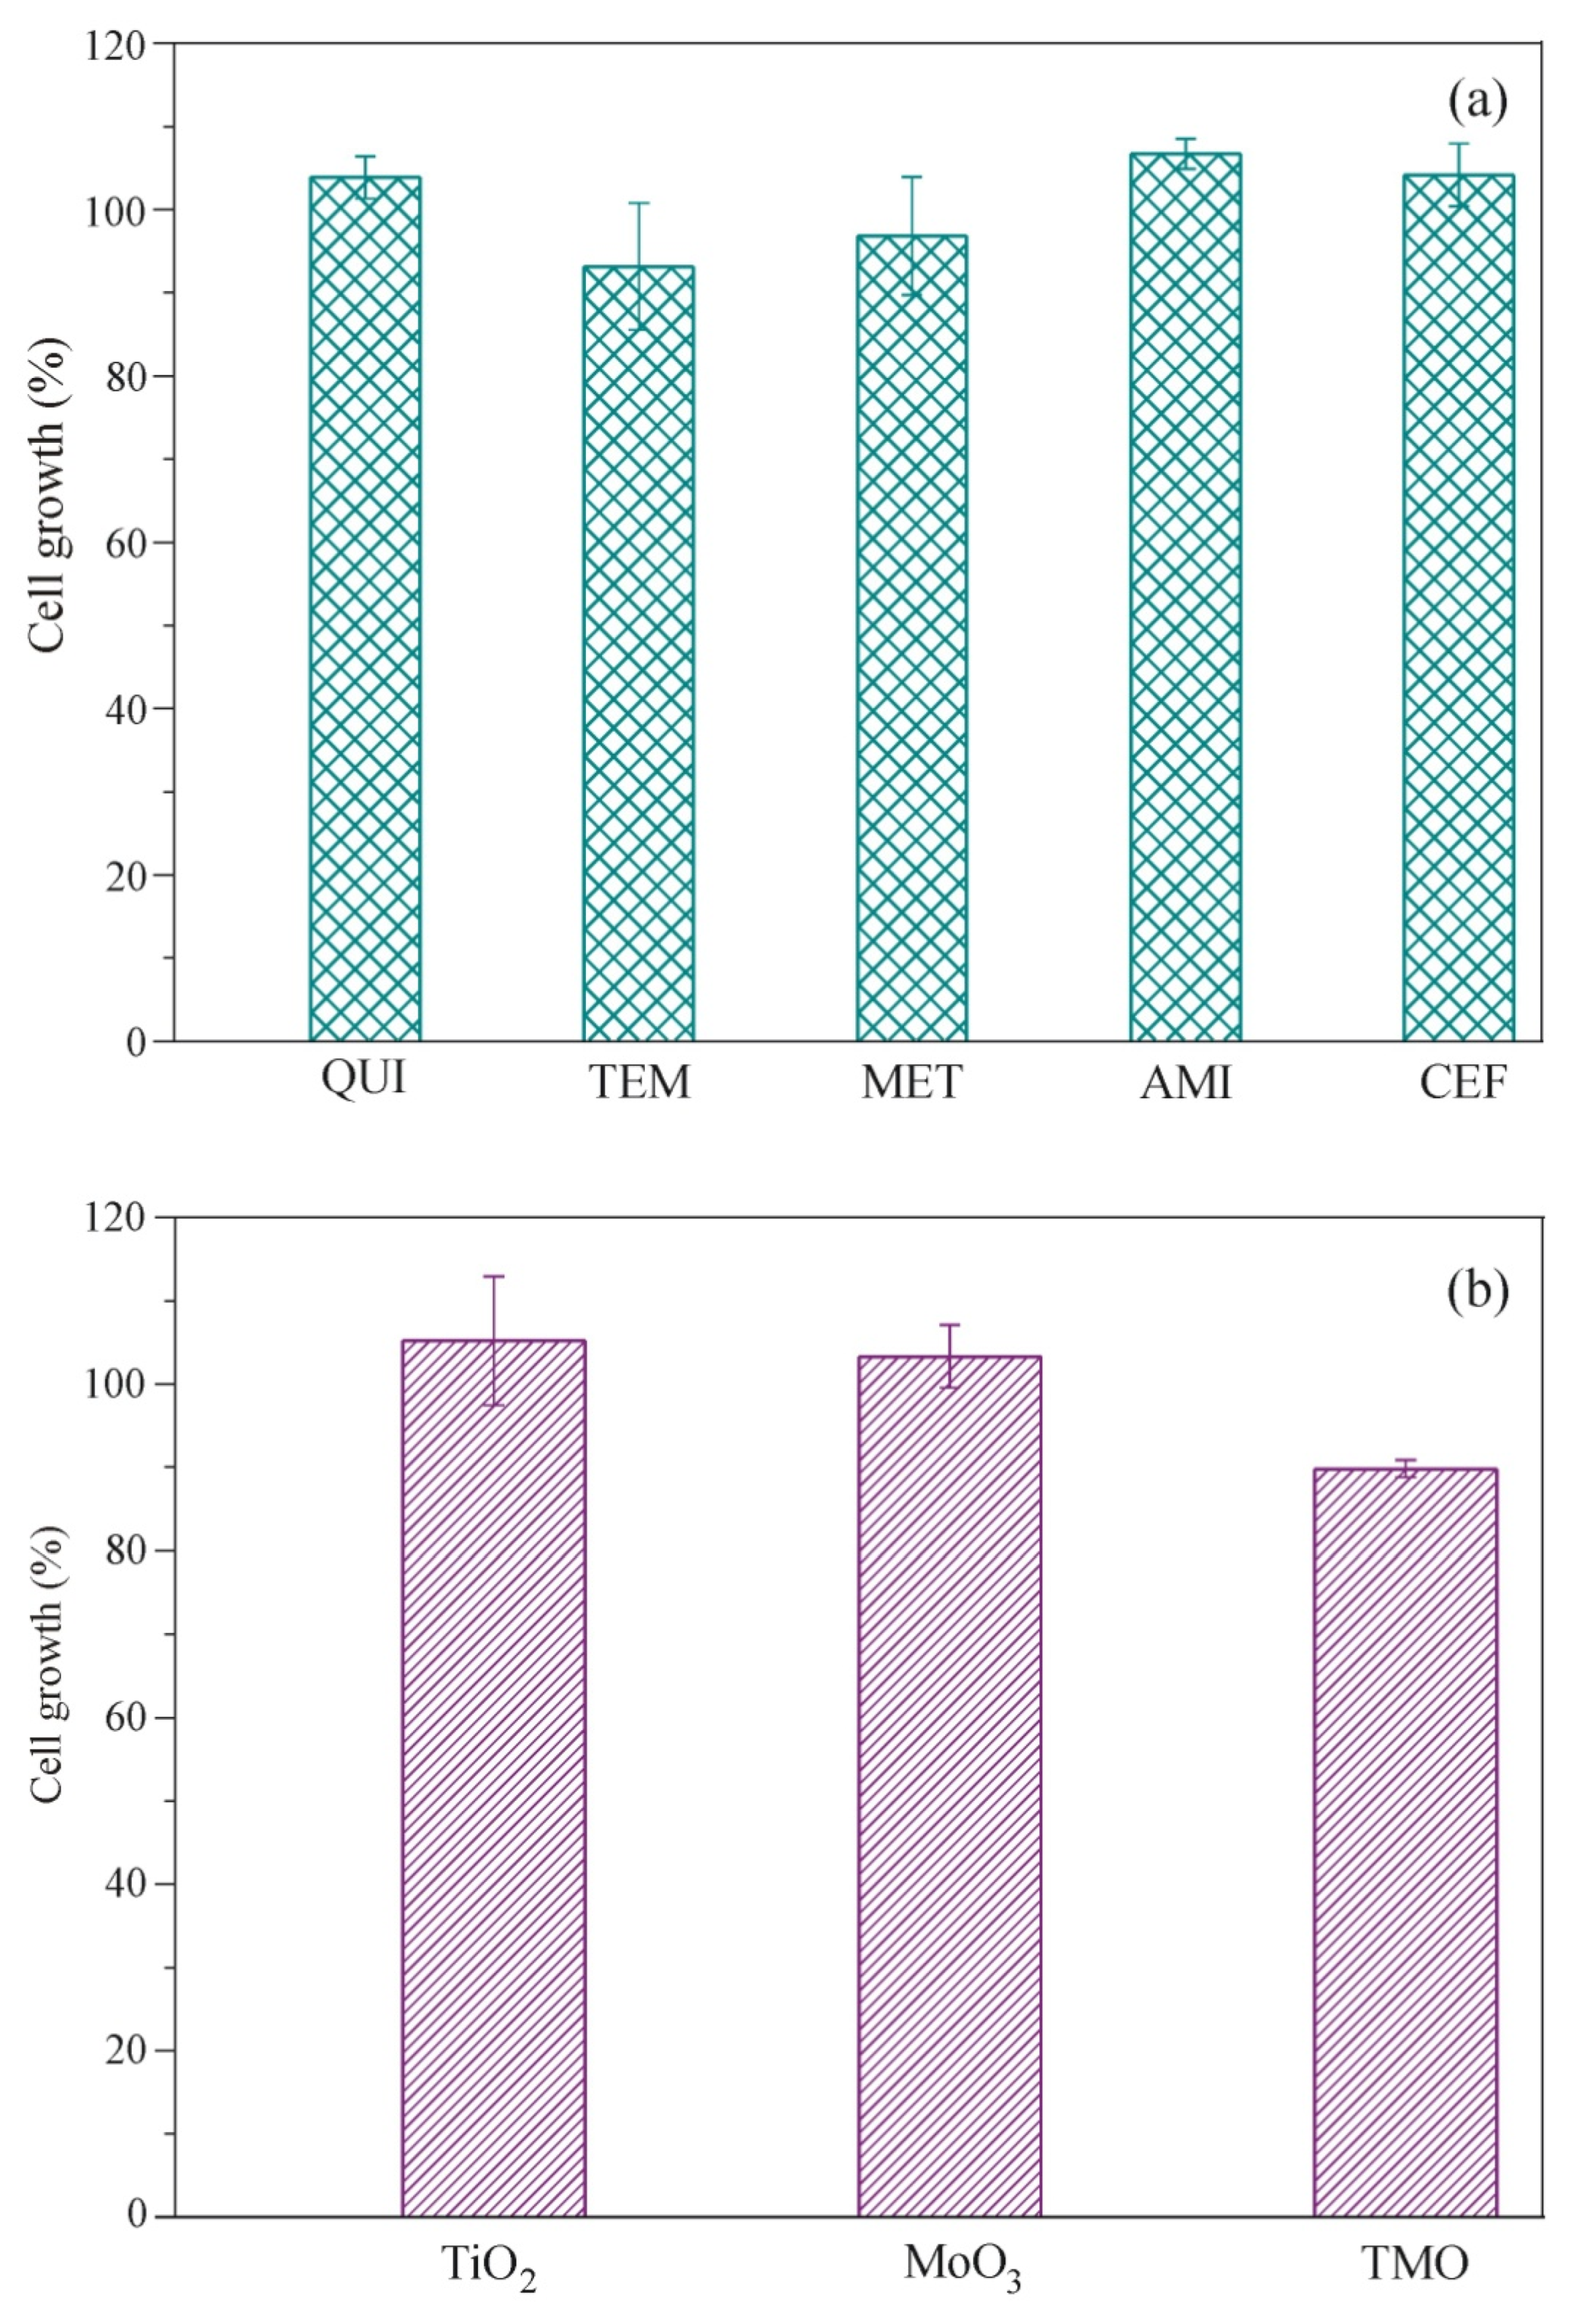
2.3. Cytotoxicity of Synthesized Catalysts, Selected Substrates, and Degradation Intermediates

Effects on the cell growth of QUI, TEM, and MET and their intermediates formed after different irradiation times and, using the TMO, showed high hepatotoxic effects, with cell growth inhibitions from 10% to 45% for all substrates—the highest being for MET after 60 min (45%), QUI after 30 min (40%), and TEM after 120 min (10%) of irradiation (Figure 10).
Effects of AMI and CEF, as well as their formed intermediates after different irradiation times and using TiO2 and MoO3, were at the level of the control, while, in the case of CEF, a mild hepatotoxic effect reaching 5% of growth inhibition was observed after 60 min of irradiation (Figure 11).
Cell growth effects of starting pesticides/pharmaceuticals solutions (Figure 12a) showed that TEM and MET had mild hepatotoxic effects (≤5%). Effects of aqueous suspension presented in Figure 12b showed that the effect of TiO2 and MoO3 on the growth of the H-4-II-E cell line was at the level of the control, while TMO was hepatotoxic (at levels ≤ 15%).

3. Materials and Methods

3.1. Catalysts Preparation and Characterization

TMO photocatalyst is prepared by the following four-step mixing-calcination solid-state method. Starting precursors (anatase TiO2 and MoO3, Sigma-Aldrich, St. Louis, MO, USA, purity 99.7%) are wet-milled by using the ball mill Retsch PM100, Haan, Germany in ethanol for 4 h, then dried in air for 24 h, annealed at 700 °C for 4 h, and finally were grind by using ceramic mortar and pestle for 10 min. The synthesis conditions are chosen from the previous works and results on similar heterojunction material systems [41,42,43]. X-ray diffraction (XRD) is carried out using a Philips PW 1050 instrument, Amsterdam, Netherlands with Cu Kα1,2 radiation, and a step scan mode of 0.02°/s in angular range 2θ = 10–70°, which enabled good profile fitting by using the Whole Powder Pattern Fitting (WPPF) Rietveld method. The morphology, microstructure, and elemental concentration were investigated by scanning electron microscopy (SEM, JEOL JSM 7001F, and JEOL JSM 6460LV equipped with an energy-dispersive spectrometer, EDS, Tokyo, Japan). UV-Vis optical spectroscopy (Ocean Optics QE65000, Dunedin, FL, USA) was used for reflectance measurements while the Raman measurements were performed by Renishaw confocal Raman microscope InviaTM, Gloucestershire, UK when the samples were excited with a 514-nm excitation line of an argon-ion laser and the beam focused by using a 50× objective. The Raman signal with a CCD camera over the frequency range of 100–1200 cm−1 was collected, and for each spectrum, the spectral resolution was 2 cm−1 and an accumulation time of 3 s.

3.2. Measurements of Photocatalytic Activity

The removal activity of the catalysts is evaluated by degradation of the aqueous solutions of 7-chloro-3-methylquinoline-8-carboxylic acid (QUI, 98.2%, Riedel-de Haën, Selzer, Germany), 2-(2-chloro-4-methylsulfonyl-3-(2,2,2-trifluoroethoxy)methyl)benzoyl cyclohexane-1,3-dione (TEM, 99.4%, Sigma-Aldrich), 1-[4-(2-methoxyethyl)phenoxy]-3-(propan-2-ylamino)propan-2-ol tartrate (2:1) (MET, ≥99%, Sigma-Aldrich), 3-(10,11-dihydro-5H-dibenzo[a,d][7]annulen-5-ylidene)-N,N-dimethylpropan-1-aminehydrochloride (AMI ≥ 98%, Sigma-Aldrich, St. Louis, MO, USA), l-cyclopropyl-6-fluoro-4-oxo-7-(piperazin-l-yl)-1,4-dihydroquinoline-3-carboxylic acid(CIP ≥ 99%, Sigma-Aldrich, St. Louis, MO, USA), and (6R,7R)-7-{[(2Z)-2-(2-amino-1,3-thiazol-4-yl)-2-methoxyiminoacetyl]amino}-3-[(2-methyl-5,6-dioxo-1H-1,2,4-triazin-3-yl)sulfanylmethyl]-8-oxo-5-thia-1-azabicyclo[4.2.0]oct-2-ene-2-carboxylic acid disodium salt hemiheptahydrate (CEF ≥ 99%, Sigma-Aldrich, St. Louis, MO, USA). The initial concentration of the investigated substrates was 0.05 mmol/dm3, and the catalyst loading was 1.0 mg/cm3. Firstly, the adsorption efficiency of catalysts was tested, and for all investigated substrates, it was measured during 90 min of stirring on a magnetic stirrer in the dark under three different pH values (under natural pH ~ 4–6 and set values ~ 7.0 and ~9.0). Selected systems (with the lowest adsorption) are stirred in the dark for 15 min to achieve adsorption–desorption equilibrium before irradiation. The photocatalytic experiments are performed in a cell made of Pyrex glass (total volume of ca. 40 cm3) with a plain window for the light beam focus, magnetic stirring bar, and the water-circulating jacket. Throughout the experiments, the suspensions are thermostated at 25 °C in an O2 stream (3.0 cm3/min) and illuminated by simulated sunlight (SS) using a 50 W halogen lamp (Philips), Amsterdam, Netherlands or by UV light using a 125 W high-pressure mercury lamp (Philips, HPL-N, emission bands in the UV region at 304, 314, 335, and 366 nm, and with maximum emission at 366 nm). Emission spectra of the UV and halogen lamp were described in our previous research [44]. The pH values of reaction mixtures were adjusted by the addition of a dilute aqueous solution of HClO4 (70%, Merck, Skopje, North Macedonia) or NaOH (Merck, Skopje, North Macedonia). Before measuring the removal efficiency of selected substrates by ultra-fast liquid chromatography with UV/Vis diode array detector (UFLC-DAD, Shimadzu, Nexera, Kyoto, Japan) after different time intervals of adsorption/degradation the samples are filtrated through a Millipore (Millex-GV, MA, USA, 0.22 μm) membrane filter to remove the photocatalyst from the aqueous solution. Appropriate aliquots were then taken and transferred into the vials for the UFLC-DAD analysis. The conditions in which the analysis was performed have been shown by Finčur et al. [45] for TEM measurements, by Armaković et al. [11] for MET analysis, by Ivetić et al. [41] for AMI, by Đačanin Far et al. [25] for CIP, and by Abramović et al. [46] for CEF measurements. Besides, conditions for QUI analysis were as follows: the mobile phase (flow rate 1.0 cm3/min) was a mixture of acetonitrile and 0.1% aqueous H3PO4 (5:5, v/v), and the UV/Vis DAD detector was set at 224 nm (wavelength of QUI maximum absorption).
The reutilization study of TMO in the removal efficiency of TEM (0.05 mmol/dm3) was performed with TMO loading of 1.0 mg/cm3 under UV irradiation. The reutilization was tested for three successive runs. After 135 min of process, suspension of TMO was kept overnight in the dark to achieve precipitation of the TMO particles. After that, the supernatant was removed and the photocatalyst was dried at 60 °C for 2 h, thereafter added to the fresh 0.05-mmol/dm3 TEM solution, and removal was carried out as previously described.

3.3. Cytotoxicity Evaluation

Assessment of the cytotoxic effect was performed using a rat hepatocarcinoma cell line (H-4-II-E, ATCC CRL-1548). The cell line was grown and prepared under the previously described procedure [47]. Aliquots of 2 cm3 suspensions of investigated substrates and their formed intermediates were taken at the beginning of the experiment and at different time points during the irradiation and filtered through membrane filters Millipore (Millex-GV, MA, USA, 0.22 μm). Reaction mixtures of pesticides/pharmaceuticals and formed intermediates (20 μL) were added to 180 μL of the culture medium with cells. The same volume (20 μL) of ultrapure water was added to the control wells. Thus, the final concentration of all starting substrates was 5 μmol/dm3. The blank tests were performed using pure pesticides/pharmaceuticals solution, as well as an aqueous suspension of catalyst (without substrate), that were also filtered through membrane filters. Cell growth was evaluated by the colorimetric SRB assay by Skehan et al. [48], which was modified by Četojević-Simin et al. [49].

4. Conclusions

In this paper, we report the removal efficiency of the selected pesticides (QUI and TEM) and pharmaceutically active compounds (MET, AMI, CIP, and CEF) by using new titanium/molybdenum/mixed-oxides for photocatalysis under the UV/Vis irradiation. A new TiO2/MoO3photocatalyst was prepared using a simple, low-cost mechanochemical solid-state method. Morphology of the prepared TMO showed the overlapping of the constituent particles, agglomeration, and formation of the contact type heterojunctions. Here, we report the TMO optical bandgap of 3.26 eV for the indirect-allowed transitions. Additionally, based on the obtained results, each semiconductor photocatalyst showed a different adsorption affinity for tested compounds (pharmaceuticals and pesticides) that was pH-dependent. QUI and MET showed a very low affinity for adsorption unlike the others investigated substrates. The starting TiO2 anatase showed the highest adsorption of CEF at natural pH (91.6%) and pH ~ 7 (91.0%), as well as adsorption of AMI at pH ~ 9 (77.5%). MoO3 is mid-efficient in AMI adsorption (52.6%) at pH ~ 9, while similar adsorption efficiency of AMI was reached for the TMO at natural pH (50.5%) and pH ~ 9 (56.7%). In general, the higher removal efficiency was observed using UV irradiation in comparison to simulated sunlight, for all substrates, but a very good result was obtained under SS for CIP removal (80%) by TMO and using synergic adsorption/photocatalytic approach. The cell growth of rat hepatoma was mildly affected by the mixture of investigated substrates and formed intermediates obtained using selected photocatalysts under UV irradiation, but the exception was the TMO mixture with QUI and MET when much higher sensitivity was obtained.

Author Contributions

Conceptualization, T.B.I. and N.L.F.; methodology, T.B.I., N.L.F. and D.D.Č.-S.; validation, T.B.I., N.L.F., D.V.Š.M., V.N.D., S.J.A., M.M.U., S.I.B., N.J.Z. and D.D.Č.-S.; formal analysis, T.B.I., N.L.F., S.J.A., M.M.U., S.I.B., N.J.Z. and D.D.Č.-S.; synthesis and characterization, T.B.I.; investigation, N.L.F., S.J.A., M.M.U., S.I.B., N.J.Z. and D.D.Č.-S.; data curation, T.B.I., N.L.F., V.N.D., S.J.A., M.M.U., S.I.B., N.J.Z. and D.D.Č.-S.; writing—original draft preparation, T.B.I., N.L.F., D.V.Š.M., V.N.D., S.J.A., M.M.U., S.I.B., N.J.Z. and D.D.Č.-S.; writing—review and editing, T.B.I., N.L.F., D.V.Š.M., D.D.Č.-S., S.R.L.-P. and B.F.A.; supervision, T.B.I. All authors have read and agreed to the published version of the manuscript.

Funding

This research was funded by the Ministry of Education, Science and Technological Development of the Republic of Serbia, grant number 451-03-9/2021-14/200125.

Data Availability Statement

The authors declare that the raw data supporting the findings and conclusions of this research are available from the corresponding author upon request.

Acknowledgments

The first author (Tamara Ivetić) acknowledge the support of the German Academic Exchange Service (DAAD) Funding program of Research Stays for University Academics and Scientists in 2018 (ID No. 57381327), and especially thanks Lothar Wondraczek from the Otto Schott Institute of Materials Research (OSIM) of the Friedrich Schiller University of Jena, Germany for his hospitality during her research stay funded by DAAD, and for an opportunity to use the state-of-the-art experimental equipment available at OSIM. The authors also thank Omar Benzine for Raman and Claudia Siedler for SEM measurements, from the Otto Schott Institute of Materials Research of the Friedrich Schiller University of Jena, Germany.

Conflicts of Interest

The authors declare no conflict of interest. The funders had no role in the design of the study; in the collection, analyses, or interpretation of data; in the writing of the manuscript; or in the decision to publish the results.

References

  1. Odling, G.; Robertson, N. Bridging the gap between laboratory and application in photocatalytic water purification. Catal. Sci. Technol. 2019, 9, 533–545. [Google Scholar] [CrossRef] [Green Version]
  2. Belenguer, V.; Martinez-Capela, F.; Masiá, A.; Picó, Y. Patterns of presence and concentration of pesticides in fish and waters of the Júcar River (Eastern Spain). J. Hazard. Mater. 2014, 265, 271–279. [Google Scholar] [CrossRef] [PubMed] [Green Version]
  3. Radović, T.; Grujić, S.; Petković, A.; Dimkić, M.; Laušević, M. Determination of pharmaceuticals and pesticides in river sediments and corresponding surface and ground water in the Danube River and tributaries in Serbia. Environ. Monit. Assess. 2015, 187, 4092. [Google Scholar] [CrossRef] [PubMed]
  4. Grossmann, K.; Scheltrup, F. On the mode of action of the new, selective herbicide quinmerac. In Proceedings of the Brighton Crop Protection Conference–Weeds, Brighton, UK, 20–23 November 1995; Volume 1, pp. 393–398. [Google Scholar]
  5. EFSA. Conclusion on the peer review of the pesticide risk assessment of the active substance quinmerac. EFSA J. 2010, 8, 1523. [Google Scholar]
  6. Calvayrac, C.; Bontemps, N.; Bissoue-Nouga, A.; Romdhane, S.; Coste, C.-M.; Cooper, J.-F. Photolysis of tembotrione and its main by-products under extreme artificial conditions: Comparison with another β-triketone herbicide. Sci. Total Environ. 2013, 452–453, 227–232. [Google Scholar] [CrossRef]
  7. Tawk, T.; Deborde, M.; Labanowski, J.; Gallard, H. Chlorination of the β-triketone herbicides tembotrione and sulcotrione: Kinetic and mechanistic study, transformation products identification and toxicity. Water Res. 2015, 76, 132–142. [Google Scholar] [CrossRef]
  8. Solis, R.R.; Javier Rivas, F.; Gimeno, O. Removal of aqueous metazachlor, tembotrione, tritosulfuron and ethofumesate by heterogeneous monopersulfate decomposition on lanthanum-cobalt perovskites. Appl. Catal. B Environ. 2017, 200, 83–92. [Google Scholar] [CrossRef]
  9. Van den Brandhof, E.-J.; Montforts, M. Fish embryo toxicity of carbamazepine, diclofenac and metoprolol. Ecotoxicol. Environ. Saf. 2010, 73, 1862–1866. [Google Scholar] [CrossRef]
  10. Deblonde, T.; Cossu-Leguille, C.; Hartemann, P. Emerging pollutants in wastewater: A review of the literature. Int. J. Hyg. Environ. Health 2011, 214, 442–448. [Google Scholar] [CrossRef]
  11. Armaković, S.J.; Grujić-Brojčin, M.; Šćepanović, M.; Armaković, S.; Golubović, A.; Babić, B.; Abramović, B.F. Efficiency of La-doped TiO2 calcined at different temperatures in photocatalytic degradation of β-blockers. Arab. J. Chem. 2019, 12, 5355–5369. [Google Scholar] [CrossRef]
  12. Abbar, J.C.; Lamani, S.D.; Nandibewoor, S.T. Ruthenium(III) Catalyzed oxidative degradation of amitriptyline-a tricyclic antidepressant drug by permanganate in aqueous acidic medium. J. Solut. Chem. 2011, 40, 502–520. [Google Scholar] [CrossRef]
  13. Togola, A.; Budzinski, H. Multi-residue analysis of pharmaceutical compounds in aqueous samples. J. Chromatogr. A 2008, 1177, 150–158. [Google Scholar] [CrossRef]
  14. Vystavna, Y.; Huneau, F.; Grynenko, V.; Vergeles, Y.; Celle-Jeanton, H.; Tapie, N.; Budzinski, H.; Le Coustumer, P. Pharmaceuticals in rivers of two regions with contrasted socio-economic conditions: Occurrence, accumulation, and comparison for Ukraine and France. Water Air Soil Pollut. 2012, 223, 2111–2124. [Google Scholar] [CrossRef]
  15. Lajeunesse, A.; Smyth, S.A.; Barclay, K.; Sauvé, S.; Gagnon, C. Distribution of antidepressant residues in wastewater and biosolids following different treatment processes by municipal wastewater treatment plants in Canada. Water Res. 2012, 46, 5600–5612. [Google Scholar] [CrossRef]
  16. Thakur, D.; Sharma, A.; Awasthi, A.; Singh Rana, D.; Singh, D.; Pandey, S.; Thakur, S. Manganese-doped zinc oxide nanostructures as potential scaffold for photocatalytic and fluorescence sensing applications. Chemosensors 2020, 8, 120. [Google Scholar] [CrossRef]
  17. Shurbaji, S.; Huong, P.T.; Altahtamouni, T.M. Review on the visible light photocatalysis for the decomposition of ciprofloxacine, norfloxacine, tetracyclines, and sulfonamines antibiotics in wastewater. Catalysts 2021, 11, 437. [Google Scholar] [CrossRef]
  18. Puddoo, H.; Nithyanandam, R.; Nguyenhuynh, T. Degradation of the antibiotic ceftriaxone by fenton oxidation process and compound analysis. J. Phys. Sci. 2017, 28, 95–114. [Google Scholar] [CrossRef] [Green Version]
  19. Opris, O.; Soran, M.-L.; Coman, V.; Copaciu, F.; Ristoiu, D. Determination of some frequently used antibiotics in waste waters using solid phase extraction followed by high performance liquid chromatography with diode array and mass spectrometry detection. Cent. Eur. J. Chem. 2013, 11, 1343–1351. [Google Scholar] [CrossRef]
  20. Diwan, V.; Tamhankar, A.J.; Aggarwal, M.; Sen, S.; Khandal, R.K.; Lundborg, C.S. Detection of antibiotics in hospital effluents in India. Curr. Sci. 2009, 97, 1752–1755. [Google Scholar]
  21. Yu, X.; Tang, X.; Zuo, J.; Zhang, M.; Chen, L.; Li, Z. Distribution and persistence of cephalosporins in cephalosporin producing wastewater using SPE and UPLC–MS/MS method. Sci. Total Environ. 2016, 569–570, 23–30. [Google Scholar] [CrossRef]
  22. Fayal, T.; Razzaq, A.; Javed, F.; Hafeez, A.; Rashid, N.; Amjad, U.S.; Rehman, M.S.U.; Faisal, A.; Rehman, F. Integrating adsorption and photocatalysis: A cost effective strategy for textile wastewater treatment using hybrid biochar-TiO2 composite. J. Hazard. Mater. 2020, 390, 121623. [Google Scholar]
  23. Loeb, S.K.; Alvarez, P.J.J.; Brame, J.A.; Cates, E.L.; Choi, W.; Crittenden, J.; Dionysiou, D.D.; Li, Q.; Li-Puma, G.; Quan, X.; et al. The technology horizon for photocatalytic water treatment: Sunrise or sunset? Environ. Sci. Technol. 2019, 53, 2937–2947. [Google Scholar] [CrossRef] [PubMed]
  24. Fosso-Kankeu, E.; Panday, S.; Sinha Ray, S. Photocatalysis in Advanced Oxidation Processes for Wastewater Treatment; John Wiley & Sons: New York, NY, USA, 2020; Volume 1, p. 320. [Google Scholar]
  25. Đačanin Far, L.R.; Finčur, N.L.; Ivetić, T.B.; Abramović, B.F.; Štrbac, D.; Bosak, O.; Lukić-Petrović, S.R. Synthesis, characterization, and photocatalytic activity of lithium-indium oxide and its possible improvement by molybdenum-doping. Rom. J. Phys. 2020, 65, 601. [Google Scholar]
  26. Neon, M.H.K.; Islam, M.S. MoO3 and Ag co-synthesized TiO2 as a novel heterogeneous photocatalyst with enhanced visible-light-driven photocatalytic activity for methyl orange dye degradation. Environ. Nanotech. Monit. Manag. 2019, 12, 100244. [Google Scholar]
  27. Yang, K.; Li, X.; Yu, C.; Zeng, D.; Chen, F.; Zhang, K.; Huang, W.; Ji, H. Review on heterophase/homophase junctions for efficient photocatalysis: The case of phase transition construction. Chin. J. Catal. 2019, 40, 796–818. [Google Scholar] [CrossRef]
  28. Chen, Y.; Zhu, G.; Hojamberdiev, M.; Gao, J.; Zhu, R.; Wang, C.; Wei, X.; Liu, P. Three-dimensional Ag2O/Bi5O7I p-n heterojunction photocatalyst harnessing UV-vis-NIR broad spectrum for photodegradation of organic pollutants. J. Hazard. Mater. 2018, 344, 42–54. [Google Scholar] [CrossRef]
  29. Fiorenza, R.; Bellardita, M.; Balsamo, S.A.; Spitaleri, L.; Guliano, A.; Condorelli, M.; D’Urso, L.; Scire, S.; Palmisano, L. A solar photothermocatalytic approach for the CO2 conversion: Investigation of different synergisms on CuO-CuO/brookite TiO2-CeO2 catalysts. Chem. Eng. J. 2021, 428, 131249. [Google Scholar] [CrossRef]
  30. Yang, H.; Li, X.; Wang, A.; Wang, Y.; Chen, Y. Photocatalytic degradation of methylene blue by MoO3 modified TiO2 under visible light. Chin. J. Catal. 2014, 35, 140–147. [Google Scholar] [CrossRef]
  31. Liu, H.; Lv, T.; Zhu, C.; Zhu, Z. Direct bandgap narrowing of TiO2/MoO3 heterostructure composites for enhanced solar-driven photocatalytic activity. Sol. Energy Mater. Sol. C 2016, 153, 1–8. [Google Scholar] [CrossRef] [Green Version]
  32. Hanaor, D.A.H.; Sorrell, C.C. Review of the anatase to rutile phase transformation. J. Mater. Sci. 2011, 46, 855–874. [Google Scholar] [CrossRef] [Green Version]
  33. Frank, O.; Zukaiova, M.; Laskova, B.; Kürti, J.; Koltai, J.; Kavan, L. Raman spectra of titanium dioxide (anatase, rutile) with identified oxygen isotopes (16, 17, 18). Phys. Chem. Chem. Phys. 2012, 14, 14567–14572. [Google Scholar] [CrossRef]
  34. Joya, M.R.; Alfonso, J.E.; Moreno, L.C. Photoluminescence and raman studies of α-MoO3 doped with erbium and neodymium. Curr. Sci. 2019, 116, 1690–1695. [Google Scholar] [CrossRef]
  35. Diaz-Droguett, D.E.; El Far, R.; Fuenzalide, V.M.; Cabrera, A.L. In situ-Raman studies on thermally induced structural changes of porous MoO3 prepared in vapor phase under He and H2. Mater. Chem. Phys. 2012, 134, 631–638. [Google Scholar] [CrossRef]
  36. Kroumova, E.; Aroyo, M.I.; Perez Mato, J.M.; Kirov, A.; Capillas, C.; Ivantchev, S.; Wondratschek, H. Bilbao Crystallographic Server: Useful databases and tools for phase transitions studies. Phase Transit. 2003, 76, 155–170. [Google Scholar] [CrossRef]
  37. Malato, S.; Fernández-Ibáñez, P.; Maldonado, M.I.; Blanco, J.; Gernjak, W. Decontamination and disinfection of water by solar photocatalysis: Recent overview and trends. Catal. Today 2009, 147, 1–59. [Google Scholar] [CrossRef]
  38. Abramović, B.F.; Despotović, V.N.; Šojić, D.V.; Orčić, D.Z.; Csanádi, J.J.; Četojević-Simin, D.D. Photocatalytic degradation of the herbicide clomazone in natural water using TiO2: Kinetics, mechanism, and toxicity of degradation products. Chemosphere 2013, 93, 166–171. [Google Scholar] [CrossRef] [PubMed]
  39. Finčur, N.L.; Šćepanović, M.J.; Grujić-Brojčin, M.; Abramović, B.F.; Krstić, J.B.; Kremenović, A.; Srećković, T.; Golubović, A. Adsorption and degradation of some psychiatric drugs by sol-gel synthesized titania-based photocatalysts: Influence of tungsten and sodium content. Sol-Gel Sci. Technol. 2019, 90, 510–524. [Google Scholar] [CrossRef]
  40. Liu, W.; He, T.; Wang, Y.; Ning, G.; Xu, Z.; Chen, X.; Hu, X.; Wu, Y.; Zhao, Y. Synergistic adsorption-photocatalytic degradation effect and norfoxacin mechanism of ZnO/ZnS@BC under UV-light irradiation. Sci. Rep. 2020, 10, 11903. [Google Scholar] [CrossRef] [PubMed]
  41. Ivetić, T.B.; Finčur, N.L.; Abramović, B.F.; Dimitrievska, M.; Štrbac, G.R.; Čajko, K.O.; Miljević, B.B.; Đačanin, L.R.; Lukić-Petrović, S.R. Environmentally friendly photoactive heterojunction zinc tin oxide nanoparticles. Ceram. Int. 2016, 42, 3575–3583. [Google Scholar] [CrossRef]
  42. Ivetić, T.B.; Finčur, N.L.; Đačanin, L.R.; Abramović, B.F.; Lukić-Petrović, S.R. Ternary and coupled binary zinc tin oxide nanopowders: Synthesis, characterization, and potential application in photocatalytic processes. Mater. Res. Bull. 2015, 62, 114–121. [Google Scholar] [CrossRef]
  43. Ivetić, T.; Finčur, N.; Miljević, B.; Đačanin Far, L.; Lukić-Petrović, S.; Abramović, B. Indium-zinc-oxide nanocrystallites: Preparation, properties and visible-light-generated photocatalytic efficiency in degradation of psychoactive drugs from water systems. Rom. J. Phys. 2018, 63, 608. [Google Scholar]
  44. Banić, N.D.; Šojić, D.V.; Krstić, J.B.; Abramović, B.F. Photodegradation of neonicotinoid active ingredients and their commercial formulations in water by different advanced oxidation processes. Water Air Soil Pollut. 2014, 225, 1954. [Google Scholar] [CrossRef]
  45. Finčur, N.; Sfirloaga, P.; Putnik, P.; Despotović, V.; Lazarević, M.; Uzelac, M.; Abramović, B.; Vlazan, P.; Ianasi, C.; Alapi, T.; et al. Removal of emerging pollutants from water using environmentally friendly processes: Photocatalysts preparation, characterization, intermediates identification and toxicity assessment. Nanomaterials 2021, 11, 215. [Google Scholar] [CrossRef] [PubMed]
  46. Abramović, B.F.; Uzelac, M.M.; Armaković, S.J.; Gašić, U.; Četojević-Simin, D.D.; Armaković, S. Experimental and computational study of hydrolysis and photolysis of antibiotic ceftriaxone: Degradation kinetics, pathways, and toxicity. Sci. Total Environ. 2021, 768, 144991. [Google Scholar] [CrossRef]
  47. Četojević-Simin, D.D.; Armaković, S.J.; Šojić, D.V.; Abramović, B.F. Toxicity assessment of metoprolol and its photodegradation mixtures obtained by using different type of TiO2 catalysts in the mammalian cell lines. Sci. Total Environ. 2013, 463–464, 968–974. [Google Scholar] [CrossRef]
  48. Skehan, S.; Storeng, R.; Scudiero, D.; Monks, A.; McMahon, J.; Vistica, D.; Warren, J.T.; Bokesch, H.; Kenney, S.; Boyd, M.R. New colorimetric cytotoxicity assay for anticancer-drug screening. J. Natl. Cancer Inst. 1990, 82, 1107–1112. [Google Scholar] [CrossRef]
  49. Cetojevic-Simin, D.D.; Bogdanovic, G.M.; Cvetkovic, D.D.; Velicanski, A.S. Antiproliferative and antimicrobial activity of traditional Kombucha and Satureja montana L. Kombucha. J. BUON 2008, 13, 395–401. [Google Scholar]
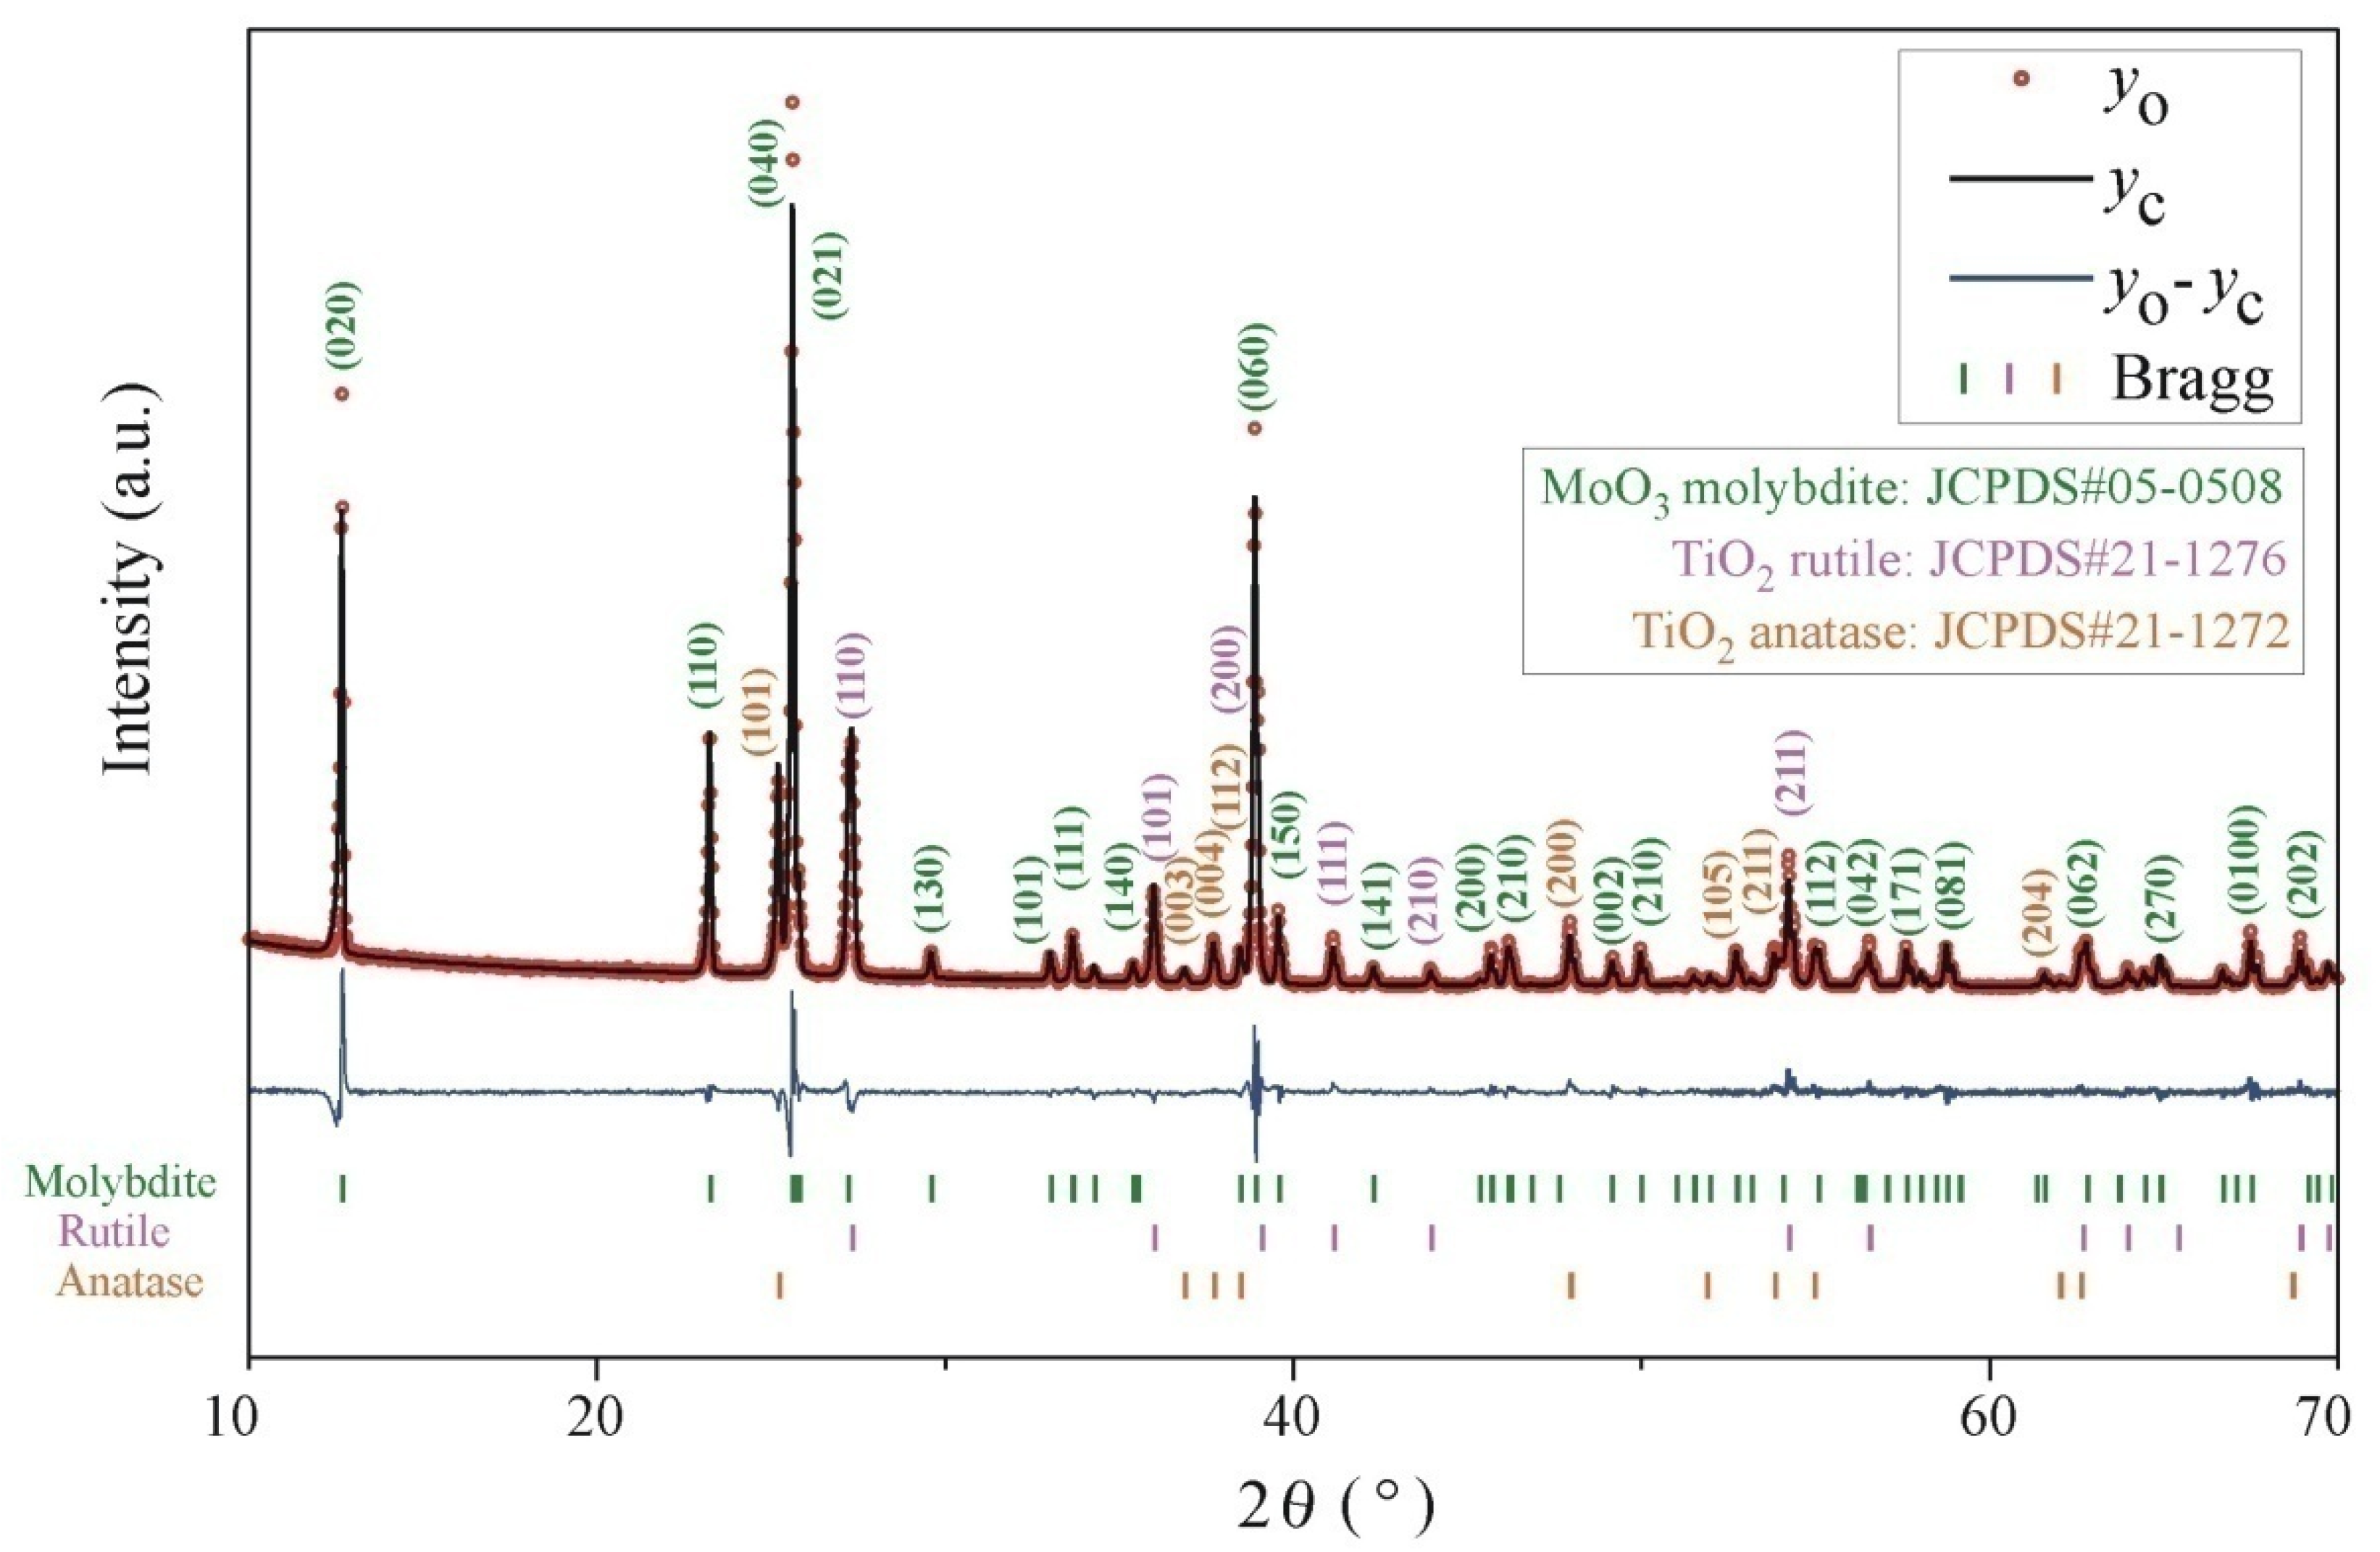
Figure 1. XRD pattern (the empty red dots) of TMO along with the Rietveld refinement profile (the solid black line) and the expected Bragg peak positions (the green, purple, and orange vertical bars) of the present phases. The blue curve shows the difference between the experimental and fitted results.
Catalysts 11 01054 g001
Figure 2. Raman spectra of the starting powders of anatase TiO2 (black line) and MoO3 (red line) and prepared TMO (blue line). The asterisk (*) shows the Eg and A1g vibration modes of the rutile TiO2 structure.
Catalysts 11 01054 g002
Figure 3. SEM images of starting (anatase TiO2 and MoO3) powders and TMO with the same magnifications (left images: ×650, and right images: ×1800) for a better comparison.
Catalysts 11 01054 g003
Figure 4. SEM images of TMO with higher magnifications (up to ×100,000) (a,b) energy-dispersive X-ray spectroscopy (EDS) spectra of four specific TMO surface areas chosen by SEM imagingat ×5000 magnification (upper left SEM image in (a), framed blue).
Catalysts 11 01054 g004
Figure 5. The (F(R)⋅hν)1/2 vs. photon energy (hν) plot of anatase TiO2 (black solid line), MoO3 (red solid line), and TMO (blue solid line).
Catalysts 11 01054 g005
Figure 6. Effect of radiation type on the efficiency of CIP (0.05 mmol/dm3) removal using a TMO (1.0 mg/cm3) photocatalyst without pH setting (pH 5.5).
Catalysts 11 01054 g006
Figure 7. Influence of pH on the removal efficiency of CIP (0.05 mmol/dm3) using TMO (1.0 mg/cm3) under SS.
Catalysts 11 01054 g007
Figure 8. Effect of radiation type on the efficiency of QUI, TEM, and MET (0.05 mmol/dm3) removal using the TMO (1.0 mg/cm3) photocatalyst at pH ~ 4–6.
Catalysts 11 01054 g008
Figure 9. Effect of radiation type on the AMI and CEF (0.05 mmol/dm3) removal using TiO2 and MoO3 (1.0 mg/cm3) photocatalysts, respectively, at a natural pH.
Catalysts 11 01054 g009
Figure 10. Effect of reaction mixtures of QUI, TEM, and MET (0.05 mmol/dm3) using TMO (1.0 mg/cm3) and formed intermediates after different irradiation times on the growth of the H-4-II-E cell line.
Catalysts 11 01054 g010
Figure 11. Effect of reaction mixtures of AMI (0.05 mmol/dm3) using TiO2 (1.0 mg/cm3) and CEF (0.05 mmol/dm3) using MoO3 (1.0 mg/cm3) and formed intermediates after different irradiation times on the growth of the H-4-II-E cell line.
Catalysts 11 01054 g011
Figure 12. Effects of pesticides/pharmaceuticals solutions (0.05 mmol/dm3) (a) and aqueous suspension of TiO2, MoO3, and TMO (1.0 mg/cm3) after filtration (b) on the growth of the H-4-II-E cell line.
Catalysts 11 01054 g012
Table 1. Rietveld refinement results of the TMO.
ParametersTiO2 RutileTiO2 AnataseMoO3 Molybdite
Space groupP42/mnm (136)I41/amd (141)Pbnm (62)
% wt.36.824.638.6
a (Å)4.59303.78413.9608
b (Å)4.59303.784113.8459
c (Å)2.95779.50843.6972
Cell volume (Å3)62.396136.153202.759
Crystallite size (nm)2142211462
Strain (%)0.0030.0860.042
Evaluation values 1: RWP = 9.73%; Rp = 7.16%; Re = 4.15%; Chi^2 = 5.49.
1 Conventional Rietveld R-factors.
Table 2. Percentage of pollutants (0.05 mmol/dm3) adsorption after reaching adsorption–desorption equilibrium on the catalyst surface (1.0 mg/cm3) after 90 min of stirring in the dark.
Catalyst TypepH ValuePollutant Type
QUITEMMETAMICEF
TiO2~4–52.319.60.79.291.6
~72.15.21.644.891.0
~92.21.31.574.543.1
MoO3~5–63.06.60.818.10.8
~73.17.60.219.11.7
~93.911.51.352.913.2
TMO~4–62.01.10.150.52.0
~71.86.90.141.813.5
~91.96.50.256.716.6
Publisher’s Note: MDPI stays neutral with regard to jurisdictional claims in published maps and institutional affiliations.

