Article

Solvothermal Crystallization of Ag/AgxO-AgCl Composites: Effect of Different Chloride Sources/Shape-Tailoring Agents

1
Department of Applied and Environmental Chemistry, Faculty of Science and Informatics, University of Szeged, Rerrich Béla Sqr. 1, HU-6720 Szeged, Hungary
2
Nanostructured Materials and Bio-Nano-Interfaces Center, Interdisciplinary Research Institute on Bio-Nano-Sciences, Babeș-Bolyai University, Treboniu Laurian Str. 42, RO-400271 Cluj-Napoca, Romania
3
Department of Chemistry, Amity Institute of Applied Sciences, Amity University, Sector-125, Noida 201313, Uttar Pradesh, India
4
Faculty of Physics, Babeș-Bolyai University, M. Kogălniceanu Str. 1, RO-400084 Cluj-Napoca, Romania
5
Institute of Research-Development-Innovation in Applied Natural Sciences, Babes-Bolyai University, Fântânele Str. 30, RO-400294 Cluj-Napoca, Romania
6
Institute of Physical Metallurgy, Metal Forming and Nanotechnology, University of Miskolc, Miskolc-Egyetemváros, HU-3515 Miskolc, Hungary
*
Authors to whom correspondence should be addressed.
Catalysts 2021, 11(3), 379; https://doi.org/10.3390/catal11030379
Submission received: 4 February 2021 / Revised: 9 March 2021 / Accepted: 9 March 2021 / Published: 15 March 2021

Abstract

:
In the present work, AgCl microcrystals were obtained by solvothermal crystallization to investigate the effect of H+, Na+, K+, and different shape-tailoring agents (non-ionic: polyvinylpyrrolidone vs. anionic: sodium dodecyl sulfate) on the textural and photocatalytic properties of the samples. The crystallization process resulted in secondary products, such as AgxO or Ag, AgClO3, AgClO4, which were further transformed during the photocatalytic tests. The most efficient photocatalyst (assessed for methyl orange degradation) was synthesized using HCl, as a chloride source and polyvinylpyrrolidone, as a shape-tailoring agent. Therefore, the ability of polyvinylpyrrolidone to enhance the photocatalytic activity was also investigated, and it was found that the addition of 0.6 g polyvinylpyrrolidone resulted in the most efficient photocatalyst. Moreover, AgxO, being a charge separator, could play a critical role in the photocatalytic process, while reversibly transforming to Ag back and forth.

Graphical Abstract

1. Introduction

The increasing interest in the use of silver-based materials is not surprising due to their advantageous properties, such as strong optical absorption, narrow band gap energy [1], high quantum efficiency, and enhanced photochemical properties [2] (especially photoluminescence [1]). These compounds can be used in several applications, such as sensors [3], photocatalytic H2 production [4], organic pollutant degradation [5], and antibacterial applications [6].
The most investigated Ag-based semiconductors include Ag2O [7], Ag2S [4,5], AgX (X = Cl [8], Br [9], I [10]), Ag3PO4 [11] and Ag2CO3 [12]. Unfortunately, the photostability of these materials is an issue that must be dealt with, as the photodeposition of Ag nanoparticles may occur on the surface of the main catalyst, that is, the silver-based material [13]. However, these nanoparticles can increase the stability of Ag-based semiconductors against further (photo)corrosion [14].
Silver chloride (AgCl) is a well-known material in photography [15], electrochemistry [16], and it is also used in photocatalytic processes [17]. Despite its relatively wide band gap energy (3.25 eV [18]/ultraviolet (UV) active), it is widely used as a photocatalyst, as several studies showed that it can be excited by visible light as well. A suitable way to achieve that is to make composites with other materials (e.g., noble metals [19] or other semiconductors). Noble metal nanoparticles deposited on the surface of a semiconductor can decrease the band gap energy of UV-active semiconductors (e.g., Ag/TiO2 [19], Ag/ZnO [20]) due to the localized surface plasmon resonance (LSPR) effect of the noble metal or the Schottky barrier between the metal and semiconductor [21]. The main differences between the two phenomena are as follows:
  • the presence of LSPR facilitates the utilization of visible light by the plasmonic effect of the Ag nanoparticles that gives rise to an electronic absorption signal in this spectral domain [21];
  • the Schottky barrier effect occurs when an electron is quickly moving from the semiconductor to the noble metal, often leading to the favorable change of the Fermi level in terms of photocatalytic efficiency [22].
Moreover, due to the low photostability of AgCl, Ag nanoparticles can appear on the surface of AgCl samples in which both LSPR and Schottky barrier are present. Ag nanoparticles on the surface of AgCl particles can appear during the synthesis or spontaneously under light irradiation. Tian et al. [14] claimed that the presence of Ag nanoparticles is mandatory for the operational stability of AgCl.
The photocatalytic activity of AgCl is often influenced by the morphology of the particles; therefore, it is not surprising that several synthesis approaches (e.g., hydrothermal synthesis method [23]; in situ oxidation strategy [24]; direct-precipitation method [25]) were used to obtain this semiconductor. The morphology can also be controlled using different additives (e.g., polymers [23]). Polyvinylpyrrolidone (PVP) is among the well-known polymers (used as a non-ionic shape-tailoring agent), which was used in several procedures to form different morphologies (e.g., nanoframes [17], nanospheres [26], cube-like structures [18]). Guo et al. [23] showed that the additives/stabilizers (such as cetyltrimethylammonium chloride or PVP) could significantly affect the catalyst’s photoactivity. To the best of our knowledge, sodium dodecyl sulfate (SDS) was not used until now as a shape-tailoring agent in the synthesis of AgCl. Moreover, the anionic shape-tailoring agent was not used previously either to control the morphology of AgCl, while SDS is one of the most used anionic shape-tailoring agents/surfactants in nanoparticle synthesis (e.g., Ag-based compounds: AgI nanoparticle [27] or Ag2S microcrystal [28]).
The usage of different Cl sources can influence the photocatalytic activity of AgCl. HCl has been used in several synthesis procedures for the deposition of Ag nanoparticles during the synthesis [29]. As a Cl source, NaCl [25] and KCl [30] are the ones used most frequently, while NaCl can also act as a sacrificial salt-crystal template in the synthesis of AgCl microcrystals [31]. Moreover, changing the concentration of Cl during the synthesis of 3D-structured AgCl is frequently investigated [32].
Considering the aspects mentioned above, the present work will include the following research steps:
  • the solvothermal synthesis of AgCl microcrystals at 160 °C;
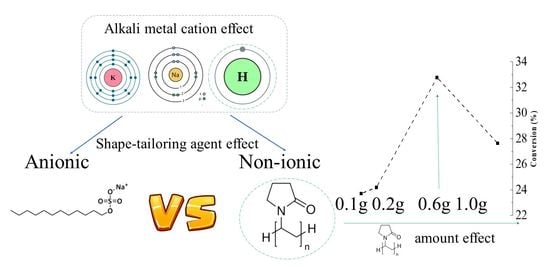
  • the synergic effect of the used chloride sources (HCl, NaCl, and KCl);
  • the nature of shape-tailoring agents (non-ionic: PVP and anionic: SDS) on the AgCl microcrystals and their stability;
  • the effect of the as-appeared Ag nanoparticles (during the synthesis/photocatalytic degradation of methyl orange (MO)) on the photocatalytic activity and stability of the AgCl microcrystals.

2. Results

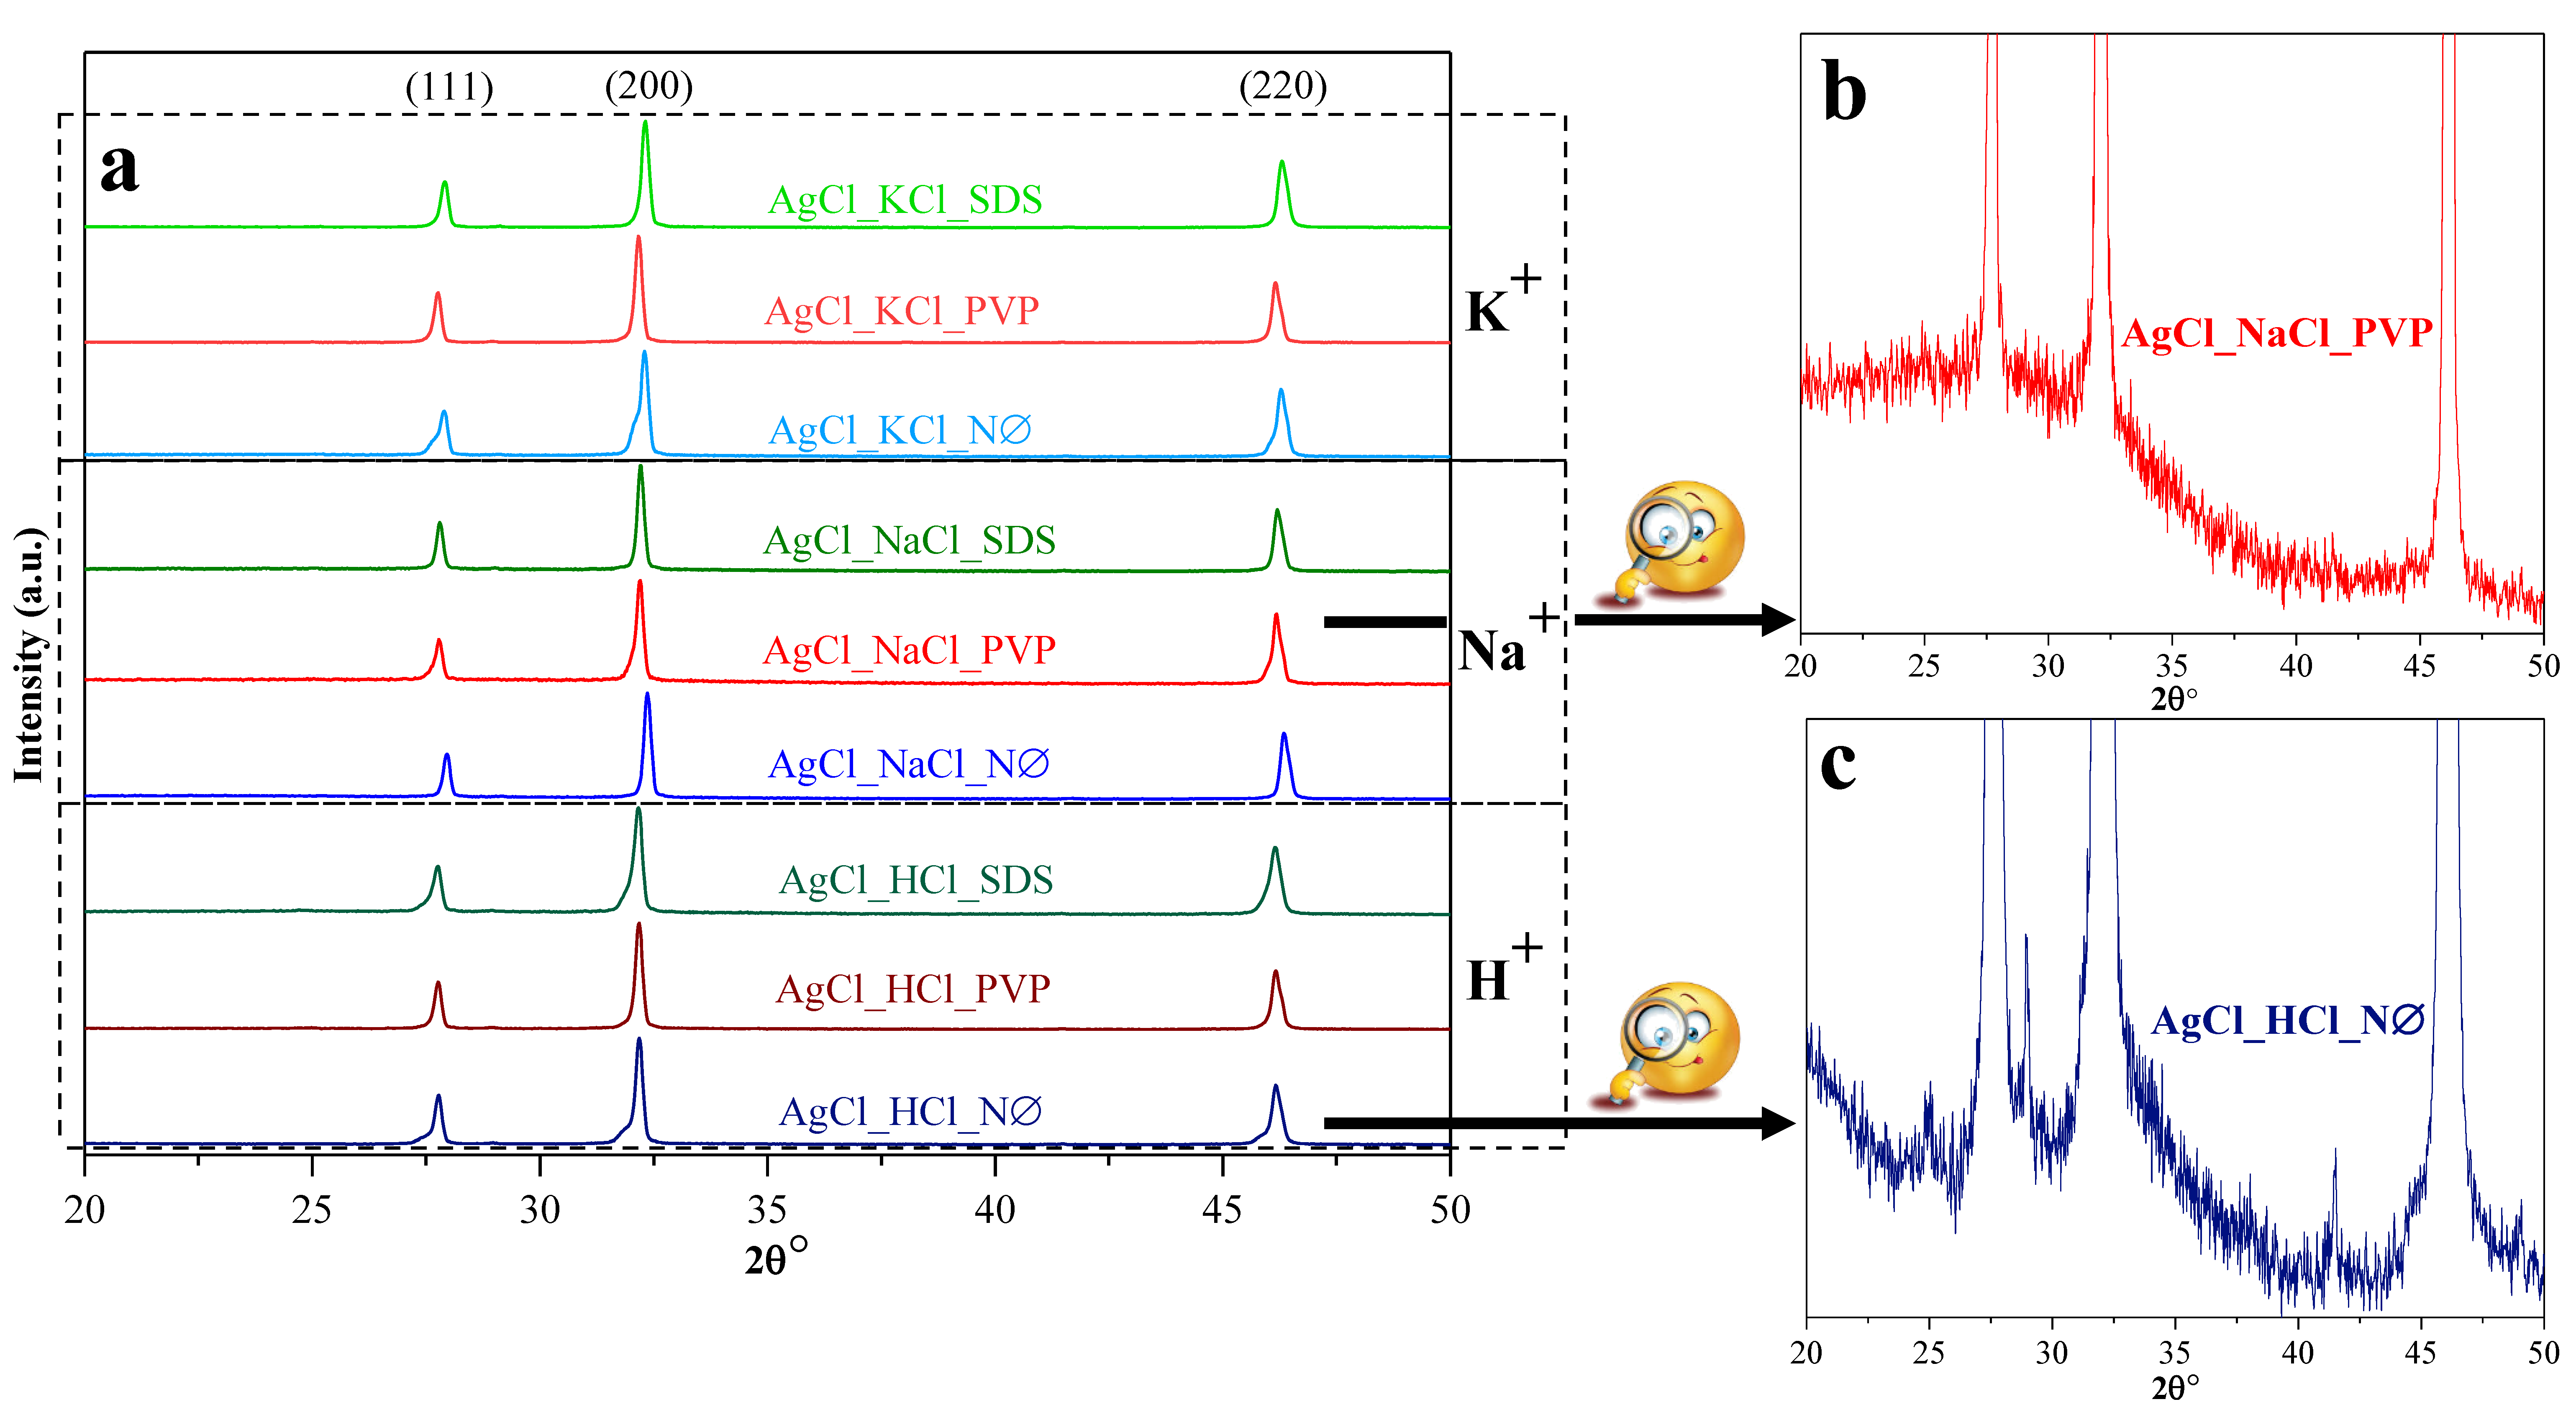
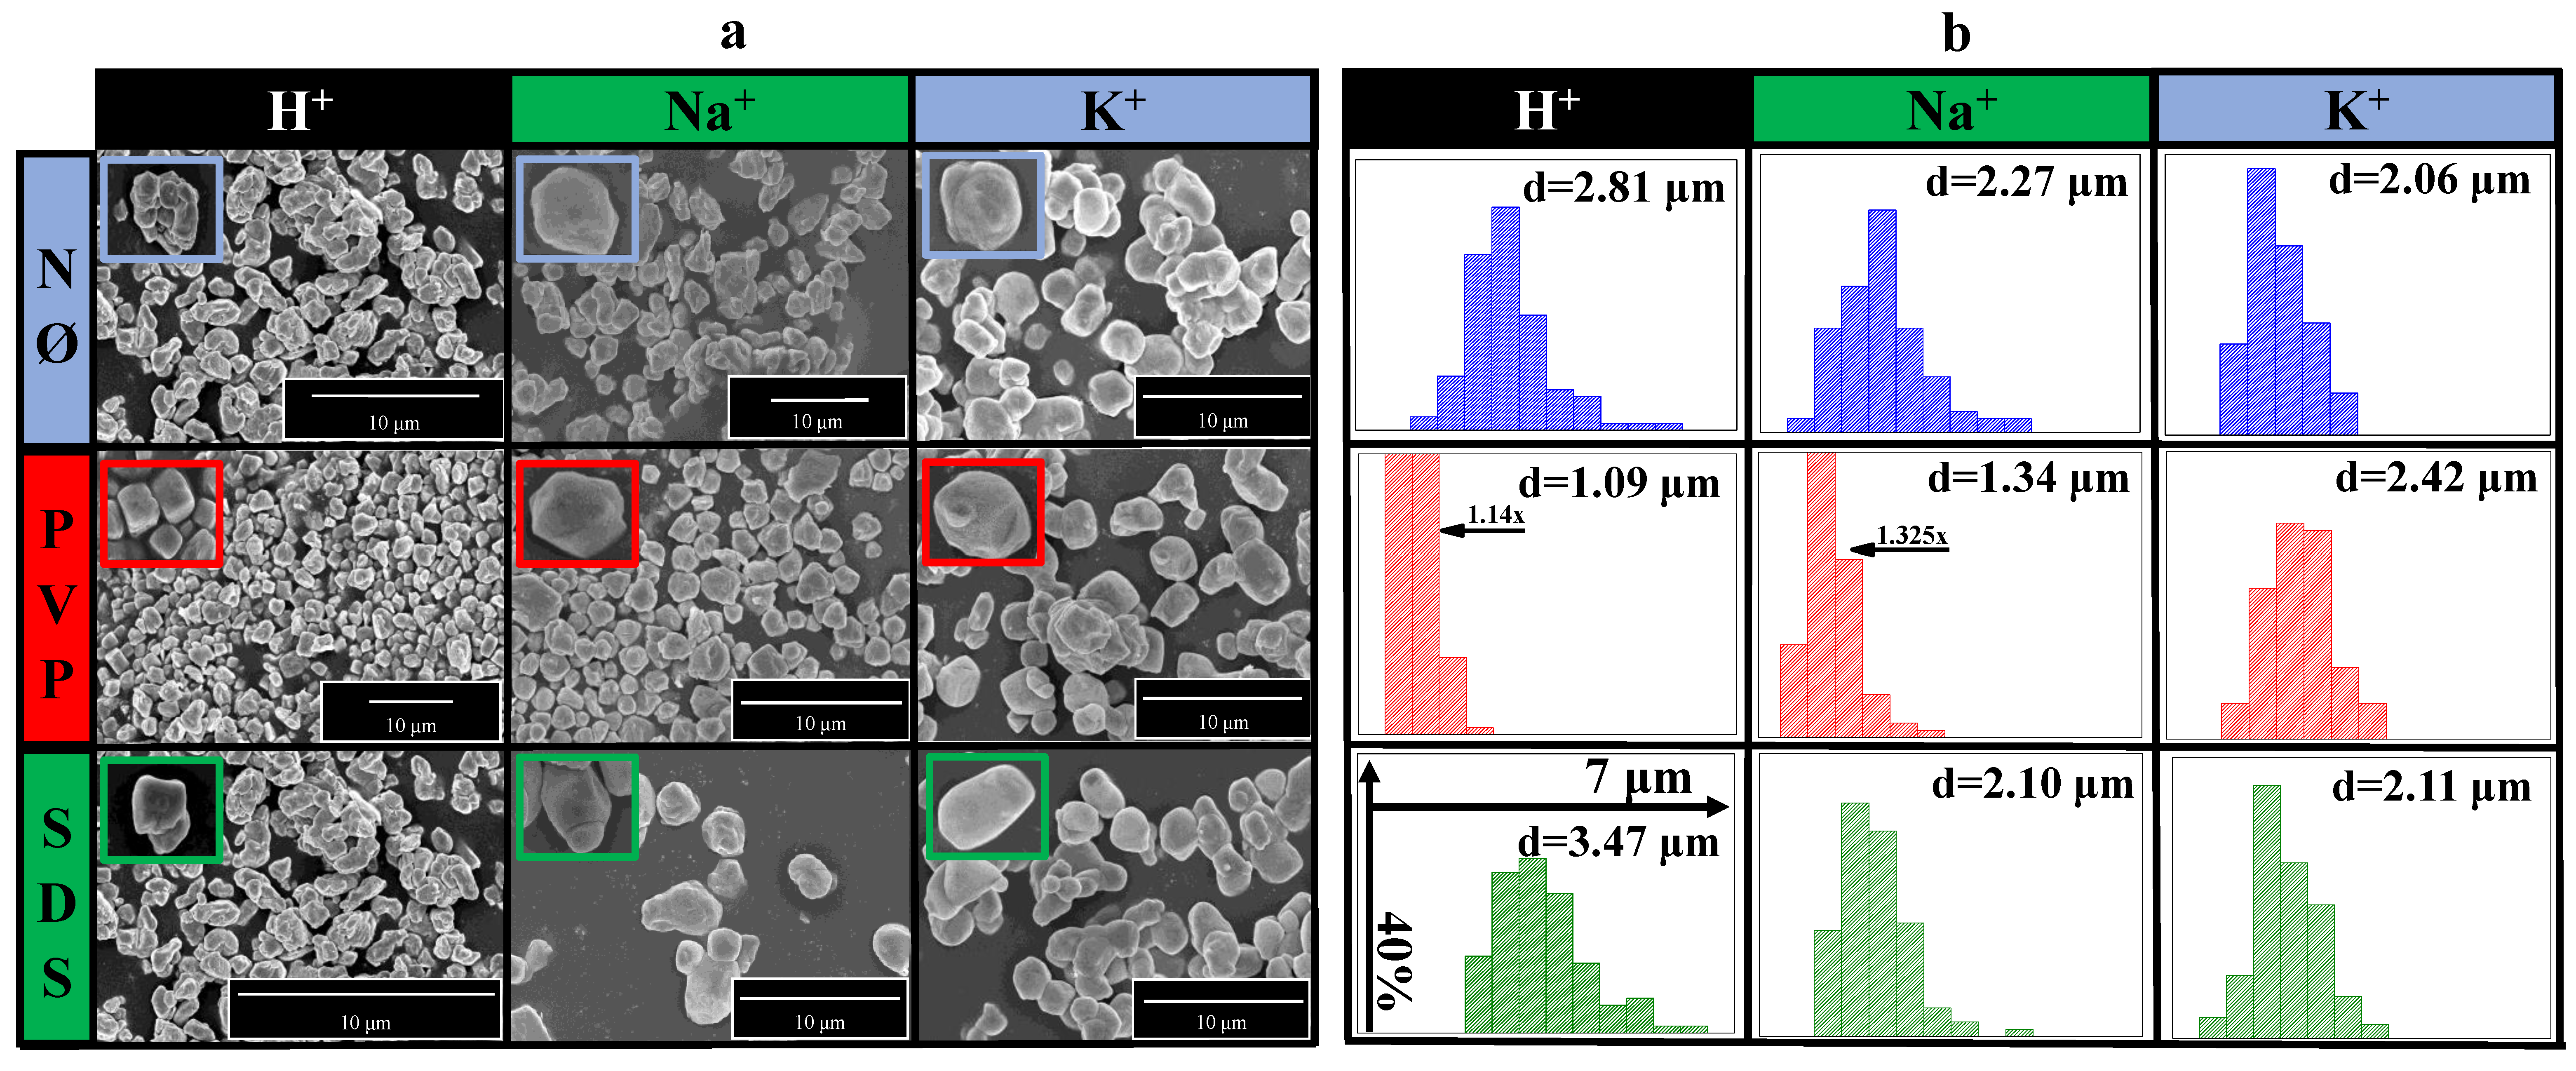
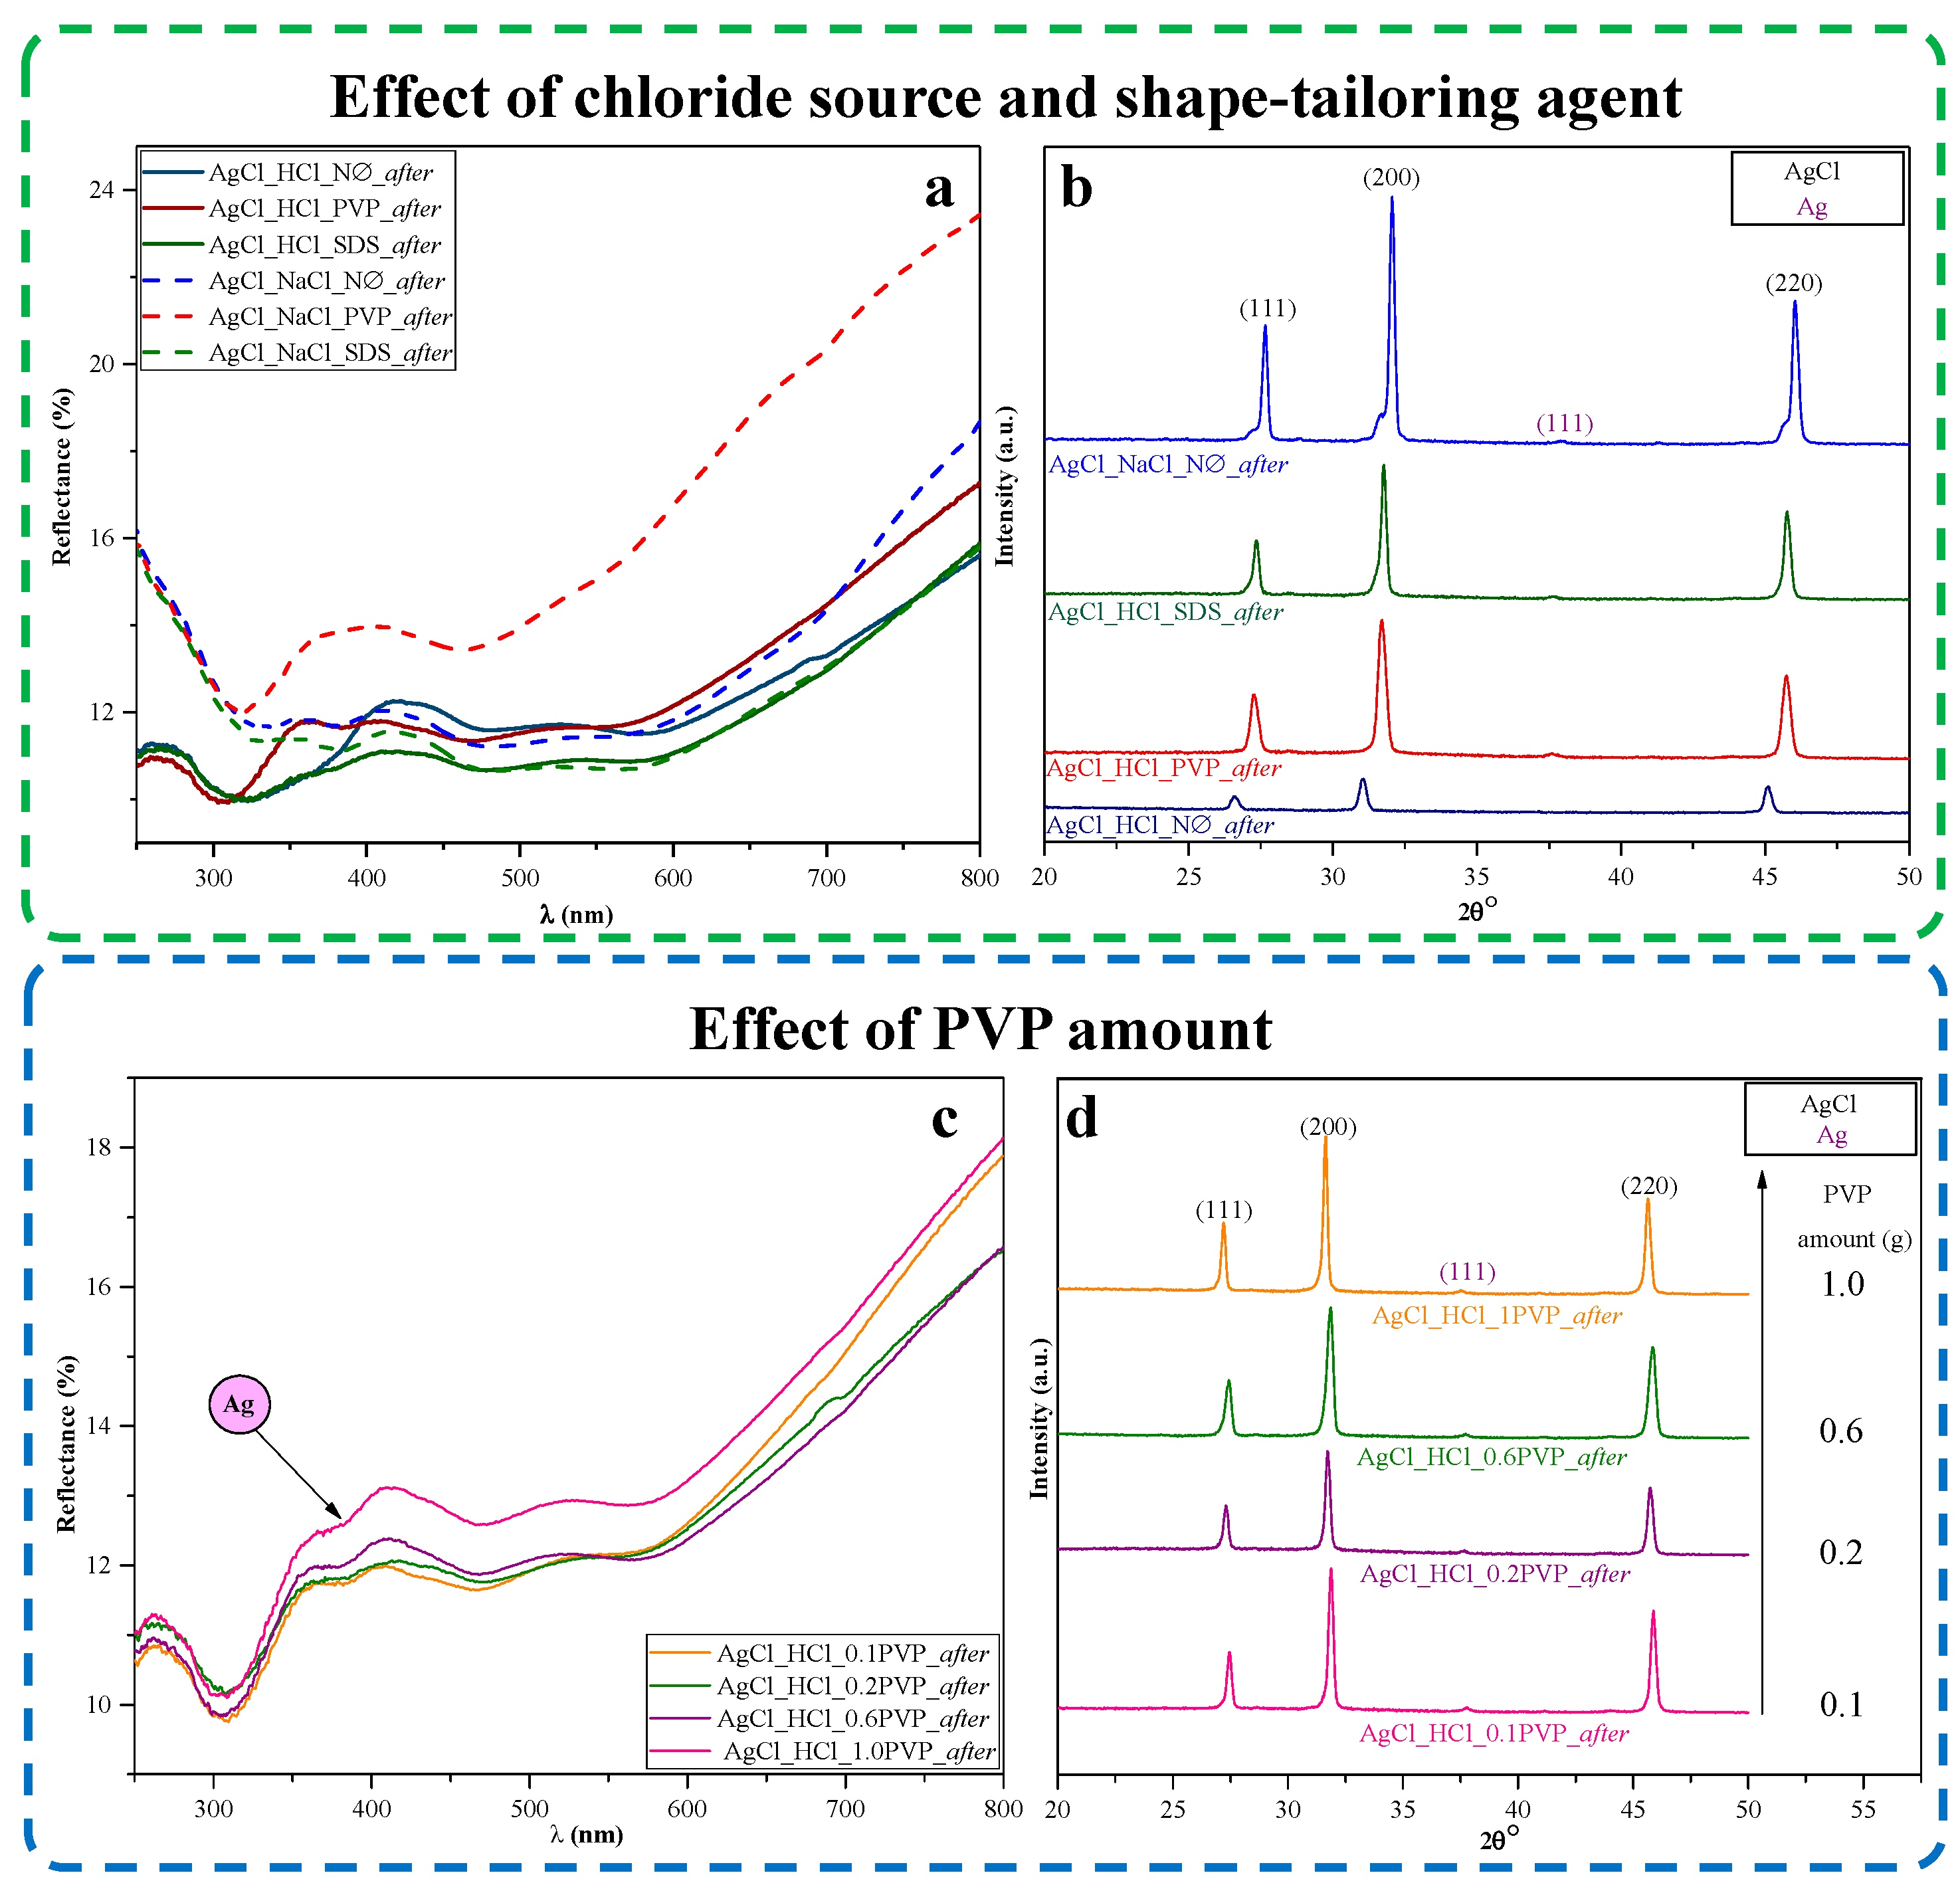
2.1. Characterization of AgCl Microcrystals

X-ray diffraction (XRD) patterns were recorded to evaluate the crystal phase composition of AgCl samples. All the characteristic reflections (Figure 1) of face-centered cubic AgCl were found at 27.7°, 32.1°, and 46.1° 2θ° values. These reflections were assigned to the (111), (200), and (220) crystallographic planes of AgCl particles, respectively (Crystallography Open Database (COD) file no. 00-031-1238, Supplementary Table S1).
In some specific cases (such as for AgCl_KCl_NØ and AgCl_HCl_SDS), additional overlapping diffraction peaks appeared at 2θ ≈ 27.6°, 32.5°, and 45.9° (which mainly overlapped with the reflections of AgCl mentioned above). The explanation of these signals may be found in the synthesis procedure/crystallization conditions:
  • the crystallization of AgCl was incomplete, showing a partially crystallized structure with crystal lattice defects, since the “shoulders” follow the original AgCl diffraction peaks.
  • other Ag-based structures were formed (the most probable ones are AgO‒32.0° (COD file no. 00-150-9488); Ag2O‒46.2° (COD file no. 00-101-0486); and AgClO2‒32.37° (COD file no. 00-231-0062)).
Other researchers also observed this phenomenon, but no further discussion of the signals’ origin was found [33,34,35]. Besides the reflections of AgCl mentioned above, other weak reflections (2θ ≈ 24.9°, 29.0°, and 41.4°, 38.2°; Supplementary Table S1, Figure 1b,c) were observed, which could be attributed to the presence of AgClO4, AgClO3, and Ag, although their quantity was very low. It should be mentioned that for sample AgCl_NaCl_PVP none of these signals were found, while the one at 2θ = 38.2° appeared only in the AgCl_KCl sample series (Supplementary Table S1). This signal can be attributed either to Ag or Ag2O; therefore, it can be concluded that KCl is responsible for their appearance. It is well known that Ag-containing samples always transform into Ag2O on the surface of Ag-based materials in low percentages. The formation of AgClO4 was not observed for the NØ sample series. Thus, the used surfactants may be responsible for the appearance of AgClO4 (exception: AgCl_NaCl_PVP, Supplementary Table S1).
The primary crystallite mean size of the samples was calculated using the Scherrer equation [36] following the deconvolution of the overlapped diffraction peaks. The calculated values were between 33–36 nm.
It was also observed that the intensity ratios of the (111)/(200) and (220)/(200) crystallographic planes showed opposite trends in all sample series (AgCl_HCl, AgCl_NaCl and AgCl_KCl; Supplementary Figure S1). For sample series NØ, the increase in the used alkali metal cation radii showed a positive effect on the formation of the (220) crystallographic plane.
Since the shape-tailoring agents affected the crystallographic plane ratios of (111)/(200) and (220)/(200), it was also expected to affect the morphology of the samples. Therefore, scanning electron microscopy (SEM) measurements were carried out to provide information about the size and morphology of the particles. It can be observed that not only can the shape-tailoring agents influence the morphology, but also the nature of the chloride source (Figure 2a). Quasi-spherical particles were formed by using K+, while in the case of Na+ and H+, polyhedral particles were observed. This is because they presumably increased the number of steps and kinks on the crystal surface. It should be mentioned that by using PVP, the appearance of the polyhedral morphology was even more dominant in comparison with the NØ and SDS sample series.
The type of alkali metal cation influenced the crystal size of the particles, which was the most evident in the NØ sample series: as the cation ionic radius increased, the average primary crystallite size decreased (Figure 2b). In contrast, the crystallite size values increased with the increase of the cationic radii by using a non-ionic shape-tailoring agent (PVP sample series). Interestingly, the usage of SDS did not have a clear effect on the crystal size of the particles.
It could also be observed that in the AgCl_NaCl_PVP and AgCl_NaCl_SDS samples small nanoparticles were formed on the surface of the “main” microparticles (Supplementary Figure S2). Therefore, transmission electron microscopy (TEM) measurements were performed, and an in-depth analysis of the small particles was carried out (Supplementary Figure S3). The results showed that the average diameter mainly depends on the alkali metal cation (AgCl_KCl: ≈40 nm and AgCl_NaCl: ≈100 nm). The nanoparticles did not possess any specific morphology; however, in some cases, aggregation was observed. These nanoparticles most probably contained Ag2O or Ag nanoparticles, according to the color of the material (visible by the naked eye), that appeared on the surface of AgCl (the amount is lower than the limit of detection of the X-ray diffractometer for NaCl, which was used as chloride source). It has to be mentioned that the silver nanoparticles could have been formed in situ by electron beam irradiation [37] (Supplementary Figure S4a). Typical surface plasmon resonance bands of Ag or Ag-based samples (which depend on the size and morphology of the noble metals as well as the dielectric environment in which they are present) was analyzed to investigate the formation of Ag nanoparticles. Moreover, light absorption capacity and the band gap energy of the samples were investigated by using diffuse reflectance spectra (DRS) measurements.
The information elucidated from the DRS measurement are the following:
(i) surface plasmon resonance band
The typical surface plasmon band of very small (i.e., <10 nm), metallic and spherical Ag nanoparticles is located approximately at 400 nm [38]. Meanwhile, Ag2O can have a wide and strong light absorption band in the range of 200–700 nm [39] (in some studies the maximum of the surface plasmon resonance band of Ag2O is located at ≈430 nm [40]).
On the other hand, it is known [41] that if metallic silver particles are not spherical (or equiaxial), the electronic absorption band is expected to be located at longer wavelengths. Moreover, it gradually shifts to shorter wavelengths (towards 400 nm) as the shape of the particles becomes more spherical. The shift of the surface plasmon resonance band to higher wavelength values than 400 nm can also be due to the increase of the spherical silver nanoparticles and their aggregation. Therefore, one can conclude that all the aforementioned parameters, i.e., the shape, size, and aggregation of silver particles, can contribute individually or in various combinations to the shift of the silver plasmon resonance absorption band to higher wavelengths.
Considering these aspects, the as-prepared materials can be divided into two spectral categories (Supplementary Figure S4a):
I. In four samples (AgCl_HCl_NØ; AgCl_HCl_SDS; AgCl_NaCl_PVP; and AgCl_KCl_NØ), only one surface plasmon resonance band was detected between 400–500 nm. These samples enlisted in category I. were those which showed two overlapping reflections in the XRD patterns (Figure 1, Supplementary Table S1). AgCl_NaCl_PVP showed a surface plasmon resonance band at a shorter wavelength (λmin ≈ 454 nm) compared to the other three bands’ position, which was located at λmin ≈ 471 nm (Supplementary Figure S4a). The latter can be presumably attributed to Ag2O or aggregation of Ag and/or Ag2O nanoparticles.
II. In the rest of the cases, two bands were observed (one due to the presence of Ag nanoparticles on the surface of the catalyst [8] and the other caused by the aggregation of the Ag nanoparticles [42]). However, for the AgCl_KCl sample series the presence of metallic Ag was also confirmed by XRD (Figure 1a, Supplementary Table S1). Meanwhile, for the AgCl_NaCl and AgCl_HCl sample series, the amount of silver was lower (< ≈1 wt%) than the limit of detection of the X-ray diffractometer. It is worth mentioning that AgClO4 and AgClO3 do not give a plasmon resonance band; therefore, they cannot be present in this material.
Since the samples contained multiple compounds, their light absorption capacity was different. To elucidate the cause of the differences between the absorption capacities, the first derivate spectra were investigated. Despite the expectations, no new electronic transition bands could be observed in the spectra (Supplementary Figure S4b–d) except for AgCl.
(ii) band gap energy values of the samples
Based on the information derived from the X-ray diffractograms, the as-investigated samples consist of multiple components. Thus, it was expected that multiple peaks would appear in their absorption spectra. However, in their first-order derivative spectra (Supplementary Figure S4b–d), only one peak was observed. Moreover, the light absorption bands were shifted compared to each other; thus, the band gap energy values of the samples were also calculated.
It should be mentioned that by using HCl as chloride source the band gap energy values were increasing as follows: AgCl_HCl_ < AgCl_HCl_PVP < AgCl_HCl_SDS (2.34 eV < 2.41 eV < 2.67 eV, Supplementary Table S1, Figure 3a), which is the opposite of the result obtained for the NaCl-containing series (AgCl_NaCl_ > AgCl_NaCl_PVP > AgCl_NaCl_SDS, 2.55 eV > 2.38 eV > 2.35 eV, Supplementary Table S1, Figure 3a). The usage of KCl as a chloride source did not influence the band gap energy values (2.49 eV, Supplementary Table S1, Figure 3a) of the corresponding samples.

2.2. Photocatalytic Efficiency of the Samples

2.2.1. AgCl_NØ Sample Series

As the cation radii of the alkali metal salts increased, the degradation yield increased as well, resulting in the decrease of the average particle size or the increase of the intensity ratio of the (220)/(200) crystallographic planes. Therefore, it can be concluded that the particle size, the growth of the (220) crystallographic plane, and the photocatalytic activity are influenced by the cation radii of the alkali metal salts.

2.2.2. AgCl_KCl Sample Series

Similar degradation yields (9.8–11.8%, Figure 3b, Supplementary Table S1) were observed for the sample series that was obtained by using KCl, which is in good agreement with our former observations, namely: (1) identical optical properties [band gap energy values (2.49 eV, Supplementary Table S1, Figure 3a) and first-order derivative DRS spectra (Supplementary Figure S4b–d)]; (2) similar average particles size ranges (2.06‒2.42 μm, Figure 2b). Therefore, in this case, we can conclude that no apparent influence could be observed in this sample series.

2.2.3. AgCl_NaCl Sample Series

Using NaCl as a chloride source, the conversion for MO degradation was between 5.6–9.3% (Supplementary Table S1; Figure 3b). The band gap energy values did not significantly influence the efficiency of the AgCl_NaCl sample series. The highest degradation yield of sample AgCl_NaCl_PVP could be mainly attributed to the fact that it not only contained AgCl, but Ag2O or Ag as well, which was also proved by X-ray photoelectron spectroscopy (XPS) measurements (presented later). In our previous works it was proved that Ag2O can act as a charge separator, thus increase the lifetime of charge carriers [43,44].

2.2.4. AgCl_HCl Sample Series

The PVP-modified samples showed the highest degradation efficiency in comparison with other sample series. This could be due to the polyhedral morphology (Figure 2a), which may increase the number of steps and kinks on the surface of the catalyst. These steps and kinks could be responsible for the enhanced adsorption of dyes on the surface of the catalysts [25]. Also, the Ag nanoparticles (whose presence was proven by the surface plasmon resonance band in the DRS spectra (Supplementary Figure S4a) and was assumed based on the small particles on the surface of the photocatalyst in the TEM micrographs (Supplementary Figure S3)) could enhance the lifetime of charge carriers, thus increasing the overall efficiency of the photocatalytic processes.
As it was shown above, AgCl_HCl_PVP had the highest degradation efficiency. Therefore, the effect of PVP concentration during the solvothermal synthesis was further investigated in the AgCl_HCl sample series.

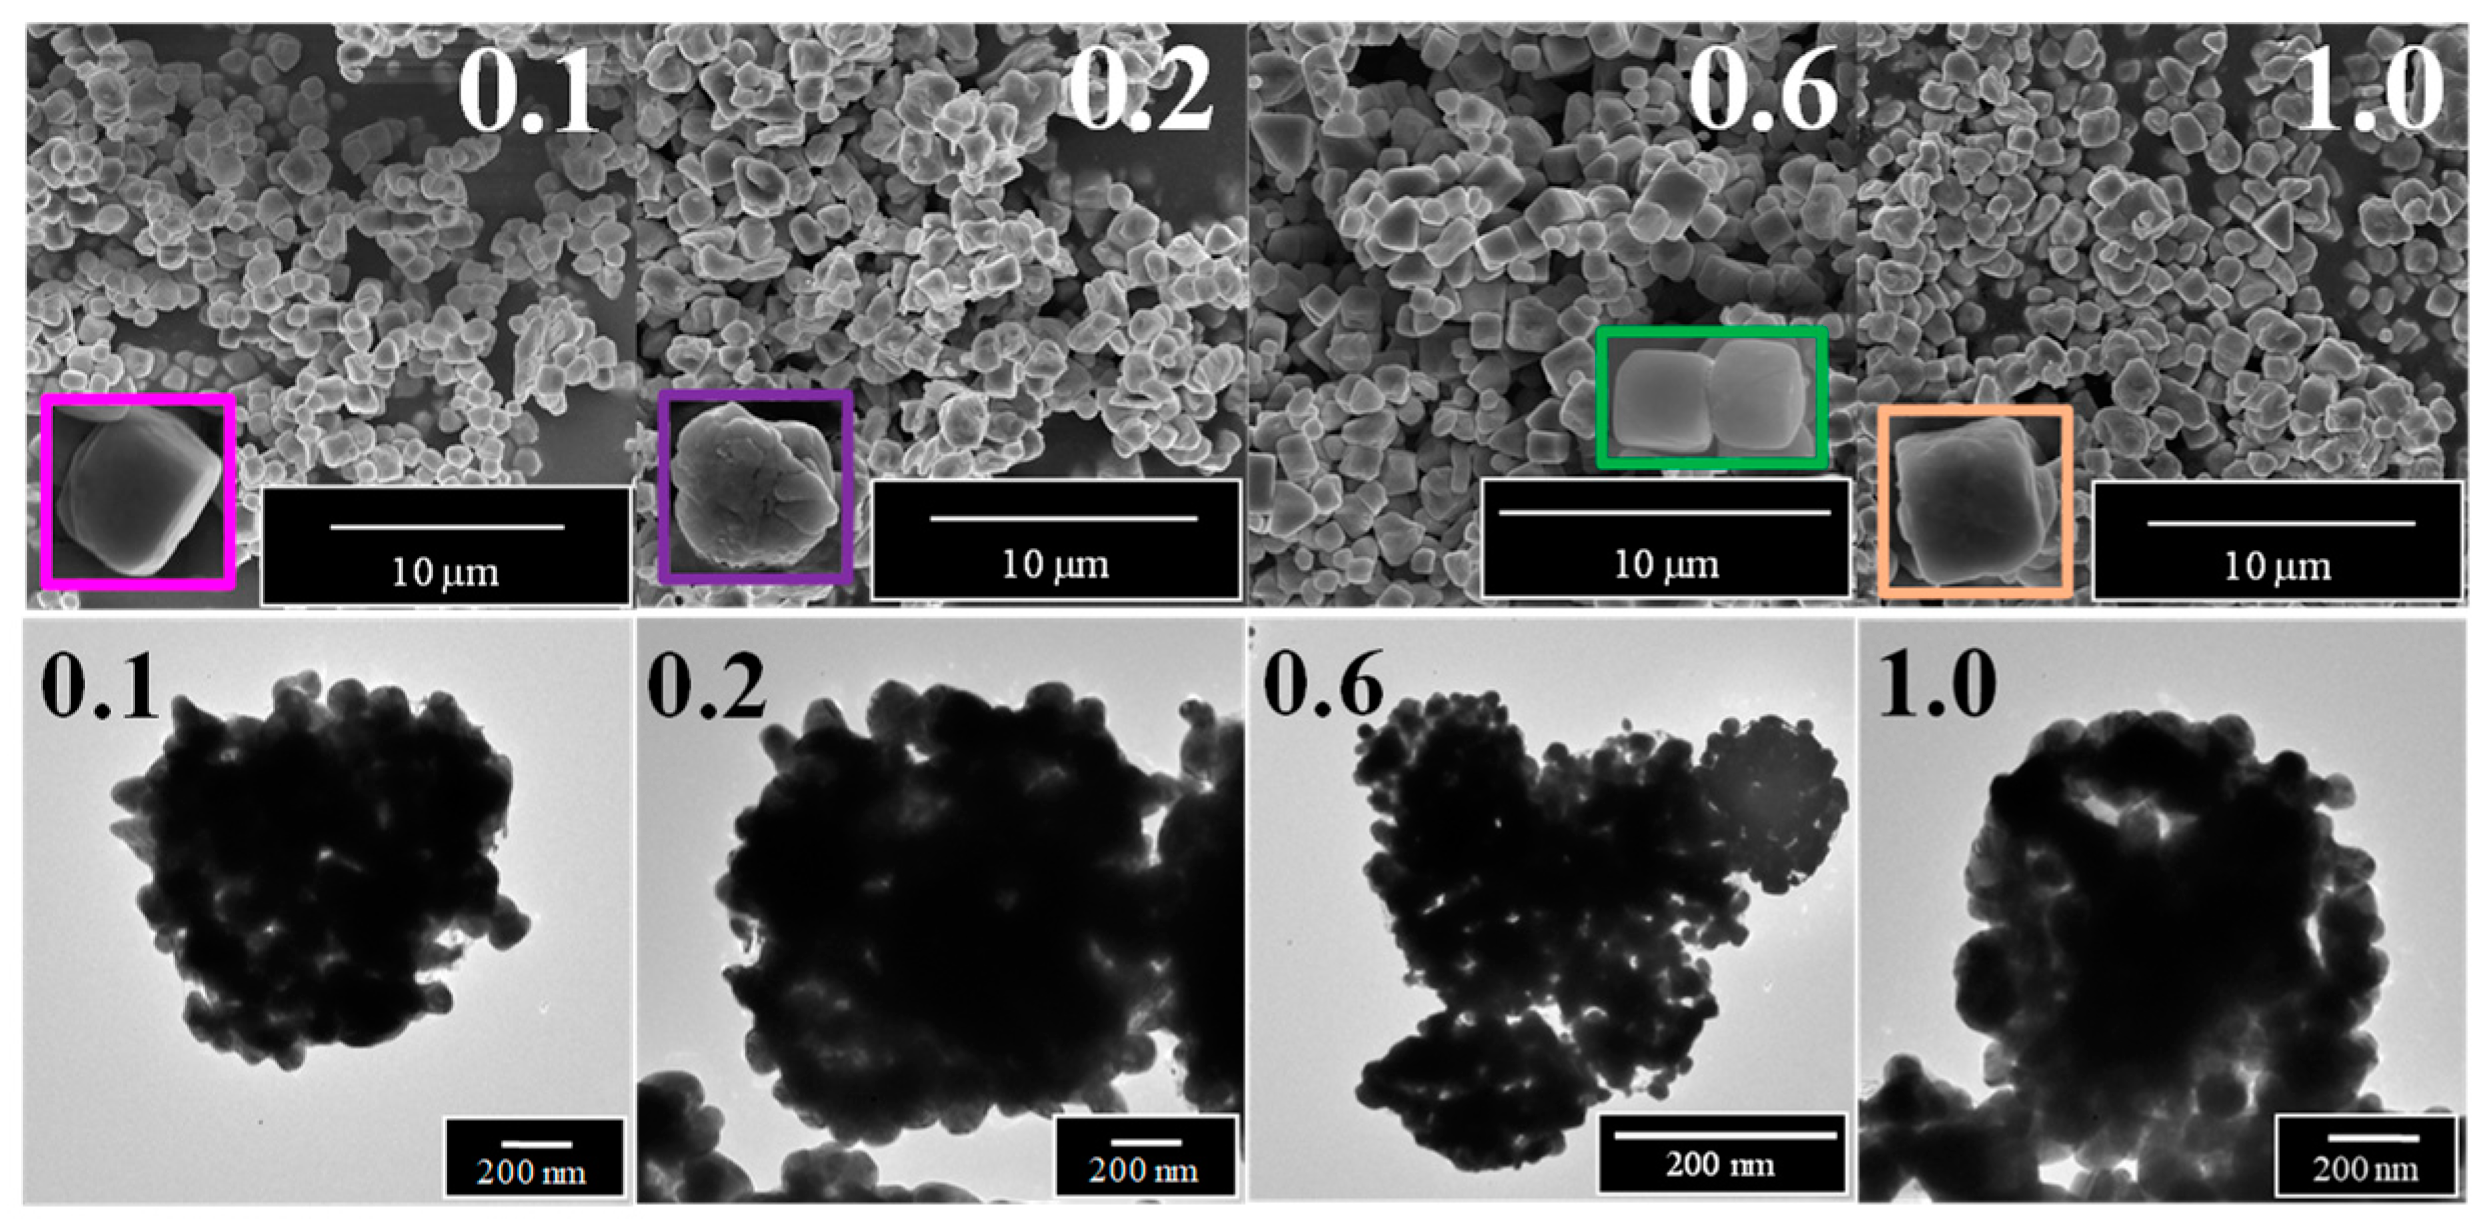
2.3. Effect of Polyvinylpyrrolidone (PVP) Amount on the Properties and Photocatalytic Activity of AgCl_HCl Sample Series

The crystal phase composition and crystal structure of the synthesized AgCl microstructures using different concentrations of PVP were investigated. The face-centered cubic crystal phase of AgCl was identified in all samples (Supplementary Table S1).
It should be noted that the previously mentioned diffraction peak shoulders appeared in this case as well (similar to Figure 1a). Moreover, an Ag-related diffraction peak was also observed at 38° (2θ°), but only for the AgCl_HCl_0.1PVP sample (Supplementary Table S1). AgClO4 was not present, while AgClO3 appeared in very low amounts (Supplementary Table S1).
Since the usage of PVP generally affects the formation of the (111) crystallographic plane [23], the ratios between the (111)/(200) and (220)/(200) crystallographic planes were calculated (Figure 4). The (111)/(200) ratio values were in the range of 0.40–0.48. Therefore, it can be concluded that the examined PVP amount presumably does not significantly affect the growth rate and the dominance of the (111) crystallographic plane. However, the formation of the (220) crystallographic plane could be reliably attributed to the intensity ratios of the (220)/(200) crystallographic planes, which were between 1.06–0.79.
The primary crystallite size values varied between 27–33 nm, from which AgCl_HCl_0.6PVP had the lowest value (27 nm). The presence of Ag nanoparticles (Figure 5) was also observed via TEM, but they did not have any specific shape or size, and in most cases they were aggregated (Figure 5). Polyhedral morphology was dominant in all samples (Figure 5). However, in some cases cube-like particles were also observed, for example, in AgCl_HCl_0.6PVP. The average particle size was almost identical in all cases (0.92–1.11 μm, Supplementary Figure S5).
Optical investigations revealed that the surface plasmon resonance bands (Supplementary Figure S6a) were like those obtained before (Supplementary Figure S4a). For AgCl_HCl_0.1PVP and AgCl_HCl_0.2PVP, the intensity of the surface plasmon resonance band was low. For these samples, only one specific plasmon resonance minimum could be seen, but the signal itself was broad, which could be attributed to the aggregation of Ag nanoparticles (visible also in the TEM micrographs, Figure 5).
The first derivative spectra of the AgCl_HCl_xPVP sample series were also analyzed, and their maxima were located at λmax = 394 nm (Supplementary Figure S6b). The as-calculated band gap values were lower than 3.00 eV. Therefore, the samples may be active under visible light. Moreover, the band gap energy values were increasing with the PVP amount: the lowest band gap energy value (2.17 eV, Supplementary Table S1; Figure 6a) was assigned to AgCl_HCl_0.1PVP, while the highest value (2.63 eV, Supplementary Table S1; Figure 6a) to AgCl_HCl_1.0PVP.
The highest degradation yield (32.8%; Supplementary Table S1; Figure 6b) was obtained for AgCl_HCl_0.6PVP, which could be explained by: (1) the high-intensity ratio of the (220)/(200) crystallographic plane, and (2) the lowest primary crystallite size (27 nm). The low particles size and dominant presence of (220) may be associated with an increase in the samples’ photoactivity.
Based on the high photocatalytic activity [45] of AgCl_HCl_0.6PVP (32.8%; Supplementary Table S1; Figure 6b), it was not surprising that the second highest value was observed for AgCl_HCl_1.0PVP (27.6%; Supplementary Table S1; Figure 6b). Very similar degradation values (AgCl_HCl_0.1PVP: 23.7% and AgCl_HCl_0.2PVP: 24.2%; Supplementary Table S1; Figure 6b) were observed for AgCl_HCl_0.1PVP and AgCl_HCl_0.2PVP, which may originate from the similar optical properties.

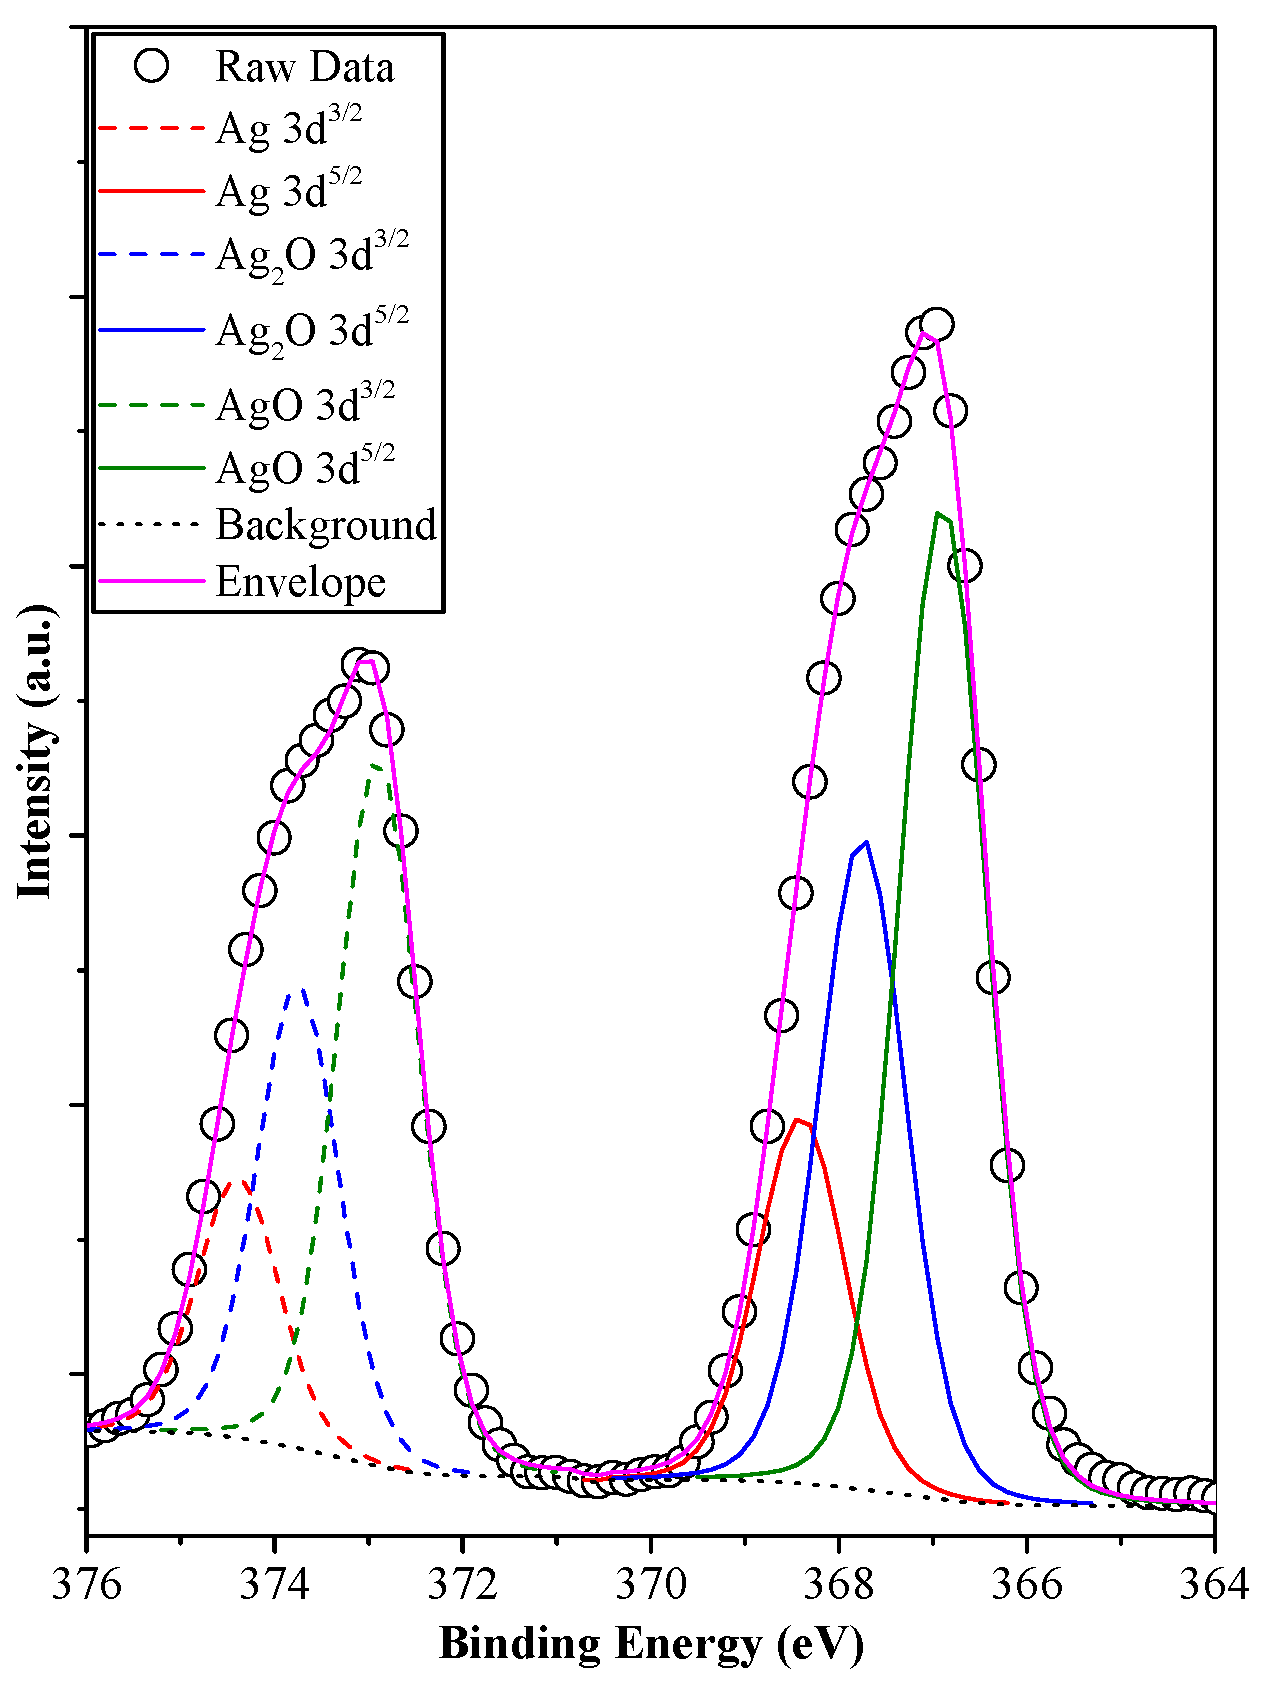
2.4. Surface Structure of AgCl Materials

The presence of different silver species on the surface of silver-containing materials is always a crucial question as it influences the applicability of the material. The following species were identified in the investigated samples: AgO (366.9 eV 3d5/2 and 372.9 eV 3d3/2, [46]), Ag2O (367.7 eV 3d5/2 and 373.7 eV 3d3/2, [47]) and Ag (368.3 eV 3d5/2 and 374.3 eV 3d3/2, [48]). From the aforementioned three species, AgO and Ag2O were present in each sample in the same ratio within experimental errors: 71.4% of AgO and 28.6% of Ag2O from the total amount of silver.
However, the situation changed when the HCl_PVP samples (Figure 7) were investigated. The sample obtained in the presence of 0.4 g of PVP contained all the three species (49.5% of AgO, 31.3% of Ag2O, and 19.2% of Ag). When the PVP amount was increased to 0.6 g, the amount of metallic silver was 0, while AgO became even more dominant in the samples, as they contained AgO up to 80.2%. The increased amount of AgO proved beneficial for the photocatalytic activity, since the samples from the HCl_PVP series were the most active as they degraded up to 32.8% of MO (Supplementary Table S1). AgO could only be observed by XPS measurements, most probably due to its amorphous nature and that it was only present on the surface of the particles (making its bulk-related concentration very low). Moreover, based on our previous studies, AgO is more stable than Ag or Ag2O species [43].

2.5. Structural and Optical Parameters of AgCl after Degradation Processes

The low stability of Ag-based materials is already known in the literature [49]. However, during the irradiation of these compounds, Ag nanoparticles may form on the surface of the material [50]. They can protect the AgCl particle from further decomposition, and act as a charge separator at the same time [14]. As was already mentioned in the introduction section, silver nanoparticles can form: (i) during the synthesis and (ii) during the degradation process of the model pollutant. Tian et al. [14] reported that the latter scenario resulted in the higher stability of Ag/AgCl, compared to the first one. Taking this information into account, the photocatalytic materials were re-characterized after the degradation processes of MO. XRD and DRS were used to determine the possible structural and optical changes (Figure 8).
(i) effect of shape-tailoring agent on the stability of photocatalysts
AgCl_HCl_NØ_after and AgCl_HCl_SDS_after lost their photocatalytic activity, which seems to be due to the increased light absorption (Figure 8a) compared with those measured before the degradation processes (Supplementary Figure S4a). In AgCl_HCl_NØ (before MO degradation) no metallic Ag-related reflection was observable, neither before nor after the degradation process.
In AgCl_HCl_SDS (Figure 1a), specific reflections for Ag nanoparticles were observed at 37.6° (2θ°) and 44° (2θ°) (COD no. 00-001-1167). Thus, it could be concluded that the AgCl_HCl_SDS_after (Figure 8b) sample began to transform into Ag during the photocatalytic experiment. Moreover, these silver nanoparticles proved to positively affect the activity (Figure 3b) compared to AgCl_HCl_NØ, in which no Ag nanoparticles could be found.
Interestingly, in AgCl_HCl_PVP_after a new surface plasmon resonance band was found at ≈390 nm (Figure 8a), and metallic Ag was detected in the XRD patterns (Figure 8b). Moreover, the AgCl reflections did not overlap with any other reflections, and the signals of AgClO4 disappeared as well. Presumably, the aforementioned stabilization occurred during the photocatalytic experiment (Figure 3b). The newly formed surface plasmon resonance band was attributed to Ag nanoparticles. Its size was lower compared with those obtained during the synthesis (Supplementary Figure S4), proved by the location of the specific surface plasmon band at lower wavelengths.
AgCl_NaCl_NØ_after did not show the plasmonic resonance band of Ag nanoparticles, but the specific reflections of Ag were found in the XRD patterns (Figure 8b). The shoulders of AgCl (which were not observed after the synthesis processes; Figure 1) were present; however, just barely. Since there were no visible plasmon resonance bands, but the XRD measurements confirmed the presence of Ag, the newly formed shoulders most likely originated from the formation of crystal defects.
(ii) effect of PVP on the photocatalysts’ stability during photocatalytic processes
In each modified sample, new surface plasmon resonance bands were observed at λmin ≈ 390 nm (Figure 8c), together with the typical reflections of Ag nanoparticles (Figure 8d). The signals of AgClO3 may be present, but the amount should be quite low, due to its low formation possibility. Interestingly, the third shoulder of AgCl (located at ≈45.6°) was absent from all samples. Therefore, the possibility of Ag nanoparticles being re-obtained by the reduction of Ag2O to Ag is plausible as was proven in our previous publication [43].

3. Materials and Methods

3.1. Chemicals

The following chemicals were used without further purification: silver nitrate (AgNO3, 99.8%, Penta industry; Prague, Czech Republic), polyvinylpyrrolidone (PVP, average molecular weight 40,000, Molar Chemicals; Halásztelek, Hungary), sodium dodecyl sulfate (SDS, Reagent Plus, Sigma Aldrich, Schnelldorf, Germany), ethylene glycol, and ethyl alcohol (EG and EtOH, respectively, analytical reagent, Molar Chemicals; Halásztelek, Hungary), hydrochloric acid (HCl, 37%, Alfa Aesar; Haverhill, MA, USA), sodium chloride (NaCl, >99.0%, Spectrum-3D), potassium chloride (KCl, 99.5%, Molar Chemicals; Halásztelek, Hungary) and Milli-Q (MQ; Budapest, Hungary) water.

3.2. Synthesis of Silver Chloride Particles

A simple solvothermal method was used to synthesize the AgCl photocatalysts. For the precipitation step, two solutions (referred to as “solution A” and “solution B”) were prepared; the former contained the Cl ions, and the latter contained the Ag+ source. Solution A consisted of 7.7 mmol MCl (M = Na+, K+, including the corresponding acid—HCl) together with 0.4 g of the shape-tailoring agent (non-ionic: PVP/anionic: SDS). Both were dissolved in 100 mL of EG and kept at 60 °C for one hour under constant magnetic stirring. Solution B was prepared using 3.3 mmol AgNO3 dissolved in 20 mL of EG, which was kept at room temperature for 10 min under constant magnetic stirring. In the next step, solution B was added slowly into solution A to form a white precipitate; afterward, the whole reaction mixture was kept at 60 °C for 1 h under continuous stirring. As the next step, solvothermal crystallization was carried out in a Teflon®-lined autoclave (≈160 mL), which was kept at 160 °C for 2 h. The as-obtained pink precipitate was washed with 2 × 45 mL of MQ water and 1 × 35 mL of EtOH at 4400 RPM, followed by drying at 40 °C for 12 h. The samples obtained without applying any shape-tailoring agent were referred to with “NØ”, while the powders prepared in the presence of the mentioned compounds were denoted as “AgCl_XCl_shape-tailoring agent” (X = H, Na or K; shape-tailoring agent: PVP and SDS).
Moreover, different quantities of PVP ranging from 0.1 g to 1 g was also used to investigate its effect on the morphology of the photocatalysts. The PVP-modified samples were denoted as “AgCl_HCl_xPVP”, where x = 0.1, 0.2, 0.4, 0.6 and 1.0 g.

3.3. Characterization Methods, Instrumentation, and Assessment of Photocatalytic Efficiencies

The morphological characterization of the samples was performed with a Hitachi S-4700 type II cold field emission scanning electron microscope (SEM; Hitachi, Tokyo, Japan) equipped with an Everhart–Thornley detector. The particle size distribution was calculated with ImageJ 1.35a.
FEI Technai G2 20 X-TWIN transmission electron microscope (TEM; FEI, Hillsboro, OR, USA) was used to carry out the in-depth analysis (deposition/formation of small nanoparticles) of the AgCl particles.
X-ray diffraction (XRD) analysis of the powder samples was carried out with a Rigaku Miniflex-II diffractometer (Rigaku, Neu-Isenburg, Germanyand between 20–50° (2θ°), before and after photodegradation of the model pollutant) λ = 0.15418 nm, scanning speed: 1°·min−1 (2θ°) using characteristic X-ray (CuKα) radiation.
Diffuse reflectance spectra (DRS) of the samples were recorded with a Jasco-V650 spectrophotometer (equipped with an ILV-724 integrative sphere; Jasco, Wien, Austria) to determine the ultraviolet–visible (UV–Vis) light absorption capacity of the samples. The spectra were recorded in the range of 250–800 nm, with 0.5 nm resolution and 100 nm·min−1 scan speed. The band gap values of the synthesized materials were estimated using the Kubelka–Munk equation [51] based on the obtained reflectance data.
A Specs Phoibos 150 MCD X-ray photoelectron spectroscope (SPECS Surface Nano Analysis GmbH, Berlin, Germany XPS) equipped with a monochromatic Al-Kα source (1486.6 eV) at 14 kV and 20 mA, a hemispherical analyzer, and a charge neutralization device was used to analyze the appeared Ag species on the surface of the semiconductor. The photocatalyst samples were fixed on a double-sided carbon tape, the powder completely covering the tape. The binding energy scale was charge referenced to the C1s at 284.6 eV. High-resolution Ag3d spectra were obtained using analyzer pass energy of 20 eV in steps of 0.05 eV. Data analysis was carried out with CasaXPS software.
The photocatalytic activity of the AgCl materials was assessed by the degradation of methyl orange (Cmethyl orange = 125 µM). The reactor system contained a double-walled reactor and 4 × 24 W (DÜWI 25920/R7S, Düwi Kft., Budapest, Hungary, λ > 400 nm) lamps. The photoreactor was thermostated at 25 °C with sodium nitrite solution (CNaNO2 = 1 M) to absorb UV photons. The suspension concentration was 1 g·L−1 and, throughout the photodegradation process, the suspension was purged continuously with air and stirred using a magnetic stirrer. After 15 min of ultrasonication, the suspension was kept in the dark for 10 min. The photocatalytic experiments were performed for 2 h (sampling every 10 min in the first hour and 20 min in the second hour). The samples were centrifuged (3 min at 13,400 RPM) and filtered (with a Whatman® Anotop® 25 (0.02 μm pore size) syringe filter). The supernatants were analyzed by recording the absorption band maxima with an Agilent 8453 spectrophotometer (λmax = 464 nm; 0.2 mm optical quartz cuvette) from which the concentration changes were determined.
The samples were remeasured after the degradation processes by XRD and DRS to investigate their stability. The samples obtained after the experiments were denoted as “sample name_after”, where “sample name” was identical to that used before degradation.

4. Conclusions

AgCl microcrystals were synthesized by a solvothermal method, using HCl, NaCl or KCl as chloride source. The nature of different shape-tailoring agents (non-ionic: PVP and anionic: SDS) and the effect of different alkali metal salts (NaCl and KCl; including the corresponding acid, HCl) were investigated on the structure, optical, morphological, and photocatalytic properties of the samples. It was shown that not only AgCl, but other compounds, including AgxO, Ag, AgClO3, and AgClO4 were formed as well.
The anionic shape-tailoring agent in the synthesis of AgCl did not have a more positive effect on the properties of the resulting photocatalysts than the non-ionic surfactant used. Using HCl as a chloride source and PVP (0.4 g) as shape-tailoring agent was found to be the most efficient combination of synthesis parameters, reaching 21.7% of MO degradation. Therefore, the effect of PVP amount was further investigated, and it was established that the addition of 0.6 g of PVP resulted in the highest MO degradation, reaching 32.8%. The reason for the high degradation yield was attributed to the resultant effect of the polyhedral morphology and the deposited Ag species (Ag or/and AgxO). After the degradation processes the samples were re-characterized, and some changes were observed in the structure of the material raising further questions concerning this interesting material.

Supplementary Materials

The following are available online at https://www.mdpi.com/2073-4344/11/3/379/s1, Figure S1: Structural properties of AgCl: Intensity ratios of (111)/(200) (red line) and (220)/(200) (black line) crystallographic planes., Figure S2: Appearance of small particles on the surface of the catalyst: SEM micrograph of AgCl_NaCl_SDS, Figure S3: In-depth analysis of the AgCl microcrystal’s morphology: transmission electron microscopy (TEM) micrographs of AgCl photocatalysts prepared using different shape-tailoring agents (; PVP and SDS), alkali metals (Na+, K+), and H+, Figure S4: Optical parameters investigation of AgCl photocatalyst: (a) diffuse reflectance spectra (DRS) using different shape-tailoring agents (; PVP and SDS), alkali metals (Na+, K+), and H+ and the first-order derivative of DRS spectra: (b) AgCl_HCl; (c) AgCl_NaCl; and (d) AgCl_KCl sample series, Figure S5: Particle size distribution of the samples: (a) AgCl_HCl_0.1PVP; (b) AgCl_HCl_0.2PVP; (c) AgCl_HCl_0.6PVP; and (d) AgCl_HCl_1.0PVP, Figure S6: The effect of PVP amount on the optical properties of the catalysts: (a) DRS spectra; (b) inset graph: first-order derivative DRS spectra of the AgCl_HCl_xPVP samples series (x = 0.1, 0.2, 0.6, and 1.0 g), Table S1: Summary of the diffractions patterns, band gap energy value of the samples and conversion values of the degradation of MO.

Author Contributions

Conceptualization, S.K.M., Z.-R.T. and Z.P.; methodology, T.G., E.B., Z.-R.T., G.K. and S.K.M.; formal analysis, G.K.; investigation, Z.-R.T. and S.K.M.; resources, L.B., S.G. and K.H.; writing—original draft preparation, Z.-R.T. and S.K.M.; writing—review and editing, Z.P., T.G., K.H. and L.B.; visualization, Z.-R.T.; supervision, Z.P., S.G. and K.H.; project administration, Z.P. and G.K.; funding acquisition, L.B., K.H. and S.G. All authors have read and agreed to the published version of the manuscript.

Funding

This research was funded by Hungarian National Research, Development and Innovation Office (GINOP-2.3.2-15-2016-00013 and the Indo-Hungarian TÉT project (TÉT_15_IN-1-2016-0013)) and Department of Science and Technology, Delhi, India (INT/HUN/P-06/2016). Zs. Pap and G. Kovács acknowledge the financial support of the Bolyai János fellowship.

Institutional Review Board Statement

Not applicable.

Informed Consent Statement

Not applicable.

Data Availability Statement

Data is contained within the article or Supplementary Materials.

Acknowledgments

The authors would like to acknowledge Nánai Lilla for a part of SEM measurements.

Conflicts of Interest

The authors declare no conflict of interest.

References

  1. Li, J.; Fang, W.; Yu, C.; Zhou, W.; Zhu, L.; Xie, Y. Ag-based semiconductor photocatalysts in environmental purification. Appl. Surf. Sci. 2015, 358, 46–56. [Google Scholar] [CrossRef]
  2. Xue, W.; Huang, D.; Wen, X.; Chen, S.; Cheng, M.; Deng, R.; Li, B.; Yang, Y.; Liu, X. Silver-based semiconductor Z-scheme photocatalytic systems for environmental purification. J. Hazard. Mater. 2020, 390, 122128. [Google Scholar] [CrossRef] [PubMed]
  3. Pargar, F.; Koleva, D.A.; van Breugel, K. Determination of Chloride Content in Cementitious Materials: From Fundamental Aspects to Application of Ag/AgCl Chloride Sensors. Sensors 2017, 17, 2482. [Google Scholar] [CrossRef] [PubMed] [Green Version]
  4. Sadovnikov, S.; Kozlova, E.; Gerasimov, E.; Rempel, A. Photocatalytic hydrogen evolution from aqueous solutions on nanostructured Ag2S and Ag2S/Ag. Catal. Commun. 2017, 100, 178–182. [Google Scholar] [CrossRef]
  5. Xue, J.; Liu, J.; Liu, Y.; Li, H.; Wang, Y.; Sun, D.; Wang, W.; Huang, L.; Tang, J. Recent advances in synthetic methods and applications of Ag2S-based heterostructure photocatalysts. J. Mater. Chem. C 2019, 7, 3988–4003. [Google Scholar] [CrossRef]
  6. Buckley, J.J.; Lee, A.F.; Olivi, L.; Wilson, K. Hydroxyapatite supported antibacterial Ag3PO4 nanoparticles. J. Mater. Chem. 2010, 20, 8056–8063. [Google Scholar] [CrossRef] [Green Version]
  7. Wang, X.; Li, S.; Yu, H.; Yu, J.; Liu, S. Ag2O as a new visible-light photocatalyst: Self-stability and high photocatalytic activity. Chem. Eur. J. 2011, 17, 7777–7780. [Google Scholar] [CrossRef]
  8. Daupor, H.; Wongnawa, S. Flower-like Ag/AgCl microcrystals: Synthesis and photocatalytic activity. Mater. Chem. Phys. 2015, 159, 71–82. [Google Scholar] [CrossRef]
  9. Tang, H.; Wang, Y.; Zhang, D.; Wu, K.; Huang, H. Shape-controllable synthesis and morphology-dependent photocatalytic properties of AgBr photocatalysts. J. Mater. Sci. Mater. Electron. 2016, 27, 6955–6963. [Google Scholar] [CrossRef]
  10. An, C.; Liu, J.; Wang, S.; Zhang, J.; Wang, Z.; Long, R.; Sun, Y. Concaving AgI sub-microparticles for enhanced photocatalysis. Nano Energy 2014, 9, 204–211. [Google Scholar] [CrossRef] [Green Version]
  11. Chen, X.; Dai, Y.; Wang, X. Methods and mechanism for improvement of photocatalytic activity and stability of Ag3PO4: A review. J. Alloys Compd. 2015, 649, 910–932. [Google Scholar] [CrossRef]
  12. Dong, H.; Chen, G.; Sun, J.; Li, C.; Yu, Y.; Chen, D. A novel high-efficiency visible-light sensitive Ag2CO3 photocatalyst with universal photodegradation performances: Simple synthesis, reaction mechanism and first-principles study. Appl. Catal. B Environ. 2013, 134–135, 46–54. [Google Scholar] [CrossRef]
  13. Dai, G.; Yu, J.; Liu, G. A New Approach for Photocorrosion Inhibition of Ag2CO3 Photocatalyst with Highly Visible-Light-Responsive Reactivity. J. Phys. Chem. C 2012, 116, 15519–15524. [Google Scholar] [CrossRef]
  14. Tian, J.; Liu, R.; Wang, G.; Xu, Y.; Wang, X.; Yu, H. Dependence of metallic Ag on the photocatalytic activity and photoinduced stability of Ag/AgCl photocatalyst. Appl. Surf. Sci. 2014, 319, 324–331. [Google Scholar] [CrossRef]
  15. Bhuiyan, M.S.H.; Maternaghan, T.J. Photographic Materials. In Reference Module in Materials Science and Materials Engineering; Elsevier: Amsterdam, The Netherlands, 2016. [Google Scholar] [CrossRef]
  16. Sophocleous, M.; Atkinson, J.K. A review of screen-printed silver/silver chloride (Ag/AgCl) reference electrodes potentially suitable for environmental potentiometric sensors. Sens. Actuators A Phys. 2017, 267, 106–120. [Google Scholar] [CrossRef] [Green Version]
  17. Han, C.; Ge, L.; Chen, C.; Li, Y.; Zhao, Z.; Xiao, X.; Li, Z.; Zhang, J. Site-selected synthesis of novel Ag@AgCl nanoframes with efficient visible light induced photocatalytic activity. J. Mater. Chem. A 2014, 2, 12594–12600. [Google Scholar] [CrossRef]
  18. Han, L.; Wang, P.; Zhu, C.; Zhai, Y.; Dong, S. Facile solvothermal synthesis of cube-like Ag@AgCl: A highly efficient visible light photocatalyst. Nanoscale 2011, 3, 2931–2935. [Google Scholar] [CrossRef] [PubMed]
  19. Sanzone, G.; Zimbone, M.; Cacciato, G.; Ruffino, F.; Carles, R.; Privitera, V.; Grimaldi, M. Ag/TiO2 nanocomposite for visible light-driven photocatalysis. Superlattices Microstruct. 2018, 123, 394–402. [Google Scholar] [CrossRef]
  20. Ziashahabi, A.; Prato, M.; Dang, Z.; Poursalehi, R.; Naseri, N. The effect of silver oxidation on the photocatalytic activity of Ag/ZnO hybrid plasmonic/metal-oxide nanostructures under visible light and in the dark. Sci. Rep. 2019, 9, 1–12. [Google Scholar] [CrossRef] [Green Version]
  21. Wang, M.; Ye, M.; Iocozzia, J.; Lin, C.; Lin, Z. Plasmon-Mediated Solar Energy Conversion via Photocatalysis in Noble Metal/Semiconductor Composites. Adv. Sci. 2016, 3, 1600024. [Google Scholar] [CrossRef] [Green Version]
  22. Zhang, X.; Chen, Y.L.; Liu, R.-S.; Tsai, D.P. Plasmonic photocatalysis. Rep. Prog. Phys. 2013, 76, 046401. [Google Scholar] [CrossRef] [PubMed] [Green Version]
  23. Guo, X.; Deng, D.; Tian, Q. One pot controllable synthesis of AgCl nanocrystals with different morphology and their photocatalytic activity. Powder Technol. 2017, 308, 206–213. [Google Scholar] [CrossRef]
  24. Bi, Y.; Ye, J. In situ oxidation synthesis of Ag/AgCl core–shell nanowires and their photocatalytic properties. Chem. Commun. 2009, 10, 6551–6553. [Google Scholar] [CrossRef] [PubMed]
  25. Zhu, M.; Chen, P.; Ma, W.; Lei, B.; Liu, M. Template-Free Synthesis of Cube-like Ag/AgCl Nanostructures via a Direct-Precipitation Protocol: Highly Efficient Sunlight-Driven Plasmonic Photocatalysts. ACS Appl. Mater. Interfaces 2012, 4, 6386–6392. [Google Scholar] [CrossRef]
  26. Wu, S.; Shen, X.; Ji, Z.; Zhu, G.; Zhou, H.; Zang, H.; Yu, T.; Chen, C.; Song, C.; Feng, L.; et al. Morphological syntheses and photocatalytic properties of well-defined sub-100 nm Ag/AgCl nanocrystals by a facile solution approach. J. Alloys Compd. 2017, 693, 132–140. [Google Scholar] [CrossRef]
  27. Mohandes, F.; Salavati-Niasari, M. Application of a new coordination compound for the preparation of AgI nanoparticles. Mater. Res. Bull. 2013, 48, 3773–3782. [Google Scholar] [CrossRef]
  28. Elsaeedy, H. A low temperature synthesis of Ag2S nanostructures and their structural, morphological, optical, dielectric and electrical studies: An effect of SDS surfactant concentration. Mater. Sci. Semicond. Process. 2019, 93, 360–365. [Google Scholar] [CrossRef]
  29. Xu, Z.; Han, L.; Hu, P.; Dong, S. Facile synthesis of small Ag@AgCl nanoparticles via a vapor diffusion strategy and their highly efficient visible-light-driven photocatalytic performance. Catal. Sci. Technol. 2014, 4, 3615–3619. [Google Scholar] [CrossRef]
  30. Cui, L.; Peng, Q.; Jiao, T.; Zhang, Q.; Zhou, J. Facile Preparation of Silver Halide Nanoparticles as Visible Light Photocatalysts. Nanomater. Nanotechnol. 2015, 5, 20. [Google Scholar] [CrossRef]
  31. Tang, Y.; Jiang, Z.; Xing, G.; Li, A.; Kanhere, P.D.; Zhang, Y.; Sum, T.C.; Li, S.; Chen, X.; Dong, Z.; et al. Efficient Ag@AgCl Cubic Cage Photocatalysts Profit from Ultrafast Plasmon-Induced Electron Transfer Processes. Adv. Funct. Mater. 2013, 23, 2932–2940. [Google Scholar] [CrossRef]
  32. Gatemala, H.; Thammacharoen, C.; Ekgasit, S. 3D AgCl microstructures selectively fabricated via Cl-induced precipitation from [Ag(NH3)2]+. CrystEngComm 2014, 16, 6688–6696. [Google Scholar] [CrossRef]
  33. Mostafa, M.; Ramadan, H.; El-Amir, M. Sorption and desorption studies of radioiodine onto silver chloride via batch equilibration with its aqueous media. J. Environ. Radioact. 2015, 150, 9–19. [Google Scholar] [CrossRef]
  34. Ao, Y.; Bao, J.; Wang, P.; Wang, C. A novel heterostructured plasmonic photocatalyst with high photocatalytic activity: Ag@AgCl nanoparticles modified titanium phosphate nanoplates. J. Alloys Compd. 2017, 698, 410–419. [Google Scholar] [CrossRef]
  35. Park, J.Y.; Lee, I.; Ham, J.; Gim, S.; Lee, J.-L. Simple and scalable growth of AgCl nanorods by plasma-assisted strain relaxation on flexible polymer substrates. Nat. Commun. 2017, 8, 15650. [Google Scholar] [CrossRef] [PubMed] [Green Version]
  36. Patterson, A.L. The Scherrer Formula for X-Ray Particle Size Determination. Phys. Rev. 1939, 56, 978–982. [Google Scholar] [CrossRef]
  37. Assis, M.; Filho, F.C.G.; Pimentel, D.S.; Robeldo, T.; Gouveia, A.F.; Castro, T.F.D.; Fukushima, H.C.S.; de Foggi, C.C.; da Costa, J.P.C.; Borra, R.C.; et al. Ag Nanoparticles/AgX (X = Cl, Br and I) Composites with Enhanced Photocatalytic Activity and Low Toxicological Effects. Chemistry 2020, 5, 4655–4673. [Google Scholar] [CrossRef]
  38. Amendola, V.; Bakr, O.M.; Stellacci, F. A Study of the Surface Plasmon Resonance of Silver Nanoparticles by the Discrete Dipole Approximation Method: Effect of Shape, Size, Structure, and Assembly. Plasmonics 2010, 5, 85–97. [Google Scholar] [CrossRef]
  39. Yang, S.; Xu, D.; Chen, B.; Luo, B.; Shi, W. In-situ synthesis of a plasmonic Ag/AgCl/Ag2O heterostructures for degradation of ciprofloxacin. Appl. Catal. B Environ. 2017, 204, 602–610. [Google Scholar] [CrossRef]
  40. Shume, W.M.; Murthy, H.C.A.; Zereffa, E.A. A Review on Synthesis and Characterization of Ag2O Nanoparticles for Photocatalytic Applications. J. Chem. 2020, 2020, 1–15. [Google Scholar] [CrossRef]
  41. Baia, L.; Muresan, D.; Baia, M.; Popp, J.; Simon, S. Structural properties of silver nanoclusters–phosphate glass composites. Vib. Spectrosc. 2007, 43, 313–318. [Google Scholar] [CrossRef]
  42. Shen, X.S.; Wang, G.Z.; Hong, X.; Zhu, W. Nanospheres of silver nanoparticles: Agglomeration, surface morphology control and application as SERS substrates. Phys. Chem. Chem. Phys. 2009, 11, 7450–7454. [Google Scholar] [CrossRef]
  43. Tóth, Z.-R.; Hernadi, K.; Baia, L.; Kovács, G.; Pap, Z. Controlled formation of Ag-AgxO nanoparticles on the surface of commercial TiO2 based composites for enhanced photocatalytic degradation of oxalic acid and phenol. Catal. Today 2020, in press. [Google Scholar] [CrossRef]
  44. Tóth, Z.-R.; Kovács, G.; Hernádi, K.; Baia, L.; Pap, Z. The investigation of the photocatalytic efficiency of spherical gold nanocages/TiO2 and silver nanospheres/TiO2 composites. Sep. Purif. Technol. 2017, 183, 216–225. [Google Scholar] [CrossRef]
  45. Yinghua, L.; Huan, W.; Li, L.; Wenquan, C. Facile Synthesis of Ag@AgCl Plasmonic Photocatalyst and Its Photocatalytic Degradation under Visible Light. Rare Met. Mater. Eng. 2015, 44, 1088–1093. [Google Scholar] [CrossRef]
  46. Kaushik, V.K. XPS core level spectra and Auger parameters for some silver compounds. J. Electron. Spectrosc. Relat. Phenom. 1991, 56, 273–277. [Google Scholar] [CrossRef]
  47. Hammond, J.S.; Gaarenstroom, S.W.; Winograd, N. X-ray photoelectron spectroscopic studies of cadmium- and silver-oxygen surfaces. Anal. Chem. 1975, 47, 2193–2199. [Google Scholar] [CrossRef]
  48. Weightman, P.; Andrews, P.T. The influence of the 4d bandwidth on the M4,5N4,5N4,5 Auger spectra of Ag in MgAg and AlAg alloys. J. Phys. C Solid State Phys. 1980, 13, 3529–3546. [Google Scholar] [CrossRef]
  49. Weng, B.; Qi, M.-Y.; Han, C.; Tang, Z.-R.; Xu, Y.-J. Photocorrosion Inhibition of Semiconductor-Based Photocatalysts: Basic Principle, Current Development, and Future Perspective. ACS Catal. 2019, 9, 4642–4687. [Google Scholar] [CrossRef]
  50. Sun, L.; Liu, C.; Li, J.; Zhou, Y.; Wang, H.; Huo, P.; Ma, C.; Yan, Y. Fast electron transfer and enhanced visible light photocatalytic activity by using poly-o-phenylenediamine modified AgCl/g-C3N4 nanosheets. Chin. J. Catal. 2019, 40, 80–94. [Google Scholar] [CrossRef]
  51. Tauc, J. Optical properties and electronic structure of amorphous Ge and Si. Mater. Res. Bull. 1968, 3, 37–46. [Google Scholar] [CrossRef]
Figure 1. Structural properties of AgCl photocatalysts: (a) X-ray diffraction (XRD) patterns of AgCl photocatalysts prepared using different shape-tailoring agents (); polyvinylpyrrolidone (PVP) and sodium dodecyl sulfate (SDS)), alkali metals (Na+, K+) and H+; diffraction patterns of (b) AgCl_NaCl_PVP and (c) AgCl_HCl_NØ.
Catalysts 11 00379 g001
Figure 2. Morphological investigation of AgCl-based samples: (a) scanning electron microscopy (SEM) micrographs and (b) particle size distribution of AgCl photocatalysts prepared using different shape-tailoring agents (; PVP and SDS), alkali metals (Na+, K+) and H+.
Catalysts 11 00379 g002
Figure 3. (a) Band gap energy values and (b) photocatalytic performance of AgCl photocatalysts.
Catalysts 11 00379 g003
Figure 4. Effect of PVP amount on the structural properties of AgCl photocatalysts (intensity ratio of the (111)/(200) crystallographic planes—red line; intensity ratio of the (220)/(200) crystallographic planes—black line).
Catalysts 11 00379 g004
Figure 5. Effect of PVP amount on the morphology of AgCl (SEM micrographs—top row; transmission electron microscopy (TEM) micrographs—bottom row).
Catalysts 11 00379 g005
Figure 6. Effect of PVP amount on (a) the band gap energy and (b) conversion values.
Catalysts 11 00379 g006
Figure 7. Ag 3d X-ray photoelectron spectroscopy (XPS) spectrum of AgCl_HCl_PVP, showing the presence of different silver species.
Catalysts 11 00379 g007
Figure 8. Characterization of AgCl photocatalysts after photocatalytic processes: effect of chloride source and shape-tailoring agent (top row): (a) optical and (b) structural properties; effect of PVP amount (bottom row): (c) optical and (d) structural characters.
Catalysts 11 00379 g008
Publisher’s Note: MDPI stays neutral with regard to jurisdictional claims in published maps and institutional affiliations.

