A Review of Microwave-Assisted Synthesis-Based Approaches to Reduce Pd-Content in Catalysts


Oak Ridge National Laboratory, P.O. Box 2008, Oak Ridge, TN 37831-6472, USA
*
Authors to whom correspondence should be addressed.
Catalysts 2020, 10(9), 991; https://doi.org/10.3390/catal10090991
Submission received: 10 August 2020
/
Revised: 26 August 2020
/
Accepted: 28 August 2020
/
Published: 1 September 2020
(This article belongs to the Special Issue Palladium-Catalyzed Reactions)
Abstract
:This review article focuses on the latest advances in the synthesis of inorganic nano-catalysts using microwave heating, which has progressed significantly since its initial implementation in the mid-1980s. Over the years, nanoparticles (NPs), which inherently offer better surface accessibility for heterogeneous catalysis, have been synthesized using a wide array of heating methods. Microwave heating is one such method and employs a unique heating mechanism that can have several benefits for catalysis. When compared to conventional form of heating which relies on inter-layer mixing via convection, microwave heating operates through the chemical polarity in the target chemicals leading to an “inside-out” mode of heating. This heating mechanism is more targeted and therefore results in rapid synthesis of catalytically active NPs. Platinum group metals (PGM) have classically been the focus of nano-catalysis; however, recent efforts have also applied non-PGM group metals with the goals of lower costs, and ideally, improved catalytic reactivity and durability. This is especially of interest with respect to Pd because of its current historically high cost. Investigations into these new materials have primarily focused on new/improved synthetic methods and catalytic compositions, but it is important to note that these approaches must also be economic and scalable to attain practical relevance. With this overarching goal in mind, this review summarizes notable recent findings with a focus on Pd-dilution and microwave heating in a chronological fashion.
1. Introduction
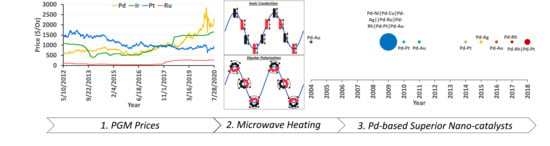
Microwave heating (µwH) for material synthesis has advanced significantly since its initial application in the mid-1980s. As an alternative heating mode that allows high throughput syntheses, µwH offers several distinct advantages that can be divided into three key points. First, heating resulting from the dipolar nature of the molecules as well as ionic conduction, also termed as “inside-out” heating, is more homogenous throughout the bulk material. Second, the rapid heating associated with µwH can result in “hot-spots,” and with proper control, this can be harnessed for synthesizing materials that would otherwise be metastable. Third, and most important, usage of µwH can increase the overall synthesis throughput, ultimately leading to a much higher research efficiency. While the first usage of µwH in synthetic chemistry was for the synthesis of TiO2 spheres [1], its applicability was also reported in organic synthesis shortly thereafter [2,3]. Over the years, µwH usage in chemical synthesis has been increasingly explored (Figure 1) and has been the main source for some interesting Pd-based bimetallic compositions which is the focus of this review.
1.1. Basics of Microwave Heating
Microwaves are electromagnetic waves with the frequencies between infrared and radio, specifically 300 MHz to 300 GHz [4]. The commonly used microwave frequency is regulated at 2.45 GHz (λair = 12.2 cm) in order to avoid interference with other applications (telecommunications, radar etc.,) and is in the center of unlicensed industrial, scientific, and medical (ISM) radio bands; therefore, it does not need to be certified by Federal Communications Commission. Importantly, energies associated with microwave radiation is very small and unable to cleave chemical bonds. For example, energy at 2.45 GHz is only 1.0 × 10⁻⁵ eV and can only affect molecular rotations. Therefore, µwH will not induce molecular changes causing a chemical reaction. Heat is generated primarily in two ways in µwH: ionic conduction and dipolar polarization (as shown in Figure 2A,B). The former occurs as ions move due to changes in the direction of the electric field resulting in friction and collisions. Dipolar polarization arises because of polarity of the reactant molecule. Polar molecules with inherent dipoles align themselves with an alternating electric field causing inter-molecular collision, friction, and rotation. A combined effect of both the ionic conduction and dipolar polarization results in an overall temperature increase. As a result of these two phenomena and due to “inside-out” heat origin, microwave heating is very rapid. Synthesis times can be reduced significantly leading to higher throughput and would thus be favorable for industrial scalability. On the other hand, heating in oil baths or with conventional heating (CvH) methods is due to interlayer mixing. External heat source transfers heat energy to the solvents and ultimately to the reactants via convection, which is much slower than µwH. Large temperature gradient exists throughout the reaction vessel leading in an overall poor temperature control. While stirring the reaction mixture helps overcome this issue, attaining the desired reaction temperature is not as rapid as µwH. As shown in Figure 2C–D, temperature profile comparisons after identical times show that µwH results in faster and more homogeneous heating [5]. Reaction tube in Figure 2C shows that maximum attained temperature is ≈50 °C higher for µwH, homogeneous, and located in the desired reaction region. CvH clearly results in less efficient heating with a temperature gradient also visible (Figure 2D).
1.2. Mechanism of µw Heating
Power-output of µwH is calculated by the following Equation:
where P is power output, c is a constant, E is material’s electric field, ε′ and ε″ are dielectric constant and dielectric loss constants, respectively. It is important to emphasize here that units for all these parameters matter and consistencies must be maintained to obtain accurate calculation results. The relative complex electrical permittivity εr is given by Equation (1) shown below where ε′ and ε″ are real and imaginary components. A materials ability to store energy under the electric field is denoted by εʹ whereas the imaginary component, ε″, represents ability of dielectrics to disperse that stored energy, a.k.a. losses. Where magnetic properties do not need to be considered, dielectric constant, ε′, represents relative permittivity which is a measure of polarizability of molecules in the electric field whereas ε″, is a measure of electromagnetic radiation conversion into heat (ability of a material to heat in the microwave). For magnetic materials, microwave adsorption depends both on permittivity and permeability (μ) and magnetic energy losses need to be carefully considered. For a material to be able to be heated using µwH, favorable dielectric properties are required. Microwave absorption is related to material’s permittivity by Equation (2), where E0 is the electric field intensity on the boundary surface, Ex is intensity at a depth of x, and Dp is penetration-depth of a material which can be described in detail using Equation (3) where α is the attenuation factor, λ0 is the wavelength, ε′ and ε″ are again dielectric and dielectric loss constants respectively. Penetration-depth, Dp, gets simplified to Equation (4) for materials with low dielectric losses (ε″/εʹ ≪ 1)). Penetration-depth can also be simply defined as the point where microwave power is 37%, (Euler’s number)−1 of the total incident power and is a function of temperature and frequency. It is inversely proportional to the applied microwave frequency and varies to a larger extent for strong microwave absorbing solvents. A permanent dipole is needed that rules out the possibility of heating gases as molecules do rotate under µwH but the separation among them is very large. Microwave heating characteristic of a material is described by loss tangent or energy dissipation factor, tan δ, which is the ratio of the two constants, i.e., ε″/ε′. Table 1 shows loss tangent values for some common solvents along with corresponding boiling points. A solvent with a high loss tangent value can be used for rapid heating under µwH, however, boiling points must also be considered for safe operation. For example, dichloromethane cannot be heated beyond 163 °C, whereas for nitrobenzene, the reaction temperature can be as high as 397 °C. Furthermore, overall suitability of a reaction solvent is not only contingent on a high loss tangent value and the boiling point, but also its high reducing ability for the reactant chemical species. Most commonly used reaction solvents such as water, ethylene glycol (EG), and N-N′-dimethylformamide (DMF) qualify all of these criteria and therefore, have been widely used for the synthesis in past.
P = c·|E|2·f·ε″ = c·|E|2·f·ε′·tan δ
Loss tangent, tan δ, decreases for solvents with an increase in temperature meaning microwave heating is more challenging at higher temperatures [6,7]. For more suitable solvents such as water, where loss tangent values are higher, temperature-based decline can be particularly significant. Horikoshi et al. reported an interesting study where effects of different microwave frequencies (2.45 and 5.8 GHz) were used to study the effects on TiO2 photoactivity via degradation of three different organic molecules 4-chlorophenol, bisphenol A, and methylene blue [6]. It was found that the higher frequency of 2.45 GHz resulted in a better TiO2 photoactivity than 5.8 GHz. While temperature vs. irradiation time profiles for the two frequencies were very similar, stark differences between the two frequencies were clearly seen for dielectric-loss-values. As shown in Figure 3A, a proportionate gap between dielectric loss factor values and different temperature dependent behaviors were clearly observed. When increasing the reaction temperature from 22 to 99 °C, the decrease in dielectric loss factor values was larger for the smaller frequency: 72% for 2.45 GHz vs. 60% for 5.8 GHz (Figure 3A). The penetration-depth increase associated with increasing the reaction temperature from 22 to 99 °C was also frequency dependent; it increased 2.7x for 2.45 GHz (1.8 to 4.8 cm) but only 1.8x for 5.8 GHz (0.34 to 0.62 cm. Although heating efficiency was much greater for the higher frequency (5.8 GHz) as shown in Figure 3B, the lower microwave frequency of 2.45 GHz was more efficient in reacting with the three organic substrates.
Rate accelerations by µwH can be broadly explained by considering two mechanisms [8,9]. The first mechanism simply considers the thermal effect only and an unchanged reaction mechanism.
The second mechanism also considers non-thermal effects of microwave. It is theorized that microwaves can favorably interact with the reactant molecules as well as the reactant media. Controlled isolation of nonthermal effects and their complete understanding is very challenging [10,11]. Using Monte Carlo simulations, Conner and Tompsett studied microwave interactions with individual interfacial species and found that adsorbed or surface formed species interacted more favorably with microwaves [12]. Microwaves change the reaction profile because of differences in microwave absorption properties at the interfacial molecular species and in fact, may provide a more favorable reaction pathway and increase the reaction rate. Perreux and Loupy proposed that pre-exponential factor, A, of the Arrhenius equation, A exp(−ΔG/RT), is larger for microwave heating meaning probability of intermolecular collision under microwave heating is higher [10]. Overall nonthermal microwave effects may include higher collision frequencies and also a possible excitement of rotational or vibrational transitions [13].
Roles of several relevant reaction factors such as µw-power input, solvent, sample type (homogeneous vs. heterogeneous) and volume were studied for organic reactions and compared with identical CvH experiments by Gedye and co-workers [14,15]. Microwave heating resulted in increased reaction rates, of up to 1240x, and such enhancements were observed under a high concentration of ions and the reactions were scalable [14,15]. Microwave absorption properties of the reaction vessel material is yet another important factor while determining operability and scalability aspects of a reaction. Most commonly used reaction flasks are made of borosilicate which has relatively low loss tangent values ensuring minimal heating contribution and negligible interference to the reaction mixture. In this area, Keppe et al. notably studied reaction vessels made of SiC ceramic material in addition to the typical Pyrex glass and attempted to explain specific or nonthermal microwave effects [16,17,18,19,20]. As shown in the Table 2, SiC has a very high microwave absorptivity and therefore, shields its contents from the electromagnetic field effects. Therefore, control reactions in SiC vessel when carried out under µwH provide a direct comparison with CvH results. A comparison of the results between the Pyrex and SiC reaction vessels may help in understanding the nature of electromagnetic field effects since it is only present in the Pyrex vessel. Authors carried out a multitude of organic synthesis reactions and confirmed that in most cases, rate enhancements are bulk temperature related, while special and nonthermal microwave effects were non-existent. Kuhnert et al. also explored special and nonthermal effects of microwaves and cautiously noted that neither of these effects are real and enhanced reaction kinetics under µwH can be explained by superheating and concentration effects [21]. The findings by Jacob et al. also supported rate enhancements due to the thermal reasons only [9]. They concluded that microwave interaction with materials and rapid reactions involve mainly formation of hot spots, molecular agitation, and better diffusion of molecules.
It is fair to say that µwH rate enhancements in majority of cases has been explained as purely thermal phenomena and existence of non-thermal effects remain somewhat unlikely and elusive. This topic may warrant further investigations wherein experimental conditions, especially if temperature profiles between µwH and CvH can be more accurately matched.
1.3. Importance of Pd in Emission Control
Another important aspect of this review is catalysis based on platinum group metals (PGMs). Platinum group metals (PGMs) comprise of six chemically similar transition metals which are widely applicable in the field of catalysis, electronics and medicine [22]. The elements Ru, Rh, Pd, Os, Ir, and Pt have all distinct advantages and are applicable to a multitude of catalytic applications [23,24,25,26,27,28]. Our focus here is Pd which is a versatile metal for a series of catalytic reactions such as cross-coupling, oxidation/reduction in three-way catalytic (TWC) converters, diesel oxidation catalysts (DOCs), and denitrification of water [29,30,31,32,33]. Historically speaking, identification of auto-emission problems can be traced back to the early 1950s when a California researcher identified that auto traffic was the underlying cause for smoggy skies [34]. Smog formation is a photo-induced reaction between unburnt hydrocarbons (HCs), oxygen, and various nitrogen oxides (NOx) and consists of ozone (O3), aldehydes, peroxyacyl nitrates (PANs), and nitric acid. Discovery of the autocatalytic converter in France and later in the United States by Eugene Houdry, and scientists at the Engelhard Corporation may be considered as the greatest environmental invention of all time. This clearly paved the path for development of new emission control technologies in conjunction with regulations implemented by the U.S. Environmental Protection Agency (EPA) and heavy reliance on PGMs has ensued. The arrival of the TWC was another landmark development with the ability of a single component that could remove the three regulated exhaust constituents with the following reactions: 1) CO oxidation, (2) HC oxidation, and 3) NOx reduction.
Earlier automotive emission control catalysts contained Pt and Pt-Pd in different compositions and were effective for complete oxidation of CO and HCs in the early 1970s [35,36]. Implementation of stricter NOx regulations in the 1980s necessitated higher efficiency and was attainable by Rh incorporation [37]. Various formulations of Pt-Rh could be successfully used for the simultaneous conversion of CO, HCs, and NOx. A synergistic effect was also discovered between these two metals since Pt helps maintain Rh in well-dispersed catalytically active state under high temperature oxidative conditions [38,39,40,41]. Pt-Rh based catalytic formulations became cost prohibitive due to high prices and limited global supply of the two constituent metals and metal substitutes were explored. Pd emerged as a promising candidate since it is the most abundant noble metal and its price was 25–40% of Pt in the early 1990s [42,43]. Additionally, Pd is thermally more stable than Pt and provides a more robust catalytic formulation under high-temperature vehicle operating conditions. Limitation of using Pd also seemed to be mitigated to a great extent due to better overall quality of fuels with an almost 0 lead levels and historically low sulfur levels [44,45]. A notable achievement therefore was replacement of Pt with Pd in the form of Pd/Rh catalyst in 1989 which showed an improved light-off as well as NOx reduction capabilities [46,47,48]. Pd alloying with Rh and formation of PdO rather inhibited the activity of Rh counterpart, and surface segregation of Pd also took place. These challenges were finally overcome 5 years later in 1994 when the Ford Motors and Engelhard used the Pd-only TWC in order to successfully meet the emission goals.
Almost 25 years later now when the auto industry faces stricter emission challenges, role of Pd in the automobile emission control has seemingly become even more central. This is one of the reasons for recent surge in global Pd prices as shown in Figure 4. Especially since the automotive industry accounts for around 85% of global Pd demand which underlines the dependence of emissions control auto-technologies on the Pd chemistry. With few exceptions, Pd:Pt price ratios had historically been <1, but since the end of 2017 (inset Figure 4), this trend has reversed. Pd prices rose above $2000/troy-oz in early 2020 and is currently >2x the price of Pt.
This scenario creates a clear need for limiting or diluting Pd usage in vehicle emissions control technologies. One potential approach to this dilution is to replace Pd with strategically selected base metals. Furthermore, atomic dilution at the nanoscale may lead to “synergistic effects” where resulting hybrid catalysts are more reactive than the monometallic counterparts. Additionally, bimetallic nanoscale mixing may result in novel and enhanced properties that have relevance to both applications and fundamental research. Coupling µwH with such bimetallic dilution strategies may open further avenues for future research in this field.
This review intends to focus on a few critical discoveries where µwH heating has been successfully applied for the synthesis of Pd-containing bimetallic nanoparticles. Although the studies were not directly used for emissions control applications, the approaches highlighted are intended to elucidate the potential of µwH for the synthesis of Pd-based hybrid nano-catalysts with the goal to guide future work. The content below will follow the year-based sequence in which these works were published with the sole focus being µw-assisted synthesis and applications.
2. Synthesis of Pd-Based Bimetallic NPs using µwH
2.1. Microwave Synthesis of Au Core-Pd Shell Nanoparticles
Core-shell catalysts have been an intense area of research over the past several years, and Harpness and Gedanken reported a first-ever microwave assisted synthesis of Au core-Pd shell nanoparticles using polyol method back in 2004 [49]. Using a power cycling method (900 W, on: 21 s and off: 9 s) with ethylene glycol (EG) as the solvent could successfully reduce both Au3+ (HAuCl4) and Pd2+ (K2PdCl4) under µwH. They used a comprehensive set of analytical techniques such as powder X-ray diffraction (XRD), X-ray photoelectron spectroscopy (XPS), transmission electron microscopy (TEM), high-resolution transmission electron microscopy (HRTEM), and energy dispersive X-ray spectroscopy (EDX) to thoroughly understand the structure of Au-Pd bimetallic nanostructures. Au core-Pd shell atomic structure was confirmed using the above-mentioned analytic tools. While XRD analysis showed pure unshifted Pd peaks, EDX analysis confirmed Au core-Pd shell geometry (Figure 5). These bimetallic NPs were almost equimolar in composition (molar %Au: 48 and molar %Pd: 52) with sizes around 12 nm and a Pd shell thickness of 3 nm. Authors also provided a mechanistic explanation for formation of such core-shell geometry, and under the reaction conditions, oxidation of EG to acetaldehyde took place which led to Au3+ reduction followed by Pd2+ reduction onto the existing Au cores. This was one of the first reports to apply µwH for the synthesis of Pd-containing NPs.
2.2. Microwave Aynthesis of (Ni/Ru/Rh/Pd/Pt)–(Cu/Ag/Au) Alloy NPs for CO Oxidation
Deploying alloys can lead to enhanced catalytic activities and improved stability although there can be significant variabilities. A systematic study of bimetallic alloy NPs was reported by El-Shall and co-workers in 2009 where they synthesized 19 distinct equimolar bimetallic compositions, including 7 Pd containing (PdNi, PdCu, PdAg, PdRu, PdRh, PdPt, PdAu) ones and evaluated them for CO oxidation reaction [50]. Bimetallic and monometallic analogues were synthesized under µwH using ligating solvents oleic acid (OA), oleic amine (OAm), and DMF-solutions of metallic precursors using a power cycling method (1000 W, on: 30 s and off: 5 s, total time: 1–15 min). As is common with separation of colloidal particles, selective precipitation was performed using ethanol, and ethanol-toluene mixtures. For the supported nano-catalysts, the authors synthesized NPs and the CeO2 support in situ and surfactant removal was done using calcination in air at 500 °C. XRD analysis showed that peaks for bimetallic NPs in all cases were shifted compared to the pure metallic counterparts and no monometallic peaks were observed. These results indicate co-nucleation and ripening of bimetallic-only nuclei resulted in alloyed NPs. Furthermore, no metal oxide peaks were observed showing that OA-OAm ligand binding to the NP surface provided effective surface protection even when ambient atmosphere was used during all syntheses (particularly relevant for Ni and Cu). All the metals showed thermodynamically stable crystal structures at the nanoscale. While Cu, Ag, Au, Pd, and Pt exhibited FCC crystal structure, Ni showed CCP with minor peaks corresponding to HCP, and HCP was observed for Ru. Alloyed combinations of these metals showed FCC phases for all cases. Size analysis (TEM) showed that these NPs are all below 50 nm albeit with shape, structural, and composition-dependent variations (Figure 6). For example, AgCu, AgAu, PtAg, RhAu, RuAu, PdPt, PdCu, PdNi, and PtNi alloys were all spherical in nature with an average diameter between 5 and 12 nm whereas larger (12–15 nm) distinct rod-like morphologies were observed for PdAg, PdRu, PdRh NPs. The morphology of the ~20 nm PtRh was a distorted cube-like structure, a hybrid of the cubic Pt NPs and prism-like Rh NPs (Figure 6).
The researchers also verified the nanoscale homogeneous alloying of these bimetallic alloys using EDX analyses. HRTEM analysis showed lattice fringes and stacking faults as well twin planes which may arise due to heteroatomic substitution of one metal by the other. This occurred either at the dissolved state in supersaturated solution or during the nanocrystal formation stage and can be explained by the alloying behavior [51]. Absorption and emission spectroscopies were also used to substantiate the alloyed nature of AgAu, PdCu, PdAg, and PdAu NPs and as expected optical characteristics of alloy NPs were between the two comprising metals (Figure 7). XPS analysis also confirmed the presence of two metals for the bimetallic alloys and showed some surface segregation, especially for Cu.
Authors also evaluated the reactivity of CeO2 supported bimetallic alloys using a gas-phase flow method (4 wt% CO, 20 wt% O2 in He; total flow: 100 sccm). Calcination at 500 °C for ligand removal was critical to observe appreciable activity and prevent rapid deactivation for these NPs. For pure metallic NPs, Pd, Cu, and Rh were most active with T50 values of 63, 82, and 113 °C (Figure 8A). Among bimetallics, PdCu was the most active for CO oxidation with a T50 (temperature in °C for 50% conversion) of 74 °C with 94% conversion obtained at 86 °C (Figure 8B). T90 (temperature in °C for 90% conversion) values for PdCu, PdPt, and RhCu were 86, 152, and 158 °C, respectively, showing these compositions are highly active. Overall catalytic activity for CO oxidation followed the order PdCu > RhCu > PdAu > RhAu > RhPt > RhPd > PtAu (Figure 8B). Alloying both Au and Cu with Pd seemed to improve the catalytic behavior, and although Pd-only was the most active catalyst on its own these equimolar alloys point to the potential of an active catalyst with less Pd in the alloy form.
While this study successfully synthesized various bimetallic compositions, their work on Pd-containing alloys is of specific interest and has been followed up by several researchers over the years [52,53,54]. Their choice of catalytic studies is also relevant to the current emission standards including U.S.DRIVE goal which focuses on 90% conversion of criteria pollutant gases at 150 °C [55].
2.3. Synthesis of Composition Tunable Pd-Pt Core-Shell NPs under µwH for Oxygen Reduction and Methanol Oxidation Reactions
Fuel cells generally require a high concentration of Pt to maintain a relevant energy density for their specific application, yet there is significant demand to decrease the Pt content to allow fuel cells to be less expensive. With this in mind, researchers have investigated substitution approaches that include using Pd in addition to Pt. Although, the prices of the two metals recently flipped, the general techniques outlined by Zhang et al. [56] and Golikand et al. [57] highlight an approach to substituting one for the other in this electrochemical application that must maintain oxygen reduction reactivity (ORR) at a level as high as possible. The direct methanol fuel cell (DMFC) is currently limited by ORR kinetics as well as CO poisoning of Pt during the methanol electro-oxidation reaction (MOR). In 2010, Zhang et al. mixed the then less-expensive Pd with Pt and synthesized a wide range of compositions of Pd-Pt core-shell NPs using µwH and evaluated them for the above mentioned electrocatalytic reactions [58]. The researchers used K2PtCl4 and PdCl2 as the precursors for the two metals and cetyltrimethylammonium bromide (CTAB) as the capping and structure directing agent. Synthesis was carried out under basic conditions, and ascorbic acid (AA) was used as the reducing agent. Molar ratios of Pd:Pt were varied as 3:1, 1:1, 1:2, 1:3, and 1:5. The role of µwH was instrumental in achieving a one-step rapid synthetic method (3 min) for compositionally tunable Pd-Pt core-shell NPs. TEM imaging analysis showed that the pure Pd NPs were uniformly cubic in nature with an average edge length of 25 nm (Figure 9A). Pure Pt NPs on the other hand were spherical with an overall 3D porous geometry comprising of small, 3–4 nm NPs and an overall larger diameter of 30 nm (Figure 9B). Roughness of cubic surface was seen once Pt was incorporated to the existing Pd nanocubes. For example, Pd:Pt in a 3:1 molar ratio resulted in 25–30 nm nanocubes with the rough surface consisting of 3–4 nm Pt NPs in an overall core-shell geometry (Figure 9C). The geometry of the core-shell NPs transitioned toward spherical shape once more Pt was incorporated (Figure 9D–G). As shown in Figure 9G, for Pd:Pt molar ratio 1:3 sample, spherical somewhat larger porous structure with an average diameter of 30–40 nm were obtained. This porous structure with higher Pt content comprised of many interconnected NPs with an average diameter of 3–4 nm. TEM analysis confirmed overall crystallinity of such Pd-Pt core-shell NPs and lattice spacing measurements also indicated Pt-rich shells. XRD (Figure 9H) measurements showed FCC phase (fm3m space group) in all cases and size variations were observed with varying bimetallic compositions-increasing Pt incorporation in the form of peak broadening because of a larger occurrence of small (≈3–4 nm) Pt NPs. Because of peak overlaps between FCC Pd and Pt in XRD however, exact size determination of Pd-Pt core-shell could not be performed.
Electrochemical measurements were used to study Pt surface coverage in the Pd-Pt core-shell with the differing molar ratios. Cyclic voltammetry (CV) in 0.5M H2SO4 showed adsorption peak for H atom adsorption between −0.25 and 0 V whenever Pd was present. Anodic peak indicating atomic H adsorption for the Pd-Pt core-shell NPs were seen for the bimetallic compositions until a complete Pt shell formation was achieved at Pd:Pt = 1:3; no such peak was observed for pure Pt, whereas Pd showed a peak at ≈0.15V (Figure 9I). This peak also shifted to larger negative values with increasing Pd content. As expected, ORR polarization curves showed higher values of maximum ORR current density for as-prepared Pt compared Pd NPs. Half-wave potentials for the bimetallic Pd-Pt core-shell were improved compared to pure Pt NPs (Figure 10). In fact, the obtained activity varied as Pd-Pt core-shell (Pd:Pt = 1:3) > Pd-Pt core-shell (Pd:Pt = 1:2) > Pd-Pt core-shell (Pd:Pt = 1:1) > Pd-Pt core-shell (Pd:Pt = 1:5) > Pd-Pt core-shell (Pd:Pt = 3:1) > Pt > Pd showing that Pd-Pt core-shell (Pd:Pt = 1:3) NPs were the most active catalyst (Figure 10A). Mass activity calculations at 0.8 and 0.85 V showed that Pd@Pt (Pd:Pt = 1:3) was 28 and 11x more active than pure Pt NPs (Figure 10B). Authors’ explanation for such enhanced activity for the core-shell geometry was that such structure provides an ideal reaction surface with optimized O–O bond cleavage as well as O–H bond formation making overall ORR more favorable. In fact, this core-shell geometry assists in the attainment of optimally placed d-band center. A d-band center located lower in energy leads to the formation of O–H bond and adsorbate binding is unfavorably weaker. A higher energy d-band on the other hand results in the stronger adsorbate binding, easier O–O bond cleavage, and M–OH formation but the cleavage of the latter (M–OH) is harder [59,60]. Therefore, pure Pt readily forms Pt–OH and results in slower ORR kinetics and activity. In the Pd-Pt core-shell case, electron donation from Pd to Pt occurs and Pd develops partial positive charge and Pt bears a partial negative charge. This in turn leads to the shifting of the d-band center of the overall system. The Pt shell around the Pd core for Pd:Pt = 1:3 is optimized so that overall best ORR activity is observed. A higher Pt-content results in thicker Pt shell, and thus limits inter-atomic electronic transfer; a thin Pt-shell on the other hand results in a partial synergy between the two metals.
The researchers also used electrocatalytic methanol oxidation reaction (MOR) in the acidic media as a reactionary probe to further illustrate the advantage of the Pd-Pt core-shell geometry (Figure 10C). Pd-Pt core-shell and Pt NPs were both active toward this reaction with the well-defined methanol oxidation anodic peak appearing at 0.60 V in the forward sweep and 0.40 V in the backward sweep. Again Pd:Pt=1:3 core-shell NPs were the most active and further increase in Pt content led to activity decline. Oxidative removal of COads was facilitated with the core-shell geometry since Pd is an oxophilic metal and led to the formation of PdO/PdOx on the underlying Pd core. There was an optimum relative concentration of the two metals and the peak mass current density for Pd:Pt = 1:3 NPs was 376 mA (mg Pt)−1.
Chronoamperometric measurements for MOR reaction showed that the current decay obtained using Pd:Pt = 1:2 and Pd:Pt = 1:3 glassy carbon electrodes (GCEs) was lower than pure Pt and Pd:Pt = 1:1 (Figure 10D). This indicated a lower surface poisoning from the intermediate species during the MOR for the optimum core-shell surface. In summary, µwH was used as an effective heating method to synthesize various compositions of Pd-Pt core-shell NPs for better ORR and MOR reactivity.
2.4. Synthesis of Bimetallic Pd-Au and Pt-Au NPs under µwH and CvH Conditions
Although Au, Pt, and Pd are all expensive materials, looking for interactions between them and understanding the impact of substituting one for the other is a key consideration because of the historical volatility of their prices. Belousov et al. reported the synthesis of Au-containing bimetallic NPs under µwH using high-pressure reaction conditions [61]. Such syntheses were carried out using quartz autoclaves and under the power-cycling method with 8 s on-time and 12 s off-time. The researchers explored Pd interaction with muriatic solutions of Au (oxidation state: +3) leading in Au (0) formation between 110–130 °C and carried out comparative analysis between µwH and CvH. The reduction of Au3+ in the presence of ≈10 nm Pd NPs was rapid (reaction 1; Scheme 1) and the solution color changed from yellow to red-brown in time as early as 1 min. Quantitative reduction of Au3+ at 110 °C was rapid and the reaction was complete within 10–15 min under µwH. XRD analysis revealed two phases corresponding to pure Pd and Pd-Au alloy. While reduction of Au3+ in the presence of Pd NPs is spontaneous, electrochemical recrystallization of Pd2+ was also concurrent and led to the solid-solution/alloy formation (reactions 2–3; Scheme 1). In fact, an electrochemical mechanism of growth was suggested where finer Pd NPs dissolved to form larger ones. Metallic composition determination under CvH showed that after 30 min, solid phase consisted of 39% solid solution with Au:Pd ratio of 53:47. Increasing the reaction time to 60 min resulted in a higher, 50% solid solution composition and a larger Au:Pd ratio of 60:40. Reaction under µwH resulted in similar metal ratios although with a higher yield of alloys and a much smaller fraction (≈ 15%) of pure Pd. Larger NPs formed upon alloying, for example 4 h contact reduction of Au3+ in the presence of 40 nm Pd NPs resulted in 100 nm bimetallic NPs. XPS analysis of these NPs showed a higher composition of Au with the Au:Pd ratio of 18:1. Using Ar+ sputtering (ion energy: 5 kV, ion current: 30 μA) and etching, the concentration of Pd was found to be larger toward the center of the NPs and decreased radially. As shown in Figure 11A, NPs comprised of a Pd-rich core covered by an intermediate Au-Pd alloyed sub-surface region and an Au-rich external surface. PdAu alloyed were formed first because of the diffusion of Au atoms along the grain boundaries. Thin Au shells were then coated onto the existing PdAu alloyed sub-surface resulting in these interesting NP geometries. Formation of such Au shells occurred mainly because of melting point depression, also called “submelting,” and is common at nanoscale [62]. The beneficial effects of µwH were seen in the form of better homogeneity among µw-prepared NPs where XRD patterns (Figure 12) were symmetric and sharper, Cv-prepared NPs on the other hand resulted in asymmetric and broad peaks due to inhomogeneity in the alloyed regions. A higher temperature of 130 °C did not result in completely reduced Au3+ due to shielding of Pd atoms which were at the core and isolated from the direct contact with the Au ions.
Results obtained for Pt-Au NPs were significantly different, no alloy phases were observed and peaks corresponding to only pure Pt and Au were seen. The reduction of Au3+ occurred in presence of both Pt2+ and Pt0 however, the rate was much faster in presence of the former. Contrary to the PdAu system, Au deposition took place on the Pt sites, and independently grew into uncontrollably large NPs. To conclude, authors illustrated advantages of using µwH for the synthesis of PdAu and PtAu NPs, and also provided mechanistic insight into their formation.
2.5. Microwave Synthesis of Pd-Pt Alloy Hypercube Alloy NPs
Continuing with the theme of Pd-Pt bi metallic systems with unique structures, Dai and coworkers synthesized Pd-Pt hypercubes using µwH in a one-step process with reaction times as short as 100 s [63]. Overall synthesis was quite convenient and tetra-ethylene glycol (TEG) was used as the solvent as well as the reductant, and chloride salts of the two metals (Na2PdCl4, H2PtCl6) were used. Constant power (1000 W) method was applied and reaction for 100 s in the presence of KI and PVP resulted in the hypercube nanostructures. The roles of PVP and KI were both found to be important for the synthesis of well-dispersed hypercubes. As shown in Figure 13, role of I− ions was found to be critical as structure-directing agent by favorably slowing the reduction kinetics due to the formation of anionic complexes, [PdI4]2− and [PtI6]2− whereas presence of PVP prevented aggregation. Hypercubes had average edge length of 22 ± 1.2 nm and their formation took place even without PVP although aggregation among the NPs was observed in that case. An optimum amount of KI was needed for the successful synthesis of such hyper-nanocubes. Less than optimum amounts of KI resulted in irregular shaped NPs with a small average diameter and incomplete hypercubic structural formation whereas larger amounts of KI resulted in hypercubes with thicker outside frames and porous side faces.
Authors used HRTEM and high-angle annular dark-field scanning transmission electron microscopy (HAADF-STEM) to obtain the structural details of these Pd-Pt hypercubes. The theoretical geometric model had good agreement with the experimentally observed HAADF-STEM images, and this analysis showed the presence of <111>, <200>, and <220> lattice planes and theoretically expected interplanar spacing values. Each hypercube was made of cubic core with 6 <100> square faces and 24 <110> isosceles trapezium lateral walls. XPS measurements showed that Pd and Pt in these hypercubes existed in zero oxidation states while XRD showed that the overall packing was FCC, which is to be expected for these two metals. Authors also did a detailed structural elemental quantification of such hypercubes using EDX analysis. Broadly speaking, the overall structure was alloyed with both Pd and Pt found in various regions of these hyper-nanocubes (Figure 14A–C). While Pd:Pt atomic % ratio in the cubic core for these structures was ~2, a value of 2.6 was observed for vertex linkages (Figure 14D,E). Trapezium lateral walls on the other hand were Pt rich, with a Pt:Pd atomic % ratio of 1.5 (Figure 14E) showing some degree of bimetallic heterogeneity throughout these nanostructures. Authors also showed oxidative etching using FeCl3 which led to dissolution of Pd from the lateral walls and outside edges, eventually collapsing it and leaving behind 1 hollow interior and 8 linkage branches.
A mechanism for the formation of such hypercubes under synthetic conditions was also provided. Formation of Pd nanocubes selectively capped by I− on <100> facets occurred first followed by galvanic replacement and eventual reduction of Pt4+ ions along the trapezium lateral walls. Here and during the subsequent steps, role of microwave was crucial in ensuring faster reaction kinetics. Under µwH, co-deposition of freshly reduced Pd and Pt atoms along the corners and edges (<111> and <110>) took place whereas selective bonding of I− to <100> planes ensured the overall formation of hypercubic structures. Homogeneous alloying and faster diffusion between Pd and Pt were also achieved because of µwH.
The authors employed these Pd-Pt hypercubes for electrocatalytic oxidation of methanol and formic acid (Figure 15). For the two electrocatalytic reactions, activity for these alloys were respectively 2.4x and 2.3x higher than Pt black. To summarize, authors used µwH for the synthesis of interesting hyopercube morphologies of electrocatalytically active Pd-Pt NPs in this study.
2.6. Microwave Synthesis of AgPd-Pd Core-Shell NPs/TiO2 Nanocatalysts for Hydrogen Production from Formic Acid in Water
Hattori et al. synthesized three different compositions of PdxAg(100−x)/TiO2 (x = 7, 10, 15) catalysts using µwH for H2 production from formic acid in aqueous solution [64]. Replacement of Au with Ag and evaluations of Ag-Pd core-shell NPs showed improved stability under catalytic operating temperature (>80 °C) as no CO formation was observed [65]. On the other hand, CO poisoning and activity decline were observed for the Au-Pd core-shell catalyst [66,67]. Authors improved upon their previous work where Pd18Ag82 alloy-Pd core-shell catalysts supported on TiO2 was synthesized in ethylene glycol at 176–178 °C in about 10 min [68]. The Pd18Ag82 alloyed core of this sample formed because of the high reaction temperature. Authors also discovered beneficial effects of the TiO2 support as it led to a 23-fold improvement in the H2 production activity when compared to the unsupported PdAg-Pd core-shell catalysts. Electron transfer from both Ag and TiO2 to Pd seemed to have occurred and was provided as an explanation for the enhanced activity. Since the PdAg alloyed structure was less active than the core-shell counterpart, the authors synthesized a lower Pd-content PdAg-Pd core-shell catalyst in a subsequent study (Figure 16) [64,65]. Alloyed cores of Pd07Ag93, Pd10Ag90, and Pd15Ag85 were synthesized in aqueous solutions at ≈100 °C with a Pd shell, and they were supported on TiO2. Overall synthesis was performed in stages. First, Ag cores were formed on anatase TiO2 support and then Pd was deposited on the Ag NPs in 0.5, 1, and 2 h. PdAg-Pd core shell catalysts were all around 4.5 nm in diameter and dispersed on the TiO2 support with an average size of 10 nm. Pd:Ag atomic ratios were also very similar, around 0.3 in all cases. XRD analysis showed the peaks for pure Ag, although some PdAg alloying was evident from the slight peak shifts; alloy compositions were calculated as Pd07Ag93, Pd10Ag90, and Pd15Ag85 using Vegard’s law [69]. XPS comparison analysis for the PdAg-Pd core-shell on TiO2 (0.5 h) showed binding energies for both Pd 3d5/2 and 3d3/2 shifting toward lower values (≈1.0 eV) when compared to the pure Pd NPs. This was attributed to electron transfer from Ag to Pd. Also, a peak shift of ≈1.2 eV for Ag 3d5/2 and 3d3/2 occurred indicting alloying behavior similar to Pd-rich PdAg alloys reported previously [70]. Supporting these PdAg-Pd core-shell catalysts on TiO2 led to further 3d5/2 and 3d3/2 peak shifts toward lower energies for both Pd and Ag; indicating electron transfer occurring between TiO2 and the two metals under the employed synthetic conditions.
Catalytic evaluations showed that H2 production rate of Pd07Ag93-Pd core-shell catalysts increased eight times from 27 °C to 90 °C to a value of ~372 Lg−1h−1. These Pd07Ag93-Pd core-shell catalysts were the most active (Figure 17A) and had 3x better performance than authors’ previous work using Pd18Ag82-Pd core shell catalysts [68]. Overall this activity was also 13x and 6x higher than previous work of well-defined Ag-Pd core-shell geometry at 20 °C [65] and Pd35Au35Co30 alloy NPs [71] respectively. The apparent activation energy calculation showed that the values increase systematically with an increase in Pd content. As x increased (7, 10, 15) in the PdxAg(100-x)-Pd core-shell catalyst, the atomic ratios of Pd shell to the PdAg alloy core decreased gradually (0.25, 0.21, 0.15). Thus, a higher Pd content led to a higher extent of alloying and overall diminished activity for H2 generation from formic acid (Figure 17B). Since reduction of Pd2+ on Ag or PdAg core was fast and complete in the first 30 min, it is reasonable that a longer reaction time led to a higher extent of Pd-Ag alloying in these NP cores. A thin Pd shell is advantageous for good activity [65], however, a higher nominal Pd content led to a thicker Pd shell first, and subsequently increased alloying, and eventually a smaller effective surface area of the Pd-shell with an end result being lower activity. This study was focused on the synthesis of AgPd-Pd core-shell NPs/TiO2 catalysts for H2 generation from HCOOH and authors observed a delicate balance between synthetic conditions for the formation of advantageous thin Pd-shell.
2.7. Synthesis of Various Compositions of PdxAu100-x Alloy NPs under µwH and a Comparative Catalytic Analysis for Probing such Nanostrcutures
A comprehensive study with the synthesis and potential applications for a wide range of PdxAu100-x alloy nano-compositions was reported under µwH [72]. Authors carried out a systematic time-dependent synthetic optimization of these NPs under µwH at 800 W at 150 °C and also compared the synthetic and catalytic results with CvH. Chloride salts of the two metals (K2PdCl4, and HAuCl4 hydrates) were controllably (via syringe pump) added to pre-heated EG solvent containing PVP (capping agent) and NaBH4 (reducing agent) for the synthesis. First, time-dependent alloying between equimolar concentrations of Pd and Au was studied. It was shown that initially Pd-rich small NP seeds with an average diameter of 2.12 ± 0.7 nm were formed followed by Au-incorporation with longer reaction times. Average diameter of the synthesized NPs grew to 2.47 ± 0.6 nm after 5 min at which point maximum Au-incorporation and optimum alloying had already occurred. Time-dependent size monitoring showed two distinct growth processes for such NPs (Figure 18A; top panel). The average size growth was relatively fast during the first 5 min (300 s), but size-changes were much smaller thereafter. NPs were mono-dispersed in all cases and PXRD analysis indicated cuboctahedral geometry as calculated by <111>/<200> intensity ratios. Analogous synthesis under CvH showed marked differences with nucleation and growth stages being less defined than µwH.
Interestingly, until 15 min (900 s) of reaction time, the average size of CvH-synthesized NPs was smaller, but the growth stayed continuous with longer reaction time (Figure 18A). For example, reaction times of 30 and 60 min under CvH resulted in larger PdxAu100-x NPs as shown in the Figure 18A. Although alloying between the two metals was observed even while using CvH, since Pd and Au are two classically miscible metals (Figure 18A; bottom panel), overall size control using CvH was inferior (Figure 18B). PXRD analysis of the <111> peak (Figure 18A; bottom panel) also showed that alloying under µwH was more rapid, and in fact the two metals were homogeneously distributed as seen with HRTEM-EDS. PXRD analysis of products obtained after different times also provided mechanistic insight into the formation of such alloys. As shown in the Figure 18C, formation of Pd-rich nanoclusters takes place in as little as 30 s with a smaller average size (≈2.1 nm) to which Au incorporation occurred via NaBH4 and Pd0-induced autocatalytic reduction of Au3+ resulting in the final alloys. Authors also applied µwH for the synthesis of larger PdxAu100-x alloy NPs; while the single-injection method did not result in substantial size growth, alloyed overlayers could be successfully deposited over µw-prepared PdxAu100-x alloyed nano-seeds.
Using the optimized synthetic conditions at 150 °C for 5 min, authors could successfully synthesize a total of nine compositions of PdxAu100-x alloy NPs. Upon higher Pd-incorporation, gradual peak shifts toward pure Pd occurred in PXRD analysis and indicated successful alloying (Figure 18D,E). TEM analysis showed similar average size (2.5–3 nm) for the intermediate PdxAu100-x (x = 10, 14, 18, 27, 42, 59, 71, 80, 90) compositions (Figure 18E). Bulk metallic compositions of these alloys were determined using ICP-OES and STEM-EDS analysis which showed expected compositions and confirmed alloying in all cases. The various compositions of PdxAu100-x were supported on amorphous silica and tested for the vapor phase hydrogenation of cyclohexene (CHE). CHE was chosen as it is a simple and industrially relevant substrate and facilitates comparative modeling studies due to its structural simplicity. As shown in the Figure 19A, appreciable catalytic activity was observed for all the Pd-rich PdxAu100-x compositions. CHE exposure led to higher hydrogenation activity initially with cyclohexane (CHA) being the sole product and steady-state was reached after ≈6 h in all cases. Such catalytic behavior was expected since NP-surfaces initially have highly reactive facets before rearranging and/or getting partially poisoned under the continuous reactant feed. Overall, Pd59Au41NPs were the most active catalyst with the steady-state turnover frequency (SS-TOF) values ≈4.7x when compared to the pure Pd catalysts. The five Pd-rich PdxAu100-x compositions (x = 42, 59, 71, 80, 90) were more active than the Pd100 NPs. Au-rich compositions: Pd27Au73, Pd18Au82, and Pd10Au90 had almost negligible activity after 6 h; in fact, Pd27Au73 had appreciable activity at the beginning before rapid restructuring of the active facets occurred and catalytic activity was completely lost after ≈3.5 h. Authors also studied physical mixture closest to the most active composition, Pd59Au41, and showed that physically mixing Pd100 and Au100 NPs and supporting them on SiO2 did not result in any catalytic improvement; in fact, physically mixed Pd100 and Au100 in a 2:1 ratio led to results very similar to the Pd100 (Figure 19B). This clearly indicated that synergistic effects between PdxAu100-x occurred only when the two hetero-atoms were mixed at the nanoscale. In order to explore whether observed activity was devoid of any SMSI effects, authors synthesized the most active PdxAu100-x composition on TiO2 and Al2O3 supports (Figure 19C). These supports were strategically chosen as SMSI probes, authors intended to see if comparable synthesis and support conditions resulted in drastically different activity. SS-TOF values of the three catalysts were very similar and therefore no SMSI effects occurred during catalyst-synthesis and evaluation conditions. The activity trends shown in Figure 19A were therefore true representative of NP-only activity. Authors also tested the CvH prepared analogues for the two most active PdxAu100-x compositions: Pd59Au41 and Pd42Au58. As shown in the Figure 19D, µw-prepared NPs were more active than their CvH counterparts. Authors later correlated this observation with surface analysis of these NPs using NMR. Overall µwH resulted in catalytically more active NPs because of the existence of reactive nanocrystalline facets as well as a much smaller amount of capped PVP, which enhanced site-accessibility to the substrates. Activation energies for CHE-hydrogenation on the most active PdxAu100-x were also calculated and were between 33.4 and 42.2 kJ mol−1 (Figure 19E).
DFT calculations were performed and by considering various types of atomic ensembles, variation in H-binding energy was calculated for different Pd compositions. As shown in Figure 20, an excellent match between experimental and theoretical results were observed. Calculated average H-binding energy values considering different ensembles for various compositions predicted a maximum at around 58% Pd content (blue curve; Figure 20A). Experimentally observed reactivity curve showed that Pd59Au41 NPs were the most active showing an excellent match with the theoretical predictions. While Pd was instrumental in oxidative cleavage of H2, presence of Au helped with the desorption of CHA products from the active sites thereby freeing vacant sites for further reaction and leading to higher activity. Pd59Au41 alloys provided the largest number of optimal Pd1Au2 and Pd2Au1 ensembles, and thus exhibited the maximum activity.
In a separate study, the authors also applied these PdxAu100-x alloy NPs for aqueous phase nitrite reduction reaction [73]. Denitrification of water is an important reaction as current state-of-the-art remedial process is wasteful and full of challenges therefore PGM-based treatments are enticing. As shown in Figure 21 below, a similar activity trend was observed with maximum activity being observed for Pd53Au47 NPs. Authors also illustrated structural beneficial effects of these alloys. As shown using red curve in Figure 21, the PdxAu100-x alloys being catalytically more active than the pure Pd NPs were also more resistant against sulfide fowling. These alloyed NPs showed appreciable nitrite reduction activity in the presence of sulfides. While Pd100 NPs lost 96% activity after sulfide exposure and had only 4% remaining activity, Pd44Au56 catalysts showed 21% retention of activity. The most active Pd53Au47 also retained 16% of the original activity post-sulfide fouling experiments. While small numerical improvements on a small scale, these may be considerably large improvements on an industrial/production scale. Alloying Au with Pd leads to higher activity and these NPs are also more durable. XPS analysis showed that sulfide fouling experiments resulted in surface segregation of Pd which might be responsible for declined activity. Authors also supported their experimental findings with the theory showing that a decrease in the Pd ensemble size on Au <111> should have weak S-binding affinity due to both electronic and strain effects.
Combination of these two studies showed rapid synthesis of various compositions of PdxAu100-x alloy NPs for cyclohexene hydrogenation and aqueous phase nitrite reduction applications.
2.8. Microwave Assisted In Situ Generation of Reduced Graphene Oxide Supported Pd-Pt Core-Shell NPs for Dehalogenation Reactions and Olefin Reductions
Goswami et al. used a one-pot µwH method for the synthesis of Pd-Pt core-shell NPs supported on reduced graphene oxide (Pd@Pt/rGO) for dehalogenation reaction of aromatic substrates and olefin reduction reaction with an excellent yield, selectivity, and recyclability [74]. Synthetic conditions were pretty straightforward, a premixed reactant solution comprising aqueous solution of the two metal chlorides (K2PdCl4 and K2PtCl6) were prepared with graphene oxide first. Using 0.1 M NaOH, the pH of the solution was then adjusted to 9 and various reducing agents such as NaBH4, L-ascorbic acid, and EG were individually evaluated to optimize the synthetic conditions. Upon stirring for 10 min and a short reaction time (3 min) at a constant power of 250 W, µwH was successful in co-reducing the two metals on the rGO support and forming well-defined spherical Pd@Pt/rGO NPs. Efficient µwH in the presence of a reducing agent was instrumental for the reduction of GO as well as Pd2+ and Pt4+. L-ascorbic acid was found to be the most efficient reducing agent for the synthesis of well-defined core-shell geometries. Reaction time of 3 min was also found to be optimum for the synthesis as even shorter times led to the formation of incomplete NPs, whereas extending the time did not lead to any structural improvements. Under these conditions, reduction of Pd2+ took place first, followed by initial adsorption, and then the subsequent reduction of Pt4+. This led to a well dispersed ≈95 nm core-shell NPs on the rGO support with a 10 nm layer Pt shell. Various analytical techniques were applied to fully ascertain the structure of these NPs. As shown in Figure 22A, powder XRD (PXRD) showed characteristic peaks of rGO. A broad diffraction peak at 2θ = 8.8°, which is indicative of the larger interlayer defect spacings and decreased during reduction (rGO formation), whereas a sharp diffraction line at 30.9° showed the typical graphitic nature of the support [75]. Another peak at 2θ = 24.7° was also observed and could be attributed to unoxidized graphitic domains [76]. Since Pd and Pt have similar lattice constants and same packing structure (FCC; Fm3m space group), as obtained in PXRD, there was significant peak overlapping and further analysis was needed (Figure 22B). The authors were eventually able to resolve the peaks for the two metals and calculate crystalline domain size as well as Pd and Pt weight percentages. ICP analysis confirmed an overall Pd:Pt relative molar ratio of 1.36. Pd-only/rGO did not form spheres, but instead pentagonal cores were observed, illustrating the role of Pt NPs in shape control (Figure 22C–H) Relative abundance of sp2, sp3, and oxygenated Cs (–C=C–, –C–C–, –C=C–O/ –C=O) showed that during the reduction to form rGO, relative abundance of sp2/sp3 C increased concomitant to an increase in the graphitic nature of the support material. The two PGMs, Pd and Pt showed 89% and 100% existence in metallic oxidation states indicating the reduction of the two metals was almost quantitative.
Authors also used µwH as heat medium for three different catalytic reactions: dehalogenation, reduction-dehalogenation, and reduction of olefins/alkynes using Pd@Pt/rGO NPs. First, 3-bromoaniline was used as a model substrate and hydrazine hydrate was the reducing agent in ethanol as the solvent (Figure 23). A comparative evaluation showed that catalysis under µwH was rapid with quantitative conversion of 3-bromoaniline to aniline at 90 °C in 15 min. On the other hand, reaction under CvH led to an incomplete conversion (only 67%) after 30 min. An optimum stoichiometry (1 eqv. substrate, 3 eqv. N2H4·H2O, and 5 mg of Pd@Pt/rGO NPs) for catalysis was determined and applied for a variety of substrates. The role of µwH in successful catalysis was also determined by running various controls such as lower reaction temperature (60 °C), and smaller amounts of catalyst and the reducing agent. Synergistic effect in the core-shell geometry is also evident by the fact that Pd/rGO and Pt/rGO resulted in 57% and 20% conversion, respectively, and their physical mixture also achieved only 37% conversion. Overall, this catalysis was also tolerant to various functional groups such as –OMe, –CN, and –Ph. The authors also successfully attempted a one-step reduction-dehalogenation catalysis of substrates such as 3-bromo-nitrobenzene and methyl-4-bromocinnamate to aniline and methyl-3-phenylpropanote in almost quantitative yield and selectivity. Interestingly, unfunctionalized rGO and hydrazine resulted in 15% and 3% yield of ethylbenzene, respectively. It had been previously shown that the functionalities and impurities were accounted for finite activity for the carbon-based materials such as rGO in this case [77,78]. For reduction of styrene, physical mixture of Pt/rGO and Pd/rGO led to 72% conversion, whereas bare/unsupported Pd@Pt NPs resulted in only 60% formation of ethylbenzene. Monometallic counterparts Pd/rGO and Pt/rGO achieved 52% and 28% conversion.
Overall, these results showed the synergistic effect between individual components of Pd@Pt/rGO catalytic NPs. Alongside steric factor considerations such as para-, meta-, and ortho-substituted styrene resulting in distinct catalytic activity (para>meta>ortho, cis-hydrogenation mode with hydrazine), the authors also tested the recyclability aspects of these catalysts. For example, Pd@Pt/rGO could be recycled at least five times without any appreciable loss in activity for the reductive-dehalogenation of 3-bromoaniline. TEM and XPS analysis showed that the overall structure of Pd@Pt/rGO remains intact after five cycles. Finally, the authors also postulated a feasible reaction pathway and mechanism. Overall, this study showed the versatility of µwH not only during the synthesis of Pd@Pt/rGO NPs but also during three distinct types of catalytic reactions.
2.9. Rapid Synthesis of Pd-Rh Alloy NPs under µwH
Piburn et al. reported µw-assisted synthesis of PdRh bimetallic NPs and studied them structurally with reaction time [79]. Such NPs could be rapidly synthesized using chloride salts in the presence of PVP in 30 s. A dynamic power method at 800 W was used and reactions were carried out at 165 °C. NPs could be observed as early as 30 s and showed crystallinity corresponding to FCC lattice packing. A clear peak shift in PXRD was also observed, indicating alloying between Rh and Pd. Additional reaction times of 3 min, 30 min, and 3 h were also investigated. TEM-obtained size analysis showed that these NPs were monodispersed, truncated cubes with an average diameter of ≈ 5 nm in all cases. Longer reaction times therefore did not result in any NP ripening and size deviations. In fact, these trends stayed the same even for CvH and were in contrast with the pure Rh NPs synthesized under similar conditions [80]. One possible explanation for such thermal stability of these PdRh NPs was due to stronger surface passivation. Rh to Pd charge transfer in these NPs could readily occur and lead in an optimized PVP binding via tertiary N or carbonyl O atoms. Surface analysis using XPS resulted in a higher concentration of Pd for shorter times (up to 30 min), whereas reaction after 3 h led to almost equimolar ratios of the two metals. The oxidized form of the two metals, Pd2+ and Rh1+ were observed for all the samples and the latter increased from 25% in 30 s to 56% in 3 h. The Pd2+ concentration on the other hand decreased from 66% to 45% during the same interval. Surface enrichment of Rh in general seemed evident from these analyses. STEM-EDS analyses showed that heteroatomic distribution in these PdRh were broadly homogeneous. However, longer reaction times resulted in some surface segregation of Rh. As shown in Figure 24, the sample obtained after 30 s was quite homogeneous, whereas the sample obtained after 3 h showed clear signs of Pd enrichment toward the core and Rh toward the surface (Figure 24). Such heterogeneity in these samples was not complete as can be seen in core-shell structures, and appreciable alloyed regions existed even in 3 h sample.
The authors used vapor phase cyclohexene (CHE) hydrogenation as a probe reaction in order to delineate the structural benefits of such hybrid NPs. Continuous reaction streams were passed over catalysts at room temperature using H2/He (1:1.5) flow. Steady state turnover frequency values (SS-TOF) showed interesting trends. PdRh NPs synthesized in 30 s and 3 h had very similar SS-TOF values of 8.5 and 8.2 surface site−1 s−1 respectively. Therefore, NPs prepared in longer times do not offer any catalytic benefits. Furthermore, all the µw-prepared NPs were stable under the reaction feed and maintained >70% of their initial activity. Comparing µwH with CvH showed CvH-prepared NPs have higher activity but the time-dependent decline is much more rapid. Lastly, hydrogenation activity between the alloys and the monometallic counterparts varied as Rh>PdRh>Pd NPs. Alloying between Pd and Rh showed inherent benefits as the deactivation rate was much slower for them than pure Rh. Authors also complemented their experimental finding with the DFT calculations. As shown in the Figure 24E, variations in H-binding energy to the <111> Rh3, Rh3Pd1, Rh2Pd1, and Pd3 hollow metal sites were clearly observed with it being strongest for the pure Pd sites. CHE binding on the other hand was strongest to pure Rh sites. CHE-binding was then calculated from the olefinic end to five distinct metal sites (Rh1-atop, Pd1-atop, Rh2-bridge, RhPd-bridge, and Pd2-bridge) and varied almost linearly with the composition of the Pd50Rh50 alloys. Ligand effect owing to charge transfer from Rh to Pd in the alloy NPs was likely and a stronger H-binding affinity for the Rh atoms occurred as they had surrounding Pd sites. Overall, since H- and CHE-binding energies for the alloyed sites were intermediate to begin with, catalytic activity also lied between the two pure metals. In conclusion, this study showed the applicability of µwH for the synthesis of classically immiscible Pd-Rh alloy NPs for alkene hydrogenation.
2.10. Synthesis and Structural Evaluations of Pd/Pt NPs under Batch and Continuous Flow Methods
Cong et al. used µwH in both batch and flow methods for the synthesis of Pd/Pt and Pt/Rh bimetallic NPs [81]. These NPs were synthesized in batch methods using single and multi-mode µwH methods. Although the former is Pd-containing and more relevant to the overall scope here, PtRh bimetallic NPs are also a very interesting composition, although only Pd/Pt will be discussed here. Besides the bimetallic compositions, this work is crucial in addressing the scalability aspects of the µwH since the flow method was also applied in this study. Single-mode reactions were carried out using 300 W at 198 °C in EG and 250 °C in glycerol for 10 min. Multi-mode reactions were carried out at 700 W (1000 W maximum power) in a non-stop wave mode at the same two temperatures using the two solvents. The polyol method was used for reducing the metal chlorides (H2PtCl6·6H2O, PdCl2, and RhCl3·3H2O) in EG and glycerol as the two solvents, and PVP (average MW = 40,000) was used as the capping agent. Overall, three distinct compositions (Pd/Pt = 4/1, 1/1, and 1/4) were synthesized. TEM size analysis of multimode batch synthesis of µw-obtained Pd/Pt (1/1) NPs showed that NPs prepared in EG were monodispersed, spherical in geometry, smaller (average size: 6.2 nm), and less size-focused than glycerol (average size: 9.3 nm) as shown in Figure 25. Fourier transformed extended X-ray fine structure spectroscopy (FT-EXAFS) showed that Pt–L3 edge at 2.5 Å decreased systematically with a higher Pt incorporation and a peak at 2.2 Å appeared as a doublet for higher Pt content samples. Further EXAFS analysis showed that coordination number (CN) values for the Pt–Pt and Pt–Pd bonds for the Pd/Pt (1/1) NPs were 7.7 and 2.7 in the Pt–L3 edge and 7.3 and 4.2 in the Pd–K edge respectively. The average CN at the Pt–L3 edge and Pd–K edge were 5.2 and 5.8 respectively. Overall average CN for the Pd/Pt (1/1) NPs was determined to be 11.0 in EG as a solvent and an NP diameter estimate was obtained to be 5.0 nm. The discrepancy between the size estimate from the EXAFS analysis and the TEM analysis was explained by the aggregation among these NPs. Therefore, TEM analysis obtained average size (6.2 nm) is in fact larger than the EXAFS estimate pointing toward some aggregation among these NPs. EXAFS analysis also showed that CN values for the Pt–Pd bond decreased from the higher content Pt sample to the lower content Pt sample (Pd/Pt = 1/4 to 1/1 to 4/1) which is reasonable since a smaller number of Pt atoms were available in the reduced form around the central Pd atoms. Interestingly however, the highest content Pt sample, Pd/Pt = 1/4, showed no EXAFS structural parameters for the Pt-Pd bond at the Pt–L3 edge. Authors explained this owing to the formation of larger Pt NPs with embedded smaller Pd NPs, Pd-Pt hetero-bond therefore was not as prevalent resulting in no measurements at the Pt–L3 edge. While using glycerol as the reaction solvent, average CN for the Pd/Pt (1/1) NPs was determined to be 12.1.
Batch type method using single-mode µwH showed that Pd/Pt (1/1) NPs were truncated monodisperse cubes. The average size for EG-prepared NPs was 7.1 nm; however, a considerable number of NPs were >7 nm. PXRD analysis confirmed that these NPs had FCC packing and their crystallinity were also confirmed using HRTEM. XRD analysis also showed peak shifts indicating that alloying between the two metals was successful. EXAFS analysis showed similar trends, appearance of split peaks indicative of Pt–Pd bond formation were observed between 2 and 3 Å. Similar to the multi-mode method, Pd/Pt (1/4) with the highest content did not show any contribution at the Pt–L3 edge due to the wide disparity between Pt (large) and Pd (much smaller) nanocrystallites. A higher Pd content led to larger CN value of the Pt–Pd bond and a smaller Pd content resulted in a higher CN value for the Pd–Pt bond above the Pt–K edge.
A continuous flow method under single-mode µwH was also explored (Figure 26). Pd/Pt (1/1) NPs could be synthesized in EG along with smaller NPs (average diameter = 5.9 nm) and better monodispersity. EXAFS analyses again confirmed the formation of bimetallic species with a split peak between 2 and 3 Å; the Pt-Pd peak, and size determination using average CN values agreed well with the TEM obtained values. This indicates less aggregation among NPs prepared using the flow method.
Authors also studied the structure model of these Pd/Pt NPs. Since the two metals can be distributed in random alloy, cluster-in-cluster, core-shell, or segregated forms, exact nature of bimetallic distribution was of interest. A variety of techniques were used to understand the overall structure of Pd/Pt (1/1) NPs. XPS analysis of these NPs showed the likelihood of Pt-surface segregation since a higher concentration of Pt was observed. EDS analysis also showed that signal emanating from the NP-surface is indeed Pt-rich (Figure 27).
EXAFS analysis showed a CN of 11.0 for EG-prepared NPs and an estimated particle diameter of 4 nm. The authors correlated this information with the estimated number of CNs for different NP geometries. A 4-nm NP theoretically contains 923 atoms which will have different CNs if the geometry were cluster-in-cluster; CN values of Pd–Pd and Pd–Pt above the Pd–K edge were calculated to be 5.8 and 4.0 respectively, and CN for Pt–Pt and Pt–Pd at the Pt–L3 edge to be 7.1 and 4.0, respectively. Overall, these numbers matched reasonably well with the experimental values indicating that the actual structure was indeed closer to the cluster-in-cluster model. This was also the case when glycerol was used as the solvent and for the continuous-flow in the single-mode method. Deviations in CN were large for both core-shell and randomly alloyed structures of these NPs and further substantiated the cluster-in-cluster structure. Authors also used XPS analysis to further distinguish between the two bimetallic systems. XPS analysis showed that Pd/Pt (1/1) NPs had a larger concentration of oxidized species than Pt/Rh (1/1) since a higher concentration of C–O, C=O, and O–C=O were observed because of a stronger coordination of PVP to Rh; therefore, a higher effective surface is available for oxidation in the case of Pd/Pt (1/1). In summary, authors synthesized Pd/Pt and Pt/Rh bimetallic NPs with microwave heating using batch and flow methods along with a detailed structural investigation in this study.
3. Conclusions
Application of µwH has come a long way since its first implementation in 1984. Notably, Pd-dilution approaches discussed here have resulted in hybrid catalysts superior to pure Pd in majority of cases. While dilution-approaches involving all types of secondary metals are important (including precious metal counterparts such as Rh, Pt, Au), base metals such as Ni, Cu, Ag are notably less expensive and have greater price stability than PGMs. The first half of this review focuses on studies primarily gaining structural insights into Pd-based bimetallics, whereas the latter half consists of application-oriented research. We have summarized the critical parameters that researcher employed for the synthesis in Table 3 below. Table 3 also shows the heating modes and applied wattage, and reactions times under µwH. Pd-containing bimetallic compositions exhibited versatile catalytic behavior: ranging from olefin reduction to CO-oxidation to electrocatalytic chemistries (such as ORR), electrooxidation of methanol and formic acid, as well as dehalogenation reactions. Flow methods pursued in the last section hold immense potential to target scalability and reproducibility issues aspects of such synthesis.
Author Contributions
Both the authors participated in the compilation of this manuscript. Both the authors have read and agreed to the published version of this manuscript.
Funding
Funding was provided by the U.S. Department of Energy’s Vehicle Technologies Office (VTO). The authors greatly appreciate support from Ken Howden, Siddiq Khan, and Gurpreet Singh at VTO.
Conflicts of Interest
The authors declare no conflict of interest.
References
- Komarmeni, S.; Roy, R. Titania gel spheres by a new sol-gel process. Mater. Lett. 1985, 3, 165–167. [Google Scholar] [CrossRef]
- Gedye, R.; Smith, F.; Westway, K.; Ali, H.; Baldisera, L.; Laberge, L.; Rousell, J. The use of microwave ovens for rapid organic synthesis. Tet. Lett. 1986, 27, 279–282. [Google Scholar] [CrossRef]
- Giguerre, R.J.; Bray, T.L.; Duncan, S.M. Application of commercial microwave ovens to organic synthesis. Tet. Lett. 1986, 27, 4945–4948. [Google Scholar] [CrossRef]
- Zhu, Y.-J.; Chen, F. Microwave-assisted preparation of inorganic nanostructures in liquid phase. Chem. Rev. 2014, 114, 6462–6555. [Google Scholar] [CrossRef]
- Schanche, J.-S. Microwave synthesis solutions from personal chemistry. Mol. Divers. 2003, 7, 293–300. [Google Scholar] [CrossRef]
- Horikoshi, S.; Sakai, F.; Kajitani, M.; Abe, M.; Serpone, N. Microwave frequency effects on the photoactivity of TiO2: Dielectric properties and the degradation of 4-chlorophenol, bisphenol A and methylene blue. Chem. Phys. Lett. 2009, 470, 304–307. [Google Scholar] [CrossRef]
- Horikoshi, S.; Iida, S.; Kajitani, M.; Sato, S.; Serpone, N. Chemical reactions with a novel 5.8-GHz microwave apparatus. Characterization of properties of common solvents and application in a Diels—Alder organic synthesis. Org. Process Res. Dev. 2008, 12, 257–263. [Google Scholar] [CrossRef]
- Dudley, G.B.; Richert, R.; Stiegman, A.E. On the existence of and mechanism for microwave-specific reaction rate enhancement. Chem. Sci. 2015, 6, 2144–2152. [Google Scholar] [CrossRef]
- Jacob, J.; Chia, L.H.L.; Boey, F.Y.C. Thermal and non-thermal interaction of microwave radiation with materials. J. Mater. Sci. 1995, 30, 5321–5327. [Google Scholar] [CrossRef]
- Perreux, L.; Loupy, A. A tentative rationalization of microwave effects in organic synthesis according to the reaction medium, and mechanistic considerations. Tetrahedron 2001, 57, 9199–9223. [Google Scholar] [CrossRef]
- De la Hoz, A.; Díaz-Ortiz, Á.; Moreno, A. Microwaves in organic synthesis. Thermal and non-thermal microwave effects. Chem. Soc. Rev. 2005, 34, 164–178. [Google Scholar] [CrossRef] [PubMed]
- Conner, W.C.; Tompsett, G.A. How could and do microwaves influence chemistry at interfaces? J. Phys. Chem. B 2008, 112, 2110–2118. [Google Scholar] [CrossRef] [PubMed]
- Li, Y.S.; Yang, W.S. Microwave synthesis of zeolite membranes: A review. J. Membr. Sci. 2008, 316, 3–17. [Google Scholar] [CrossRef]
- Gedye, R.N.; Smith, F.E.; Westaway, K.C. The rapid synthesis of organic compounds in microwave ovens. Can. J. Chem. 1988, 66, 17–26. [Google Scholar] [CrossRef]
- Gedye, R.N.; Rank, W.; Westaway, K.C. The rapid synthesis of organic compounds in microwave ovens. II. Can. J. Chem. 1991, 69, 706–711. [Google Scholar] [CrossRef]
- Kappe, C. Unraveling the Mysteries of Microwave Chemistry Using Silicon Carbide Reactor Technology. Acc. Chem. Res. 2013, 46, 1579–1587. [Google Scholar] [CrossRef]
- Dallinger, D.; Kappe, C.O. Microwave-assisted synthesis in water as solvent. Chem. Rev. 2007, 107, 2563–2591. [Google Scholar] [CrossRef]
- Baghbanzadeh, M.; Carbone, L.; Cozzoli, P.D.; Kappe, C.O. Microwave-Assisted Synthesis of Colloidal Inorganic Nanocrystals. Angew. Chem. Int. Ed. 2011, 50, 11312–11359. [Google Scholar] [CrossRef]
- Kappe, C.O. Controlled Microwave Heating in Modern Organic Synthesis. Angew. Chem. Int. Ed. 2004, 43, 6250–6284. [Google Scholar] [CrossRef]
- Robinson, J.; Kingman, S.; Irvine, D.; Licence, P.; Smith, A.; Dimitrakis, G.; Obermayer, D.; Kappe, C.O. Understanding microwave heating effects in single mode type cavities—Theory and experiment. Phys. Chem. Chem. Phys. 2010, 12, 4750–4758. [Google Scholar] [CrossRef]
- Kuhnert, N. Microwave-Assisted Reactions in Organic Synthesis—Are There Any Nonthermal Microwave Effects? Angew. Chem. Int. Ed. 2002, 41, 1863–1866. [Google Scholar] [CrossRef]
- Rao, C.R.M.; Reddi, G.S. Platinum group metals (PGM); occurrence, use and recent trends in their determination. TrAC Trends Anal. Chem. 2000, 19, 565–586. [Google Scholar] [CrossRef]
- Yu, W.; Porosoff, M.D.; Chen, J.G. Review of Pt-Based Bimetallic Catalysis: From Model Surfaces to Supported Catalysts. Chem. Rev. 2012, 112, 5780–5817. [Google Scholar] [CrossRef] [PubMed]
- Crabtree, R. Iridium compounds in catalysis. Acc. Chem. Res. 1979, 12, 331–337. [Google Scholar] [CrossRef]
- Hayashi, T.; Yamasaki, K. Rhodium-Catalyzed Asymmetric 1,4-Addition and Its Related Asymmetric Reactions. Chem. Rev. 2003, 103, 2829–2844. [Google Scholar] [CrossRef]
- Phan, N.T.; Van Der Sluys, M.; Jones, C.W. On the Nature of the Active Species in Palladium Catalyzed Mizoroki–Heck and Suzuki–Miyaura Couplings—Homogeneous or Heterogeneous Catalysis, A Critical Review. Advan. Synth. Catal. 2006, 348, 609–679. [Google Scholar] [CrossRef]
- Naota, T.; Takaya, H.; Murahashi, S.I. Ruthenium-Catalyzed Reactions for Organic Synthesis. Chem. Rev. 1998, 98, 2599–2660. [Google Scholar] [CrossRef]
- Schroeder, M. Osmium tetraoxide cis hydroxylation of unsaturated substrates. Chem. Rev. 1980, 80, 187–213. [Google Scholar] [CrossRef]
- Biffis, A.; Centomo, P.; Zotto, A.D.; Zecca, M. Pd metal catalysts for cross-couplings and related reactions in the 21st century: A critical review. Chem. Rev. 2018, 118, 2249–2295. [Google Scholar] [CrossRef]
- Wang, J.; Chen, H.; Hu, Z.; Yao, M.; Li, Y. A Review on the Pd-Based Three-Way Catalyst. Catal. Rev. -Sci. Eng. 2015, 57, 79–144. [Google Scholar] [CrossRef]
- Chaplin, B.P.; Reinhard, M.; Schneider, W.F.; Schüth, C.; Shapley, J.R.; Strathmann, T.J.; Werth, C.J. Critical Review of Pd-Based Catalytic Treatment of Priority Contaminants in Water. Environ. Sci. Technol. 2012, 46, 3655–3670. [Google Scholar] [CrossRef] [PubMed]
- Epling, W.S.; Campbell, L.E.; Yezerets, A.; Currier, N.W.; Parks, J.E. Overview of the Fundamental Reactions and Degradation Mechanisms of NOx Storage/Reduction Catalysts. Catal. Rev. -Sci. Eng. 2004, 46, 163–245. [Google Scholar] [CrossRef]
- Toops, T.J.; Smith, D.B.; Epling, W.S.; Parks, J.E.; Partridge, W.P. Quantified NOx adsorption on Pt/K/gamma-Al2O3 and the effects of CO2 and H2O. Appl. Catal. B 2005, 58, 255–264. [Google Scholar] [CrossRef]
- Littman, F.E.; Magill, P.L. Some unique aspects of air pollution in Los Angeles. Air Repair 1953, 3, 29–34. [Google Scholar] [CrossRef] [Green Version]
- Voltz, S.E.; Morgan, C.R.; Liederman, D.; Jacob, S.M. Kinetic study of carbon monoxide and propylene oxidation on platinum catalysts. Ind. Eng. Chem. Prod. Res. Develop. 1973, 12, 294–301. [Google Scholar] [CrossRef]
- Dwyer, F.G. Catalysis for Control of Automotive Emissions. Catal. Rev.-Sci. Eng. 1972, 6, 261–291. [Google Scholar] [CrossRef]
- Meguerian, G.H.; Hirschberg, E.H.; Rakowsky, F.W. Catalyst for Treating Exhaust Gas from Internal Combustion Engine. U.S. Patent 4006103, 1 February 1977. [Google Scholar]
- Hegedus, L.; Summers, J.C. Platinum-Rhodium Catalyst for Automotive Emission Control. U.S. Patent 4128506, 5 December 1978. [Google Scholar]
- Acres, G.J.K.; Cooper, B.J. Platinum Catalysts for Exhaust Emission Control: The Mechanism of Catalyst Poisoning by Lead and Phosphorus Compounds. Platinum. Metals. Rev. 2010, 54, 61–62. [Google Scholar] [CrossRef]
- Hu, Z.; Allen, F.M.; Wan, C.Z.; Heck, R.M.; Steger, J.J.; Lakis, R.E.; Lyman, C.E. Performance and Structure of Pt–Rh Three-Way Catalysts: Mechanism for Pt/Rh Synergism. J. Catal. 1998, 174, 13. [Google Scholar] [CrossRef]
- Hu, Z. A Pt–Rh synergism in Pt/Rh three-way catalysts. Chem. Commun. 1996, 879–880. [Google Scholar] [CrossRef]
- Matsuura, S.; Hirai, A.; Arimura, K.; Shinjoh, H. Development of Three-Way Catalyst with Using Only Pd as Activator. SAE Trans. 1995, 302–309. [Google Scholar] [CrossRef]
- Available online: http://www.platinum.matthey.com/prices/price-charts (accessed on 29 July 2020).
- Gandhi, H.S.; Williamson, W.B.; Logothetis, E.M.; Tabock, J.; Peters, C.; Hurley, M.D.; Shelef, M. Affinity of lead for noble metals on different supports. Surf. Interface Anal. 1984, 6, 149–161. [Google Scholar] [CrossRef]
- Gandhi, H.S.; Shelef, M. Effects of sulphur on noble metal automotive catalysts. Appl. Catal. 1991, 77, 175–186. [Google Scholar] [CrossRef]
- Chattha, M.S.; Watkins, W.L.H.; Gandhi, H.S. Three-Way Catalyst for Automotive Emission Control and Method of Making the Catalyst. U.S. Patent 4992405, 12 February 1991. [Google Scholar]
- Shelef, M.; McCabe, R.W. Twenty-five years after introduction of automotive catalysts: What next? Catal. Today 2000, 62, 35–50. [Google Scholar] [CrossRef]
- Gandhi, H.S.; Graham, G.W.; McCabe, R.W. Automotive exhaust catalysis. J. Catal. 2003, 216, 433–442. [Google Scholar] [CrossRef]
- Harpness, R.; Gedanken, A. Microwave Synthesis of Core−Shell Gold/Palladium Bimetallic Nanoparticles. Langmuir 2004, 20, 3431–3434. [Google Scholar] [CrossRef]
- Abdelsayed, V.; Alijarash, A.; El-Shall, M.S.; Al Othmon, Z.A.; Alghamdi, A.H. Microwave Synthesis of Bimetallic Nanoalloys and CO Oxidation on Ceria-Supported Nanoalloys. Chem. Mater. 2009, 21, 2825–2834. [Google Scholar] [CrossRef]
- Abdelsayed, V.; Glaspell, G.; Nguyen, M.; Howe, J.M.; El-Shall, M.S. Laser synthesis of bimetallic nanoalloys in the vapor and liquid phases and the magnetic properties of PdM and PtM nanoparticles (M = Fe, Co and Ni). Faraday Discuss. 2008, 138, 163–180. [Google Scholar] [CrossRef]
- Fox, E.B.; Velu, S.; Engelhard, M.H.; Chin, Y.H.; Miller, J.T.; Kropf, J.; Song, C. Characterization of CeO2-supported Cu–Pd bimetallic catalyst for the oxygen-assisted water–gas shift reaction. J. Catal. 2008, 260, 358–370. [Google Scholar] [CrossRef]
- Wang, F.; Zhao, K.; Zhang, H.; Dong, Y.; Wang, T.; He, D. Low temperature CO catalytic oxidation over supported Pd–Cu catalysts calcined at different temperatures. Chem. Eng. J. 2014, 242, 10–18. [Google Scholar] [CrossRef]
- Zhou, F.; Du, X.; Yu, J.; Mao, D.; Lu, G. Highly water-resistant carbon nanotube supported PdCl2–CuCl2 catalysts for low temperature CO oxidation. RSC Adv. 2016, 6, 66553–66563. [Google Scholar] [CrossRef]
- Rappé, K.G.; DiMaggio, C.; Pihl, J.A.; Theis, J.R.; Oh, S.H.; Fisher, G.B.; Parks, J.; Easterling, V.G.; Yang, M.; Stewart, M.L.; et al. Aftertreatment Protocols for Catalyst Characterization and Performance Evaluation: Low-Temperature Oxidation, Storage, Three-Way, and NH3-SCR Catalyst Test Protocols. Emiss. Control Sci. Technol. 2019, 5, 183–214. [Google Scholar] [CrossRef]
- Zhang, J.; Mo, Y.; Vukmirovic, M.B.; Klie, R.; Sasaki, K.; Adzic, R.R. Platinum Monolayer Electrocatalysts for O2 Reduction: Pt Monolayer on Pd (111) and on Carbon-Supported Pd Nanoparticles. J. Phys. Chem. B 2004, 108, 10955–10964. [Google Scholar] [CrossRef]
- Golikand, A.N.; Lohrasbi, E.; Maragheh, M.G.; Asgari, M.J. Carbon nano-tube supported Pt–Pd as methanol-resistant oxygen reduction electrocatalyts for enhancing catalytic activity in DMFCs. Appl. Electrochem. 2009, 39, 2421–2431. [Google Scholar] [CrossRef]
- Zhang, H.; Yin, Y.; Hu, Y.; Li, C.; Wu, P.; Wei, S.; Cai, C.J. Pd@ Pt core—Shell nanostructures with controllable composition synthesized by a microwave method and their enhanced electrocatalytic activity toward oxygen reduction and methanol oxidation. Phys. Chem. B 2010, 114, 11861–11867. [Google Scholar] [CrossRef]
- Zhang, J.L.; Vukmirovic, M.B.; Xu, Y.; Mavrikakis, M.; Adzic, R.R. Controlling the catalytic activity of platinum-monolayer electrocatalysts for oxygen reduction with different substrates. Angew. Chem. Int. Ed. 2005, 44, 2132. [Google Scholar] [CrossRef]
- Hammer, B.; Norskov, J.K. Theoretical surface science and catalysis—Calculations and concepts. Adv. Catal. 2000, 45, 71–129. [Google Scholar] [CrossRef]
- Belousov, O.V.; Belousova, N.T.; Sirotina, A.V.; Solovyov, L.A.; Zhyzhaev, A.M.; Zharkov, S.M.; Mikhlin, Y.L. Formation of Bimetallic Au–Pd and Au–Pt Nanoparticles under Hydrothermal Conditions and Microwave Irradiation. Langmuir 2011, 27, 11697–11703. [Google Scholar] [CrossRef]
- Buffat, P.H.; Borel, J.-P. Size effect on the melting temperature of gold particles. Phys. Rev. A 1976, 13, 2287–2298. [Google Scholar] [CrossRef] [Green Version]
- Dai, L.; Zhao, Y.; Chi, Q.; Huang, T.; Liu, H. Controlled synthesis of Pd–Pt alloy nanohypercubes under microwave irradiation. Cryst. Eng. Comm. 2014, 16, 5206–5211. [Google Scholar] [CrossRef]
- Hattori, M.; Shimamoto, D.; Ago, H.; Tsuji, M. AgPd@Pd/TiO2 nanocatalyst synthesis by microwave heating in aqueous solution for efficient hydrogen production from formic acid. J. Mater. Chem. A 2015, 3, 10666–10670. [Google Scholar] [CrossRef]
- Tedsree, K.; Li, T.; Jones, S.; Chan, C.W.A.; Yu, K.M.K.; Bagot, P.A.J.; Marquis, E.A.; Smith, G.D.W.; Tsnag, S.C.E. Hydrogen production from formic acid decomposition at room temperature using a Ag–Pd core–shell nanocatalyst. Nat. Nanotechnol. 2011, 6, 302–307. [Google Scholar] [CrossRef]
- Zhou, X.; Huang, Y.; Xing, W.; Liu, C.; Liao, J.; Lu, T. High-quality hydrogen from the catalyzed decomposition of formic acid by Pd–Au/C and Pd–Ag/C. Chem. Commun. 2008, 3540–3542. [Google Scholar] [CrossRef] [PubMed]
- Huang, Y.; Zhou, X.; Yin, M.; Liu, C.; Xing, W. Novel PdAu@Au/C Core−Shell Catalyst: Superior Activity and Selectivity in Formic Acid Decomposition for Hydrogen Generation. Chem. Mater. 2010, 22, 5122–5128. [Google Scholar] [CrossRef]
- Hattori, M.; Einaga, H.; Daio, T.; Tsuji, M. Efficient hydrogen production from formic acid using TiO2-supported AgPd@Pd nanocatalysts. J. Mater. Chem. A 2015, 3, 4453–4461. [Google Scholar] [CrossRef]
- Denton, A.R.; Ashcroft, N.W. Vegard’s Law. Phys. Rev. A 1991, 43, 3161–3164. [Google Scholar] [CrossRef]
- Steiner, P.; Hufner, S. Thermochemical analysis of PdxAg1-x alloys from XPS core-level binding energy shifts. Solid State Commun. 1981, 37, 79–81. [Google Scholar] [CrossRef]
- Wang, Z.-L.; Yan, J.-M.; Ping, Y.; Wang, H.-L.; Zheng, W.-T.; Jiang, Q. An Efficient CoAuPd/C Catalyst for Hydrogen Generation from Formic Acid at Room Temperature. Angew. Chem. Int. Ed. 2013, 52, 4406–4409. [Google Scholar] [CrossRef]
- Kunal, P.; Li, H.; Dewing, B.L.; Zhang, L.; Jarvis, K.; Henkelman, G.; Humphrey, S.M. Microwave-Assisted Synthesis of PdxAu100–xAlloy Nanoparticles: A Combined Experimental and Theoretical Assessment of Synthetic and Compositional Effects upon Catalytic Reactivity. ACS Catal. 2016, 6, 4882–4893. [Google Scholar] [CrossRef]
- Seraj, S.; Kunal, P.; Henkelman, G.; Humphrey, S.M.; Werth, C.J. PdAu Alloy Nanoparticle Catalysts: Effective Candidates for Nitrite Reduction in Water. ACS Catal. 2017, 7, 3268–3276. [Google Scholar] [CrossRef]
- Goswami, A.; Rathi, A.K.; Aparicio, C.; Tomanec, O.; Petr, M.; Pocklanova, R.; Gawande, M.; Varma, R.S.; Zboril, R. In Situ Generation of Pd–Pt Core–Shell Nanoparticles on Reduced Graphene Oxide (Pd@Pt/rGO) Using Microwaves: Applications in Dehalogenation Reactions and Reduction of Olefins. ACS Appl. Mater. Interfaces 2017, 9, 2815–2824. [Google Scholar] [CrossRef]
- Pocklanova, R.; Rathi, A.K.; Gawande, M.B.; Datta, K.K.R.; Ranc, V.; Cepe, K.; Petr, M.; Varma, R.S.; Kvitek, L.; Zboril, R. Gold nanoparticle-decorated graphene oxide: Synthesis and application in oxidation reactions under benign conditions. J. Mol. Catal. A Chem. 2016, 424, 121–127. [Google Scholar] [CrossRef]
- Wei, Z.; Pan, R.; Hou, Y.; Yang, Y.; Liu, Y. Graphene-supported Pd catalyst for highly selective hydrogenation of resorcinol to 1, 3-cyclohexanedione through giant π-conjugate interactions. Sci. Rep. 2015, 5, 15664. [Google Scholar] [CrossRef] [PubMed]
- Navalon, S.; Dhakshinamoorthy, A.; Alvaro, M.; Garcia, H. Carbocatalysis by Graphene-Based Materials. Chem. Rev. 2014, 114, 6179. [Google Scholar] [CrossRef] [PubMed]
- Primo, A.; Neatu, F.; Florea, M.; Parvulescu, V.; Garcia, H. Graphenes in the absence of metals as carbocatalysts for selective acetylene hydrogenation and alkene hydrogenation. Nat. Commun. 2014, 5, 5291. [Google Scholar] [CrossRef] [PubMed] [Green Version]
- Piburn, G.W.; Li, H.; Kunal, P.; Henkelman, G.; Humphrey, S.M. Rapid Synthesis of Rhodium-Palladium Alloy Nanocatalysts. ChemCatChem 2018, 10, 329–333. [Google Scholar] [CrossRef]
- Dahal, N.; Garcίa, S.; Zhou, J.; Humphrey, S.M. Beneficial Effects of Microwave-Assisted Heating versus Conventional Heating in Noble Metal Nanoparticle Synthesis. ACS Nano 2012, 6, 9433–9446. [Google Scholar] [CrossRef]
- Cong, C.; Nakayama, S.; Maenosono, S.; Harada, M. Microwave-Assisted Polyol Synthesis of Pt/Pd and Pt/Rh Bimetallic Nanoparticles in Polymer Solutions Prepared by Batch and Continuous-Flow Processing. Ind. Eng. Res. 2018, 57, 179–190. [Google Scholar] [CrossRef]
Figure 1.
A bar graph showing µw-related papers over the years, data were obtained from Scopus using the keyword: “microwave synthesis nano” on 07/17/2020; statistics for 2020 was not included.
Figure 1.
A bar graph showing µw-related papers over the years, data were obtained from Scopus using the keyword: “microwave synthesis nano” on 07/17/2020; statistics for 2020 was not included.

Figure 2.
(A,B) Representation of ionic conduction and dipolar polarization mechanisms under μwH; heating comparisons between μwH (C), and CvH (D); μwH leads in a better overall heating and temperature control than CvH. Adapted with permission from Springer Science and Business Media B.V.
Figure 2.
(A,B) Representation of ionic conduction and dipolar polarization mechanisms under μwH; heating comparisons between μwH (C), and CvH (D); μwH leads in a better overall heating and temperature control than CvH. Adapted with permission from Springer Science and Business Media B.V.

Figure 3.
(A) Dielectric loss factors (left vertical axis) and penetration-depth (on right) plotted vs. Temperature for 2.45 GHz and 5.8 GHz. (B) Temperature vs. time profiles for the two frequencies after Mw-irradiation by the powdered TiO2 in the reactor tube. Adapted with permission from Elsevier B.V. Copyright 2009 Elsevier B.V.

Figure 4.
Historical PGM prices since 07/01/1992, data were accessed on 07-29-2020. Inset with dashed green border shows zoomed-in prices since 05/10/2012, Rh prices have been removed for clarity, dashed black vertical line in inset shows the time point when Pd prices became higher than Pt. Source: Johnson Matthey.

Figure 5.
(A) XRD (the asterisk indicates Pd) and (B) HRTEM image analysis of Au core-Pd shell NPs. Adapted with permission from the American Chemical Society. Copyright 2004 American Chemical Society.
Figure 5.
(A) XRD (the asterisk indicates Pd) and (B) HRTEM image analysis of Au core-Pd shell NPs. Adapted with permission from the American Chemical Society. Copyright 2004 American Chemical Society.

Figure 6.
(A) TEM images of various bimetallic compositions under µwH and (B) digital images of bimetallic and corresponding monometallic NPs in toluene solution. Adapted with permission from the American Chemical Society. Copyright 2009 American Chemical Society.
Figure 6.
(A) TEM images of various bimetallic compositions under µwH and (B) digital images of bimetallic and corresponding monometallic NPs in toluene solution. Adapted with permission from the American Chemical Society. Copyright 2009 American Chemical Society.

Figure 7.
(A) UV-vis and (B) photoemission spectra of PdCu, PdAu, and PdAg nanocrystals in toluene solution. Adapted with permission from the American Chemical Society. Copyright 2009 American Chemical Society.
Figure 7.
(A) UV-vis and (B) photoemission spectra of PdCu, PdAu, and PdAg nanocrystals in toluene solution. Adapted with permission from the American Chemical Society. Copyright 2009 American Chemical Society.

Figure 8.
CO oxidation behavior of different metals (A) and bimetallic alloy NPs (B) supported on CeO2 NPs. Adapted with permission from the American Chemical Society. Copyright 2009 American Chemical Society.
Figure 8.
CO oxidation behavior of different metals (A) and bimetallic alloy NPs (B) supported on CeO2 NPs. Adapted with permission from the American Chemical Society. Copyright 2009 American Chemical Society.

Figure 9.
TEM images, (A–G) in order are pure Pd, Pt, nanostructures with PdCl2/K2PtCl4 molar ratio of 3:1, 2:1, 1:1, 1:2, and 1:3; (H) shows the PXRD data, and CV results are shown in (I), these CVs were calculated using modified GCE in the potential range of −0.25 to 0 V in 0.5 M H2SO4 solution with a scan rate of 50 mVs−1, only positive scan data had been shown for clarity. Adapted with permission from the American Chemical Society. Copyright 2010 American Chemical Society. (A) Schematic representation for the formation of Pd core-Au shell NPs; (B) concentration vs. time (min) dependence for Pd2+ (1, 3), and Au3+ (2, 4).

Figure 10.
(A) ORR polarization curves on various Pd, Pt, and various Pd-Pt core-shell compositions, in order (a-g) are pure Pd, pure Pt, 3:1, 1:5, 1:1, 1:2, and 1:3 Pd-Pt core-shell NPs; (B) mass activity comparison for Pd (a, aʹ), Pd (b, bʹ), and Pd@Pt NPs with 3:1, 1:5, 1:1, 1:2, being again shown in the same order and as alphabetical sets of (c, cʹ to g, gʹ); (C) CV results obtained on the NPs in the same order using modified GCEs in 0.5 M H2SO4 solution containing 0.5 M MeOH with a scan rate of 50 mV s−1; (D) chronoamperometric curves for the various NPs in the above-mentioned order in a 0.5 M H2SO4 aqueous solution containing 0.5 M MeOH at 0.60 V potential (vs. SCE). Adapted with permission from the American Chemical Society. Copyright 2010 American Chemical Society.

Scheme 1.
Various reaction pathways involved in the formation of Pd/Au bimetallic NPs [61].
Scheme 1.
Various reaction pathways involved in the formation of Pd/Au bimetallic NPs [61].

Figure 11.
(A) Schematic representation for the formation of Pd core-Au shell NPs; (B) concentration vs. time (min) dependence for Pd2+ (1, 3), and Au3+ (2, 4). Adapted with permission from the American Chemical Society. Copyright 2011 American Chemical Society.
Figure 11.
(A) Schematic representation for the formation of Pd core-Au shell NPs; (B) concentration vs. time (min) dependence for Pd2+ (1, 3), and Au3+ (2, 4). Adapted with permission from the American Chemical Society. Copyright 2011 American Chemical Society.

Figure 12.
PXRD data for Pd/Au NPs synthesized in 15 min (A), and 60 min (B) under µwH; (C,D) PXRD and TEM respectively for Pd/Au NPs synthesized in 60 min, scale bars are 20 nm; (E) shows reference XRD patterns. Adapted with permission from the American Chemical Society. Copyright 2011 American Chemical Society.

Figure 13.
TEM images of Pd-Pt NPs using the typical reaction conditions in (A) 80 s; (B) 120 s; (C) 140 s; (D) 0 mg of KI; (E) 25 mg of KI; (F) 100 mg of KI. Adapted with permission from Reference [51]. Copyright 2014 American Chemical Society.
Figure 13.
TEM images of Pd-Pt NPs using the typical reaction conditions in (A) 80 s; (B) 120 s; (C) 140 s; (D) 0 mg of KI; (E) 25 mg of KI; (F) 100 mg of KI. Adapted with permission from Reference [51]. Copyright 2014 American Chemical Society.

Figure 14.
(A) HAADF-STEM image for Pd-Pt hypercube; (B,C) EDX mapping results for Pd and Pt respectively; (D) HAADF-STEM image of single hypercube for EDS analysis of three regions marked 1, 2, and 3; (E) plot of Pd and Pt % values for the three regions; (F) line-scanning profile along the single hypercube NP. Adapted with permission from the American Chemical Society. Copyright 2014 American Chemical Society.

Figure 15.
Cyclic voltammograms for electro-oxidation of (A) formic acid and (B) methanol using as-prepared Pd-Pt hypercubes, Pt black is shown using dashed lines in both cases. Adapted with permission from the American Chemical Society. Copyright 2014 American Chemical Society.
Figure 15.
Cyclic voltammograms for electro-oxidation of (A) formic acid and (B) methanol using as-prepared Pd-Pt hypercubes, Pt black is shown using dashed lines in both cases. Adapted with permission from the American Chemical Society. Copyright 2014 American Chemical Society.

Figure 16.
(A) PXRD data for all PdAg-Pd core-shell on TiO2 (0.5 h) nanocatalysts; (B) STEM image, the corresponding 2D-mapping data (C–F), and the line-scan analysis (G) for PdAg-Pd core-shell on TiO2 (0.5 h) sample. Adapted with permission from the American Chemical Society. Copyright 2015 American Chemical Society.

Figure 17.
(A) Gas generation by formic acid decomposition (20 mL, 0.25 M) vs. time (min) for the various PdAg-Pd core-shell catalysts on TiO2 samples; (B) variation rate in H2 generation for PdxAg(100-x) at 27 °C. Adapted with permission from Adapted with permission from the American Chemical Society. Copyright 2015 American Chemical Society.

Figure 18.
(A) Plot of average size vs. reaction time (min) shown in the top panel with the data for µwH shown in blue and CvH in red; <111> PXRD peak position vs. reaction time (min) is shown in the bottom panel using the same color scheme; (B) time-dependent polydispersity comparisons for the two heating methods, data for µwH and CvH are respectively shown in blue and red again; (C) time-dependent mechanism for the formation of Pd50Au50 NPs under µwH; (D) PXRD patterns for PdxAu100-x NPs of different compositions, ICP-derived compositions are annotated on the right and the inset shows zoomed-in <111> region; (E) TEM images and size analysis of the various PdxAu100-x NP compositions synthesized using optimized conditions. Adapted with permission from the American Chemical Society. Copyright 2016 American Chemical Society.

Figure 19.
(A) Plot of TOF vs. time on stream (min) for various PdxAu100-x compositions; (B) TOF vs. time on stream curves for Pd59Au41 alloy NPs, Pd100 NPs, and physically mixed control comprising of Pd100 and Au100 in closely matched molar ratio; (C) comparative reactivity curves (TOF vs. time) for the three different supports; (D) reactivity curves for two most active compositions obtained using µwH and CvH; (E) Arrhenius activation energy plots for Pd-rich highly active PdxAu100-x compositions; for reference Pd100 is shown in black. Adapted with permission from the American Chemical Society. Copyright 2016 American Chemical Society.

Figure 20.
(A) Activity trend comparisons between experimental results (red) and theoretical calculations (blue), experimental plot was obtained by plotting SS-TOF for the various PdxAu100-x compositions, and the theoretical plot was obtained by calculating the difference in H-binding energies for the different alloyed ensembles and target H binding energy; (B) decomposition of average H binding energy into different surface site ensembles, the bars represent the frequency of various binding energies at seven distinct compositions with the average binding energy per site shown as solid symbols. Target H-bonding energy of −0.4 eV is shown as the orange dashed line. Adapted with permission from the American Chemical Society. Copyright 2016 American Chemical Society.

Figure 21.
Overall reaction scheme is shown on top; total mass (metal) normalized first-order rate constants of SiO2-supported NP catalysts for different PdxAu100-x compositions, original activity is shown in blue whereas sulfide fouled activity is shown in red, the three images show top views of absorbed sulfur atom upon Au-rich, PdxAu100-x alloyed, and Pd surfaces (left-to-right). Adapted with permission from the American Chemical Society. Copyright 2017 American Chemical Society.

Figure 22.
(A) PXRD data for GO, Pd@Pt, Pd@Pt/rGO, and Pd@Pt/rGO recycled samples; (B) Reitveld refined spectra of Pd@Pt/rGO with Pt and Pd shown in green and blue; (C) HRTEM image; (D) HAADF-STEM image; (E,F) 2D mapping results with Pd counts (yellow), and Pt counts (green); (G) overlay; (H) line scan analysis with Pt (blue), and Pd (red). Adapted with permission from the American Chemical Society. Copyright 2017 American Chemical Society.

Figure 23.
Schematic representation of dehalogenation of 3-bromoaniline and various catalytic results obtained are shown in the tabular form. Adapted with permission from the American Chemical Society. Copyright 2017 American Chemical Society.
Figure 23.
Schematic representation of dehalogenation of 3-bromoaniline and various catalytic results obtained are shown in the tabular form. Adapted with permission from the American Chemical Society. Copyright 2017 American Chemical Society.

Figure 24.
(A) PXRD data for Pd50Rh50 alloy NPs synthesized in four different reaction times; (B) corresponding TEM analysis; (C) EDS data comparisons between 30 s (top panel) and 3 h samples; (D) plot of TOF vs. time on stream (min); (E,F) respectively show variations in H-, and CHE-binding energies for various binding sites that were considered. Adapted with permission from the Wiley-VCH Verlag GmbH & Co. KGaA, Weinheim. Copyright 2018 Wiley-VCH Verlag GmbH & Co. KGaA, Weinheim.

Figure 25.
(A) TEM images for Pd/Pt (1/1) NPs synthesized using multimode µwH in EG, corresponding size distribution analysis is shown in (B), (C) shows FT-EXAFS spectra; (D–F) show TEM, size distribution analysis, and FT-EXAFS spectra respectively for Pd/Pt (1/1) NPs synthesized using multimode µwH in glycerol. Copyright 2018 American Chemical Society.

Figure 26.
(A) HRTEM image with the electron diffraction pattern (inset) and (B) size analysis for Pd/Pt (1:1) synthesized using single-mode batch type µwH method and using single-mode flow type µwH method (C,D) in EG solvent. Adapted with permission from the American Chemical Society. Copyright 2018 American Chemical Society.

Figure 27.
Schematic model of (A) random, (B) core-shell, (C) cluster-in-cluster, and (D) separated model for a six layered nanoparticle comprising of 923 atoms; HAADF-STEM image is shown in (E), Pt-M, and Pd-L edge spectra are shown in (F) and (G) respectively, (H) shows the overlay of these two, EDS line profile diagonal to a particle denoted in (E) is shown in (I), (J) shows EDS spectra of Pd/Pt (1/1) prepared using single-mode batch type µwH method in EG. Adapted with permission from the American Chemical Society. Copyright 2018 American Chemical Society.


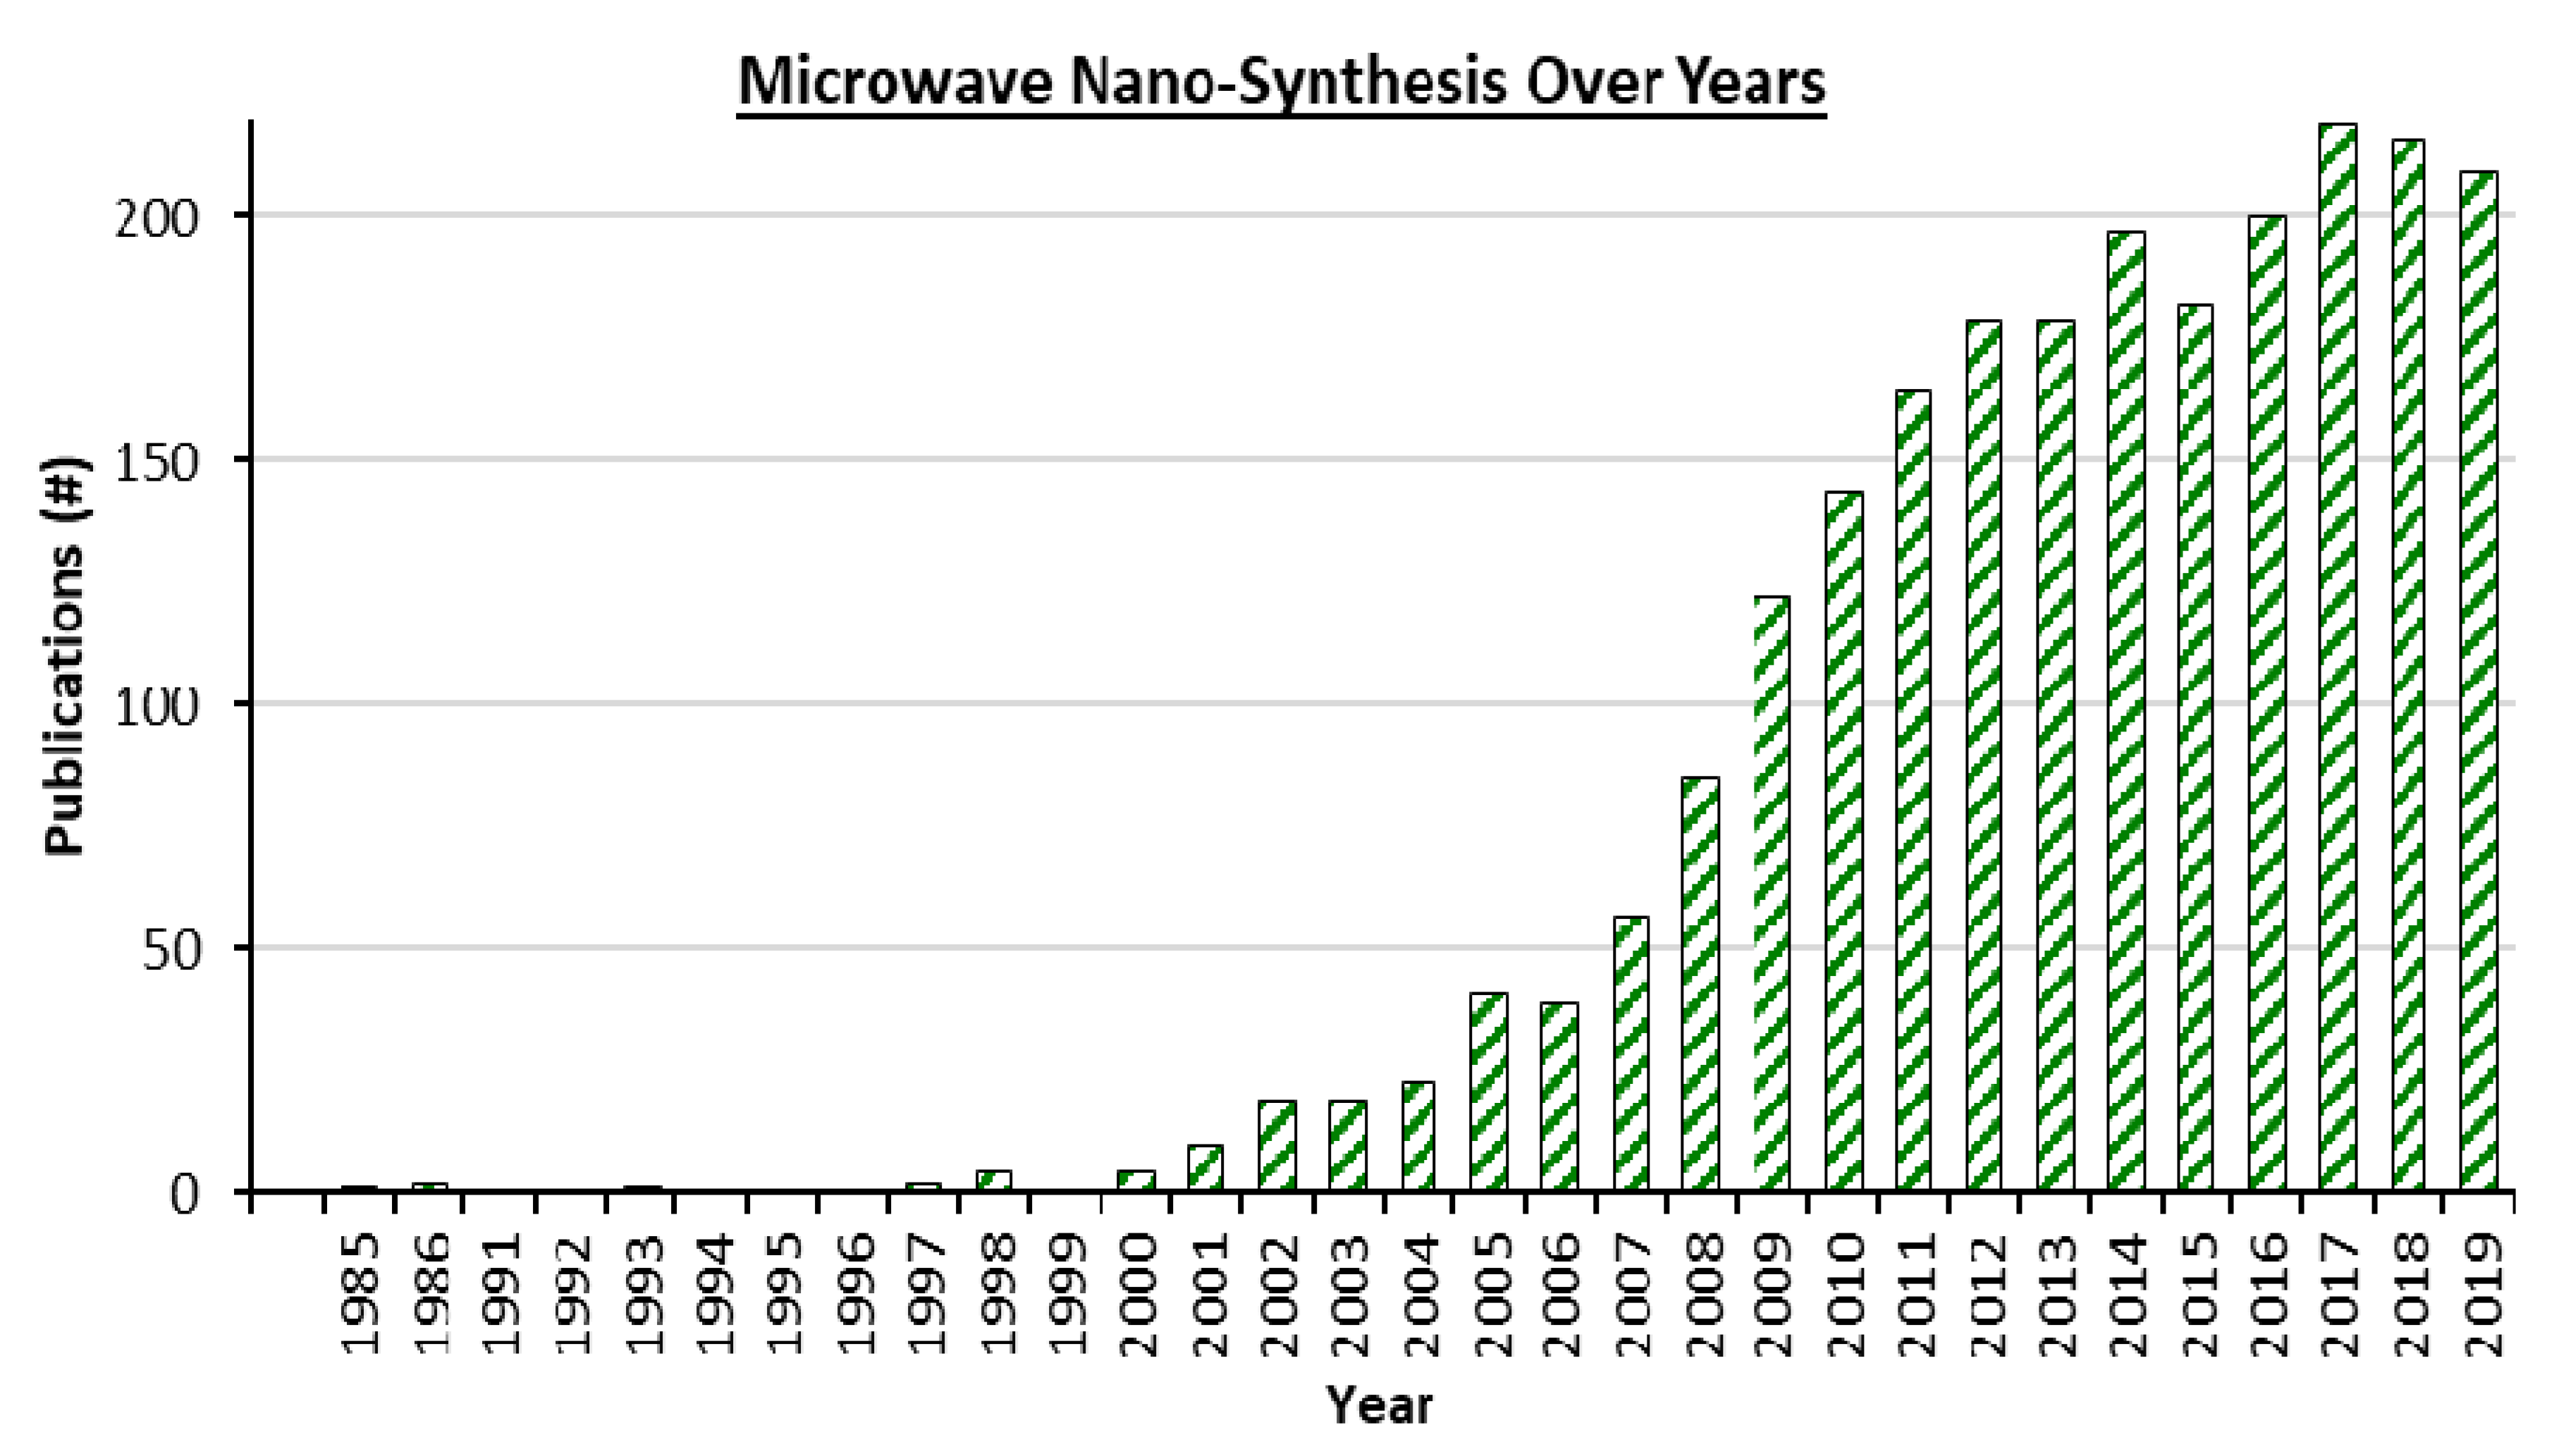
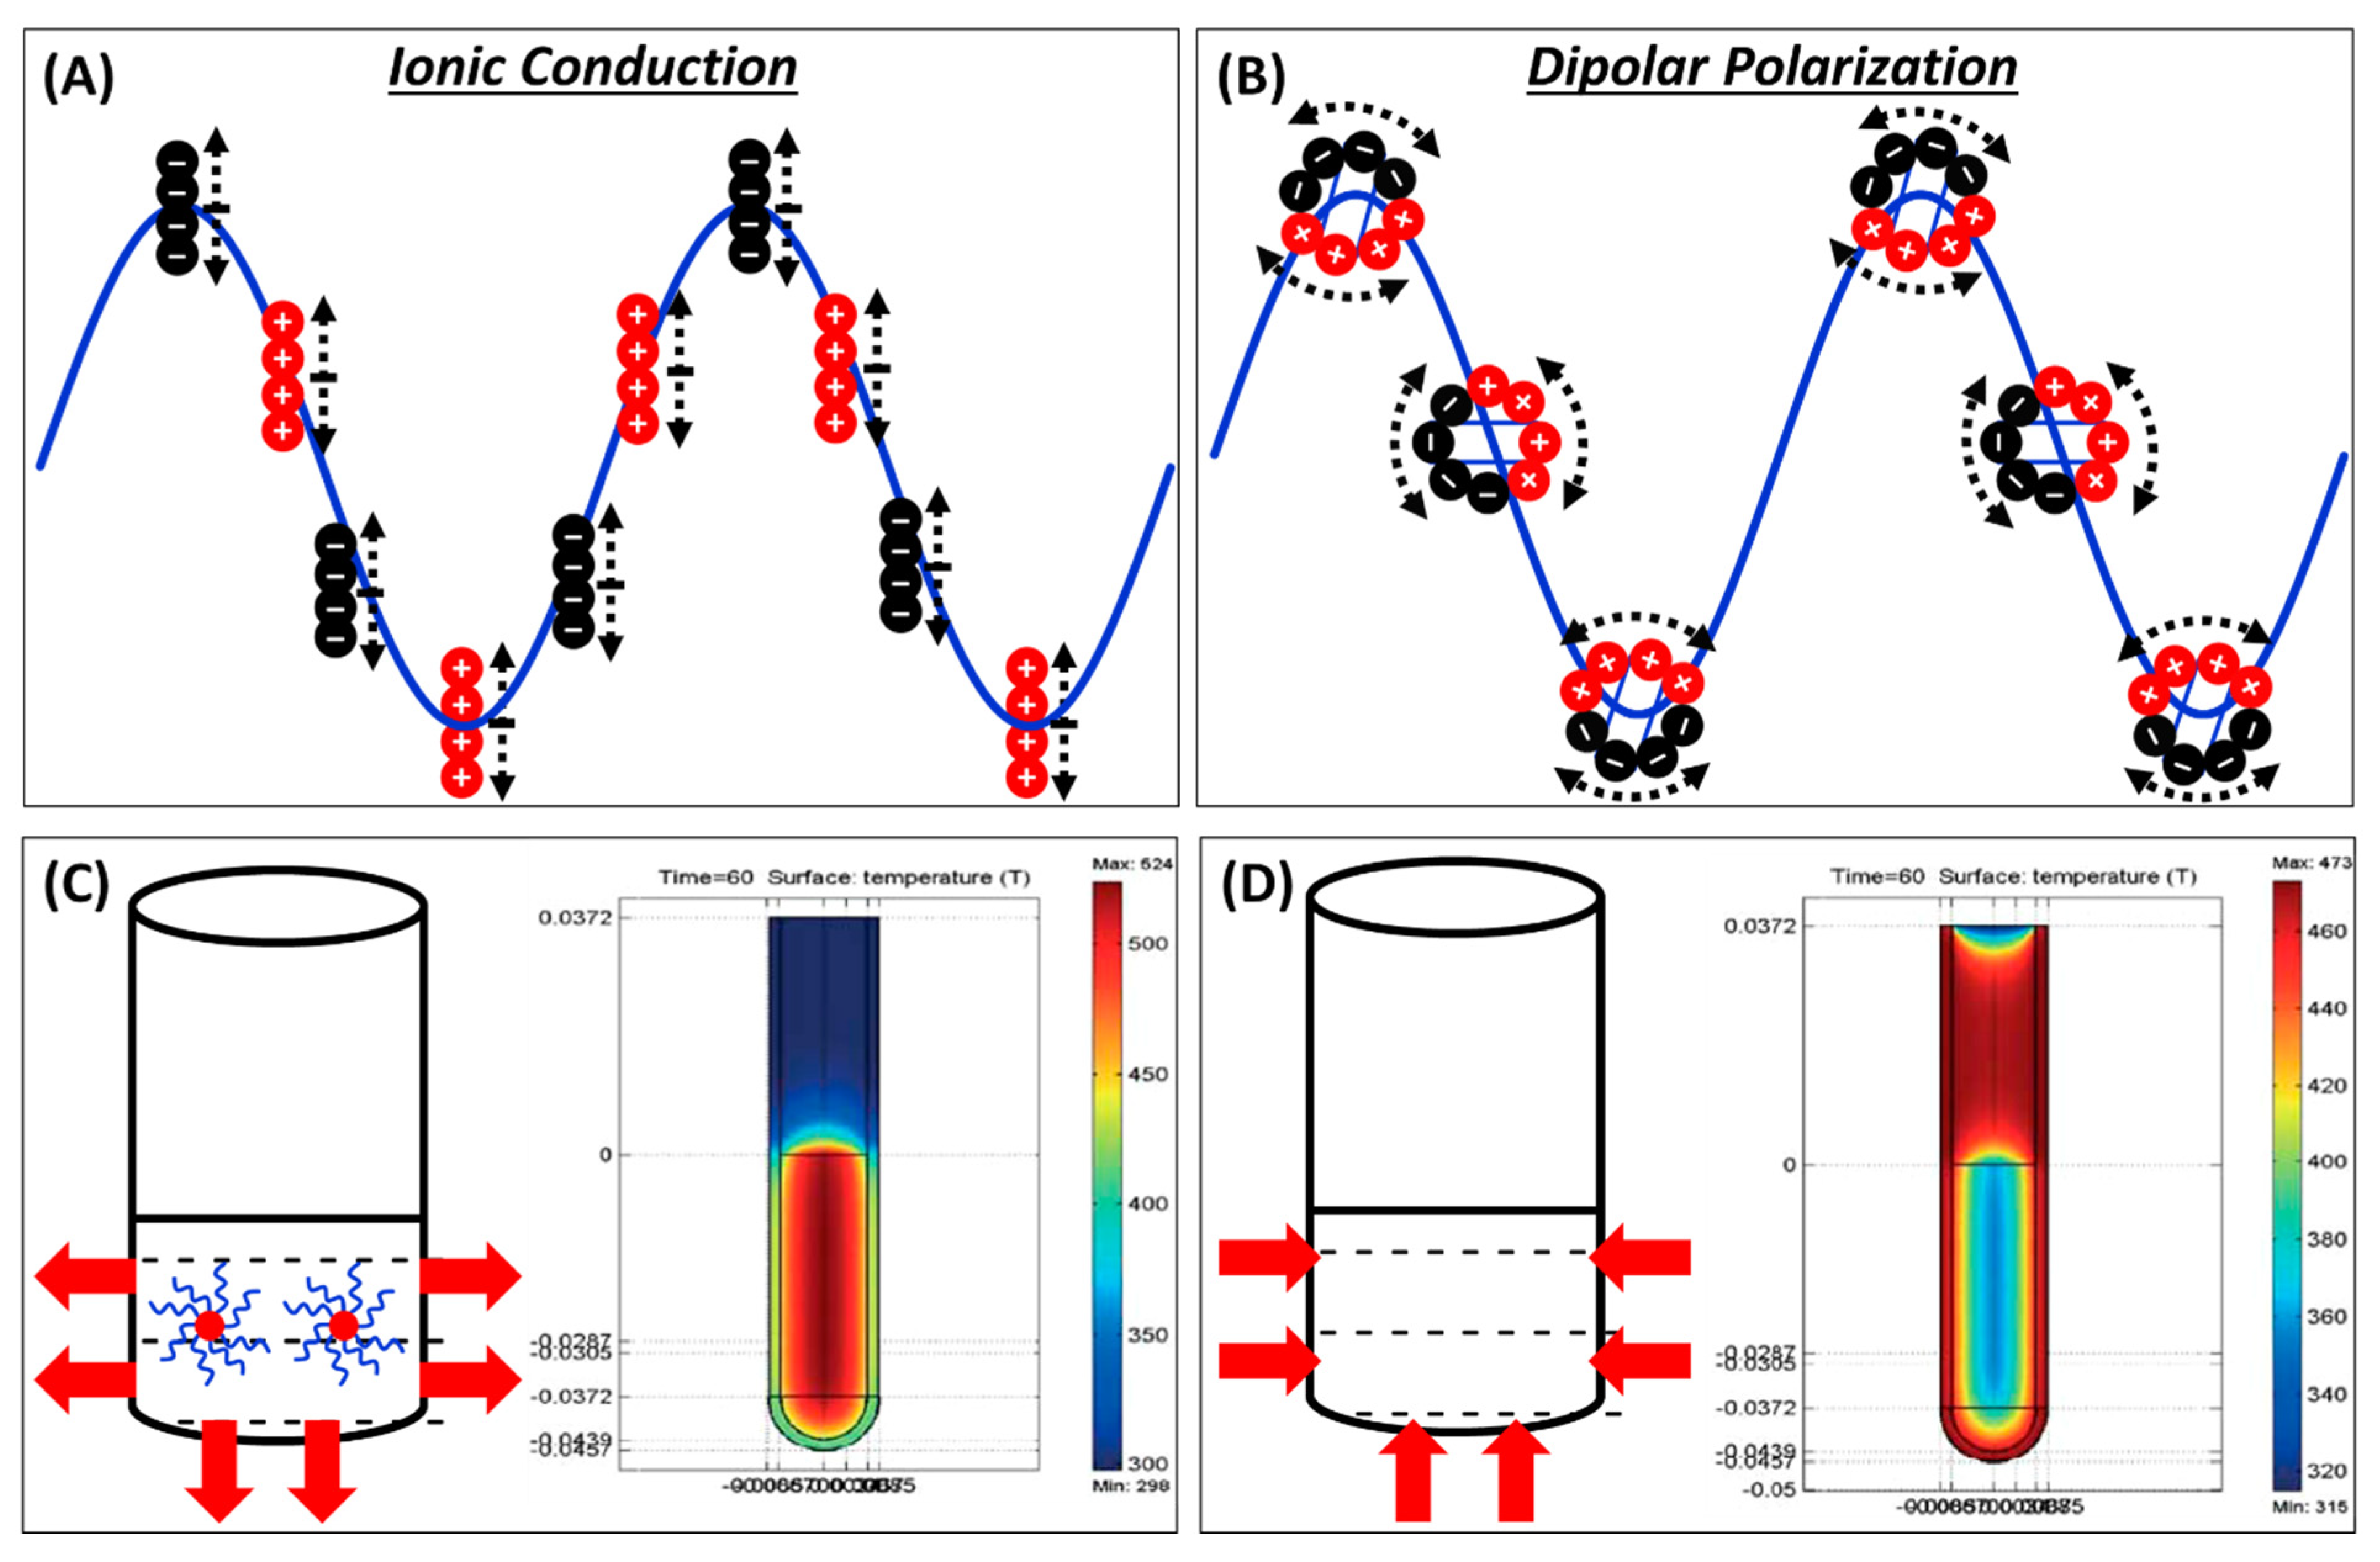
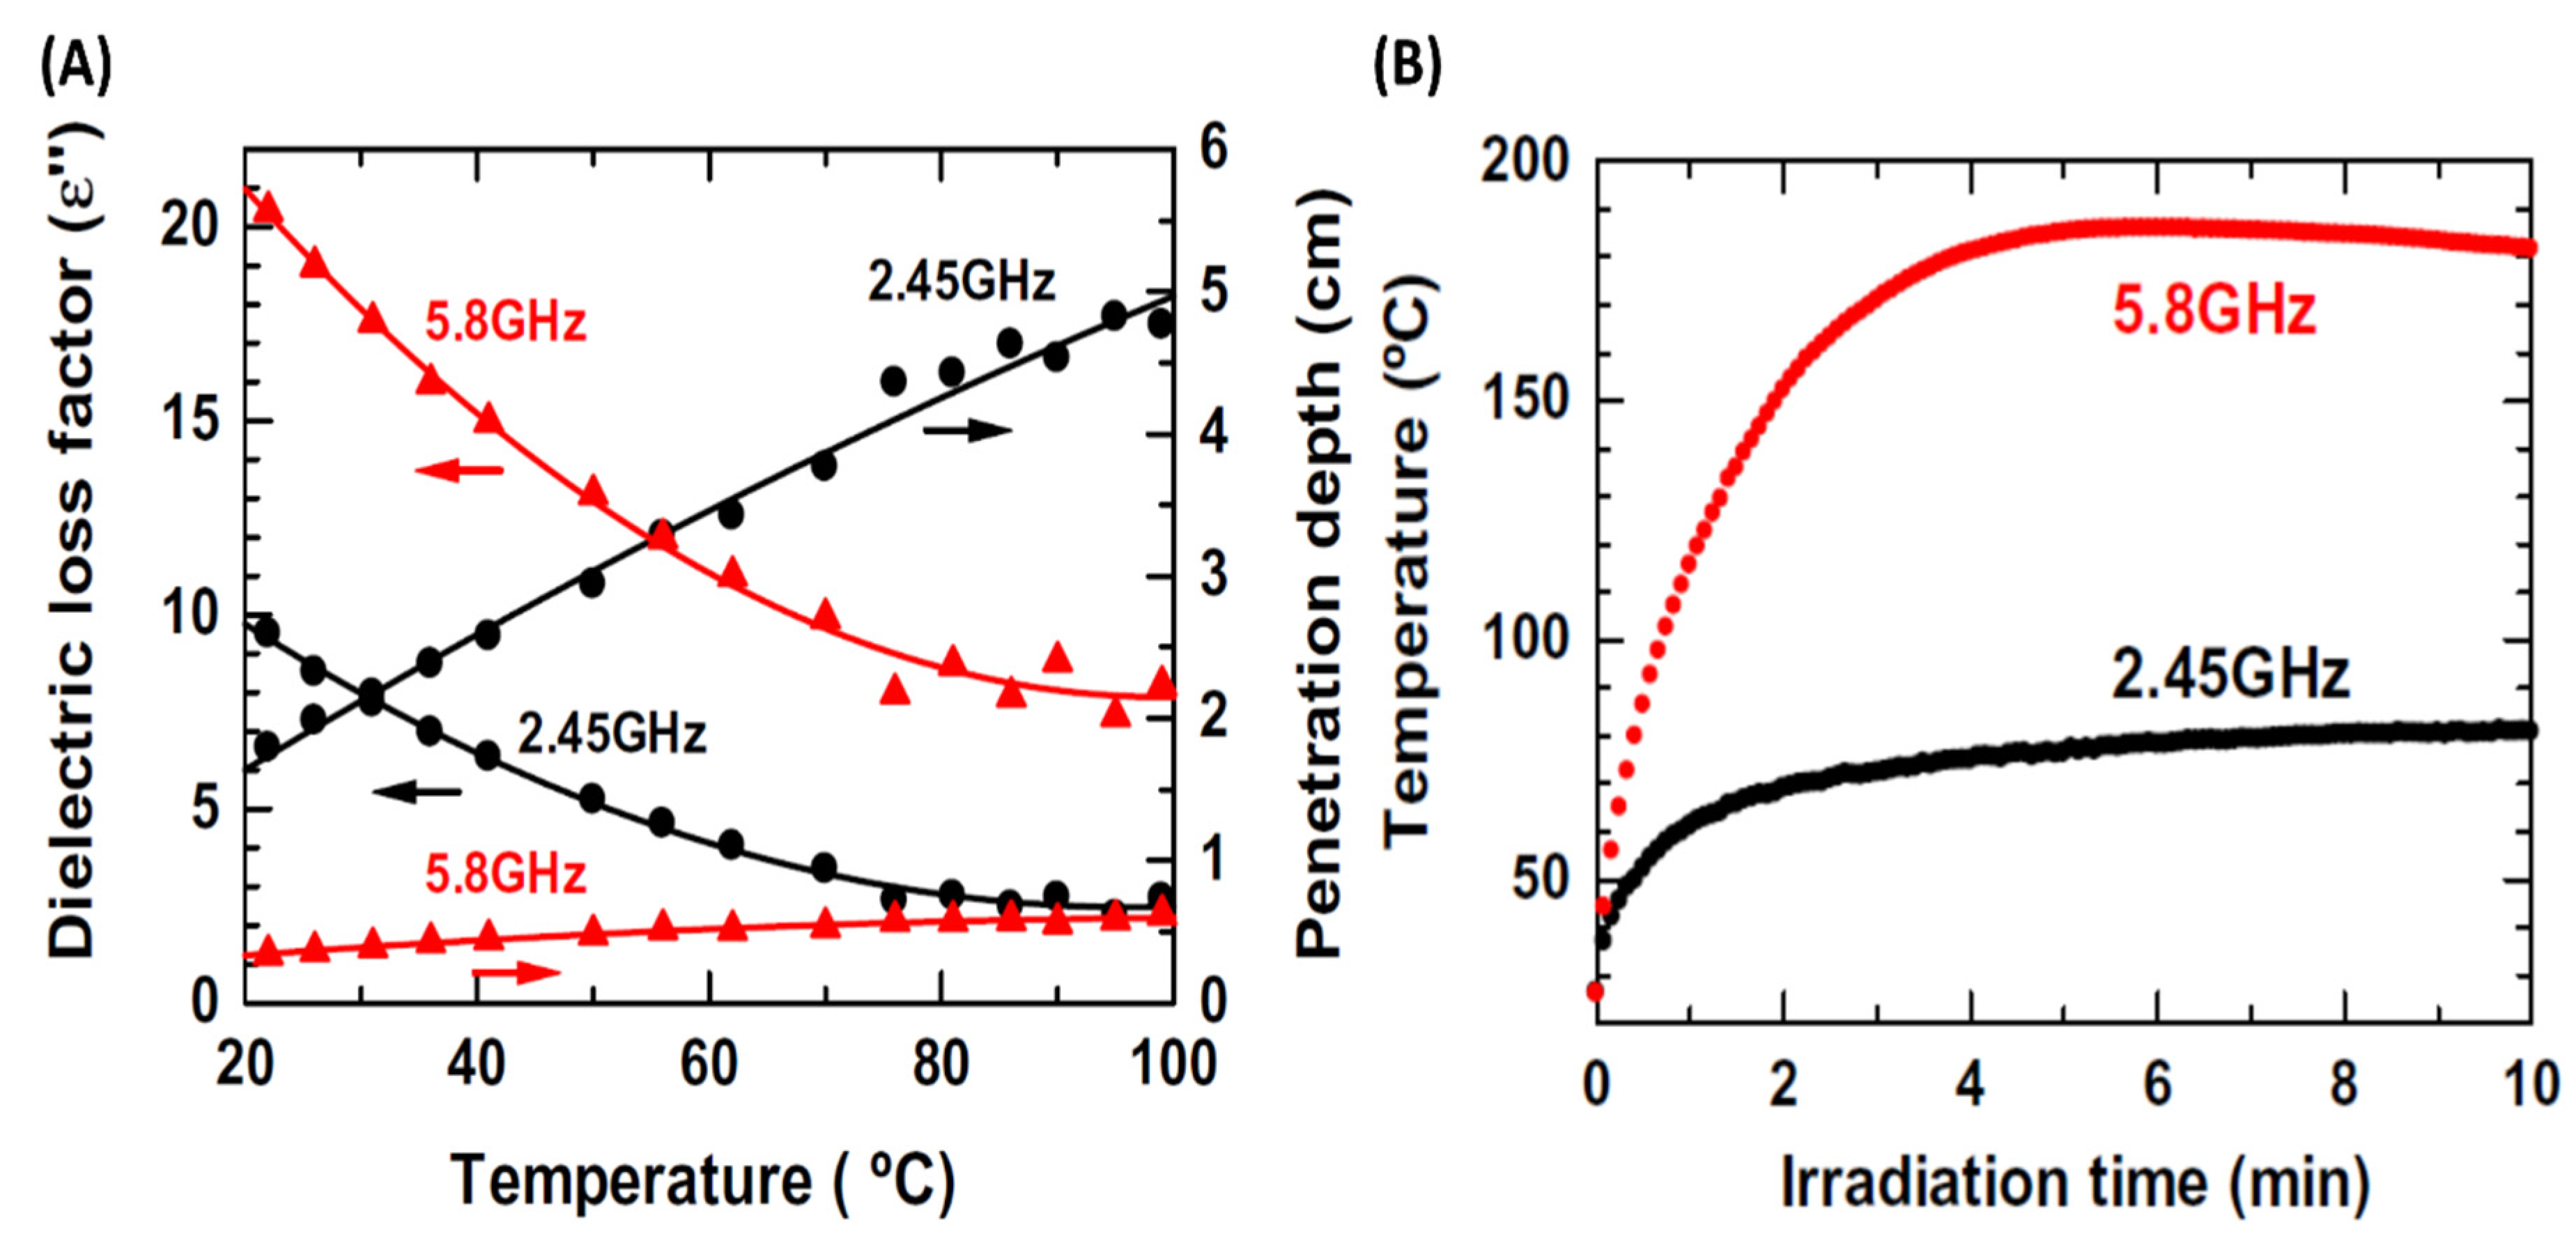
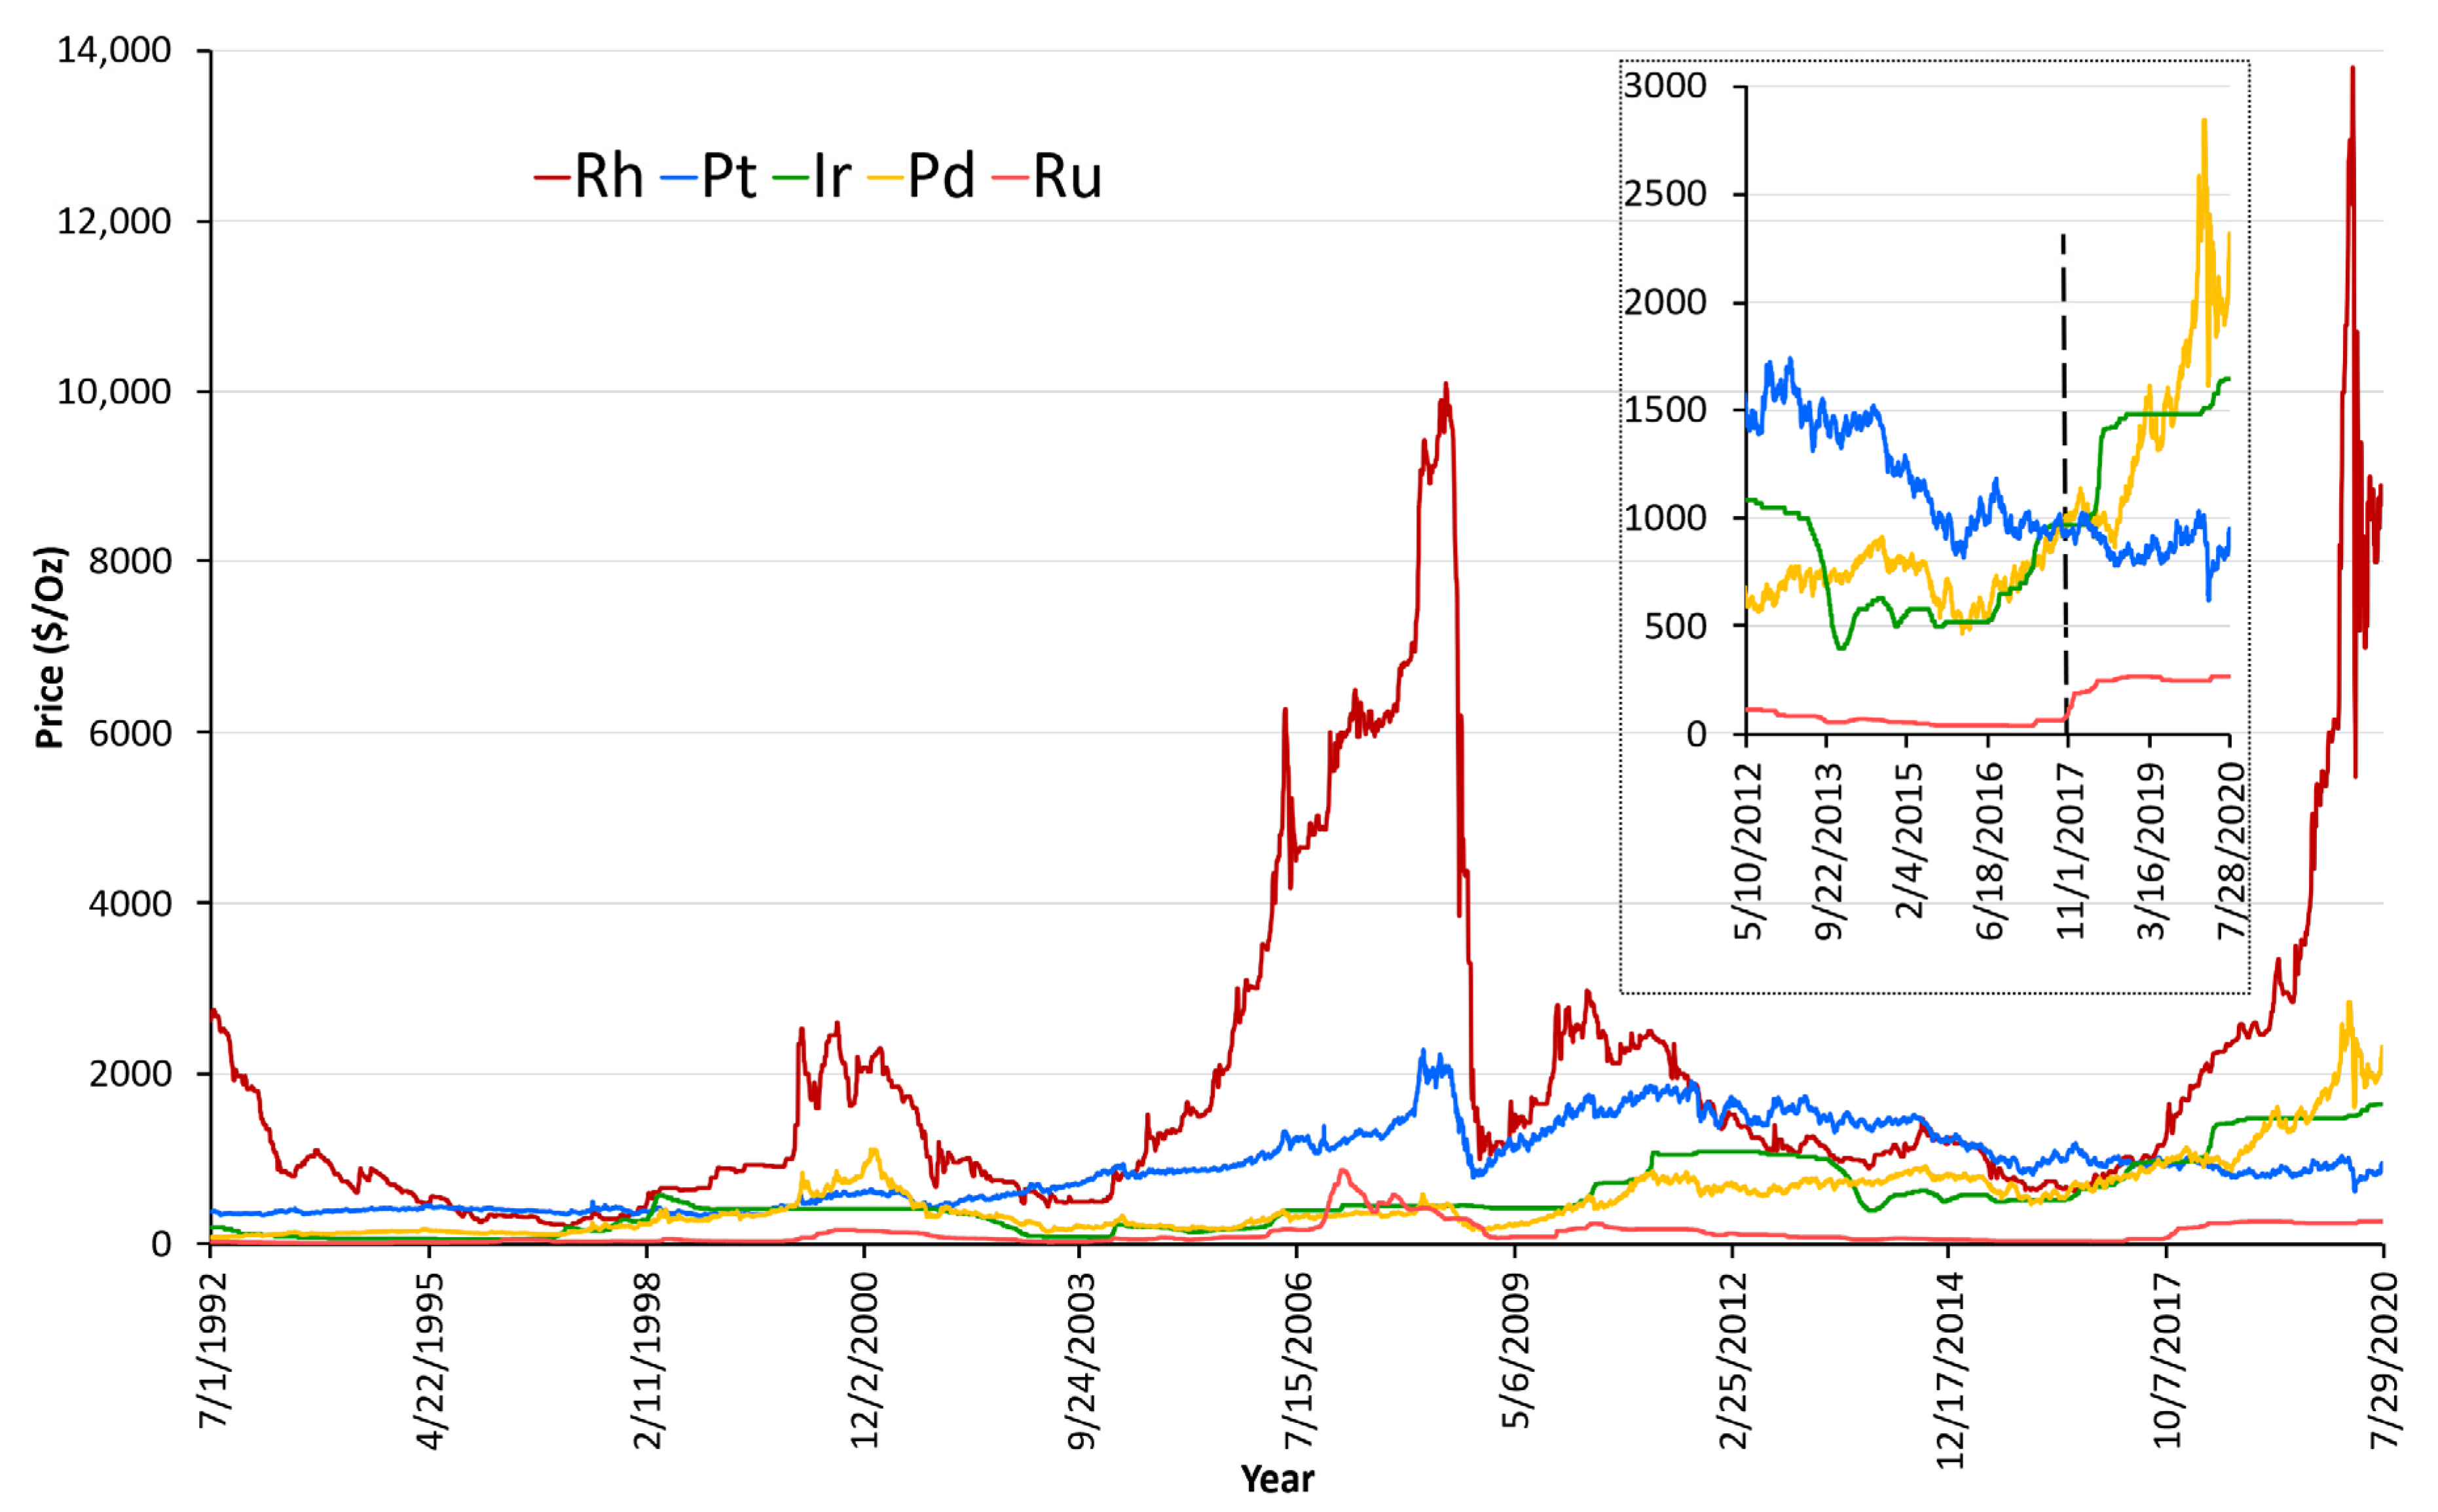
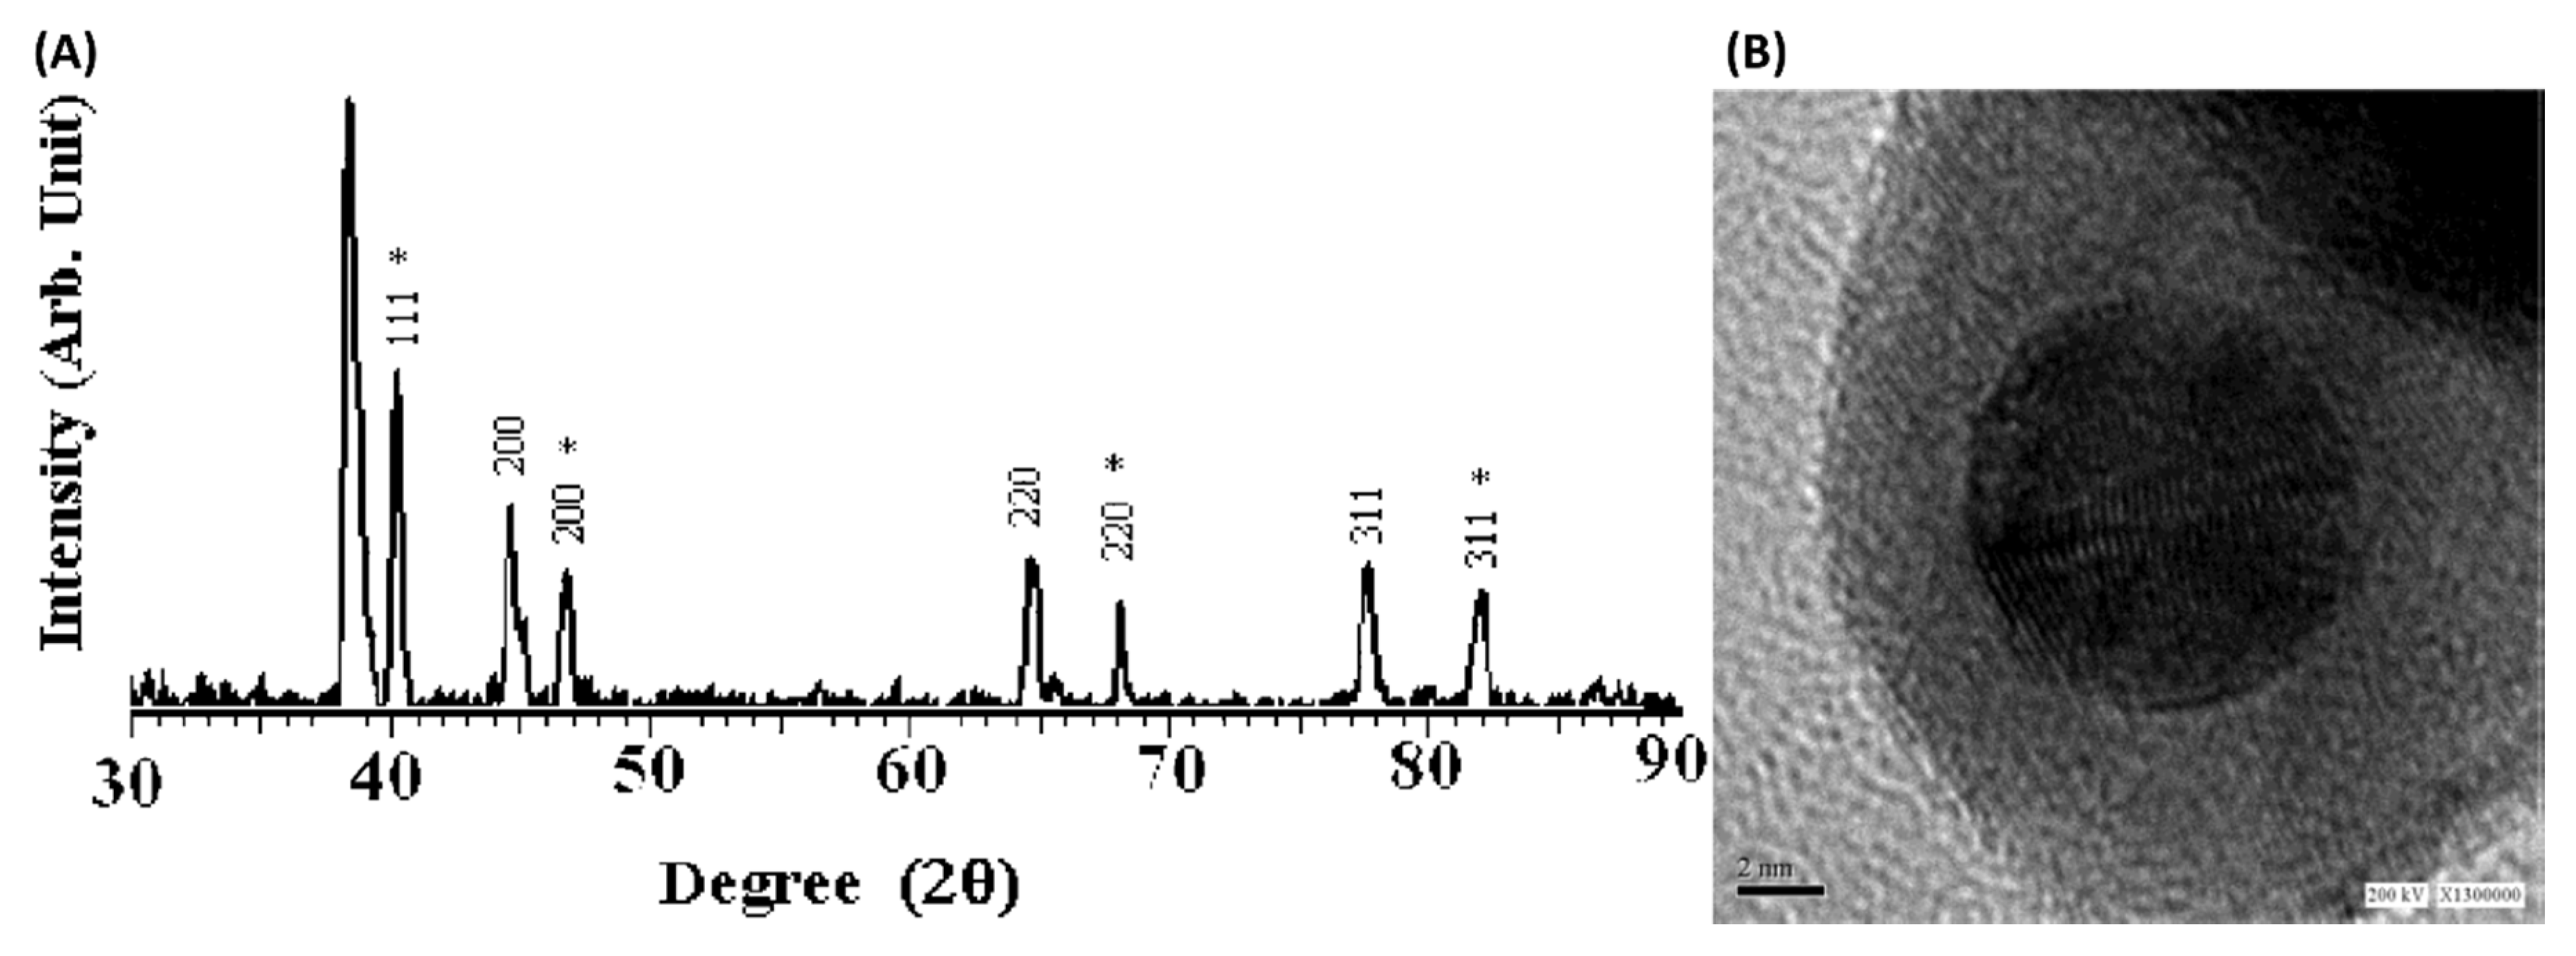
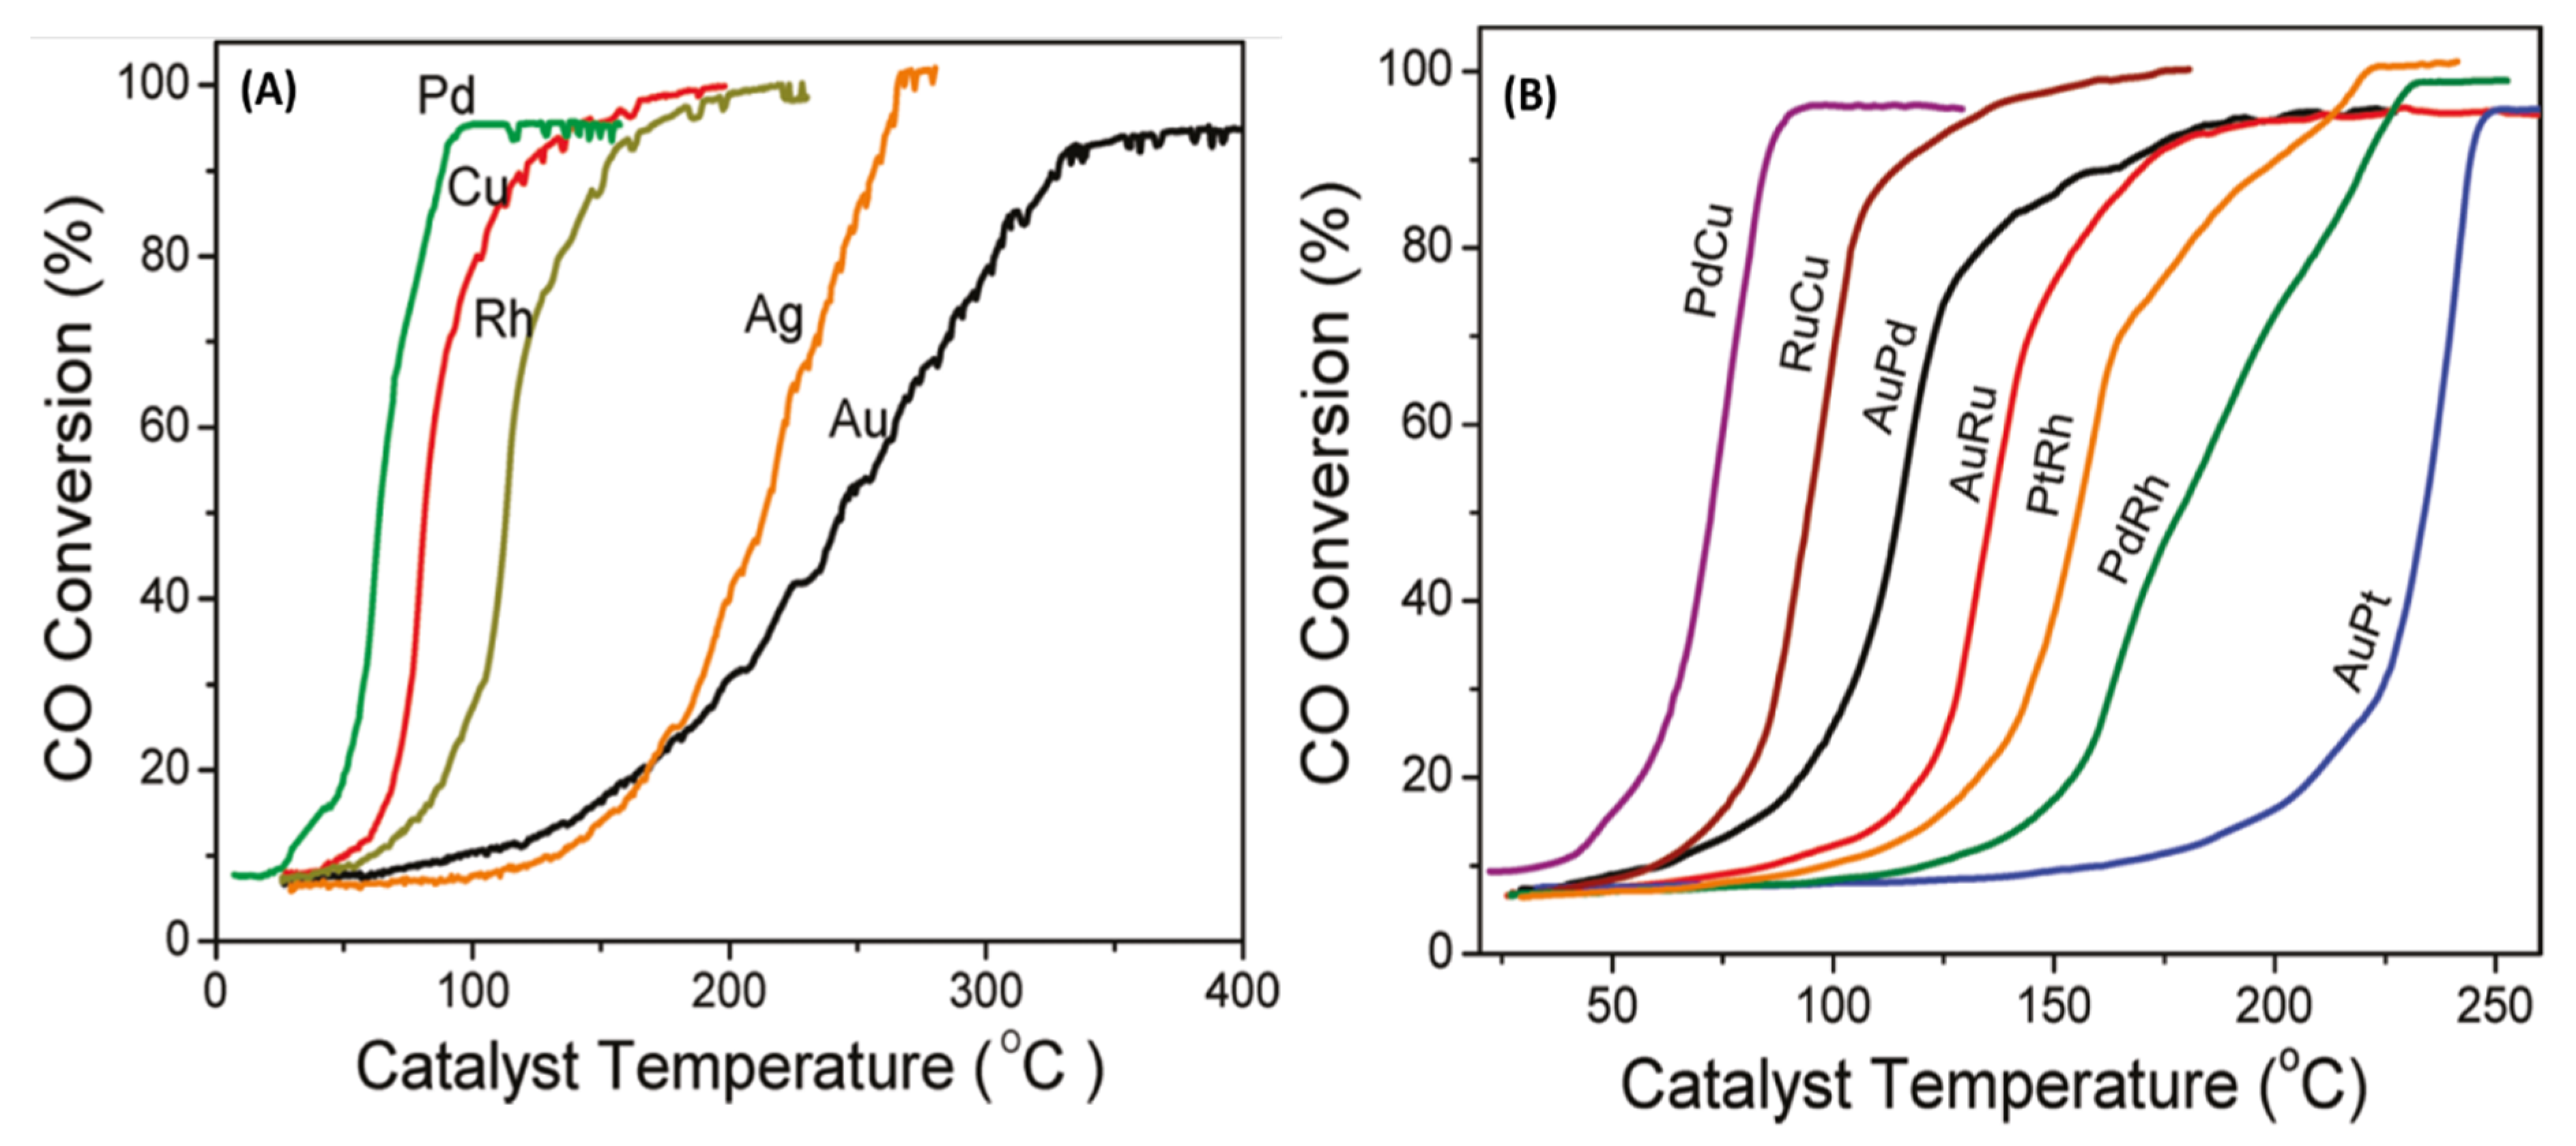
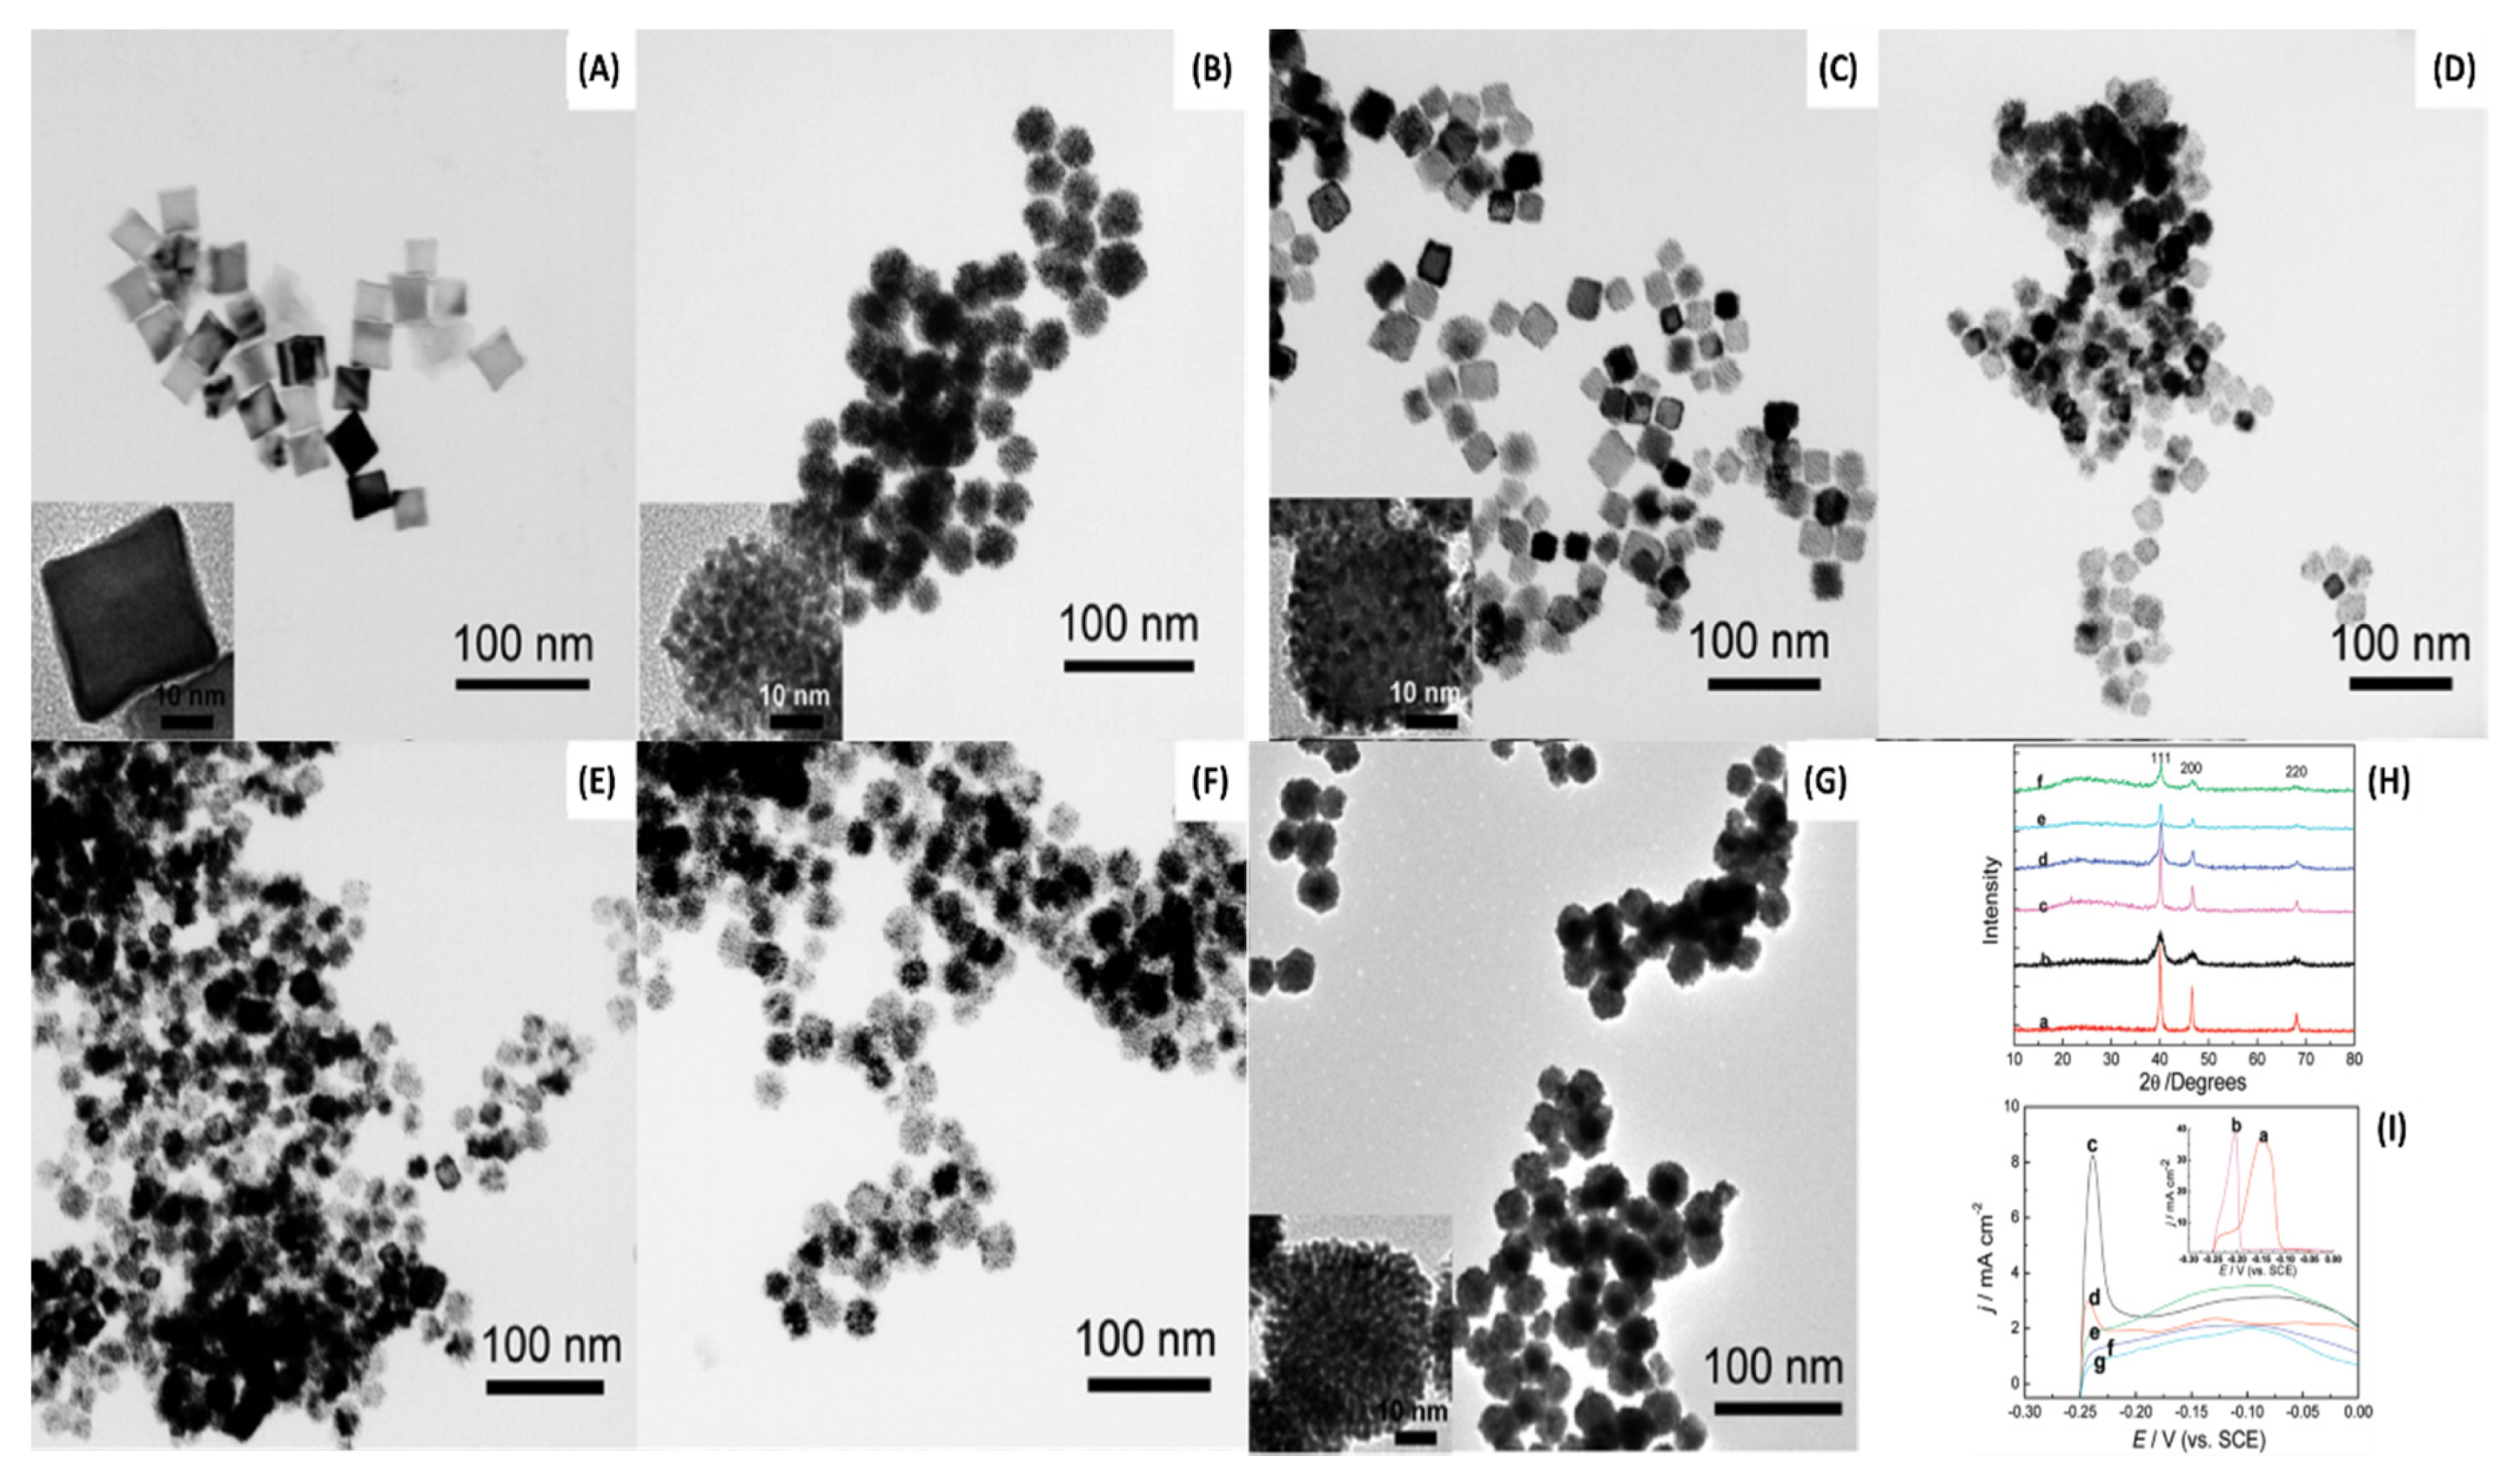
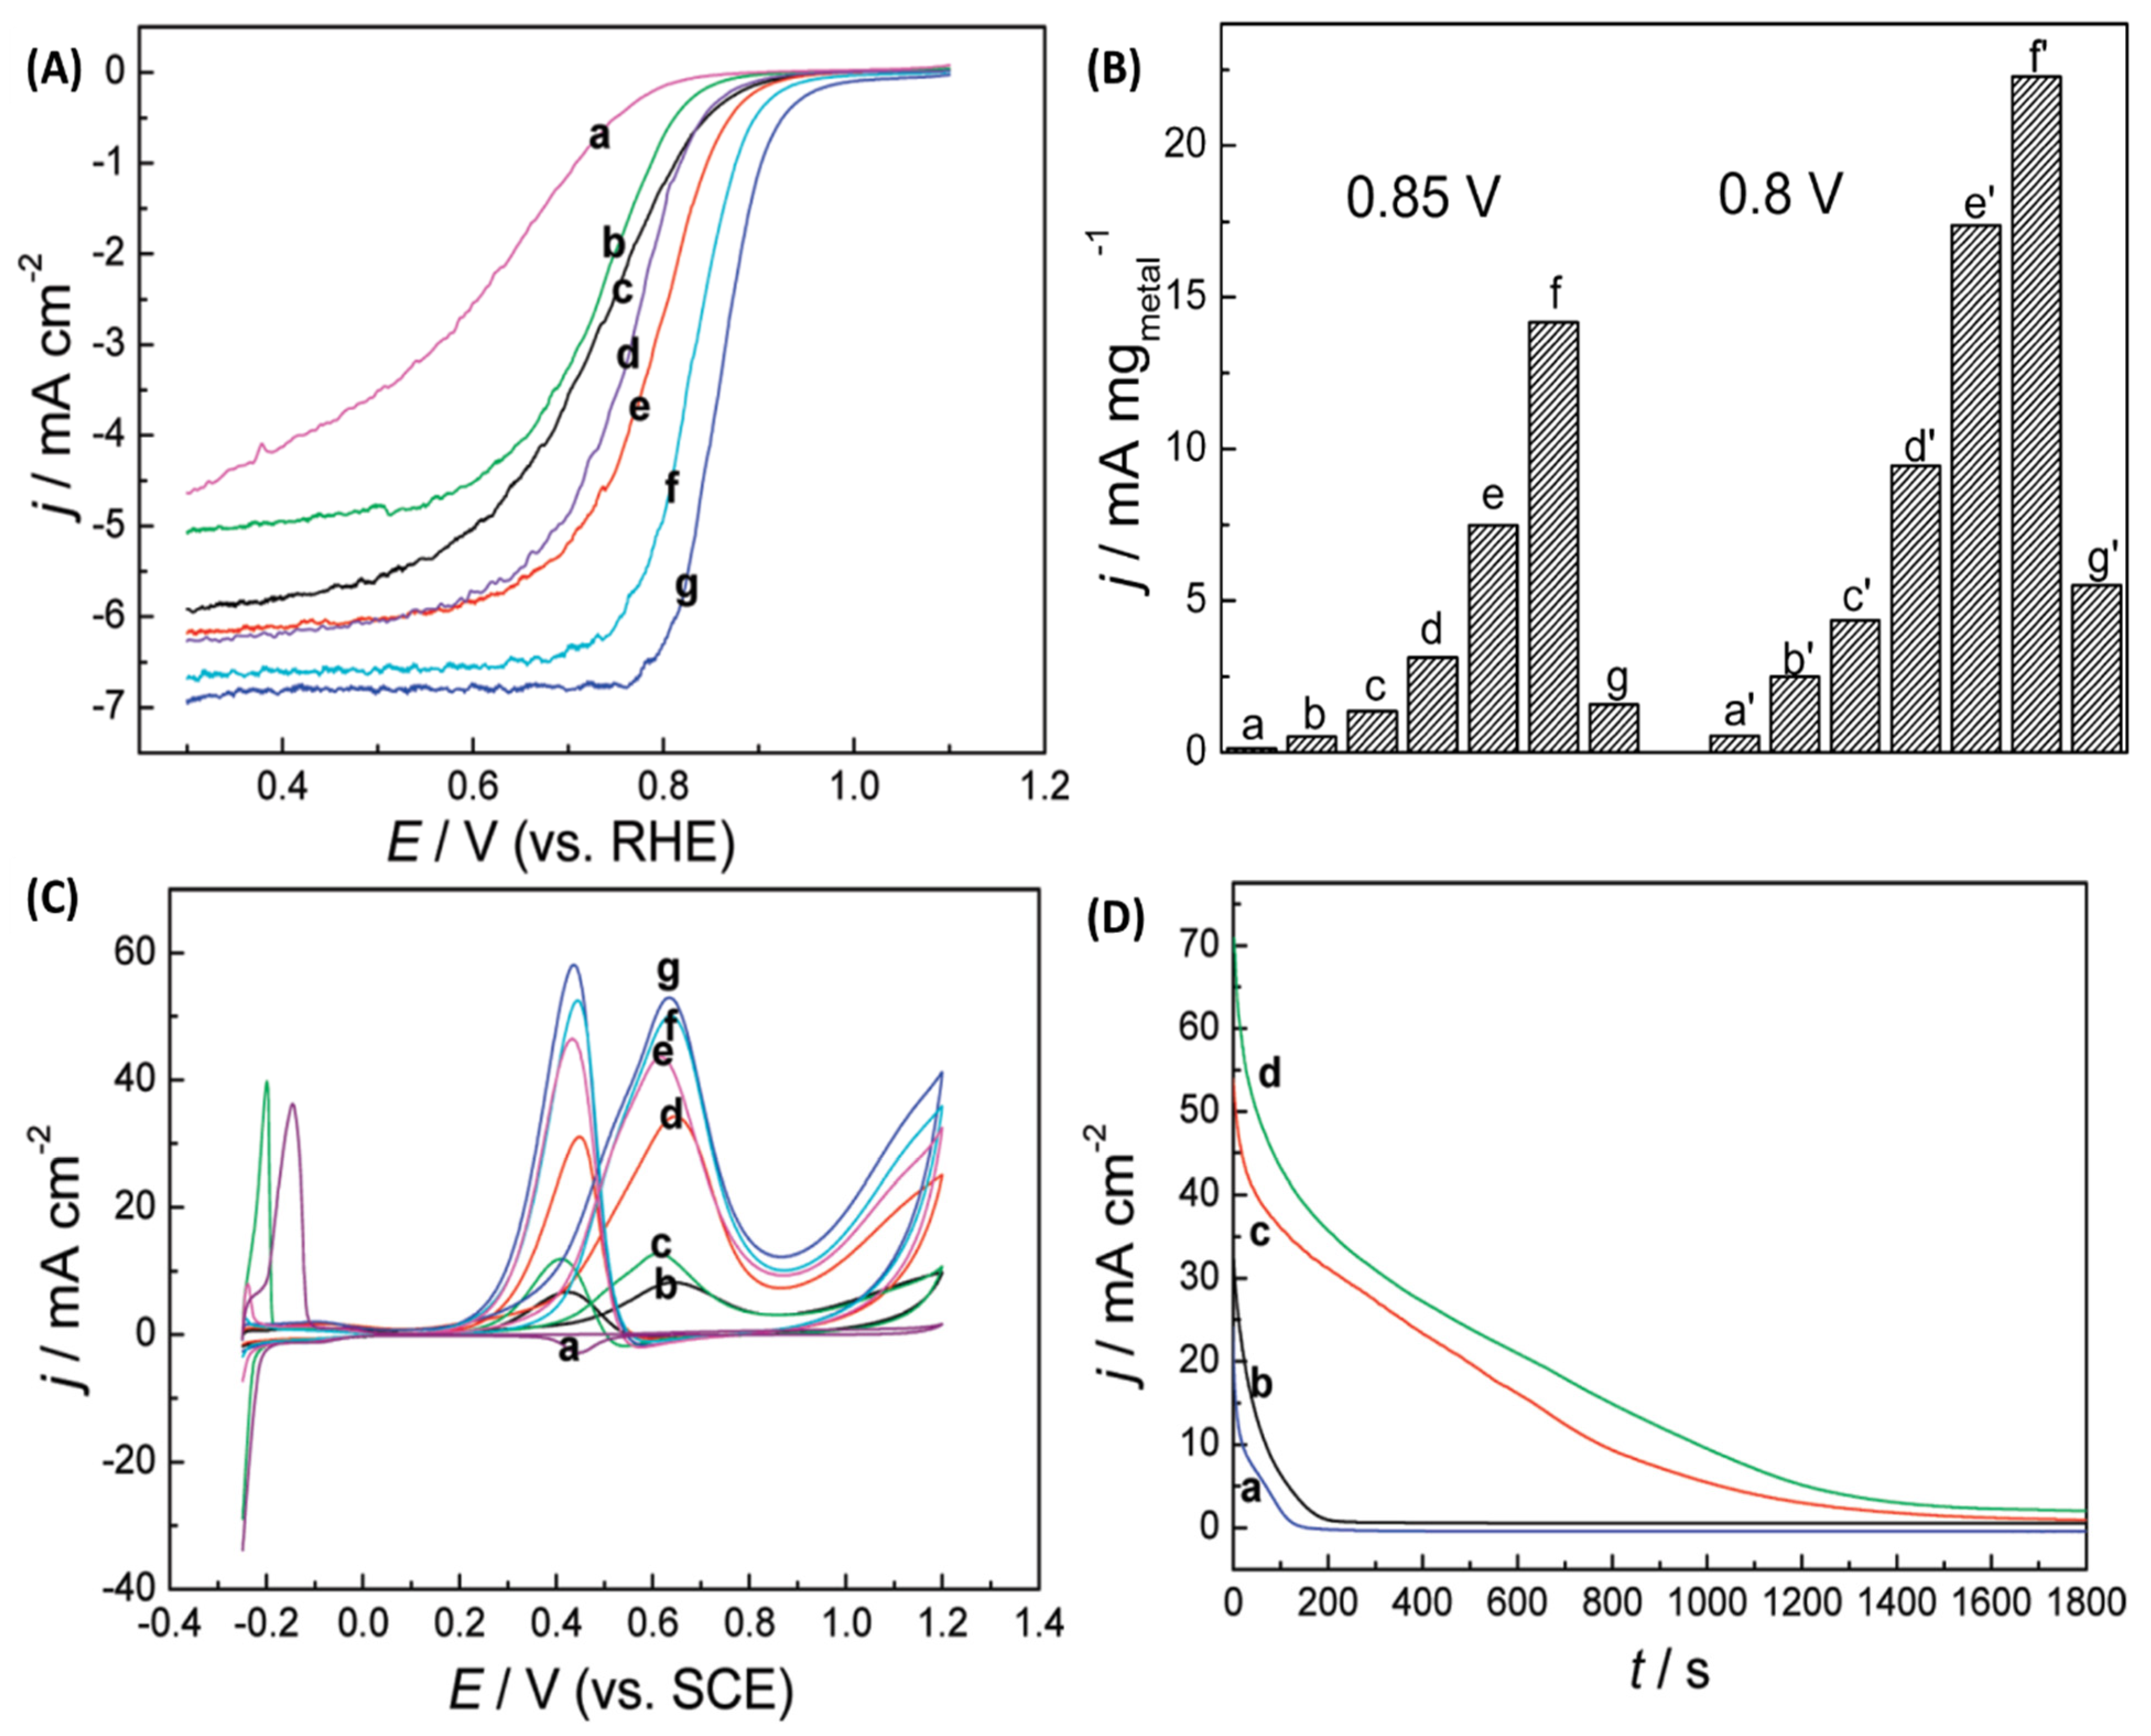
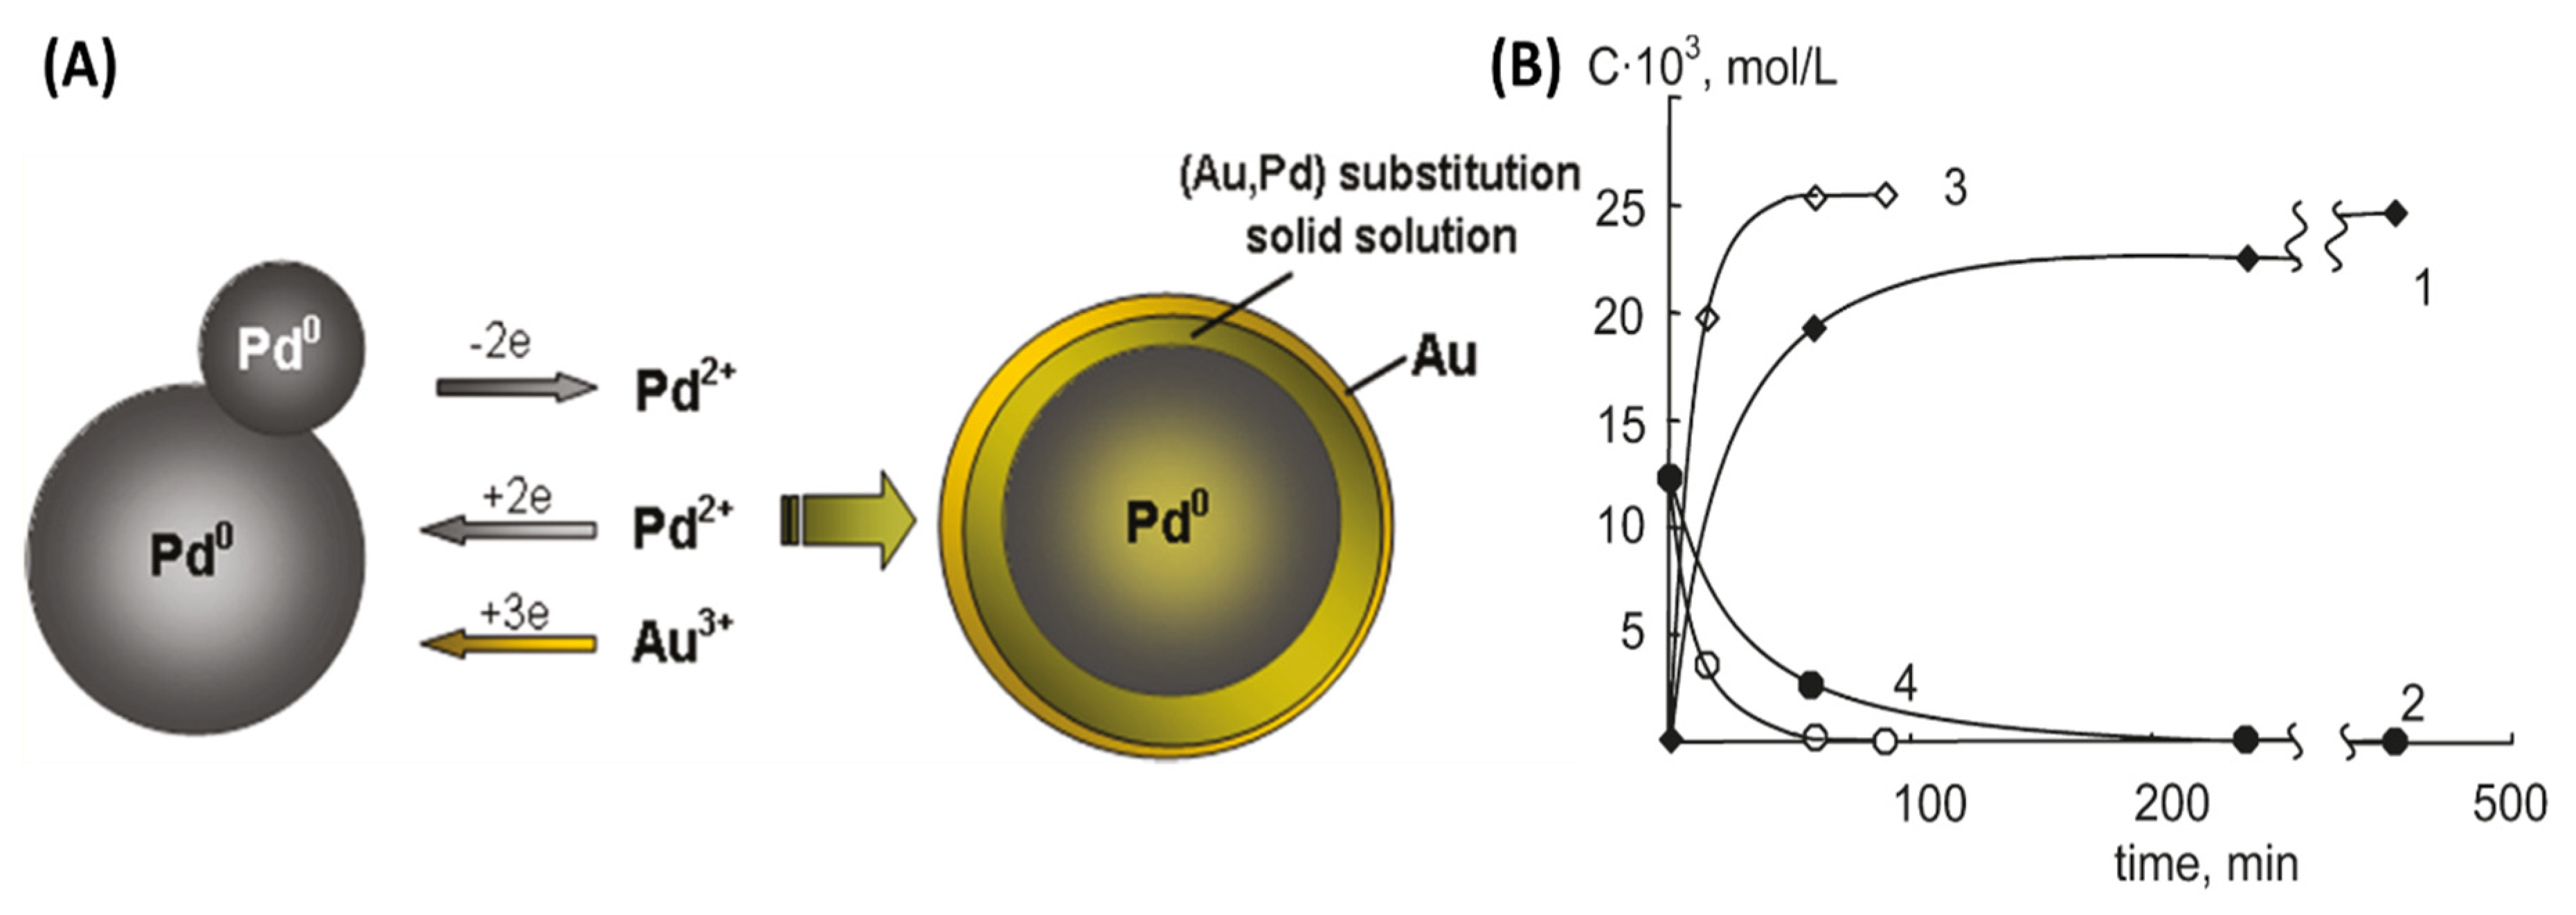
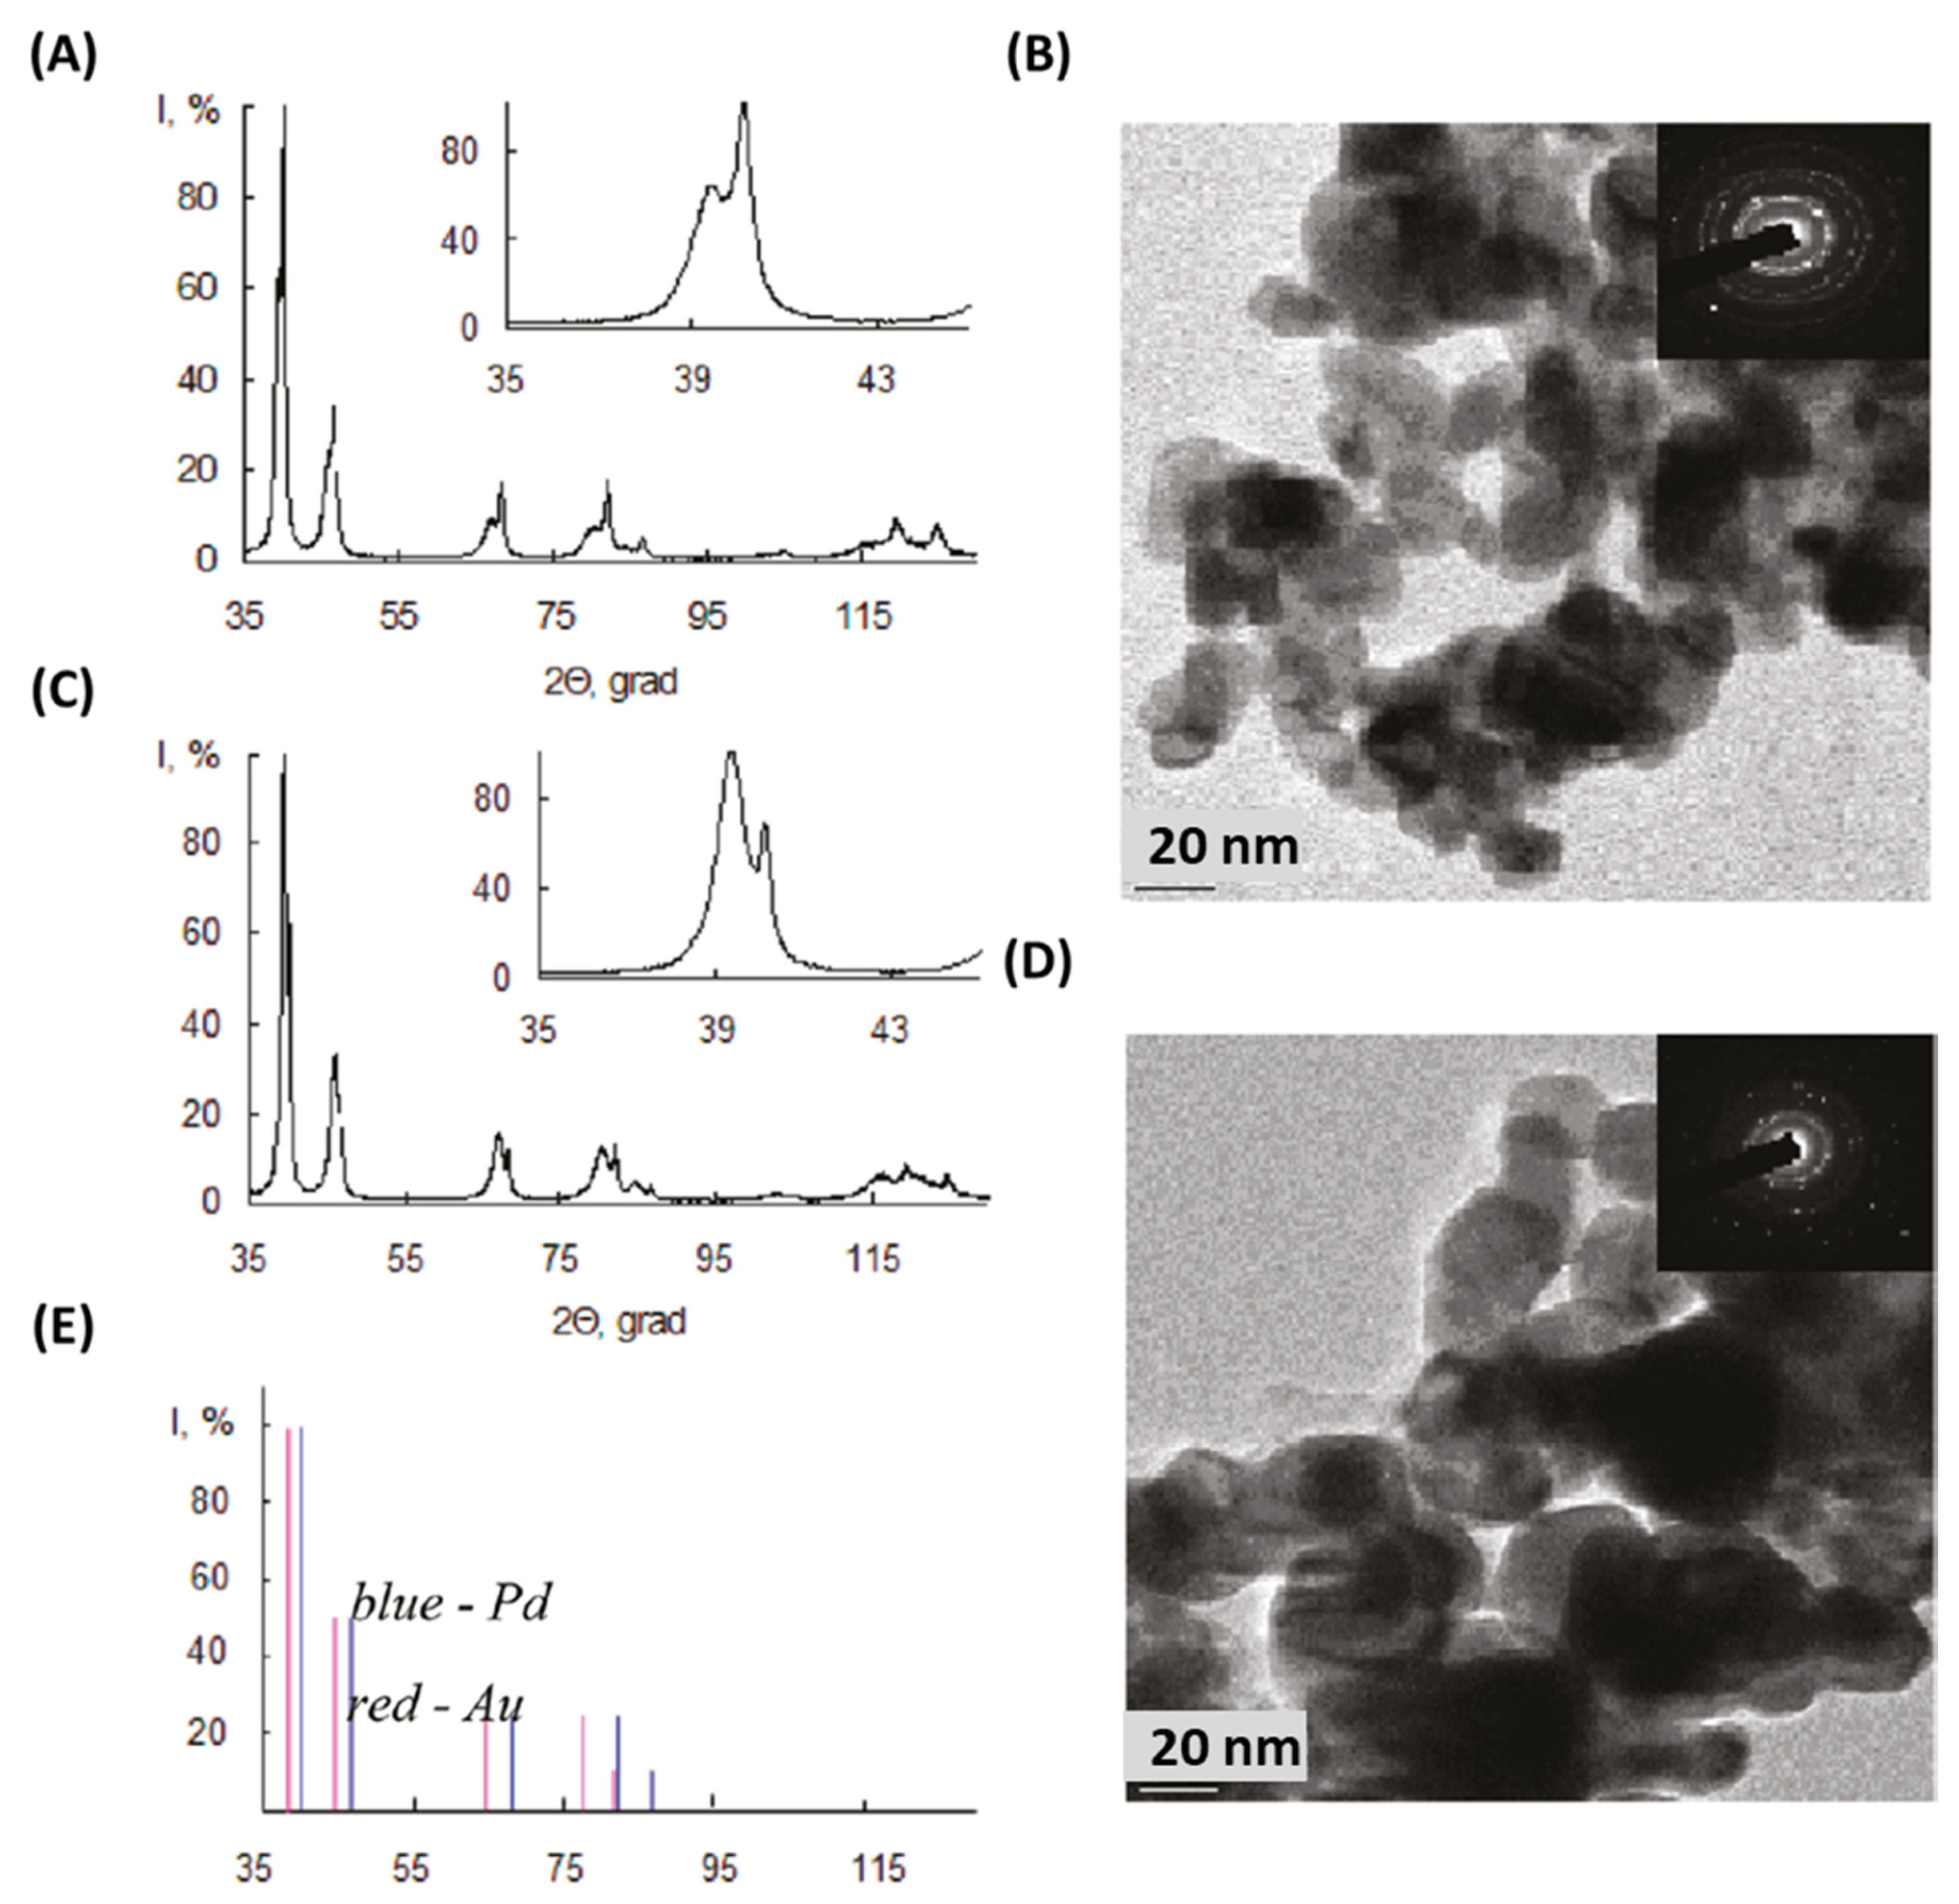
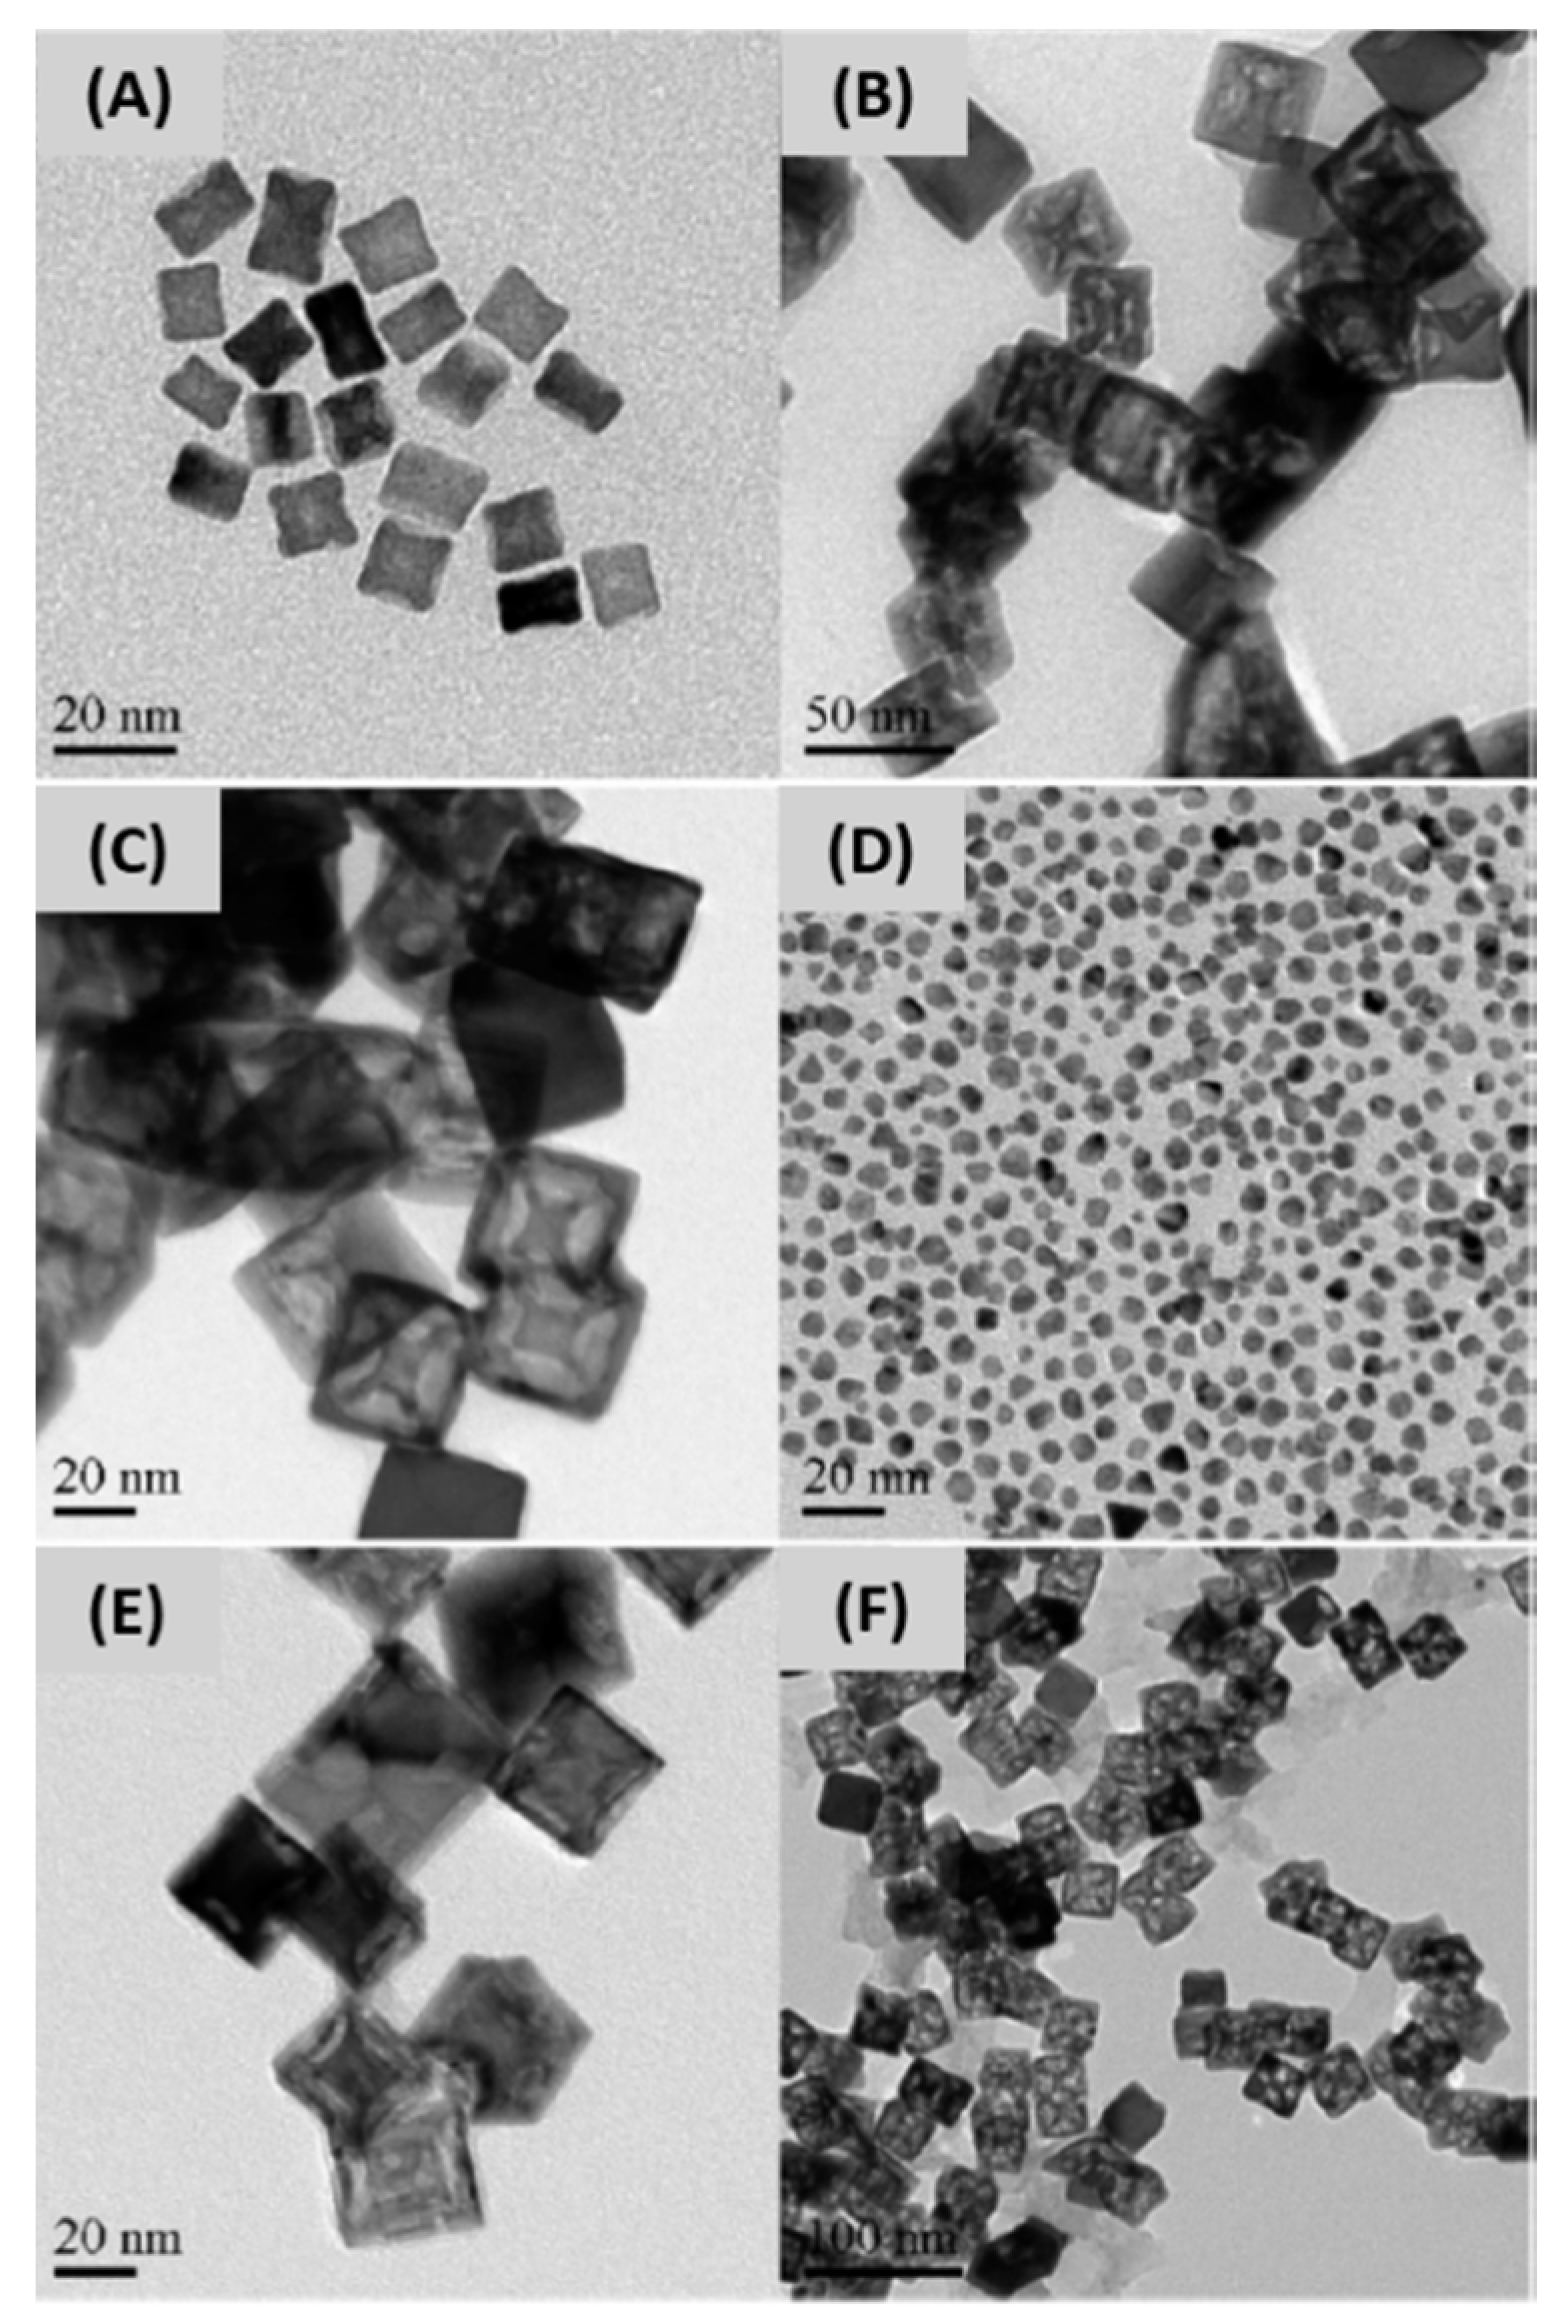
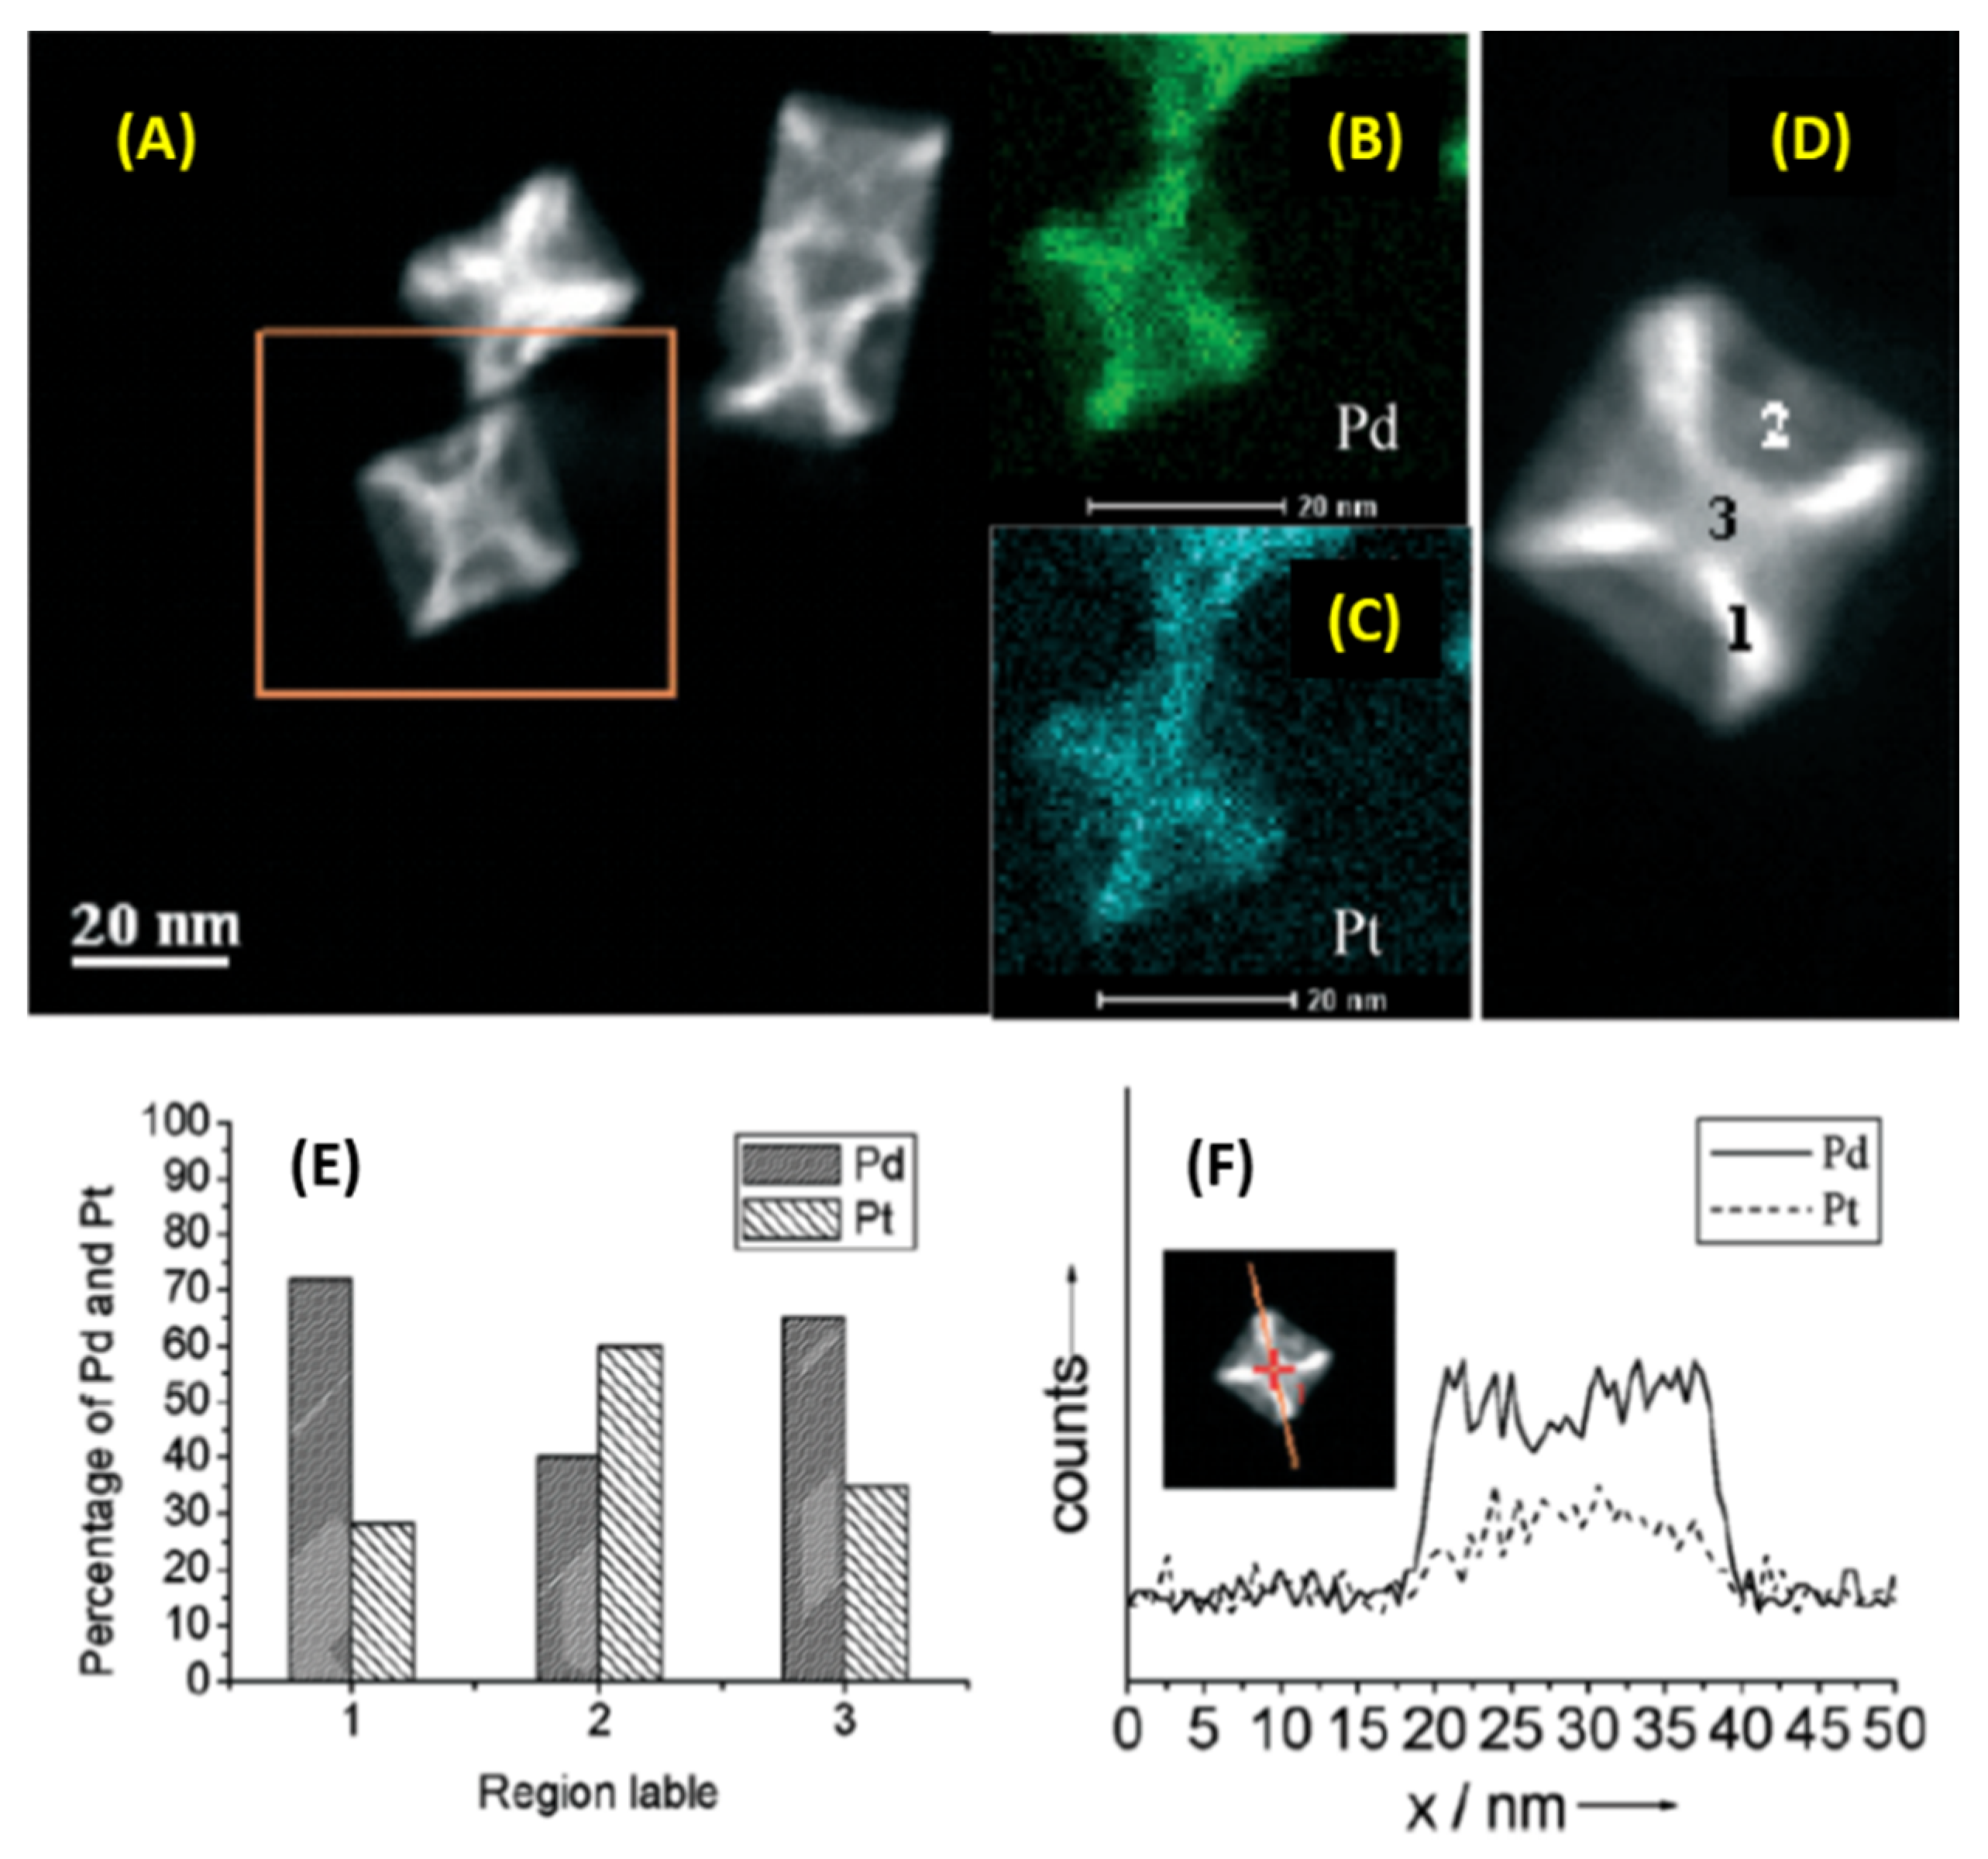
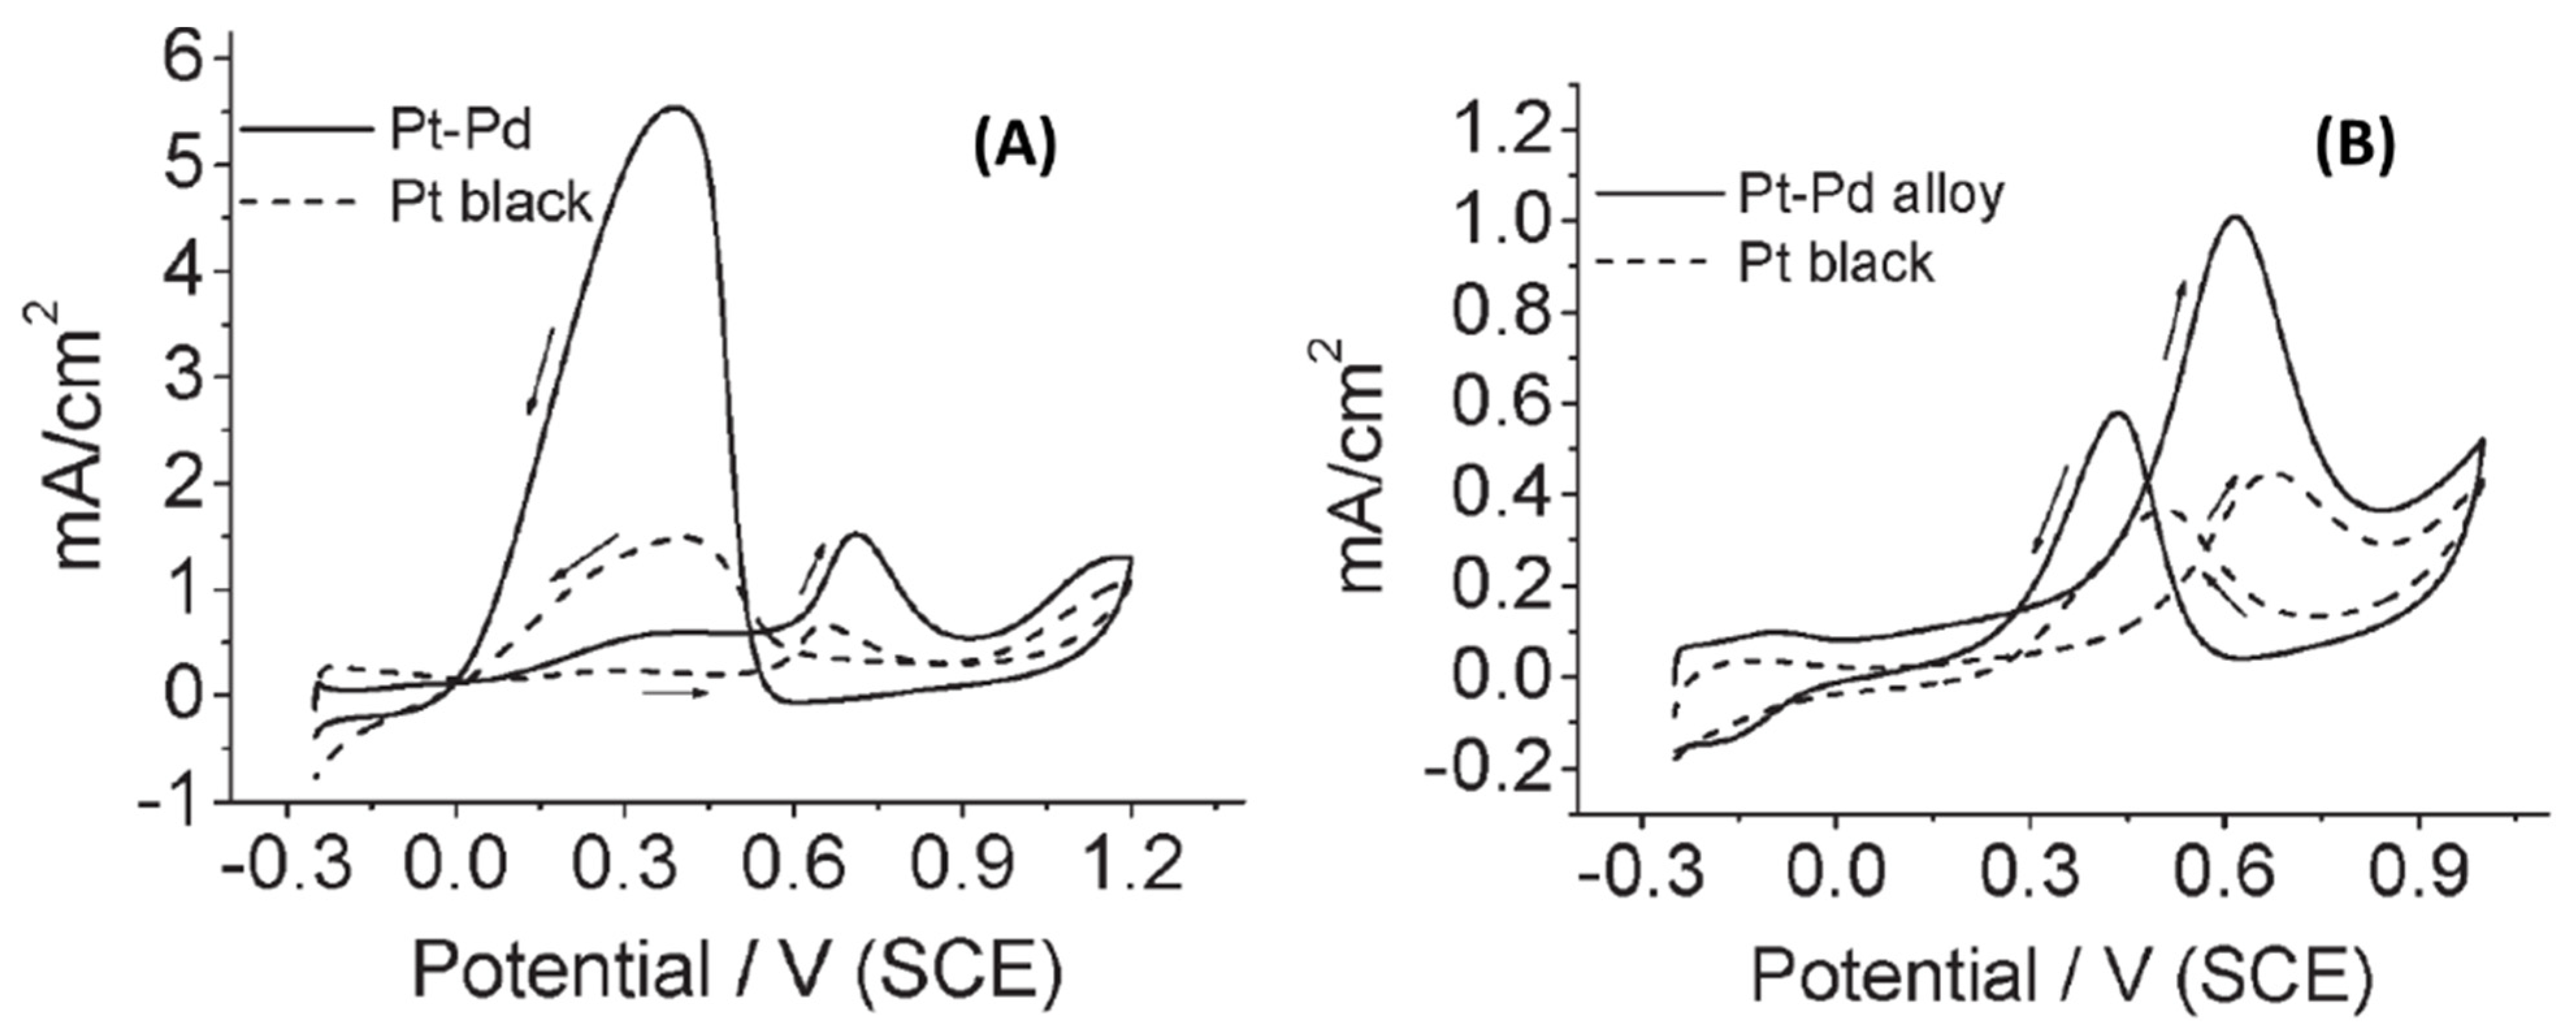
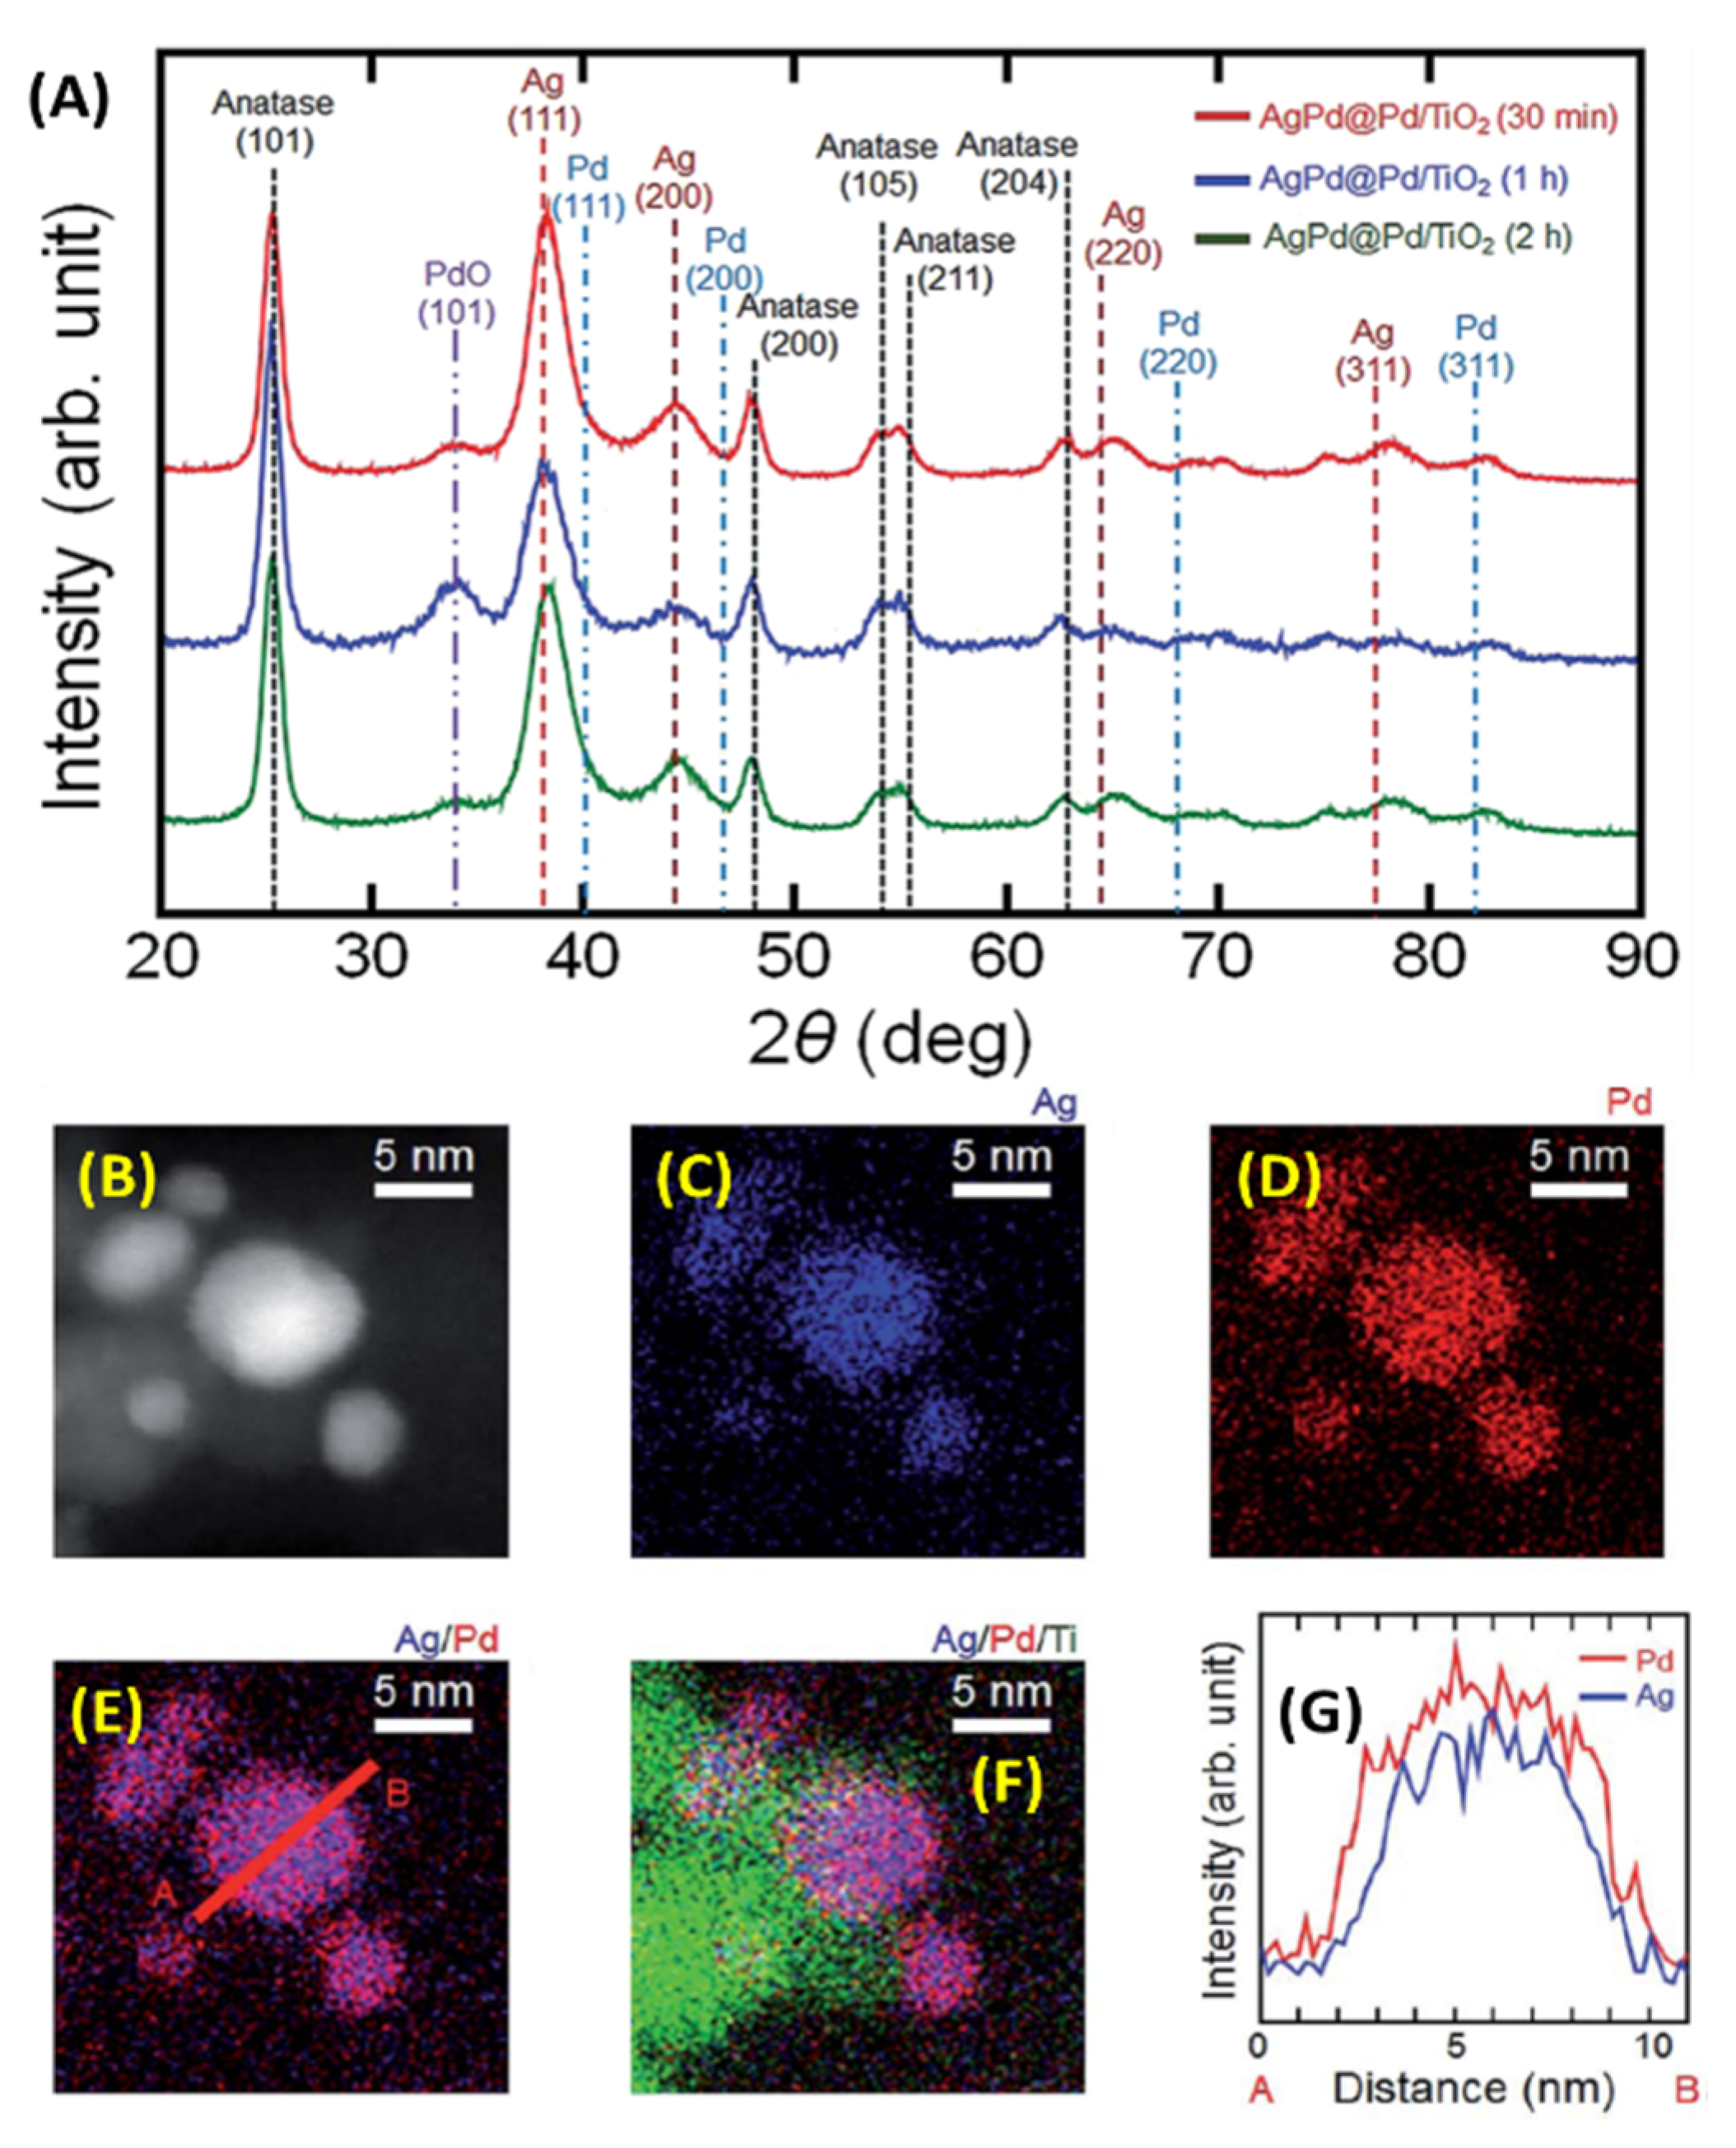
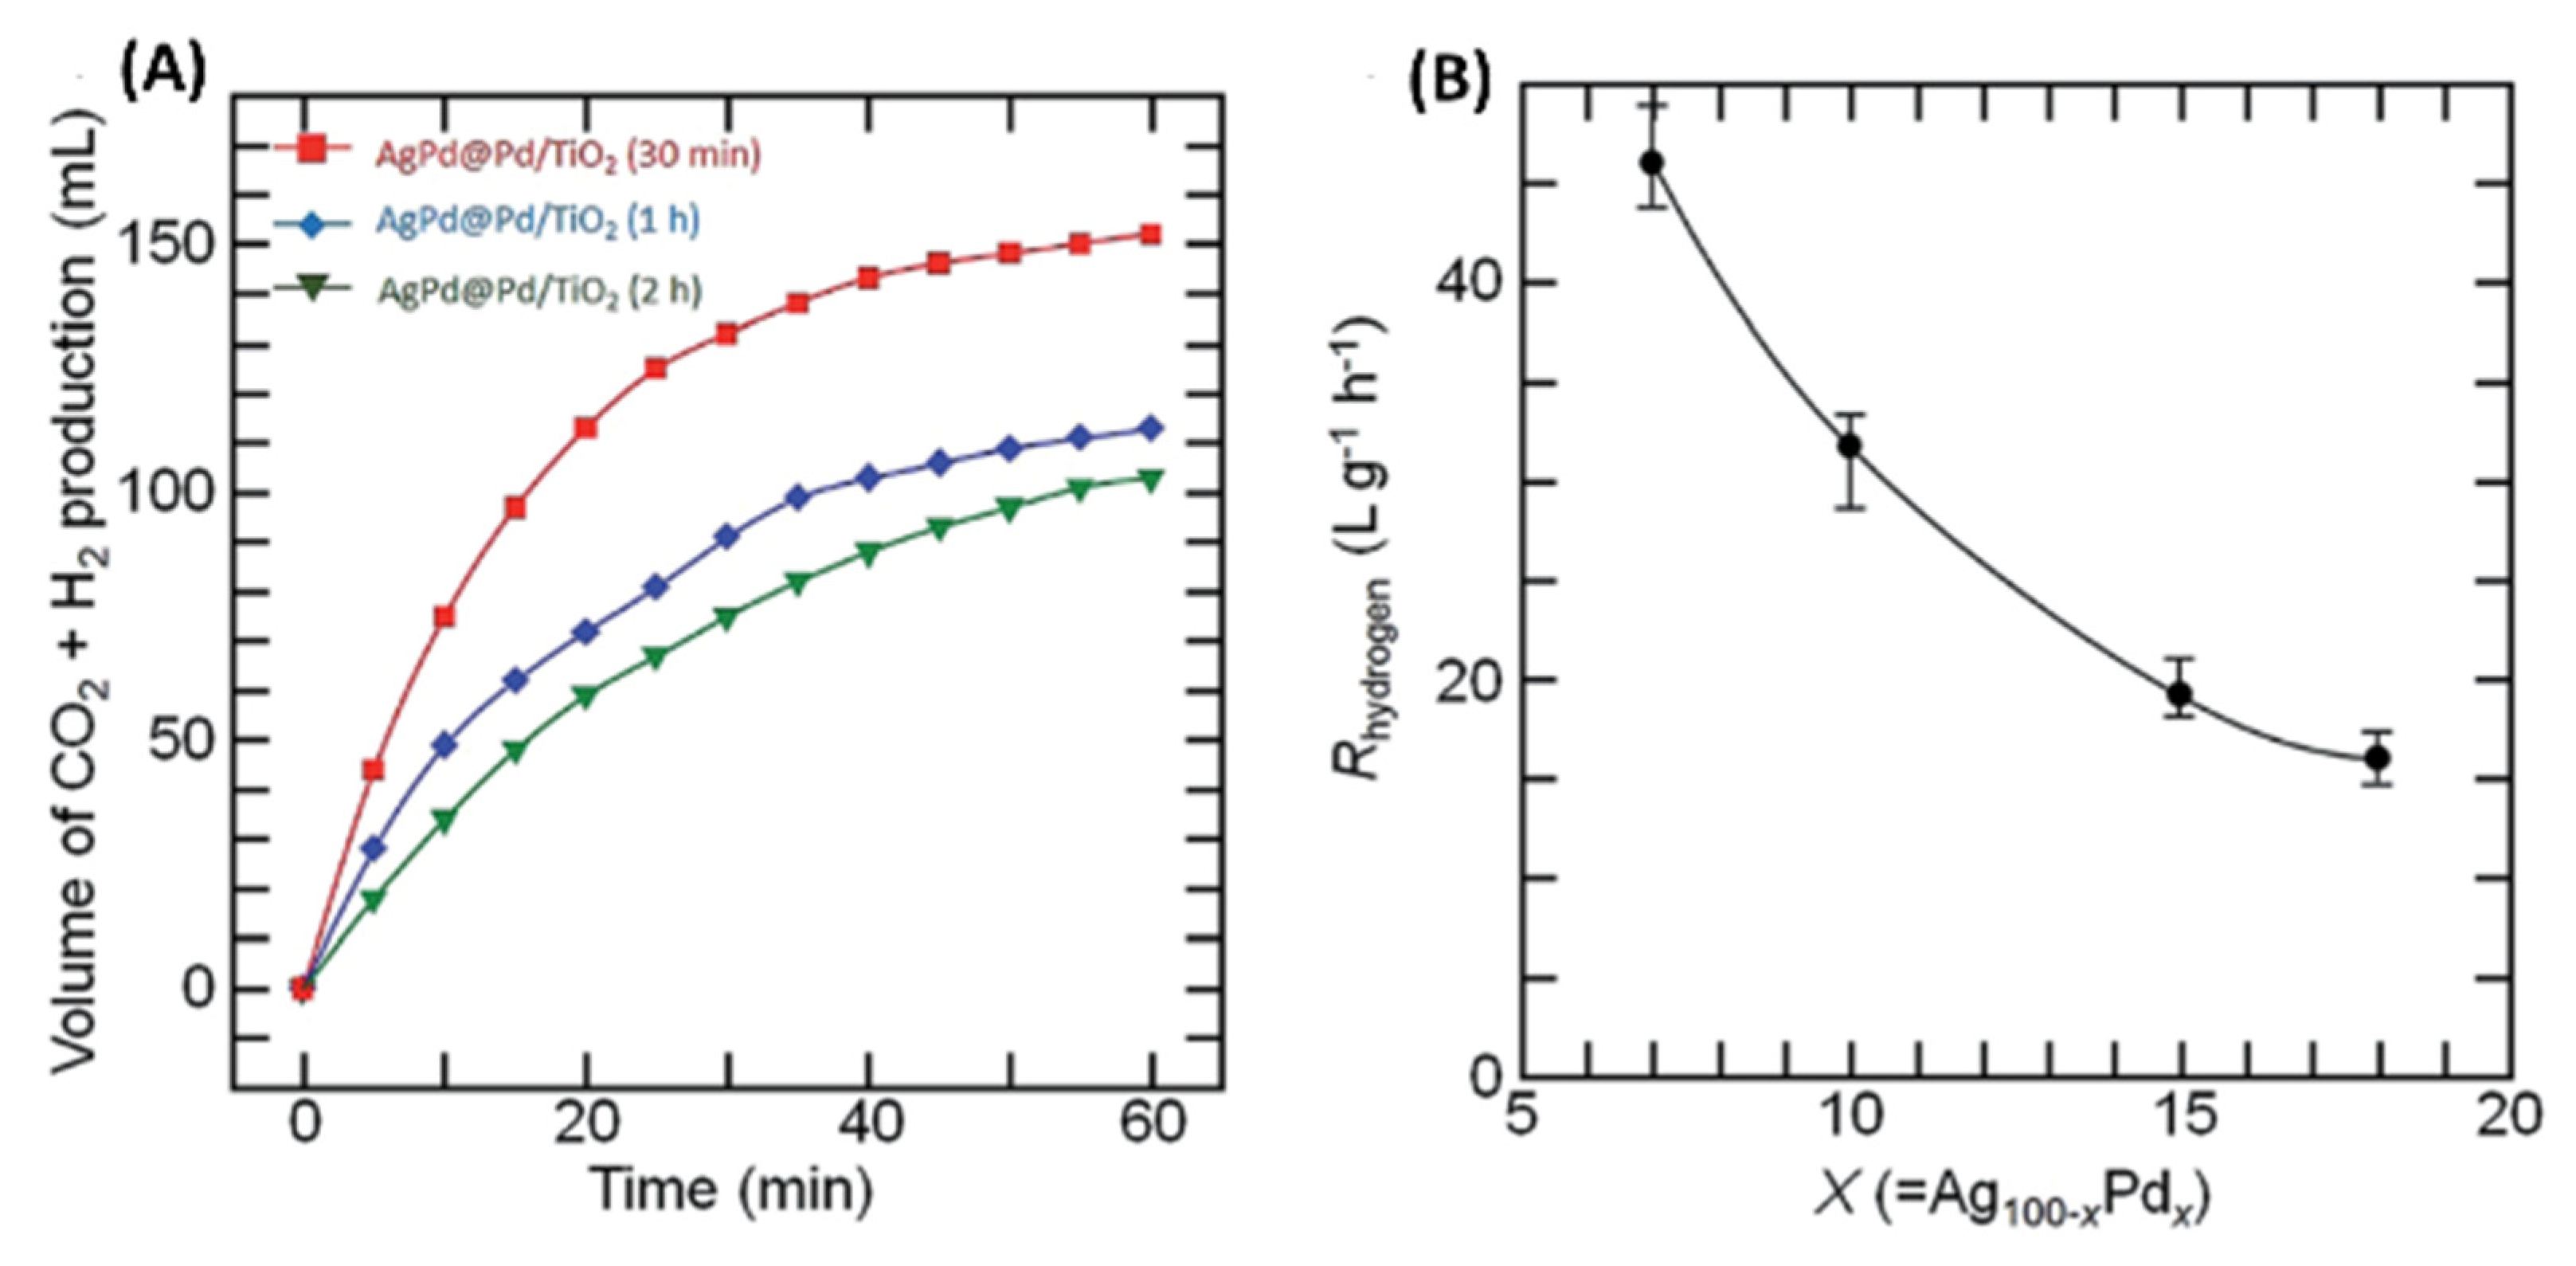
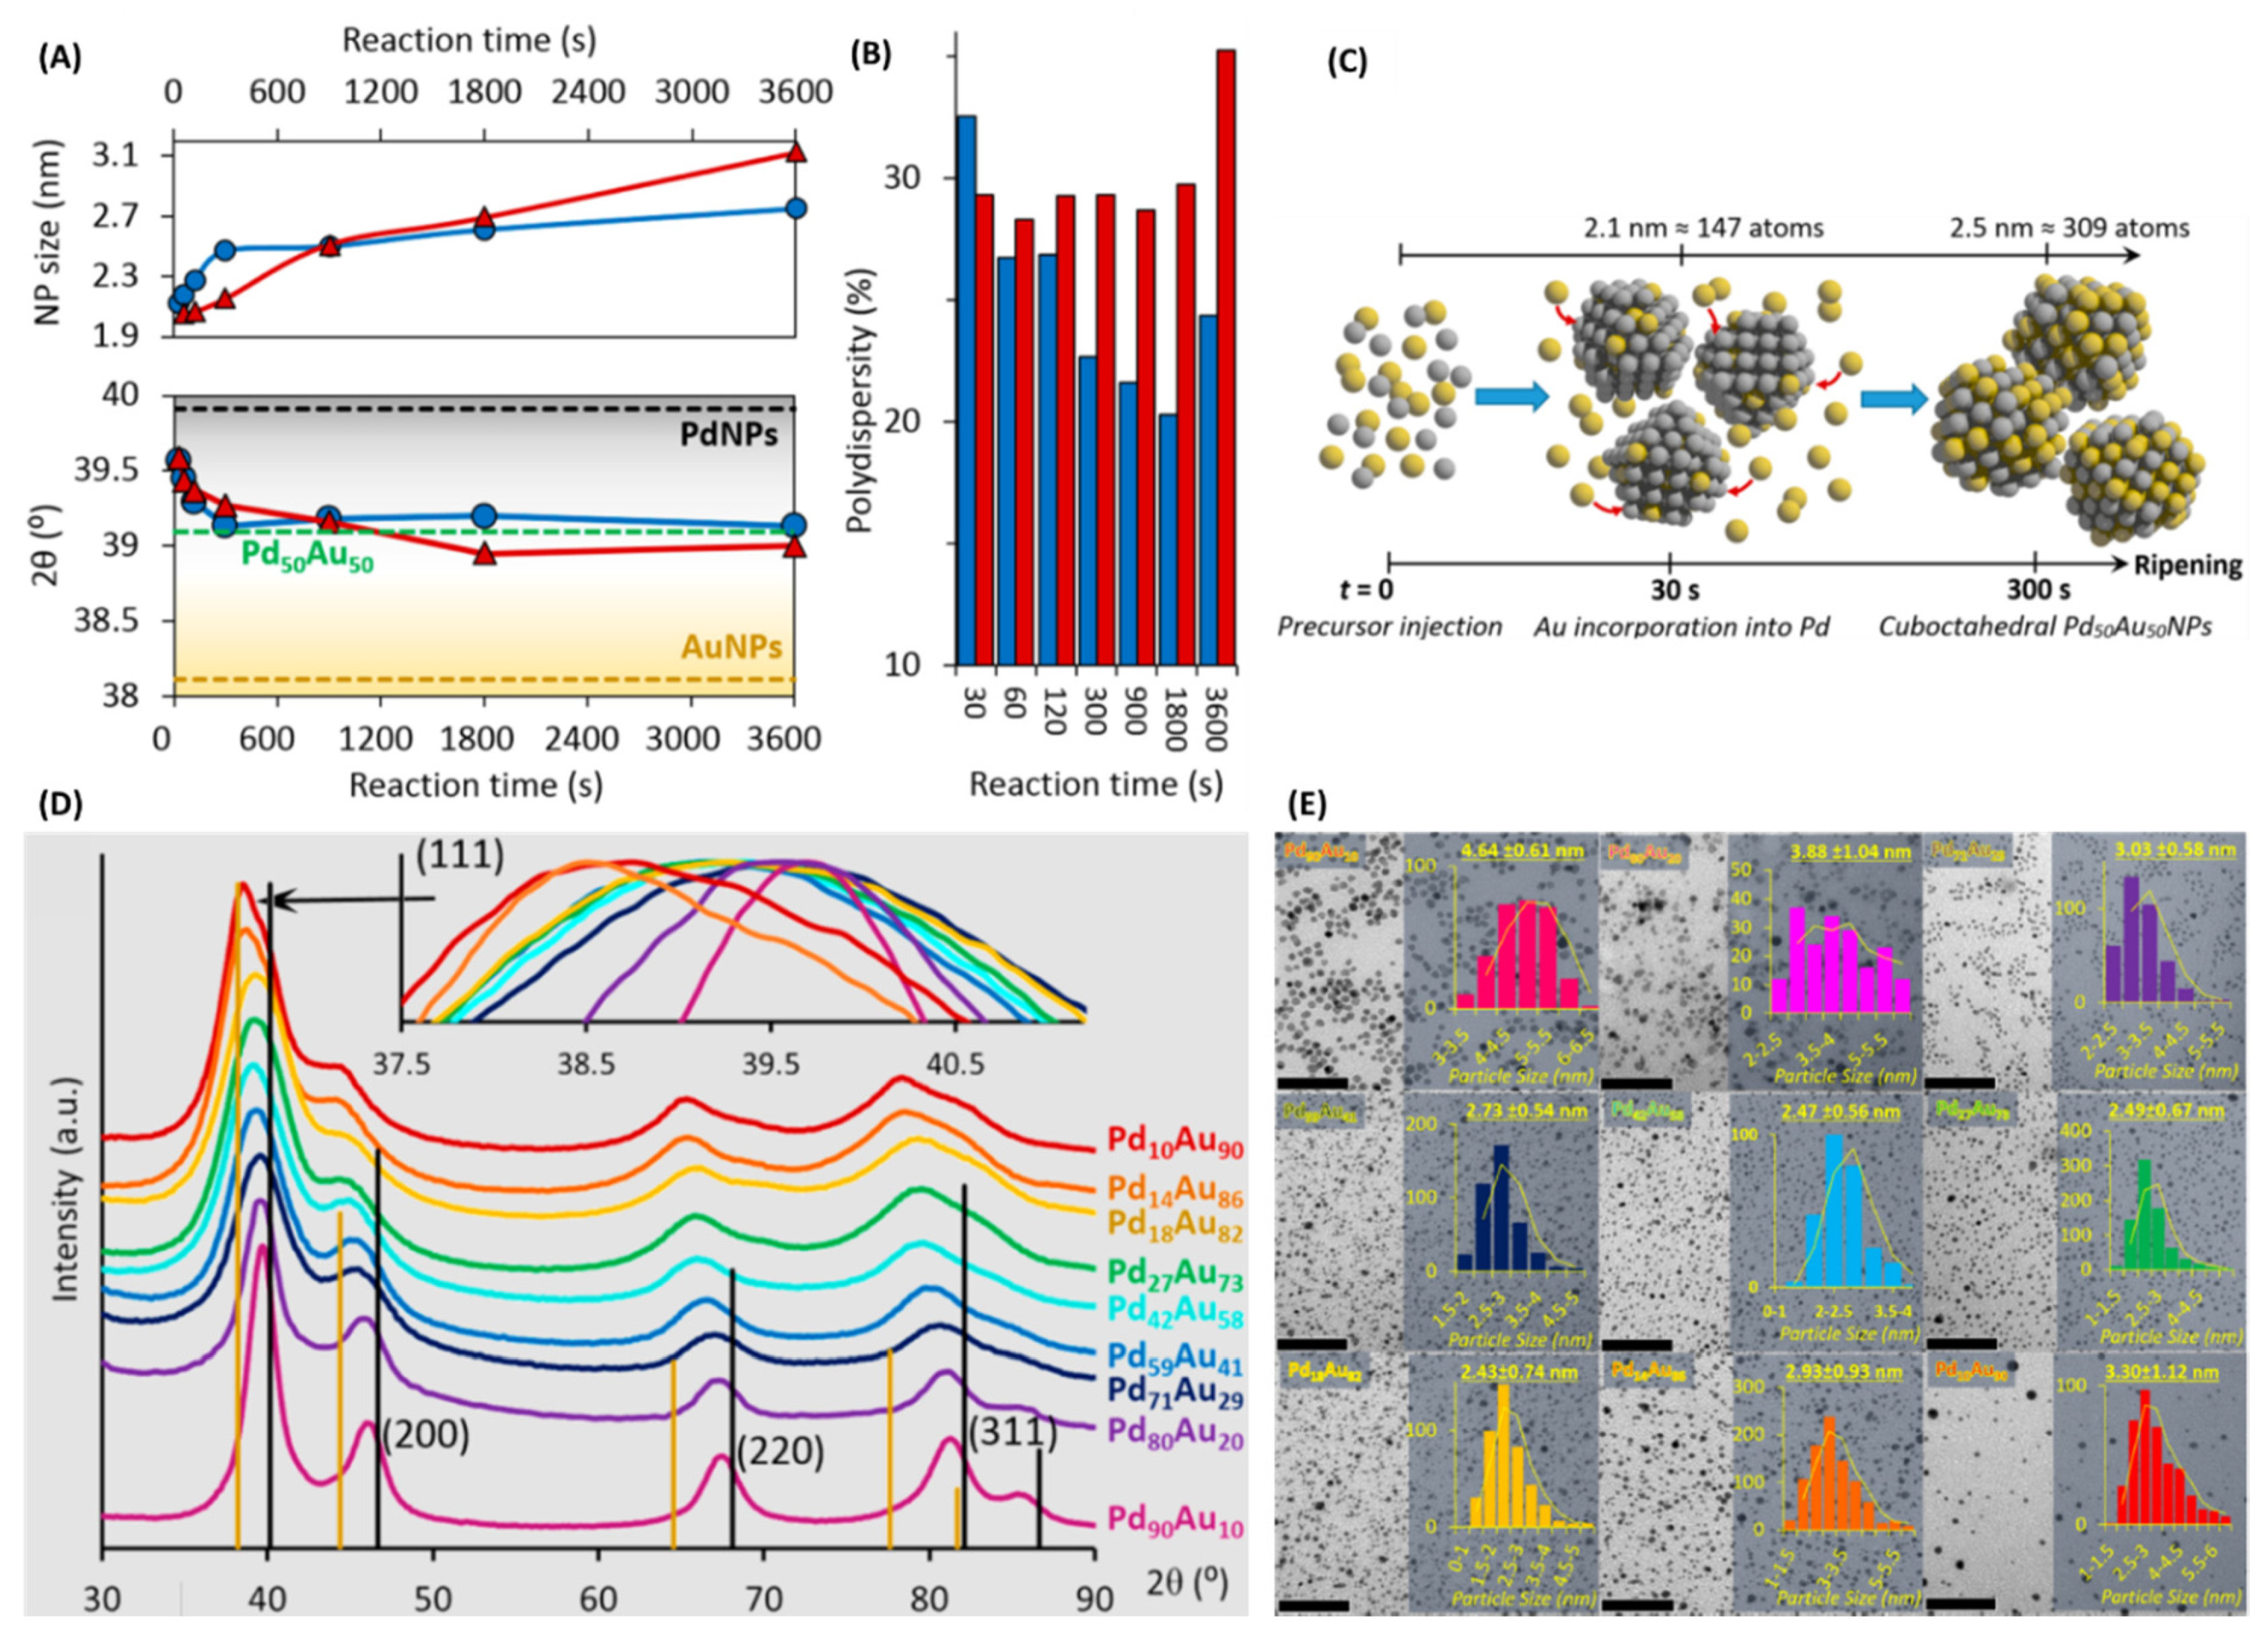
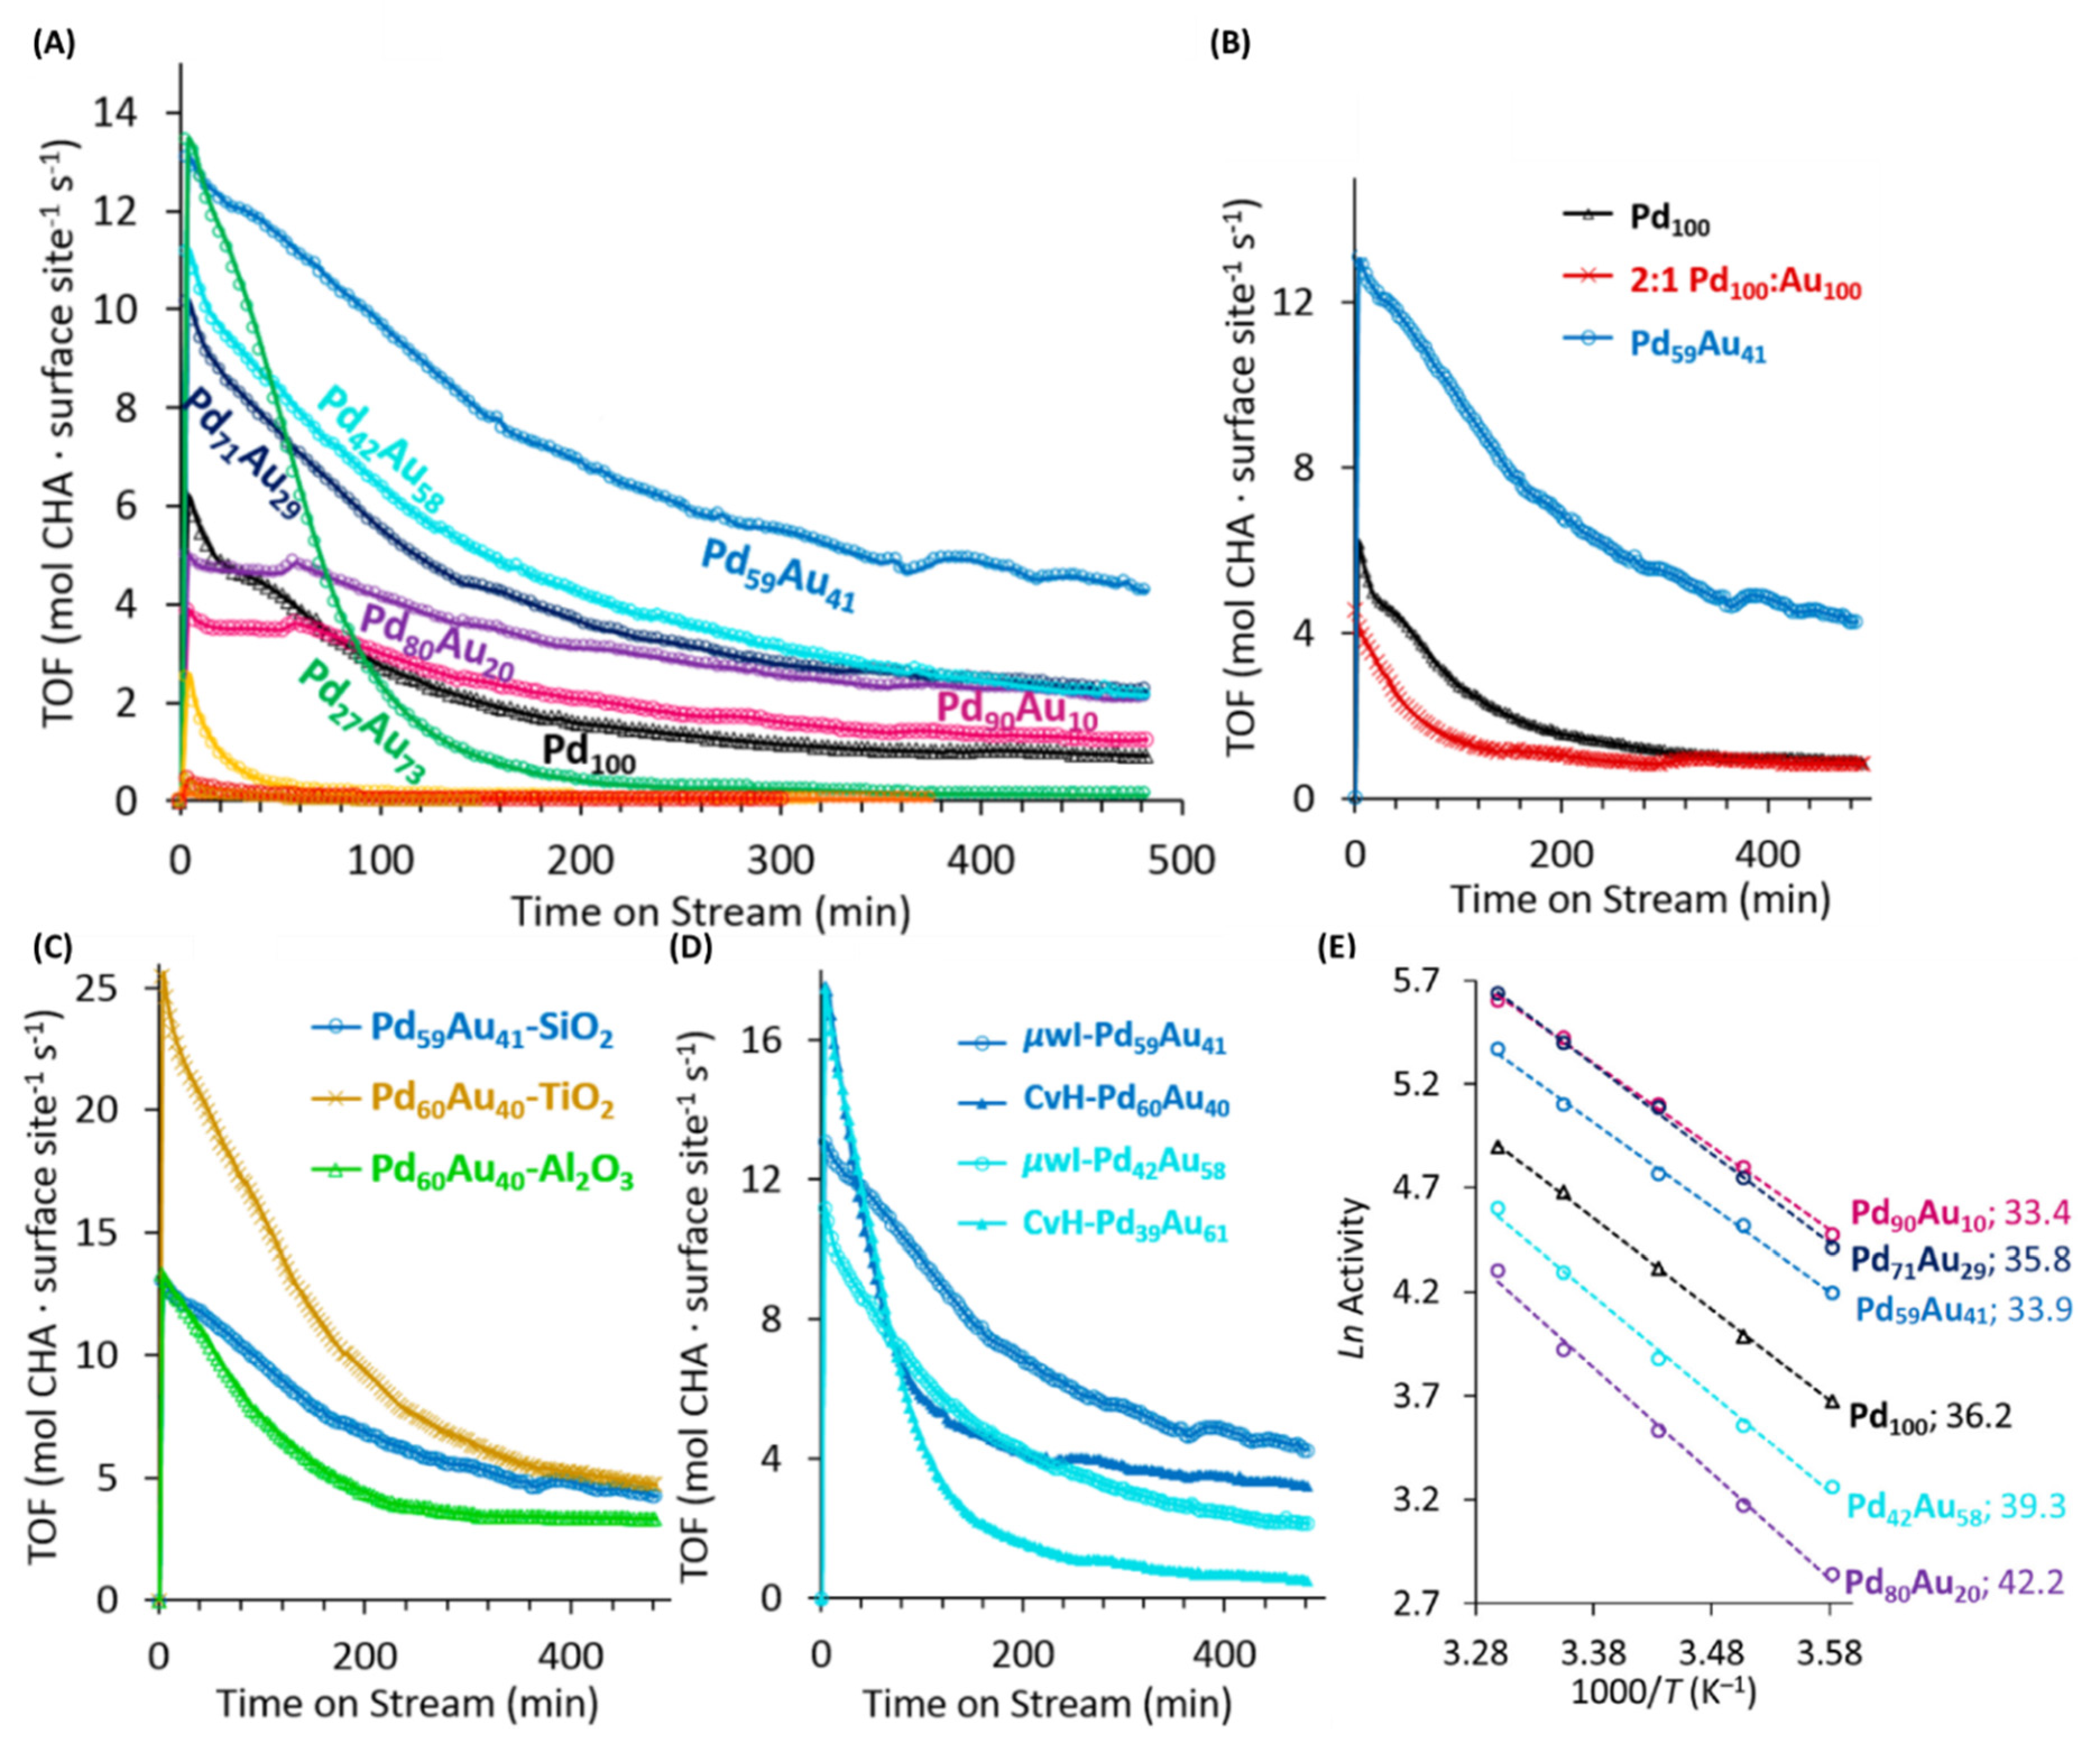
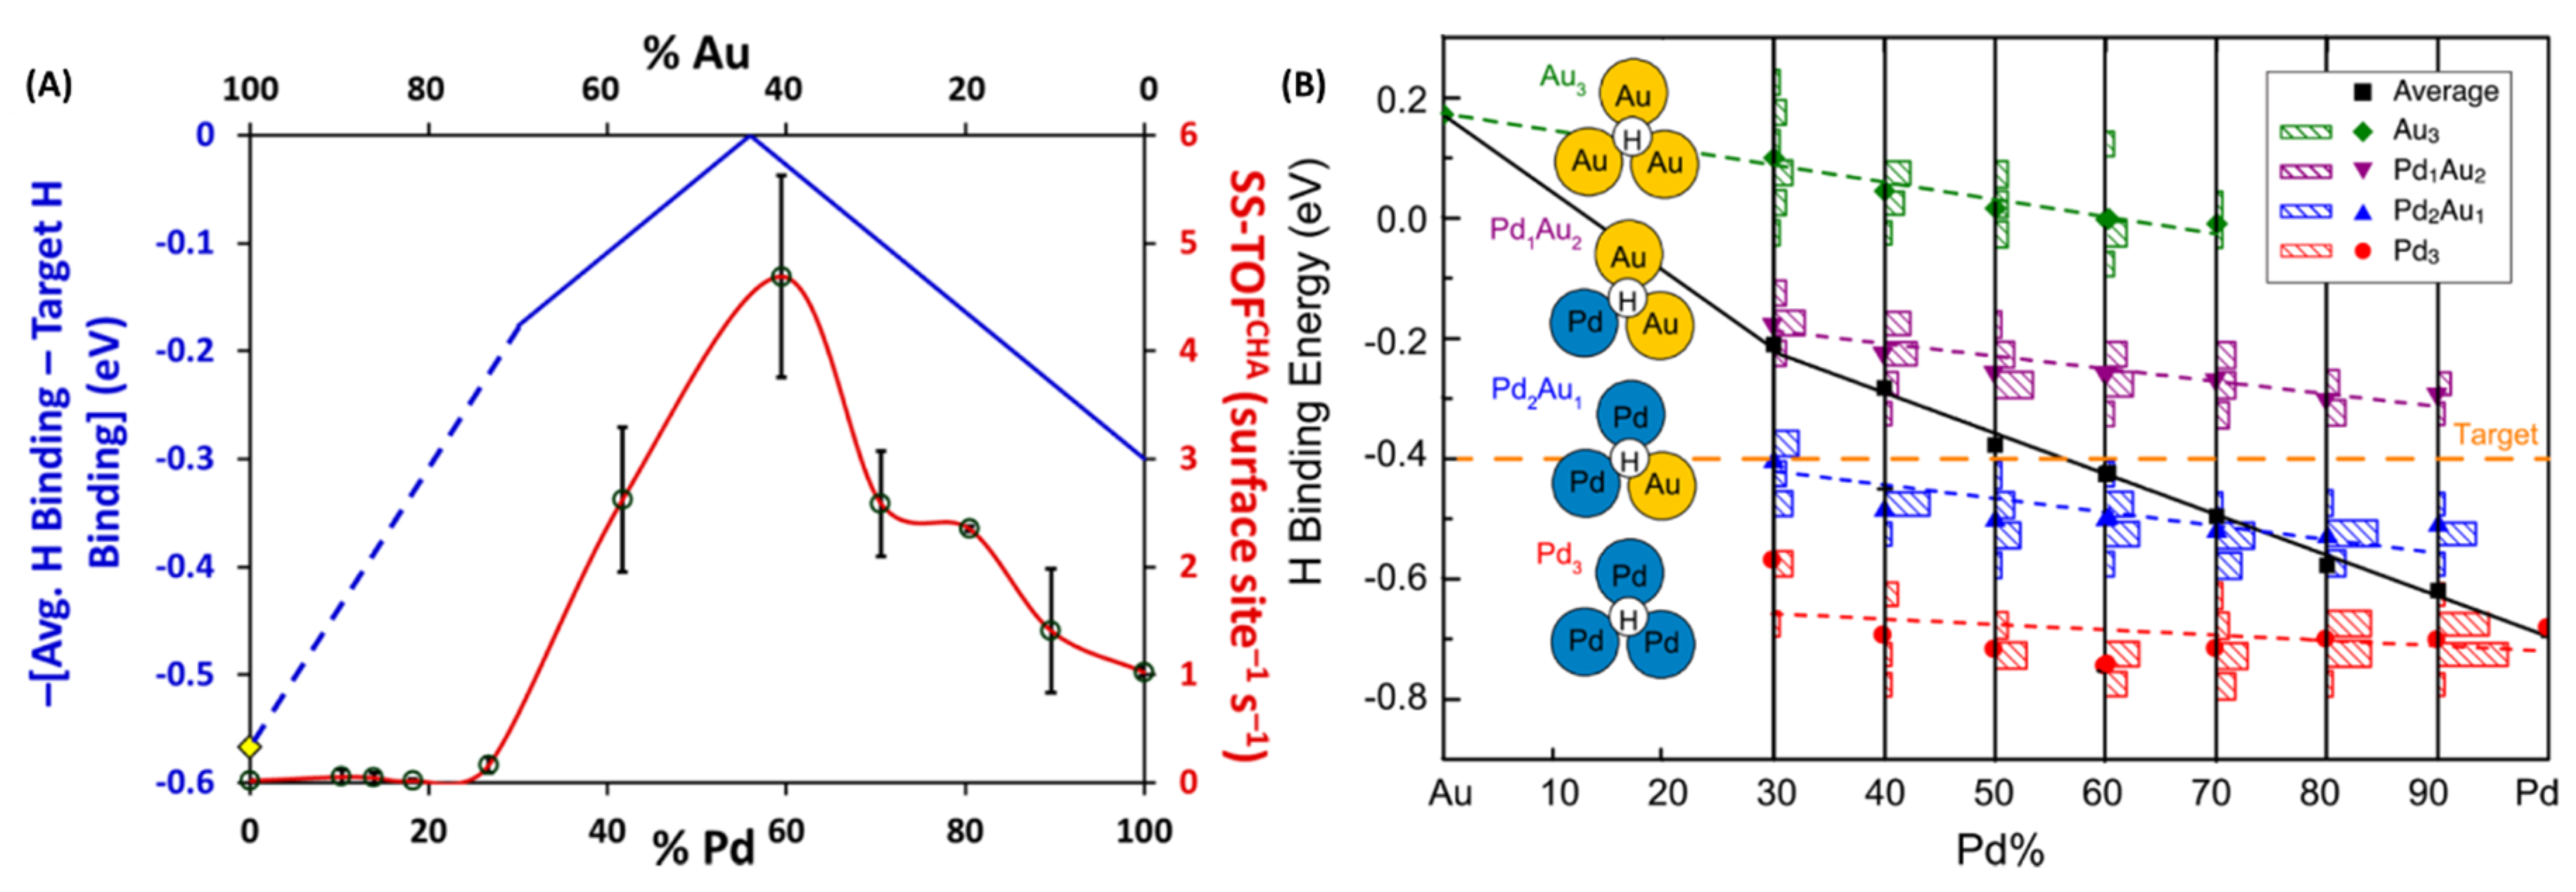
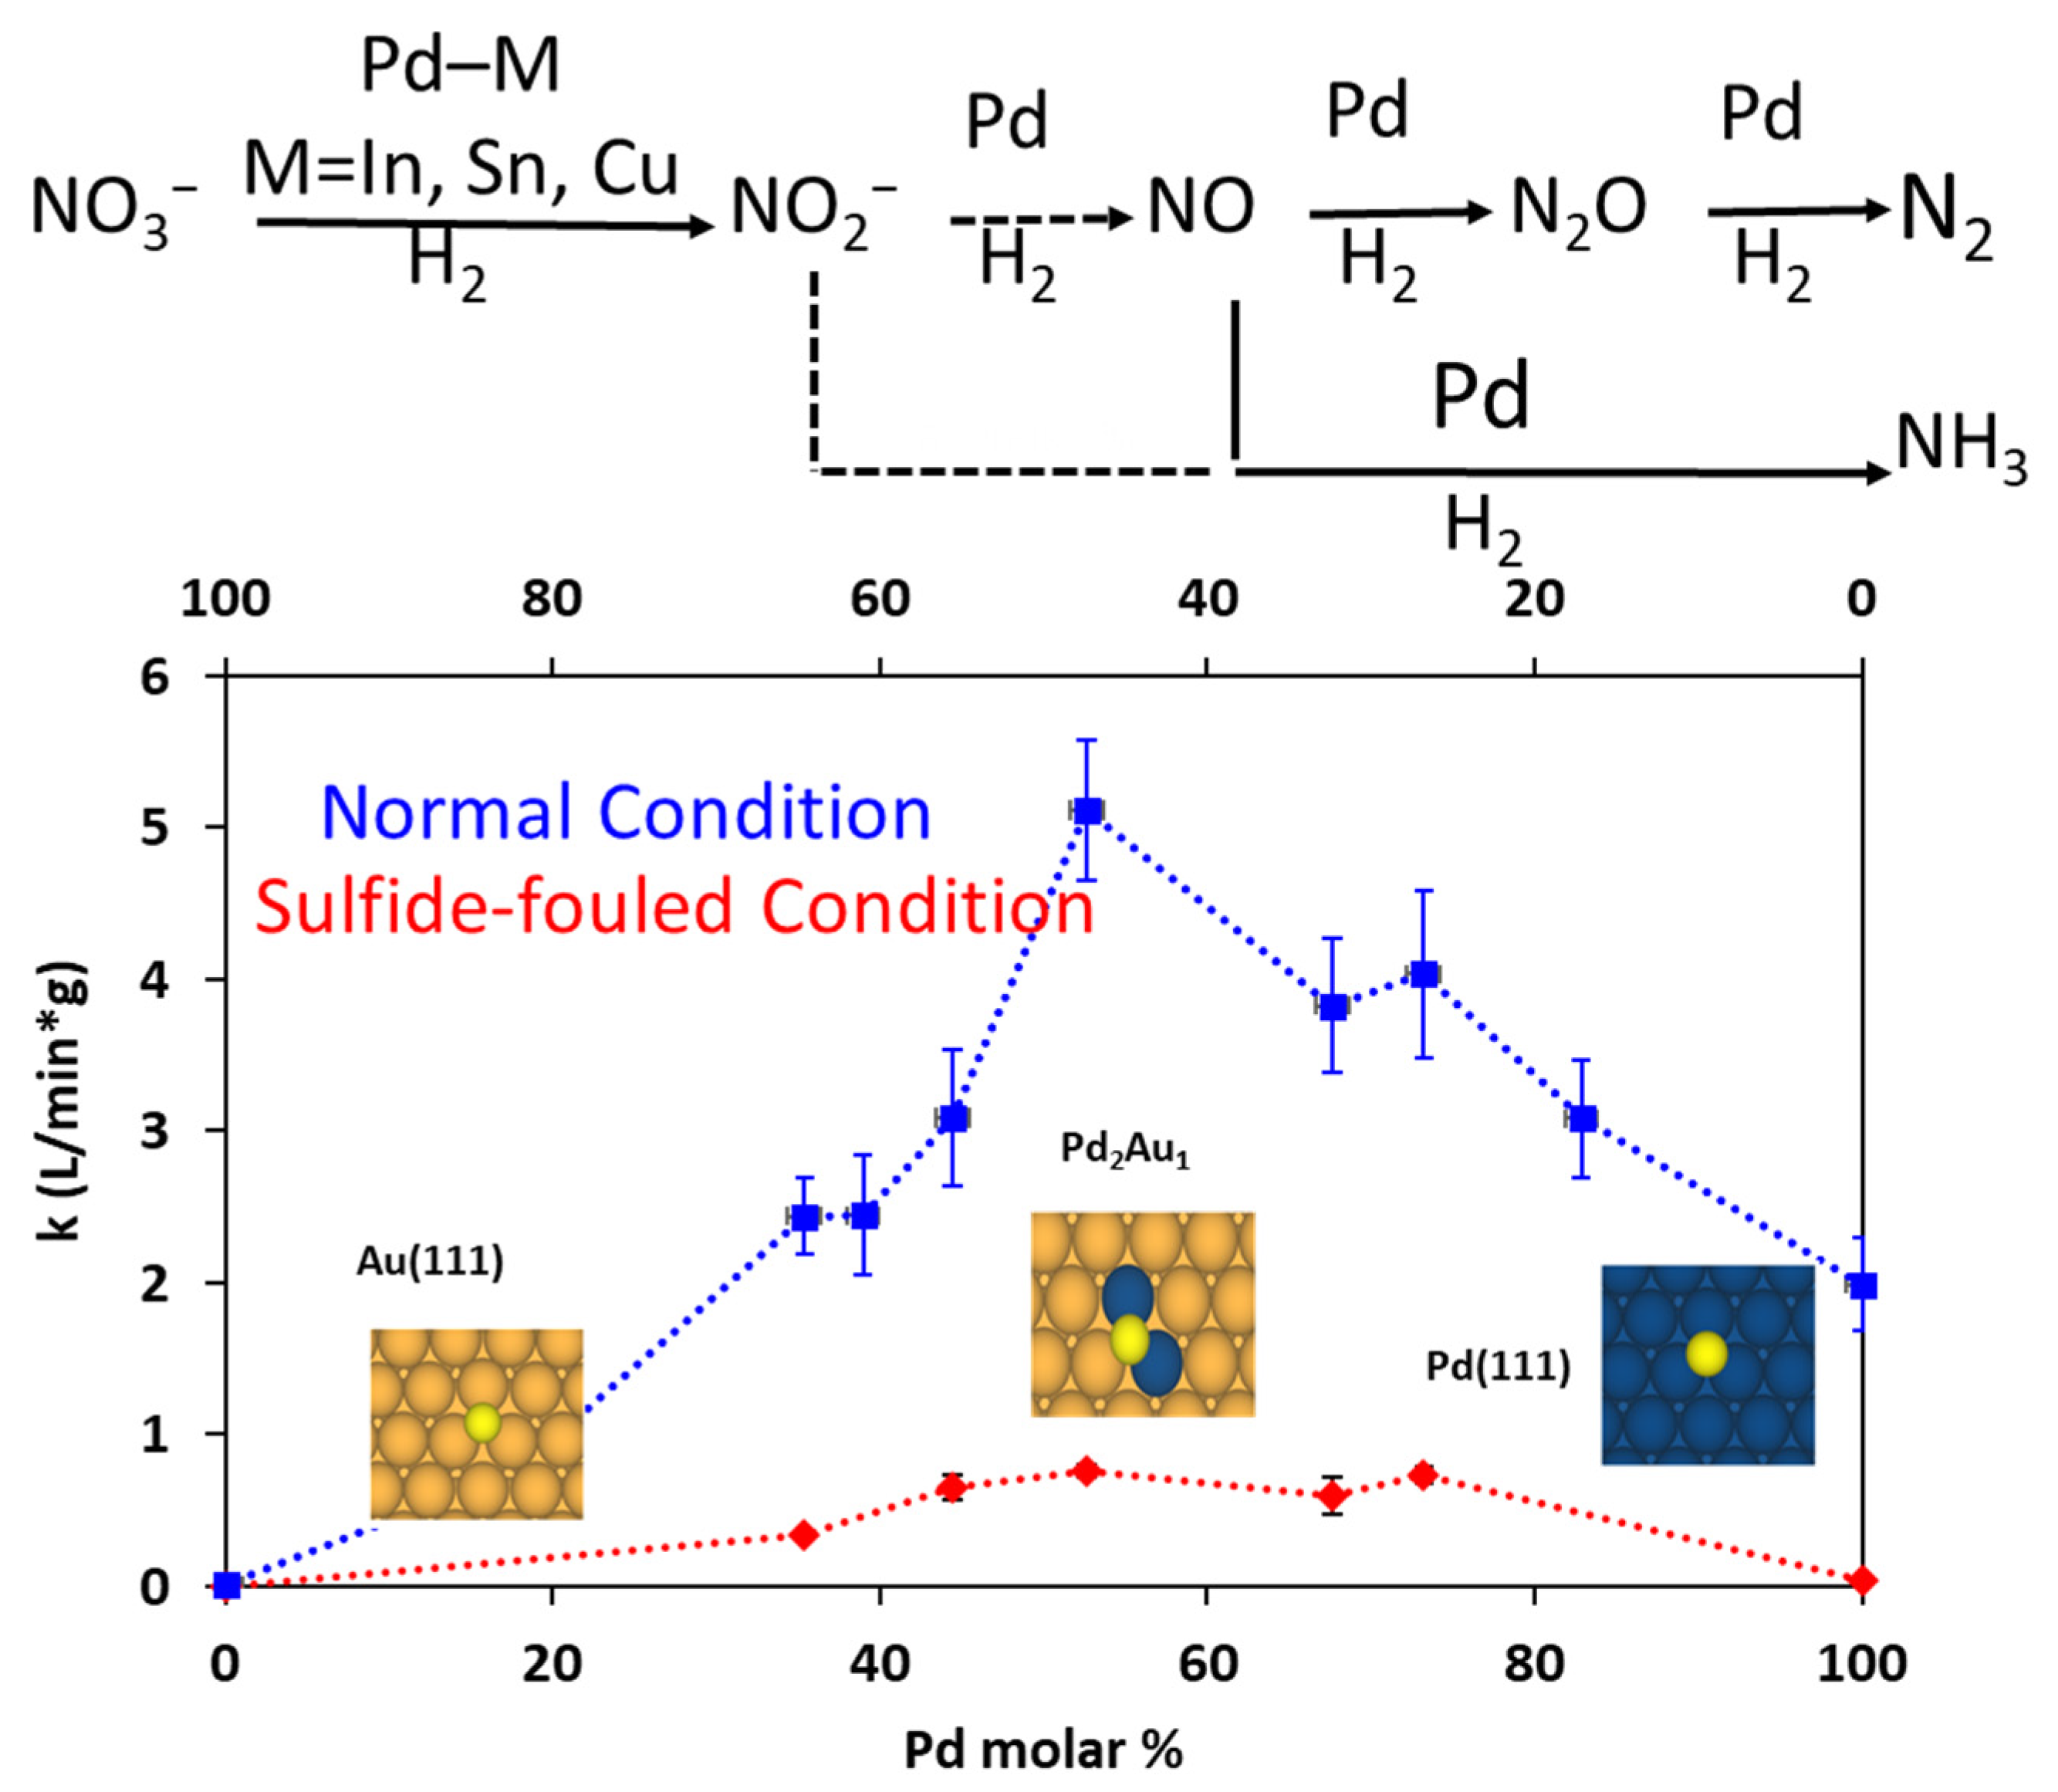
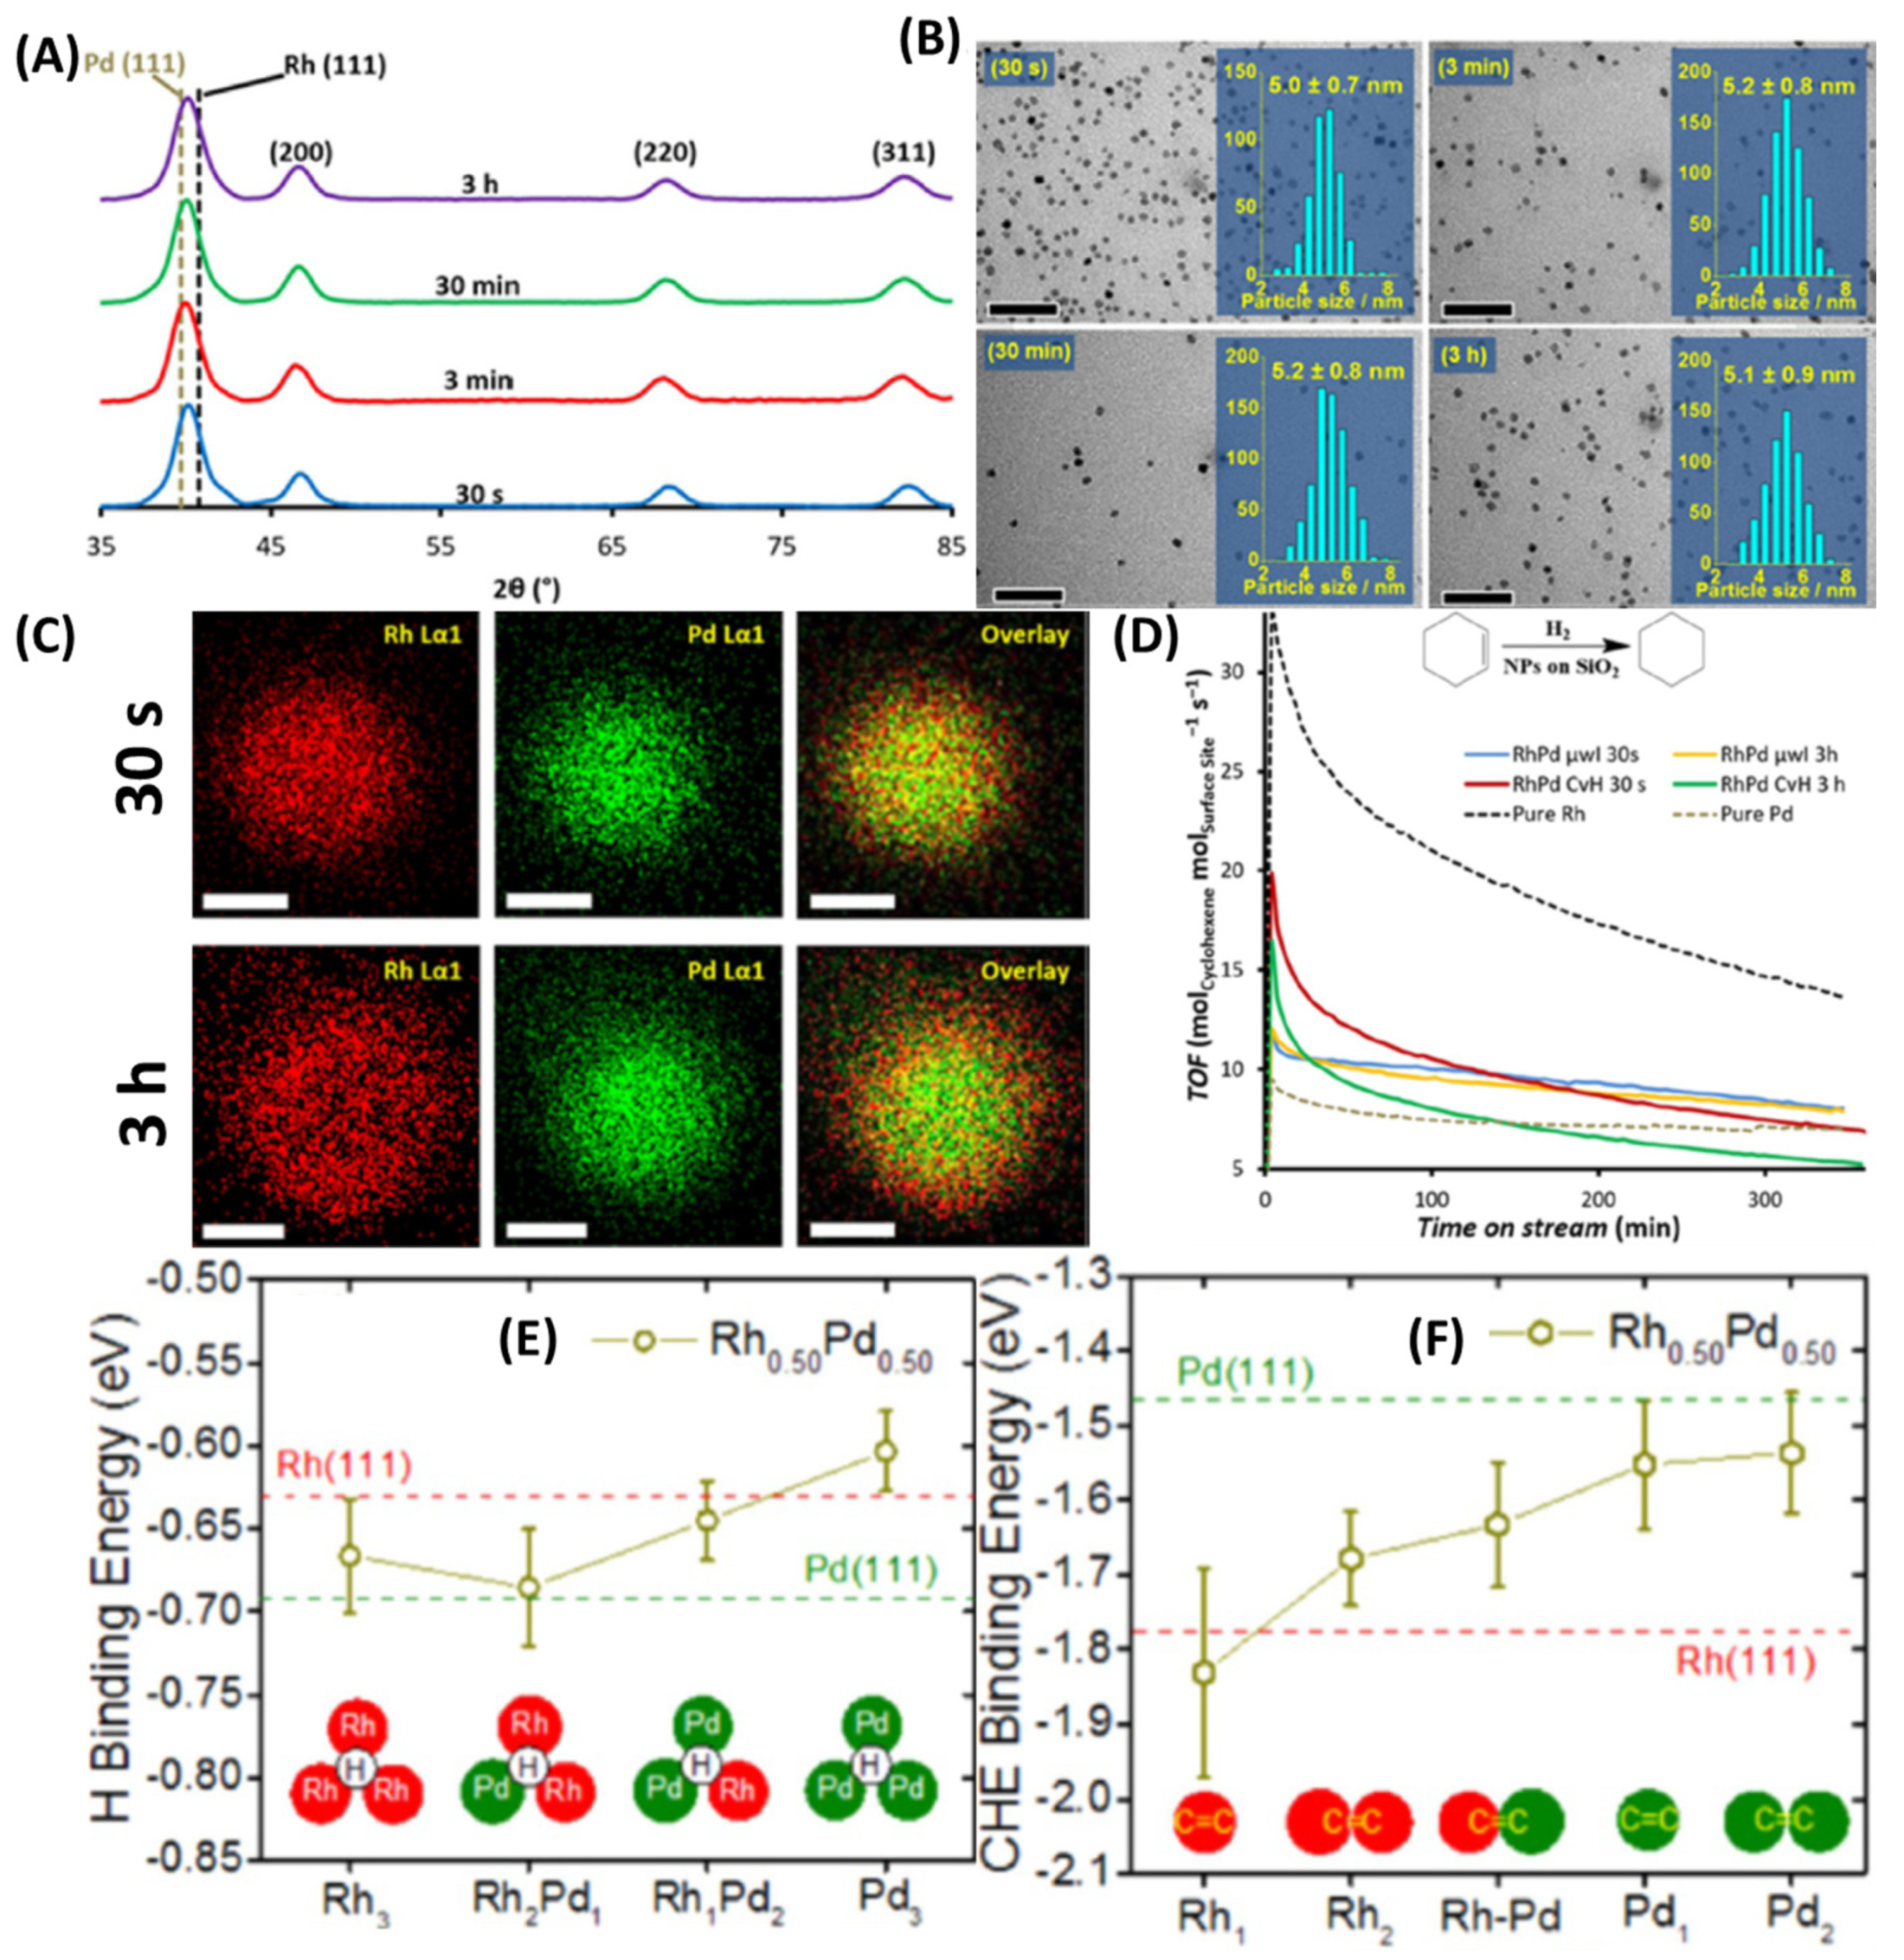
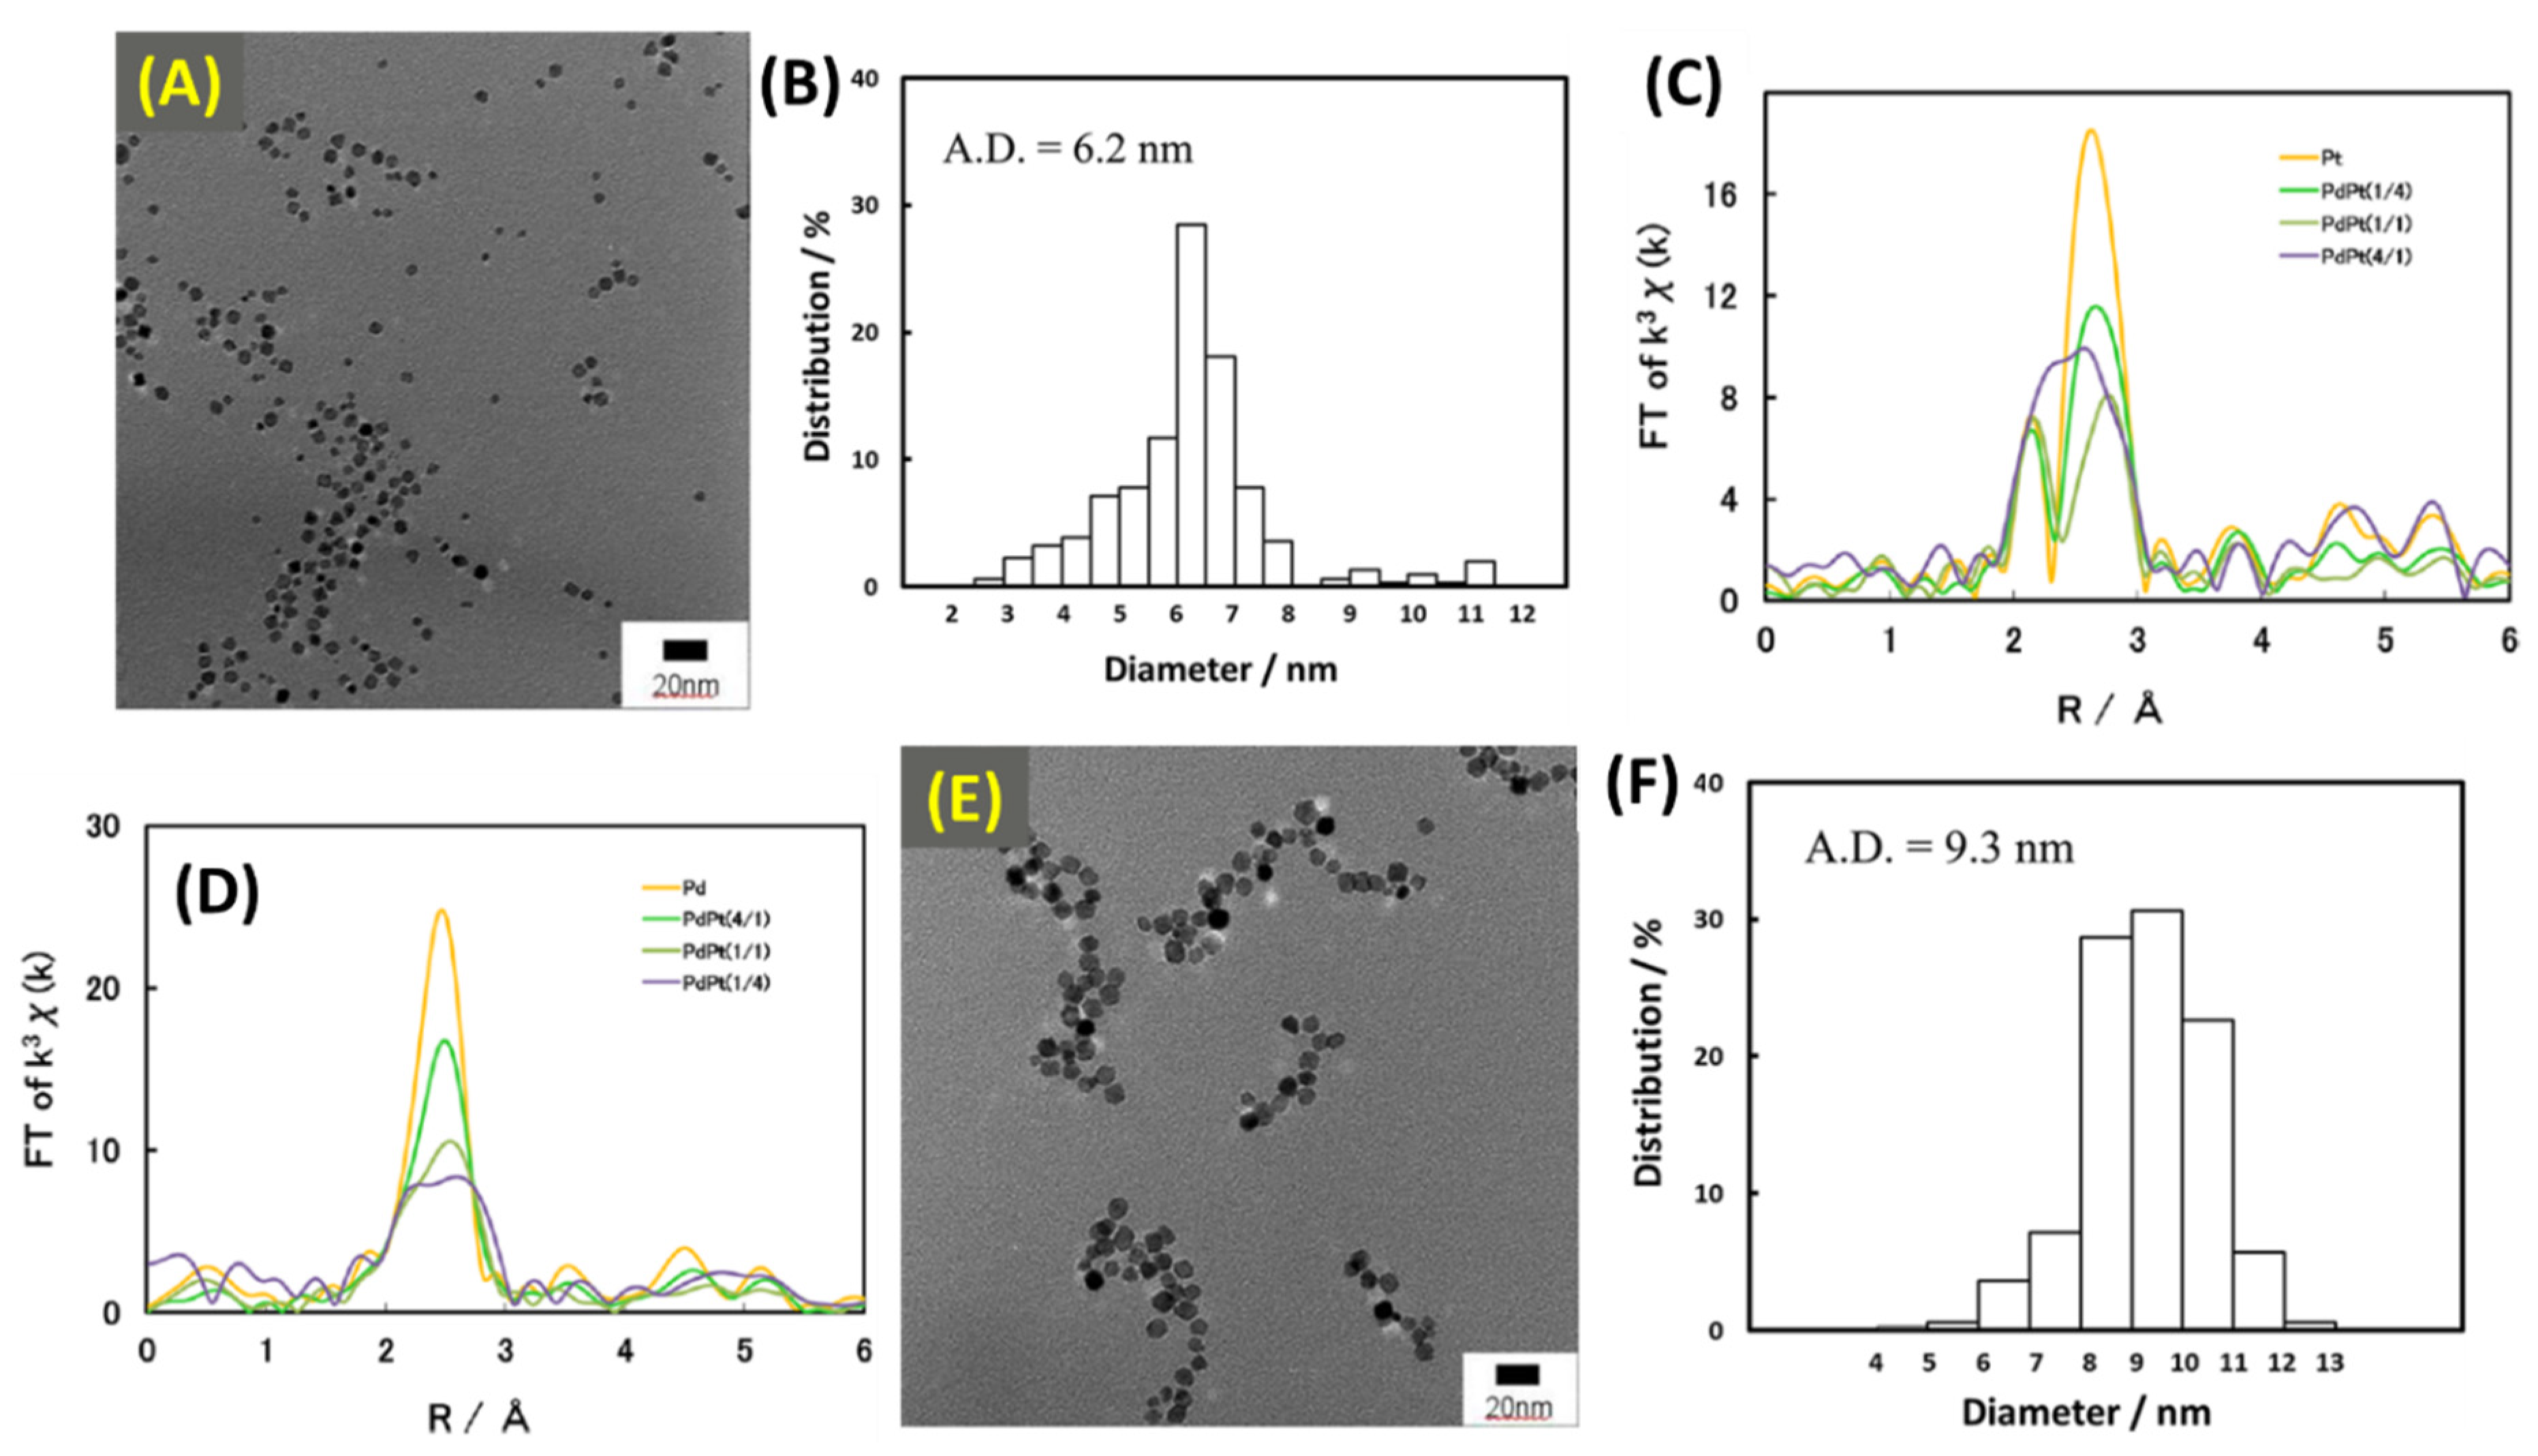
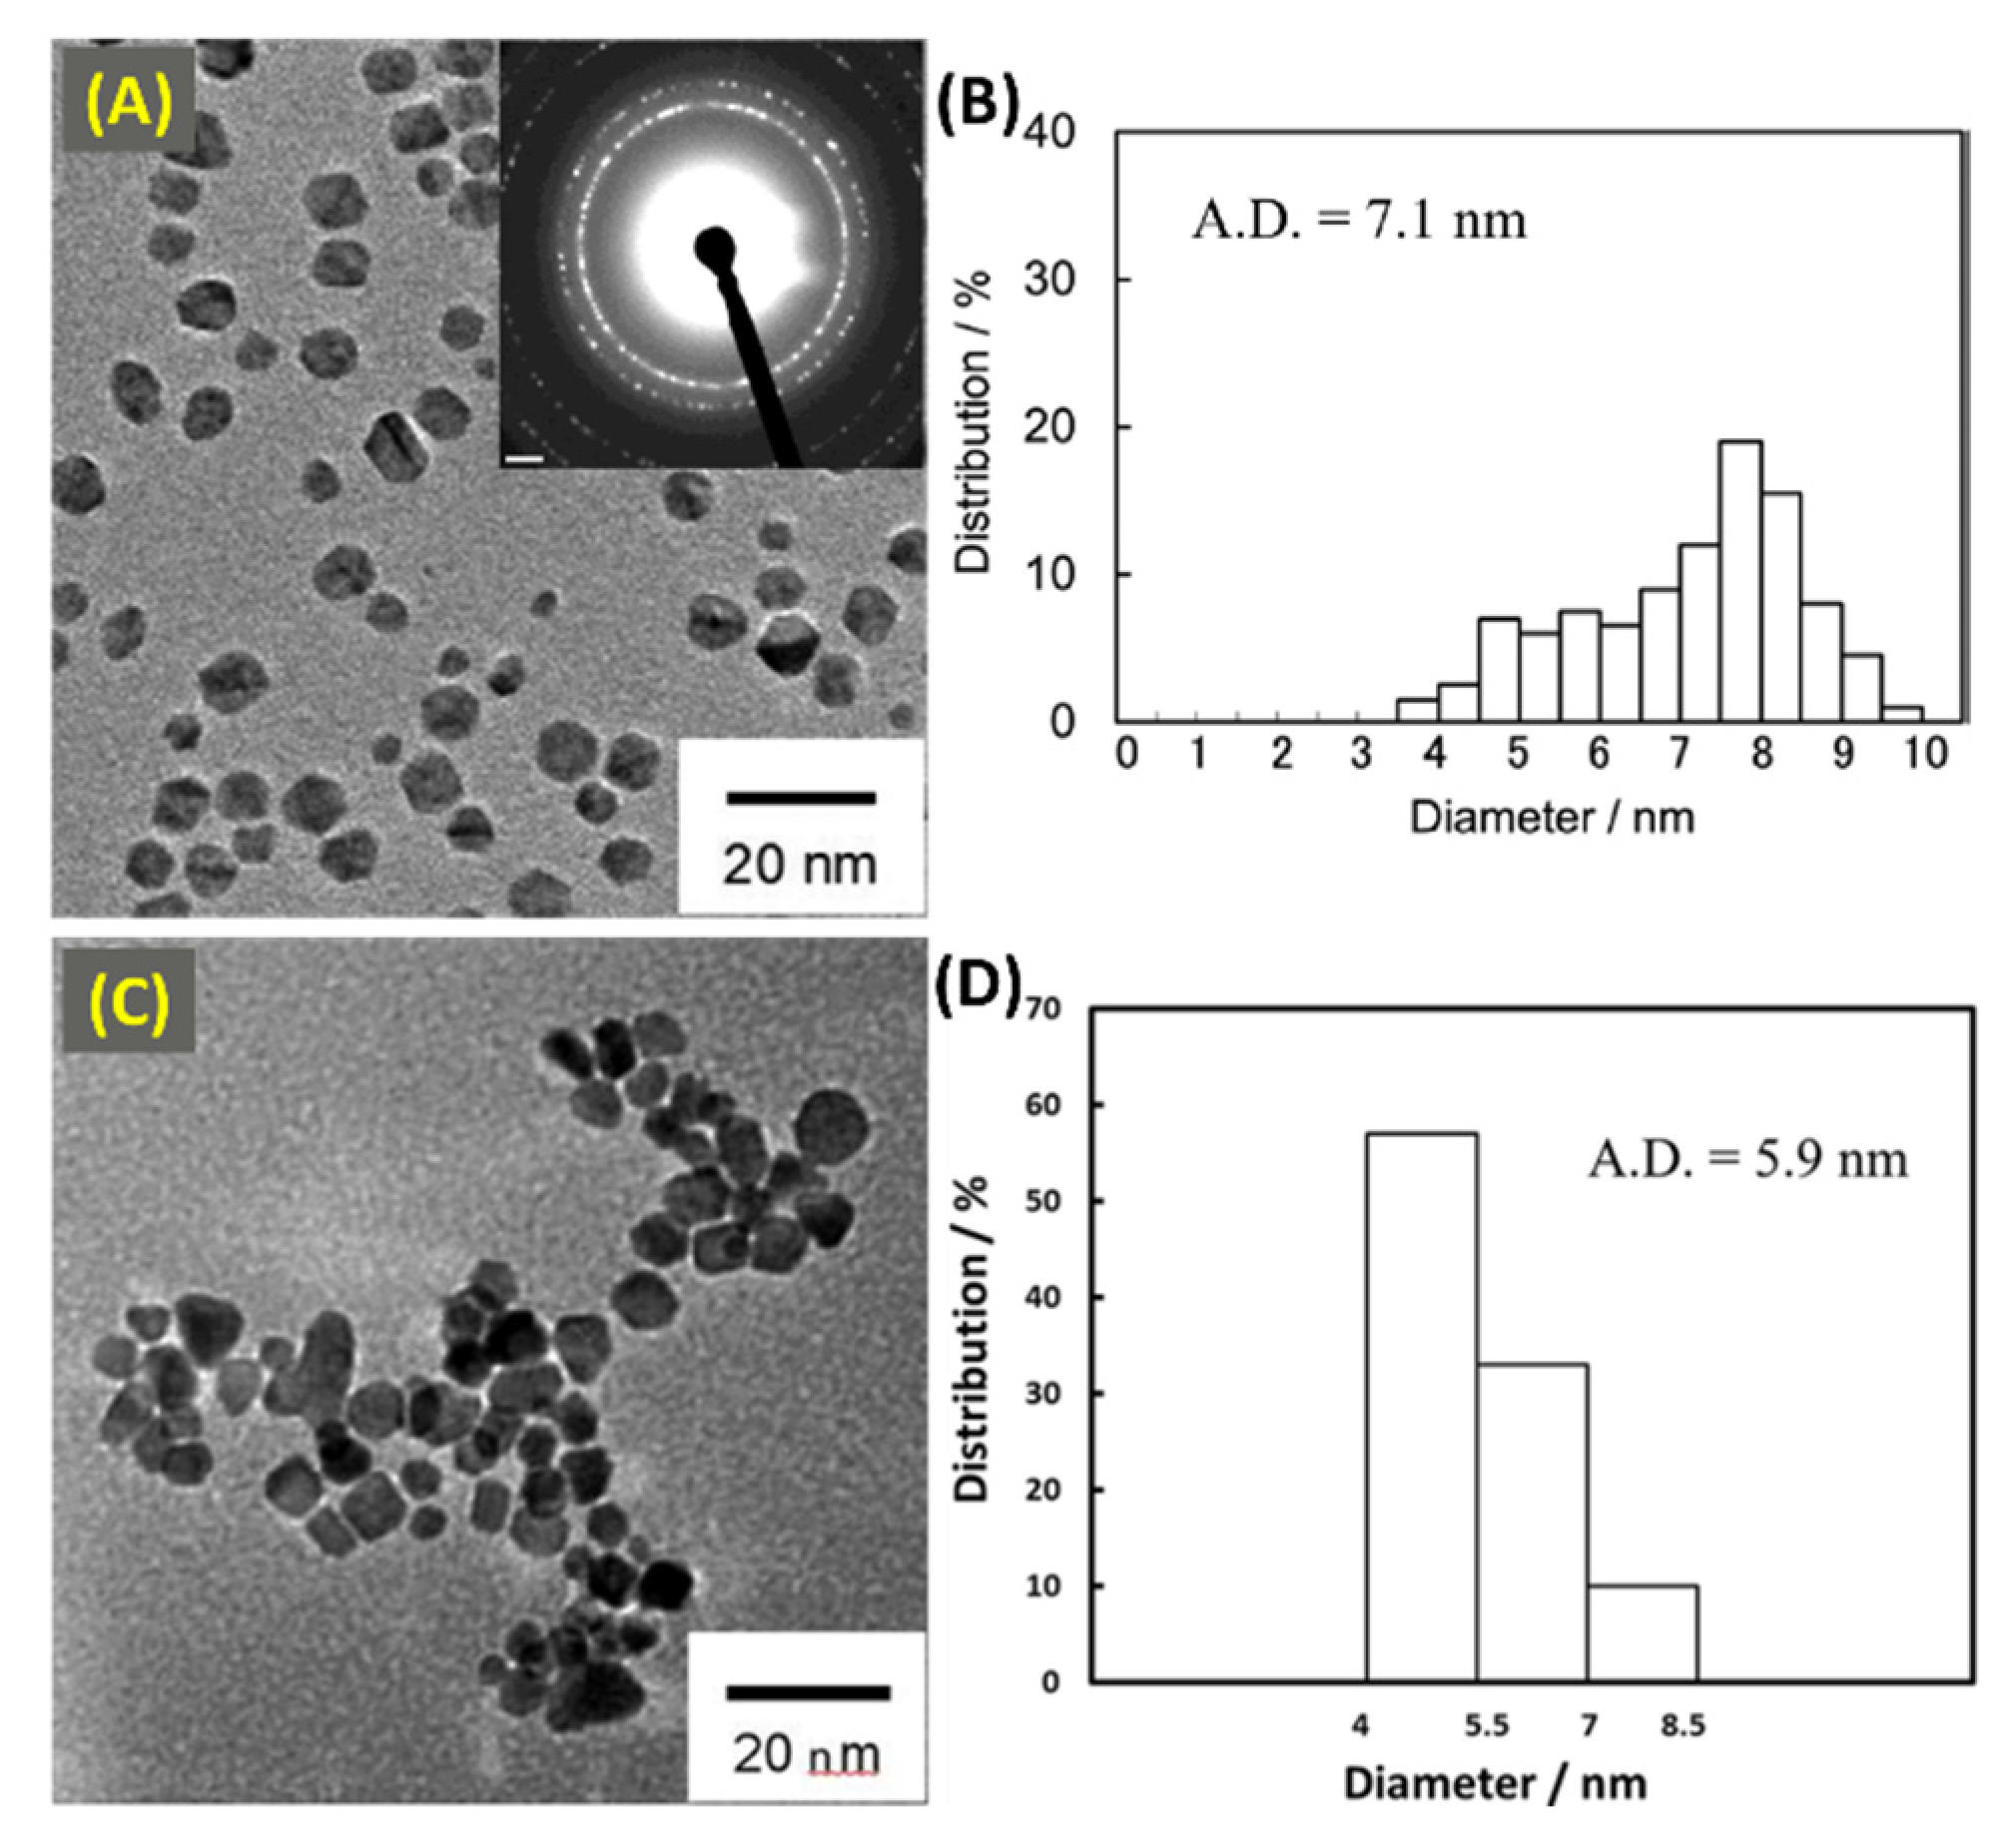
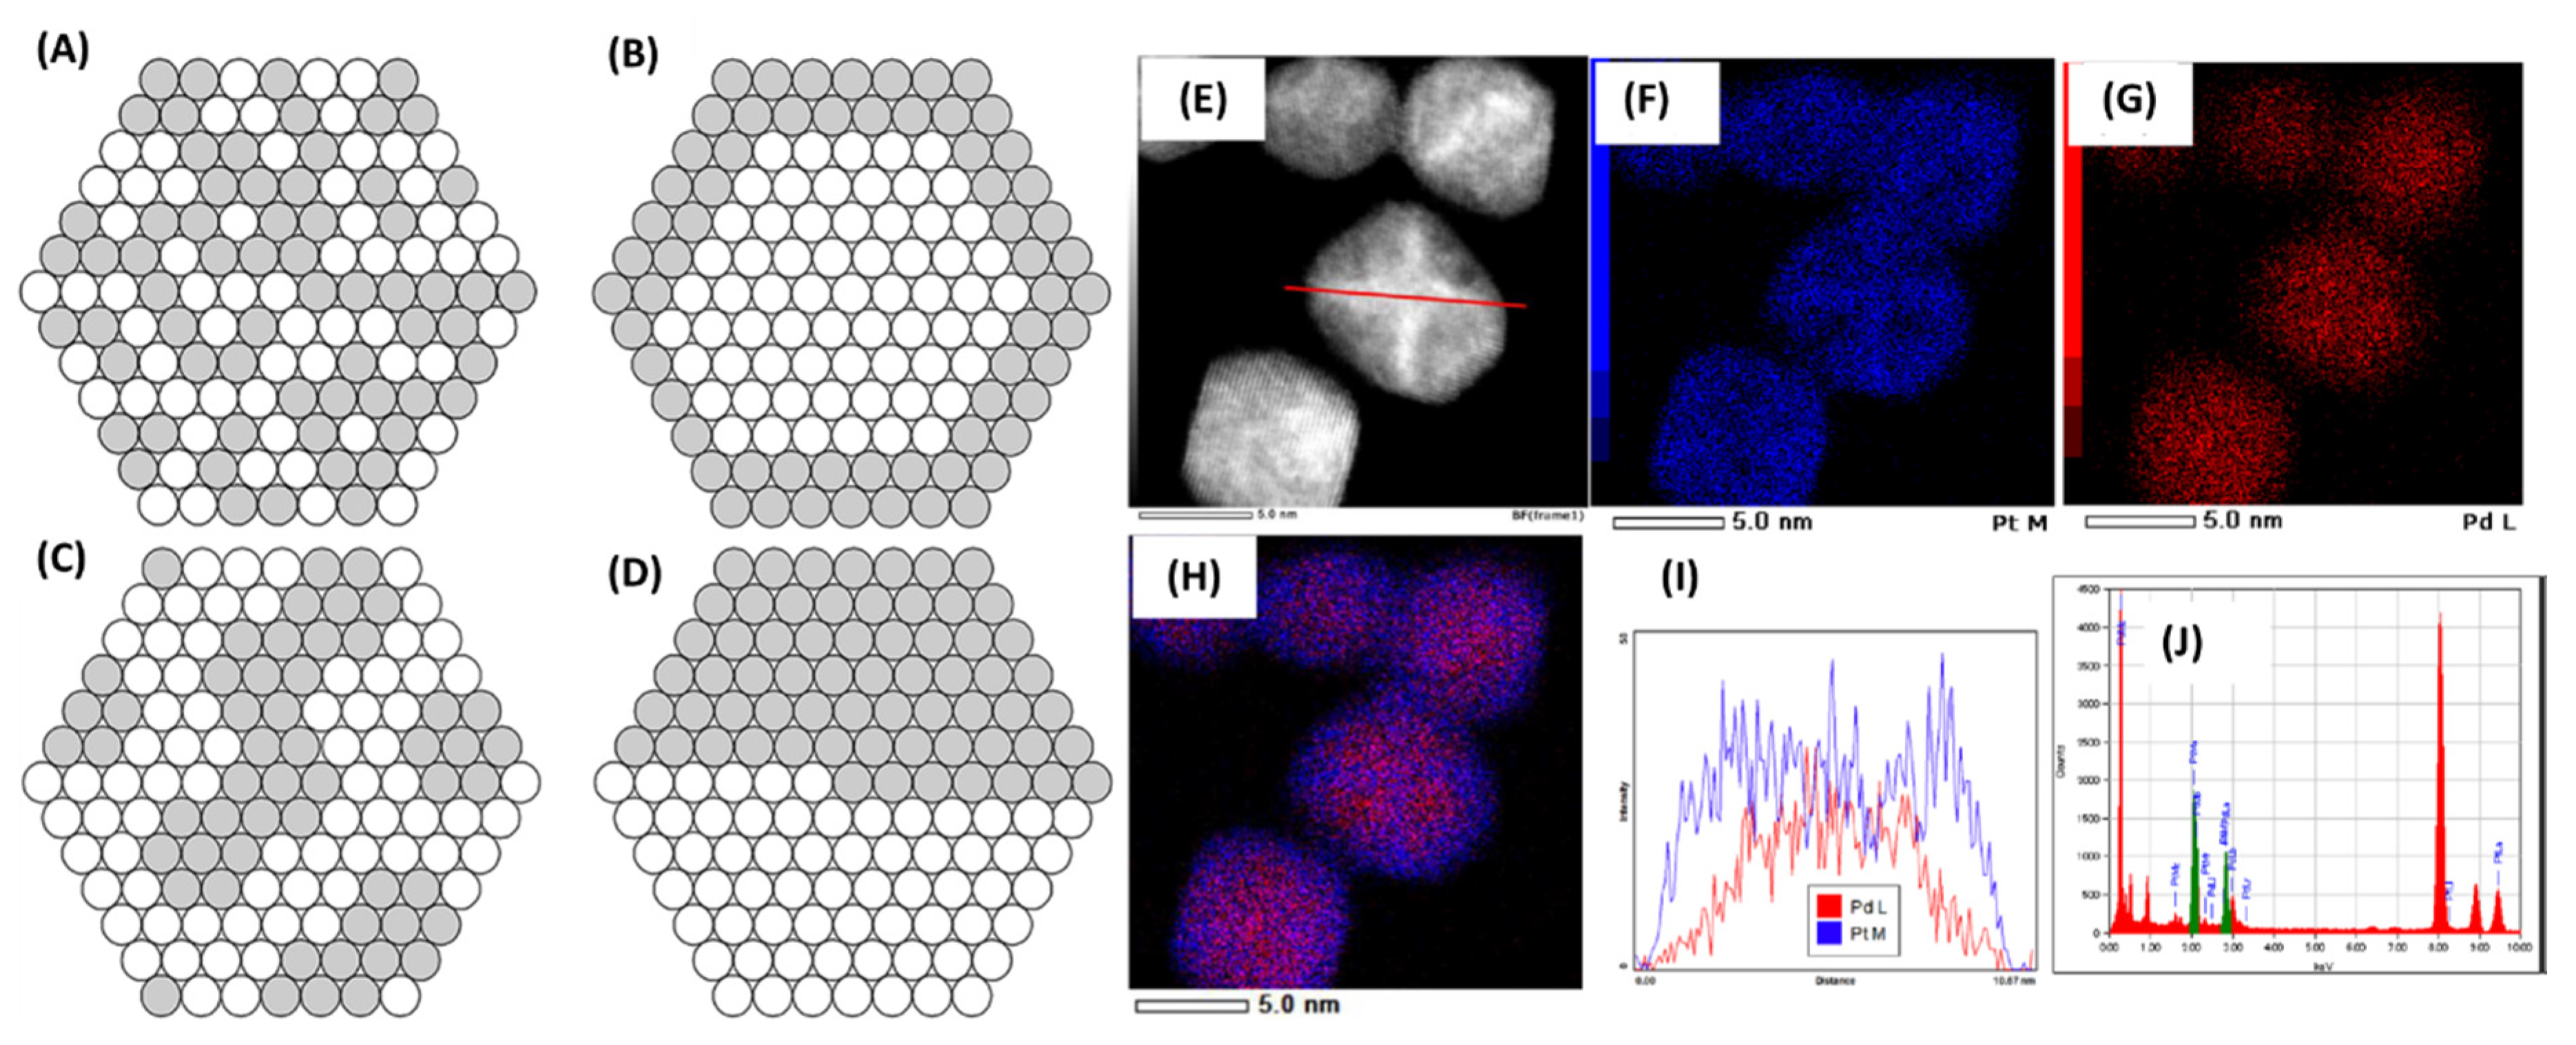
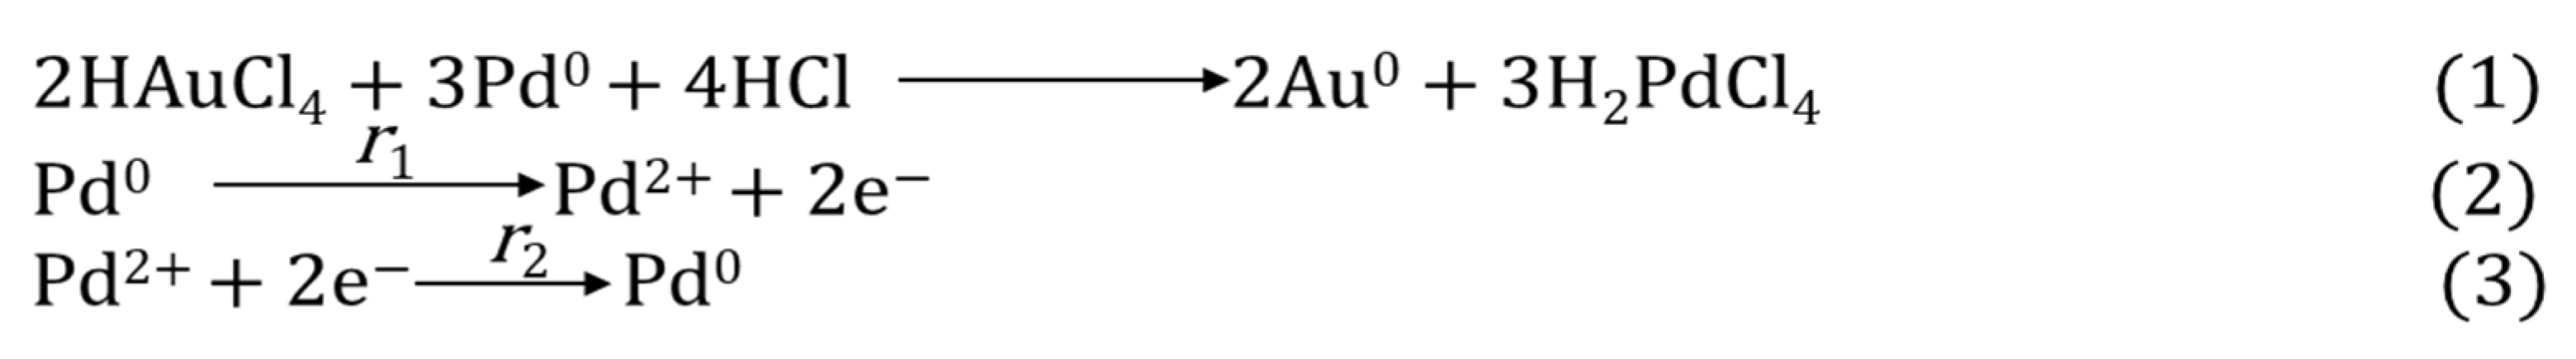
Table 1.
Loss tangent values in the order of increasing boiling points for different solvents and commonly used acronyms (parentheses) under µwH.
Table 1.
Loss tangent values in the order of increasing boiling points for different solvents and commonly used acronyms (parentheses) under µwH.
| Solvent | Boiling Point (°C) | Tangent Loss (tan δ) |
|---|---|---|
| Dichloromethane | 40 | 0.042 |
| Acetone | 56 | 0.054 |
| Chloroform | 61 | 0.091 |
| Methanol | 65 | 0.659 |
| Tetrahydrofuran | 66 | 0.047 |
| Hexane | 69 | 0.020 |
| Ethyl acetate | 77 | 0.059 |
| Ethanol | 78 | 0.941 |
| Acetonitrile | 81 | 0.062 |
| 2-Propanol | 82 | 0.799 |
| 1,2-Dichloroethane | 84 | 0.127 |
| 2-Butanol | 99 | 0.447 |
| Water | 100 | 0.123 |
| Formic Acid | 101 | 0.722 |
| Toluene | 111 | 0.040 |
| Acetic acid | 118 | 0.174 |
| 1-Butanol | 118 | 0.571 |
| Chlorobenzene | 131 | 0.101 |
| N-N′-dimethylformamide | 154 | 0.161 |
| 1,2-Dichlorobenzene | 180 | 0.280 |
| Dimethyl Sulfoxide | 189 | 0.825 |
| Ethylene glycol | 197 | 1.350 |
| N-methyl-2-pyrrolidone | 204 | 0.275 |
| Nitrobenzene | 210 | 0.589 |
Table 2.
Loss tangent values for different materials applicable for µwH.
| Vessel Material | Melting Point (°C) | Tangent Loss (tan δ) |
|---|---|---|
| Plexiglass | 160 | 5.7 × 10⁻³ |
| Polystyrene | 240 | 3.3 × 10⁻⁴ |
| Teflon | 327 | 1.5 × 10⁻⁴ |
| Borosilicate glass | 1648 | 1.0 × 10⁻³ |
| Quartz | 1715 | 6.0 × 10⁻⁵ |
| Porcelain | 1840 | 1.1 × 10⁻³ |
| SiC | 2700 | 0.02–1.05 |
Table 3.
Summary of studies covered in this review.
| Manuscript Section | Publication Year | Instrument-Manufacturer, Watts Used | Solvent(s) | Temperature, Time | NP Composition |
|---|---|---|---|---|---|
| 2.1. | 2004 | Domestic-Spectra, 900 W | EG | N.A., 21 s | Pd-Au |
| 2.2. | 2009 | Domestic, 1000 W | OA + OAm | N.A., Variable (30 s, 90 s) | *Pd-Ni, Pd-Cu, Pd-Ag, Pd-Ru, Pd-Rh, Pd-Pt, Pd-Au |
| 2.3. | 2010 | Domestic, 200 W | H2O | N.A., 3 min | Pd-Pt |
| 2.4. | 2011 | Domestic-LG, 850 W | Muriatic Solution | Variable; 110-130 °C, Variable (15 min-60 min) | *Pd-Au |
| 2.5. | 2014 | Domestic-Galanz, 1000 W | TEG | N.A., 100 s | Pd-Pt |
| 2.6. | 2015 | N.A., 400 W | H2O | 100 °C, Variable; 30 min-2 hr | Pd-Ag |
| 2.7. | 2016 | MARS 5- CEM Corp., 800 W | EG | 150 °C, Variable (30 s-1 hr) | Pd-Au |
| 2.8. | 2017 | NN-J155WB EPG-Panasonic, 250 W | H2O | N.A., 3 min | Pd-Rh |
| 2.9. | 2018 | MARS 5- CEM Corp., 800 W | EG | 165 °C, Variable (30 s-3 hr) | Pd-Rh |
| 2.10. | 2018 | Flow Synthesis; Microsynth Plus-Milestone General K. K., 700W | Batch synthesis: Discover SP-CEM Corp.; 300 W | EG, Glycerol | 198 °C (EG), 250 °C (Glycerol), 10 min | *Pd-Pt |
* Selected for the scope of this review, more combinations were synthesized.
© 2020 by the authors. Licensee MDPI, Basel, Switzerland. This article is an open access article distributed under the terms and conditions of the Creative Commons Attribution (CC BY) license (http://creativecommons.org/licenses/by/4.0/).
Share and Cite
MDPI and ACS Style
Kunal, P.; Toops, T.J. A Review of Microwave-Assisted Synthesis-Based Approaches to Reduce Pd-Content in Catalysts. Catalysts 2020, 10, 991. https://doi.org/10.3390/catal10090991
AMA Style
Kunal P, Toops TJ. A Review of Microwave-Assisted Synthesis-Based Approaches to Reduce Pd-Content in Catalysts. Catalysts. 2020; 10(9):991. https://doi.org/10.3390/catal10090991
Chicago/Turabian StyleKunal, Pranaw, and Todd J. Toops. 2020. "A Review of Microwave-Assisted Synthesis-Based Approaches to Reduce Pd-Content in Catalysts" Catalysts 10, no. 9: 991. https://doi.org/10.3390/catal10090991
Note that from the first issue of 2016, this journal uses article numbers instead of page numbers. See further details here.