Article

Kinetic Model of the Action of 17α-Ethynylestradiol on the Capacitation of Mouse Sperm, Monitored by HPLC-MS/MS

1
Department of Analytical Chemistry, Faculty of Science, Charles University, Albertov 2030, 128 43 Prague 2, Czech Republic
2
Laboratory of Reproductive Biology, Institute of Biotechnology, Czech Academy of Sciences, BIOCEV, Prumyslova 595, 252 50 Vestec, Czech Republic
3
Toxicology Department, Institute of Forensic Medicine and Toxicology, General University Hospital in Prague, Ke Karlovu 2, 128 08 Prague 2, Czech Republic
4
Department of Zoology, Faculty of Science, Charles University, Vinicna 7, 128 44 Prague 2, Czech Republic
*
Authors to whom correspondence should be addressed.
Catalysts 2020, 10(1), 124; https://doi.org/10.3390/catal10010124
Submission received: 22 December 2019 / Revised: 9 January 2020 / Accepted: 9 January 2020 / Published: 15 January 2020

Abstract

:
17α-Ethynylestradiol (EE2), a synthetic estrogen used in contraceptive pills, is resistant to hepatic degradation and is excreted in the urine. It is chemically stable and has a negative impact on the endocrine system. The aim of this work was to mathematically describe the possible interaction of EE2 (200, 20, and 2 μg/L) with sperm estrogen receptors during sperm maturation, which is called capacitation. The concentrations of the unbound EE2 remaining in capacitating medium during 180 min of sperm capacitation were determined at 30 min intervals by high performance liquid chromatography with tandem mass spectrometric detection (HPLC-MS/MS) and the data obtained (relative concentrations Bt) were subjected to kinetic analysis. The suggested kinetic schema was described by the system of differential equations with the optimization of rate constants used to calculate the theoretical Bt values. Optimal parameters (overall rate constants K1K5 and molar ratio n) were determined by searching the minimum of absolute values of the difference between theoretical and experimental Bt values. These values were used for the design of the theoretical B(t) curves which fit to experimental points. The proposed kinetic model assumes the formation of an unstable adduct between EE2 and the receptor in cytoplasm, which acts as an autocatalytic agent and gradually decomposes.

Graphical Abstract

1. Introduction

The estrogenic hormone 17α-ethynylestradiol (EE2) belongs to a group of pollutants termed estrogenic endocrine-disrupting chemicals (E-EDC), which are chemical substances in the environment that have a negative impact on the endocrine systems of animals and also humans [1]. E-EDCs enter the environment in the form of waste products as a result of elevated production and consumption of a number of drugs, e.g., hormonal contraceptives or supportive substances [2], and already constitute a toxicological reproductive risk at very low concentrations (ng/L). These substances can, in fact, simulate the behavior of endogenic estrogenic hormones, which control a number of physiological processes, including sperm maturation and preparation for fertilization, binding to their receptors [2,3,4] (estrogen receptors (ERs), nuclear receptors (nER), and membrane (mER) and cytoplasmic (cER) receptors) [5,6].
EE2 is a synthetic hormone used in hormonal contraception and is resistant to decomposition in the liver [7,8]. After ingestion, it is excreted in the urine, most often as a conjugate (glucuronate or sulphate), and thus enters waste waters, and, after deconjugation, can act as an E-EDC in the environment [9]. Its subsequent binding to an estrogen receptor can inhibit the secretion of the gonadotropin-releasing hormone and subsequently the secretion of the luteinizing hormone, leading to a reduction in the function or activity of the testes and directly affecting spermatogenesis, i.e., the process of formation and development of sperm, resulting in a male sex cell [10,11]. The sperm could then be morphologically mature, but not capable of fertilizing an egg [12].
Under normal circumstances, following ejaculation into the female reproductive system, sperm undergo complex biochemical and physiological changes, summarily termed capacitation [13]. Only capacitated sperm gain progressive motility (sperm hyperactivation) and are capable of penetrating through the egg envelope (in a process known as the acrosome reaction) and fertilizing the egg [14]. Capacitation in vivo, which includes membrane rearrangement, cholesterol efflux, activation of specific signal transduction pathways leading to protein tyrosine phosphorylation (TyrP) and cytoskeleton rearrangements [15,16,17], takes place in the uterus and fallopian tubes and is activated by substances excreted from the female genital tract. The capacitation process in vitro can take place under exactly delimited conditions employing incubation of sperm in a capacitation/fertilization medium containing albumin and calcium ions, at a temperature of 37 °C and in an atmosphere with 5% CO2, which imitates the physiological environment in female genital tracts [15,18]. In order to study the effect of the presence of exogenous hormones on sperm capacitation in vitro, it is important to determine how capable the sperm is of binding these hormones during these processes and the dynamics of this process.
Methods of studying the effect of estrogenic hormones on sperm capacitation have been published only sporadically in the literature. Immunochemical methods have been used to study the effect of estrogens on the capacitation of mouse sperm in vivo [19] and boar sperm in vitro [20]. It has been found that sperm capacitation in vitro is substantially modulated by the presence of estrogens and that its speed can also be increased [21,22,23]. The effect of estriol on the capacitation of mouse sperm has been studied by HPLC with UV detection, but with low detection sensitivity [24]. The method was greatly improved by using sensitive HPLC-MS/MS methods for monitoring the action of 17β-estradiol (E2) on the capacitation of mouse sperm in vitro, enabling monitoring of changes in hormone concentration levels during sperm capacitation even at the level of units of μg/L [25,26], thus approaching real values of potential exposure. The obtained results were subjected to kinetic analysis, which has been used successfully to study the mechanism of the action of fluorides and aluminum fluoride complexes on the capacitation ability of mouse sperm [27]. The results of kinetic analysis of concentration changes on the receptors of unbound E2 during time-dependent sperm capacitation have demonstrated that E2 is first adsorbed on the surface of plasmatic membranes and subsequently passes into the cytoplasm, where it forms an unstable adduct with the receptors; the formation of this adduct has an autocatalytic effect [26]. It has thus been found that the application of kinetic analysis to the experimentally obtained data could be a useful instrument in monitoring sperm responses to the action of external factors and for prediction of kinetically specific mechanisms at a molecular level, including selected signal pathways.
This study focuses on the effect of synthetic EE2 on mouse sperm capacitation and comparison of the EE2 action with E2 [26]. An HPLC-MS/MS method capable of monitoring the concentration changes in unbound EE2 during time-dependent capacitation of mouse sperm in capacitating medium is developed, and the results obtained are subjected to kinetic analysis.

2. Results

2.1. HPLC-MS/MS Analysis

The ability of bovine serum albumin (BSA) to bind some estrogen substances, especially under in vitro conditions (tempering for 60 min in an incubator at 37 °C and 5% CO2), has been described in the literature [28,29,30]. Experiments were conducted to clarify whether EE2 is bound to BSA, and, if so, for how long. Consequently, samples were taken at times of 0, 30, 60, and 90 min during tempering of EE2 in the capacitating medium (200, 20, and 2 μg/L) under in vitro conditions and were subsequently analyzed by the developed HPLC-MS/MS method. It was found that the EE2 concentration decreases during tempering. If the values of the relevant concentrations are compared at the start (200, 20, and 2 μg/L) and after 60 min (~180, 18, and 1.8 μg/L) of tempering, it can be seen that their differences (~20, 2, and 0.2 μg/L) decrease with decrease in the initial EE2 concentration following the concept of simple equilibrium. The EE2 concentration decreases especially in the first 30 min and then remains practically constant up to 90 min, which means that after 30 min no EE2 binds to BSA. This is very important because at 60 min, when tempering of the prepared biological samples is terminated, the sperm are immediately added to the sample and their capacitation begins.
The process of capacitation was monitored for the time range 0 to 180 min with a 30 min interval between sample collections. The biological sample (EE2 in capacitating medium with the addition of sperm) was measured in three parallel sets (n’ = 3) where each set represented sperm collected from one individual. Blanks (no sperm) were also prepared for each tested concentration. The course of the entire measurement for the tested EE2 concentrations is depicted in Figure 1A–C. It can be seen in Figure 1A–C that there is a gradual decrease in the concentration of EE2 in the time interval 0 to 60 min, with a minimum value on the curve at around 60 min of capacitation for all the measured concentrations (200, 20, and 2 μg/L). This means that the greatest binding of the hormone by sperm occurred around 60 min of capacitation. Subsequently, after the first decrease, the hormone concentration increased until the end of capacitation, i.e., to 180 min, when the concentration of the overall unbound EE2 approached the original concentration value at time 0 min. This gradual increase in concentration was caused by the slow release of EE2 bound in the sperm. On the other hand, analysis of the blank samples demonstrated that the EE2 concentration was practically constant for the whole measured time. For comparison of the results obtained for various dilutions of EE2 (concentrations 200, 20, and 2 μg/L) it is useful to introduce relative values of Bt, calculated as C(t)/C(t=0) (for the individual capacitation times), which are listed in Table 1.

2.2. Kinetic Analysis of the HPLC-MS/MS Data

The obtained HPLC-MS/MS data was subjected to kinetic analysis to determine the mechanism of EE2 action on sperm during their capacitation. The curve interposed by the experimentally measured points (concentration of unbound EE2 in dependence on the time of sperm capacitation (Figure 1)), exhibited an autocatalytic character. This followed from two parameters: the slope (tangent) of the dependence of the measured quantity on time became steeper during the interaction, i.e., the interaction rate increased, and the hormone (EE2) formed an adduct (EE2-R) with the receptor (R). However, the adduct was unstable and subsequently decomposed, increasing the concentration of unbound EE2. The concept of the autocatalytic course is based on the fact that similar behavior has already been described for E2 [26]. This means that the initial formation of the adduct (non-catalytic step) leads to increased accessibility of the cytoplasmic membrane (termed signaling). The energy released in the formation of bonds between the receptor and the hormone is transferred by the bond system of the macromolecular receptors to the surface of the membrane, where it causes relaxation of this membrane and becomes more permeable for the passage of a higher amount of extracellular EE2 (autocatalytic step).
Four hypothetical possibilities can be considered to describe the decomposition of the adduct located inside the cytoplasmic membrane of sperm: (i) the decomposition produces active EE2i and active R, both capable of further interactions; (ii) the decomposition produces active EE2i and inactive receptor R’; (iii) the decomposition produces active receptor R and inactive hormone EE2i’; and (iv) the decomposition yields both inactive products, i.e., R’ and EE2i’. The last two reactions (iii) and (iv) can be rejected because it follows from the experimental data that at the end of the interaction between the hormone and sperm, the hormone returns to its starting concentration. Thus, we can consider reactions (i) and (ii) only. Because both of the components formed in the first reaction (i) are active, it is easy to imagine a reverse back (equilibrium) reaction between the hormone and the receptor in the cytoplasm. On the other hand, the second reaction (ii) is unidirectional and leads to deactivation of the receptor. The two reactions, (i) and (ii), can take place simultaneously and this phenomenon can be considered as a disturbance of the equilibrium (i.e., a pseudo-equilibrium reaction). The whole process can be described by the simple scheme shown in Figure 2. It follows from the scheme that monitoring of the EE2 concentration by HPLC/MS-MS (described in Section 2.1) is related to the overall concentration of free, unbound hormone, i.e., the original EE2 and the internal EE2i. After centrifugation, both components of the hormone are present in the supernatant; on the other hand, the hormone bound in the complex with the receptor (adduct: EE2-R) remains in the sediment and its concentration is not measured.
Furthermore, the kinetic scheme describes kinetic products and rate constants (K1K5) in the form of the following rate equations. For brevity, the term EE2 is replaced in the equations by the symbol E, also designating its molar concentration under various experimental conditions. R designates the receptor and its concentration, the symbol ER stands for the adduct, Ei is the internal free hormone in the cytoplasm, and ε is the relative concentration of unbound hormone outside the membrane.
d E d t = E × R ( K 1 + K 2 × ( 1 ε ) )
d R d t = E × R ( K 1 + K 2 × ( 1 ε ) ) + K 4 × E i × R K 3 × ( E R )
d ( E R ) d t = E × R ( K 1 + K 2 × ( 1 ε ) ) + K 4 × E i × R ( K 3 + K 5 ) × ( E R )
Equation (1) describes the decrease in hormone E on reaction with receptor R by non-autocatalytic (K1) and autocatalytic (K2) reactions, Equation (2) describes the decrease in the receptor through its reaction with the external (K1, K2) and internal hormone (K4) and increase by the adduct decomposition (K3), and Equation (3) describes the increase in the adduct through the non-autocatalytic (K1), autocatalytic (K2), and back (K4) reactions and decrease through the equilibrium (K3) and pseudo-equilibrium (K5) reactions. The derivation of the individual differential equations and reasons for their specific position are described in detail in Section 4.4.
The parameters of the theoretical B(t) curves, i.e., the rate constants K0K5 and the molar ratio n, were optimized by looking for the minima in the absolute values of the difference between the theoretical and experimental Bt values using the Matlab program. The results of optimization of the rate constants and parameter n are listed in Table 2, and Figure 3 shows very good agreement between the theoretical curves and the experimental points.

3. Discussion

The results show that with the simultaneous progress of the equilibrium and pseudo-equilibrium reactions, the course of the B(t) curves can be described over almost two concentration orders simply by a change in parameter n with unvarying rate constants. This is perfect behavior in which the description of the kinetic scheme reflects its suitability. The correctness of the proposed model is further confirmed by the positions of the minima on the B(t) curves, which are in agreement with the experimental values. The kinetic model and positions of the individual kinetic equations demonstrate that EE2 binds rapidly to the receptors but that this is a very weak bond. This also corresponds to the character of the values of the decomposition rate constants, which are larger than the rate constants of adduct formation. The adduct is unstable and is connected with inactivation of the binding receptor. The back reaction progresses relatively easily.
The theoretical shape of the B(t) curves obtained for synthetic EE2 mimics behavior of endogenic E2 [26]; this means that the course has similar autocatalytic character. The differences between these two hormones are in the position of the minimum of curves. In the case of EE2 the minimum remains at the constant position of capacitation time (60 min) and does not depend on the tested concentration. On the other hand, with increasing E2 concentration, the position of the minimum value shifts to longer times (from 30 min for 200 μg/L to 90 min for 2 μg/L) as a result of initial adsorption of E2 on the plasma membrane surface controlled by the Langmuir isotherm.

4. Materials and Methods

4.1. Chemicals, Reagents, and Animals

Acetonitrile (ACN) for LC-MS, Chromasolv (purity ≥ 99.9%), deuterated β-estradiol-16,16,17-d3 (estradiol-d3) (purity 98%), and commercial capacitating M2 culture media for in vitro sperm capacitation and fertilization (M7167) were purchased from Sigma-Aldrich (Steinheim, Germany). Ethanol (purity ≥ 96% p.a.) was obtained from Lachner (Neratovice, Czech Republic). Paraffin oil was provided by Carl Roth (Karlsruhe, Germany). Formic acid (HCOOH) (purity 98% p.a.) and 17α-ethynylestradiol (purity 98%) were obtained from Merck (Darmstadt, Germany). Deionized water (1.85 μS, Milli-Q water purification system Millipore, Burlington, MA, USA) was used in all the experiments.
Laboratory inbred strain of house mouse BALB/c was used for the experiments. The mice were housed in animal facilities of the Institute of Molecular Genetics of Czech Academy of Science, Prague, and food and water were supplied ad libitum. All the animal procedures and all the experimental protocols were approved by the Animal Welfare Committee of the Czech Academy of Sciences (Animal Ethics Number 66866/2015-MZE-17214, 18 December 2015).

4.2. Instrumentation and Chromatographic Conditions

The HPLC equipment (Agilent Technologies, Waldbronn, Germany) consisted of a 1290 Infinity Series LC (a quaternary pump, degasser, thermostatic auto sampler, and column oven). A Triple Quad LC/MS 6460 tandem mass spectrometer (Agilent Technologies, Waldbronn, Germany) with an electrospray ionization interface was used for the detection. The signal was processed and data were handled using MassHunter Workstation Acquisition and MassHunter Qualitative Analysis Software (Agilent Technologies, Waldbronn, Germany).
All the instrumental MS-MS parameters were optimized. ESI (+) conditions in the MRM mode for EE2 were capillary voltage 4000 V, nebulizer pressure 55 psi, gas temperature 350 °C, and nitrogen flow rate 10 L/min. For EE2 the m/z 279.1 → 133.0 transition (fragmentor voltage 100 V, collision energy 15 V, and parameter dwell 400 ms) and for estradiol-d3 the m/z 258.5 → 158.9 transition (fragmentor voltage 100 V, collision energy 15 V, and parameter dwell 400 ms) were monitored, respectively.
The separation system was based on the publication of Bosakova et al. [26] with a Kinetex EVO column C18 (100 × 3.0 mm, 2.6 μm, Phenomenex, Torrance, CA, USA) and a mobile phase containing a binary mixture of ACN/water with addition of 0.1% HCOOH in both parts at a volume ratio of 50/50 (v/v); the flow rate was 0.3 mL/min. The column temperature was held at 21 ± 0.5 °C. The amount of sample injected equaled 7.5 µL. Estradiol-d3, which was used as an internal standard (IS) at a final concentration of 25 μg/L (diluted in capacitating medium) was added to each sample. The retention times of IS and EE2 were 3.1 and 3.7 min, respectively. Because of the complex capacitating medium containing inorganic and organic components, of which especially bovine serum albumin (4.0 g/L) can cause difficulties during the separation and detection processes, the eluate was fed to waste from 0 to 2.5 min and to the MS detector only from 2.5 to 5.0 min.
The linearity of the method was determined from the calibration curve constructed by plotting the ratio of the peak areas of EE2 to that of IS against the analyte concentration. It was statistically analyzed by 1/x weighted linear regression analysis using the least-squares regression method. The obtained data was linear (y = 0.0252x − 0.0298, R2 = 0.9989) in the whole measured calibration range 1–225 μg/L. Relative standard deviations (n’ = 5) varied from 1.8–3.3%. The limit of detection (0.88 μg/L) and limit of quantitation (1.21 μg/L) were calculated as the 3.3 × σ/S and 10 × σ/S ratios, respectively, where σ was the baseline noise of the sample and S was the slope of the regression curve (based on peak heights) constructed from the calibration curve. The accuracy, precision, and repeatability were measured at three EE2 concentration levels (200, 20, and 2 μg/L). Intra-day and inter-day accuracy and precision (each n’ = 5) were determined by repeatedly assaying samples on the same day and on two consecutive days, respectively. The results are summarized in Table 3.

4.3. Capacitation of Mouse Sperm In Vitro

Thirty-five millimeter Petri dishes obtained from Thermo Fisher Scientific (Rochester, NY, USA) were used for the capacitation in vitro. An Olympus CX 21 inverted-light microscope and Olympus epifluorescent microscope were supplied by Olympus (Prague, Czech Republic). An NB-203 incubator was purchased from N-BIOTEK (Gyeonggi-do, Korea). A Telstar Bio-IIA incubator and BioTek laminar box from N-BIOTEK (Gyeonggi-do, Korea) were used for the in vitro sperm cultivation.
Firstly, a stock solution of the EE2 standard with a concentration of 200 mg/L was prepared in ethanol, from which working ethanol solutions of EE2 with concentrations of 20 and 2 mg/L were diluted. In the laminar box, 1 μL of the working ethanol solution of EE2 with the appropriate concentration (200, 20, or 2 mg/L) was pipetted, diluted by capacitating medium to a volume of 1 mL in the test tube so that the final test concentration of EE2 in the capacitating medium was obtained (200, 20, or 2 μg/L), and the ethanol content was minimized and remained constant. Subsequently, 100 μL of solution with the appropriate concentration was pipetted into the fertilization Petri dish. The pipetted mixture in the Petri dish was covered with 1 mL of paraffin oil. The prepared Petri dishes were placed in the incubator and tempered for 60 min at a temperature of 37 °C and with 5% CO2 in the air.
The spermatozoa which were recovered from the distal region of the cauda epididymidis were placed in the fertilization Petri dishes with capacitating medium and paraffin oil and then placed for 10 min in the incubator for sperm release. Then, the stock concentration of mouse sperm was adjusted to 5 × 10⁶ sperm/mL. During preparation, the motility of the sperm was controlled under a microscope.
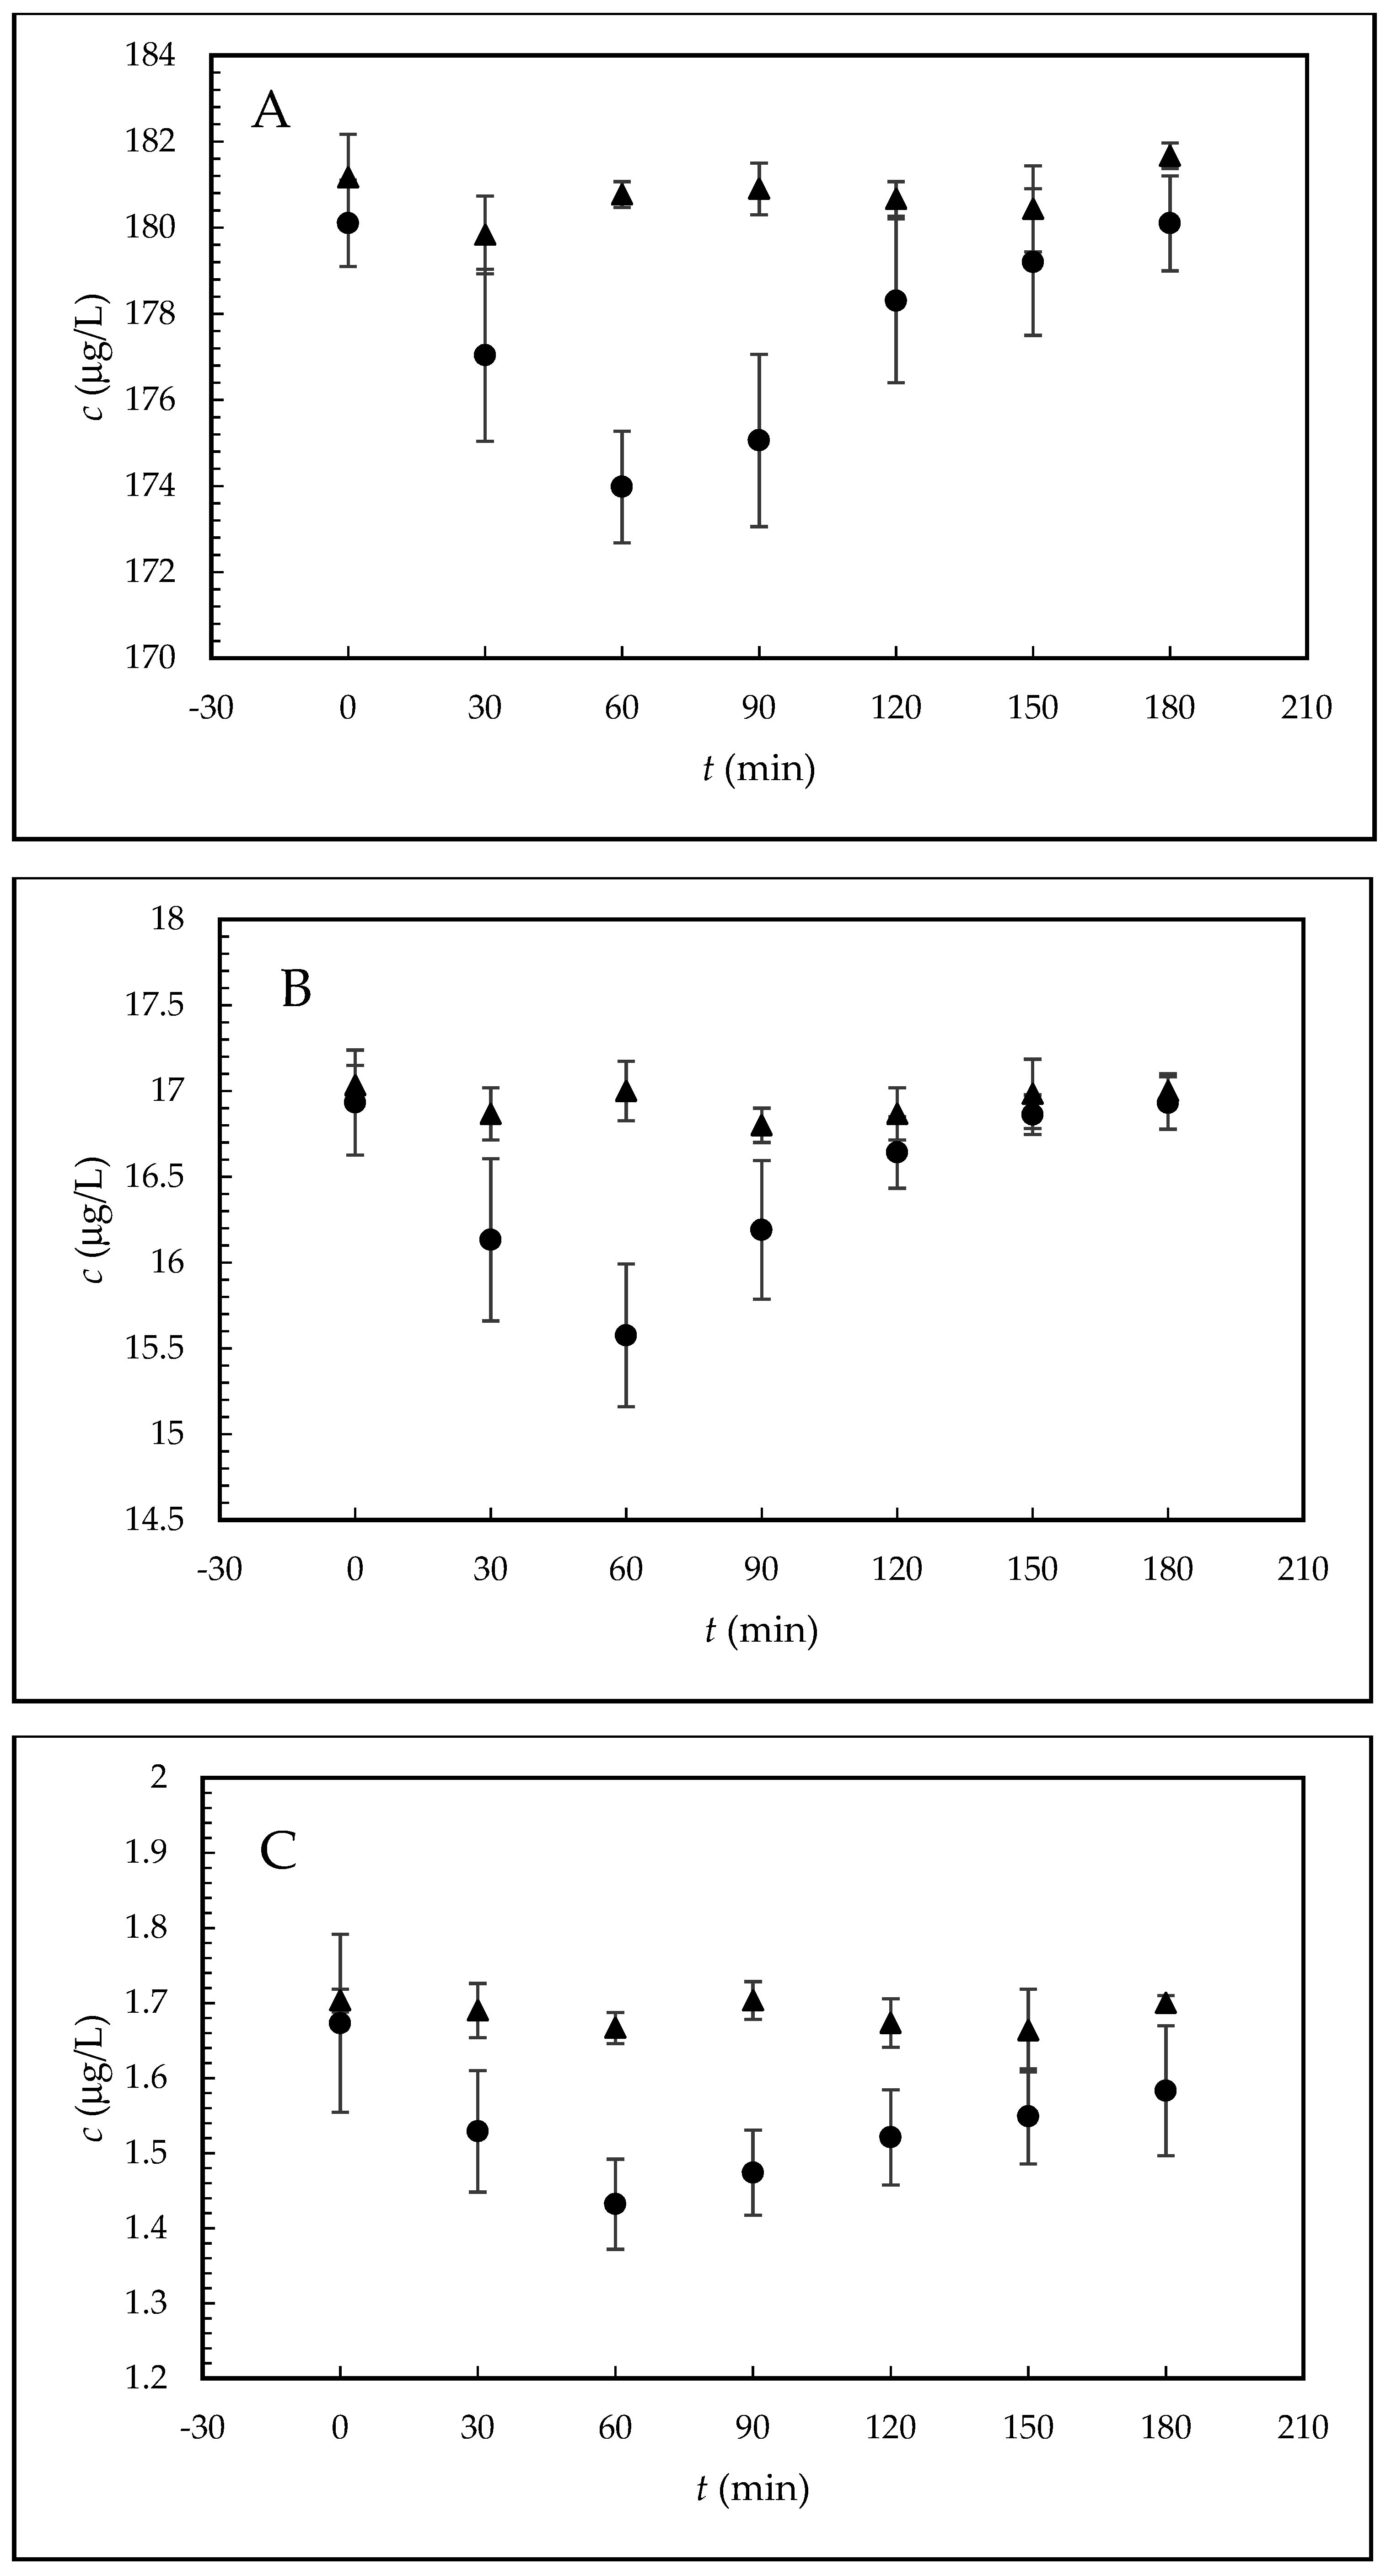
The biological sample was prepared as follows. Following 60 min of tempering, 5 µL of the stock sperm were added to 100 µL of the EE2 sample in capacitating medium (200, 20, or 2 µg/L). For each capacitation time (0–180 min) eight Petri dishes containing 105 µL of sample covered with 1 mL of paraffin oil were prepared. The dishes prepared in this way were incubated again under the same conditions for various time periods (0, 30, 60, 90, 120, 150, and 180 min after adding the sperm), during which sperm capacitation took place. After the individual times, samples (only the solutions with the capacitating medium and without the paraffin oil), were pipetted from all eight Petri dishes into a single micro-test tube, which was centrifuged for 10 min at 12,000 rpm. In this way the sperm were separated from the solution and approximately 600 μL of supernatant was obtained for HPLC-MS/MS analysis of free, sperm-unbound EE2. This sample represented one sampling time during capacitation.
In order to eliminate any systematic errors during sample preparation (e.g., partial evaporation of samples during incubation or differences in collection of the supernatant after centrifugation, etc.), reference samples (blanks) without addition of mouse sperm were prepared simultaneously under the same experimental conditions.
Prior to the actual HPLC-MS/MS analysis, 20 µL of estradiol-d3 (IS) with a concentration of 250 µg/L was added to each biological sample as well as to each blank (180 µL).
The matrix effect was investigated by comparison of the results (EE2/IS peak area ratios) obtained for samples prepared by two different procedures: (i) the sample was prepared by addition of EE2 and IS to the supernatant, which was obtained after the capacitating medium with sperm covered with paraffin oil was tempered, the paraffin oil removed, and the capacitating medium centrifuged; (ii) the sample was prepared by addition of EE2 and IS to the capacitating medium. Each experiment was performed in triplicate for all EE2 concentrations (200, 20, and 2 µg/L). The recovery percentages of the samples with EE2 concentrations of 200, 20, and 2 μg/L were 94.3, 97.1, and 95.8%, respectively.

4.4. Mathematical Model
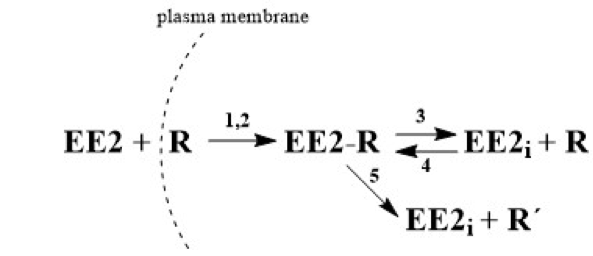
As was described in Section 2.2, the term EE2 has been replaced in equations with the symbol E, which also designates its molar concentration under various experimental conditions. R designates the receptor and its concentration, symbol ER stands for the adduct, Ei is the internal free hormone in the cytoplasmic membrane, and R’ is the inactive receptor. The formation of the ER adduct following the interaction of hormone E with receptor R on the sperm leads to relaxation of the cytoplasmic membrane.
Because the amount of adduct formed is proportional to the difference E(t=0)E(t) and because the amount of hormone at the end of the reaction equals 0, the degree of relaxation of membrane S can be defined as E ( t = 0 ) E ( t ) E ( t = 0 ) , meaning S = 1 − ε, where ε is the relative concentration of unbound hormone outside the membrane. Autocatalytic formation of the adduct thus progresses with rate “constant” k 1 + S × k 2 = k 1 + k 2 × ( 1 ε ) .
Taking into consideration all the possibilities, this can be described by the following system of kinetic equations, i.e., Equations (1)–(7).
d E i d t = ( K 3 + K 5 ) × ( E R ) ( K 4 × E i × R )
d R d t = K 5 × ( E R )
Equation (1) describes the decrease in hormone E by reaction with receptor R by non-autocatalytic (K1) and autocatalytic (K2) reactions, Equation (2) describes the decrease in the receptor through its reaction with the external (K1, K2) and internal hormone (K4) and increase by the adduct decomposition (K3), and Equation (3) describes the increase in the adduct through the non-autocatalytic (K1), autocatalytic (K2), and back (K4) reactions and decrease through the equilibrium (K3) and pseudo-equilibrium (K5) reactions. Equation (4) describes the increase of the internal hormone Ei by the adduct decomposition (K3 and K5) and its decrease by back K4 reaction. Equation (5) describes the formation (K5) of inactive receptor R’.
The balance equation for the hormone (Equation (6)) and the balance equation for the receptor (Equation (7)) are valid, i.e.,
E o = E + ( E R ) + E i   so   that   E i = E o E ( E R )
R o = R + ( E R ) + R   so   that   R = R o ( E R ) R
In the kinetic equations, Ei and R can be expressed according to Equations (6) and (7), meaning the set of kinetic equations is reduced to three for variables E, (ER), and R’.
Further, the relative variables are introduced, i.e.,
E E o = ε ( E R ) E o = α E o R o = n R R o = β
Equation (8) can also be used to describe the relative concentration of the internal hormone E i E 0 and the relative concentration of the receptor R R 0 in Equations (6) and (7).
E i E o = 1 ε α R R o = 1 ( E R ) R o R R o   so   that   R R o = 1 α × n β
Introduction of the relative concentrations and generalized time τ = R 0 × t yields a set of three differential equations, Equations (10)–(12), i.e.,
d ε d T = ( K 1 + K 2 × ( 1 ε ) ) × ( 1 n × α β ) × ε
d α d T = ( K 1 + K 2 × ( 1 ε ) ) × ( 1 n × α β ) × ε ( K 3 R o + K 5 R o ) × α + K 4 ( 1 ε α ) × ( 1 n × α β )
d β d T = n × α × K 5 R o
where the definitions of K3’ and K5’ are
K 3 R 0 = K 3 ;       K 5 R 0 = K 5
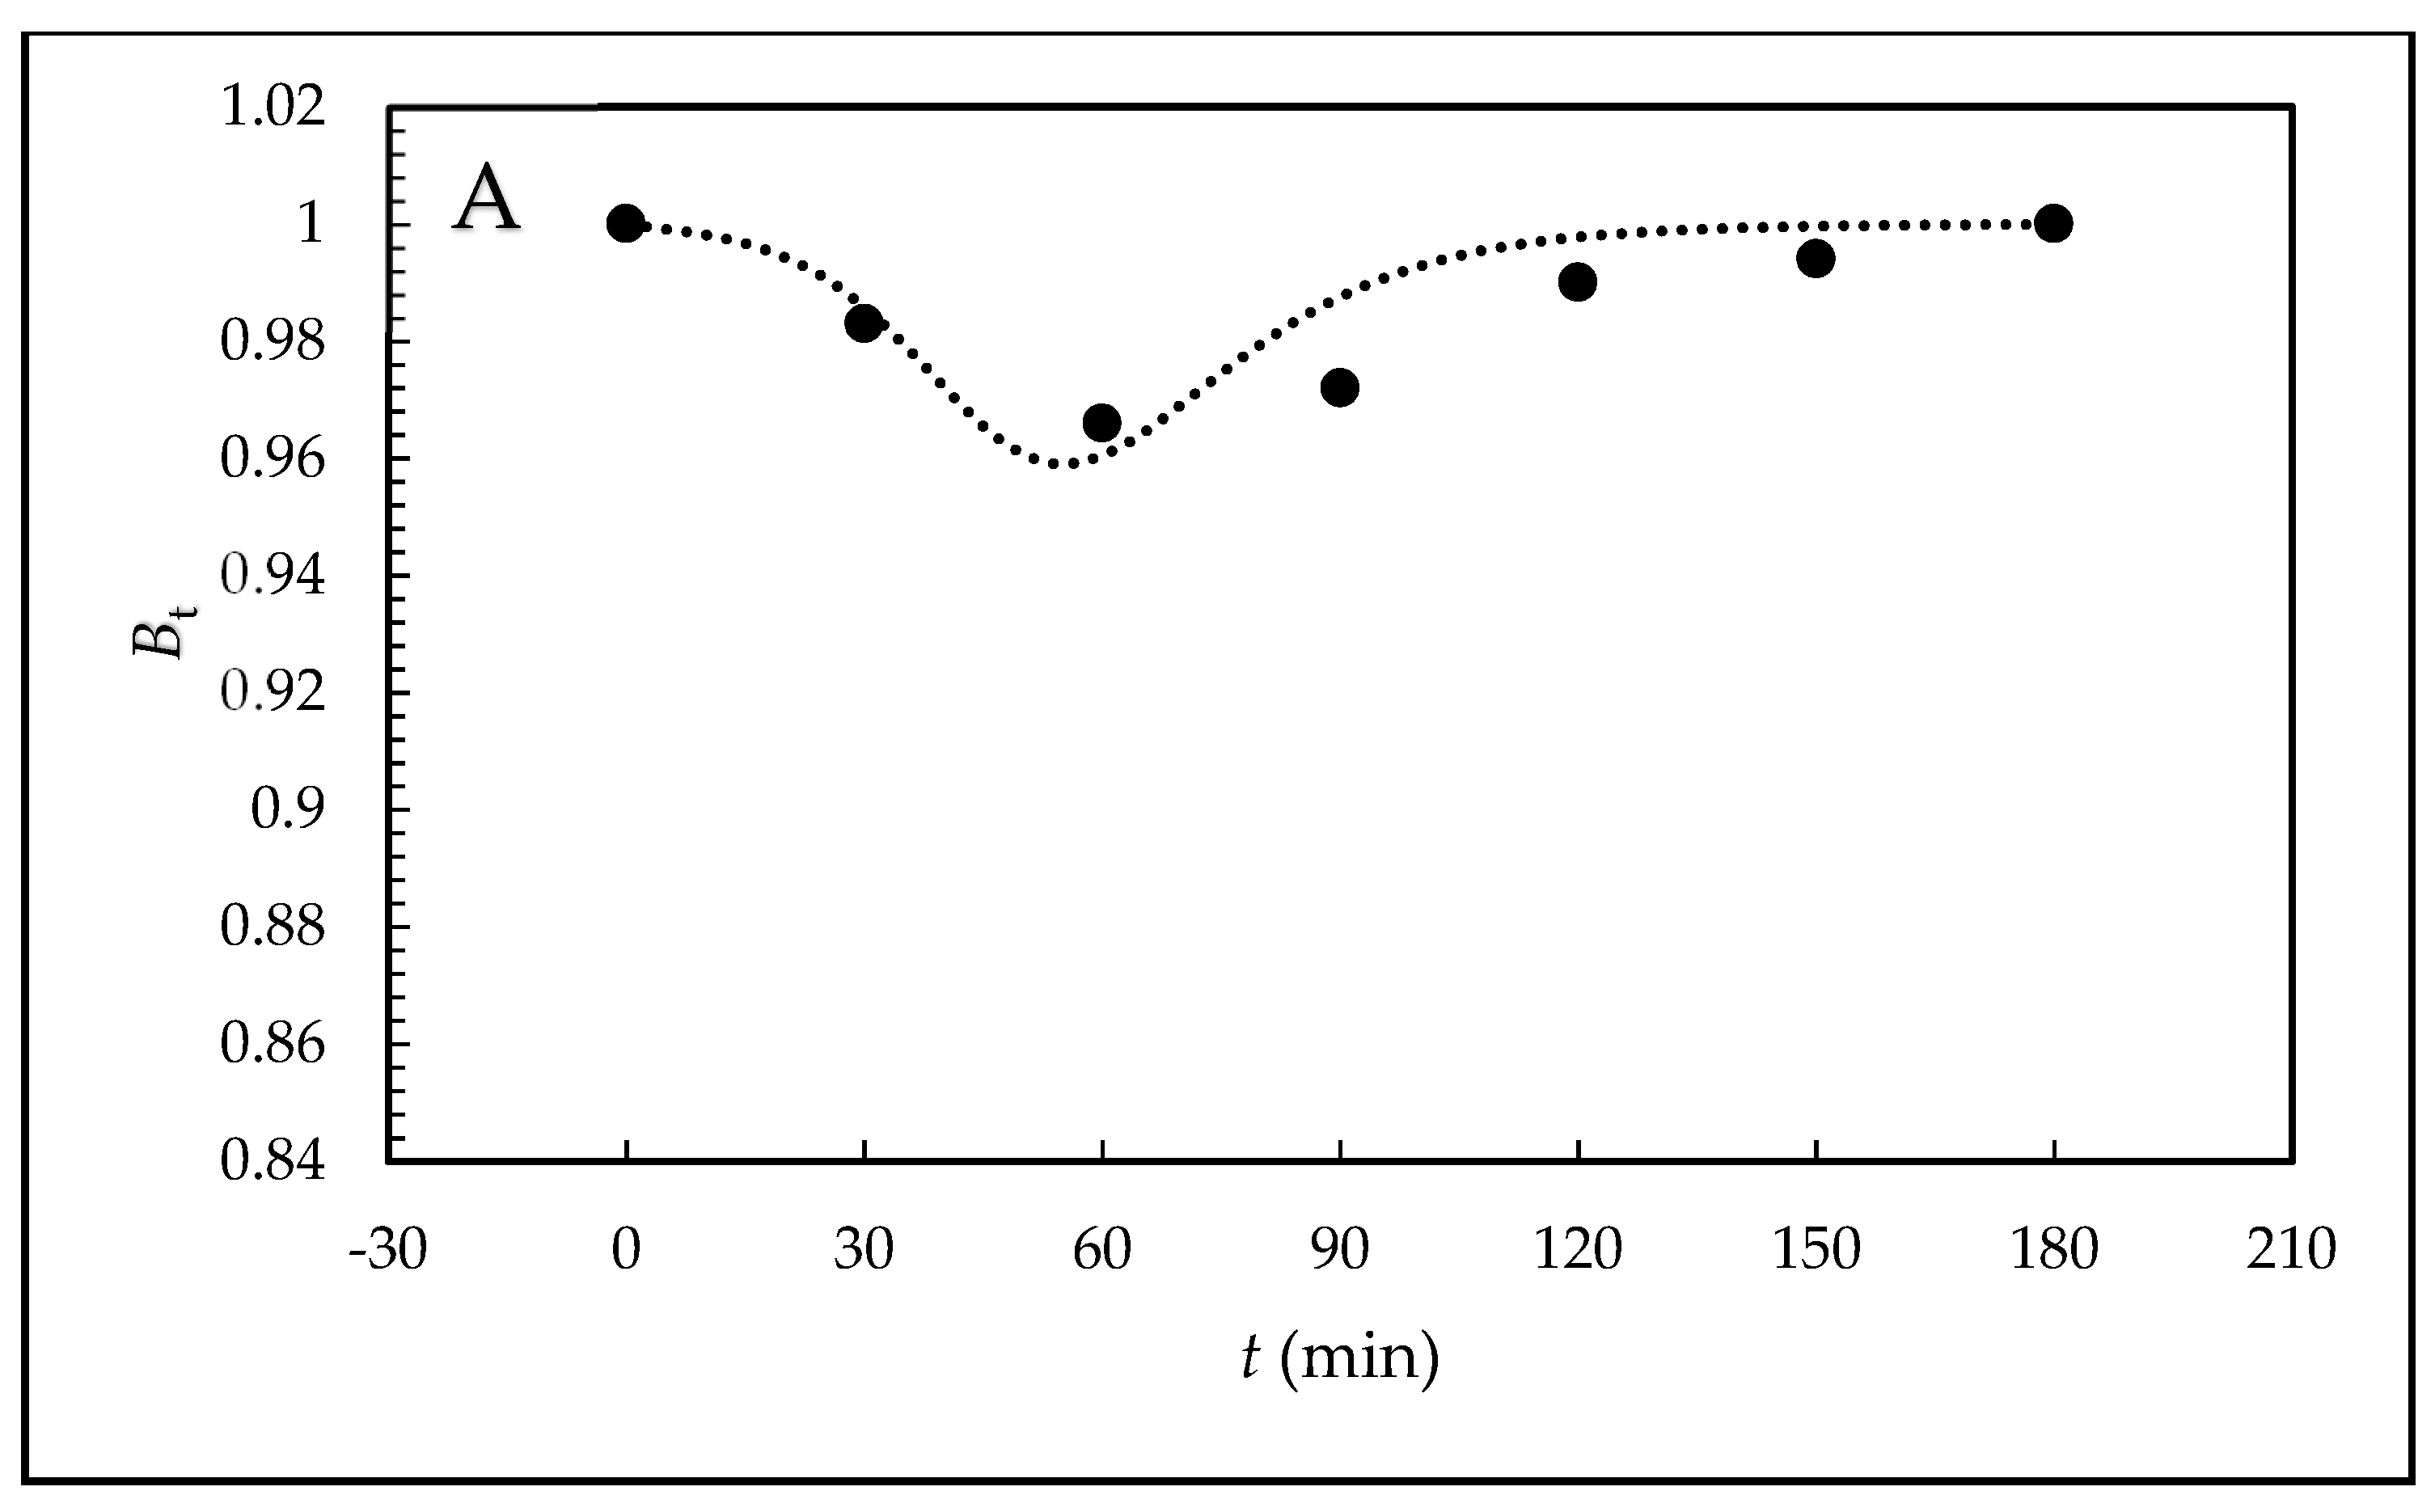
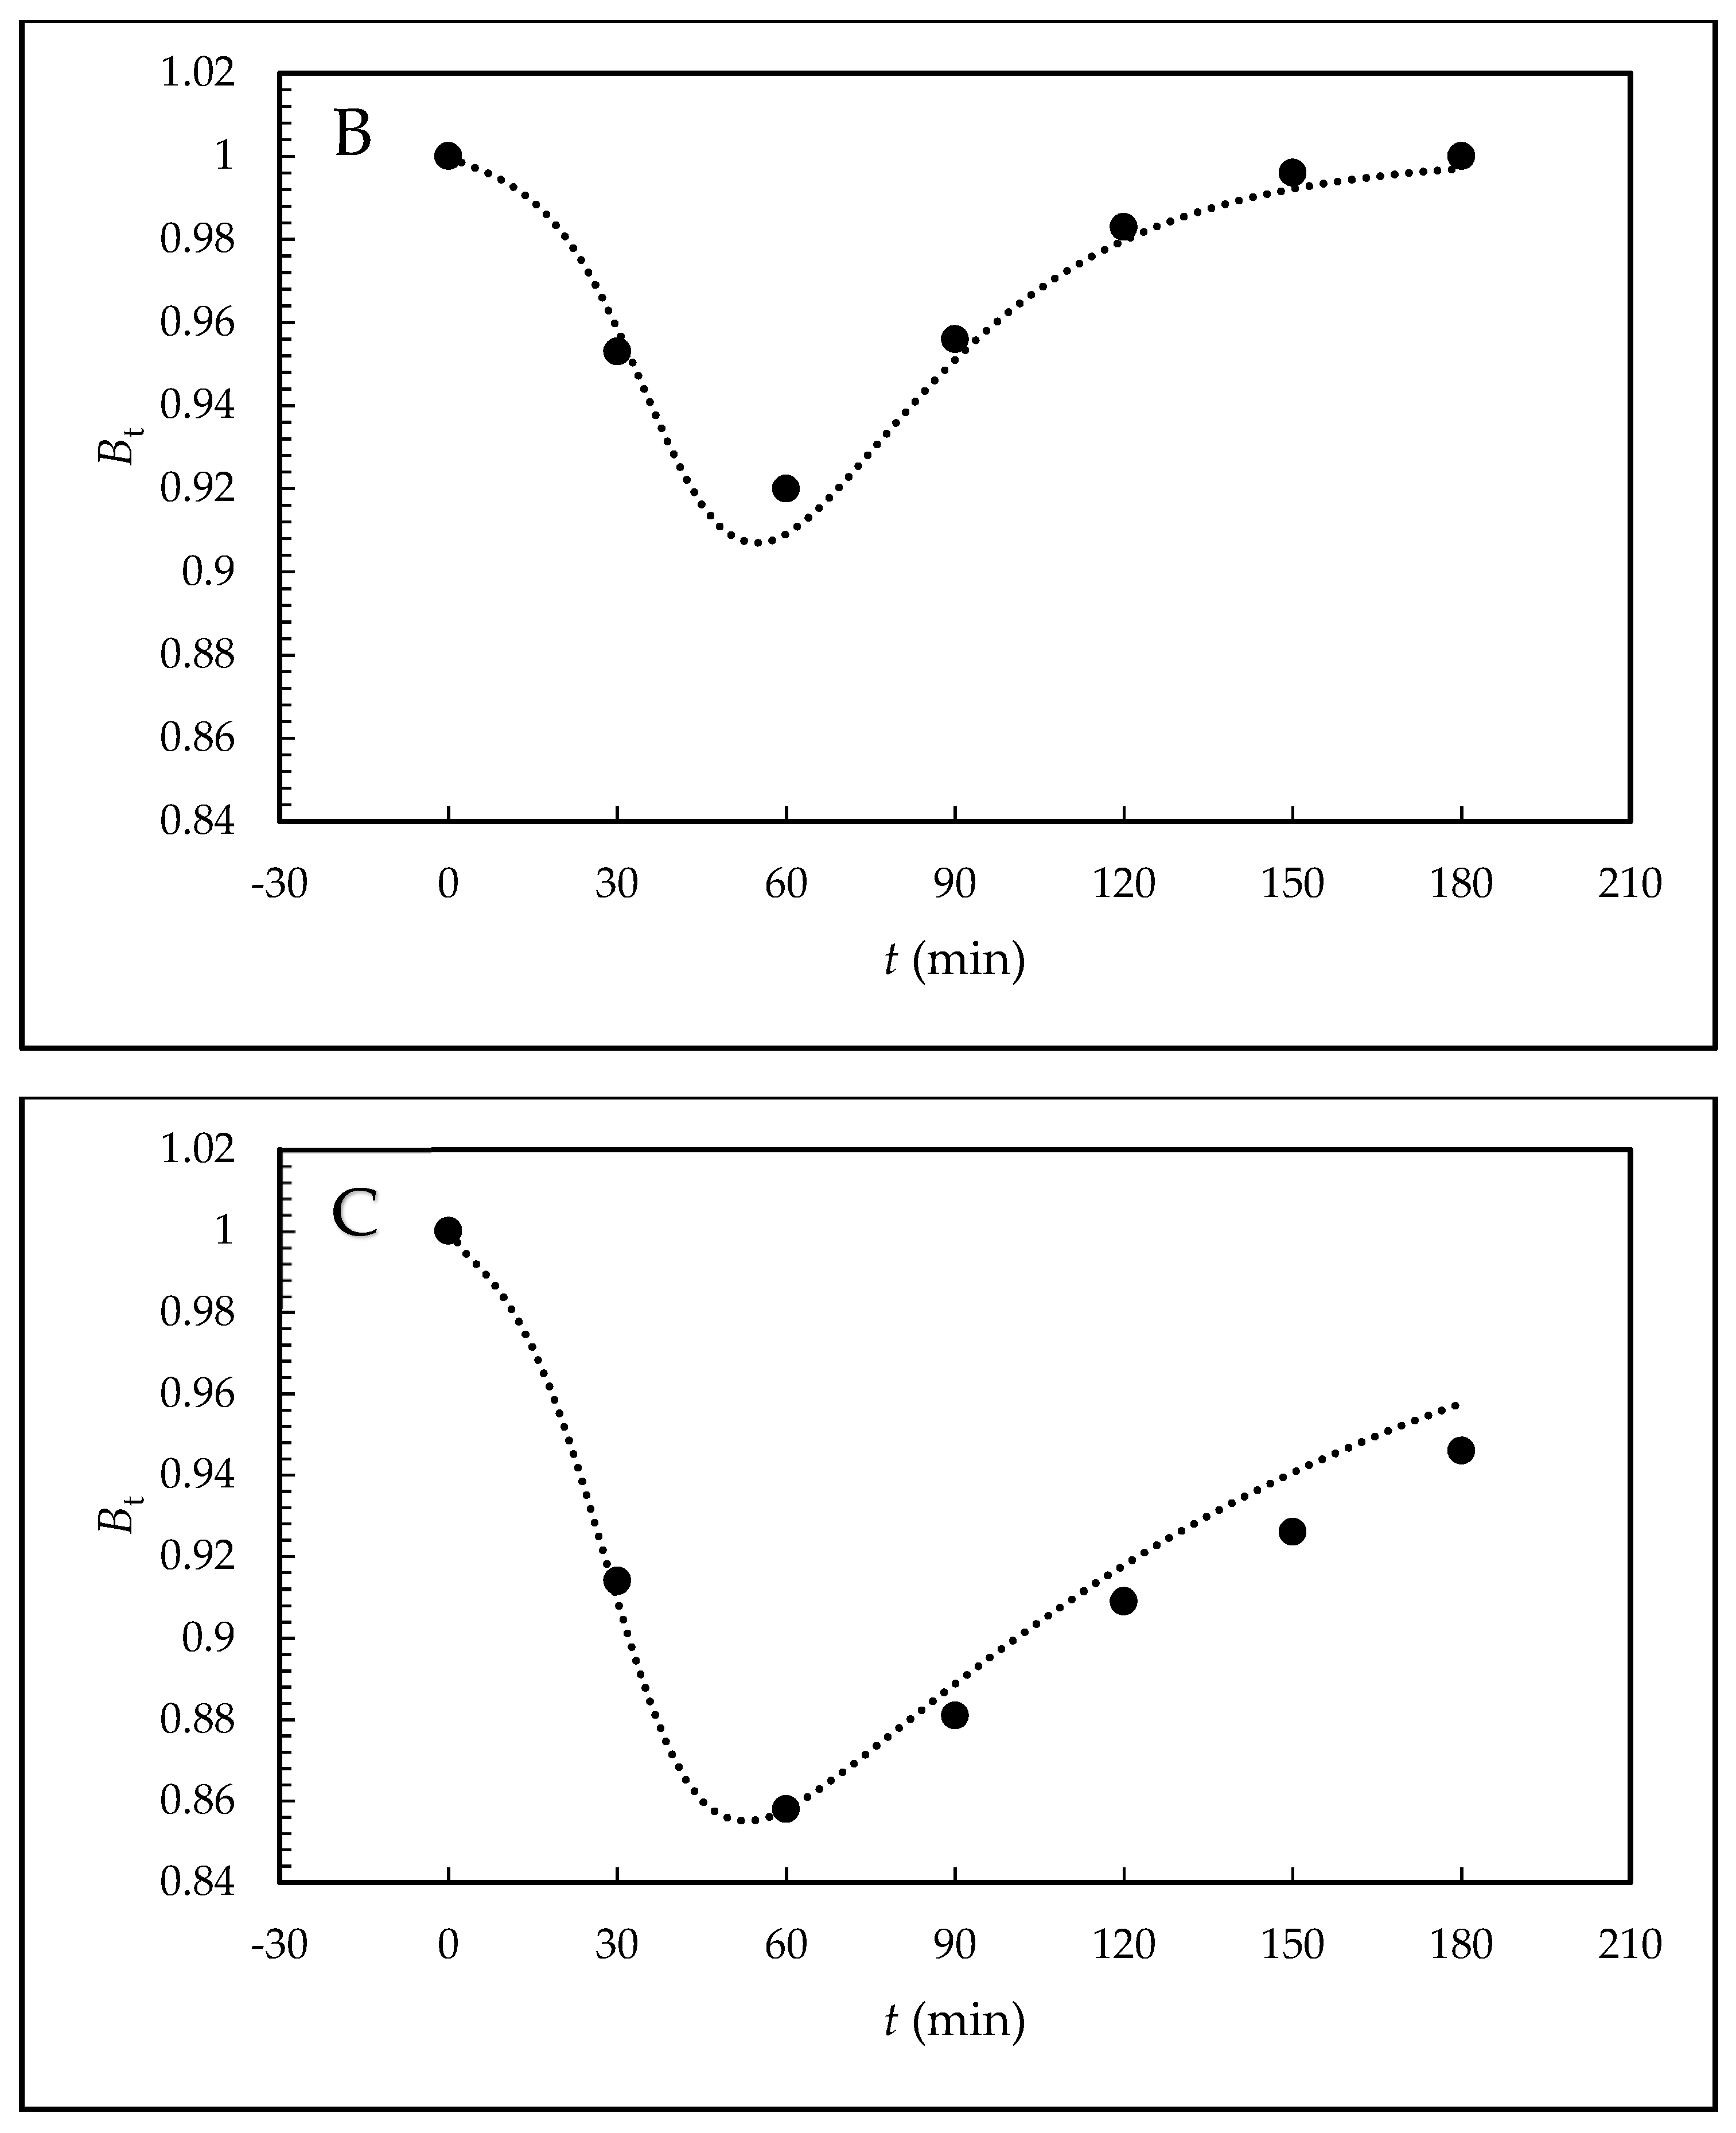
Furthermore, the kinetic scheme employs kinetic products and rate constants in the form of rate equations. The relative values are introduced for the individual variables and the system is solved by numerical integration with simultaneous optimization of the rate constants, including parameter n. Because the sum of the relative concentrations of free hormone B and sperm-bonded hormone α must equal 1, B equals 1–α. Quantity B can be measured and also theoretically calculated from α. For the given kinetic scheme, comparison of the theoretical values with the experimental values makes it possible to decide whether the proposed kinetic scheme is credible.
The equations are solved by the fourth-order Runge-Kutta method with step of h = 10−4. The parameters of the theoretical B(t) curves, i.e., the rate constants and the molar ratio n, were optimized by looking for the minima of the absolute values of the difference between the theoretical and experimental Bt values. The obtained constant values are given in Table 2 and the shapes of the theoretical curves are depicted in Figure 3.

5. Conclusions

In this work, an HPLC-MS/MS method was developed and validated for analysis of EE2 concentration in capacitating medium. This method was subsequently used to monitor the concentration changes of the free hormone not bound by mouse sperm during time-dependent capacitation. The experimentally (HPLC-MS/MS) obtained Bt data were subjected to kinetic analysis and the kinetic model, described by three principal kinetic equations, was designed as follows. Extracellular EE2 can bind to the plasma membrane receptors, forming the adduct in cytoplasm. Once formed, the adduct serves as an autocatalytic agent, acting on the plasma membrane to increase its fluidity. This leads to an increase in the interaction rate between the hormone and the receptor in the cytoplasm. However, the formed adduct is unstable and gradually decomposes. The decomposition can produce the active form of the internal hormone (EE2i) and active receptor (R) in the cytoplasm, which are both capable of further interactions, enabling a reverse back (equilibrium) reaction. The decomposition can also lead to the deactivation of the receptor (R’) during a unidirectional reaction. Both reactions can take place simultaneously and can be considered to be a pseudo-equilibrium reaction (Figure 2). The monitoring of EE2 concentration by HPLC/MS-MS in capacitating medium is related to the overall concentration of free unbound hormone, i.e., the original extracellular EE2 together with the internal EE2i. After centrifugation, both components of the hormone are present in the supernatant, but on the other hand, the hormone bound in the complex with the receptor (adduct: EE2-R) remains in the sediment and its concentration is not measured. Very good agreement of the experimental Bt values with the theoretically calculated values confirms that the proposed kinetic scheme is credible.
The theoretical shape of the B(t) curves obtained for synthetic EE2 mimics behavior of endogenic E2 [26]; this means that the course has similar autocatalytic character. The differences between EE2 and E2 are in the position of the minimum of B(t) curves for the increased initial tested concentration of these two hormones. For EE2, it remains at a constant position of capacitation time and does not depend on the tested concentration. On the other hand, with the increasing E2 concentration, the position of the minimum value shifts to longer times as a result of initial adsorption of E2 on the plasma membrane surface controlled by the Langmuir isotherm. The results suggest that this new analytical–mathematical approach to reproductive biology, such as the study of the mechanism of action of steroid hormones on sperm capacitation, is of a more general nature and can be used in a broader context of endocrine signaling.

Author Contributions

T.B. performed the HPLC-MS/MS experiments and the relevant statistics; T.B., A.T., and R.C. designed and performed the kinetic analysis and wrote the relevant part of the manuscript; N.S. performed sperm capacitation; and K.K. designed and supervised the biological part of the project, including sperm capacitation, analyzed the data, and wrote the relevant parts of the manuscript. All authors have read and agreed to the published version of the manuscript.

Funding

This research received no external funding.

Acknowledgments

This work was financed by the Grant Agency of the Charles University GAUK no. 693118 and SVV project, by the Grant Agency of the Czech Republic no. GA-18-11275S, by the project “BIOCEV–Biotechnology and Biomedicine Centre of the Academy of Sciences and Charles University” (CZ.1.05/1.1.00/02.0109), by institutional support of the Institute of Biotechnology RVO: 86652036, and by the European Regional Development Fund (www.biocev.eu).

Conflicts of Interest

The authors declare no conflict of interest.

References

  1. Campbell, C.G.; Borglin, S.E.; Green, F.B.; Grayson, A.; Wozei, E.; Stringfellow, W.T. Biologically directed environmental monitoring, fate, and transport of estrogenic endocrine disrupting compounds in water: A review. Chemosphere 2006, 65, 1265–1280. [Google Scholar] [CrossRef] [PubMed]
  2. López de Alda, M.J.; Barceló, D. Determination of steroid sex hormones and related synthetic compounds considered as endocrine disruptors in water by liquid chromatography-diode array detection-mass spectrometry. J. Chromatogr. A 2000, 892, 391–406. [Google Scholar] [CrossRef]
  3. Colborn, T.; vom Saal, F.S.; Soto, A.M. Developmental effects of endocrine-disrupting chemicals in wildlife and humans. Environ. Health Perspect. 1993, 101, 378–384. [Google Scholar] [CrossRef] [PubMed]
  4. Della Seta, D.; Farabollini, F.; Dessí-Fulgheri, F.; Fusani, L. Environmental-like exposure to low levels of estrogen affects sexual behavior and physiology of female rats. Endocrinology 2008, 149, 5592–5598. [Google Scholar] [CrossRef] [PubMed] [Green Version]
  5. Aquila, S.; De Amicis, F. Steroid receptors and their ligands: Effects on male gamete functions. Exp. Cell Res. 2014, 328, 303–313. [Google Scholar] [CrossRef] [PubMed]
  6. Dostalova, P.; Zatecka, E.; Dvorakova-Hortova, K. Of Oestrogens and perm: A Review of the roles of oestrogens and oestrogen receptors in male reproduction. Int. J. Mol. Sci. 2017, 18, 904. [Google Scholar] [CrossRef] [Green Version]
  7. Matějíček, D.; Kubáň, V. High performance liquid chromatography/ion-trap mass spectrometry for separation and simultaneous determination of ethynylestradiol, gestodene, levonorgestrel, cyproterone acetate and desogestrel. Anal. Chim. Acta 2007, 588, 304–315. [Google Scholar] [CrossRef]
  8. Ingrand, V.; Herry, G.; Beausse, J.; de Roubin, M.R. Analysis of steroid hormones in effluents of wastewater treatment plants by liquid chromatoraphy–tandem mass spectrometry. J. Chromatogr. A 2003, 1020, 99–104. [Google Scholar] [CrossRef]
  9. Čelić, M.; Biljana, S.I.; Petrović, M. Development of a sensitive and robust online dual column liquid chromatography-tandem mass spectrometry method for the analysis of natural and synthetic estrogens and their conjugates in river water and wastewater. Anal. Bioanal. Chem. 2017, 409, 5427–5440. [Google Scholar] [CrossRef]
  10. Safe, S.H.; Pallaroni, L.; Yoon, K.; Gaido, K.; Ross, S.; Saville, B.; McDonnellc, D. Toxicology of environmental estrogens. Reprod. Fertil. Dev. 2001, 13, 307–315. [Google Scholar] [CrossRef] [PubMed]
  11. Kumar, V.; Majumdar, C.; Roy, P. Effects of endocrine disrupting chemicals from leather industry effluents on male reproductive system. J. Steroid Biochem. Mol. Biol. 2008, 111, 208–216. [Google Scholar] [CrossRef] [PubMed]
  12. Yoshida, M.; Kawano, N.; Yoshida, K. Control of sperm motility and fertility: Diverse factors and common mechanisms. Cell. Mol. Life Sci. 2008, 65, 3446–3457. [Google Scholar] [CrossRef] [PubMed]
  13. Yanagimachi, R. Mammalian fertilization. In The Physiology of Reproduction; Knobil, E., Neill, J.D., Eds.; Raven Press: New York, NY, USA, 1994; pp. 189–317. [Google Scholar]
  14. Suarez, S.S.; Pacey, A.A. Sperm transport in the female reproductive tract. Hum. Reprod. Update 2006, 12, 23–37. [Google Scholar] [CrossRef] [Green Version]
  15. Naz, R.K.; Rajesh, P.B. Role of tyrosine phosphorylation in sperm capacitation/acrosome reaction. Reprod. Biol. Endocrin. 2004, 2, 75–87. [Google Scholar] [CrossRef] [PubMed] [Green Version]
  16. Visconti, P.E.; Bailey, J.L.; Moore, G.D.; Pan, D.; Olds-Clarke, P.; Kopf, G.S. Capacitation of mouse spermatozoa. I. Correlation between the capacitation state and protein tyrosine phosphorylation. Development 1995, 121, 1129–1137. [Google Scholar] [PubMed]
  17. Wang, J.; Qi, L.; Huang, S.; Zhou, T.; Guo, Y.; Wang, G.; Guo, X.; Zhou, Z.; Sha, J. Quantitative phosphoproteomics analysis reveals a key role of insulin growth factor 1 receptor (IGF1R) tyrosine kinase in human sperm capacitation. Mol. Cell. Proteom. 2015, 14, 1104–1112. [Google Scholar] [CrossRef] [Green Version]
  18. Huang, T.T.; Fleming, A.D.; Yanagimachi, R. Only acrosome-reacted spermatozoa can bind to and penetrate zona pellucida: A study using the guinea pig. J. Exp. Zool. 1981, 217, 287–290. [Google Scholar] [CrossRef]
  19. Ded, L.; Sebková, N.; Cerna, M.; Elzeinova, F.; Dostalova, P.; Peknicova, J.; Dvorakova-Hortova, K. In vivo exposure to 17β-estradiol triggers premature sperm capacitation in cauda epididymis. Reproduction 2013, 145, 255–263. [Google Scholar] [CrossRef] [Green Version]
  20. Děd, L.; Dostálová, P.; Dorosh, A.; Dvořáková-Hortová, K.; Pěknicová, J. Effect of estrogens on boar sperm capacitation in vitro. Reprod. Biol. Endocrinol. 2010, 8. [Google Scholar] [CrossRef] [Green Version]
  21. Peknicová, J.; Kyselová, V.; Boubelík, M.; Buckiová, D. Effect of an endocrine disruptor on mammalian fertility. Application of monoclonal antibodies against sperm proteins as markers for testing sperm damage. Am. J. Reprod. Immunol. 2002, 47, 311–318. [Google Scholar] [CrossRef]
  22. Baldi, E.; Luconi, M.; Muratori, M.; Marchiani, S.; Tamburrino, L.; Forti, G. Nongenomic activation of spermatozoa by steroid hormones: Facts and fictions. Mol. Cell. Endocrinol. 2009, 308, 39–46. [Google Scholar] [CrossRef] [PubMed]
  23. Sebkova, N.; Cerna, M.; Ded, L.; Peknicova, J.; Dvorakova-Hortova, K. The slower the better: How sperm capacitation and acrosome reaction is modified in the presence of estrogens. Reproduction 2012, 143, 297–307. [Google Scholar] [CrossRef] [PubMed] [Green Version]
  24. Dvořáková-Hortová, K.; Honetschlägerová, M.; Tesařová, E.; Vašinová, J.; Frolíková, M.; Bosáková, Z. Residual concentration of estriol during mouse sperm capacitation in vitro determined by HPLC method. Folia Zool. 2009, 58, 75–81. [Google Scholar]
  25. Kozlik, P.; Bosakova, Z.; Tesarova, E.; Coufal, P.; Cabala, R. Development of a solid-phase extraction with capillary liquid chromatography tandem mass spectrometry for analysis of estrogens in environmental water samples. J. Chromatogr. A 2011, 1218, 2127–2132. [Google Scholar] [CrossRef] [PubMed]
  26. Bosakova, T.; Tockstein, A.; Sebkova, N.; Simonik, O.; Adamusova, H.; Albrechtova, J.; Albrecht, T.; Bosakova, Z.; Dvorakova-Hortova, K. New insight into sperm capacitation: A novel mechanism of 17β-estradiol signalling. Int. J. Mol. Sci. 2018, 19, 4011. [Google Scholar] [CrossRef] [PubMed] [Green Version]
  27. Bosakova, Z.; Tockstein, A.; Adamusova, H.; Coufal, P.; Sebkova, N.; Dvorakova-Hortova, K. Kinetic analysis of decreased sperm fertilizing ability by fluorides and fluoroaluminates: A tool for analyzing the effect of environmental substances on biological events. Eur. Biophys. J. 2016, 45, 71–79. [Google Scholar] [CrossRef]
  28. Davis, B.K.; Byrne, R.; Hungund, B. Studies on the mechanism of capacitation. II Evidence for lipid transfer between plasma membrane of rat sperm and serum albumin during capacitation in vitro. J. Chromatogr. B 1979, 558, 257–266. [Google Scholar] [CrossRef]
  29. Dow, M.P.D.; Bavister, B.D. Direct contact is required between serum albumin and hamster spermatozoa for capacitation in vitro. Gamete Res. 1989, 23, 171–180. [Google Scholar] [CrossRef]
  30. Romeu, A.M.; Martino, E.E.; Stoppani, A.O. Structural requirements for the action of steroids as quenchers of albumin fluorescence. Biochim. Biophys. Acta 1975, 409, 376–386. [Google Scholar] [CrossRef]
Figure 1. Dependencies of the concentration of the overall unbound 17α-ethynylestradiol (EE2) on the time of mouse sperm capacitation in vitro. The tested concentrations of EE2 in the capacitating medium were (A) 200 μg/L, (B) 20 μg/L, and (C) 2 μg/L. The samples were prepared in three parallel sets, where each set represented sperm collected from one individual (dots). The blanks were prepared and measured in parallel (triangles). Experimental conditions: 50/50 (v/v) acetronitrile (ACN)/H2O, both containing 0.1% formic acid (HCOOH), measured in the multiple reaction monitoring (MRM) mode for transition 279.1 → 133.0; the error bars were calculated using the standard deviations (n’ = 3).
Catalysts 10 00124 g001
Figure 2. Simplified process of the interaction between hormone and sperm receptor, where EE2 is the extracellular hormone, R is the active sperm receptor, EE2-R is the adduct, EE2i is the internal unbound hormone and R’ is the inactive sperm receptor; 1 and 2 represent rate constants of the non-autocatalytic (1) and autocatalytic (2) formation of EE2-R which are ongoing simultaneously, 3 and 5 represent rate constants of adduct decomposition, and 4 represents the rate constant of the back reaction.
Catalysts 10 00124 g002
Figure 3. Theoretical shape of the B(t) curves obtained by integration of the kinetic equations for the selected concentrations (A) 200 μg/L, (B) 20 μg/L, and (C) 2 μg/L, molar ratios n, and optimized values of K1K5 (see Table 3) with designation of the Bt points obtained in the experiment (see Table 2).
Catalysts 10 00124 g003aCatalysts 10 00124 g003b
Table 1. Relative concentration Bt calculated from the means of measured EE2 time-dependent concentrations C (n’ = 3) obtained during capacitation for three tested EE2 concentrations (see Figure 1).
Capacitation Time (min) Bt
200 μg/L20 μg/L2 μg/L
01.0001.0001.000
300.9830.9530.914
600.9660.9200.856
900.9720.9560.881
1200.9900.9830.909
1500.9940.9960.926
1801.0001.0000.946
Table 2. Calculated constants for three tested EE2 concentrations, where C is the tested concentration, n is the molar ratio, K1K5 are the overall rate constants, K0 is the basic rate constant of the first step in the formation of the adduct, and R0 is the number of total receptors.
C (μg/L)K1 = K0/nK2K3’ = (K3 + K5)/R0K4K5’ = K5/R0nK0 = K1·n
2000.029104912202.440.0725
200.098104912200.7700.0734
20.270104912200.2650.0715
Table 3. Validation parameters for intra-day and inter-day accuracy and precision (n’ = 5).
C (Theoretical) (μg/L)Intra-Day (μg/L)Accuracy (%)Precision (%)Inter-Day (μg/L)Accuracy (%)Precision (%)
200202.1 ± 0.2101.11.07203.3 ± 0.4101.61.63
2019.9 ± 0.0199.50.5519.8 ± 0.199.10.90
21.9 ± 0.0197.03.001.91 ± 0.0495.54.50

