
Prognostic Value of Comorbidity for Patients with Upper Tract Urothelial Carcinoma after Radical Nephroureterectomy

 ,
,
Abstract
:Simple Summary
Abstract
1. Introduction
2. Materials and Methods
2.1. Study Population
2.2. Adult Comorbidity Evaluation-27
2.3. Postoperative Follow-Up
2.4. Statistical Analyses
3. Results
3.1. Clinicopathological Characteristics of Patients
3.2. ACE-27 Comorbidity and Survival
3.3. Cox Regression Analysis of Clinical Outcomes
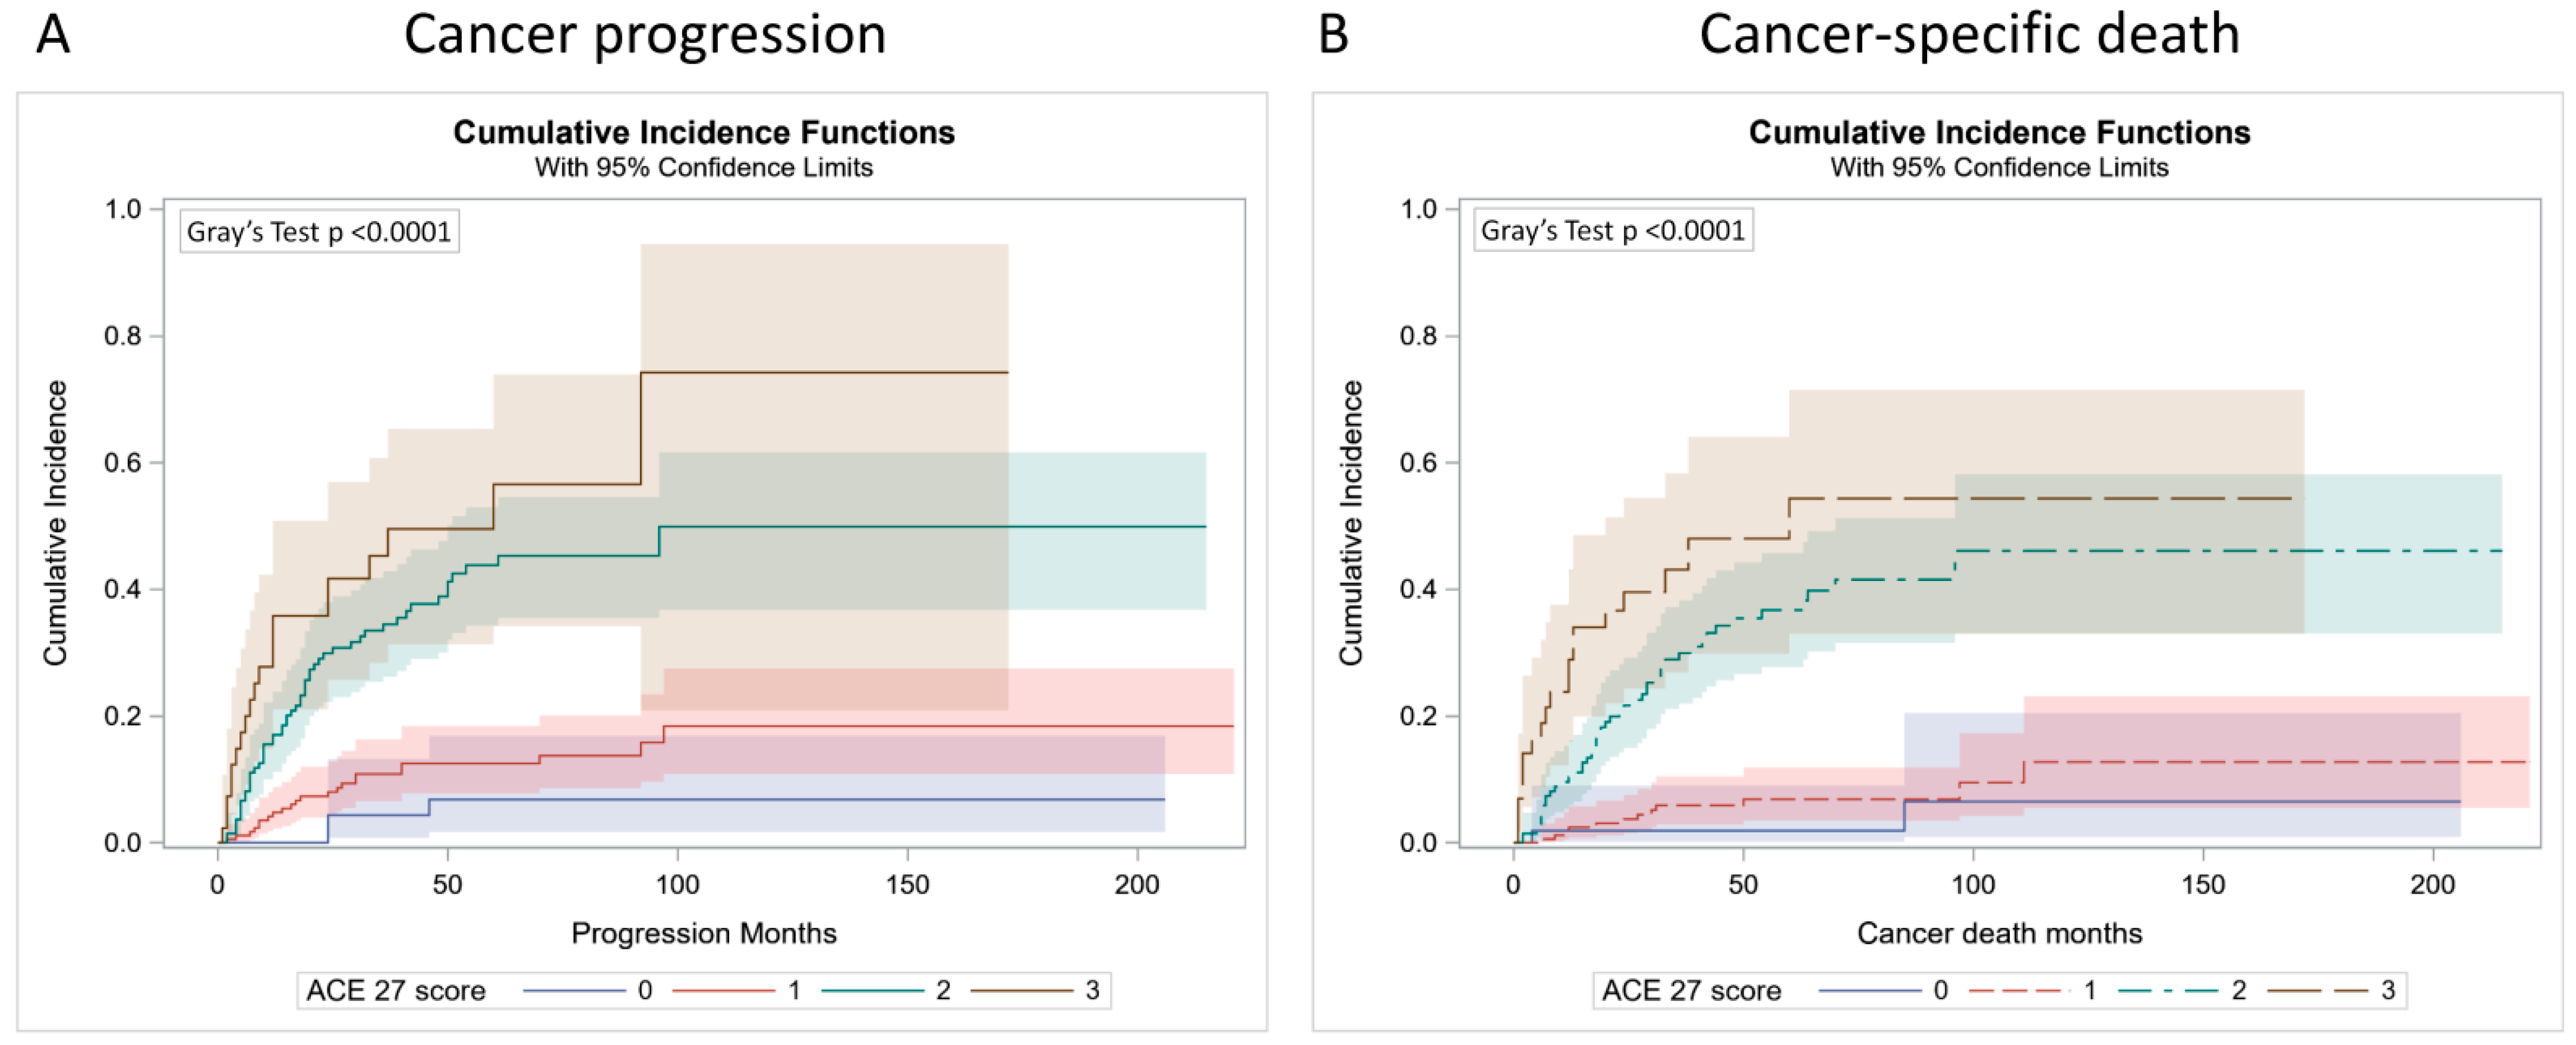
3.4. Competing Risk Analysis of Clinical Outcomes
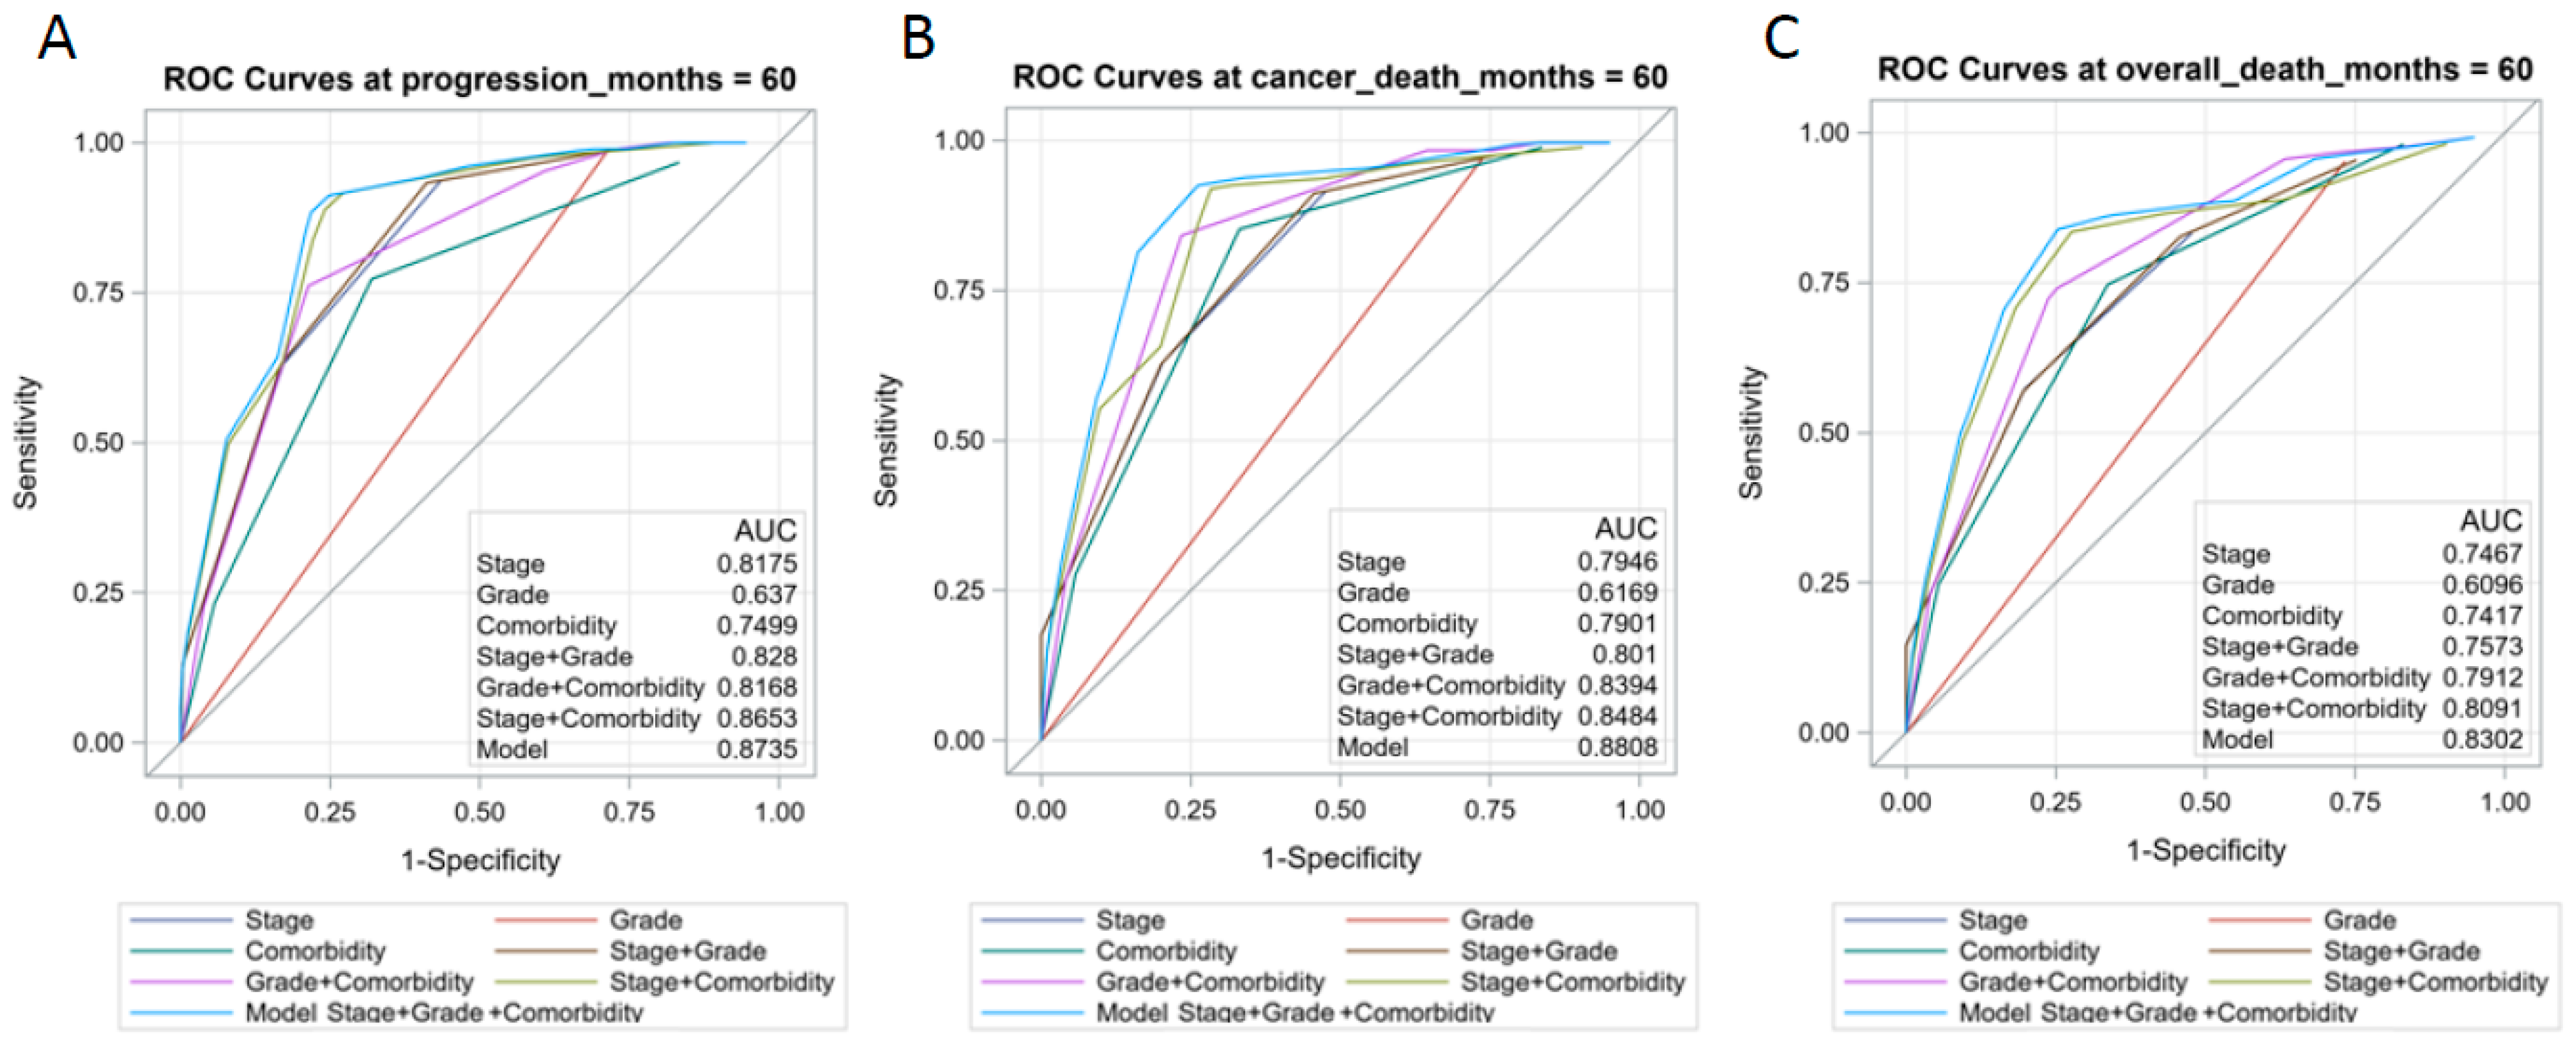
3.5. Establish a Prognostic Model
4. Discussion
5. Conclusions
Supplementary Materials
Author Contributions
Funding
Institutional Review Board Statement
Informed Consent Statement
Data Availability Statement
Conflicts of Interest
References
- Siegel, R.L.; Miller, K.D.; Fuchs, H.E.; Jemal, A. Cancer Statistics, 2021. CA Cancer J. Clin. 2021, 71, 7–33. [Google Scholar] [CrossRef] [PubMed]
- Roupret, M.; Babjuk, M.; Burger, M.; Capoun, O.; Cohen, D.; Comperat, E.M.; Cowan, N.C.; Dominguez-Escrig, J.L.; Gontero, P.; Hugh Mostafid, A.; et al. European Association of Urology Guidelines on Upper Urinary Tract Urothelial Carcinoma: 2020 Update. Eur. Urol. 2021, 79, 62–79. [Google Scholar] [CrossRef] [PubMed]
- Soria, F.; Shariat, S.F.; Lerner, S.P.; Fritsche, H.M.; Rink, M.; Kassouf, W.; Spiess, P.E.; Lotan, Y.; Ye, D.; Fernandez, M.I.; et al. Epidemiology, diagnosis, preoperative evaluation and prognostic assessment of upper-tract urothelial carcinoma (UTUC). World J. Urol. 2017, 35, 379–387. [Google Scholar] [CrossRef] [PubMed]
- Lughezzani, G.; Burger, M.; Margulis, V.; Matin, S.F.; Novara, G.; Roupret, M.; Shariat, S.F.; Wood, C.G.; Zigeuner, R. Prognostic factors in upper urinary tract urothelial carcinomas: A comprehensive review of the current literature. Eur. Urol. 2012, 62, 100–114. [Google Scholar] [CrossRef]
- Hassler, M.R.; Bray, F.; Catto, J.W.F.; Grollman, A.P.; Hartmann, A.; Margulis, V.; Matin, S.F.; Roupret, M.; Sfakianos, J.P.; Shariat, S.F.; et al. Molecular Characterization of Upper Tract Urothelial Carcinoma in the Era of Next-generation Sequencing: A Systematic Review of the Current Literature. Eur. Urol. 2020, 78, 209–220. [Google Scholar] [CrossRef]
- Robinson, B.D.; Vlachostergios, P.J.; Bhinder, B.; Liu, W.; Li, K.; Moss, T.J.; Bareja, R.; Park, K.; Tavassoli, P.; Cyrta, J.; et al. Upper tract urothelial carcinoma has a luminal-papillary T-cell depleted contexture and activated FGFR3 signaling. Nat. Commun. 2019, 10, 2977. [Google Scholar] [CrossRef] [Green Version]
- Bagrodia, A.; Cha, E.K.; Sfakianos, J.P.; Zabor, E.C.; Bochner, B.H.; Al-Ahmadie, H.A.; Solit, D.B.; Coleman, J.A.; Iyer, G.; Scott, S.N.; et al. Genomic Biomarkers for the Prediction of Stage and Prognosis of Upper Tract Urothelial Carcinoma. J. Urol. 2016, 195, 1684–1689. [Google Scholar] [CrossRef] [PubMed] [Green Version]
- van Doeveren, T.; van der Mark, M.; van Leeuwen, P.J.; Boormans, J.L.; Aben, K.K.H. Rising incidence rates and unaltered survival rates for primary upper urinary tract urothelial carcinoma: A Dutch population-based study from 1993 to 2017. BJU Int. 2021, 128, 343–351. [Google Scholar] [CrossRef] [PubMed]
- Raman, J.D.; Messer, J.; Sielatycki, J.A.; Hollenbeak, C.S. Incidence and survival of patients with carcinoma of the ureter and renal pelvis in the USA, 1973–2005. BJU Int. 2011, 107, 1059–1064. [Google Scholar] [CrossRef]
- Yates, J.W. Comorbidity considerations in geriatric oncology research. CA Cancer J. Clin. 2001, 51, 329–336. [Google Scholar] [CrossRef] [Green Version]
- Sarfati, D.; Koczwara, B.; Jackson, C. The impact of comorbidity on cancer and its treatment. CA Cancer J. Clin. 2016, 66, 337–350. [Google Scholar] [CrossRef] [PubMed]
- Piccirillo, J.F.; Tierney, R.M.; Costas, I.; Grove, L.; Spitznagel, E.L., Jr. Prognostic importance of comorbidity in a hospital-based cancer registry. JAMA 2004, 291, 2441–2447. [Google Scholar] [CrossRef] [PubMed] [Green Version]
- Satariano, W.A.; Silliman, R.A. Comorbidity: Implications for research and practice in geriatric oncology. Crit. Rev. Oncol. Hematol. 2003, 48, 239–248. [Google Scholar] [CrossRef] [PubMed]
- Sogaard, M.; Thomsen, R.W.; Bossen, K.S.; Sorensen, H.T.; Norgaard, M. The impact of comorbidity on cancer survival: A review. Clin. Epidemiol. 2013, 5, 3–29. [Google Scholar] [CrossRef] [PubMed] [Green Version]
- Boakye, D.; Jansen, L.; Schneider, M.; Chang-Claude, J.; Hoffmeister, M.; Brenner, H. Personalizing the Prediction of Colorectal Cancer Prognosis by Incorporating Comorbidities and Functional Status into Prognostic Nomograms. Cancers 2019, 11, 1435. [Google Scholar] [CrossRef] [Green Version]
- Wong, M.L.; McMurry, T.L.; Schumacher, J.R.; Hu, C.Y.; Stukenborg, G.J.; Francescatti, A.B.; Greenberg, C.C.; Chang, G.J.; McKellar, D.P.; Walter, L.C.; et al. Comorbidity Assessment in the National Cancer Database for Patients with Surgically Resected Breast, Colorectal, or Lung Cancer (AFT-01, -02, -03). J. Oncol. Pract. 2018, 14, e631–e643. [Google Scholar] [CrossRef]
- de Boer, A.Z.; Bastiaannet, E.; Putter, H.; Marang-van de Mheen, P.J.; Siesling, S.; de Munck, L.; de Ligt, K.M.; Portielje, J.E.A.; Liefers, G.J.; de Glas, N.A. Prediction of Other-Cause Mortality in Older Patients with Breast Cancer Using Comorbidity. Cancers 2021, 13, 1627. [Google Scholar] [CrossRef]
- Daskivich, T.J.; Thomas, I.C.; Luu, M.; Shelton, J.B.; Makarov, D.V.; Skolarus, T.A.; Leppert, J.T. External Validation of the Prostate Cancer Specific Comorbidity Index: A Claims Based Tool for the Prediction of Life Expectancy in Men with Prostate Cancer. J. Urol. 2019, 202, 518–524. [Google Scholar] [CrossRef]
- Whitney, C.A.; Howard, L.E.; Freedland, S.J.; DeHoedt, A.M.; Amling, C.L.; Aronson, W.J.; Cooperberg, M.R.; Kane, C.J.; Terris, M.K.; Daskivich, T.J. Impact of age, comorbidity, and PSA doubling time on long-term competing risks for mortality among men with non-metastatic castration-resistant prostate cancer. Prostate Cancer Prostatic. Dis. 2019, 22, 252–260. [Google Scholar] [CrossRef]
- Williams, S.B.; Kamat, A.M.; Chamie, K.; Froehner, M.; Wirth, M.P.; Wiklund, P.N.; Black, P.C.; Steinberg, G.D.; Boorjian, S.A.; Daneshmand, S.; et al. Systematic Review of Comorbidity and Competing-risks Assessments for Bladder Cancer Patients. Eur. Urol. Oncol. 2018, 1, 91–100. [Google Scholar] [CrossRef]
- Berod, A.A.; Colin, P.; Yates, D.R.; Ouzzane, A.; Audouin, M.; Adam, E.; Arroua, F.; Marchand, C.; Bigot, P.; Soulie, M.; et al. The role of American Society of Anesthesiologists scores in predicting urothelial carcinoma of the upper urinary tract outcome after radical nephroureterectomy: Results from a national multi-institutional collaborative study. BJU Int. 2012, 110, E1035–E1040. [Google Scholar] [CrossRef] [PubMed]
- Austin, P.C.; Fine, J.P. Practical recommendations for reporting Fine-Gray model analyses for competing risk data. Stat. Med. 2017, 36, 4391–4400. [Google Scholar] [CrossRef] [PubMed]
- Dignam, J.J.; Zhang, Q.; Kocherginsky, M. The use and interpretation of competing risks regression models. Clin. Cancer Res. 2012, 18, 2301–2308. [Google Scholar] [CrossRef] [PubMed] [Green Version]
- Garg, T.; Young, A.J.; Kost, K.A.; Danella, J.F.; Larson, S.; Nielsen, M.E.; Kirchner, H.L. Burden of Multiple Chronic Conditions among Patients with Urological Cancer. J. Urol. 2018, 199, 543–550. [Google Scholar] [CrossRef] [PubMed]
- Lenis, A.T.; Lec, P.M.; Chamie, K.; Mshs, M.D. Bladder Cancer: A Review. JAMA 2020, 324, 1980–1991. [Google Scholar] [CrossRef] [PubMed]
- Fairey, A.S.; Jacobsen, N.E.; Chetner, M.P.; Mador, D.R.; Metcalfe, J.B.; Moore, R.B.; Rourke, K.F.; Todd, G.T.; Venner, P.M.; Voaklander, D.C.; et al. Associations between comorbidity, and overall survival and bladder cancer specific survival after radical cystectomy: Results from the Alberta Urology Institute Radical Cystectomy database. J. Urol. 2009, 182, 85–92. [Google Scholar] [CrossRef] [PubMed]
- Megwalu, I.I.; Vlahiotis, A.; Radwan, M.; Piccirillo, J.F.; Kibel, A.S. Prognostic impact of comorbidity in patients with bladder cancer. Eur. Urol. 2008, 53, 581–589. [Google Scholar] [CrossRef] [Green Version]
- Koppie, T.M.; Serio, A.M.; Vickers, A.J.; Vora, K.; Dalbagni, G.; Donat, S.M.; Herr, H.W.; Bochner, B.H. Age-adjusted Charlson comorbidity score is associated with treatment decisions and clinical outcomes for patients undergoing radical cystectomy for bladder cancer. Cancer 2008, 112, 2384–2392. [Google Scholar] [CrossRef]
- Eisenberg, M.S.; Boorjian, S.A.; Cheville, J.C.; Thompson, R.H.; Thapa, P.; Kaushik, D.; Frank, I. The SPARC score: A multifactorial outcome prediction model for patients undergoing radical cystectomy for bladder cancer. J. Urol. 2013, 190, 2005–2010. [Google Scholar] [CrossRef] [PubMed]
- Yap, S.A.; Schupp, C.W.; Chamie, K.; Evans, C.P.; Koppie, T.M. Effect of age on transitional cell carcinoma of the upper urinary tract: Presentation, treatment, and outcomes. Urology 2011, 78, 87–92. [Google Scholar] [CrossRef]
- Shariat, S.F.; Godoy, G.; Lotan, Y.; Droller, M.; Karakiewicz, P.I.; Raman, J.D.; Isbarn, H.; Weizer, A.; Remzi, M.; Roscigno, M.; et al. Advanced patient age is associated with inferior cancer-specific survival after radical nephroureterectomy. BJU Int. 2010, 105, 1672–1677. [Google Scholar] [CrossRef] [PubMed]
- Yuan, Y.; Wang, Y.; Zhang, N.; Mao, X.; Huang, Y.; Huang, J.; Ji, N. Influence of American Society of Anesthesiologists Score on Oncologic Outcomes in Patients with Upper Tract Urothelial Carcinoma After Radical Nephroureterectomy: A Large-Sample Study in Two Institutions. Front. Oncol. 2021, 11, 723669. [Google Scholar] [CrossRef] [PubMed]
- Martinez-Salamanca, J.I.; Shariat, S.F.; Rodriguez, J.C.; Chromecki, T.F.; Ficarra, V.; Fritsche, H.M.; Kassouf, W.; Matsumoto, K.; Cabello, L.O.; Seitz, C.; et al. Prognostic role of ECOG performance status in patients with urothelial carcinoma of the upper urinary tract: An international study. BJU Int. 2012, 109, 1155–1161. [Google Scholar] [CrossRef] [PubMed] [Green Version]
- Bagrodia, A.; Kuehhas, F.E.; Gayed, B.A.; Wood, C.G.; Raman, J.D.; Kapur, P.; Derweesh, I.H.; Bensalah, K.; Sagalowsky, A.I.; Shariat, S.F.; et al. Comparative analysis of oncologic outcomes of partial ureterectomy vs radical nephroureterectomy in upper tract urothelial carcinoma. Urology 2013, 81, 972–977. [Google Scholar] [CrossRef] [PubMed]
- Aziz, A.; Fritsche, H.M.; Gakis, G.; Kluth, L.A.; Hassan, F.; Engel, O.; Dahlem, R.; Otto, W.; Gierth, M.; Denzinger, S.; et al. Comparative analysis of comorbidity and performance indices for prediction of oncological outcomes in patients with upper tract urothelial carcinoma who were treated with radical nephroureterectomy. Urol. Oncol. 2014, 32, 1141–1150. [Google Scholar] [CrossRef] [PubMed]
- Sarfati, D. Review of methods used to measure comorbidity in cancer populations: No gold standard exists. J. Clin. Epidemiol. 2012, 65, 924–933. [Google Scholar] [CrossRef] [PubMed]
- Sinha, P.; Kallogjeri, D.; Piccirillo, J.F. Assessment of comorbidities in surgical oncology outcomes. J. Surg. Oncol. 2014, 110, 629–635. [Google Scholar] [CrossRef] [PubMed]
- Kallogjeri, D.; Piccirillo, J.F.; Spitznagel, E.L., Jr.; Steyerberg, E.W. Comparison of Scoring Methods for ACE-27: Simpler Is Better. J. Geriatr. Oncol. 2012, 3, 238–245. [Google Scholar] [CrossRef] [PubMed] [Green Version]


| Total Patients (n = 409) | ACE-27, None (n = 53) | ACE-27, Mild (n = 174) | ACE-27, Moderate (n = 139) | ACE-27, Severe (n = 43) | p Value | |
|---|---|---|---|---|---|---|
| Age, (years) | ||||||
| ≤65, | 182 (44.5) | 33 (62.3) | 72 (41.4) | 62 (44.6) | 15 (34.9) | |
| >65 | 227 (55.5) | 20 (37.7) | 102 (58.6) | 77 (55.4) | 28 (65.1) | 0.0284 * |
| Sex | ||||||
| Female | 226 (55.3) | 30 (56.6) | 88 (50.6) | 84 (60.4) | 24 (55.8) | |
| Male | 183 (44.7) | 23 (43.4) | 86 (49.4) | 55 (39.6) | 19 (44.2) | 0.3776 |
| Side | ||||||
| Right | 186 (45.5) | 23 (43.4) | 82 (47.1) | 58 (41.7) | 23 (53.5) | |
| Left | 223 (54.5) | 30 (56.6) | 92 (52.9) | 81 (58.3) | 20 (46.5) | 0.5349 |
| Tumor location | ||||||
| Renal pelvis | 213 (52.1) | 28 (52.8) | 91 (52.3) | 74 (53.2) | 20 (46.5) | |
| Ureter | 196 (47.9) | 25 (47.2) | 83 (47.7) | 65 (46.8) | 23 (53.5) | 0.8909 |
| Mutifocality | ||||||
| No | 323 (79.0) | 49 (92.5) | 140 (80.5) | 99 (71.2) | 35 (81.4) | |
| Yes | 86 (21.0) | 4 (7.5) | 34 (19.5) | 40 (28.8) | 8 (18.6) | 0.0106 * |
| Type op RNU | ||||||
| Open | 294 (71.9) | 40 (75.5) | 120 (69.0) | 103 (74.1) | 31 (72.1) | |
| Laparoscopy | 115 (28.1) | 13 (24.5) | 54 (31.0) | 36 (25.9) | 12 (27.9) | 0.7033 |
| Tumor stage (pT) | ||||||
| 1 | 175 (42.8) | 31 (58.5) | 82 (47.1) | 50 (36.0) | 12 (27.9) | |
| 2 | 112 (27.4) | 10 (18.9) | 49 (28.2) | 39 (28.1) | 14 (32.6) | |
| 3 | 106 (25.9) | 12 (22.6) | 42 (24.1) | 42 (30.2) | 10 (23.3) | |
| 4 | 16 (3.9) | 0 (0.0) | 1 (0.6) | 8 (5.8) | 7 (16.3) | <0.0001 * |
| Tumor grade | ||||||
| Low | 86 (21.0) | 18 (34.0) | 36 (20.7) | 26 (18.7) | 6 (14.0) | |
| High | 323 (79.0) | 35 (66.0) | 138 (79.3) | 113 (81.3) | 37 (86.0) | 0.0688 |
| Event/Total Patients, % | Person-Months | Incidence Rate (95% CI) per 1000 Person-Months | Crude HR (95% CI) | p Value | Adjusted HR (95% CI) | p Value | Adjusted (Selection) HR (95% CI) | p Value | |
|---|---|---|---|---|---|---|---|---|---|
| Age, (years) | |||||||||
| ≤65, | 49/182, 26.92 | 10,553 | 4.64 (4.56–4.73) | 1.00 | 1.00 | ||||
| >65 | 51/227, 22.47 | 11,079 | 4.60 (4.52–4.69) | 0.88 (0.59–1.30) | 0.5184 | 0.72 (0.48–1.08) | 0.1081 | ||
| Sex | |||||||||
| Female | 59/226, 26.11 | 11,575 | 5.10 (5.01–5.19) | 1.00 | 1.00 | ||||
| Male | 41/183, 22.40 | 10,057 | 4.08 (4.00–4.16) | 0.84 (0.56–1.25) | 0.3825 | 0.74 (0.49–1.11) | 0.1470 | ||
| Side | |||||||||
| Right | 49/186, 26.34 | 10,066 | 4.87 (4.77–4.96) | 1.00 | 1.00 | ||||
| Left | 51/223, 22.87 | 11,566 | 4.41 (4.33–4.49) | 0.89 (0.60–1.32) | 0.5776 | 0.86 (0.57–1.29) | 0.4532 | ||
| Tumor location | |||||||||
| Renal pelvis | 47/213, 22.07 | 11,801 | 3.98 (3.91–4.06) | 1.00 | 1.00 | ||||
| Ureter | 53/196, 27.04 | 9831 | 5.39 (5.29–5.50) | 1.29 (0.87–1.91) | 0.2009 | 1.57 (1.01–2.43) | 0.0440 | ||
| Mutifocality | |||||||||
| No | 72/323, 22.29 | 17,010 | 4.23 (4.17–4.30) | 1.00 | 1.00 | 1.00 | |||
| Yes | 28/86, 32.56 | 4622 | 6.06 (5.89–6.24) | 1.66 (1.07–2.57) | 0.0232 * | 1.18 (0.71–1.95) | 0.5217 | 0.99 (0.62–1.58) | 0.9733 |
| Type op RNU | |||||||||
| Open | 68/294, 23.13 | 15,990 | 4.25 (4.19–4.32) | 1.00 | 1.00 | ||||
| Laparoscopy | 32/115, 27.83 | 5642 | 5.67 (5.53–5.82) | 1.20 (0.79–1.82) | 0.4023 | 1.20 (0.77–1.84) | 0.4205 | ||
| Tumor stage (pT) | |||||||||
| 1 | 8/175, 4.57 | 11,727 | 0.68 (0.67–0.69) | 1.00 | 1.00 | 1.00 | |||
| 2 | 30/112, 26.79 | 5791 | 5.18 (5.05–5.32) | 6.87 (3.15–14.99) | <0.0001 * | 3.74 (1.66–8.46) | 0.0015 * | 3.73 (1.68–8.32) | 0.0013 * |
| 3 | 49/106, 46.23 | 3963 | 12.36 (11.99–12.76) | 15.01 (7.09–31.78) | <0.0001 * | 8.38 (3.81–18.41) | <0.0001 * | 7.60 (3.50–16.49) | <0.0001 * |
| 4 | 13/16, 81.25 | 151 | 86.09 (73.4–100.98) | 72.61 (29.36–179.56) | <0.0001 * | 21.69 (8.30–56.72) | <0.0001 * | 21.18 (8.22–54.62) | <0.0001 * |
| Tumor grade | |||||||||
| Low | 1/86, 1.16 | 6409 | 0.16 (0.15–0.16) | 1.00 | 1.00 | 1.00 | |||
| High | 99/323, 30.65 | 15,223 | 6.50 (6.40–6.61) | 33.42 (4.66–239.73) | 0.0005 * | 8.91 (1.15–68.86) | 0.0360 * | 9.61 (1.26–73.26) | 0.0289 * |
| ACE-27 Comorbidity | |||||||||
| None, 0 | 3/53, 5.66 | 4255 | 0.71 (0.68–0.73) | 1.00 | 1.00 | 1.00 | |||
| Mild, 1 | 22/174, 12.64 | 10,266 | 2.14 (2.10–2.18) | 2.54 (0.76–8.48) | 0.1308 | 2.28 (0.68–7.68) | 0.1832 | 2.25 (0.67–7.54) | 0.1904 |
| Moderate, 2 | 54/139, 38.85 | 5929 | 9.11 (8.88–9.34) | 9.56 (2.98–30.66) | 0.0001 * | 6.59 (2.02–21.49) | 0.0018 * | 6.97 (2.14–22.69) | 0.0013 * |
| Severe, 3 | 21/43, 48.84 | 1182 | 17.77 (16.78–18.81) | 17.11 (5.07–57.68) | <0.0001 * | 12.41 (3.59–42.84) | <0.0001 * | 11.58 (3.40–39.47) | <0.0001 * |
| Event/Total Patients, % | Person-Months | Incidence Rate (95% CI) per 1000 Person-Months | Crude HR (95% CI) | p Value | Adjusted HR (95% CI) | p Value | Adjusted (Selection) HR (95% CI) | p Value | |
|---|---|---|---|---|---|---|---|---|---|
| Age, (years) | |||||||||
| ≤65, | 42/182, 23.08 | 11,320 | 3.71 (3.64–3.78) | 1.00 | 1.00 | ||||
| >65 | 38/227, 16.74 | 11,652 | 3.26 (3.20–3.32) | 0.79 (0.51–1.22) | 0.2862 | 0.62 (0.39–0.98) | 0.0413 | ||
| Sex | |||||||||
| Female | 45/226, 19.91 | 12,472 | 3.61 (3.55–3.67) | 1.00 | 1.00 | ||||
| Male | 35/183, 19.13 | 10,500 | 3.33 (3.27–3.40) | 0.94 (0.61–1.47) | 0.7985 | 0.91 (0.58–1.45) | 0.6972 | ||
| Side | |||||||||
| Right | 38/186, 20.43 | 10,532 | 3.61 (3.54–3.68) | 1.00 | 1.00 | ||||
| Left | 42/223, 18.83 | 12,440 | 3.38 (3.32–3.44) | 0.93 (0.6–1.45) | 0.7592 | 0.87 (0.55–1.36) | 0.5342 | ||
| Tumor location | |||||||||
| Renal pelvis | 37/213, 17.37 | 12,328 | 3.00 (2.95–3.05) | 1.00 | 1.00 | ||||
| Ureter | 43/196, 21.94 | 10,644 | 4.04 (3.96–4.12) | 1.32 (0.85–2.04) | 0.2214 | 1.60 (0.98–2.60) | 0.0597 | ||
| Mutifocality | |||||||||
| No | 55/323, 17.03 | 18,086 | 3.04 (3.00–3.09) | 1.00 | 1.00 | 1.00 | |||
| Yes | 25/86, 29.07 | 4886 | 5.12 (4.98–5.26) | 1.87 (1.16–3.00) | 0.0095 * | 1.43 (0.83–2.48) | 0.1975 | 1.14 (0.69–1.89) | 0.6011 |
| Type op RNU | |||||||||
| Open | 59/294, 20.07 | 16,849 | 3.50 (3.45–3.55) | 1.00 | 1.00 | ||||
| Laparoscopy | 21/115, 18.26 | 6123 | 3.43 (3.34–3.52) | 0.89 (0.54–1.46) | 0.6435 | 0.93 (0.56–1.54) | 0.7781 | ||
| Tumor stage (pT) | |||||||||
| 1 | 9/175, 5.14 | 12,111 | 0.74 (0.73–0.76) | 1.00 | 1.00 | 1.00 | |||
| 2 | 22/112, 19.64 | 5956 | 3.69 (3.60–3.79) | 4.51 (2.07–9.80) | 0.0001 * | 2.59 (1.13–5.95) | 0.0247 * | 2.70 (1.20–6.10) | 0.01670 |
| 3 | 37/106, 34.91 | 4733 | 7.82 (7.6–8.04) | 9.16 (4.41–19.04) | <0.0001 * | 4.65 (2.10–10.29) | 0.0002 * | 4.72 (2.16–10.27) | <0.0001 * |
| 4 | 12/16, 75.00 | 172 | 69.77 (60.08–81.01) | 58.43 (23.73–143.88) | <0.0001 * | 15.43 (5.85–40.70) | <0.0001 * | 16.00 (6.13–41.8) | <0.0001 * |
| Tumor grade | |||||||||
| Low | 2/86, 2.33 | 6483 | 0.31 (0.30–0.32) | 1.00 | 1.00 | ||||
| High | 78/323, 24.15 | 16,489 | 4.73 (4.66–4.80) | 12.78 (3.14–52.06) | 0.0004 * | 4.60 (1.02–20.78) | 0.0475 * | 4.45 (1.00–19.88) | 0.0504 |
| ACE-27 Comorbidity | |||||||||
| None, 0 | 2/53, 3.77 | 4342 | 0.46 (0.45–0.47) | 1.00 | 1.00 | 1.00 | |||
| Mild, 1 | 12/174, 6.9 | 10,781 | 1.11 (1.09–1.13) | 2.07 (0.46–9.24) | 0.342 | 1.86 (0.41–8.37) | 0.4178 | 1.81 (0.40–8.12) | 0.4386 |
| Moderate, 2 | 47/139, 33.81 | 6506 | 7.22 (7.05–7.40) | 12.26 (2.97–50.61) | 0.0005 * | 8.59 (2.04–36.11) | 0.0033 * | 8.82 (2.10–36.94) | 0.0029 * |
| Severe, 3 | 19/43, 44.19 | 1343 | 14.15 (13.41–14.92) | 22.4 (5.19–96.58) | <0.0001 * | 15.94 (3.63–70.03) | 0.0002 * | 13.90 (3.19–60.48) | 0.0005 * |
| Event/Total Patients, % | Person-Months | Incidence Rate (95% CI) per 1000 Person-Months | Crude HR (95% CI) | p Value | Adjusted HR (95% CI) | p Value | Adjusted (Selection) HR (95% CI) | p Value | |
|---|---|---|---|---|---|---|---|---|---|
| Age, (years) | |||||||||
| ≤65, | 46/182, 25.27 | 11,320 | 4.06 (3.99–4.14) | 1.00 | 1.00 | ||||
| >65 | 51/227, 22.47 | 11,652 | 4.38 (4.30–4.46) | 0.97 (0.65–1.45) | 0.8858 | 0.78 (0.52–1.18) | 0.2459 | ||
| Sex | |||||||||
| Female | 55/226, 24.34 | 12,472 | 4.41 (4.33–4.49) | 1.00 | 1.00 | ||||
| Male | 42/183, 22.95 | 10,500 | 4.00 (3.92–4.08) | 0.93 (0.62–1.39) | 0.7173 | 0.87 (0.58–1.32) | 0.5247 | ||
| Side | |||||||||
| Right | 46/186, 24.73 | 10,532 | 4.37 (4.29–4.45) | 1.00 | 1.00 | ||||
| Left | 51/223, 22.87 | 12,440 | 4.10 (4.03–4.17) | 0.94 (0.63–1.41) | 0.7739 | 0.88 (0.58–1.32) | 0.5217 | ||
| Tumor location | |||||||||
| Renal pelvis | 43/213, 20.19 | 12,328 | 3.49 (3.43–3.55) | 1.00 | 1.00 | ||||
| Ureter | 54/196, 27.55 | 10,644 | 5.07 (4.98–5.17) | 1.42 (0.95–2.12) | 0.0881 | 1.70 (1.10–2.64) | 0.0175 | ||
| Mutifocality | |||||||||
| No | 70/323, 21.67 | 18,086 | 3.87 (3.81–3.93) | 1.00 | 1.00 | 1.00 | |||
| Yes | 27/86, 31.40 | 4886 | 5.53 (5.37–5.68) | 1.59 (1.02–2.49) | 0.0398 * | 1.31 (0.79–2.17) | 0.2983 | 1.06 (0.67–1.69) | 0.8023 |
| Type op RNU | |||||||||
| Open | 74/294, 25.17 | 16,849 | 4.39 (4.33–4.46) | 1.00 | 1.00 | ||||
| Laparoscopy | 23/115, 20.00 | 6123 | 3.76 (3.66–3.85) | 0.77 (0.48–1.24) | 0.2842 | 0.79 (0.49–1.27) | 0.3337 | ||
| Tumor stage (pT) | |||||||||
| 1 | 18/175, 10.29 | 12,111 | 1.49 (1.46–1.51) | 1.00 | 1.00 | 1.00 | |||
| 2 | 25/112, 22.32 | 5956 | 4.20 (4.09–4.31) | 2.58 (1.41–4.73) | 0.0022 * | 1.61 (0.83–3.11) | 0.159 | 1.68 (0.88–3.2) | 0.1152 |
| 3 | 42/106, 39.62 | 4733 | 8.87 (8.62–9.13) | 5.28 (3.03–9.19) | <0.0001 * | 3.14 (1.69–5.84) | 0.0003 * | 3.10 (1.70–5.68) | 0.0002 * |
| 4 | 12/16, 75.00 | 172 | 69.77 (60.08–81.01) | 31.21 (14.47–67.31) | <0.0001 * | 9.80 (4.24–22.64) | <0.0001 * | 10.43 (4.55–23.92) | <0.0001 * |
| Tumor grade | |||||||||
| Low | 5/86, 5.81 | 6483 | 0.77 (0.75–0.79) | 1.00 | 1.00 | 1.00 | |||
| High | 92/323, 28.48 | 16,489 | 5.58 (5.49–5.67) | 6.08 (2.47–14.98) | <0.0001 * | 2.97 (1.10–8.04) | 0.0319 * | 2.94 (1.10–7.85) | 0.0316 * |
| ACE-27 Comorbidity | |||||||||
| None, 0 | 3/53,5.66 | 4342 | 0.69 (0.67–0.71) | 1.00 | 1.00 | 1.00 | |||
| Mild, 1 | 22/174,12.64 | 10,781 | 2.04 (2–2.08) | 2.56 (0.77–8.56) | 0.1268 | 2.35 (0.70–7.89) | 0.1675 | 2.34 (0.70–7.85) | 0.1684 |
| Moderate, 2 | 50/139,35.97 | 6506 | 7.69 (7.5–7.87) | 8.93 (2.78–28.69) | 0.0002* | 6.63 (2.03–21.66) | 0.0018 * | 6.91 (2.12–22.5) | 0.0013 * |
| Severe, 3 | 22/43,51.16 | 1343 | 16.38 (15.53–17.28) | 18.08 (5.39–60.66) | <0.0001 * | 13.18 (3.86–45.00) | <0.0001 * | 12.16 (3.59–41.2) | <0.0001 * |
| Crude SHR (95% CI) | p Value | Adjusted SHR (95% CI) | p Value | Adjusted (Selection) SHR (95% CI) | p Value | |
|---|---|---|---|---|---|---|
| Age, (years) | ||||||
| ≤65, | 1.00 | 1.00 | ||||
| >65 | 0.85 (0.57–1.25) | 0.4054 | 0.68 (0.45–1.05) | 0.0821 | ||
| Sex | ||||||
| Female | 1.00 | 1.00 | ||||
| Male | 0.85 (0.57–1.27) | 0.4381 | 0.77 (0.51–1.17) | 0.2167 | ||
| Side | ||||||
| Right | 1.00 | 1.00 | ||||
| Left | 0.92 (0.62–1.36) | 0.6739 | 0.89 (0.58–1.35) | 0.5775 | ||
| Tumor location | ||||||
| Renal pelvis | 1.00 | 1.00 | ||||
| Ureter | 1.25 (0.84–1.85) | 0.2692 | 1.46 (0.95–2.23) | 0.0814 | ||
| Mutifocality | ||||||
| No | 1.00 | 1.00 | 1.00 | |||
| Yes | 1.71 (1.1–2.67) | 0.0166 * | 1.21 (0.69–2.12) | 0.5028 | 1.03 (0.62–1.7) | 0.9124 |
| Type op RNU | ||||||
| Open | 1.00 | 1.00 | ||||
| Laparoscopy | 1.23 (0.81–1.88) | 0.3250 | 1.31 (0.81–2.1) | 0.2698 | ||
| Tumor stage (pT) | ||||||
| 1 | 1.00 | 1.00 | 1.00 | |||
| 2 | 6.59 (3.05–14.28) | <0.0001 * | 3.60 (1.61–8.02) | 0.0018 * | 3.54 (1.62–7.73) | 0.0015 * |
| 3 | 14.93 (7.14–31.26) | <0.0001 * | 8.30 (3.83–18.00) | <0.0001 * | 7.64 (3.56–16.38) | <0.0001 * |
| 4 | 73.77 (31.47–172.94) | <0.0001 * | 22.75 (9.20–56.26) | <0.0001 * | 21.83 (9.07–52.56) | <0.0001 * |
| 3 + 4 vs. 1 + 2 | 11.31 (5.56–23.03) | <0.0001 * | 6.34 (3.05–13.19) | <0.0001 * | 5.84 (2.83–12.05) | <0.0001 * |
| Tumor grade | ||||||
| Low | 1.00 | 1.00 | 1.00 | |||
| High | 32.56 (4.57–232.22) | 0.0005 * | 8.86 (1.19–66.18) | 0.0334 * | 9.39 (1.28–68.78) | 0.0275 * |
| ACE-27 Comorbidity | ||||||
| None, 0 | 1.00 | 1.00 | 1.00 | |||
| Mild, 1 | 2.51 (0.76–8.29) | 0.1319 | 2.23 (0.69–7.16) | 0.1777 | 2.17 (0.69–6.87) | 0.1874 |
| Moderate, 2 | 9.52 (3.01–30.13) | 0.0001 * | 6.43 (2.06–20.07) | 0.0013 * | 6.69 (2.17–20.65) | 0.0009 * |
| Severe, 3 | 14.93 (4.46–50.02) | <0.0001 * | 10.82 (3.28–35.68) | <0.0001 * | 10.12 (3.15–32.50) | 0.0001 * |
| 2 + 3 vs. 0 + 1 | 4.95 (3.16–7.77) | <0.0001 * | 4.44 (2.79–7.07) | <0.0001 * | 4.47 (2.81–7.10) | <0.0001 * |
| Crude SHR (95% CI) | p Value | Adjusted SHR (95% CI) | p Value | Adjusted (Selection) SHR (95% CI) | p Value | |
|---|---|---|---|---|---|---|
| Age, (years) | ||||||
| ≤65, | 1.00 | 1.00 | ||||
| >65 | 0.77 (0.50–1.20) | 0.2489 | 0.60 (0.38–0.94) | 0.0264 | ||
| Sex | ||||||
| Female | 1.00 | 1.00 | ||||
| Male | 0.95 (0.61–1.47) | 0.8061 | 0.93 (0.59–1.48) | 0.7645 | ||
| Side | ||||||
| Right | 1.00 | 1.00 | ||||
| Left | 0.94 (0.61–1.45) | 0.7796 | 0.88 (0.56–1.38) | 0.5703 | ||
| Tumor location | ||||||
| Renal pelvis | 1.00 | 1.00 | ||||
| Ureter | 1.29 (0.84–2.00) | 0.2473 | 1.53 (0.97–2.40) | 0.0652 | ||
| Mutifocality | ||||||
| No | 1.00 | 1.00 | 1.00 | |||
| Yes | 1.90 (1.19–3.06) | 0.0077 * | 1.46 (0.83–2.54) | 0.1857 | 1.17 (0.70–1.97) | 0.5508 |
| Type op RNU | ||||||
| Open | 1.00 | 1.00 | ||||
| Laparoscopy | 0.90 (0.55–1.49) | 0.6921 | 0.97 (0.59–1.60) | 0.9161 | ||
| Tumor stage (pT) | ||||||
| 1 | 1.00 | 1.00 | 1.00 | |||
| 2 | 4.48 (2.07–9.69) | 0.0001 * | 2.52 (1.10–5.80) | 0.0297 * | 2.63 (1.18–5.89) | 0.0182 * |
| 3 | 9.11 (4.4–18.88) | <0.0001 * | 4.65 (2.08–10.41) | 0.0002 * | 4.77 (2.21–10.33) | <0.0001 * |
| 4 | 58.46 (24.57–139.08) | <0.0001 * | 15.74 (6.37–38.86) | <0.0001 * | 16.2 (6.47–40.59) | <0.0001 * |
| 3 + 4 vs. 1 + 2 | 7.55 (3.79–15.05) | <0.0001 * | 4.07 (1.93–8.55) | 0.0002 * | 4.13 (2.02–8.46) | 0.0001 * |
| Tumor grade | ||||||
| Low | 1.00 | 1.00 | 1.00 | |||
| High | 12.57 (3.06–51.55) | 0.0004 * | 4.64 (1.05–20.55) | 0.0430 * | 4.39 (1.02–18.93) | 0.0473 * |
| ACE-27 Comorbidity | ||||||
| None, 0 | 1.00 | 1.00 | 1.00 | |||
| Mild, 1 | 2.04 (0.46–9.08) | 0.3491 | 1.81 (0.40–8.10) | 0.4400 | 1.75 (0.39–7.94) | 0.4657 |
| Moderate, 2 | 12.19 (2.98–49.93) | 0.0005 * | 8.38 (2.01–34.88) | 0.0035 * | 8.55 (2.02–36.3) | 0.0036 * |
| Severe, 3 | 20.53 (4.76–88.57) | <0.0001 * | 14.81 (3.44–63.81) | 0.0003 * | 12.90 (2.91–57.22) | 0.0008 * |
| 2 + 3 vs. 0 + 1 | 7.75 (4.38–13.72) | <0.0001 * | 7.05 (3.94–12.60) | <0.0001 * | 6.96 (3.89–12.47) | <0.0001 * |
Publisher’s Note: MDPI stays neutral with regard to jurisdictional claims in published maps and institutional affiliations. |
© 2022 by the authors. Licensee MDPI, Basel, Switzerland. This article is an open access article distributed under the terms and conditions of the Creative Commons Attribution (CC BY) license (https://creativecommons.org/licenses/by/4.0/).
Share and Cite
Ke, H.-L.; Li, C.-C.; Lee, H.-Y.; Tu, H.-P.; Wei, Y.-C.; Yeh, H.-C.; Wu, W.-J.; Li, W.-M. Prognostic Value of Comorbidity for Patients with Upper Tract Urothelial Carcinoma after Radical Nephroureterectomy. Cancers 2022, 14, 1466. https://doi.org/10.3390/cancers14061466
Ke H-L, Li C-C, Lee H-Y, Tu H-P, Wei Y-C, Yeh H-C, Wu W-J, Li W-M. Prognostic Value of Comorbidity for Patients with Upper Tract Urothelial Carcinoma after Radical Nephroureterectomy. Cancers. 2022; 14(6):1466. https://doi.org/10.3390/cancers14061466
Chicago/Turabian StyleKe, Hung-Lung, Ching-Chia Li, Hsiang-Ying Lee, Hung-Pin Tu, Yu-Ching Wei, Hsin-Chih Yeh, Wen-Jeng Wu, and Wei-Ming Li. 2022. "Prognostic Value of Comorbidity for Patients with Upper Tract Urothelial Carcinoma after Radical Nephroureterectomy" Cancers 14, no. 6: 1466. https://doi.org/10.3390/cancers14061466