
BRENDA-Score, a Highly Significant, Internally and Externally Validated Prognostic Marker for Metastatic Recurrence: Analysis of 10,449 Primary Breast Cancer Patients

 ,
,
Abstract
:Simple Summary
Abstract
1. Introduction
2. Materials and Methods
3. Surrogate Definition of Intrinsic Subtypes
4. Statistical Analysis
5. Results
6. External Validation
7. Discussion
8. Conclusions
- (1).
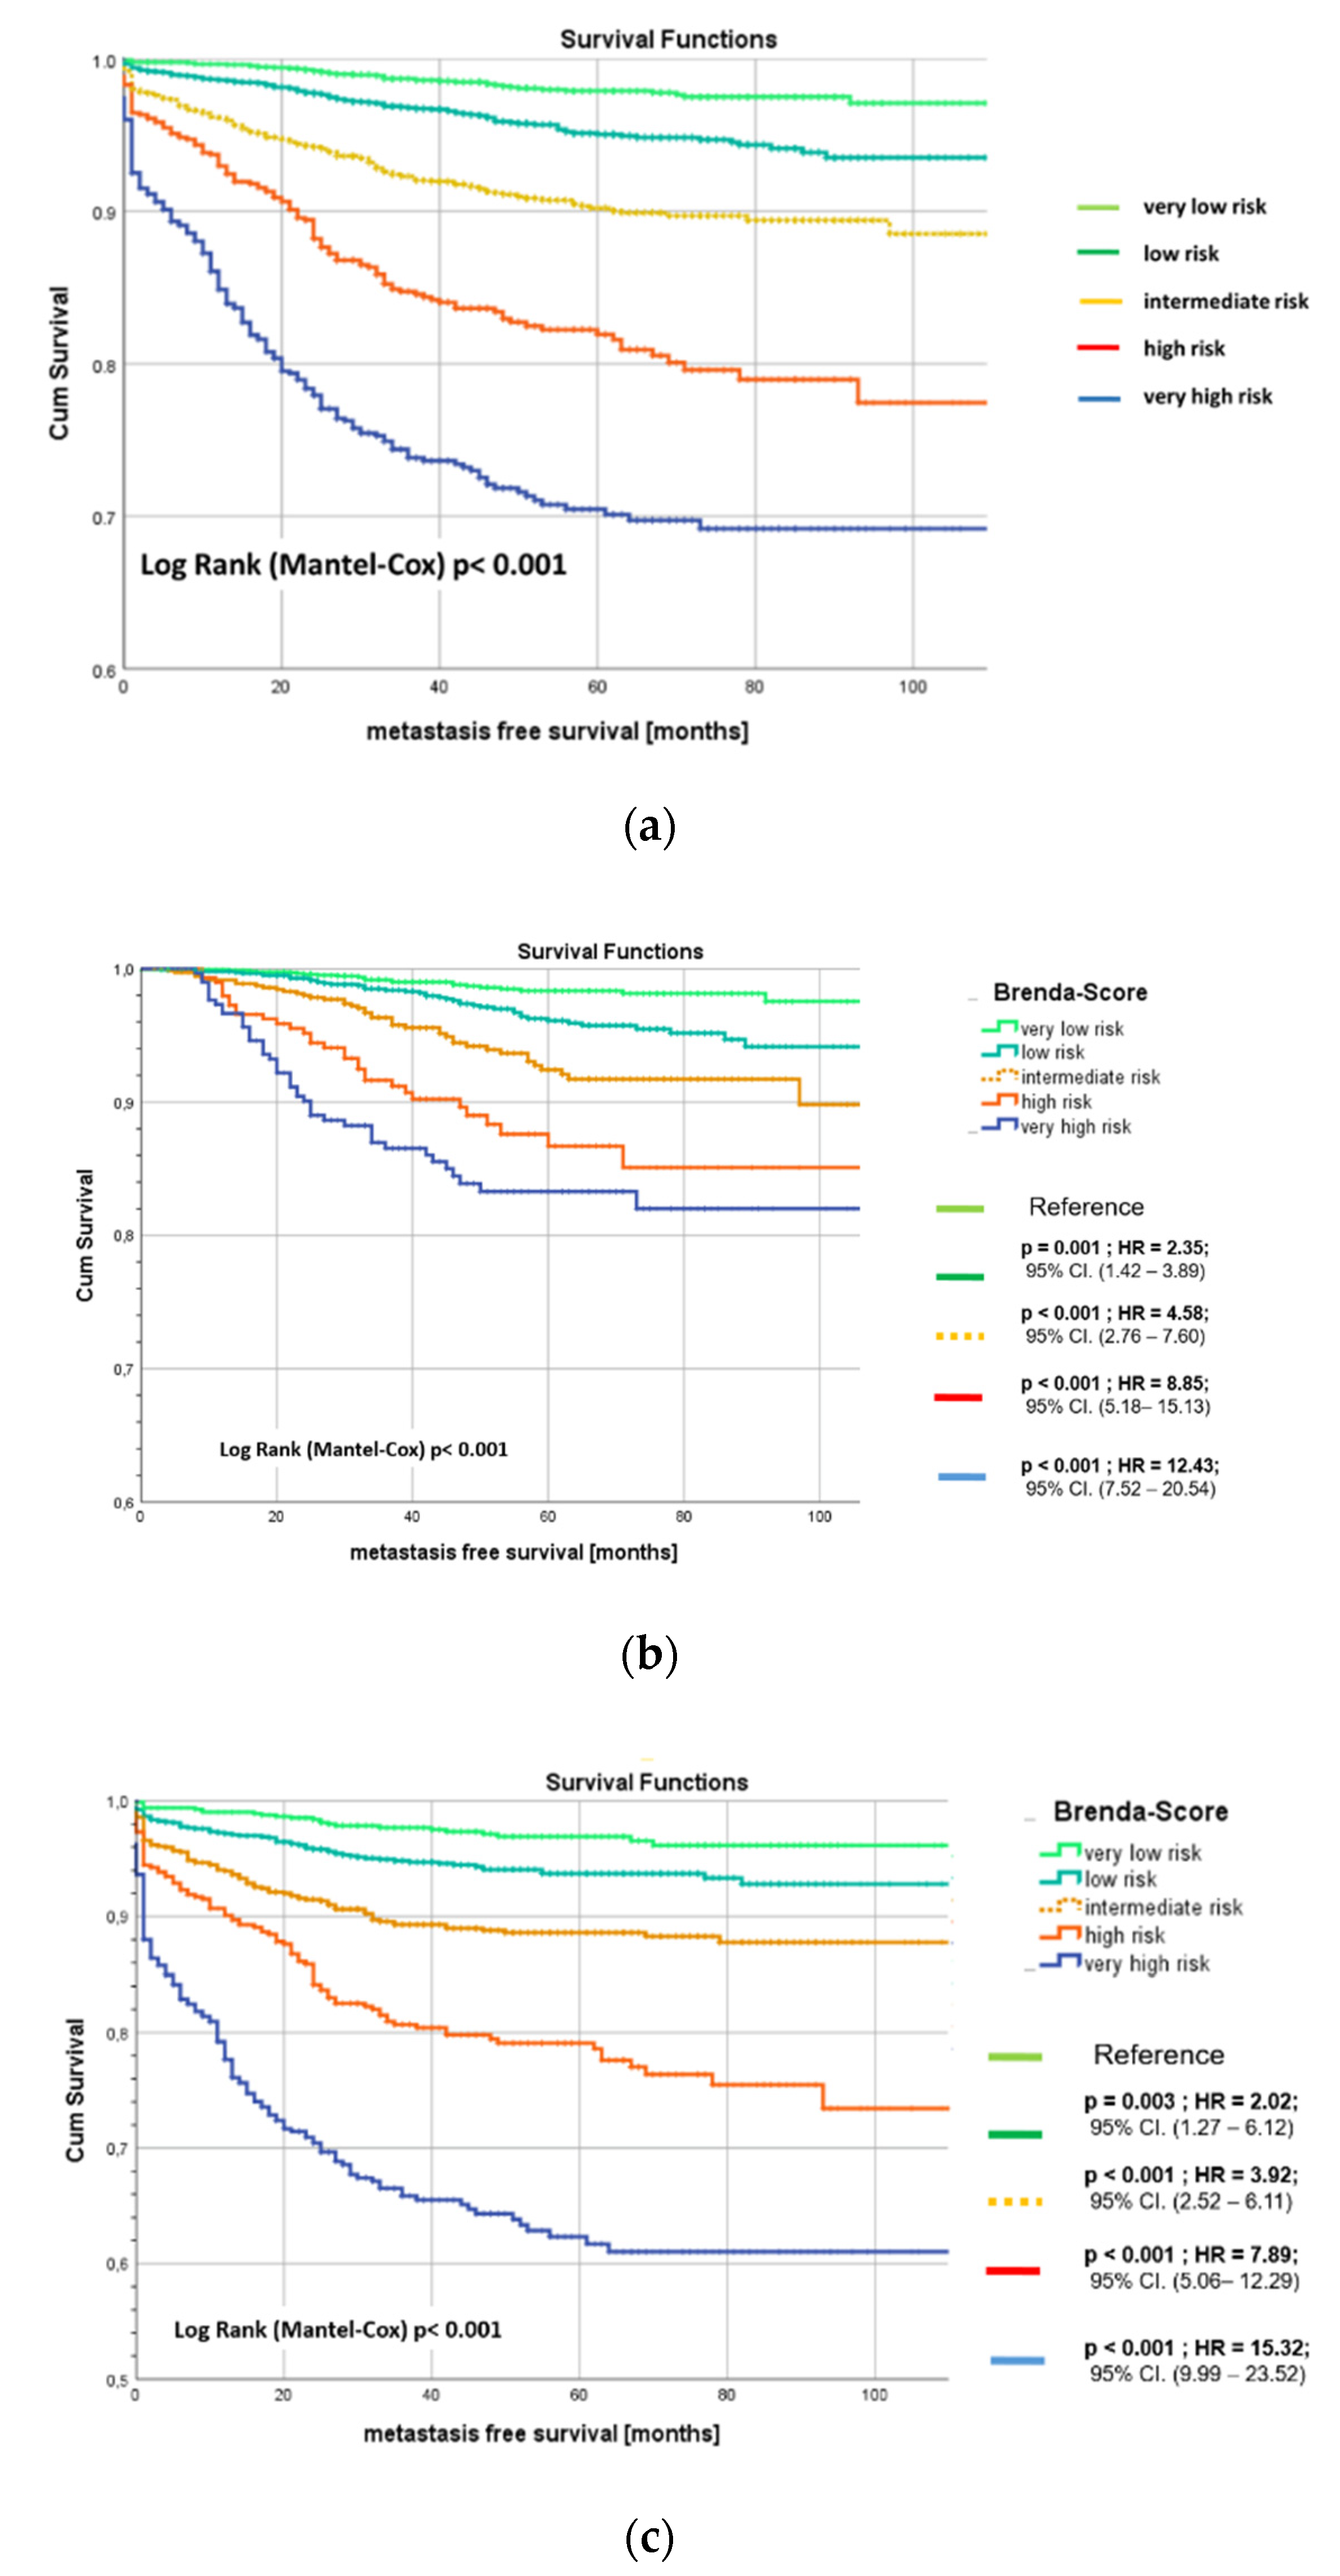
- The BRENDA-Score is a highly significant predictive tool for metastatic recurrence of breast cancer patients;
- (2).
- It is based on routine parameters, easily accessible in daily clinical care;
- (3).
- The BRENDA-Score is stable over at least the first five years after primary diagnosis, i.e., the sensitivities and specificities of this predicting system is rather similar with AUCs between 0.76 and 0.81;
- (4).
- Internal and external validations confirmed these results;
- (5).
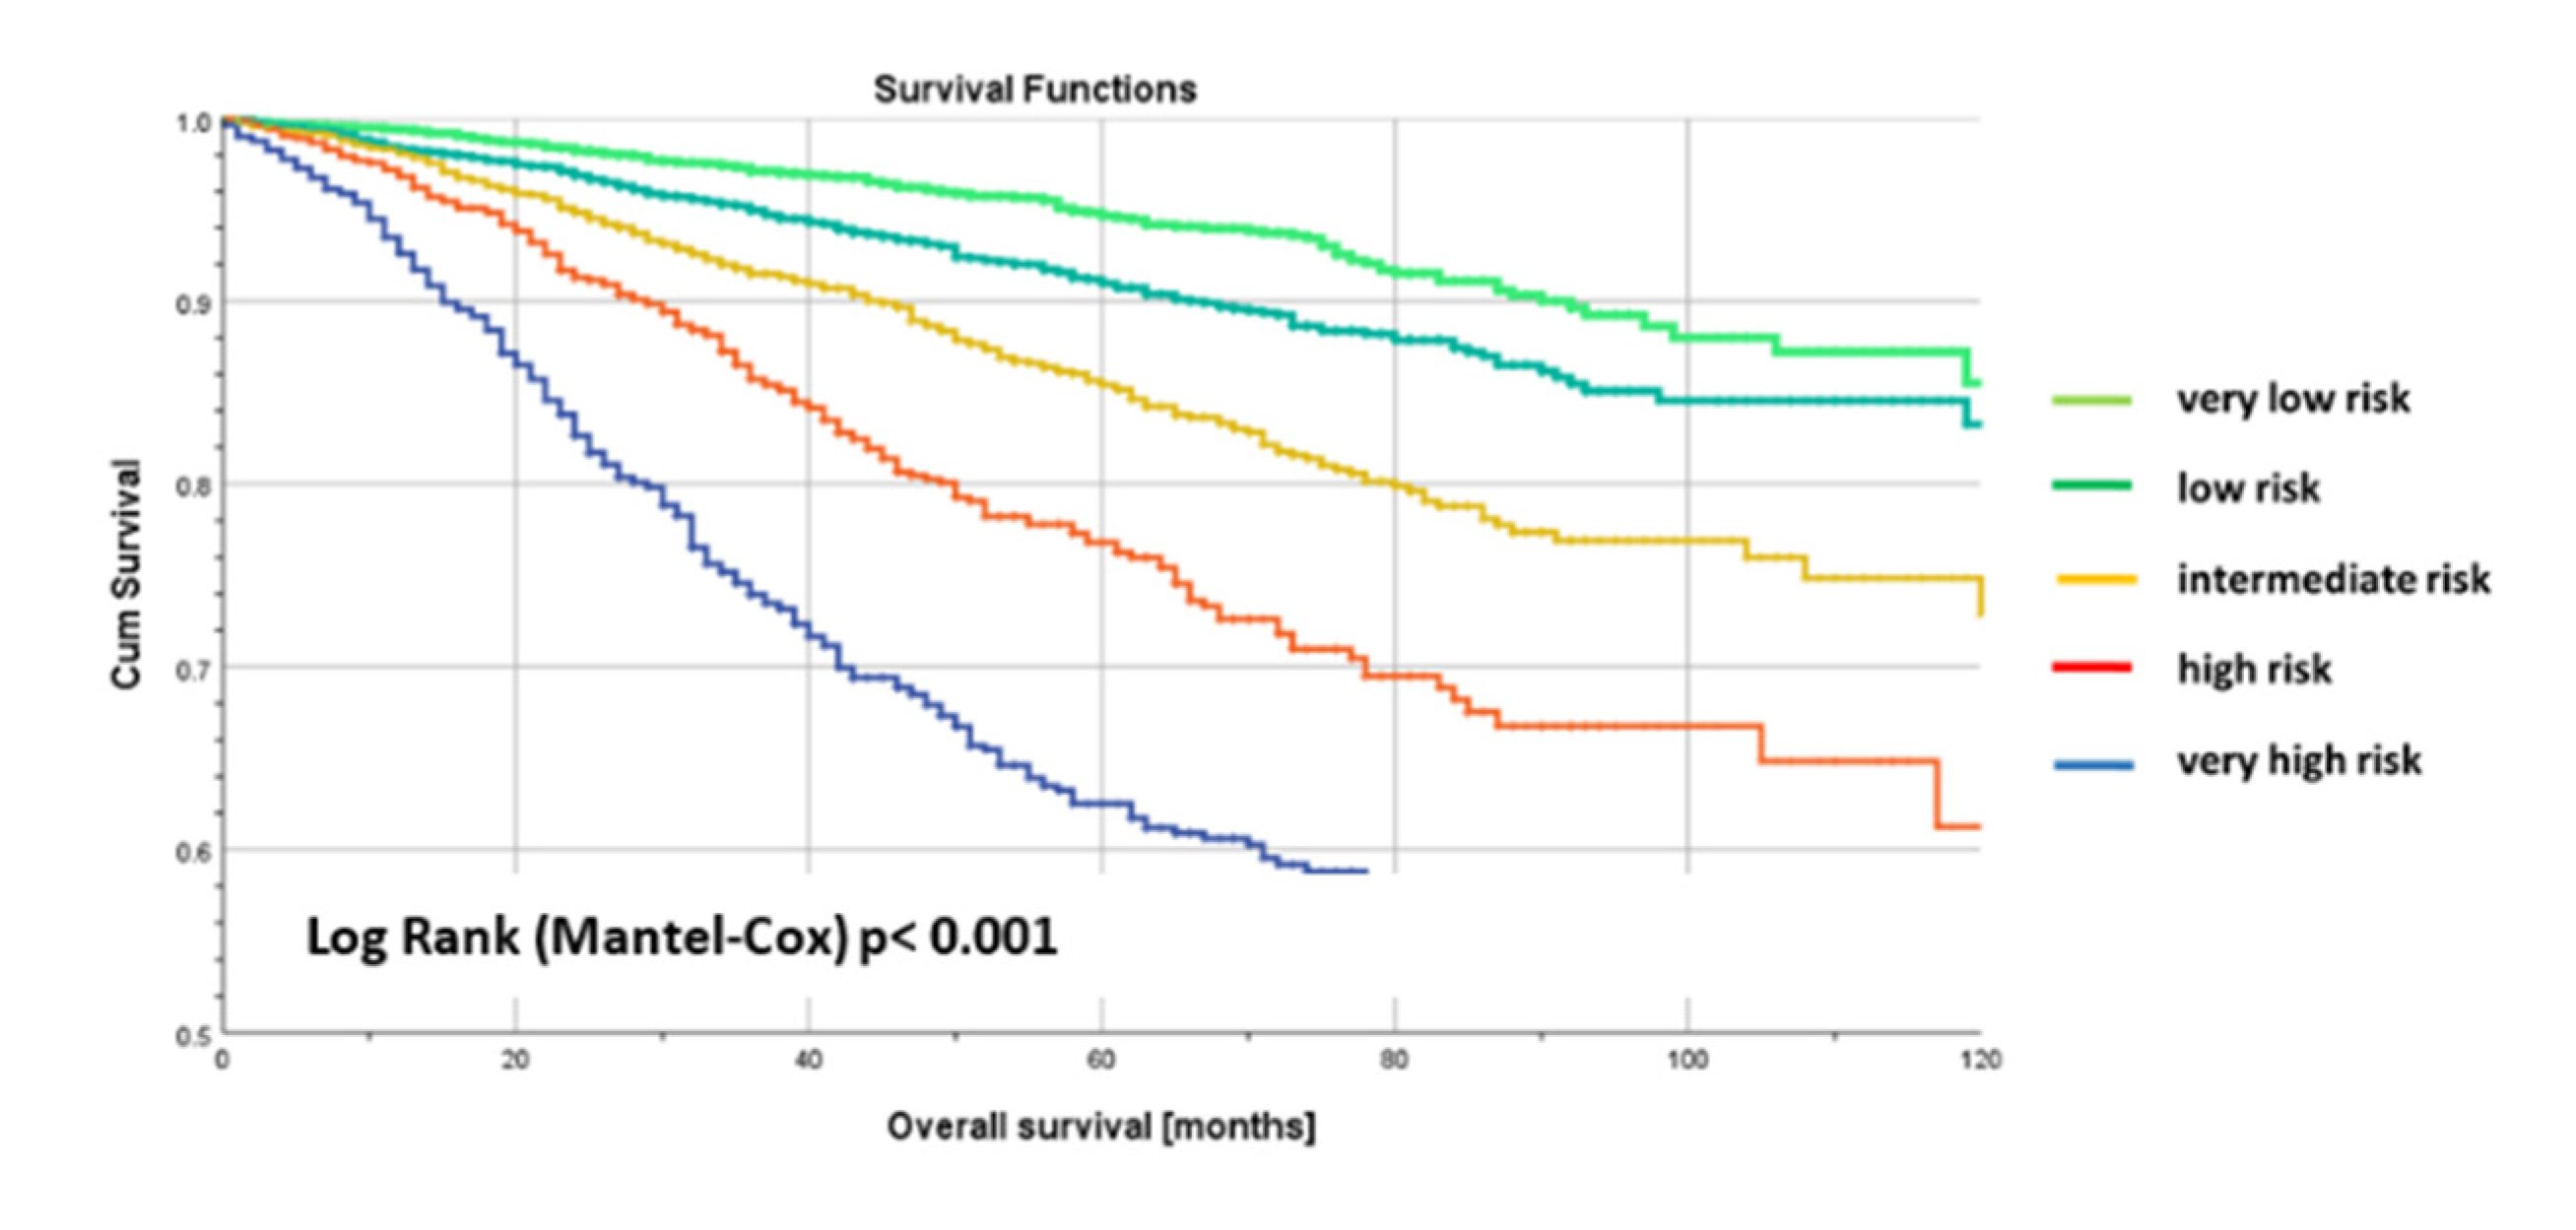
- Finally, the BRENDA-Score is in addition a good prognostic marker for overall survival. This confirms that metastatic free survival is a strong surrogate parameter for overall survival;
- (6).
- A multivariate Cox regression model for overall survival with BRENDA- and Nottingham prognostic score (NPS) showed that only the BRENDA-Score is statistically significant.
Author Contributions
Funding
Institutional Review Board Statement
Informed Consent Statement
Data Availability Statement
Acknowledgments
Conflicts of Interest
References
- Van Maaren, M.C.; de Munck, L.; Strobbe, L.J.A.; Sonke, G.S.; Westenend, P.J.; Smidt, M.L.; Poortmans, P.M.P.; Siesling, S. Ten-year recurrence rates for breast cancer subtypes in the Netherlands: A large population-based study. Int. J. Cancer 2019, 144, 263–272. [Google Scholar] [CrossRef] [Green Version]
- Bychkovsky, B.L.; Lin, N.U. Imaging in the evaluation and follow-up of early and advanced breast cancer: When, why, and how often? Breast 2017, 31, 318–324. [Google Scholar] [CrossRef]
- Veys, I. Follow-up of breast cancer patients by general practioner. Rev. Med. Brux. 2018, 39, 280–286. [Google Scholar]
- Moschetti, I.; Cinquini, M.; Lambertini, M.; Levaggi, A.; Liberati, A. Follow-up strategies for women treated for early breast cancer. Cochrane Database Syst. Rev. 2016, 2016, CD001768. [Google Scholar] [CrossRef] [PubMed]
- Hahn, E.E.; Tang, T.; Lee, J.S.; Munoz-Plaza, C.E.; Shen, E.; Rowley, B.; Maeda, J.L.; Mosen, D.M.; Ruckdeschel, J.C.; Gould, M.K. Use of posttreatment imaging and biomarkers in survivors of early-stage breast cancer: Inappropriate surveillance or necessary care? Cancer 2015, 122, 908–916. [Google Scholar] [CrossRef] [PubMed] [Green Version]
- Malmgren, J.; Hurlbert, M.; Atwood, M.; Kaplan, H.G. Examination of a paradox: Recurrent metastatic breast cancer incidence decline without improved distant disease survival: 1990–2011. Breast Cancer Res. Treat. 2019, 174, 505–514. [Google Scholar] [CrossRef] [PubMed] [Green Version]
- Bartmann, C.; Wischnewsky, M.; Stüber, T.; Stein, R.; Krockenberger, M.; Häusler, S.; Janni, W.; Kreienberg, R.; Blettner, M.; Schwentner, L.; et al. Pattern of metastatic spread and subcategories of breast cancer. Arch. Gynecol. Obstet. 2017, 295, 211–223. [Google Scholar] [CrossRef]
- Kast, K.; Link, T.; Friedrich, K.; Petzold, A.; Niedostatek, A.; Schoffer, O.; Werner, C.; Klug, S.J.; Werner, A.; Gatzweiler, A.; et al. Impact of breast cancer subtypes and patterns of metastasis on outcome. Breast Cancer Res. Treat. 2015, 150, 621–629. [Google Scholar] [CrossRef] [PubMed]
- Van Mechelen, M.; Van Herck, A.; Punie, K.; Nevelsteen, I.; Smeets, A.; Neven, P.; Weltens, C.; Han, S.; Vanderstichele, A.; Floris, G.; et al. Behavior of metastatic breast cancer according to subtype. Breast Cancer Res. Treat. 2020, 181, 115–125. [Google Scholar] [CrossRef]
- Wu, Q.; Li, J.; Zhu, S.; Wu, J.; Chen, C.; Liu, Q.; Wei, W.; Zhang, Y.; Sun, S. Breast cancer subtypes predict the preferential site of distant metastases: A SEER based study. Oncotarget 2017, 8, 27990–27996. [Google Scholar] [CrossRef] [Green Version]
- Hui, L.; Fan, Z.; Luanhong, W.; De, Z. Use of clinical nomograms for predicting survival outcomes in young women with breast cancer. Oncol. Lett. 2019, 17, 1505–1516. [Google Scholar]
- Lee, A.H.S.; Ellis, I.O. The Nottingham Prognostic Index for Invasive Carcinoma of the Breast. Pathol. Oncol. Res. 2008, 14, 113–115. [Google Scholar] [CrossRef] [PubMed]
- Lin, Z.; Yan, S.; Zhang, J.; Pan, Q. A Nomogram for Distinction and Potential Prediction of Liver Metastasis in Breast Cancer Patients. J. Cancer 2018, 9, 2098–2106. [Google Scholar] [CrossRef]
- Voelkel, V.; Draeger, T.; Groothuis-Oudshoorn, C.G.M.; De Munck, L.; Hueting, T.; Gerken, M.; Klinkhammer-Schalke, M.; Lavric, M.; Siesling, S. Predicting the risk of locoregional recurrence after early breast cancer: An external validation of the Dutch INFLUENCE-nomogram with clinical cancer registry data from Germany. J. Cancer Res. Clin. Oncol. 2019, 145, 1823–1833. [Google Scholar] [CrossRef] [Green Version]
- Ebner, F.; Wöckel, A.; Schwentner, L.; Blettner, M.; Janni, W.; Kreienberg, R.; Wischnewsky, M. Does the number of removed axillary lymphnodes in high risk breast cancer patients influence the survival? BMC Cancer 2019, 19, 90. [Google Scholar] [CrossRef] [Green Version]
- Schwentner, L.; For the BRENDA Study Group; Wöckel, A.; Konig, J.; Janni, W.; Ebner, F.; Blettner, M.; Kreienberg, R.; Van Ewijk, R. Adherence to treatment guidelines and survival in triple-negative breast cancer: A retrospective multi-center cohort study with 9156 patients. BMC Cancer 2013, 13, 487. [Google Scholar] [CrossRef] [Green Version]
- Wolters, R.; For the BRENDA Study Group; Wöckel, A.; Janni, W.; Novopashenny, I.; Ebner, F.; Kreienberg, R.; Wischnewsky, M.; Schwentner, L. Comparing the outcome between multicentric and multifocal breast cancer: What is the impact on survival, and is there a role for guideline-adherent adjuvant therapy? A retrospective multicenter cohort study of 8935 patients. Breast Cancer Res. Treat. 2013, 142, 579–590. [Google Scholar]
- Schouten, L.J.; Jager, J.J.; Brandt, P.A.V.D.; Brandt, P.V.D. Quality of cancer registry data: A comparison of data provided by clinicians with those of registration personnel. Br. J. Cancer 1993, 68, 974–977. [Google Scholar] [CrossRef] [Green Version]
- Parise, C.A.; Caggiano, V. Breast Cancer Survival Defined by the ER/PR/HER2 Subtypes and a Surrogate Classification according to Tumor Grade and Immunohistochemical Biomarkers. J. Cancer Epidemiol. 2014, 2014, 1–11. [Google Scholar] [CrossRef] [PubMed]
- Von Minckwitz, G.; Untch, M.; Blohmer, J.U.; Costa, S.D.; Eidtmann, H.; Fasching, P.A.; Gerber, B.; Eiermann, W.; Hilfrich, J.; Huober, J.; et al. Definition and impact of pathologic complete response on prognosis after neoadjuvant chemotherapy in various intrinsic breast cancer subtypes. J. Clin. Oncol. 2012, 30, 1796–1804. [Google Scholar] [CrossRef] [PubMed] [Green Version]
- Lips, E.H.; Mulder, L.; De Ronde, J.J.; Mandjes, I.A.M.; Koolen, B.B.; Wessels, L.F.A.; Rodenhuis, S.; Wesseling, J. Breast cancer subtyping by immunohistochemistry and histological grade outperforms breast cancer intrinsic subtypes in predicting neoadjuvant chemotherapy response. Breast Cancer Res. Treat. 2013, 140, 63–71. [Google Scholar] [CrossRef] [Green Version]
- Heagerty, P.J.; Lumley, T.; Pepe, M.S. Time-Dependent ROC Curves for Censored Survival Data and a Diagnostic Marker. Biometrics 2000, 56, 337–344. [Google Scholar] [CrossRef]
- Green, A.R.; Soria, D.; Powe, D.G.; Nolan, C.C.; Aleskandarany, M.; Szász, M.A.; Tőkés, A.M.; Ball, G.R.; Garibaldi, J.M.; Rakha, E.A.; et al. Nottingham prognostic index plus (NPI+) predicts risk of distant metastases in primary breast cancer. Breast Cancer Res. Treat. 2016, 157, 65–75. [Google Scholar] [CrossRef] [PubMed] [Green Version]
- Harrell, F.E.; Lee, K.L.; Mark, D.B. Multivariable prognostic models: Issues in developing models, evaluating assumptions and adequacy, and measuring and reducing errors. Stat. Med. 1996, 15, 361–387. [Google Scholar] [CrossRef]
- S3-Leitlinie Früherkennung, Diagnose, Therapie und Nachsorge des Mammakarzinoms, Leitlinienreport 4.1. Available online: http://www.leitlinienprogramm-onkologie.de/fileadmin/user_upload/Downloads/Leitlinien/Mammakarzinom_4_0/LL_Mammakarzinom_Langversion_Konsultationsfassung_Version_0.4.1.pdf (accessed on 1 June 2021).
- Chu, J.; Yang, D.; Wang, L.; Xia, J. Nomograms predicting survival for all four subtypes of breast cancer: A SEER-based population study. Ann. Transl. Med. 2020, 8, 544. [Google Scholar] [CrossRef] [PubMed]
- Lin, M.; Jin, Y.; Jin, J.; Wang, B.; Hu, X.; Zhang, J. A risk stratification model for predicting brain metastasis and brain screening benefit in patients with metastatic triple-negative breast cancer. Cancer Med. 2020, 9, 8540–8551. [Google Scholar] [CrossRef]
- Wang, Y.; Yang, Y.; Chen, Z.; Zhu, T.; Wu, J.; Su, F.; Deng, H. Development and validation of a novel nomogram for predicting distant metastasis-free survival among breast cancer patients. Ann. Transl. Med. 2019, 7, 537. [Google Scholar] [CrossRef]
- Izci, H.; Tambuyzer, T.; Tuand, K.; Depoorter, V.; Laenen, A.; Wildiers, H.; Vergote, I.; Van Eycken, L.; De Schutter, H.; Verdoodt, F.; et al. A Systematic Review of Estimating Breast Cancer Recurrence at the Population Level With Administrative Data. J. Natl. Cancer Inst. 2020, 112, 979–988. [Google Scholar] [CrossRef]
- Phung, M.T.; Tin, S.T.; Elwood, J.M. Prognostic models for breast cancer: A systematic review. BMC Cancer 2019, 19, 1–18. [Google Scholar] [CrossRef] [Green Version]
- Huang, C.-C.; Chan, S.-Y.; Lee, W.-C.; Chiang, C.-J.; Lu, T.-P.; Cheng, S.H.-C. Development of a prediction model for breast cancer based on the national cancer registry in Taiwan. Breast Cancer Res. 2019, 21, 1–9. [Google Scholar] [CrossRef] [Green Version]
- Candido dos Reis, F.J.; Wishart, G.C.; Dicks, E.M.; Greenberg, D.; Rashbass, J.; Schmidt, M.K.; van den Broek, A.J.; Ellis, I.O.; Green, A.; Rakha, E.; et al. An updated PREDICT breast cancer prognostication and treatment benefit prediction model with independent validation. Breast Cancer Res. 2017, 19, 58. [Google Scholar] [CrossRef] [PubMed]
- Haybittle, J.L.; Blamey, R.W.; Elston, C.W.; Johnson, J.E.; Doyle, P.J.; Campbell, F.C.; Nicholson, R.I.; Griffiths, K. A prognostic index in primary breast cancer. Br. J. Cancer 1982, 45, 361–366. [Google Scholar] [CrossRef] [Green Version]
- Sanghani, M.; Truong, P.T.; Raad, R.A.; Niemierko, A.; Lesperance, M.; Olivotto, I.A.; Wazer, D.E.; Taghian, A.G. Validation of a Web-Based Predictive Nomogram for Ipsilateral Breast Tumor Recurrence After Breast Conserving Therapy. J. Clin. Oncol. 2010, 28, 718–722. [Google Scholar] [CrossRef] [PubMed]
- Kindts, I.; Laenen, A.; Peeters, S.; Janssen, H.; Depuydt, T.; Nevelsteen, I.; Van Limbergen, E.; Weltens, C. Validation of the Web-Based IBTR! 2.0 Nomogram to Predict for Ipsilateral Breast Tumor Recurrence After Breast-Conserving Therapy. Int. J. Radiat. Oncol. 2016, 95, 1477–1484. [Google Scholar] [CrossRef]
- Witteveen, A.; Vliegen, I.M.H.; Sonke, G.S.; Klaase, J.M.; Ijzerman, M.J.; Siesling, S. Personalisation of breast cancer follow-up: A time-dependent prognostic nomogram for the estimation of annual risk of locoregional recurrence in early breast cancer patients. Breast Cancer Res. Treat. 2015, 152, 627–636. [Google Scholar] [CrossRef] [PubMed] [Green Version]
- Draeger, T.; Voelkel, V.; Groothuis-Oudshoorn, C.G.; Lavric, M.; Veltman, J.; Dassen, A.; Boersma, L.J.; Witteveen, A.; Sonke, G.S.; Koffijberg, H.; et al. Applying Risk-Based Follow-Up Strategies on the Dutch Breast Cancer Population: Consequences for Care and Costs. Value Health 2020, 23, 1149–1156. [Google Scholar] [CrossRef]
- Lu, W.L.; Jansen, L.; Post, W.J.; Bonnema, J.; Van De Velde, J.C.; De Bock, G.H. Impact on survival of early detection of isolated breast recurrences after the primary treatment for breast cancer: A meta-analysis. Breast Cancer Res. Treat. 2008, 114, 403–412. [Google Scholar] [CrossRef] [Green Version]
- Sejben, A.; Nyári, T.; Zombori, T.; Cserni, G. Comparison of Nottingham Prognostic Index, PREDICT and PrognosTILs in Triple Negative Breast Cancer –a Retrospective Cohort Study. Pathol. Oncol. Res. 2020, 26, 2443–2450. [Google Scholar] [CrossRef]
- Hempel, D.; Ebner, F.; Garg, A.; Trepotec, Z.; Both, A.; Stein, W.; Gaumann, A.; Güttler, L.; Janni, W.; DeGregorio, A.; et al. Real world data analysis of next generation sequencing and protein expression in metastatic breast cancer patients. Sci. Rep. 2020, 10, 1–7. [Google Scholar] [CrossRef]
- Tzanikou, E.; Lianidou, E. The potential of ctDNA analysis in breast cancer. Crit. Rev. Clin. Lab. Sci. 2019, 57, 54–72. [Google Scholar] [CrossRef]
- Sparano, J.A.; Henry, N.L. Surveillance After Treatment of Localized Breast Cancer: Time for Reappraisal? J. Natl. Cancer Inst. 2019, 111, 339–341. [Google Scholar] [CrossRef] [PubMed] [Green Version]


| Brenda-Score | |||||||
|---|---|---|---|---|---|---|---|
| Total | Very Low Risk | Low Risk | Intermediate Risk | High Risk | Very High Risk | ||
| n = 8566 (%) | n = 2568 (30.0) | n = 2661 (31.1) | n = 1718 (20.1) | n = 817 (9.5) | n = 802 (9.4) | Sig | |
| 62.1 ± 13.1 min 18; max 89 | 62.1 ± 13.1 min 18; max 89 | 61.5 ± 13.2 min 24; max 89 | 62.6 ± 14.0 min 27; max 89 | 62.9 ± 13.7 min 18; max 89 | 0.005 | ||
| T1 | 4842 (56.5) | 2568 (100) | 1616 (60.7) | 428 (24.9) | 178 (21.8) | 52 (6.5) | <0.001 |
| T2 | 3281 (38.3) | 0 (0) | 988 (37.1) | 1192 (69.4) | 606 (74.2) | 495 (61.7) | |
| T3/T4 | 443 (5.2) | 0 (0) | 57 (2.1) | 98 (5.7) | 33 (4.0) | 443 (5.2) | |
| nodal negative | 5272 (61.5) | 2569 (100) | 2063 (77.5) | 626 (36.4) | 15 (1.8) | 0 (0) | <0.001 |
| 1–3 affected lymph nodes | 1974 (23.0) | 0 (0) | 598 (22.5) | 903 (52.6) | 362 (44.3) | 111 (13.8) | |
| >3 affected lymph nodes | 1320 (15.4) | 0 (0) | 0 (0) | 189 (11.0) | 440 (53.9) | 691 (86.2) | |
| G1 | 817 (9.5) | 539 (21.0) | 228 (8.6) | 7 (0.9) | 7 (0.9) | 1 (0.1) | <0.001 |
| G2 | 5303 (61.9) | 2029 (79.0) | 1755 (66.0) | 367 (44.9) | 367 (44.9) | 187 (23.3) | |
| G3 | 2446 (28.6) | 0 (0) | 678 (25.5) | 443 (54.2) | 443 (54.2) | 614 (76.6) | |
| luminal A | 5305 (61.9) | 2552 (99.4) | 1559 (58.6) | 790 (46.0) | 316 (38.7) | 88 (11.0) | <0.001 |
| luminal B-HER2-negative like | 1185 (13.8) | 0 (0) | 315 (11.8) | 353 (20.5) | 268 (32.8) | 249 (31.0) | |
| Luminal B-HER2-positive like | 870 (10.2) | 16 (0.6) | 377 (14.2) | 236 (13.7) | 95 (11.6) | 146 (18.2) | |
| HER2 overexpressing | 410 (4.8) | 0 (0) | 126 (4.7) | 109 (6.3) | 60 (7.3) | 115 (14.3) | |
| Triple-negative | 796 (9.3) | 0 (0) | 284 (10.7) | 230 (13.4) | 78 (9.5) | 204 (25.4) | |
| Variables in the Equation | ||||||
|---|---|---|---|---|---|---|
| Covariates | B | SE | Sig. | HR | 95% Confidence Interval | |
| lower | upper | |||||
| luminal B-HER2-negative like | 0.48 | 0.18 | 0.007 | 1.61 | 1.14 | 2.28 |
| Luminal B-HER2-positive like | 0.42 | 0.15 | 0.004 | 1.53 | 1.14 | 2.04 |
| HER2 overexpressing | 0.72 | 0.18 | 0.000 | 2.06 | 1.45 | 2.94 |
| Triple-negative | 0.76 | 0.17 | 0.000 | 2.14 | 1.55 | 2.96 |
| T2 | 0.50 | 0.09 | 0.000 | 1.65 | 1.38 | 1.97 |
| T3/T4 | 0.96 | 0.14 | 0.000 | 2.62 | 2.01 | 3.41 |
| G2 | 0.49 | 0.24 | 0.038 | 1.64 | 1.03 | 2.61 |
| G3 | 0.63 | 0.27 | 0.020 | 1.89 | 1.10 | 3.22 |
| 1 ≤ n ≤3 | 0.80 | 0.11 | 0.000 | 2.23 | 1.81 | 2.74 |
| n > 3 | 1.56 | 0.10 | 0.000 | 4.75 | 3.89 | 5.79 |
| Bootstrap for Variables in the Equation | ||||||
|---|---|---|---|---|---|---|
| B | Bootstrap a | |||||
| Bias | Std. Error | Sig. (2-Tailed) | 95% Confidence Interval | |||
| lower | upper | |||||
| luminal B-HER2-negative like | 0.48 | 0.01 | 0.18 | 0.010 | 0.11 | 0.83 |
| Luminal B-HER2-positive like | 0.42 | −0.01 | 0.15 | 0.005 | 0.09 | 0.70 |
| HER2 overexpressing | 0.72 | −0.01 | 0.18 | 0.001 | 0.36 | 1.05 |
| Triple-negative | 0.76 | 0.00 | 0.17 | 0.001 | 0.42 | 1.07 |
| T2 | 0.50 | 0.00 | 0.09 | 0.001 | 0.32 | 0.69 |
| T3/T4 | 0.96 | −0.01 | 0.14 | 0.001 | 0.66 | 1.22 |
| G2 | 0.49 | 0.03 | 0.25 | 0.034 | 0.09 | 1.08 |
| G3 | 0.63 | 0.02 | 0.28 | 0.014 | 0.14 | 1.23 |
| 1≤ n≤ 3 | 0.80 | 0.00 | 0.10 | 0.001 | 0.60 | 1.00 |
| n > 3 | 1.56 | 0.00 | 0.11 | 0.001 | 1.35 | 1.78 |
Publisher’s Note: MDPI stays neutral with regard to jurisdictional claims in published maps and institutional affiliations. |
© 2021 by the authors. Licensee MDPI, Basel, Switzerland. This article is an open access article distributed under the terms and conditions of the Creative Commons Attribution (CC BY) license (https://creativecommons.org/licenses/by/4.0/).
Share and Cite
Wischnewsky, M.; Schwentner, L.; Diessner, J.; de Gregorio, A.; Joukhadar, R.; Davut, D.; Salmen, J.; Bekes, I.; Kiesel, M.; Müller-Reiter, M.; et al. BRENDA-Score, a Highly Significant, Internally and Externally Validated Prognostic Marker for Metastatic Recurrence: Analysis of 10,449 Primary Breast Cancer Patients. Cancers 2021, 13, 3121. https://doi.org/10.3390/cancers13133121
Wischnewsky M, Schwentner L, Diessner J, de Gregorio A, Joukhadar R, Davut D, Salmen J, Bekes I, Kiesel M, Müller-Reiter M, et al. BRENDA-Score, a Highly Significant, Internally and Externally Validated Prognostic Marker for Metastatic Recurrence: Analysis of 10,449 Primary Breast Cancer Patients. Cancers. 2021; 13(13):3121. https://doi.org/10.3390/cancers13133121
Chicago/Turabian StyleWischnewsky, Manfred, Lukas Schwentner, Joachim Diessner, Amelie de Gregorio, Ralf Joukhadar, Dayan Davut, Jessica Salmen, Inga Bekes, Matthias Kiesel, Max Müller-Reiter, and et al. 2021. "BRENDA-Score, a Highly Significant, Internally and Externally Validated Prognostic Marker for Metastatic Recurrence: Analysis of 10,449 Primary Breast Cancer Patients" Cancers 13, no. 13: 3121. https://doi.org/10.3390/cancers13133121