
Thermophysical Characterization of Paraffins versus Temperature for Thermal Energy Storage

1
Univ Paris Est Creteil, CERTES, F-94010 Creteil, France
2
Center for Advanced Materials (CAM), Qatar University, Doha 2713, Qatar
*
Author to whom correspondence should be addressed.
Buildings 2023, 13(4), 877; https://doi.org/10.3390/buildings13040877
Submission received: 20 November 2022
/
Revised: 1 March 2023
/
Accepted: 16 March 2023
/
Published: 27 March 2023
(This article belongs to the Special Issue Computational Fluid Dynamics Modeling for Smart Buildings Design)
Abstract
:Latent heat storage systems (LHSS), using solid–liquid phase change materials (PCMs), are attracting growing interest in many applications. The determination of the thermophysical properties of PCMs is crucial for selecting the appropriate material for an LHSS and for predicting the thermal behavior of the PCM. In this context, the thermophysical characterization of four paraffins (RT21, RT27, RT35HC, RT50) at different temperatures, including the solid and liquid phases, is conducted in this investigation. This work is part of a strategic technological brick in the CERTES laboratory of the Paris Est University to build a database for phase change material properties. It contains the measurements of the thermophysical, optical and mechanical properties. It will serve as input for the numerical simulations to study the behavior of PCMs in LHSS. The temperatures and the latent heats of the phase transitions as well as the thermal dependence of the specific heat of the paraffins were evaluated by differential scanning calorimetry (DSC). In addition, the DSC measurements under successive thermal cycles revealed good reliability of the paraffins. Thermogravimetric analysis (TGA) was performed, and the results highlighted the thermal stability of the paraffins. Moreover, the evolutions of the thermal conductivities and diffusivities with temperature were measured simultaneously using the hot disk method. A discontinuity of the thermal conductivities was observed near the melting temperatures. Furthermore, the measurements of the densities of the paraffins at different temperatures were carried out. The volume changes and the coefficients of thermal expansion were assessed. The obtained outcomes of this study were compared with the available bibliographical data.
1. Introduction
The global energy demand has continually increased over the last few decades [1,2], and it will rise by 46.9% between 2018 and 2050 [3] due to population and economic growth. This demand is facing two major issues, namely the scarcity of fossil fuel resources and the environmental risks of greenhouse gas emissions [1,2]. Hence, the thermal management of energy systems and the effective utilization of renewable energies are indispensable for the reduction of energy consumption and for the preservation of the environment.
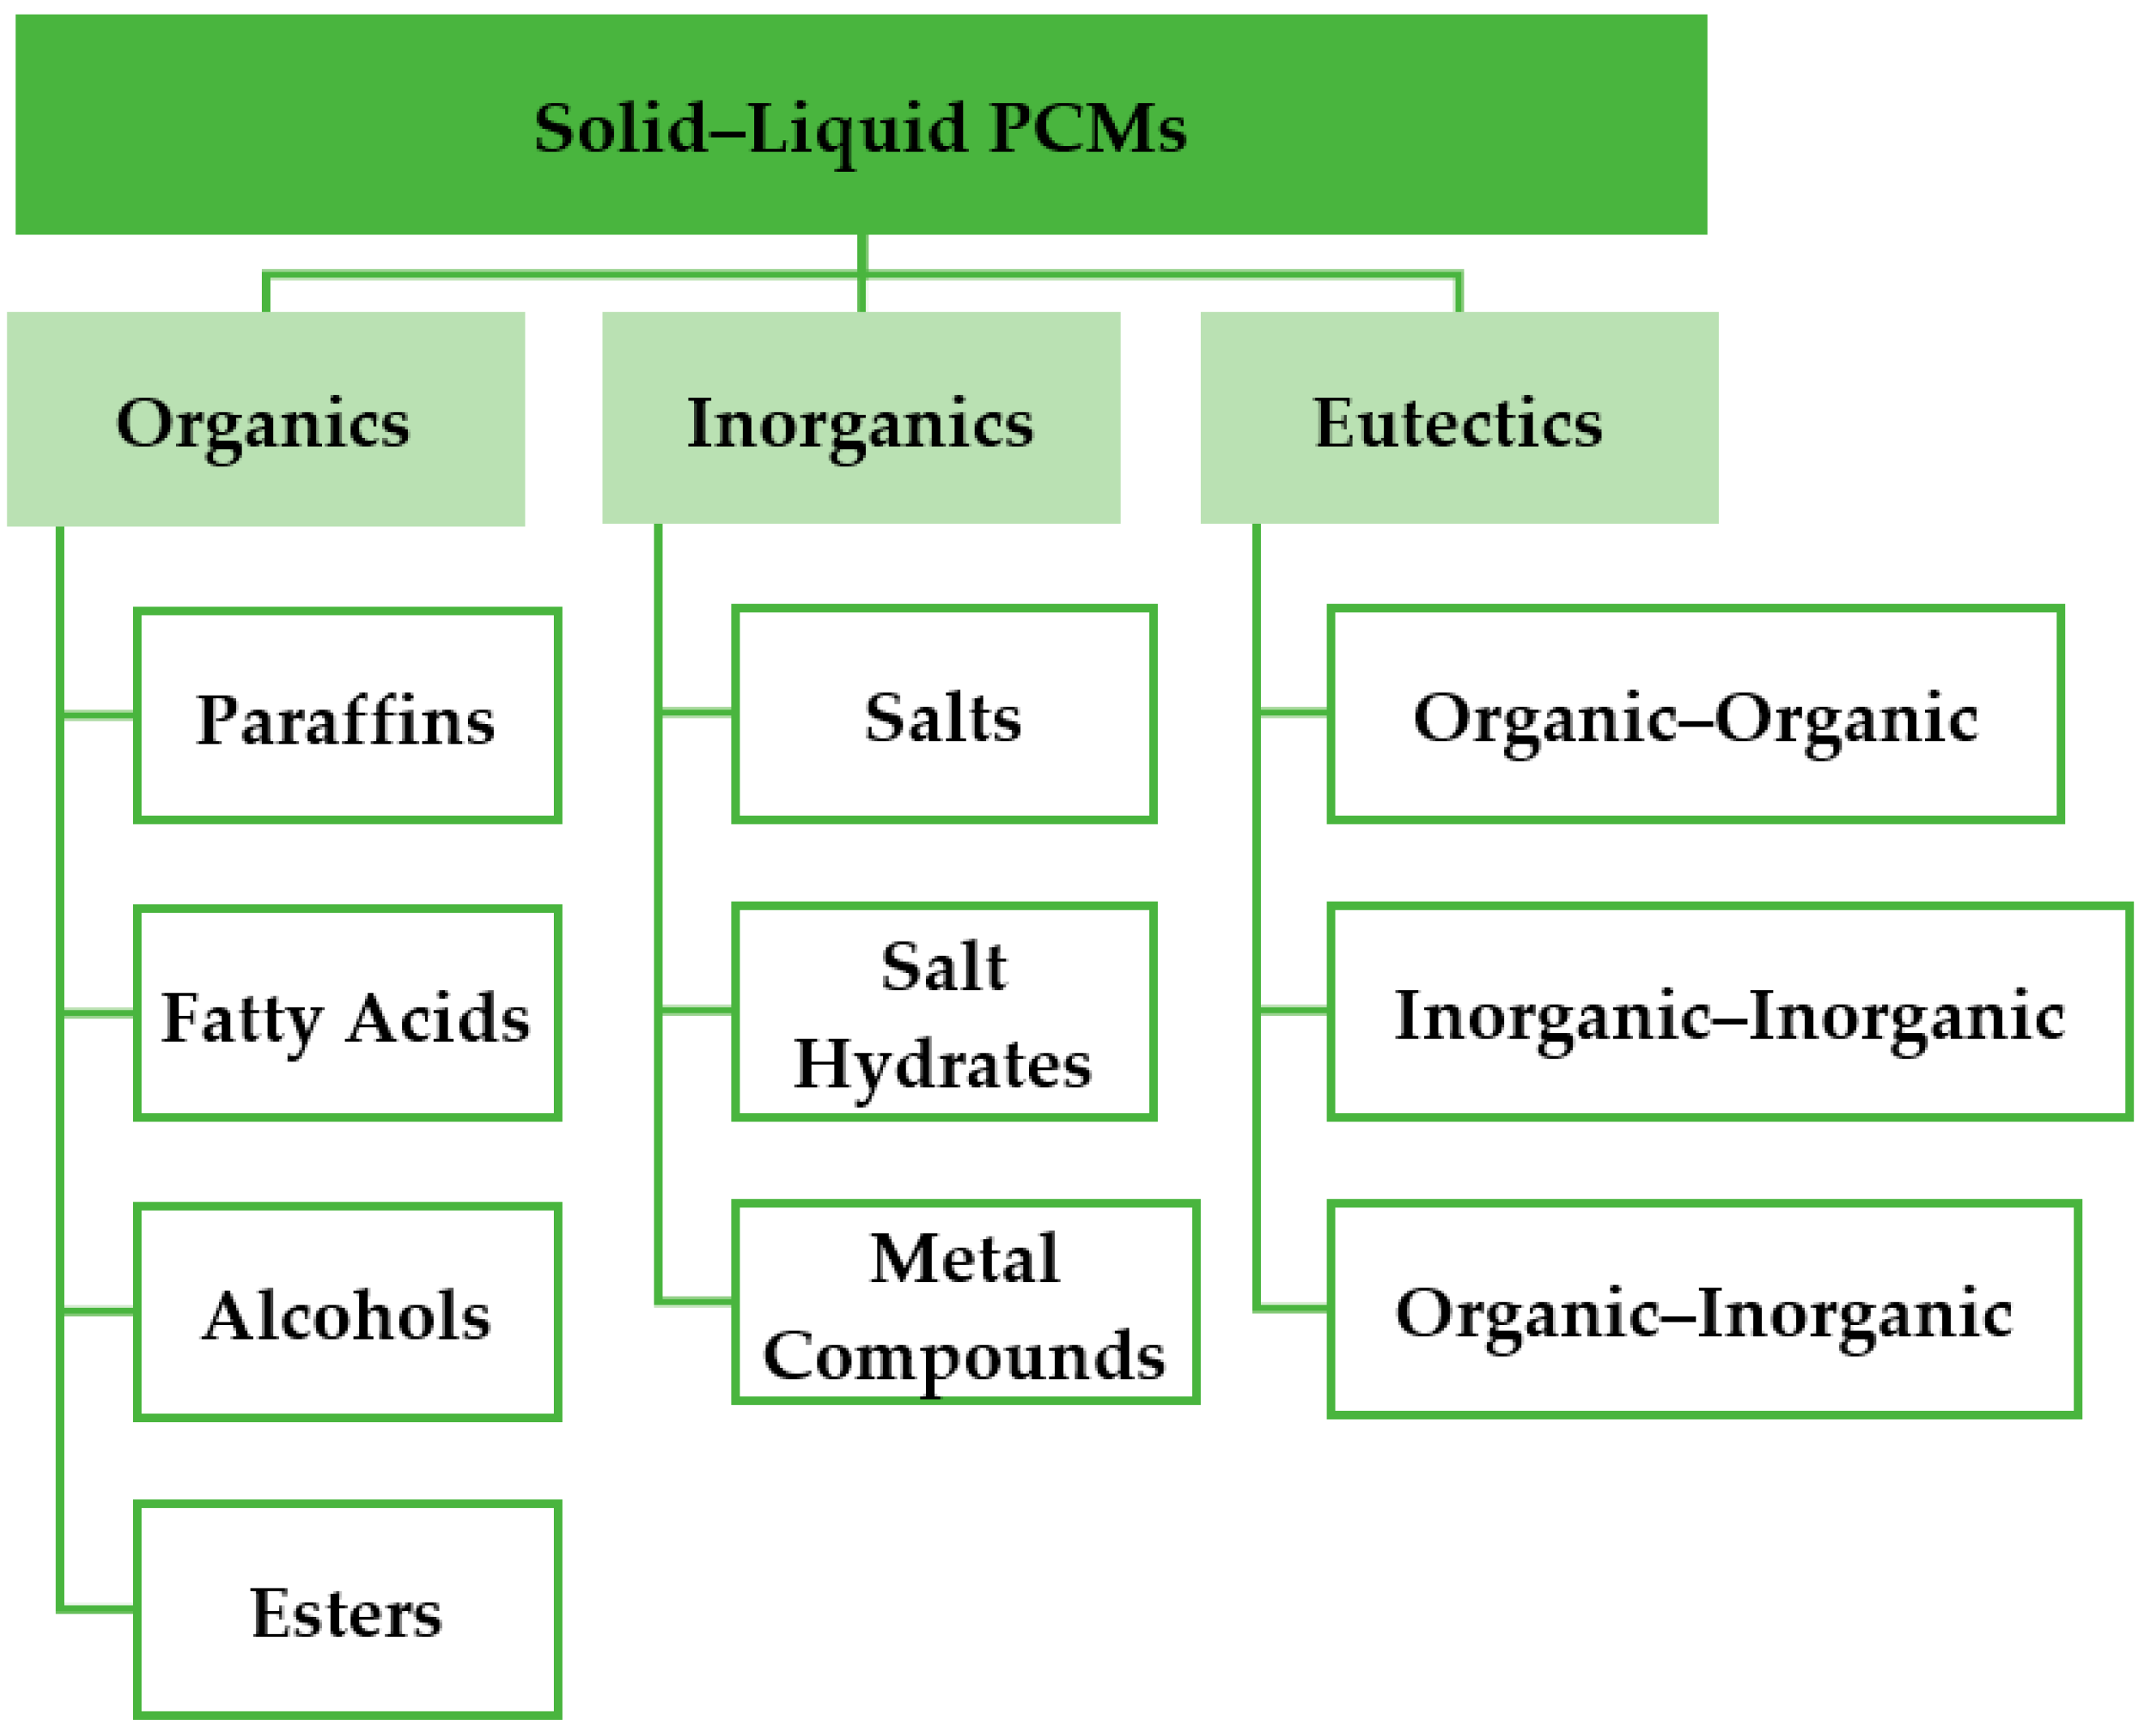
In this context, latent heat storage systems (LHSS) are at the forefront of environmentally friendly solutions for saving energy. They are based on phase change materials (PCMs) which store the heat during an endothermic phase transition and release it throughout an exothermic phase transition. There are four types of phase changes that can occur in an LHSS: solid–liquid, liquid–gas, solid–gas and solid–solid. Among these PCMs, the solid–liquid phase change materials are the most attractive and innovative candidates for thermal energy storage. This is due to their availability in a wide range of temperatures and their high heat storage capacities. The solid–liquid PCMs are classified into three groups: organics, inorganics and eutectics [4,5,6] (Figure 1). They cover a broad range of applications because of the diversity of their melting temperature [7].
Paraffins are organic solid–liquid PCMs that attract great interest due to their availability in a large range of temperatures from −10 °C to 67 °C [8]. They are suitable for low- and medium-temperature storage applications [9], including cold storage, buildings [5], thermal management of batteries [10,11,12,13] and electronic cooling [14]. They are thermally stable until 150 °C [10]. They have reproducible temperatures and latent heats of melting over 1000–2000 cycles of melting—solidification [15]. They are also characterized by their great latent heats, their low degrees of supercooling, their chemical stability, their noncorrosivity and their nontoxicity. Paraffins have a wide variety of specific heats for supplementary sensible heat storage [16]. They have no separation issues, and they are inexpensive. However, their low thermal conductivities (0.2 W.m−1.K−1 −0.4 W.m−1.K−1) [17,18] and their high volume changes (10–20%) compared to other S-L PCMs [19] are their main disadvantages.
The performance of the latent heat storage systems using paraffins depends on the above thermophysical properties. Different experimental methods are reported in the literature for the assessment of the thermophysical properties of paraffins. The phase change properties including the temperatures and the latent heats of melting and solidification were investigated by differential scanning calorimetry (DSC) in many studies [20,21,22,23,24,25,26,27,28,29,30,31,32] at heating–cooling rates ranging from 0.05 °C.min−1 to 10 °C.min−1. Few investigations [20,23,32,33,34,35] focused on the measurement of the specific heats of paraffins in the solid and in liquid phases using the DSC method. The thermal degradation of commercial paraffins was assessed in [22,27,29,30,31,32] by means of thermogravimetric analysis at a heating rate of 10 °C.min−1. The thermal conductivities of solid paraffins were measured by the hot disk method in [24,28,29,31,32], by the periodic method in [25] and by the transient line heat source method in [21,30]. Furthermore, the measurement of the thermal conductivities of solid paraffins was performed using the hot wire method in [34,36] and by means of the transient hot bridge method in [27]. However, few studies focused on the determination of the thermal conductivities of liquid paraffins [31,32,34,35,36]. Thermal diffusivity measurements of paraffins were conducted in [34] using the hot wire method and in [32,33] using an experimental transient method. The density of paraffins in the solid and liquid phases was evaluated in [32,33,34,36], and the volume change was assessed [32,33].
The above literature review showed that most investigations studied the thermophysical characterization of paraffins either in the solid phase or in the liquid phase. It should be pointed out also that few studies focused on the temperature-dependent thermophysical properties of paraffins [32,33,34,35]. However, the measurements of paraffin properties in a large temperature range are of great importance for the selection of a suitable paraffin for LHSS. They are also important for the numerical prediction of the thermal behavior of PCMs during heat storage and heat release.
To the best of our knowledge, there is no study that investigates the thermophysical characterization of paraffins RT21, RT27, RT35HC and RT50 at different temperatures including the solid and liquid phases. Therefore, the present experimental investigation aims to establish a database of the thermodependency of the properties of these paraffins. This exhaustive dataset will be reliable as input data for numerical simulations of the thermal behavior of paraffins in LHSS given the scarcity of this information in the literature. The heat storage properties such as the temperatures, the latent heats of melting and solidification, and the specific heats in both solid and liquid phases were measured by the DSC method. Cyclic DSC measurements were performed to study the thermal reliability of paraffins. Thermogravimetric analysis (TGA) was conducted to study thermal stability. The thermal conductivities and diffusivities of paraffins were measured in the solid and liquid phases at different temperatures by the hot disk method. Paraffin densities over a wide range of temperatures were assessed. The volume changes of the PCMs as well as their thermal expansion coefficients were consequently calculated.
2. Materials and Methods
2.1. Materials
2.1.1. Raw Materials
This investigation focuses on four paraffins, RT21, RT27, RT35HC and RT50, purchased from Rubitherm GmBH company, as phase change materials. The thermophysical properties of the paraffins, indicated by the supplier, are mentioned in Table 1. Paraffins RT27, RT35HC and RT50 were delivered in the solid state in tanks. Paraffin RT21 was bought in the liquid state considering its melting temperature. To ensure the homogeneity of the paraffins, the total paraffin contained in each tank was melted, mixed and then distributed in bottles.
2.1.2. Sample Preparation
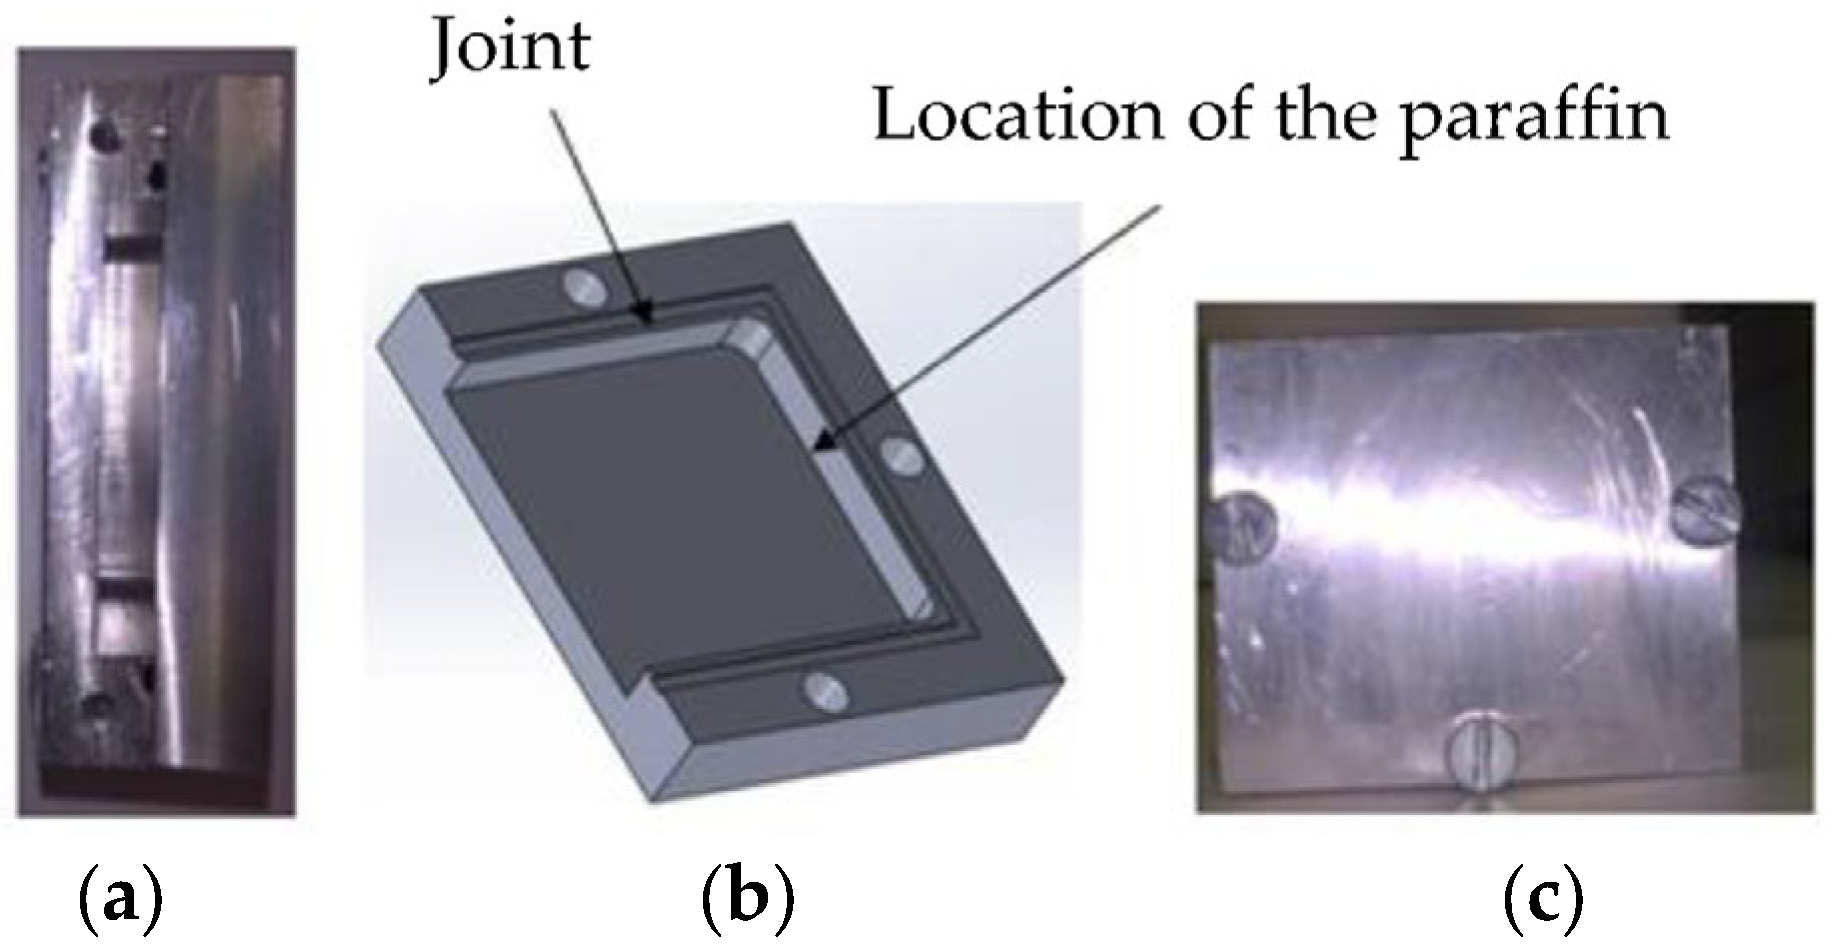
Solid paraffin samples with dimensions of 40–28–4.5 mm3 were prepared in an aluminum mold (Figure 2). This mold was made of two removable parts assembled by the screws, and it was equipped with a joint to prevent the leakage of the liquid paraffin (Figure 2).
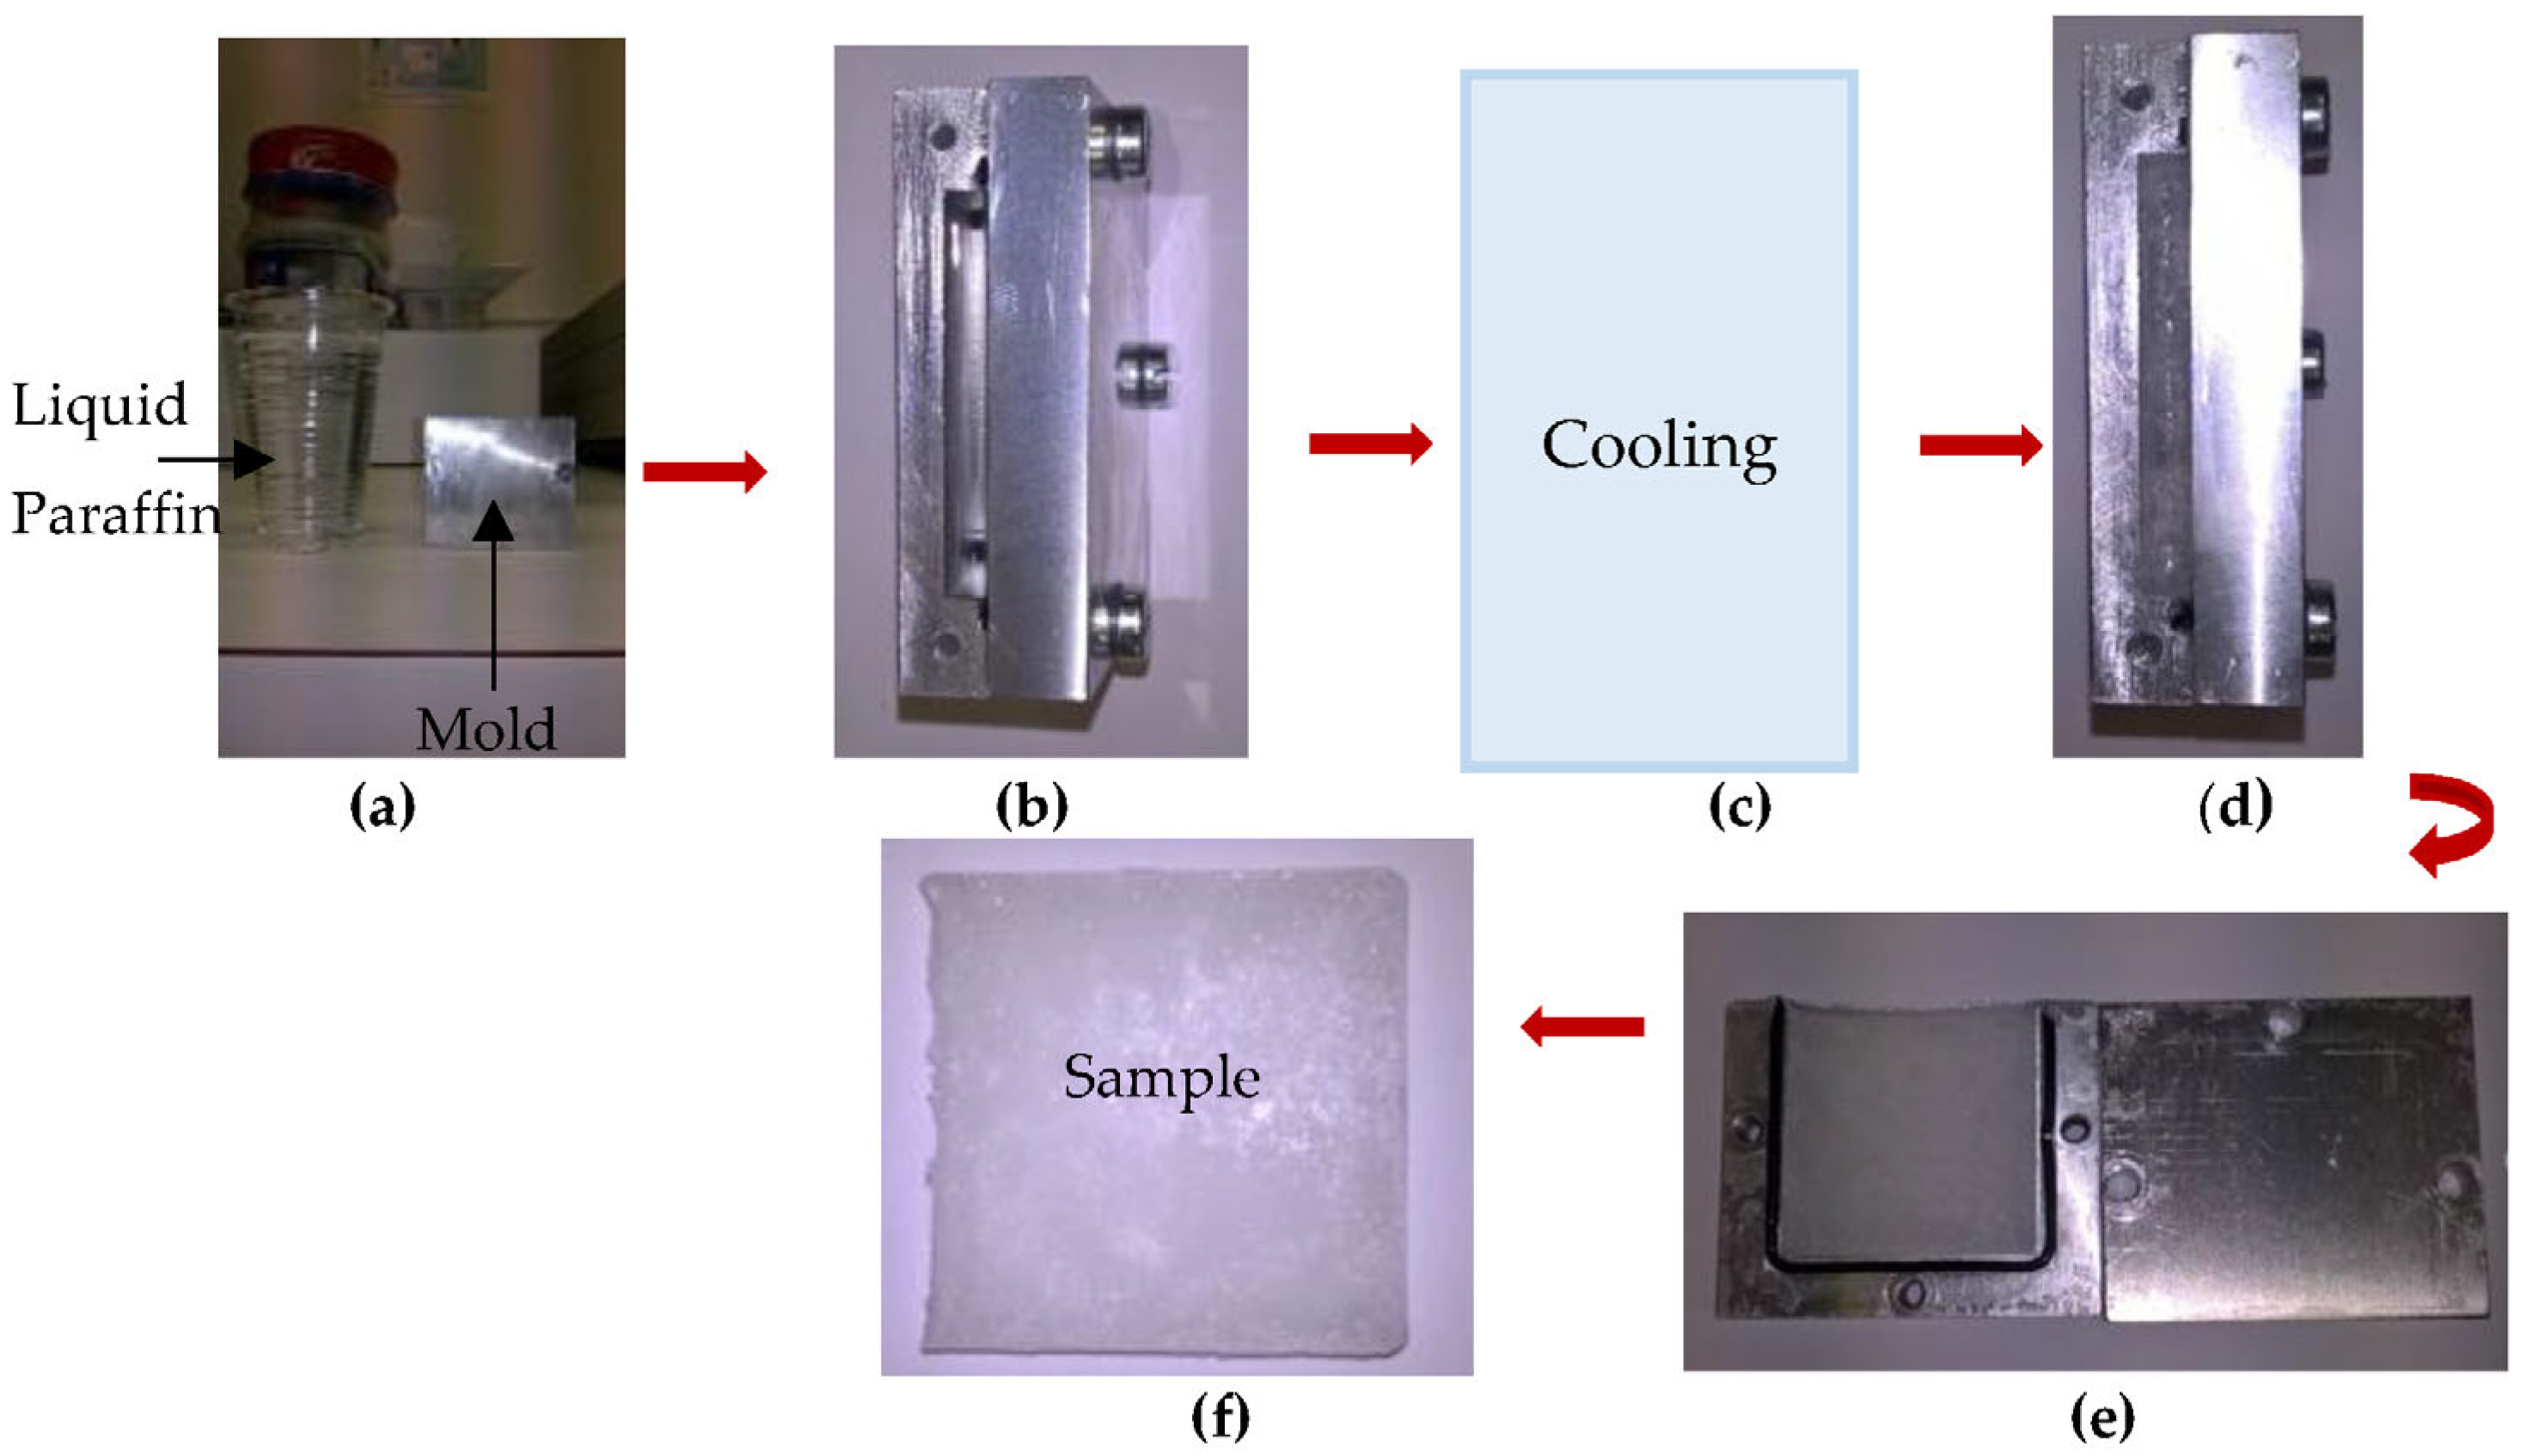
The experimental procedure of the preparation of the paraffin samples is illustrated in Figure 3. The liquid paraffin was first poured into the mold by means of a syringe (Figure 3a,b). Then, the paraffin was cooled in a refrigerator in the case of paraffin RT21 and under the ambient temperature for paraffins RT27, RT35HC and RT50 (Figure 3c). Once the paraffin was completely solidified (Figure 3d), the sample was removed from the mold (Figure 3e,f).
2.2. Experimental Methods
2.2.1. Differential Scanning Calorimetry (DSC)
DSC measurements were performed using a power compensation calorimeter [38,39] (Diamond Perkin Elmer, Waltham, MA, USA) equipped with the Pyris software 13.3.2 for thermal data analysis. The temperature and power accuracies of this calorimeter are 0.1 °C and 1%, respectively. The measurements were carried out at heating–cooling rates of 10 °C.min−1 and 0.2 °C.min−1 under a constant nitrogen rate. Indium (TS-L = 156.6 °C, ∆HS-L = 28.61 J.g−1) and distilled water (TS-L = 0 °C) were used as standard materials for the temperature and the enthalpy calibration of the calorimeter.
- DSC measurements at a heating–cooling rate of 10 °C.min−1
The measurements conducted at a heating–cooling rate of 10 °C.min−1 were used to evaluate the temperatures and latent heats of the melting and solidification of the paraffin waxes, to study their thermal reliabilities under thermal cycles and to measure their specific heat capacities at different temperatures.
The calorimeter was calibrated at a heating rate of 10 °C.min−1. Then, the baseline was established by measuring the heat flow obtained when empty aluminum pans were placed in the crucibles of the DSC furnaces. Afterward, each paraffin was sealed in an aluminum pan in the DSC furnace and subjected to eleven thermal cycles made of heating and cooling steps. Isothermal phases of 3 min were applied between each temperature ramp. The weights of the paraffin samples were in the range of 7.66 mg to 7.93 mg. Table 2 summarizes the masses of the paraffins and the temperature programs.
The calorimeter was calibrated in heat capacity with a sapphire sample (m = 28.4 mg) to determine the specific heats of the paraffin waxes in the solid and liquid phases at a heating rate of 10 °C.min−1 (Equation (1)). and 0 refer to the measured heat flow and the baseline, respectively. The masses of paraffin waxes and temperature programs for the specific heat measurements are presented in Table 2.
- DSC measurements at a heating–cooling rate of 0.2 °C.min−1
DSC measurements were performed at a heating–cooling rate of 0.2 °C.min−1. They were used to highlight the effect of the heating–cooling rate on the temperatures and the latent heats of the melting and solidification of the paraffin waxes. The parameters of these measurements are indicated in Table 3.
2.2.2. Thermogravimetric Analysis (TGA)
The thermal degradation of the paraffin waxes was assessed using a TGA 4000 (Perkin Elmer, Waltham, MA, USA) at a temperature range of 20 °C to 400 °C at a heating rate of 5 °C.min−1 under nitrogen atmosphere. The mass and the temperature accuracies of this apparatus are 0.02% and 1 °C, respectively [40]. The weight of the samples varied between 10.000 (0.0020) mg and 20.0000 (0.0040) mg. The first aim of conducting the TGA measurements was to study the thermal stability of the paraffins. Their second goal was to determine the temperature of the degradation of each paraffin for safety reasons. The evolutions of the derivative weights with temperature were also studied to investigate the kinetics of the degradation of the paraffin waxes.
2.2.3. Transient Plane Source Technique (Hot Disk)
- Principle
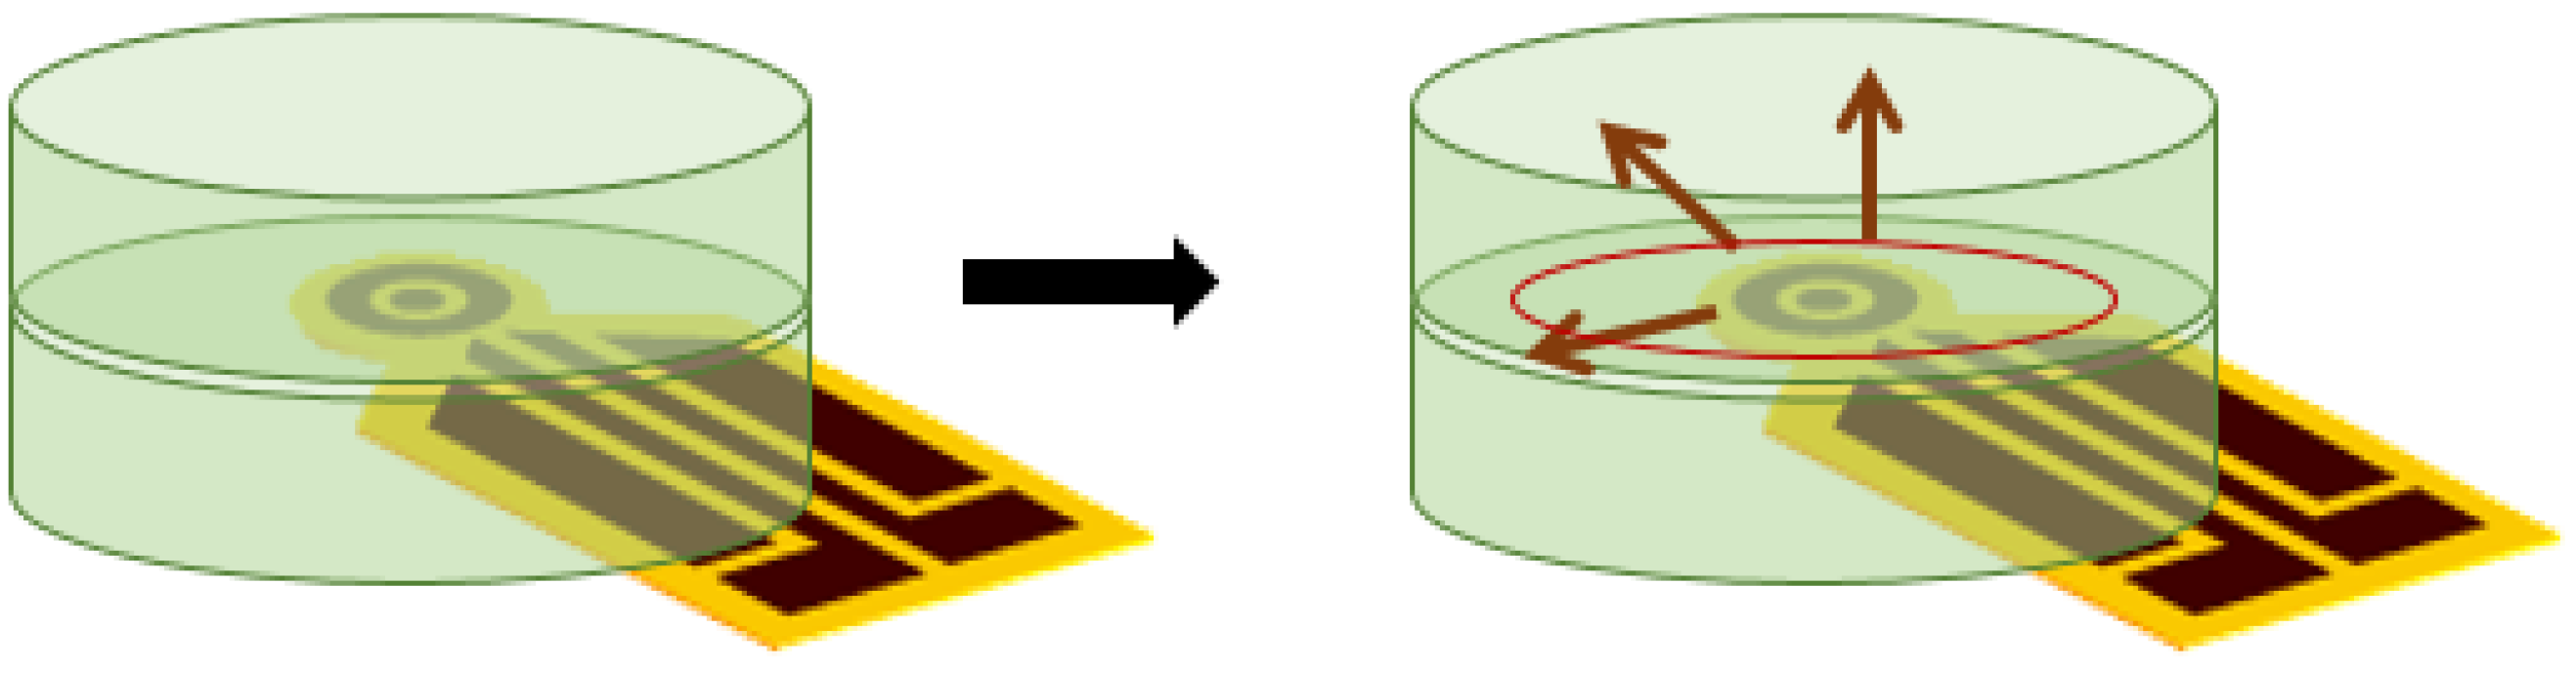
The transient plane source technique (hot disk) was used for the simultaneous measurement of the thermal conductivities and diffusivities of paraffins in the solid and liquid phases. This method uses a plane sensor made of electrical resistances in the shape of a double spiral and insulated by a Kapton film (Figure 4). The sensor is sandwiched between two identical samples and acts as a heater and as a resistance temperature detector (Figure 4). The temperature increase in the sensor depends on the thermophysical properties of the samples. It is analyzed by means of numerical models consistent with experimental conditions to determine the thermal conductivity and diffusivity of the sample. More details about the principle of the hot disk method are featured in the literature [41,42,43].
- Specifications of the thermal analyzer
The thermal conductivities and diffusivities of paraffins were measured using the Hot Disk Thermal Constants Analyzer TPS 2500. The accuracies of the thermal conductivity and diffusivity measurements are 5% and 10%, respectively, in accordance with ISO22007-2 [44]. The apparatus is equipped with Hot Disk Thermal Analyzer 7.3 software, which uses an isotropic model [41,42,43] to measure the thermal conductivity and diffusivity of the samples. The specific heat of the sensor is taken into consideration in this model.
- Measurements in the solid phase
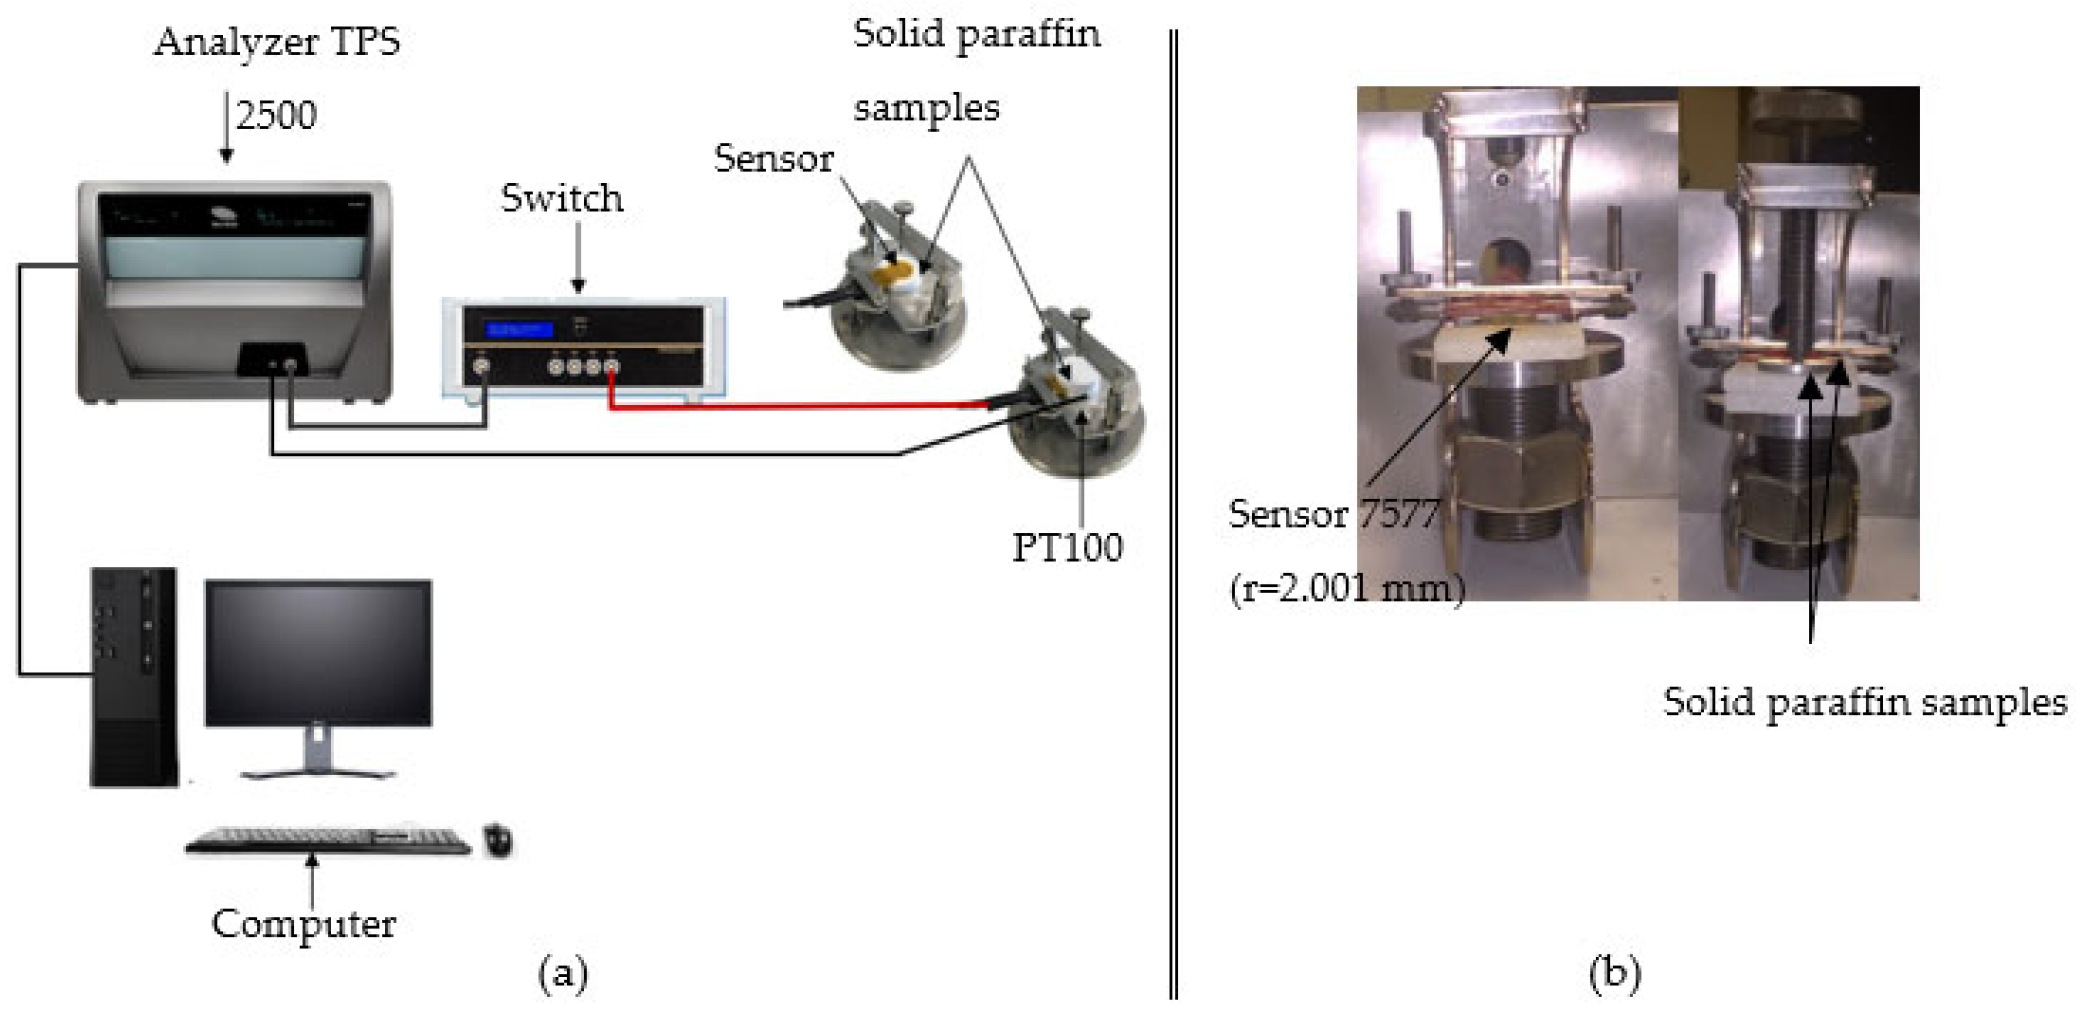
The thermal conductivities and diffusivities of the solid paraffin samples were measured at different temperatures using the experimental setup presented in Figure 5a. A 7577 sensor with a radius of 2001 mm was sandwiched between two identical samples (Figure 5a,b). This sensor was connected to a switch that is linked to the analyzer (Hot Disk TPS 2500). A PT100 temperature sensor, connected to the analyzer, measured the sample temperature. The applied heating power and the measurement time were 20 mW and 40 s, respectively. The measurements were performed at least three times to ensure repeatability. The overall result at each temperature was the average of the repeated measurements. Standard deviations were calculated to evaluate the uncertainties of the average thermal conductivities and diffusivities.
- Measurements in the liquid phase
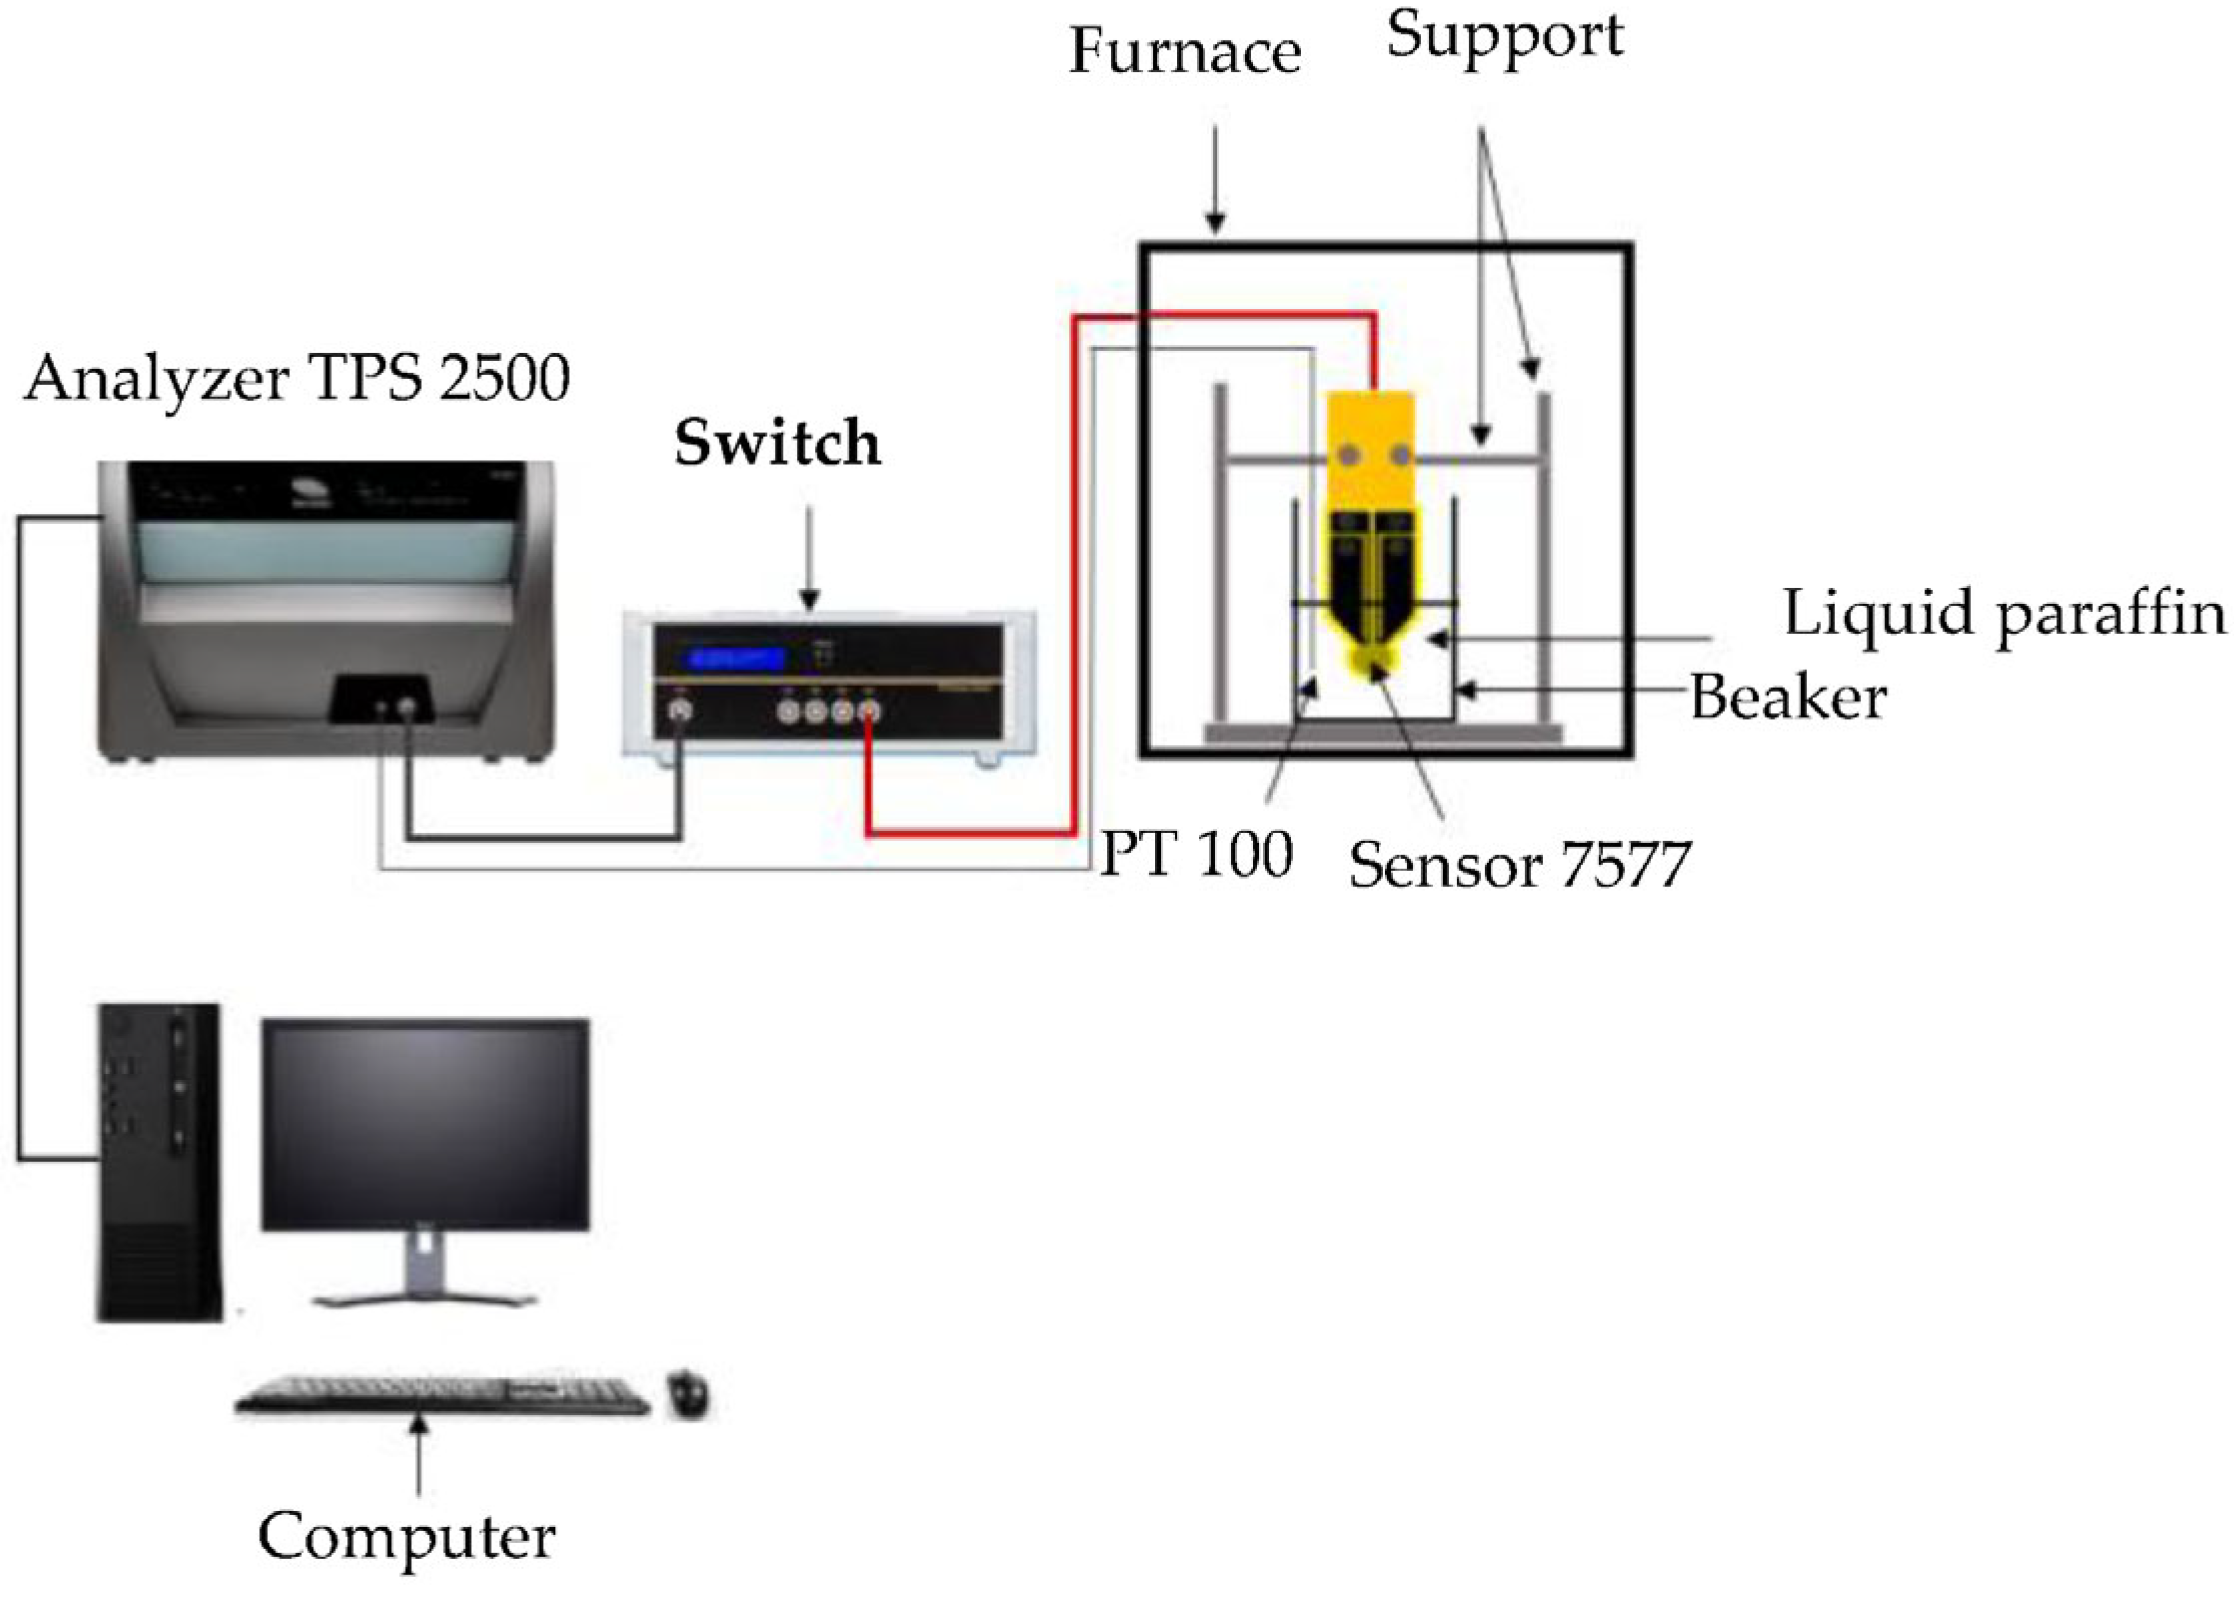
Figure 6 illustrates the experimental procedure of the hot disk method for the characterization of the paraffins in the liquid phase. The 7577 sensor was immersed in 5.216 × 10⁻⁵ m3 of the liquid paraffin in a beaker and was is connected to the TPS 2500 analyzer by means of the switch. The measurements were conducted at different temperatures in a furnace. The beaker was closed with polystyrene and covered with aluminum sheet in the furnace to avoid the movement of the liquid paraffin caused by the furnace fan (Figure 7).
The heating power and the measurement time were 12 mW and 4 s, respectively. These parameters ensure a temperature increase of the sensor without the onset of the natural convection in the liquid paraffin. More details about the selection criteria of the parameters of the hot disk measurements in the liquid state can be found in the literature [45,46,47]. The measurements were carried out at least three times.
2.2.4. Density Measurement
The densities of paraffins, defined in Equation (2), were measured in the solid and liquid states. The measurements were conducted using pycnometers (glass containers with a volume accurately known thanks to their glass stopper) and a balance with a precision of 0.001 g.
- Measurements in the solid phase
The measurements of the density of a paraffin in the solid state were performed using the following experimental procedure: First, the empty and dry pycnometer with mass of m0 is filled up to the stopper with distilled water with known density [48]. The volume of the water VH2O in the pycnometer is given by Equation (3), where m1 refers to the mass of the pycnometer filled with the distilled water. Afterward, the solid sample of paraffin with mass of ms is inserted in the empty and dry pycnometer. A volume of distilled water V′H2O is added up to the stopper of this pycnometer (Equation (4)). m2 indicates the mass of the pycnometer filled with the sample and the volume of water V′H2O. Hence, the volume of the solid sample is given by Equation (5), and the density is yielded from Equation (2).
- Measurements in the liquid phase
The measurements of the density of a paraffin in the liquid state were performed using the following experimental procedure: First, the mass of the empty and dry pycnometer m0 is weighed. Then, a volume of water VH2O is poured into the pycnometer up to the stopper (Equation (6)). m1 indicates the mass of the pycnometer filled with distilled water. Afterward, the dry and empty pycnometer is filled with the liquid paraffin up to the stopper. The mass of the pycnometer filled with paraffin, m2, is measured. Hence, the density of the liquid paraffin is given by Equation (7). The measurements of the density in the liquid phase are performed at different temperatures in a furnace.
3. Results and Discussion
3.1. DSC Results
3.1.1. Temperatures and Latent Heats of Phase Transitions
- Studies of RT21, RT27 and RT50
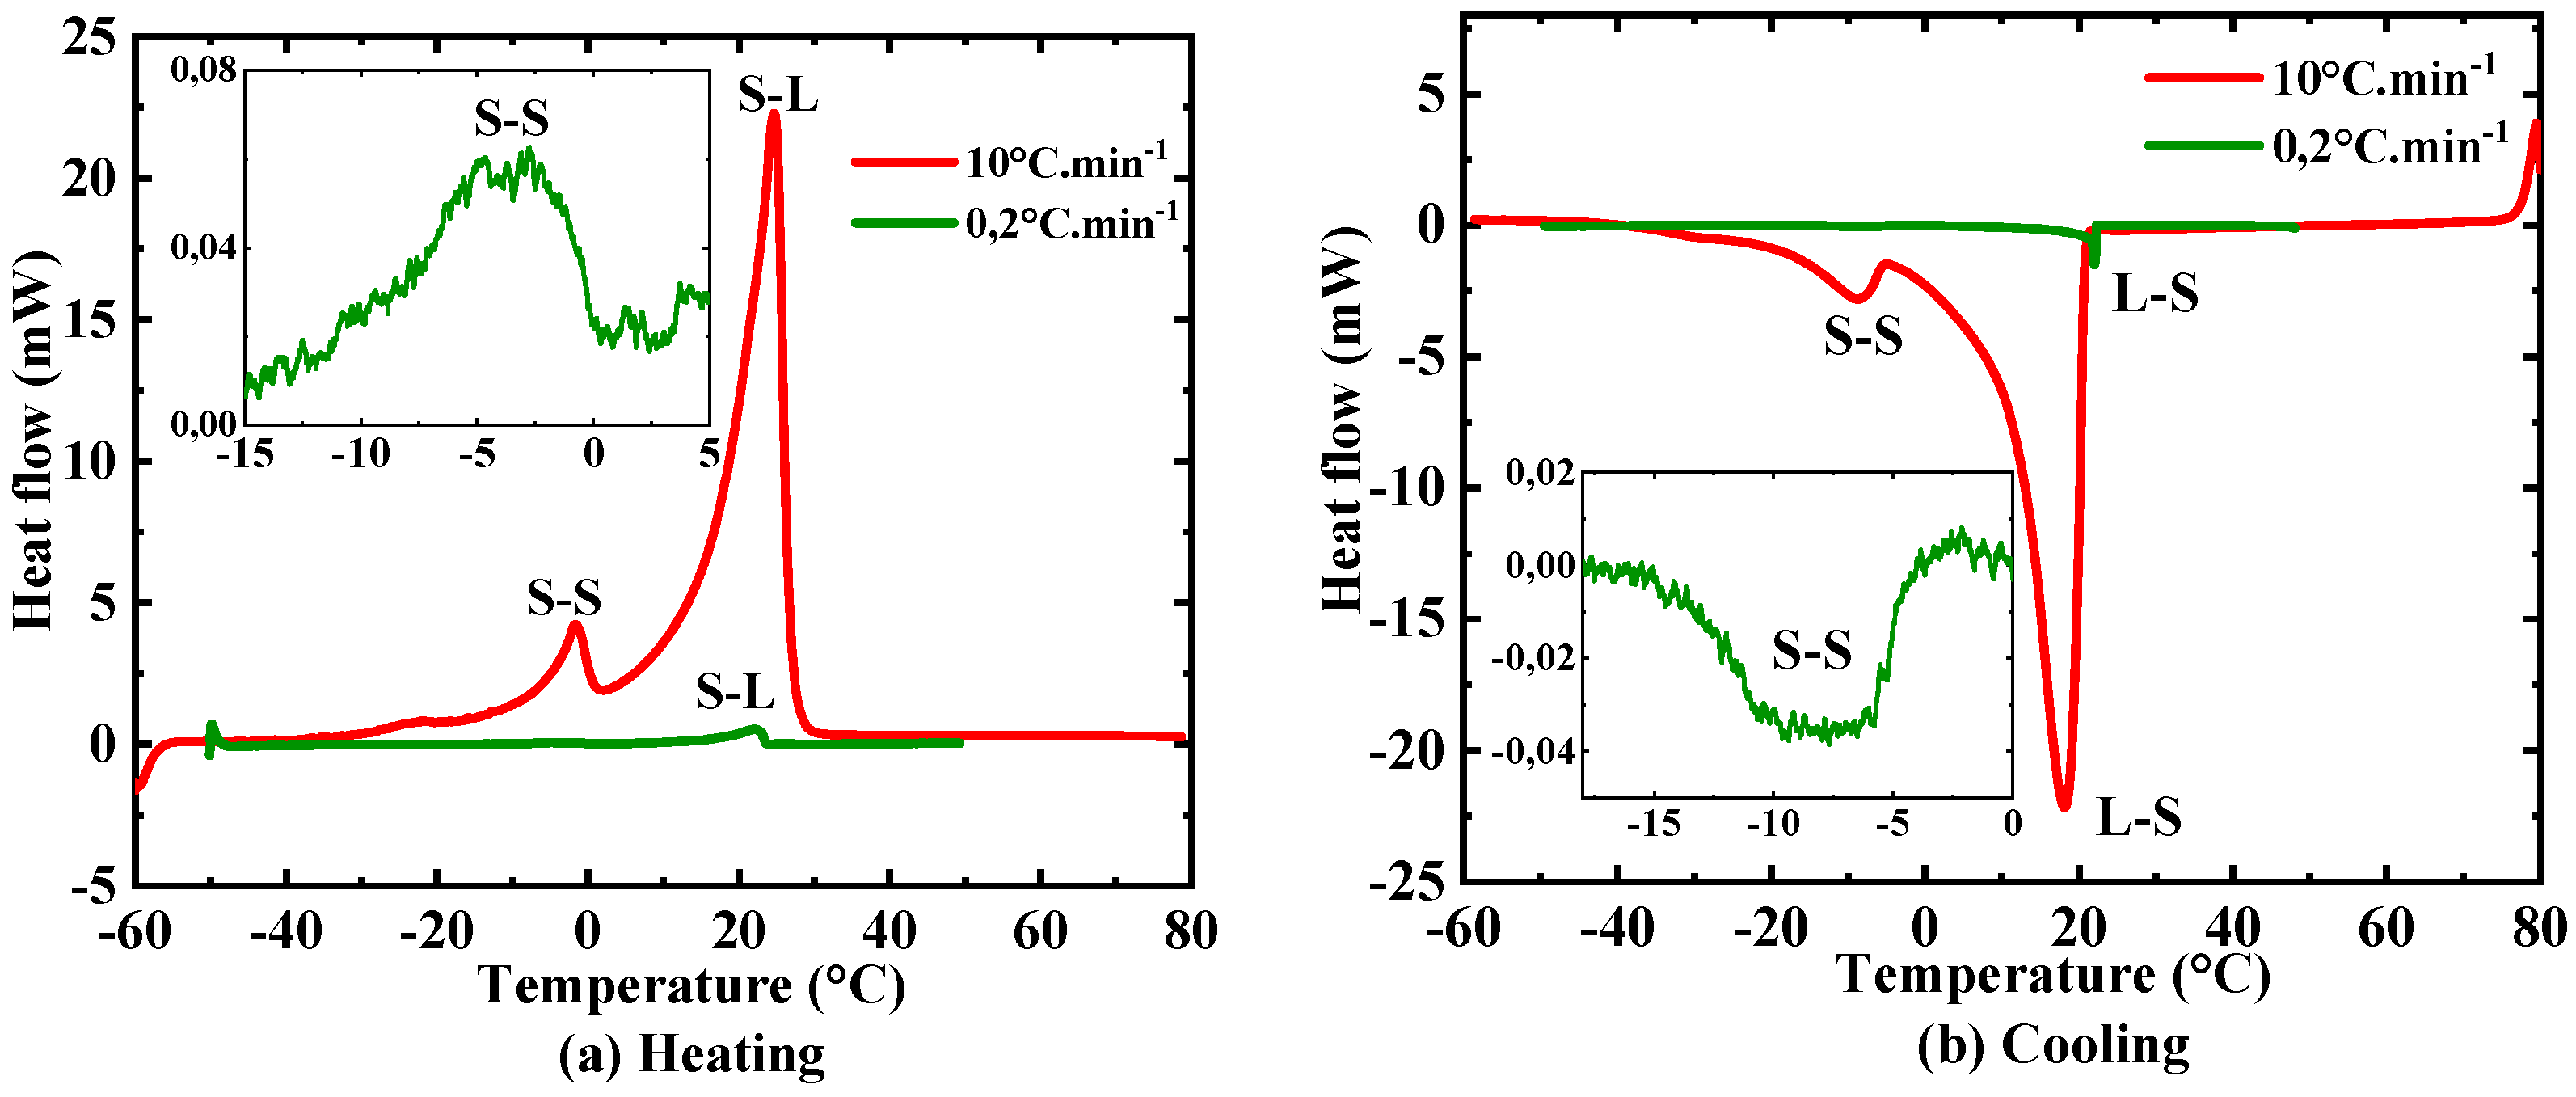
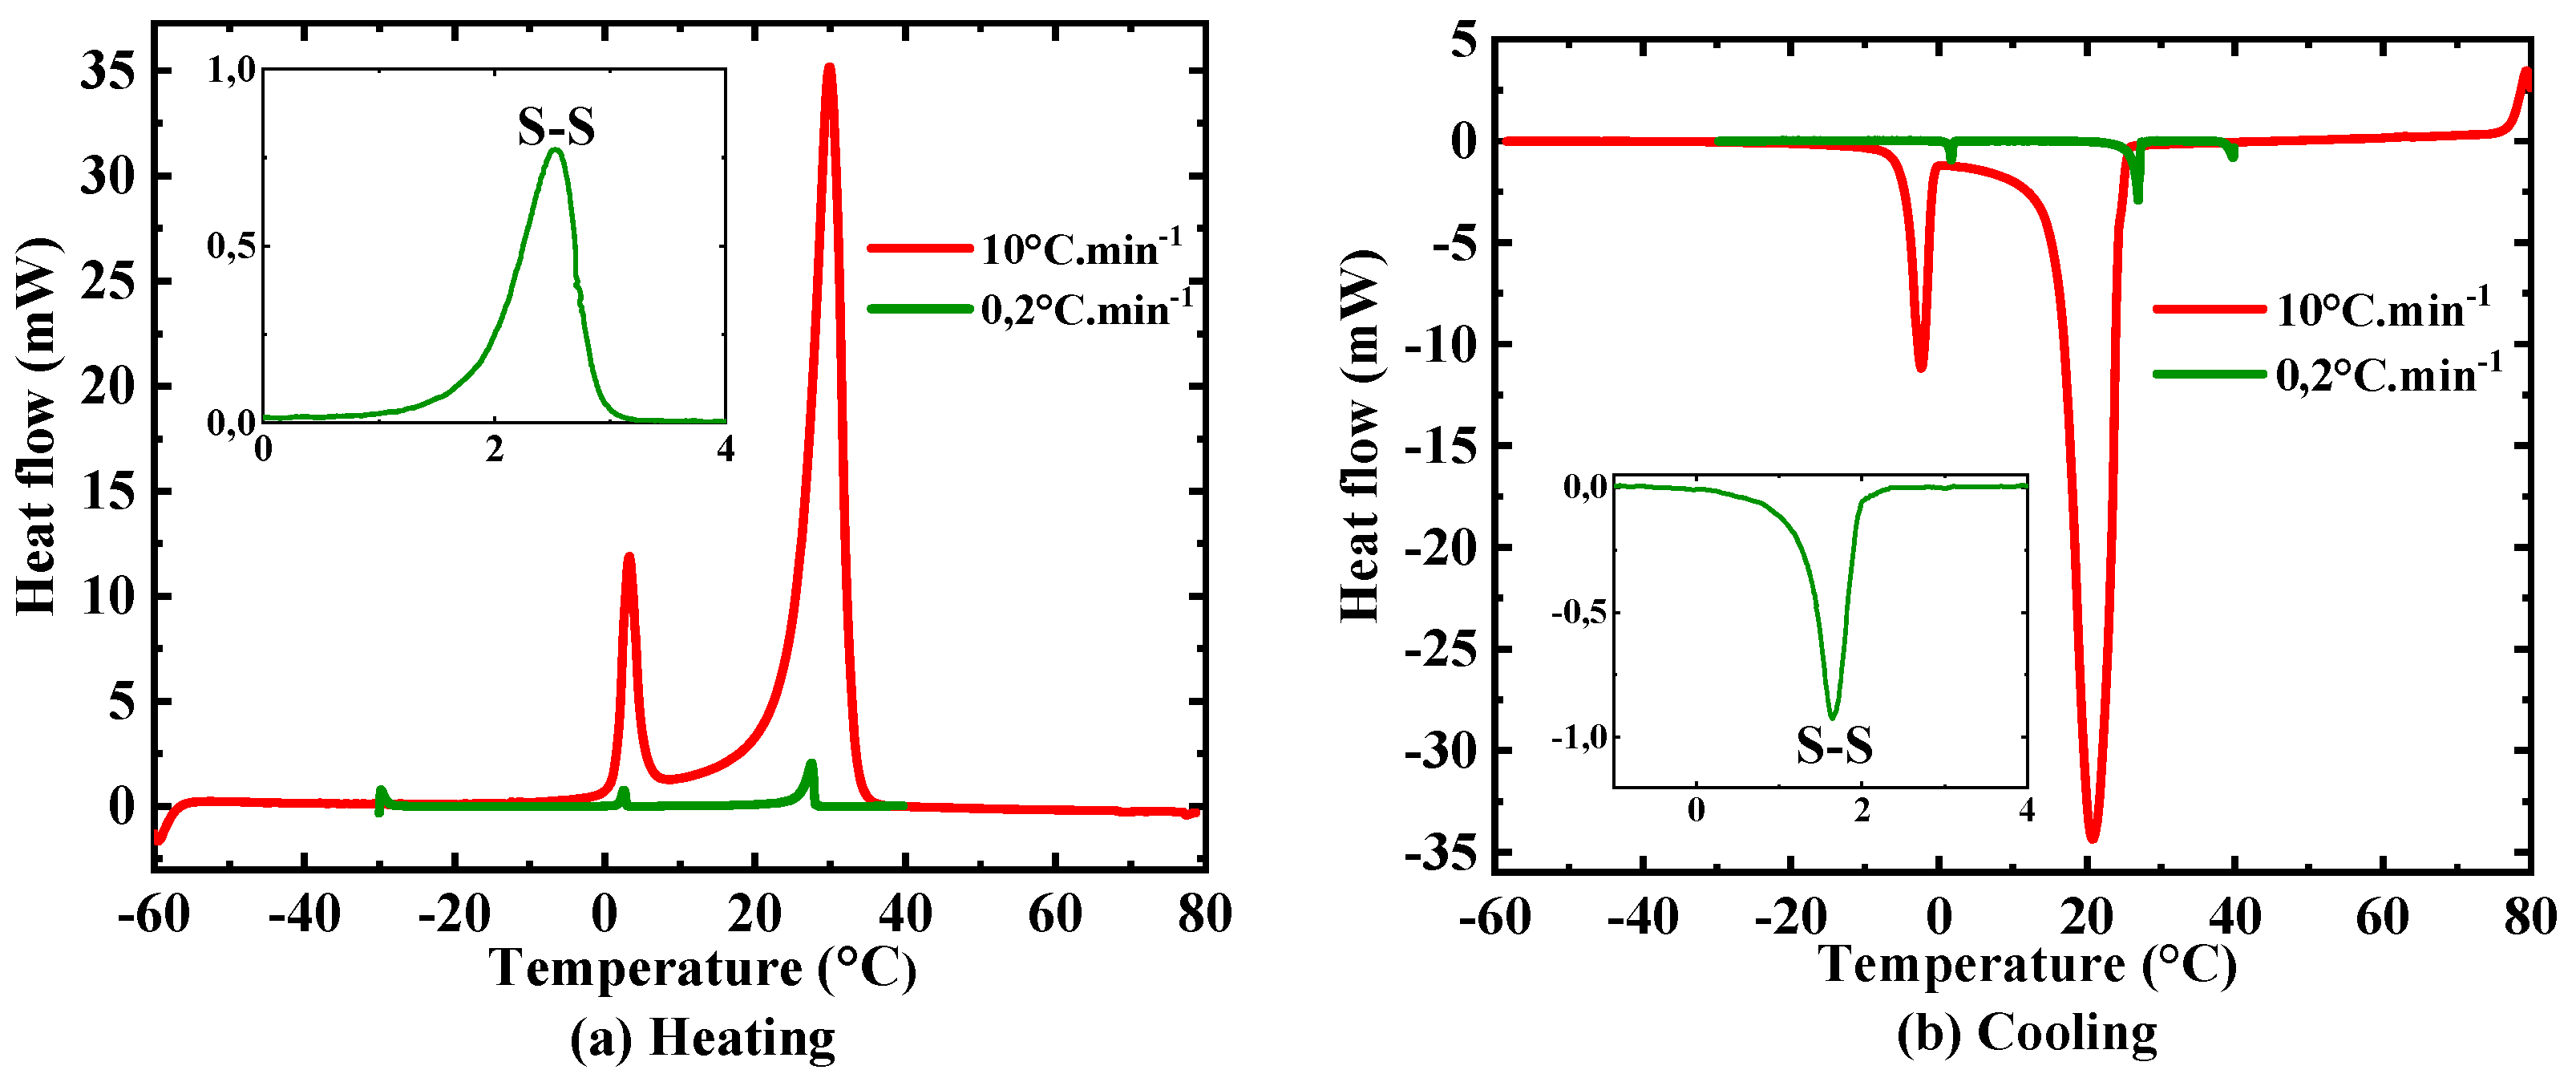
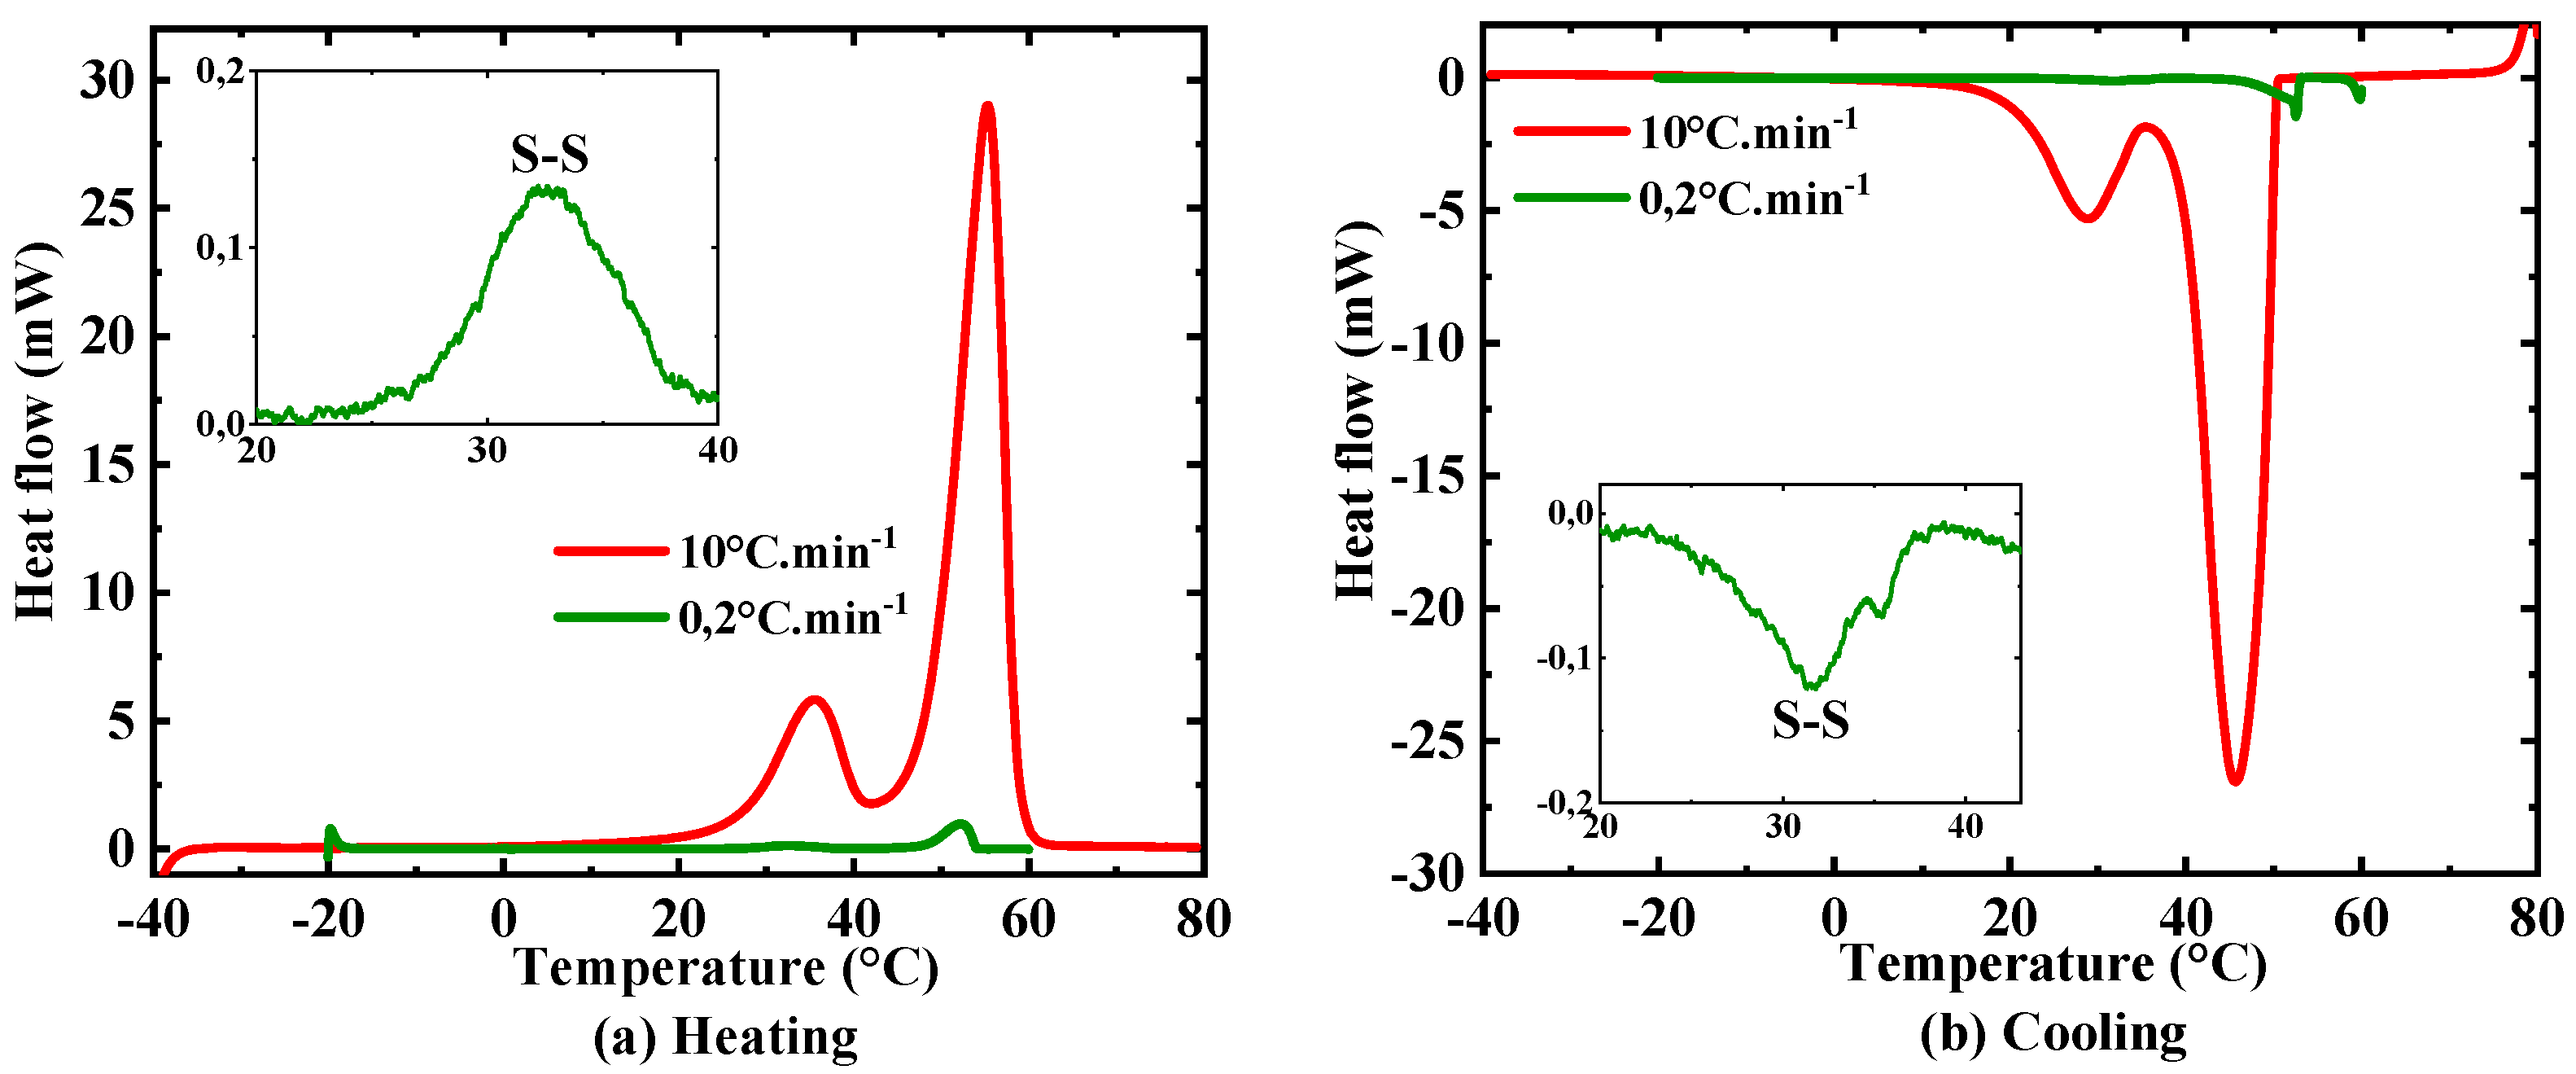
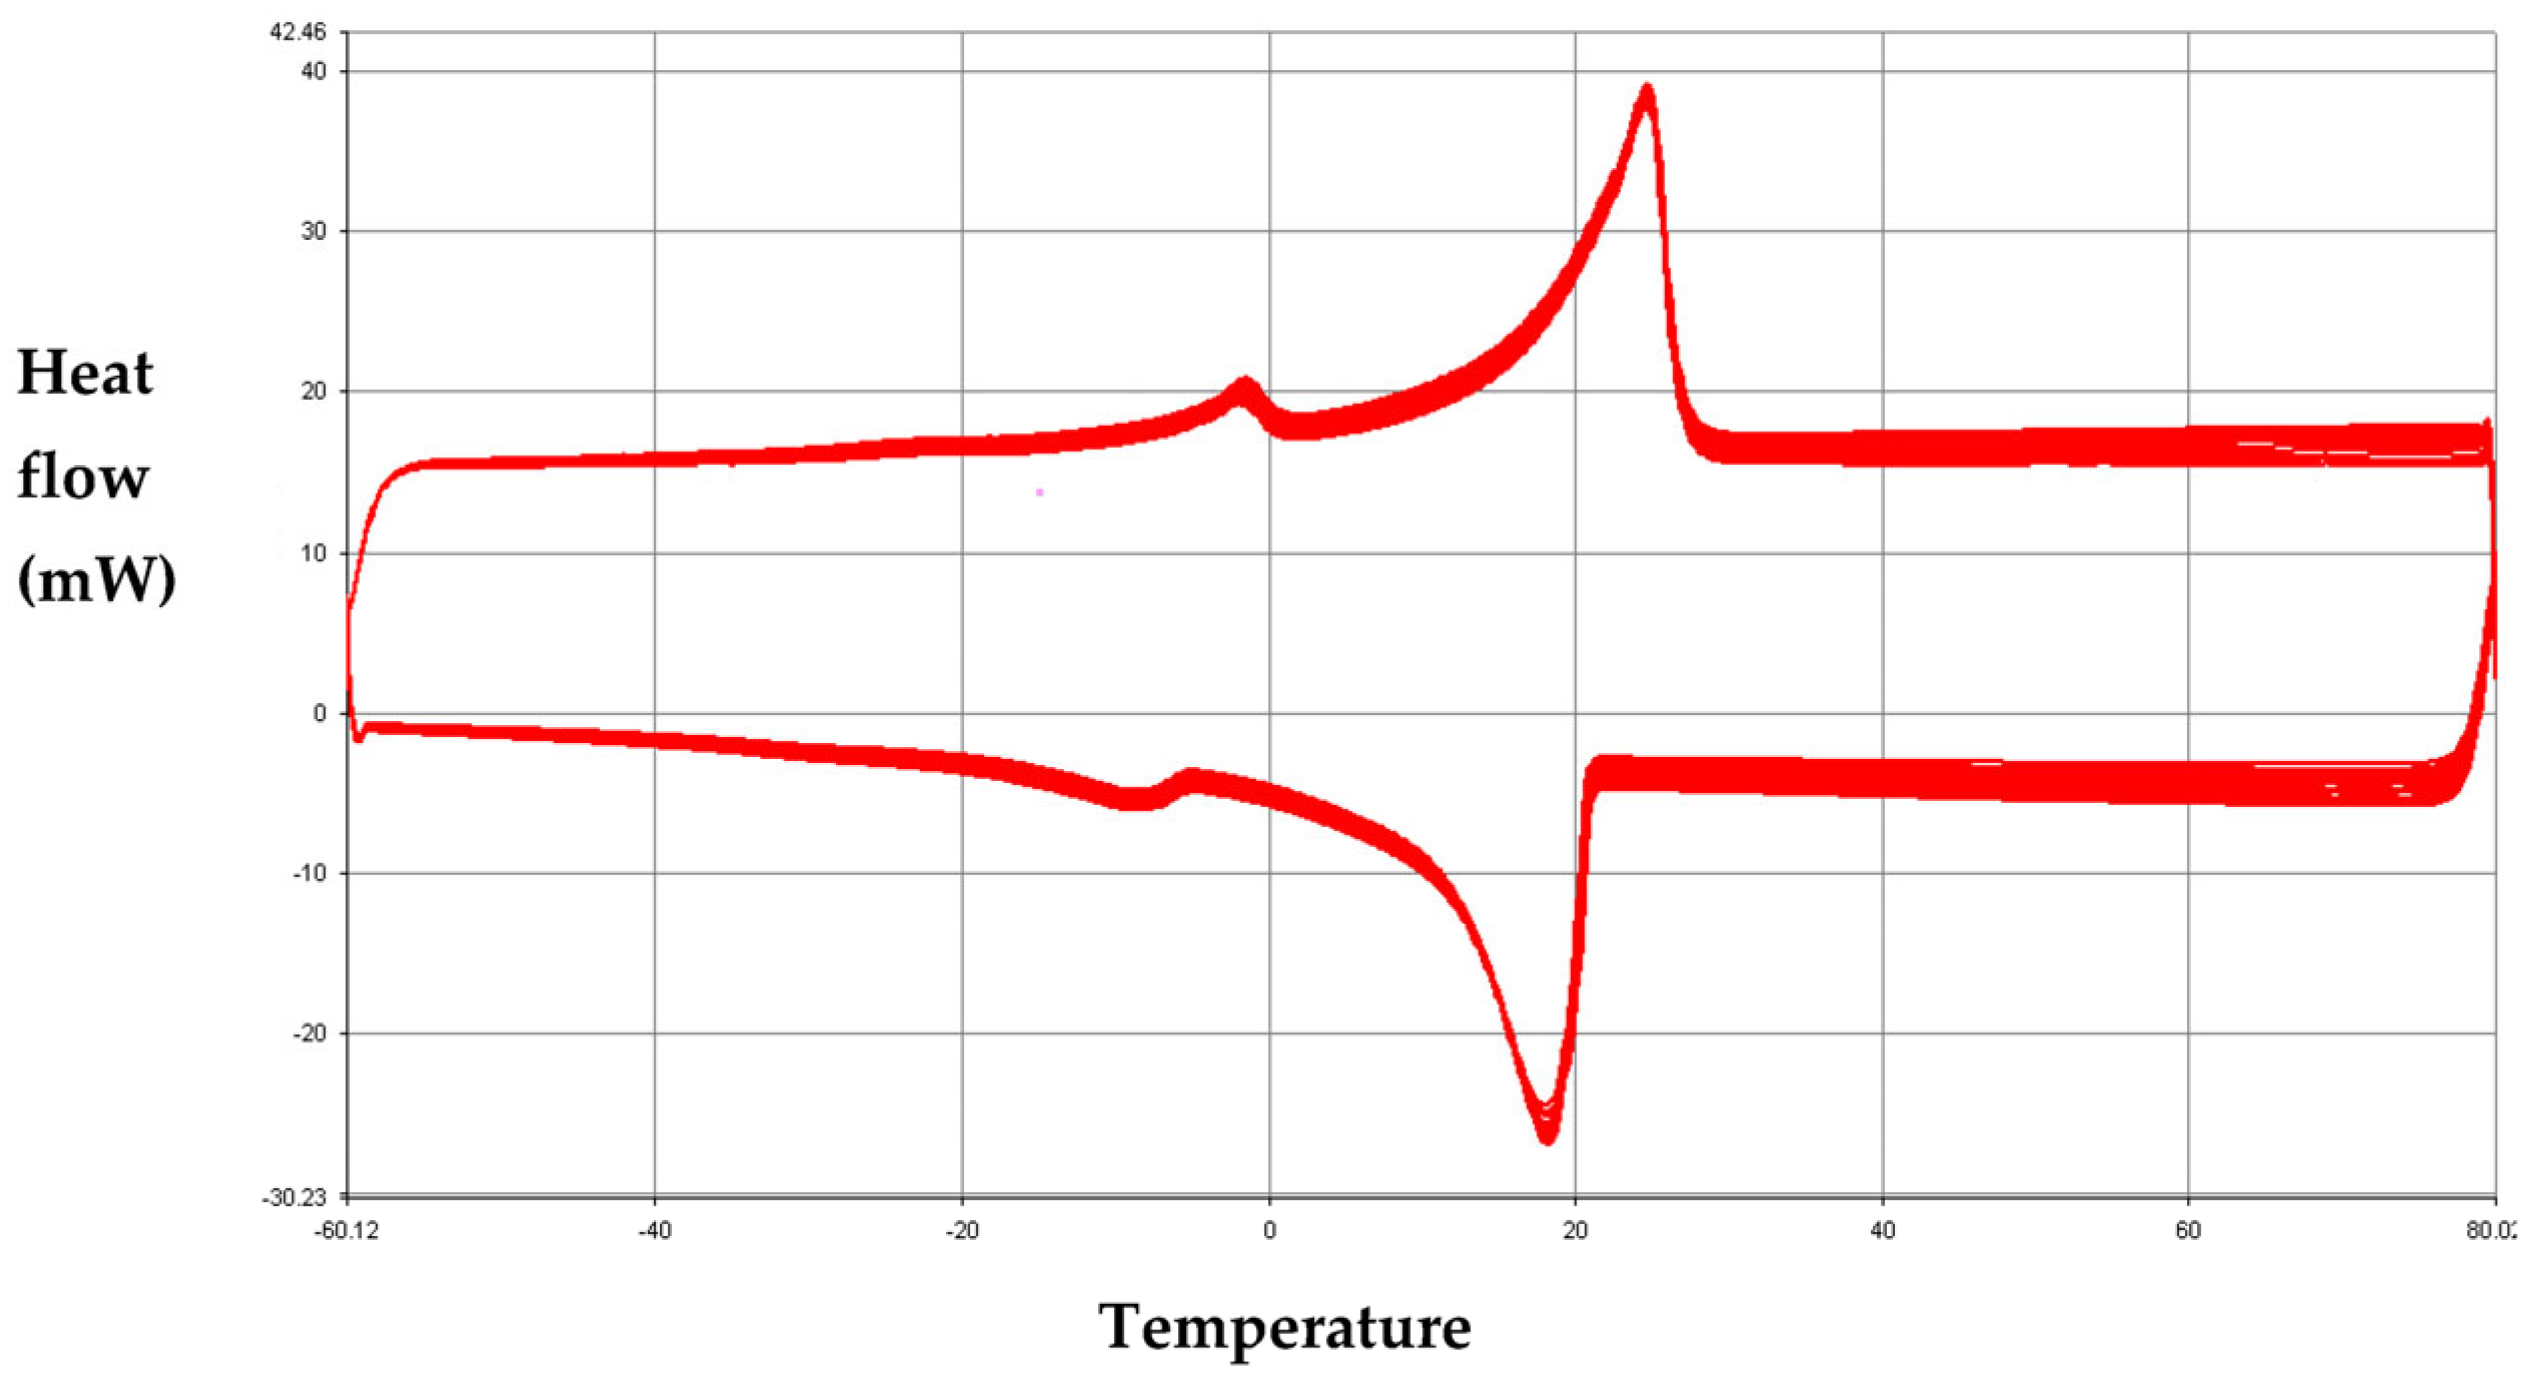
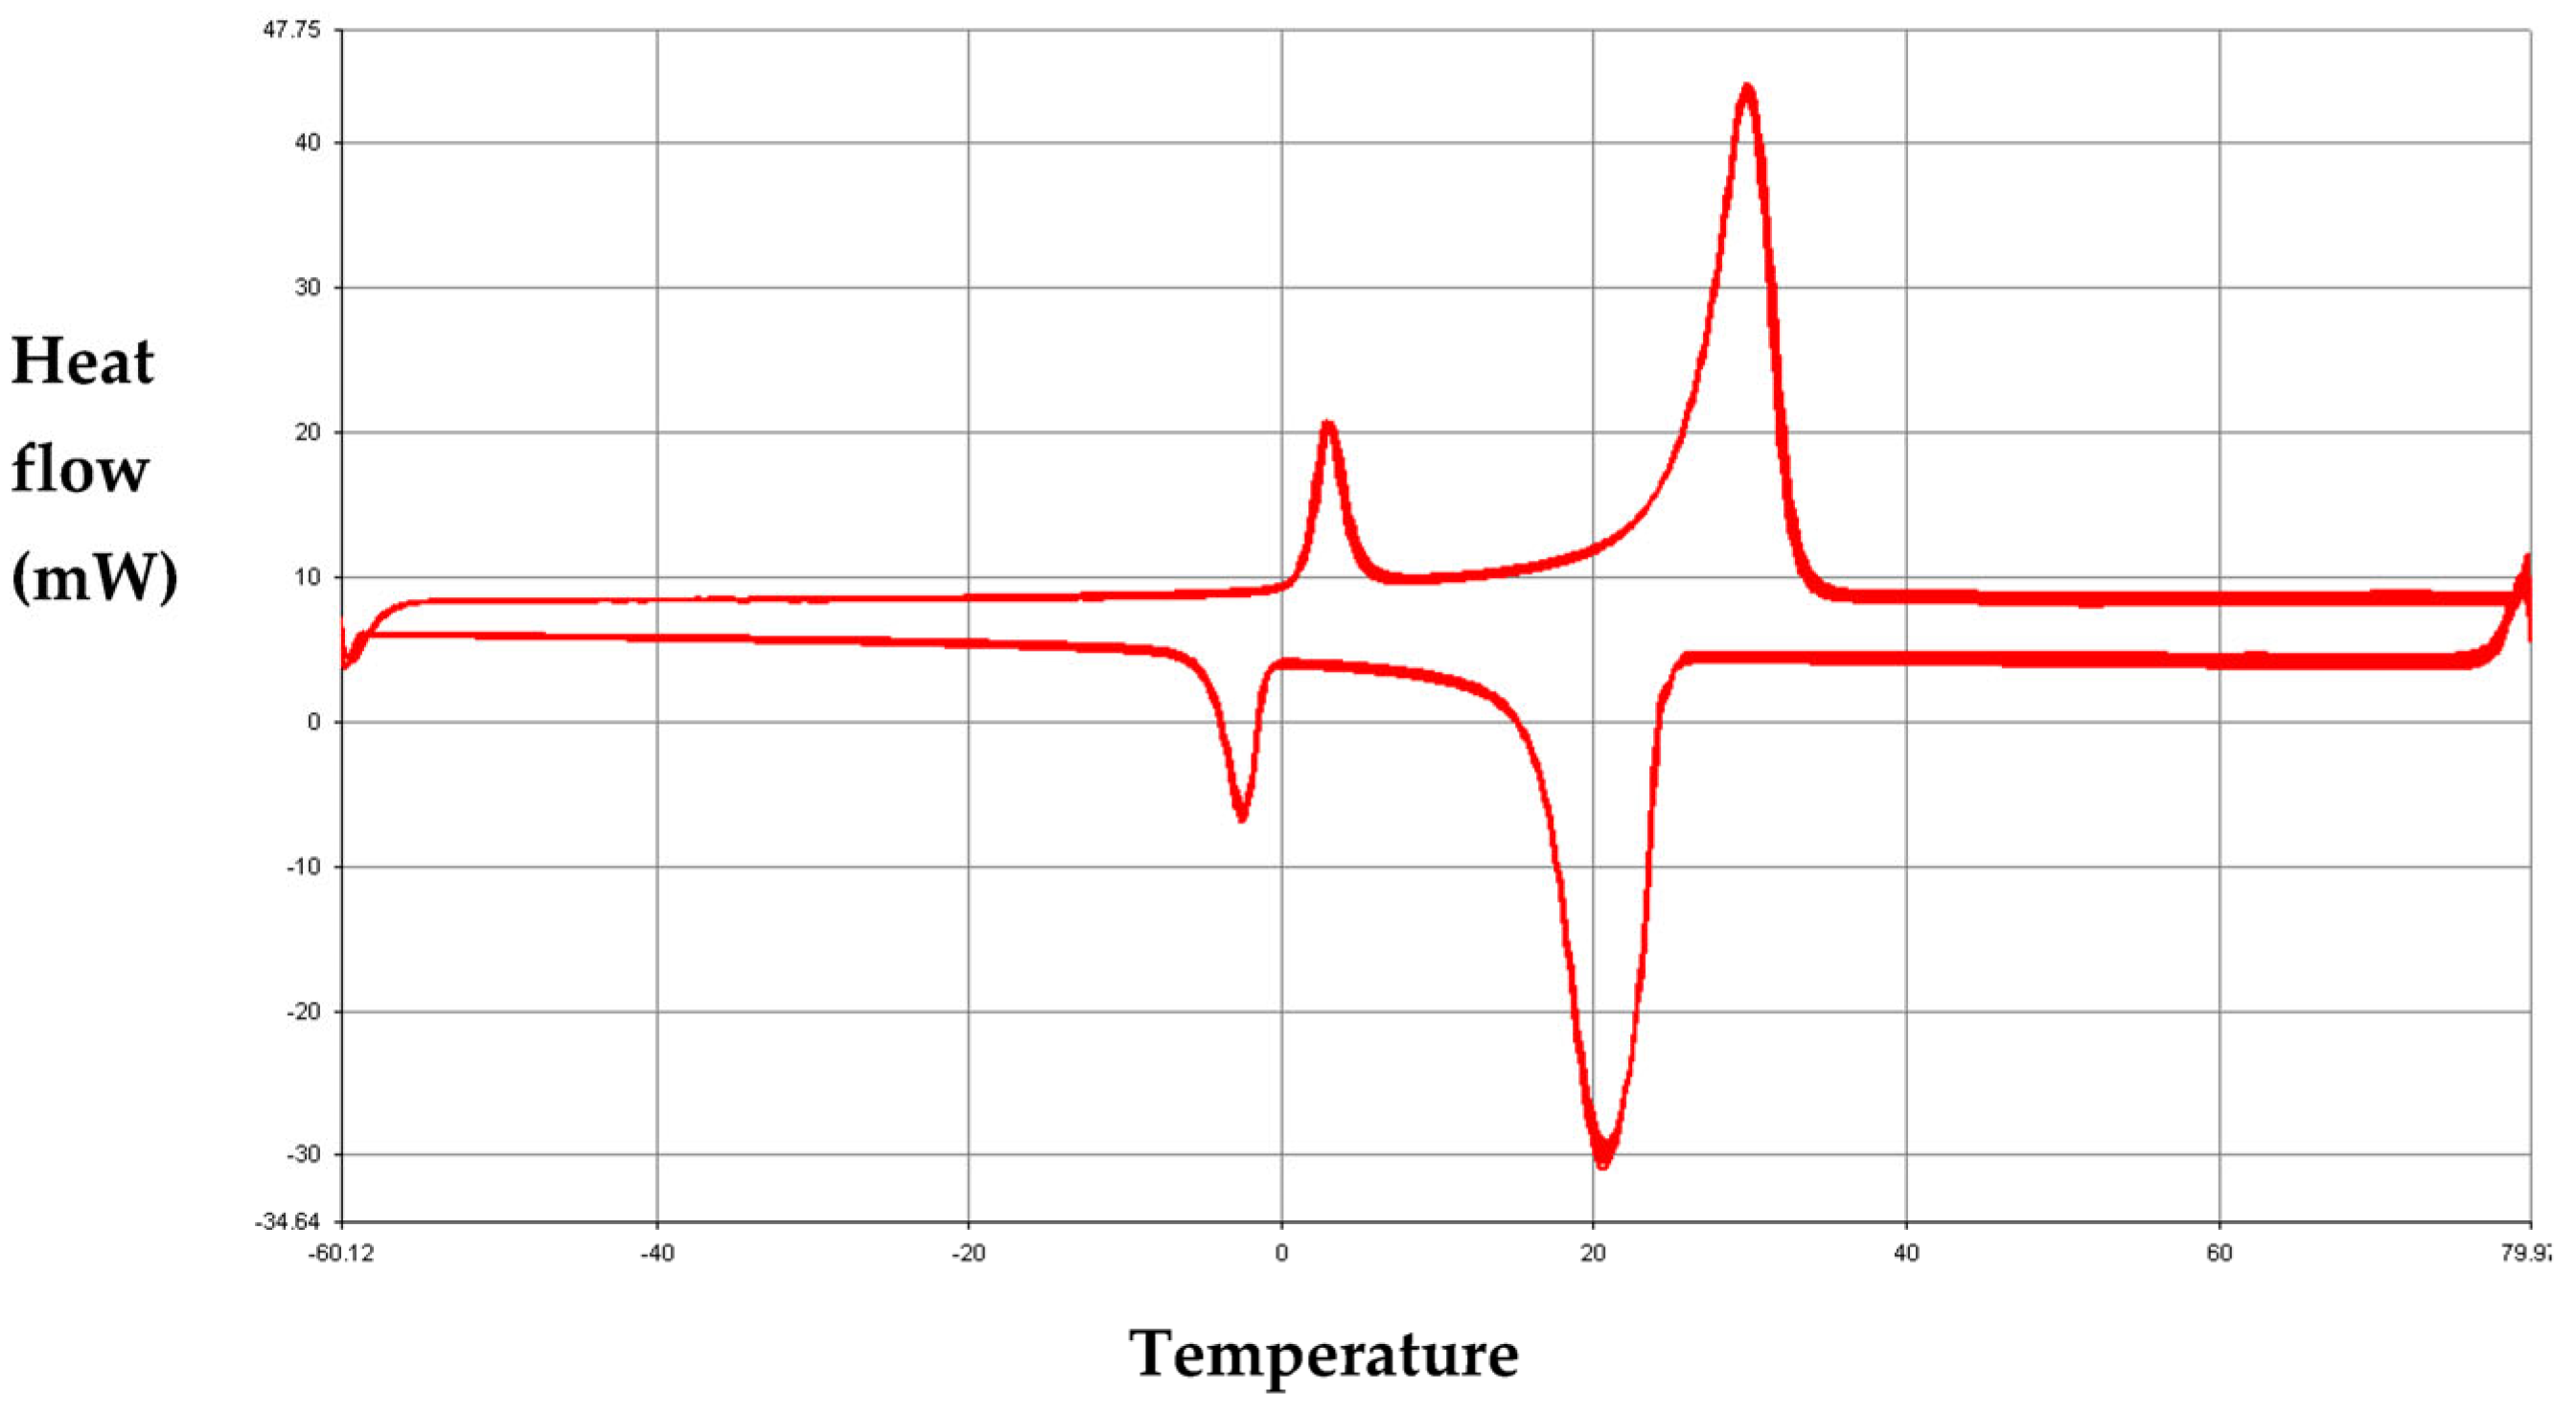
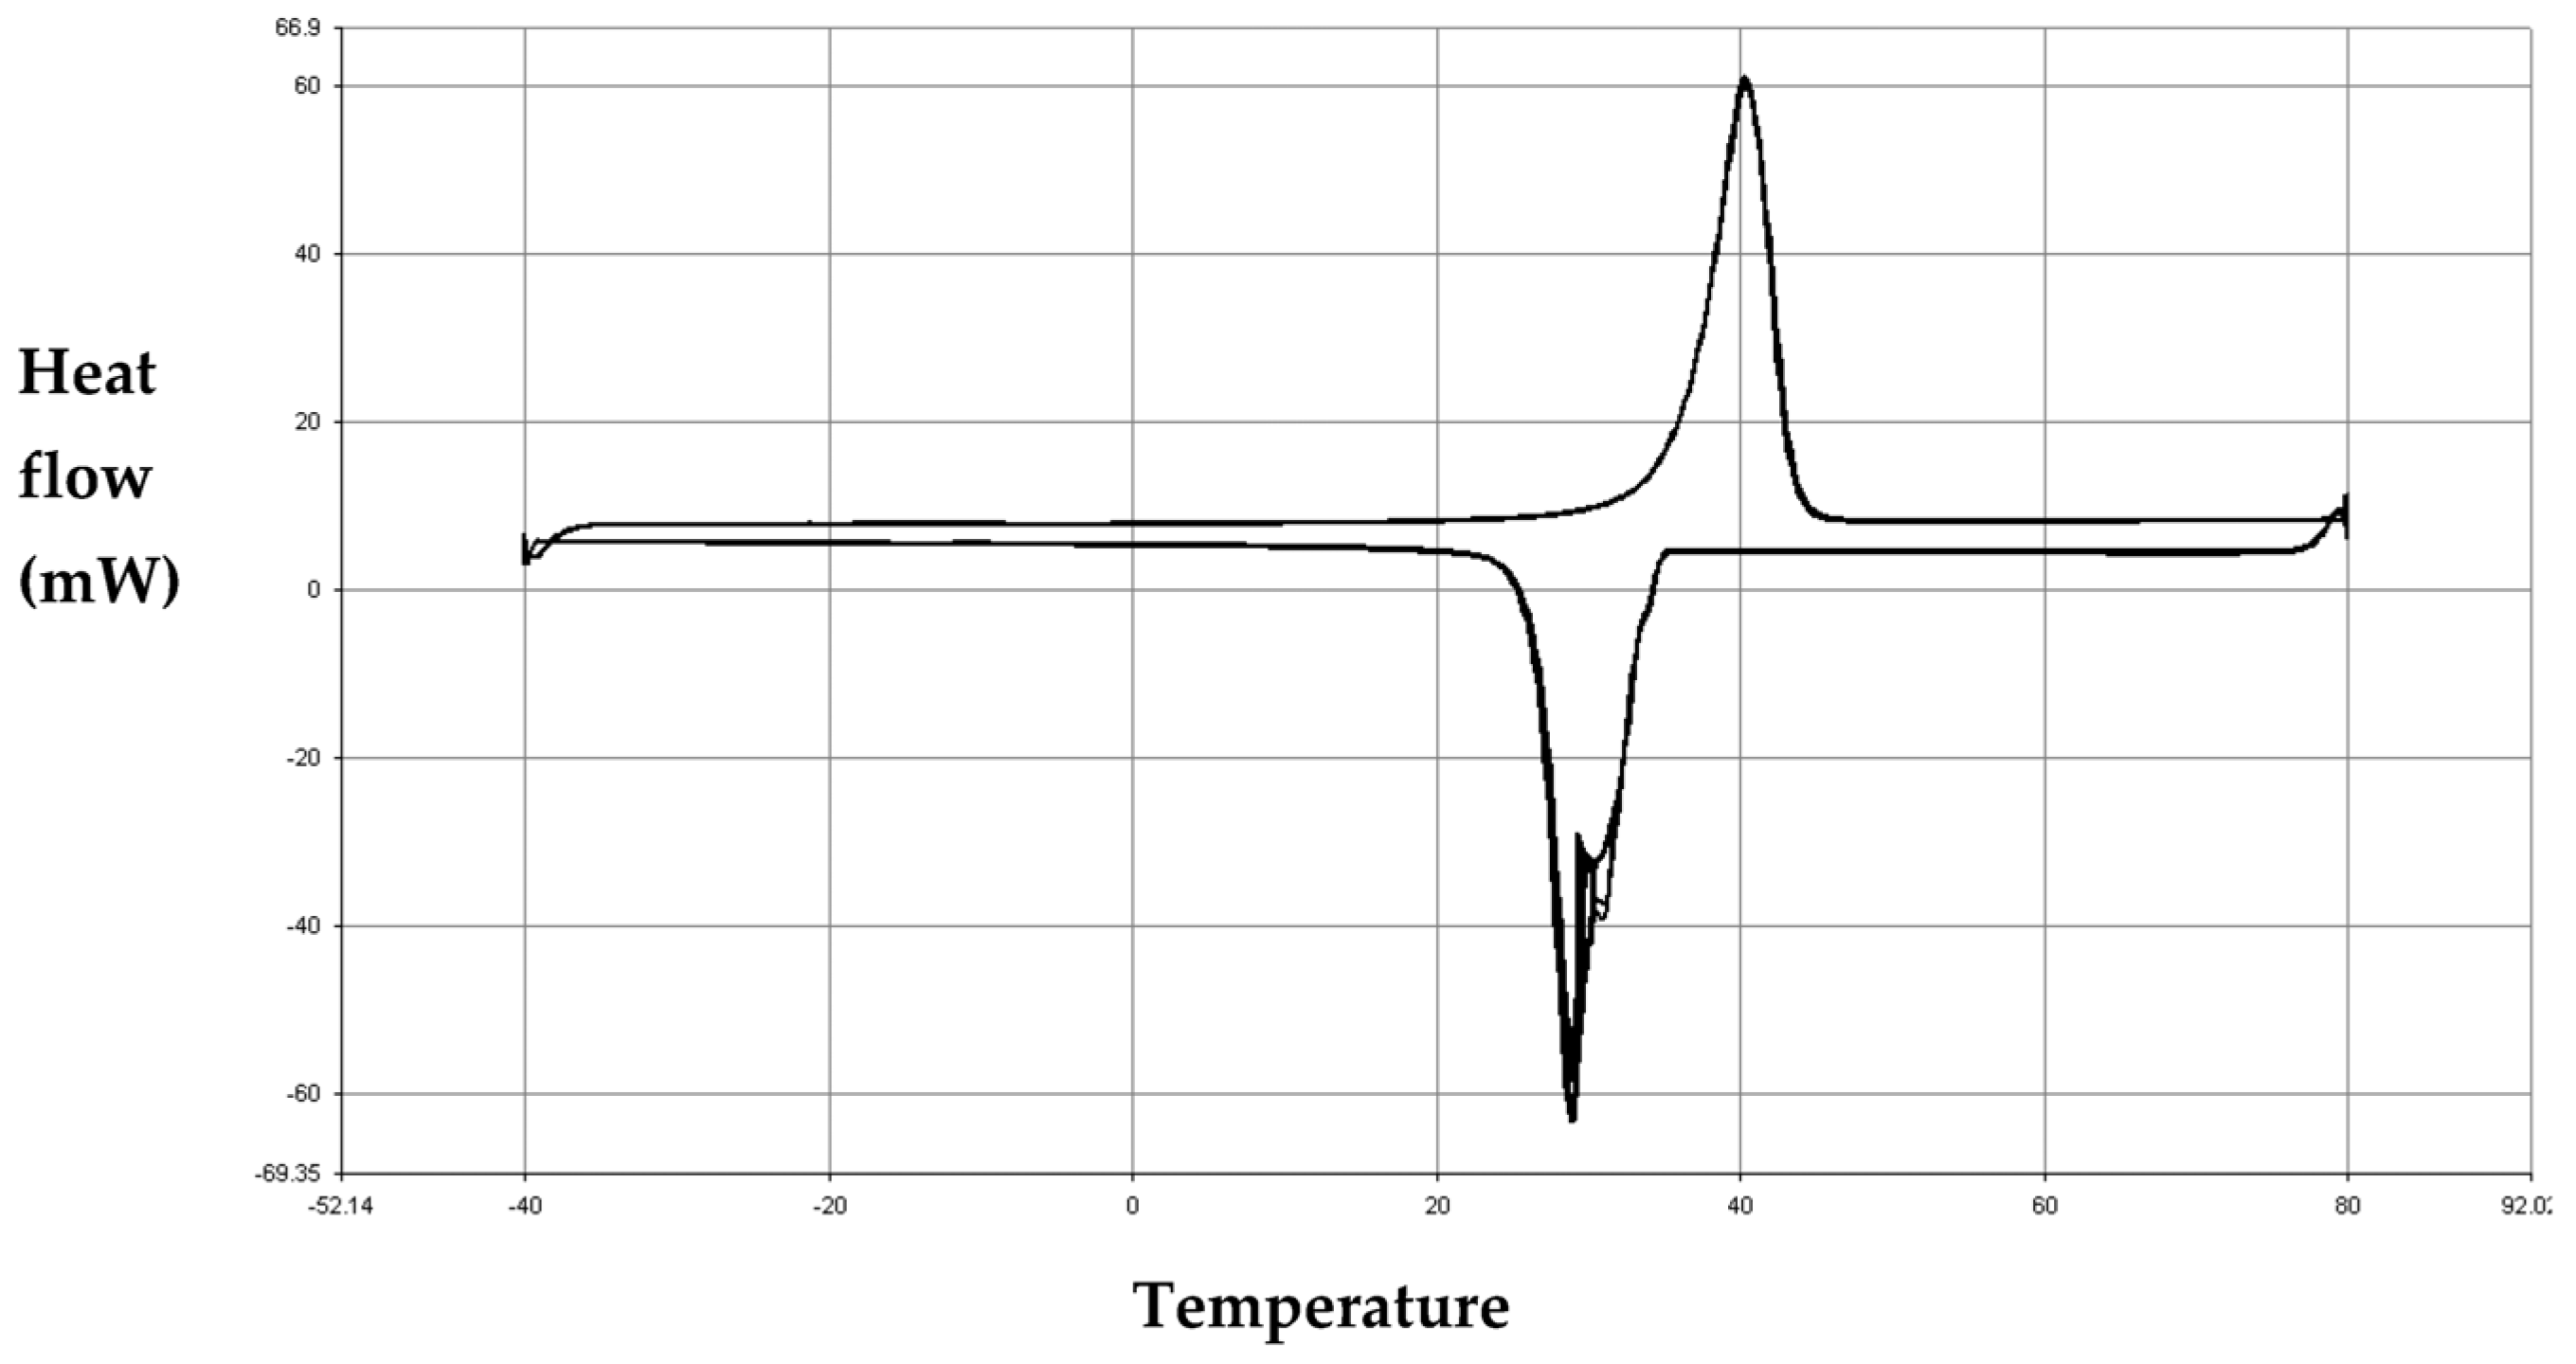
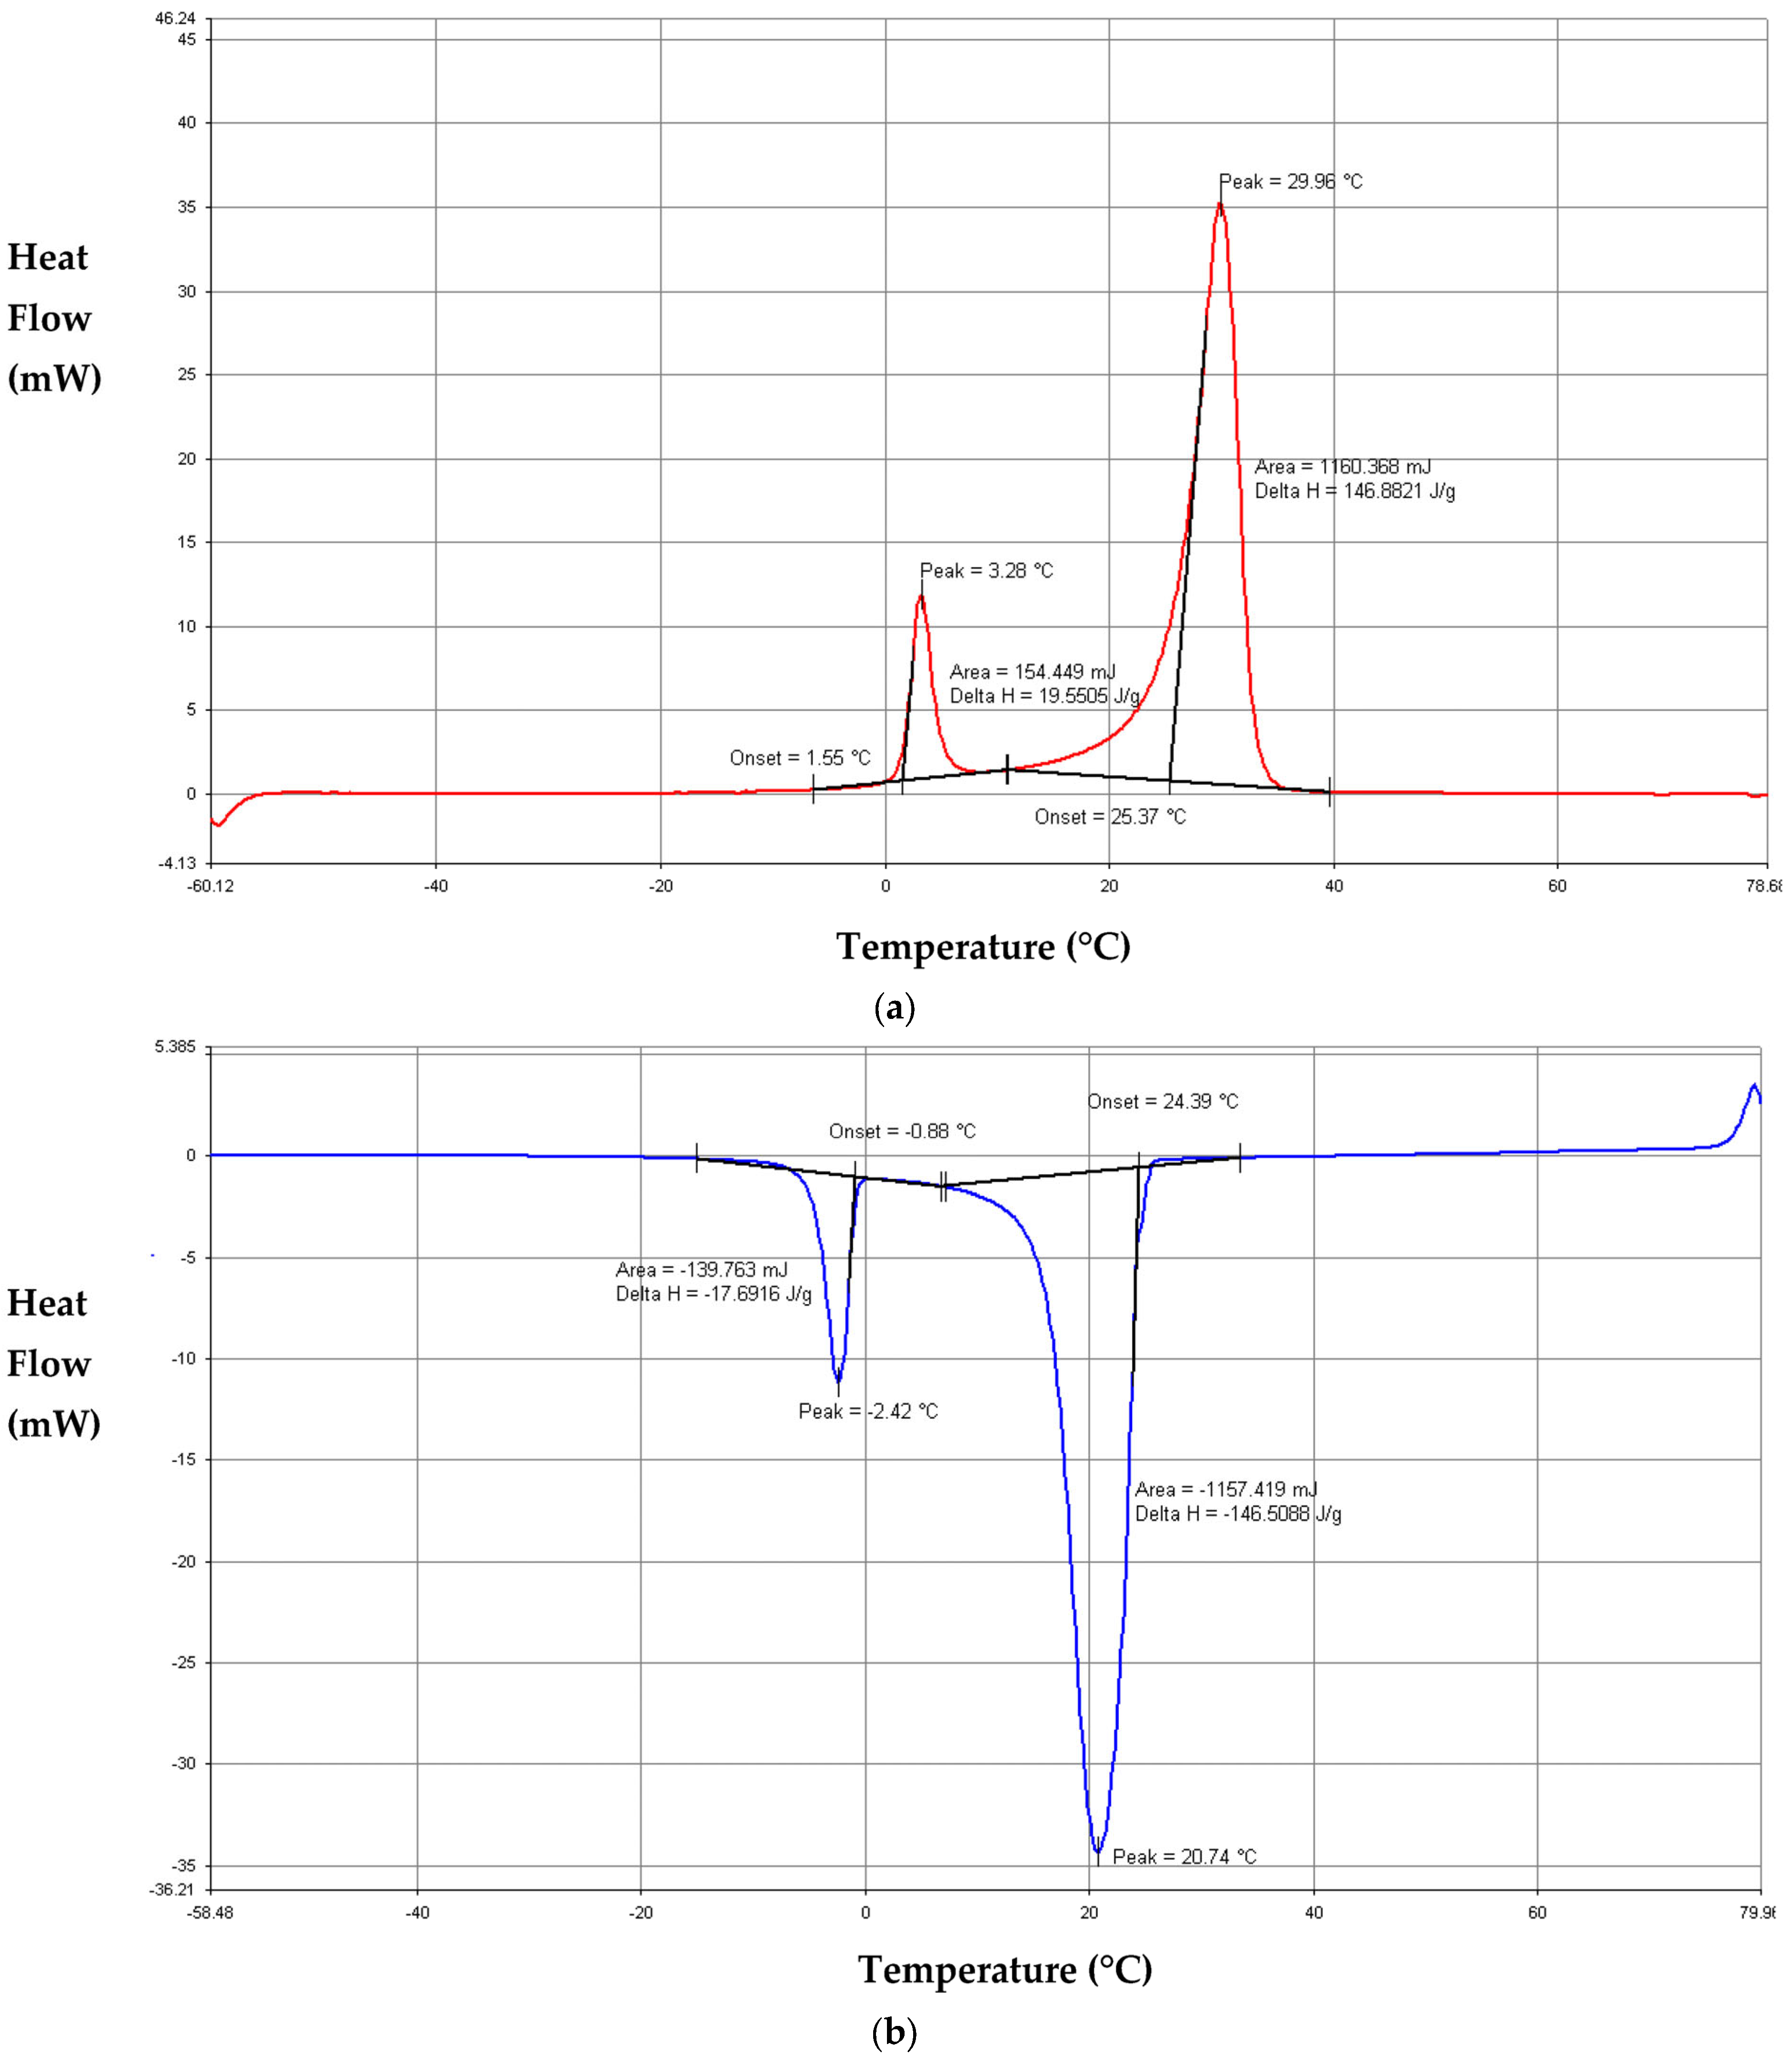
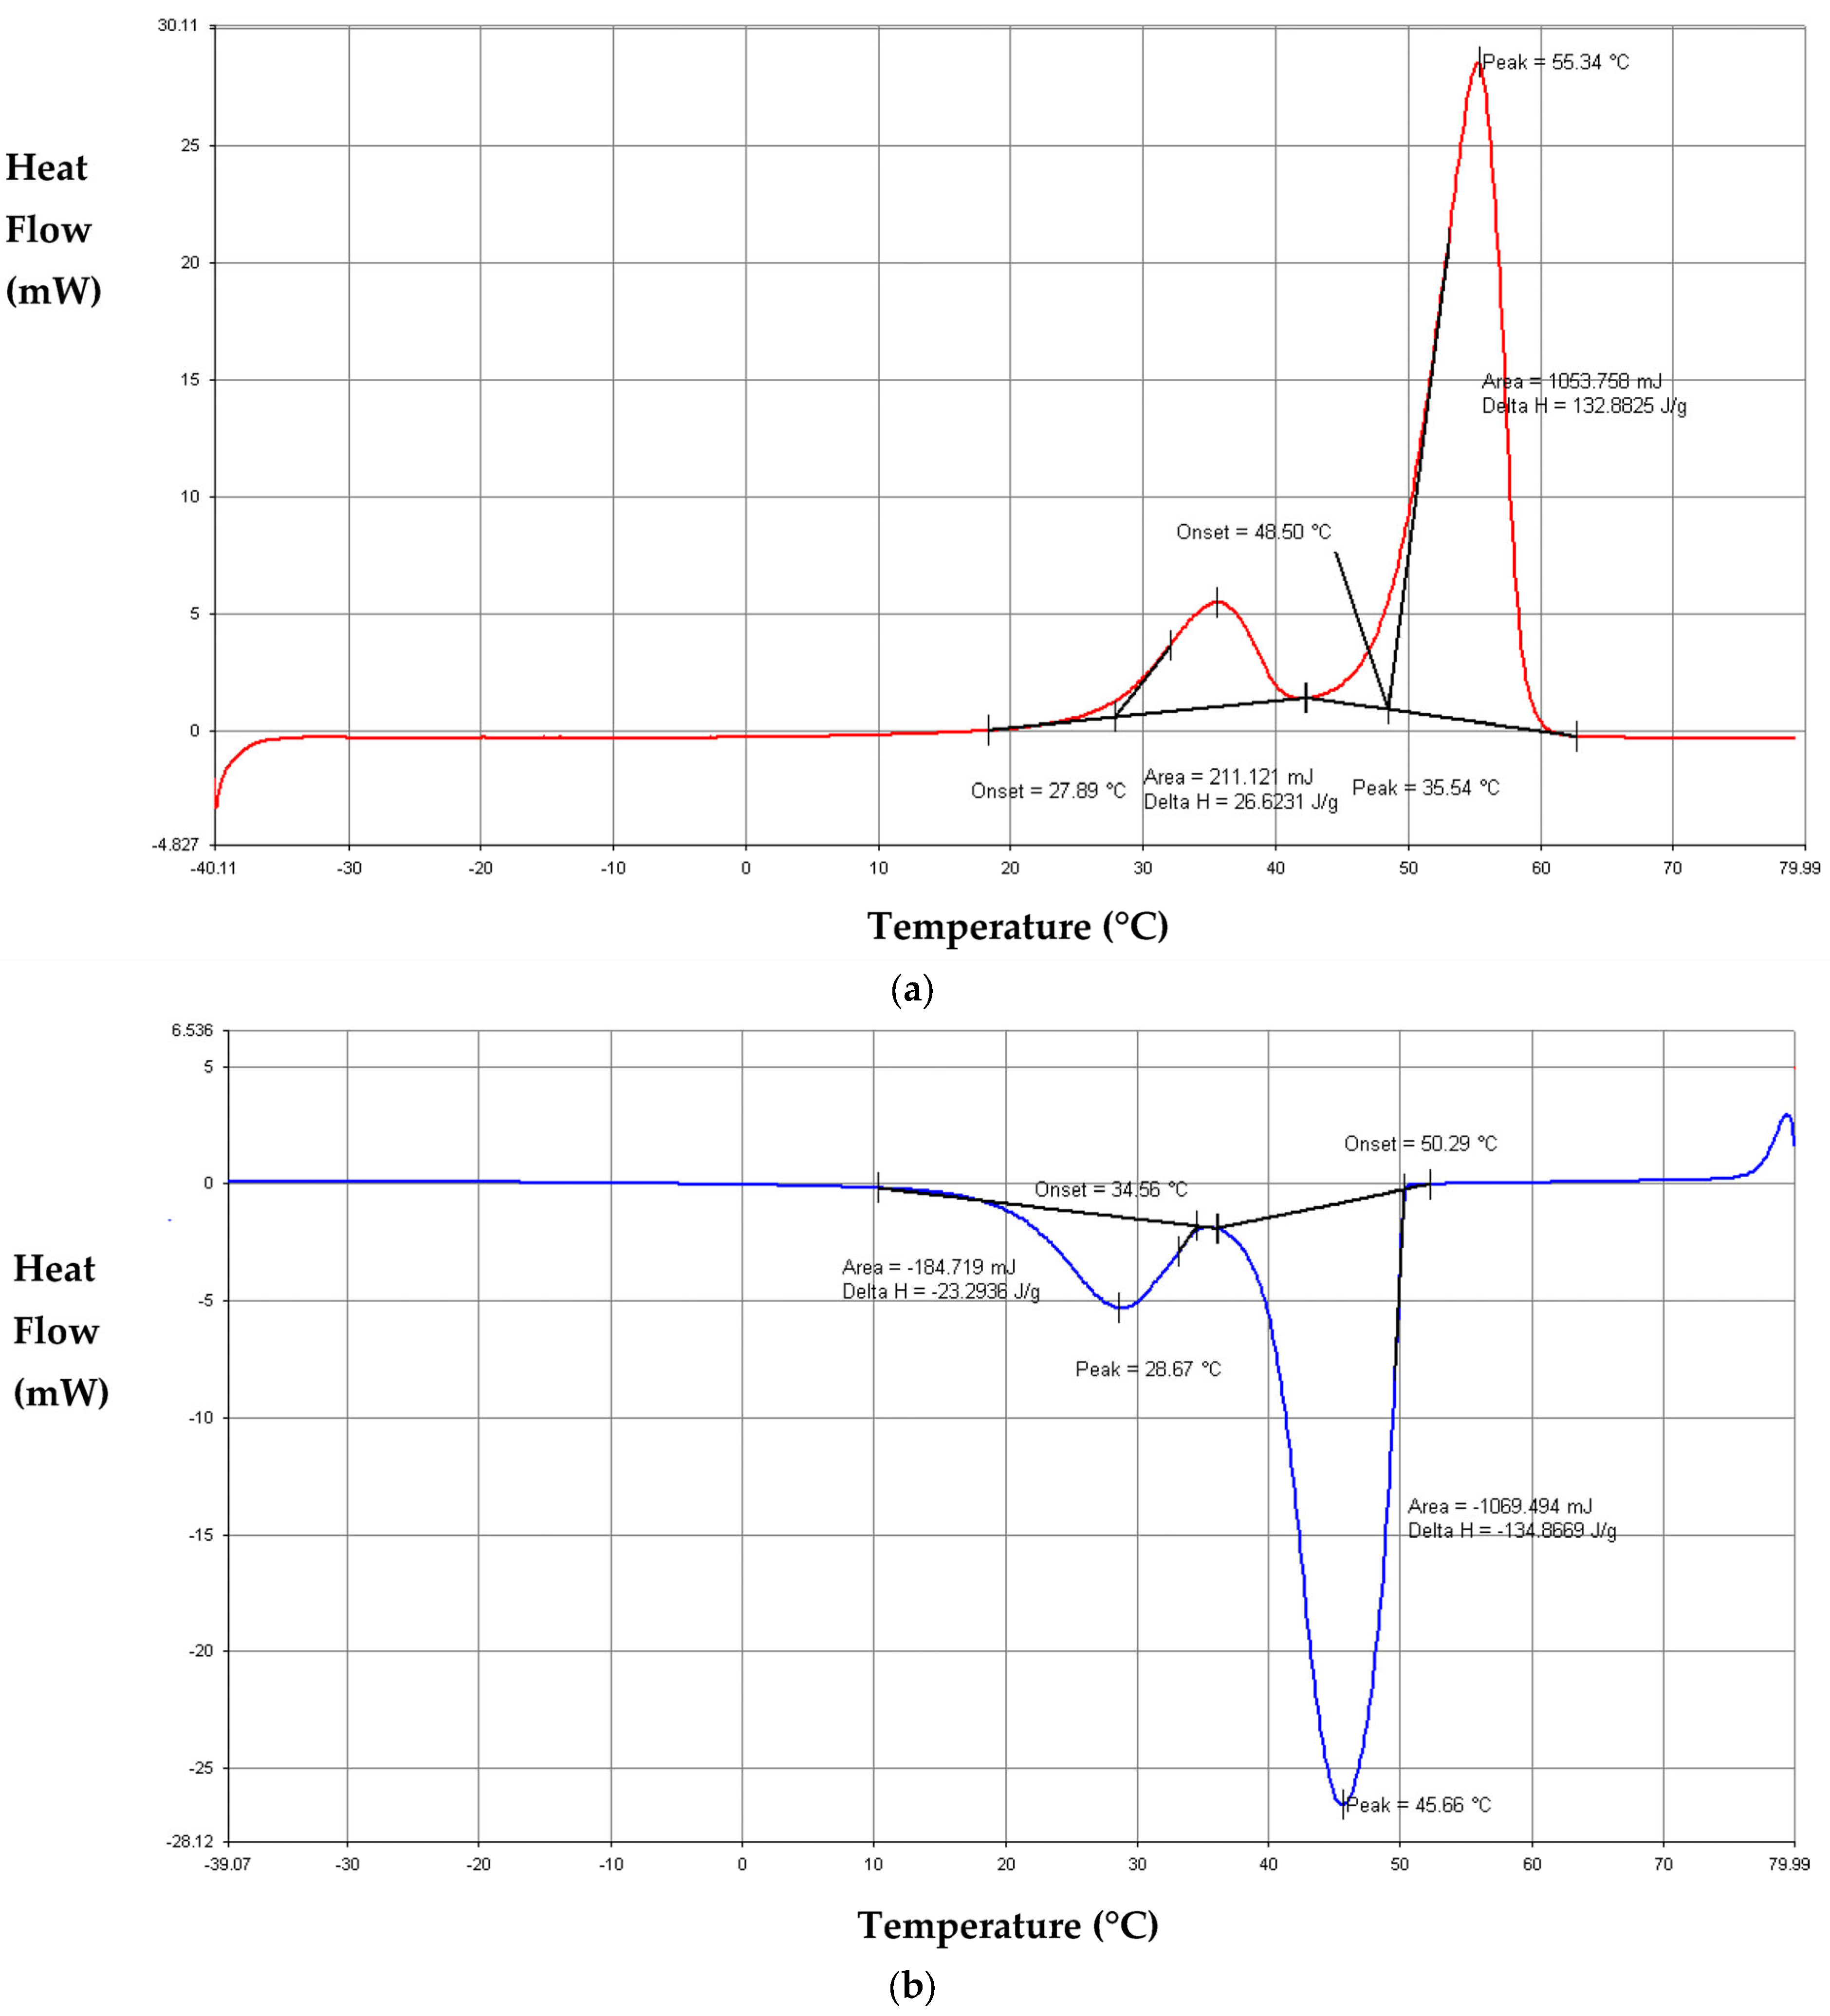
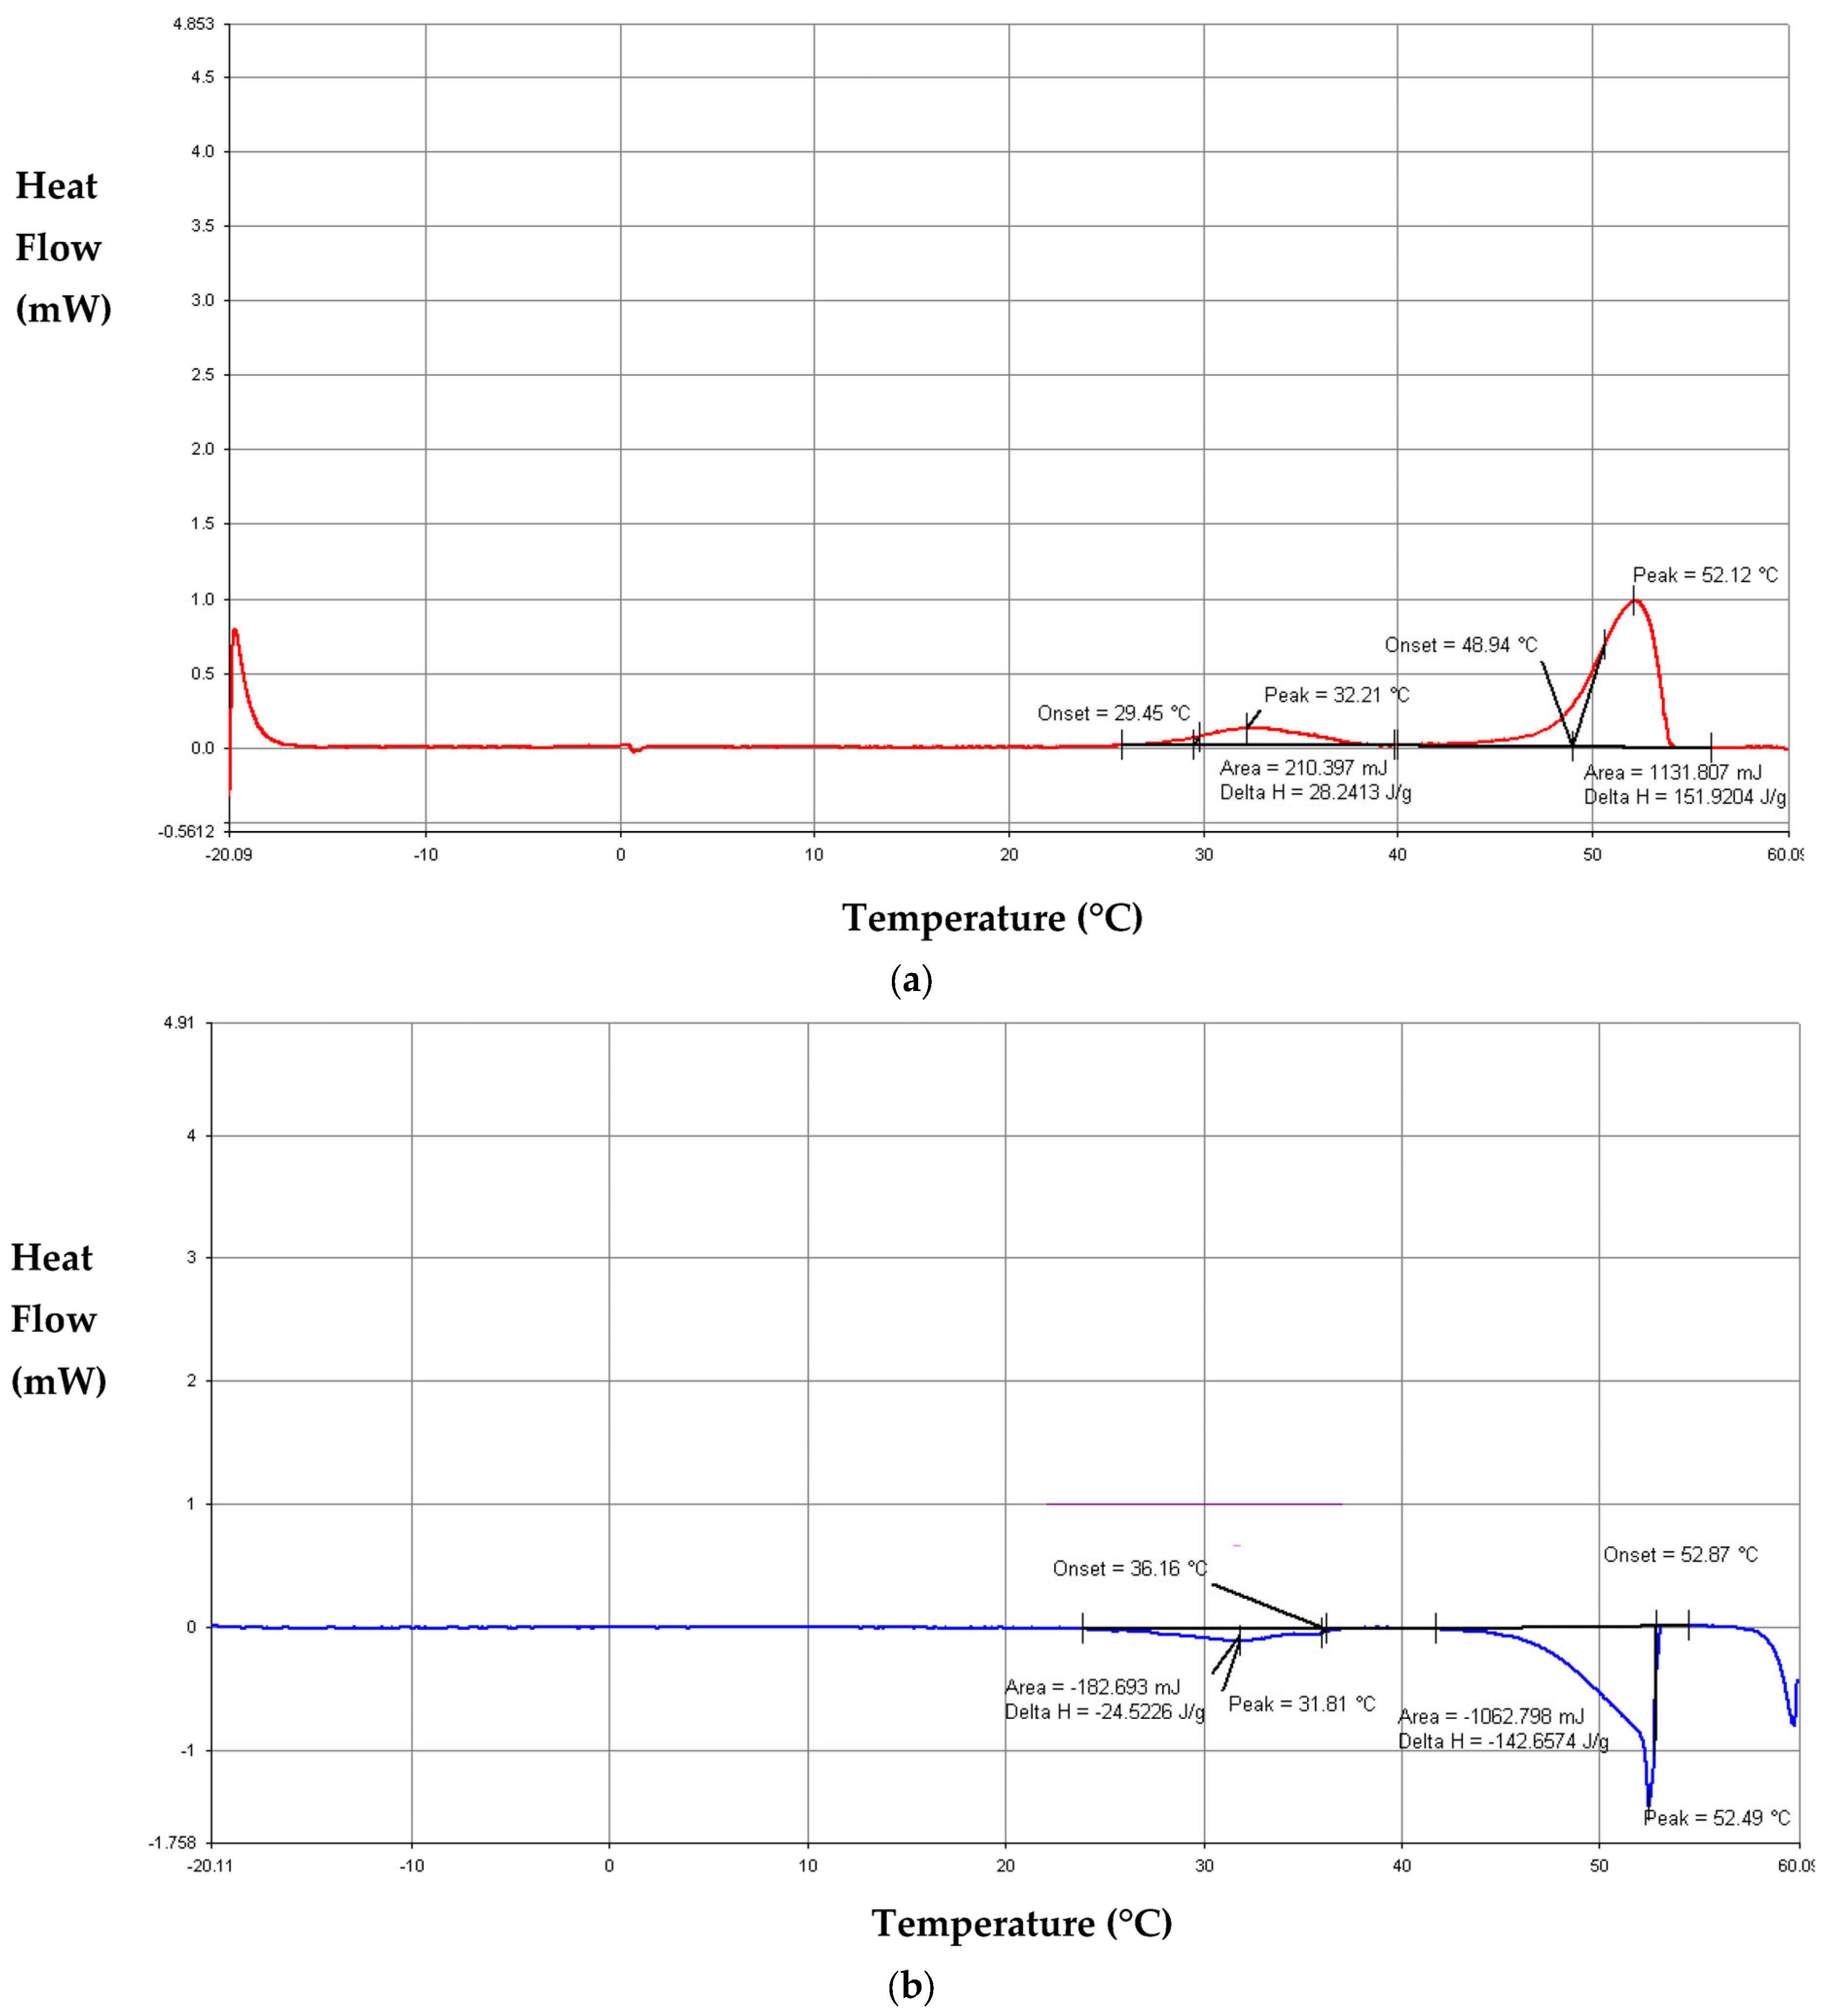
Figure 8, Figure 9 and Figure 10 illustrate the DSC thermograms of paraffins RT21, RT27 and RT50, respectively, corresponding to the DSC measurements at heating and cooling rates of 10 °C.min−1 and 0.2 °C.min−1. The results reveal that the DSC thermograms of the three paraffins have the same trend. In fact, the examination the thermograms from the heating at 10 °C.min−1 and at 0.2 °C.min−1 show two endothermic peaks. The first peak corresponds to the solid–solid transition. The second peak, having higher amplitude, is attributed to the solid–liquid phase change. The results obtained from cooling the paraffins at 10 °C.min−1 and at 0.2 °C.min−1 reveal that the thermograms present two exothermic peaks corresponding to the liquid–solid transition and solid–solid transition.
Furthermore, Figure 8, Figure 9 and Figure 10 highlight the effect of the heating and cooling rate on the amplitudes and widths of the thermogram peaks. In fact, the results show that the peaks of the thermograms obtained from heating and cooling at 10 °C.min−1 are higher than those of measurements at 0.2 °C.min−1. Figure 8, Figure 9 and Figure 10 reveal also that the width of the thermograms increases at a greater heating–cooling rate. These results are due to the thermal inertia of the samples [49,50]. In fact, the DSC measurements at a heating–cooling rate of 10 °C.min−1 overestimate the phase change interval because of the non-thermal equilibrium in the sample. A thermal equilibrium is reached at heating–cooling rates less than 0.5 °C.min−1 [49,51].
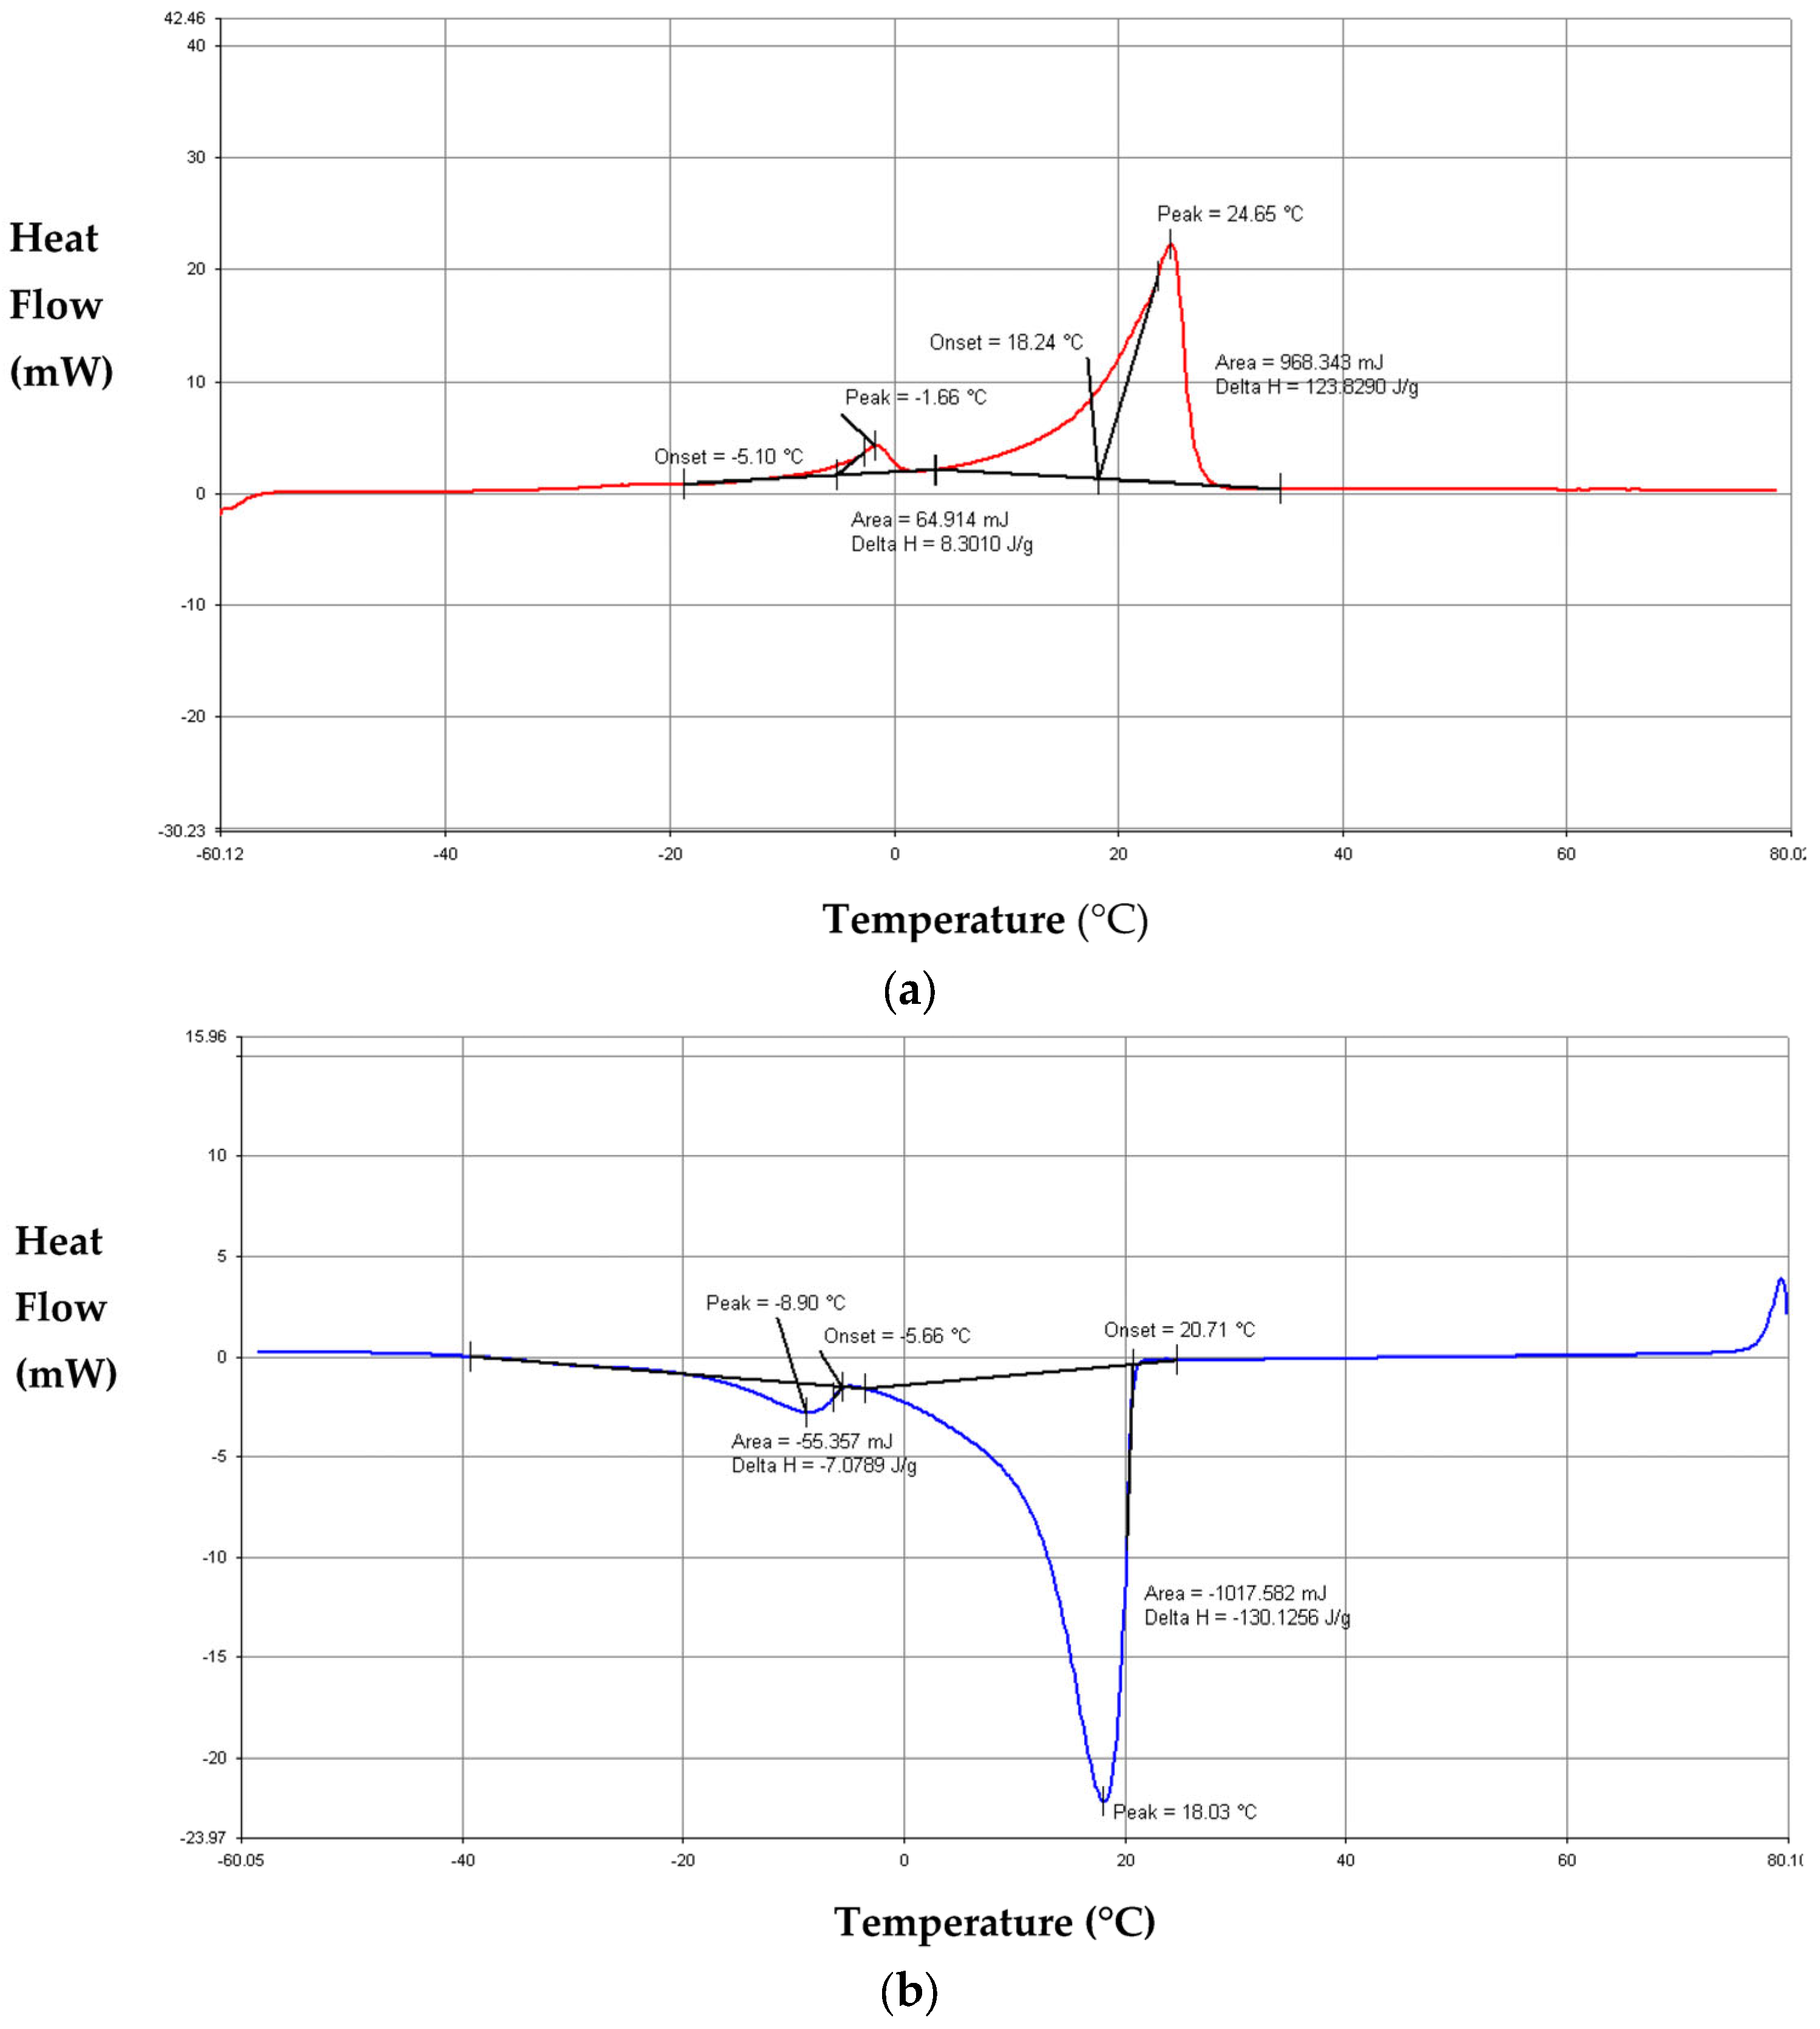
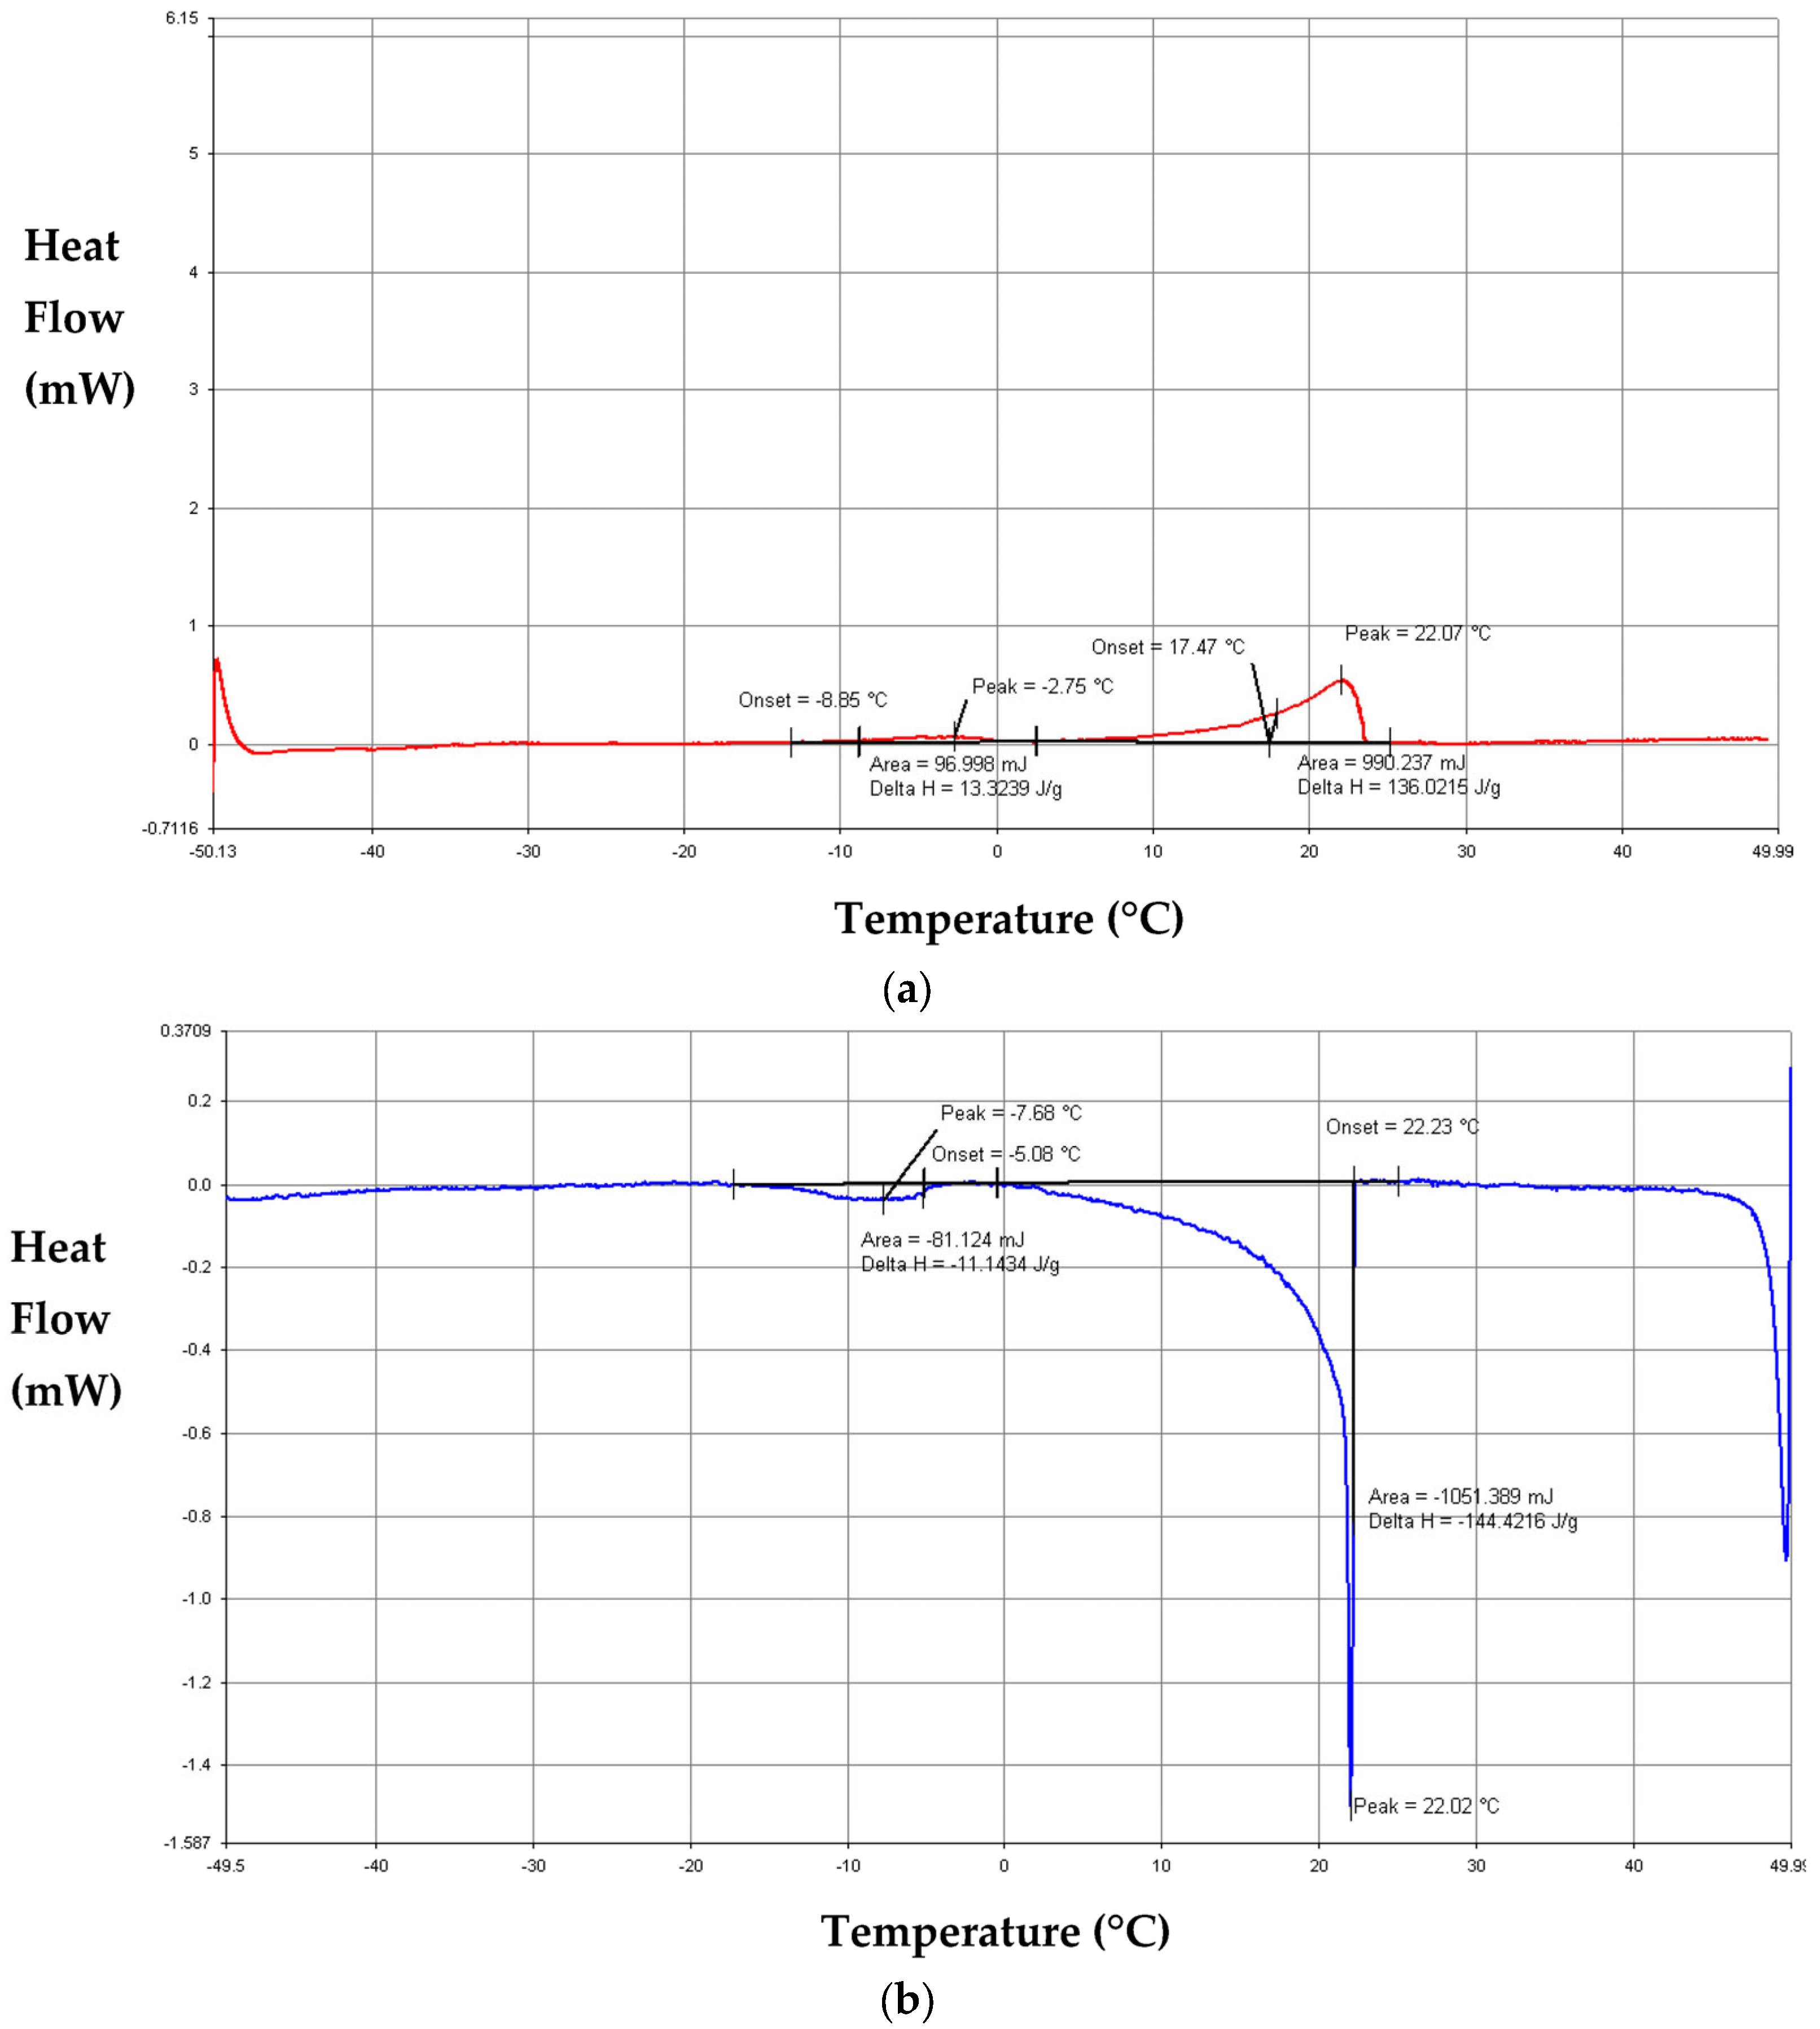
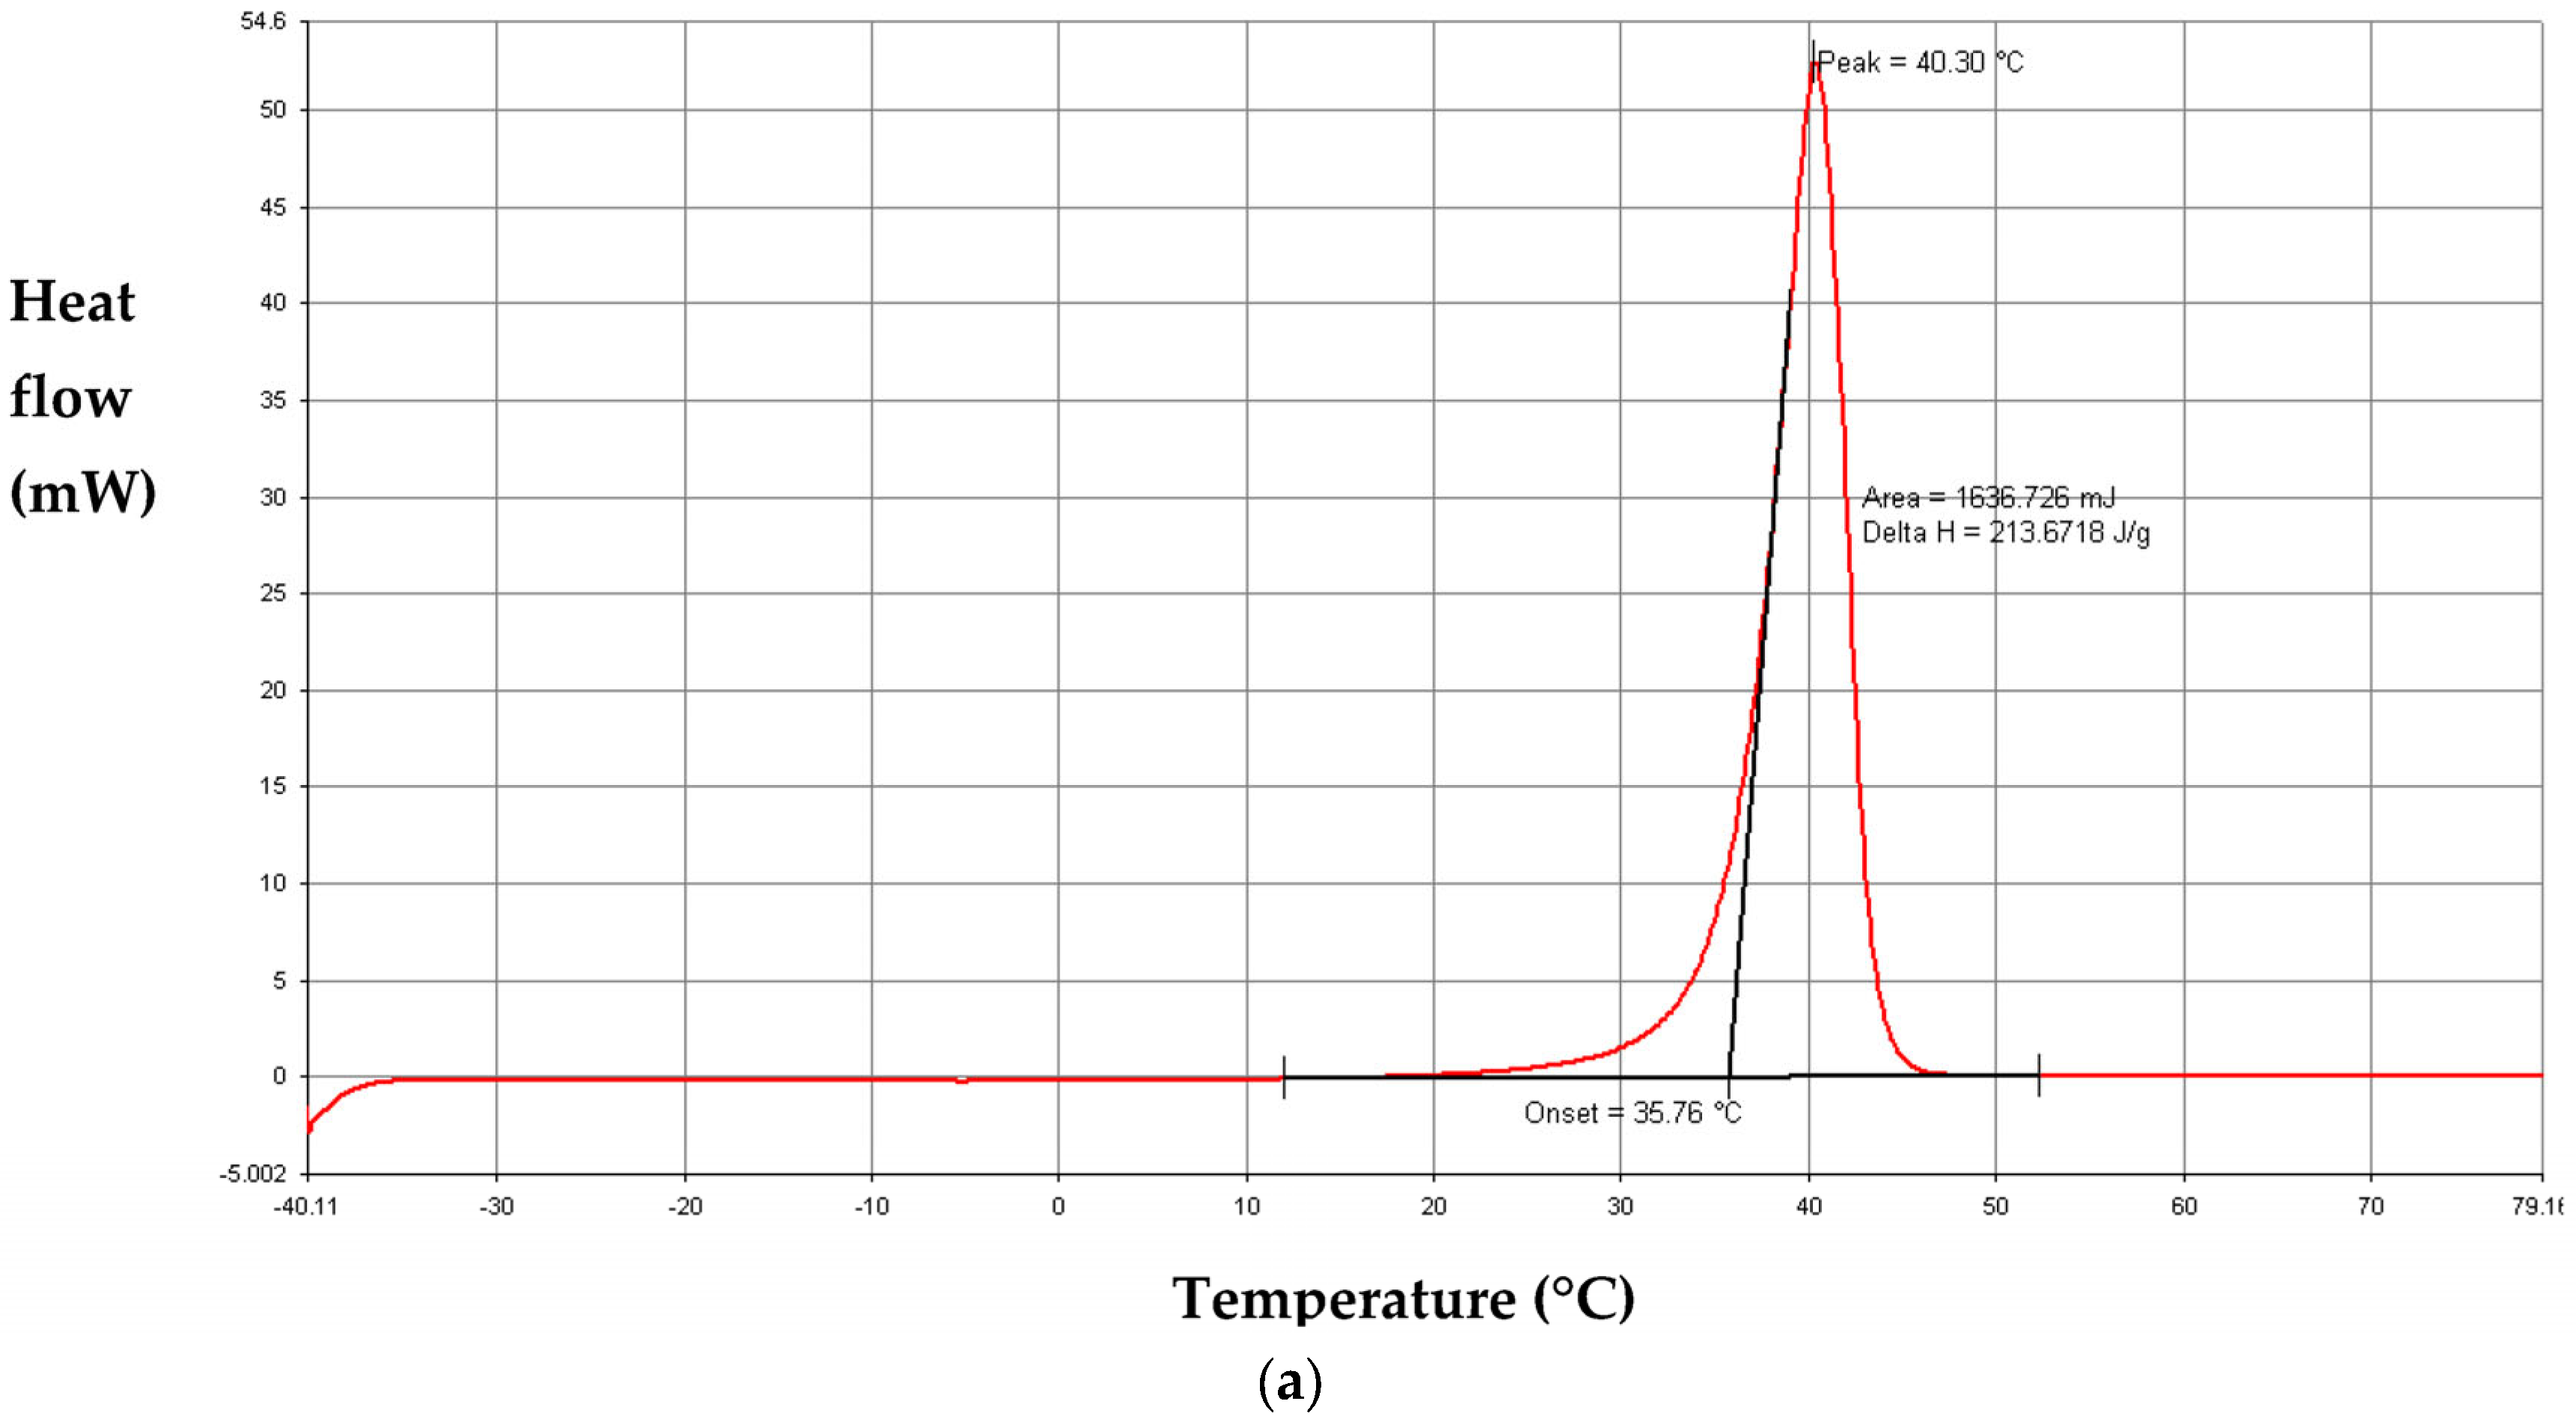
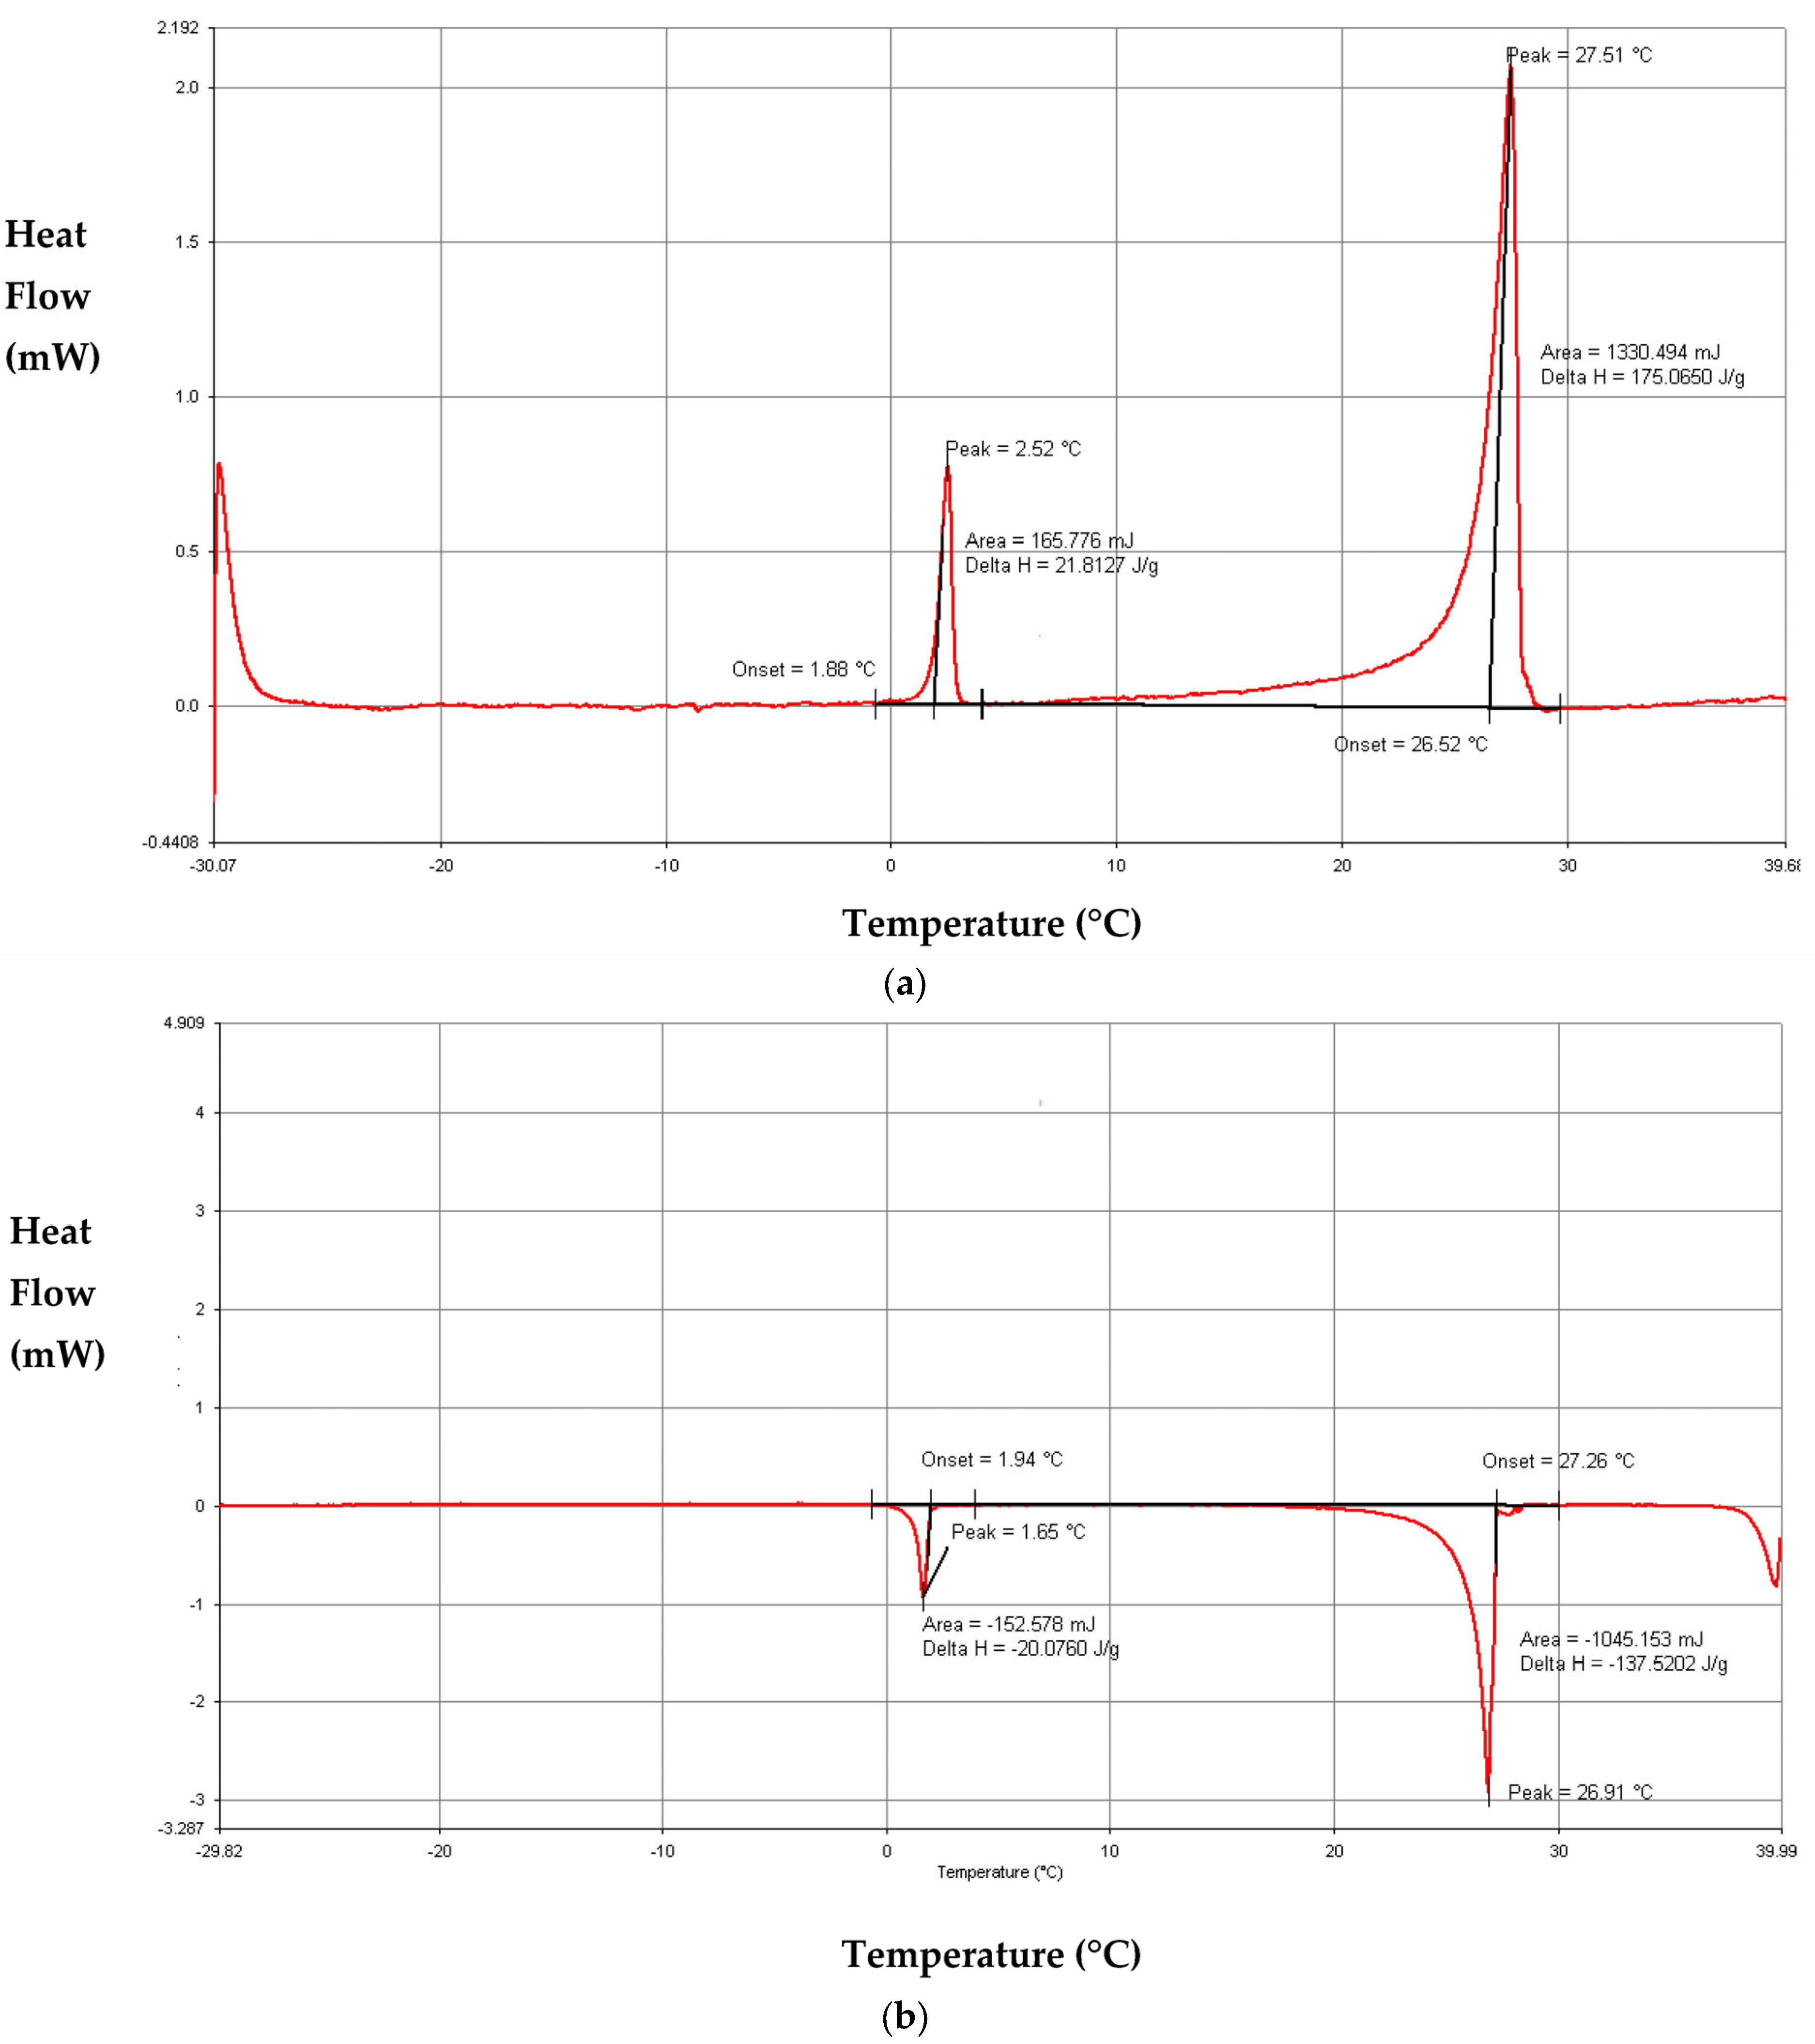
The DSC thermograms, illustrated in Figure 8, Figure 9 and Figure 10, are analyzed by means of Pyris software to evaluate the temperature and the latent heats of the solid–solid, solid–liquid and liquid–solid transitions. Figure 11 and Figure 12 present the thermal analysis of the DSC thermograms of RT21 corresponding to the measurements at heating–cooling rates of 10 °C.min−1 and 0.2 °C.min−1, respectively. The melting temperatures TS-L, the solidification temperatures TL-S and the solid–solid phase transition temperatures of paraffins are taken as onset temperatures which correspond to the temperature where the first tangent line intersects the baseline (Figure 11 and Figure 12). The latent heats are calculated by the integration of the area under the peaks of solid–liquid, liquid–solid and solid–solid transitions (Figure 11 and Figure 12). The thermal analysis results of paraffins RT27 and RT50 are presented in Appendix A.
Table 4, Table 5 and Table 6 display the onset temperatures and the latent heats of phase transitions of RT21, RT27 and RT50 respectively. The results show that the solid–solid transition, melting and solidification temperatures of paraffins decrease as the heating–cooling rate increases. An exception was observed according to the onset temperatures of RT21.
The examination of the DSC results reveals also that the latent heats are lower with a higher heating–cooling rate. The latent heat of the solidification of RT27 was exceptional, which can be attributed to the fact that the calorimeter is calibrated at a heating step.
Furthermore, Table 4, Table 5 and Table 6 exhibit discrepancies between the heating and cooling onset temperatures and latent heat for a given experimental rate. These discrepancies, which yield the asymmetry of the DSC thermograms (Figure 8, Figure 9 and Figure 10), can be attributed to the temperature gradient in the sample. They can be due to the contact resistance between the crucible of the calorimeter and the sample and contact resistance between the two crucibles of the calorimeter [52]. These differences can be related also to the calibration of the calorimeter during the heating and not during the cooling.
- Study of RT35HC
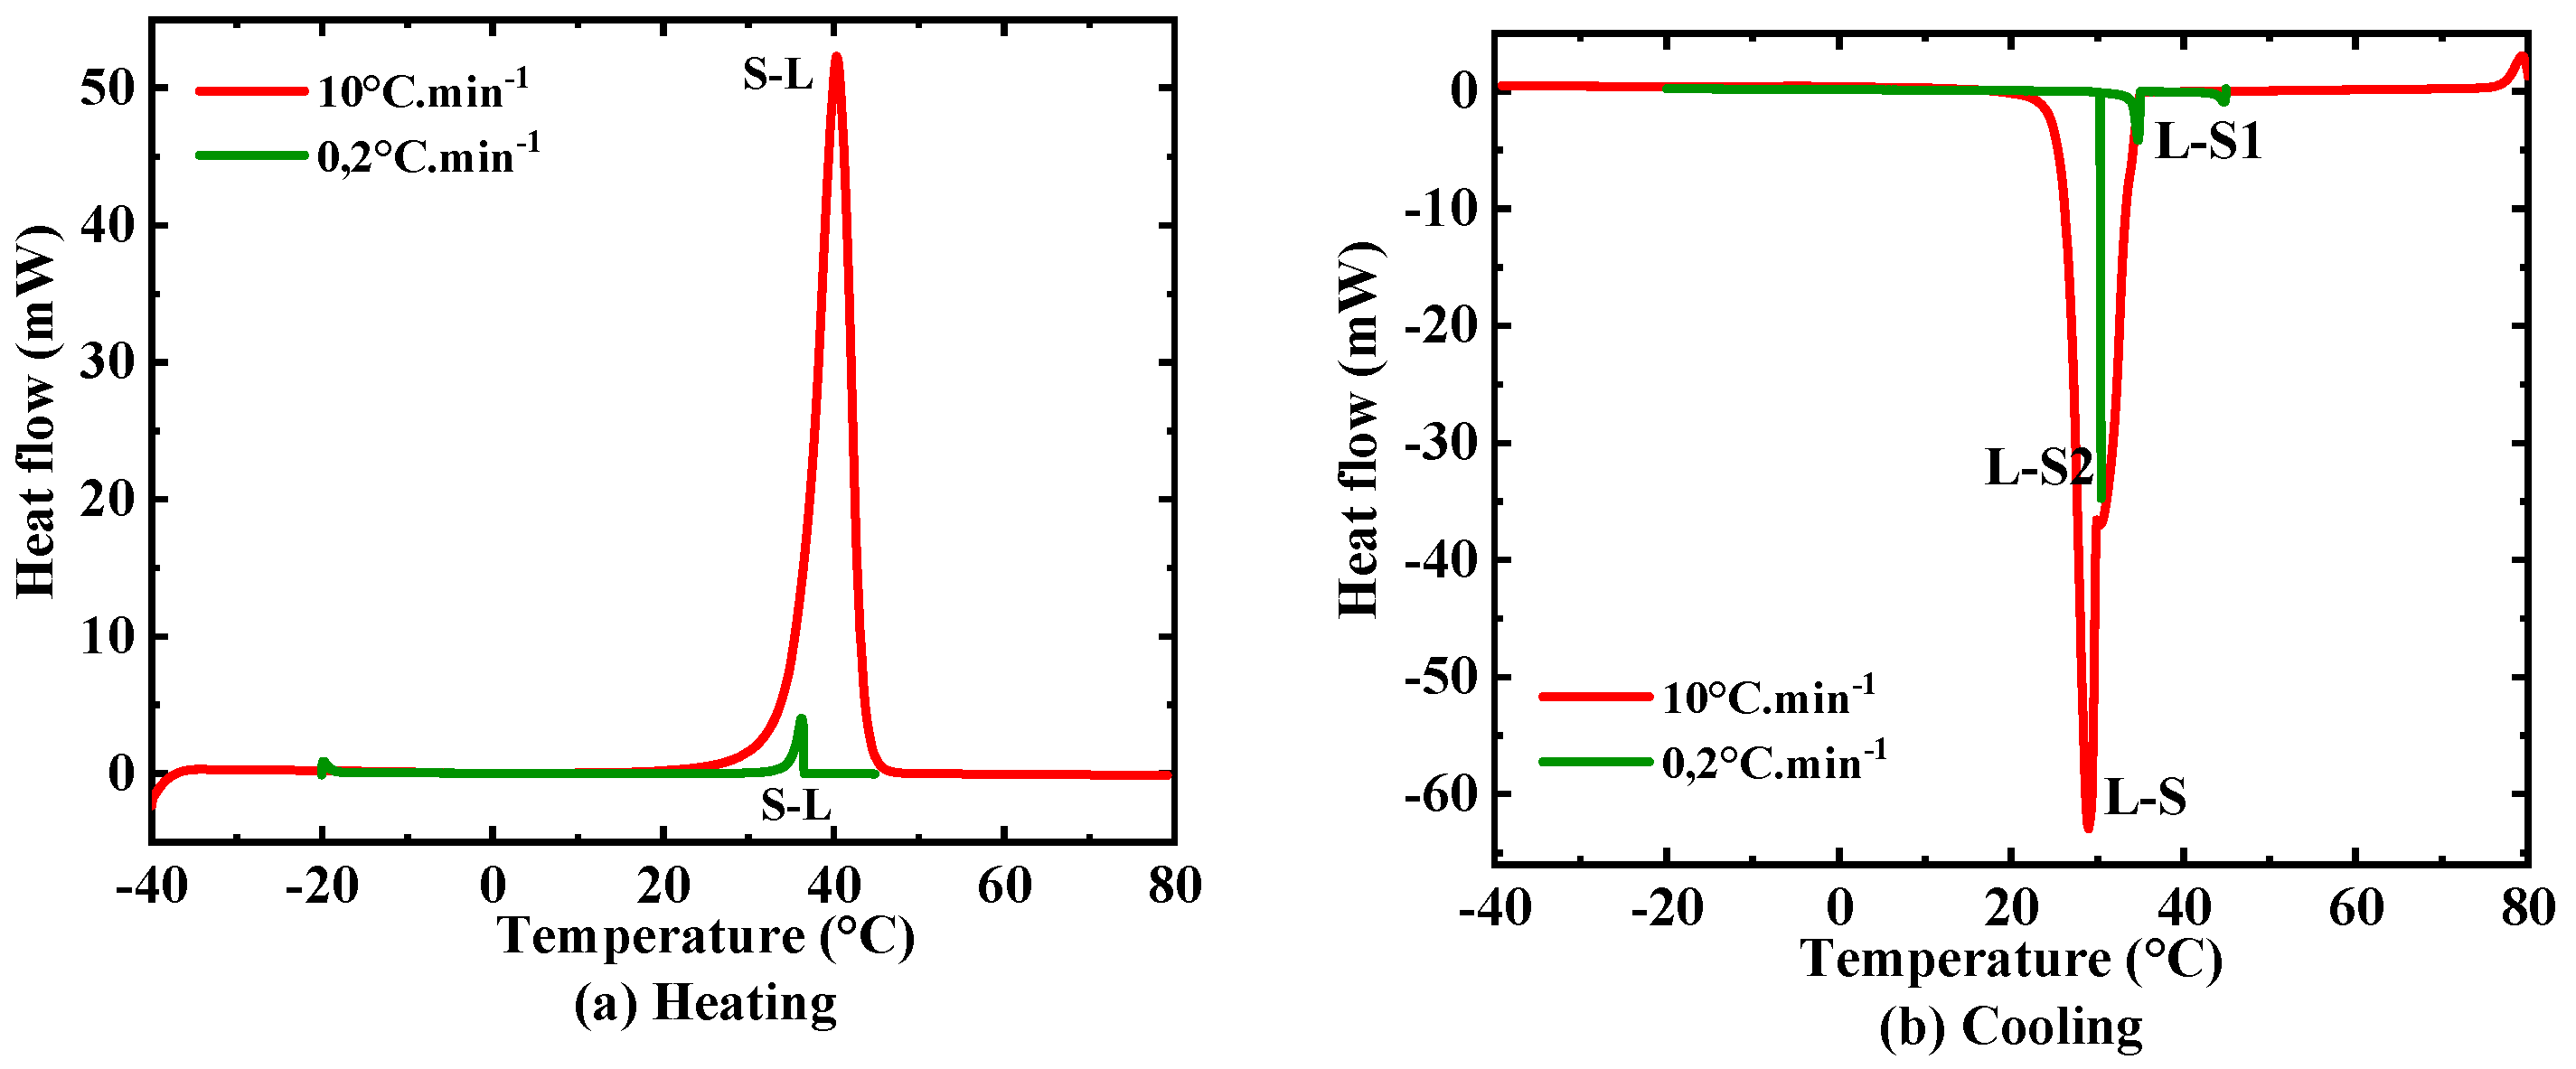
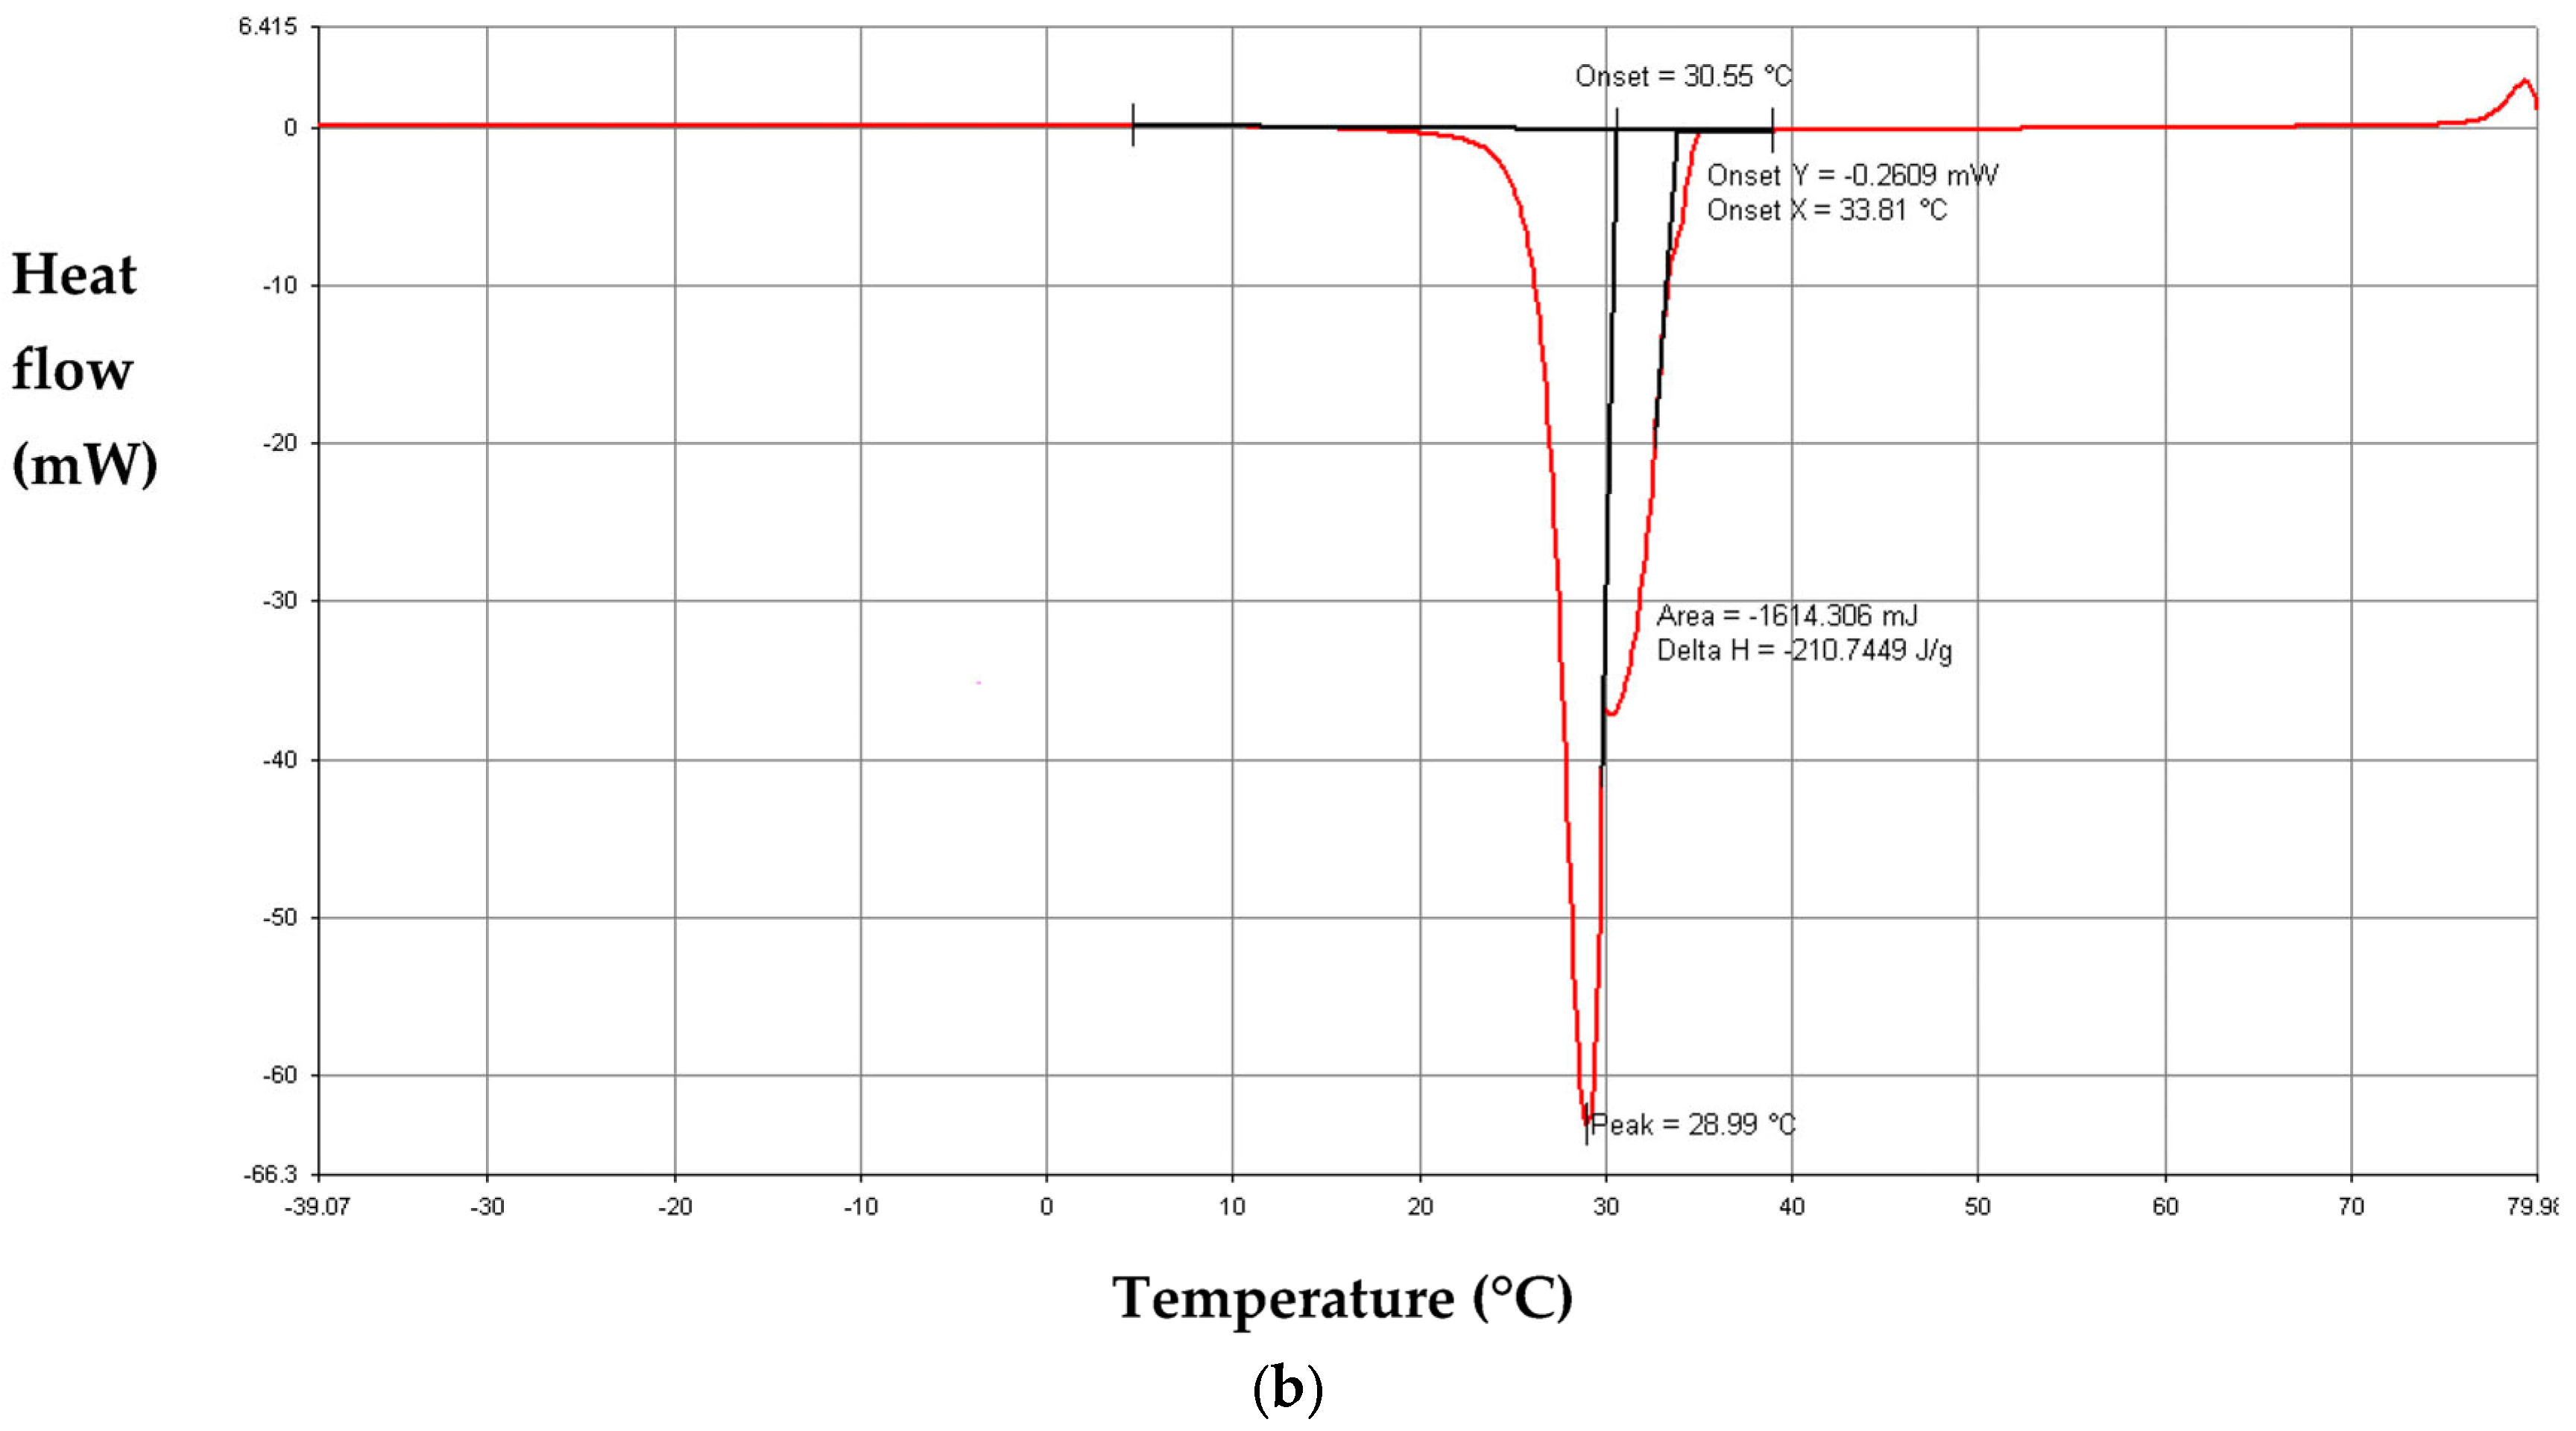
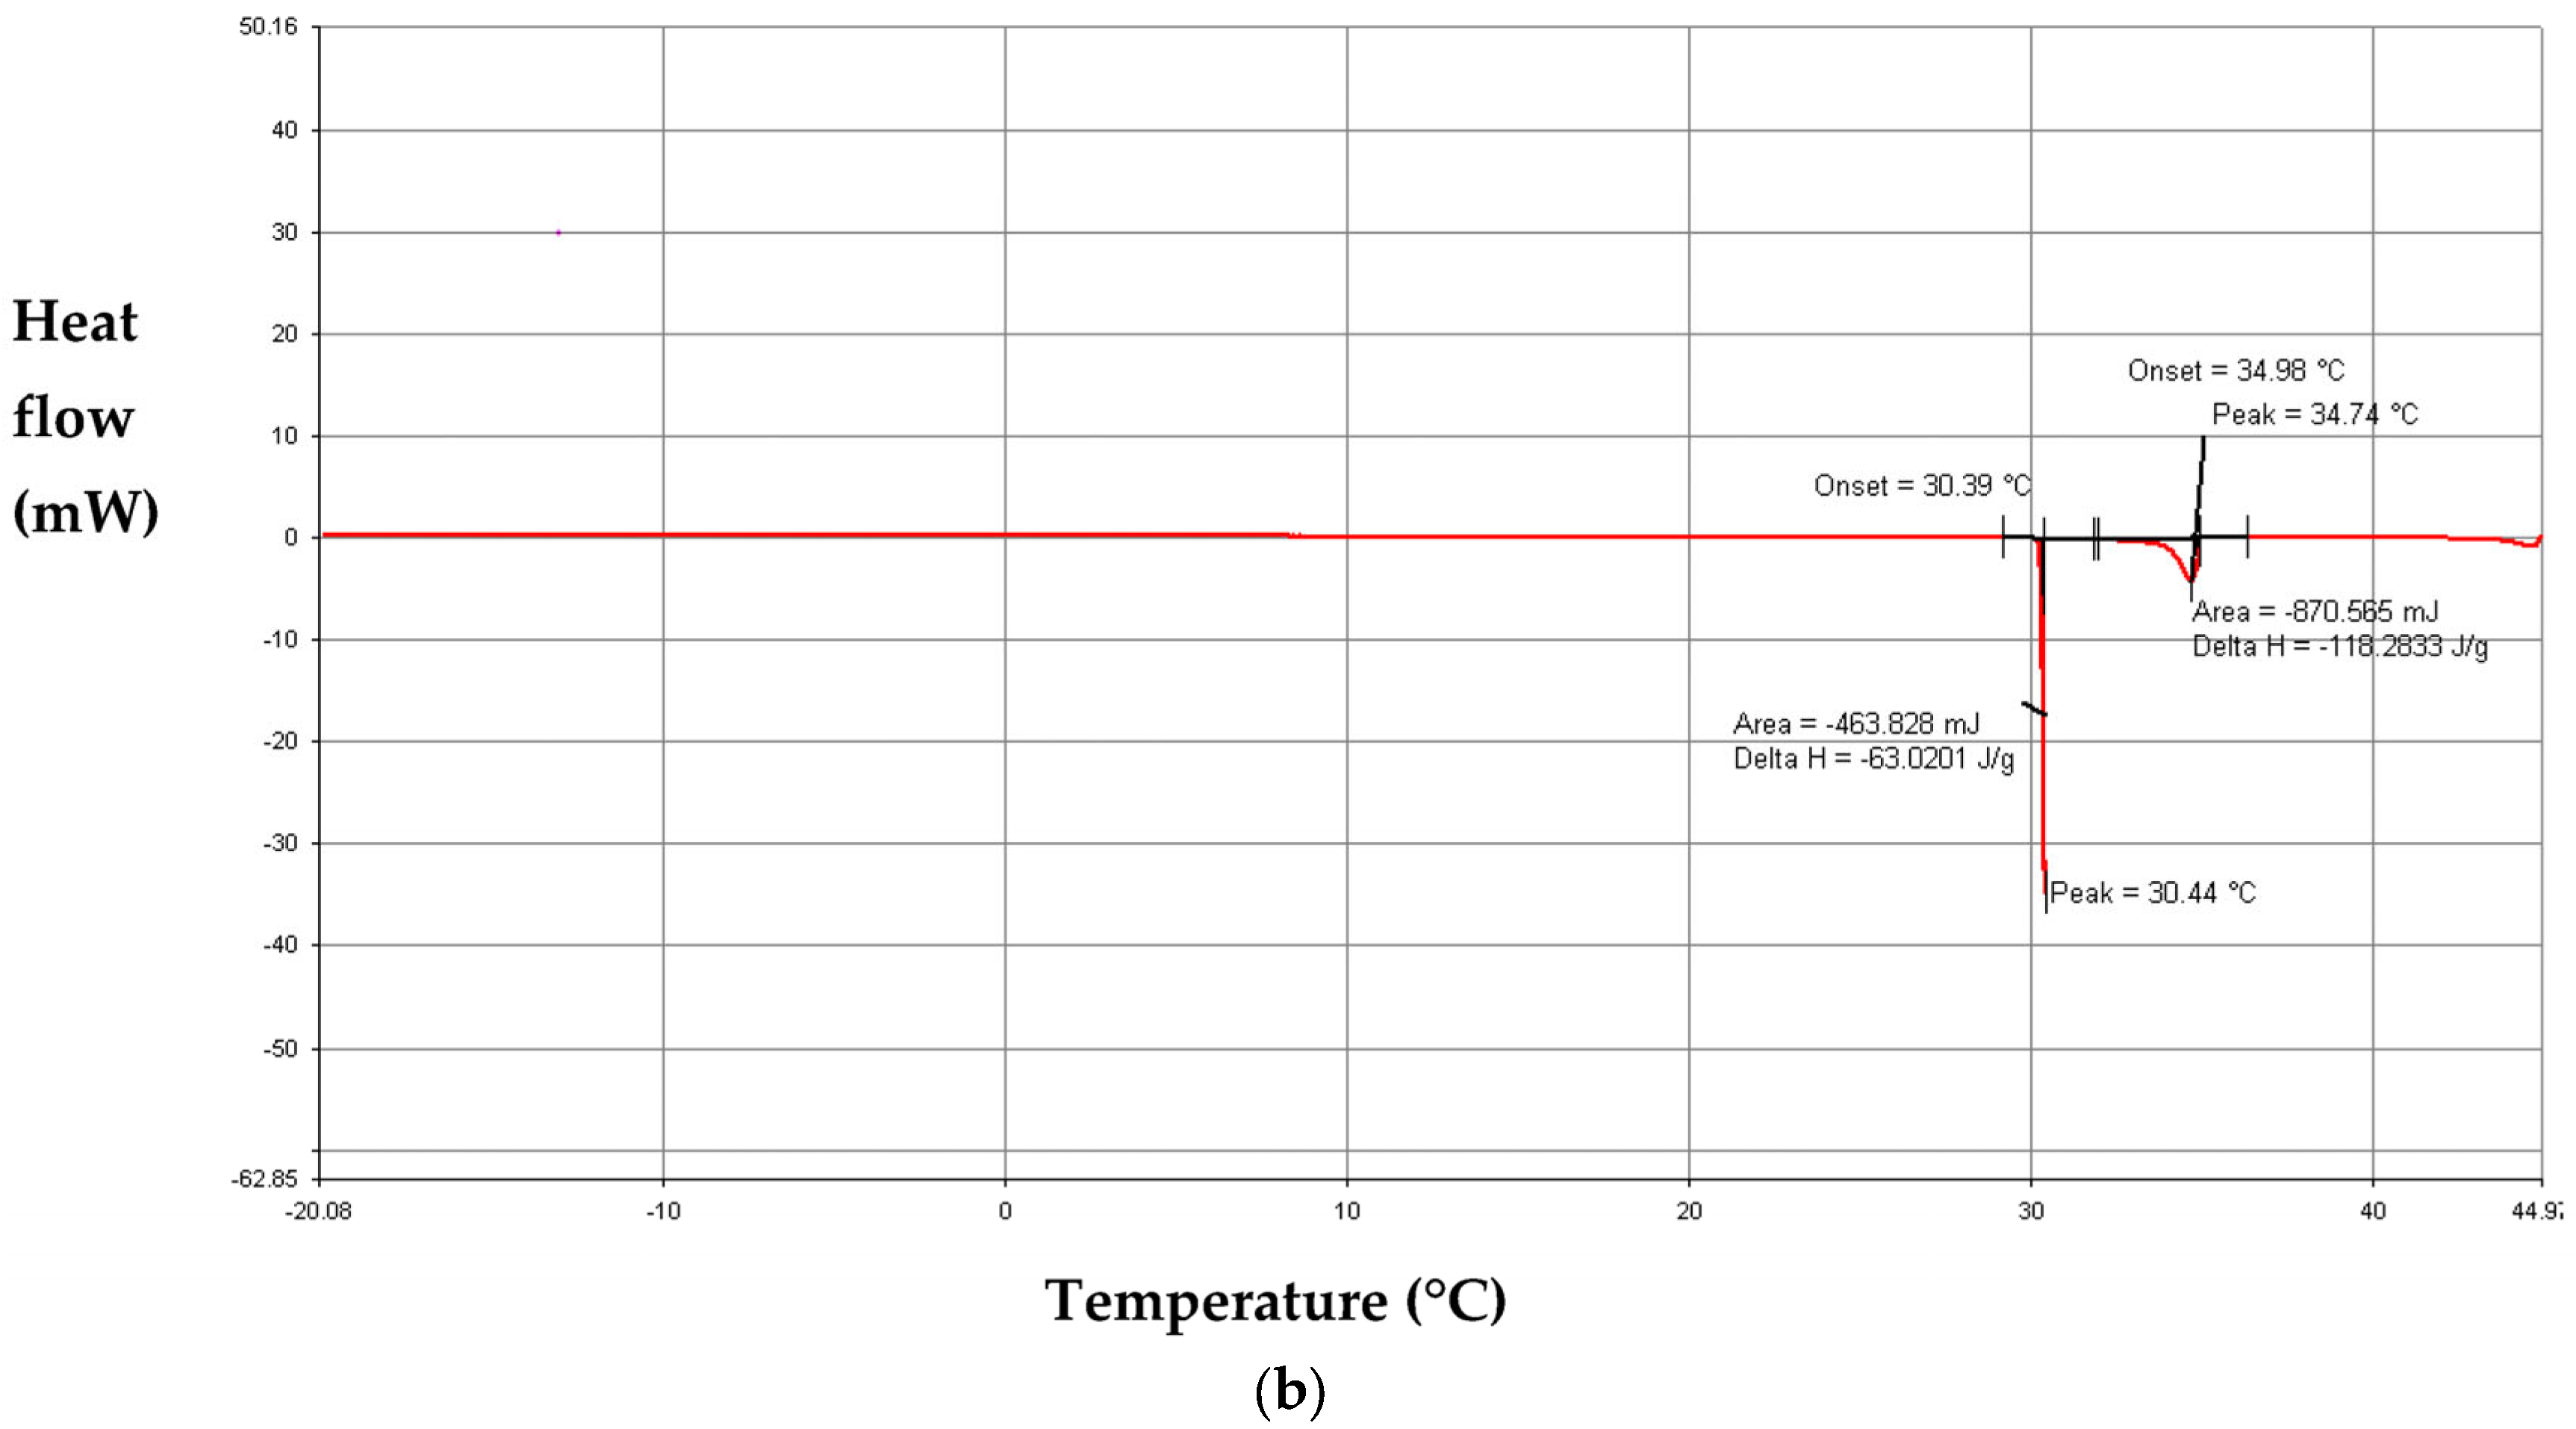
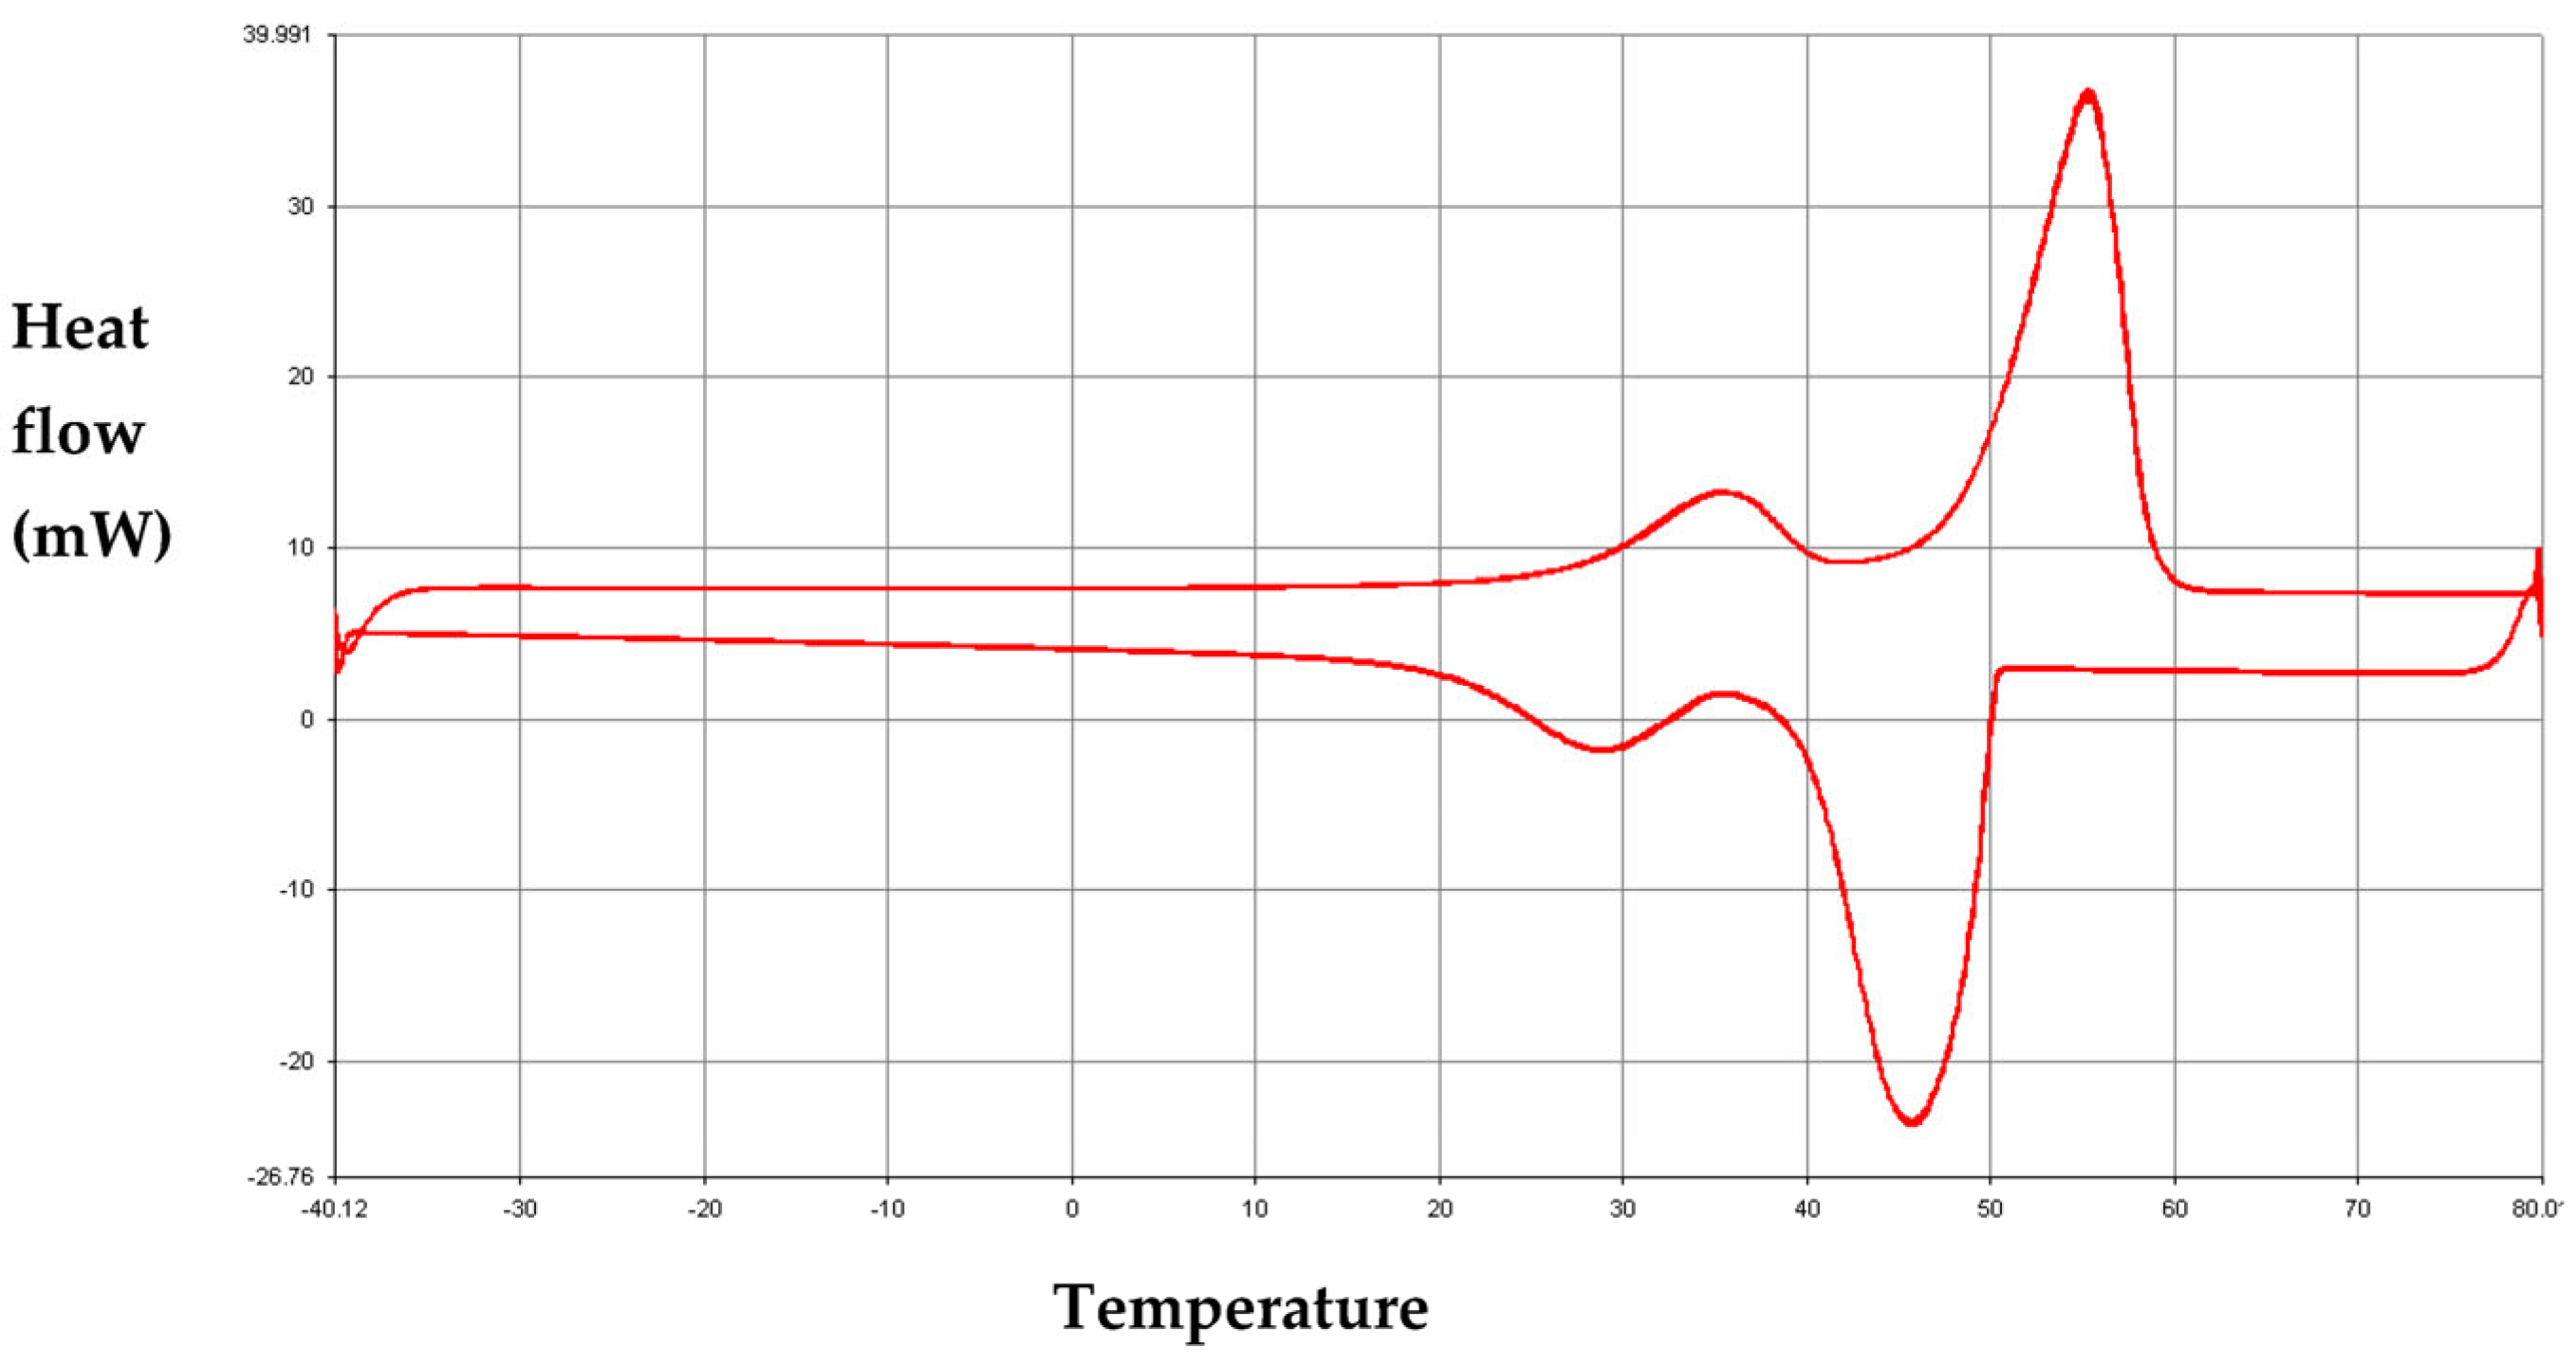
Figure 13 presents the DSC thermograms of paraffin RT35HC. The DSC curves associated with the heating of RT35HC at 10 °C.min−1 and at 0.2°C.min−1 (Figure 13a) show an endothermic peak that corresponds to the solid–liquid transition. The DSC curves of the cooling of RT35HC (Figure 13b) reveal exothermic peaks corresponding to the liquid–solid transition. The examination of Figure 13b indicates that the solidification of RT35HC exhibits two steps. In fact, the DSC thermogram of the cooling of RT35HC at a rate of 10 °C.min−1 shows one exothermic peak composed of two parts which point out the steps of the solidification (Figure 13b). The two steps of the solidification of RT35HC are indicated in the thermogram obtained at a cooling rate of 0.2 °C.min−1 by two separated exothermic peaks at the temperature ranges of [31.86 °C; 36.35 °C] and [29.20 °C; 31.86 °C] (Figure 13b). From the foregoing observations, it can be concluded that the melting of RT35HC occurs in one step while its solidification is performed in two steps. This outcome implies that the RT35HC, which is a commercial paraffin made of a mixture of n-alkanes CnH2n+2, melts congruently and solidifies incongruently.
It can be inferred also from the DSC thermograms that paraffin RT35HC does not present a solid–solid transition during the heating and cooling process. This result indicates that RT35HC is made of n-alkanes CnH2n+2 with n below 15 or even between 16 and 20 [53].
In conclusion, the thermal behavior of RT35HC during the heating and cooling at different rates reveals differences compared to those of RT21, RT27and RT50.
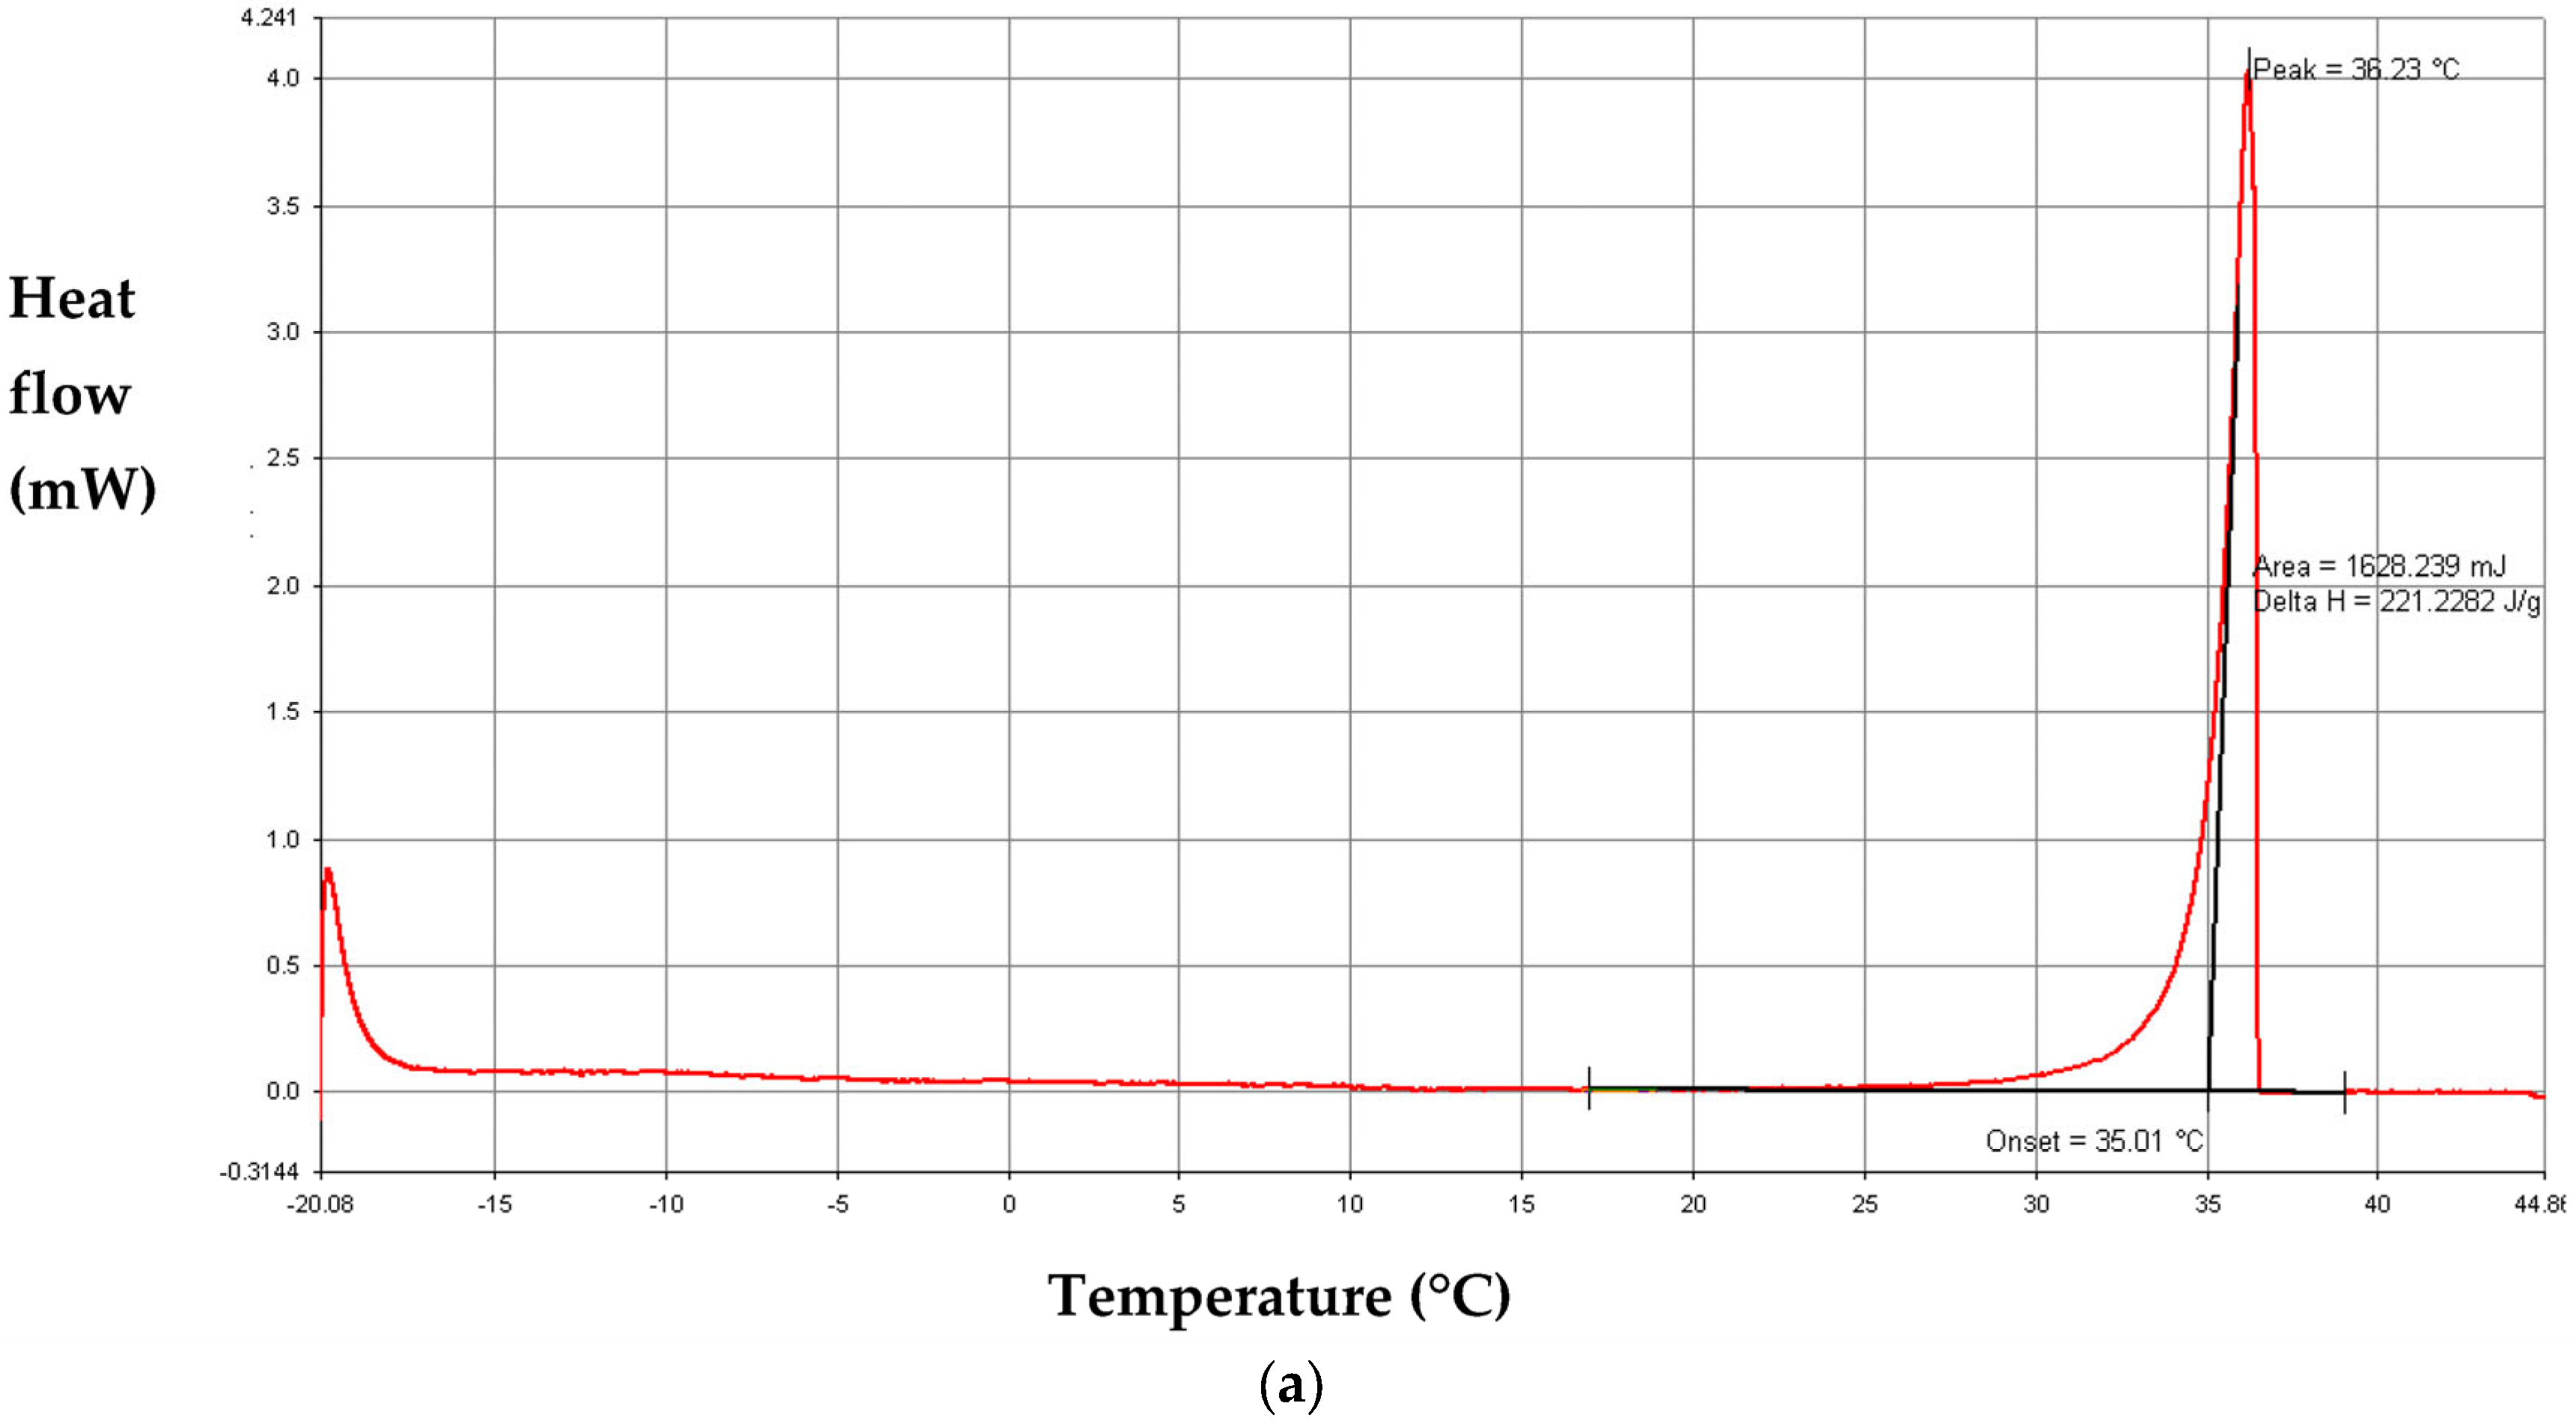
Figure 14 and Figure 15 illustrate the thermal analysis of the DSC curves of RT35HC associated with DSC measurements at the rates of 10 °C.min−1 and 0.2 °C.min−1, respectively. The onset temperatures and latent heats of phase transitions are summarized in Table 7. L-S1 and L-S2 in the table refer to the first and the second steps of solidification, respectively.
The results, displayed in Table 7, reveal that the melting temperature of RT35HC for DSC measurements at a heating rate of 10 °C.min−1 is lower by 2% than that at a rate of 0.2°C.min−1. This indicates that the melting temperature of RT35HC varies slightly as the heating rate increases. The results show also that the onset temperatures of the first and the second steps of the solidification of RT35HC decrease with the cooling rate. Regarding the latent heats, it can be seen from Table 7 that the latent heat of the melting of RT35HC decreases as the heating rate increases. Moreover, the results show that the latent heat of the solidification at a cooling rate of 10 °C.min−1 is 16% greater than that at the rate of 0.2 °C.min−1.
- Comparison between the findings of the present work and the available literature data
Table 8 compares the experimental heat storage properties of the paraffins obtained in the present work and in the literature. The inspection of the results shows a good agreement between the phase change temperatures assessed in this study and those found in previous studies [20,21,22,23,37]. Concerning the latent heats of melting and solidification, the values reported by other investigations [20,21,23] show discrepancies varying from 5% to 22% compared to the current research. This can be attributed to the mass of the paraffin, the thermal cycle, the heating–cooling rate, the precision of the DSC instrument and the type of the crucibles used in the DSC measurements.
- Comparison between the properties of paraffins RT21, RT27, RT35HC and RT50
The comparison between the DSC results of paraffins RT21, RT27, RT35HC and RT50 reveals that RT35HC has the highest latent heat of melting and that the lowest latent heat of melting is attributed to RT21. The difference between the latent heats of melting of paraffins can be due to the number of the carbon atoms of the n-alkanes composing the paraffins. In fact, it was demonstrated in [34] that the latent heat of the melting increases with the number of carbon atoms. This difference can be also related to the paraffin composition and to the impurities.
The results of the melting temperatures of the paraffins exhibit that paraffins RT21, RT27 and RT35HC are suitable for low-temperature latent thermal energy storage applications. RT35HC is a medium-temperature phase change material for thermal energy storage.
3.1.2. Thermal Reliability
Figure 16, Figure 17, Figure 18 and Figure 19 illustrate the DSC findings for RT21, RT27, RT35HC and RT50 under ten thermal cycles at a heating–cooling rate of 10 °C.min−1, respectively. The results show that the DSC thermograms of each paraffin are almost superimposed. This implies that the temperature and the latent heats of the melting and solidification of paraffins vary insignificantly over the thermal cycles. Hence, RT21, RT27, RT35HC and RT50 have good thermal reliability.
3.1.3. Specific Heats
- Apparent specific heats
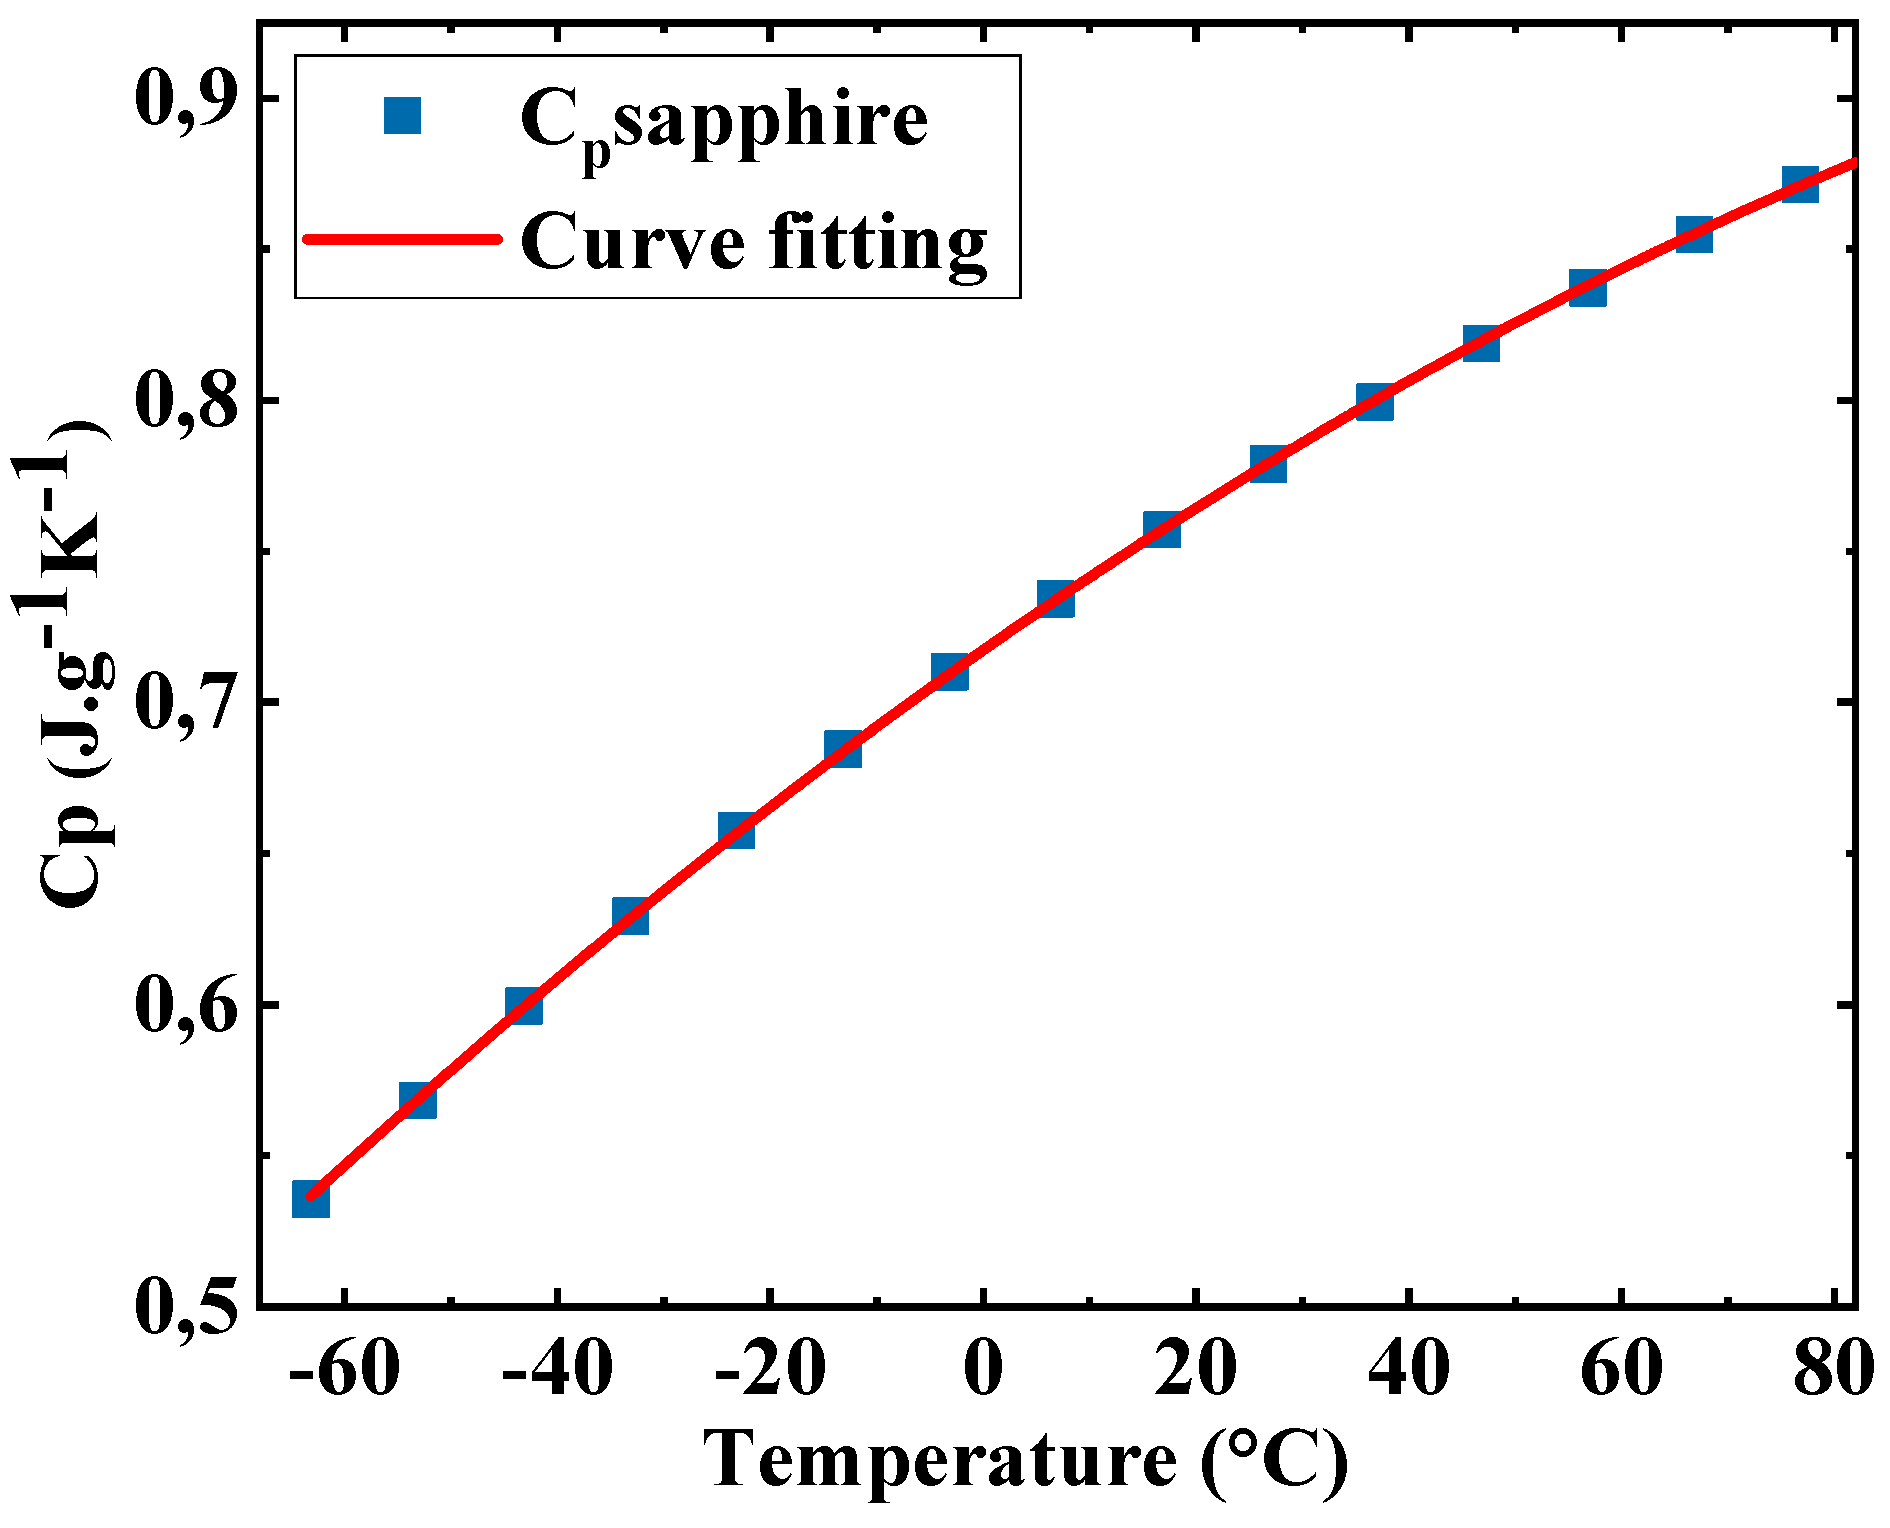
The apparent specific heats of paraffins RT21, RT27, RT35HC and RT50 as a function of temperature are determined using Equation (1) (Section 2.2), which requires a preliminary study of the temperature dependence of the specific heat of sapphire. Hence, a second-degree polynomial curve fitting of the specific heat of sapphire in the temperature range of −60 °C to 80 °C (Figure 20) is determined based on the Cp values in the literature [54] (Figure 20). The variation of the specific heat of sapphire with temperature is given by Equation (8).
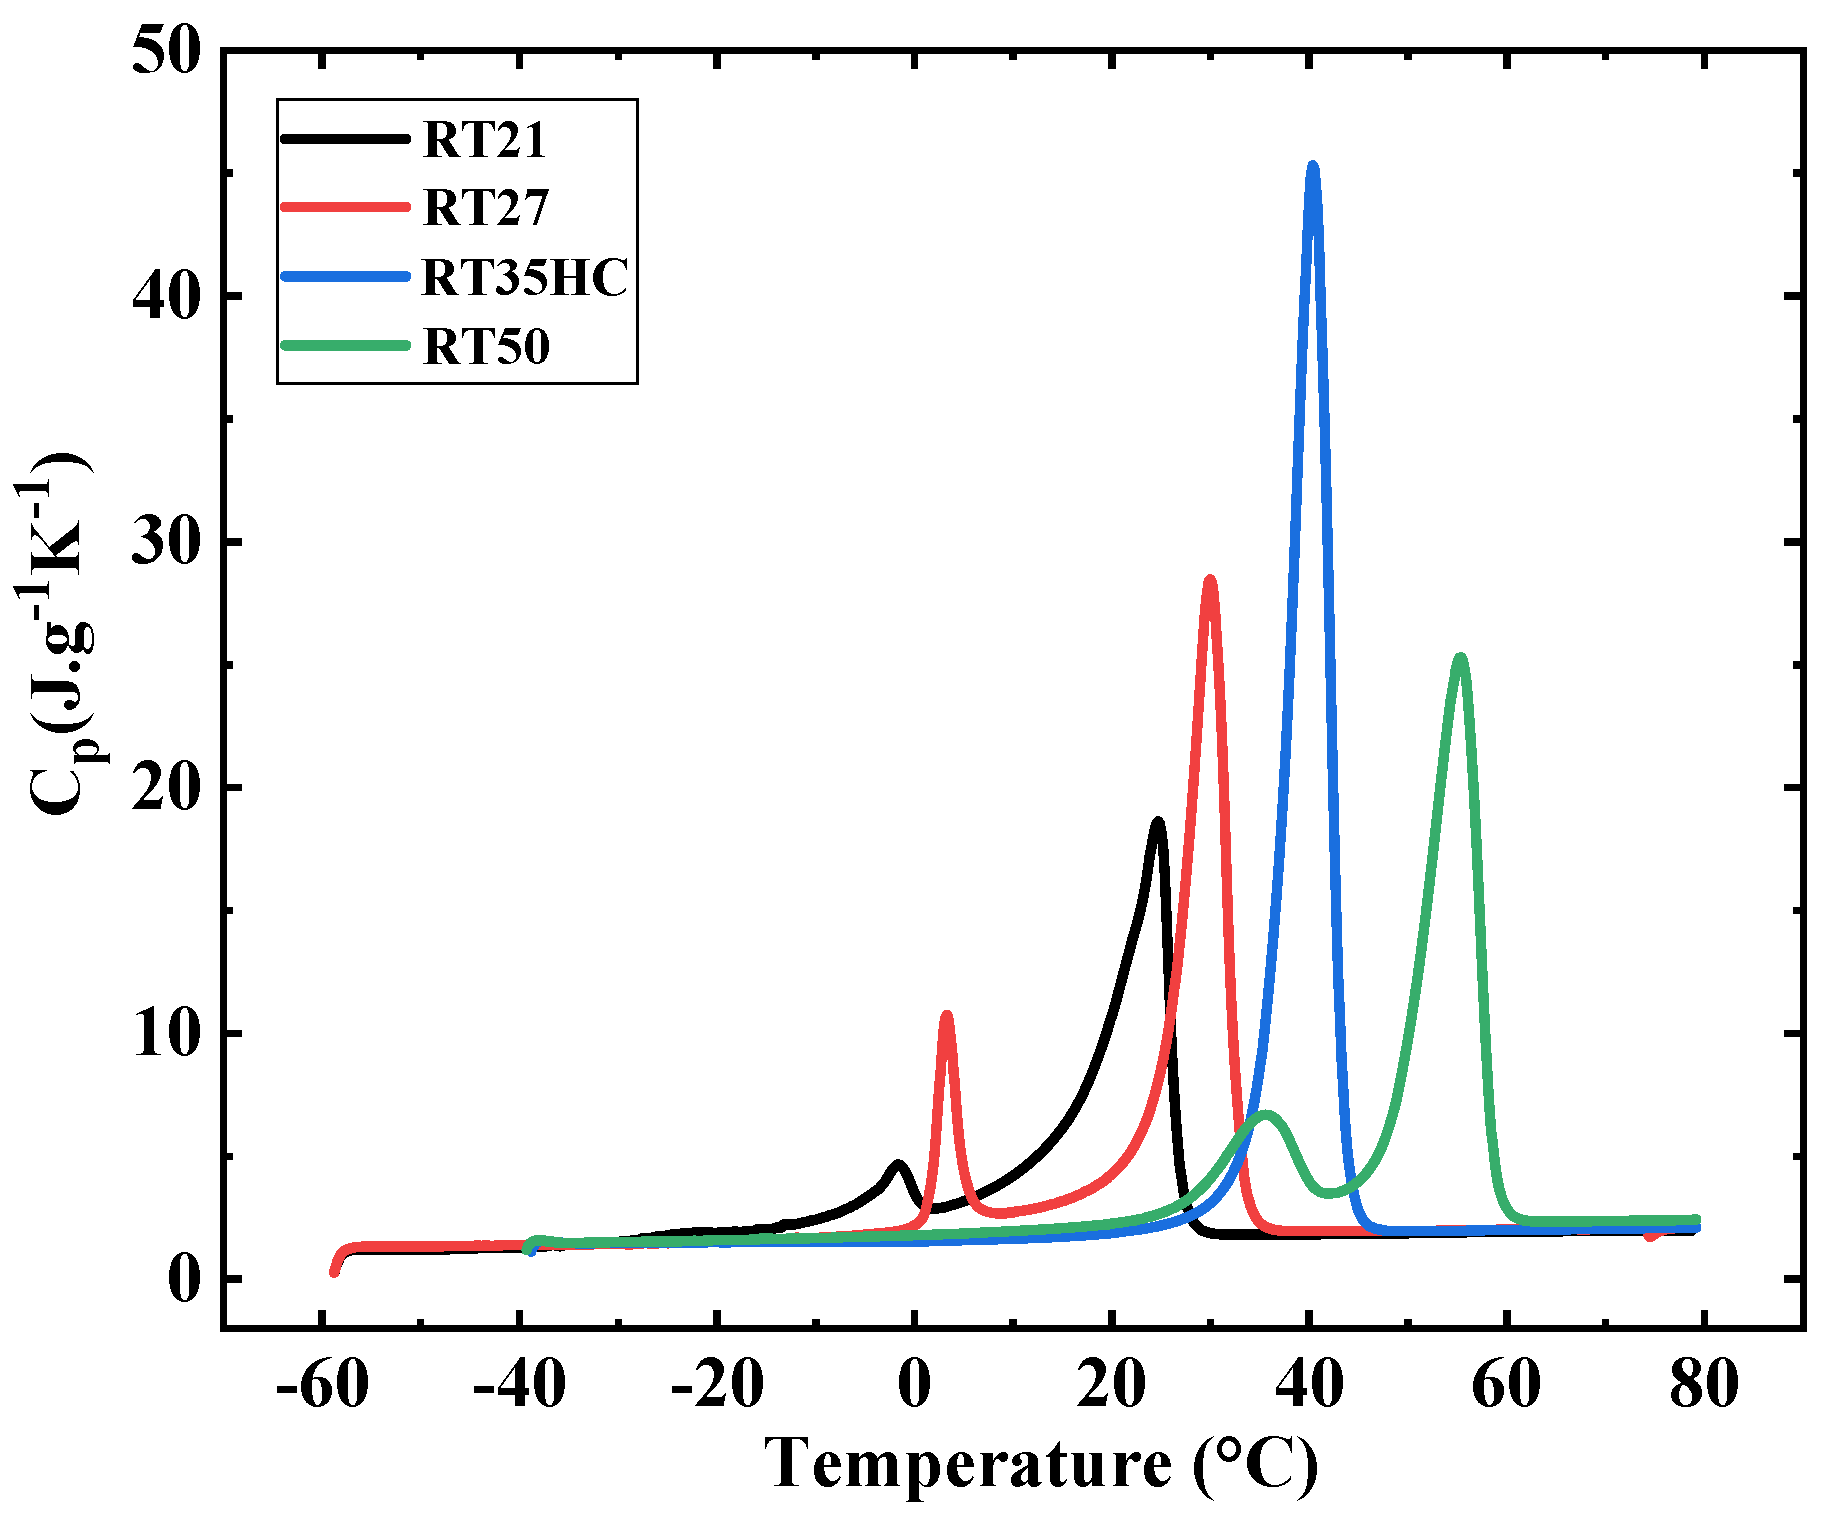
The apparent specific heat capacities of paraffins RT21, RT27, RT35HC and RT50 as a function of temperature from DSC measurements (Section 2.2.1) are displayed in Figure 21.
It can be observed from Figure 21 that the apparent specific heat capacities of the paraffins, given by Equation (9), exhibit two endothermic peaks for RT21, RT27 and RT50. These peaks correspond to the solid–solid and the solid–liquid transitions. However, the apparent specific heat capacity of RT35HC reveals one endothermic peak relative to the solid–liquid transition. An examination of the melting peak amplitudes reveals that RT35HC has the highest apparent specific heat since it has the highest latent heat of melting (Section 3.1.1).
The evolution of the apparent specific heat capacities with temperature evaluated in the current study is of great interest in the numerical studies of the solid–liquid phase change based on the apparent heat capacity method.
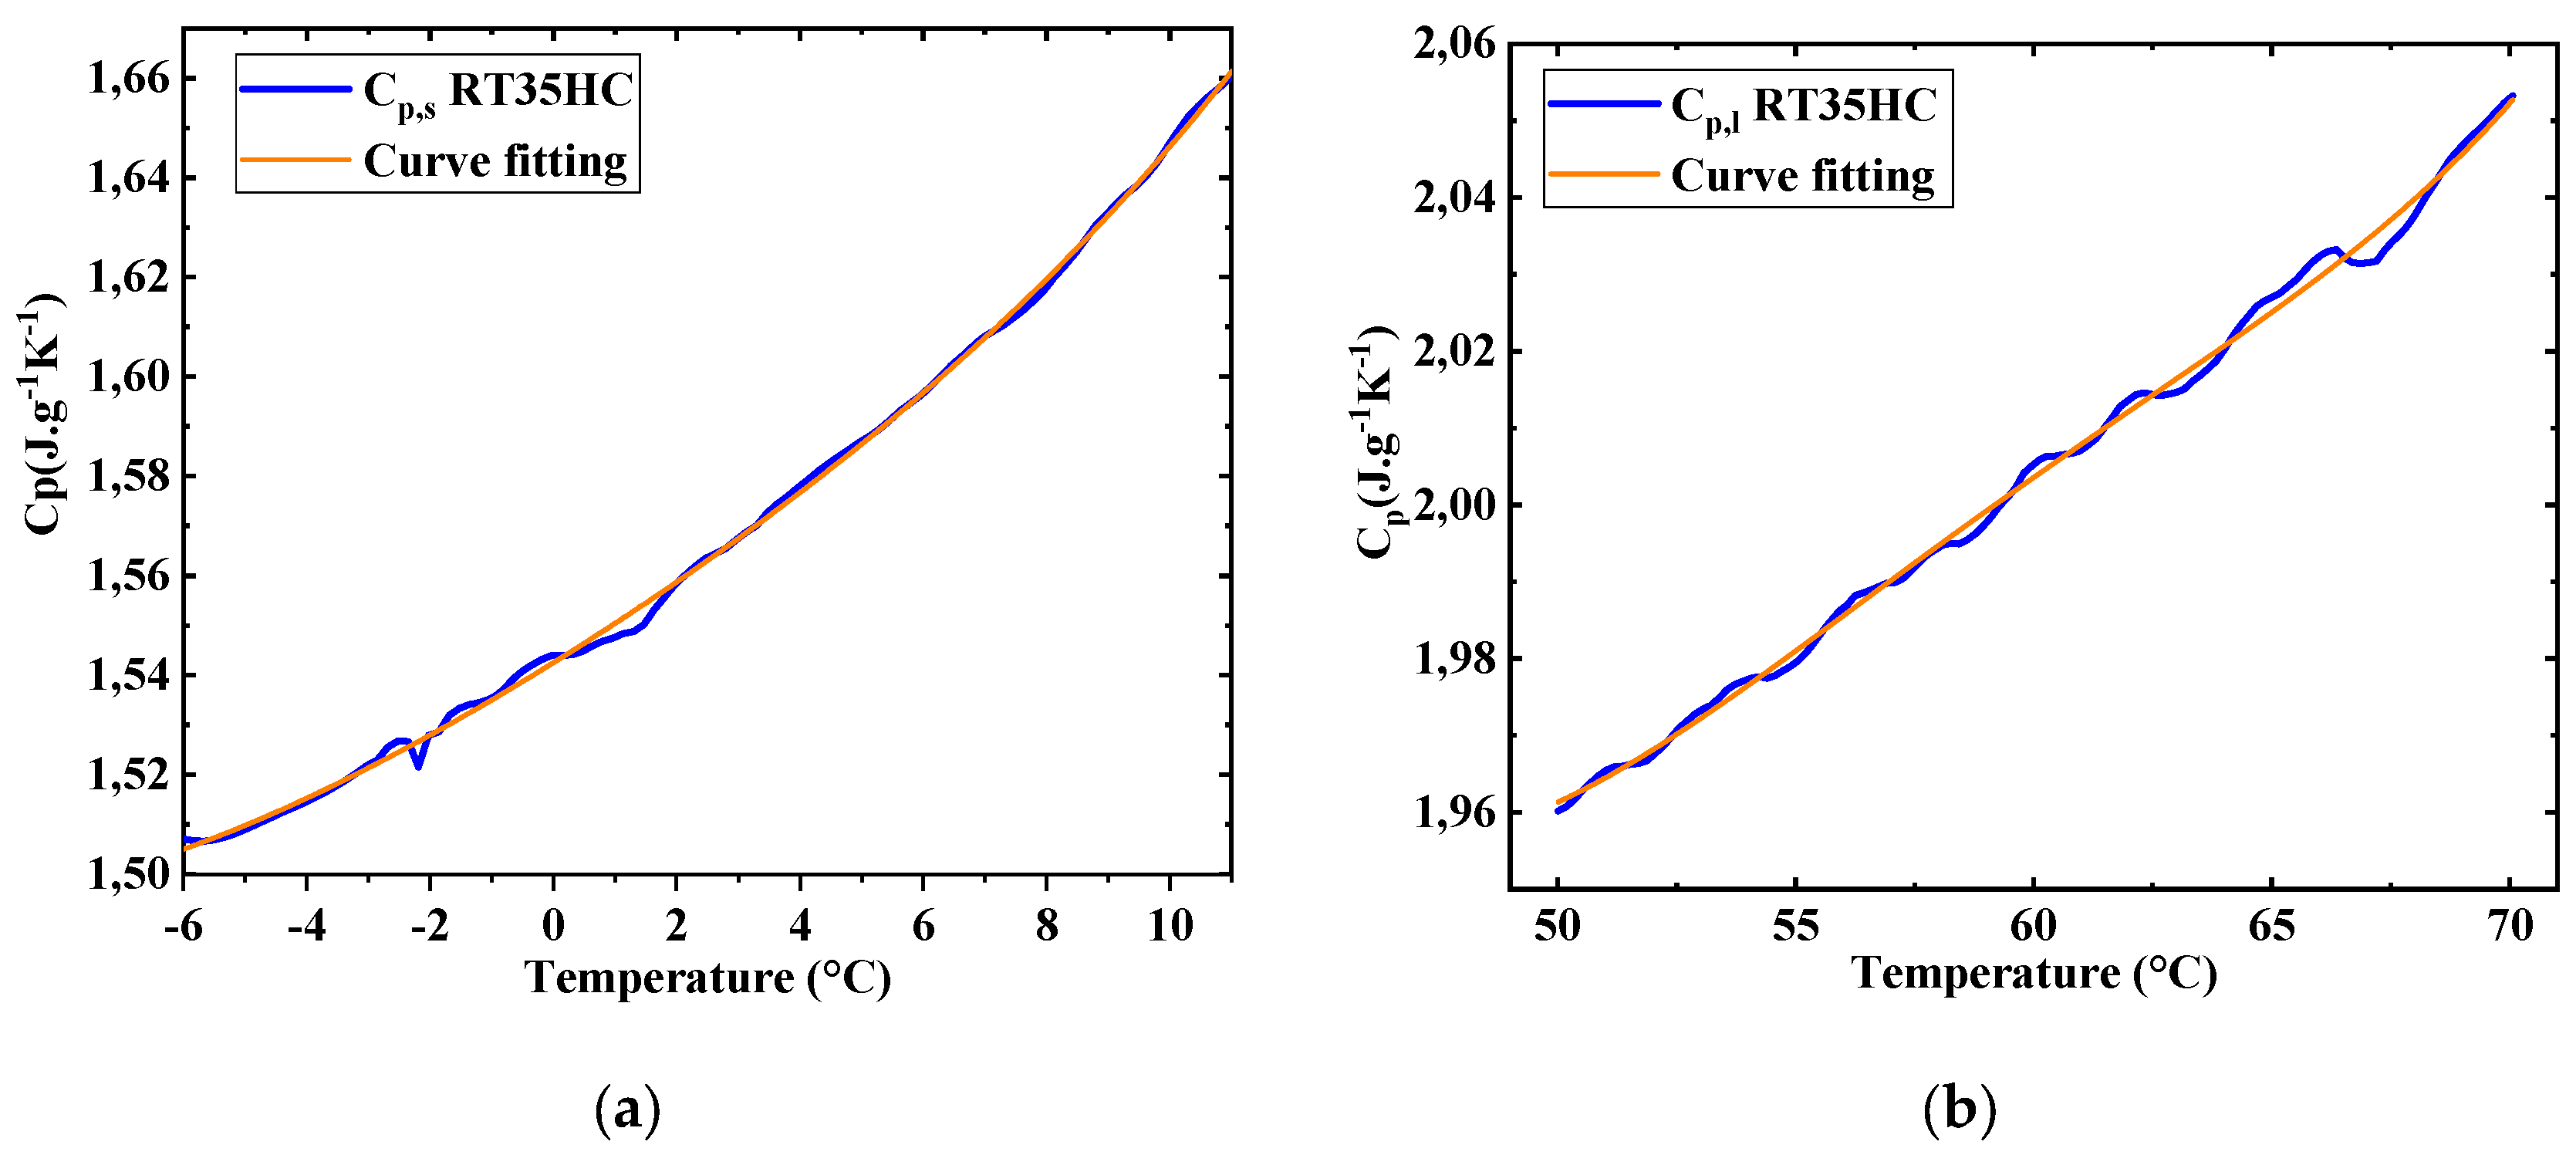
- Specific heats in the solid and liquid phases
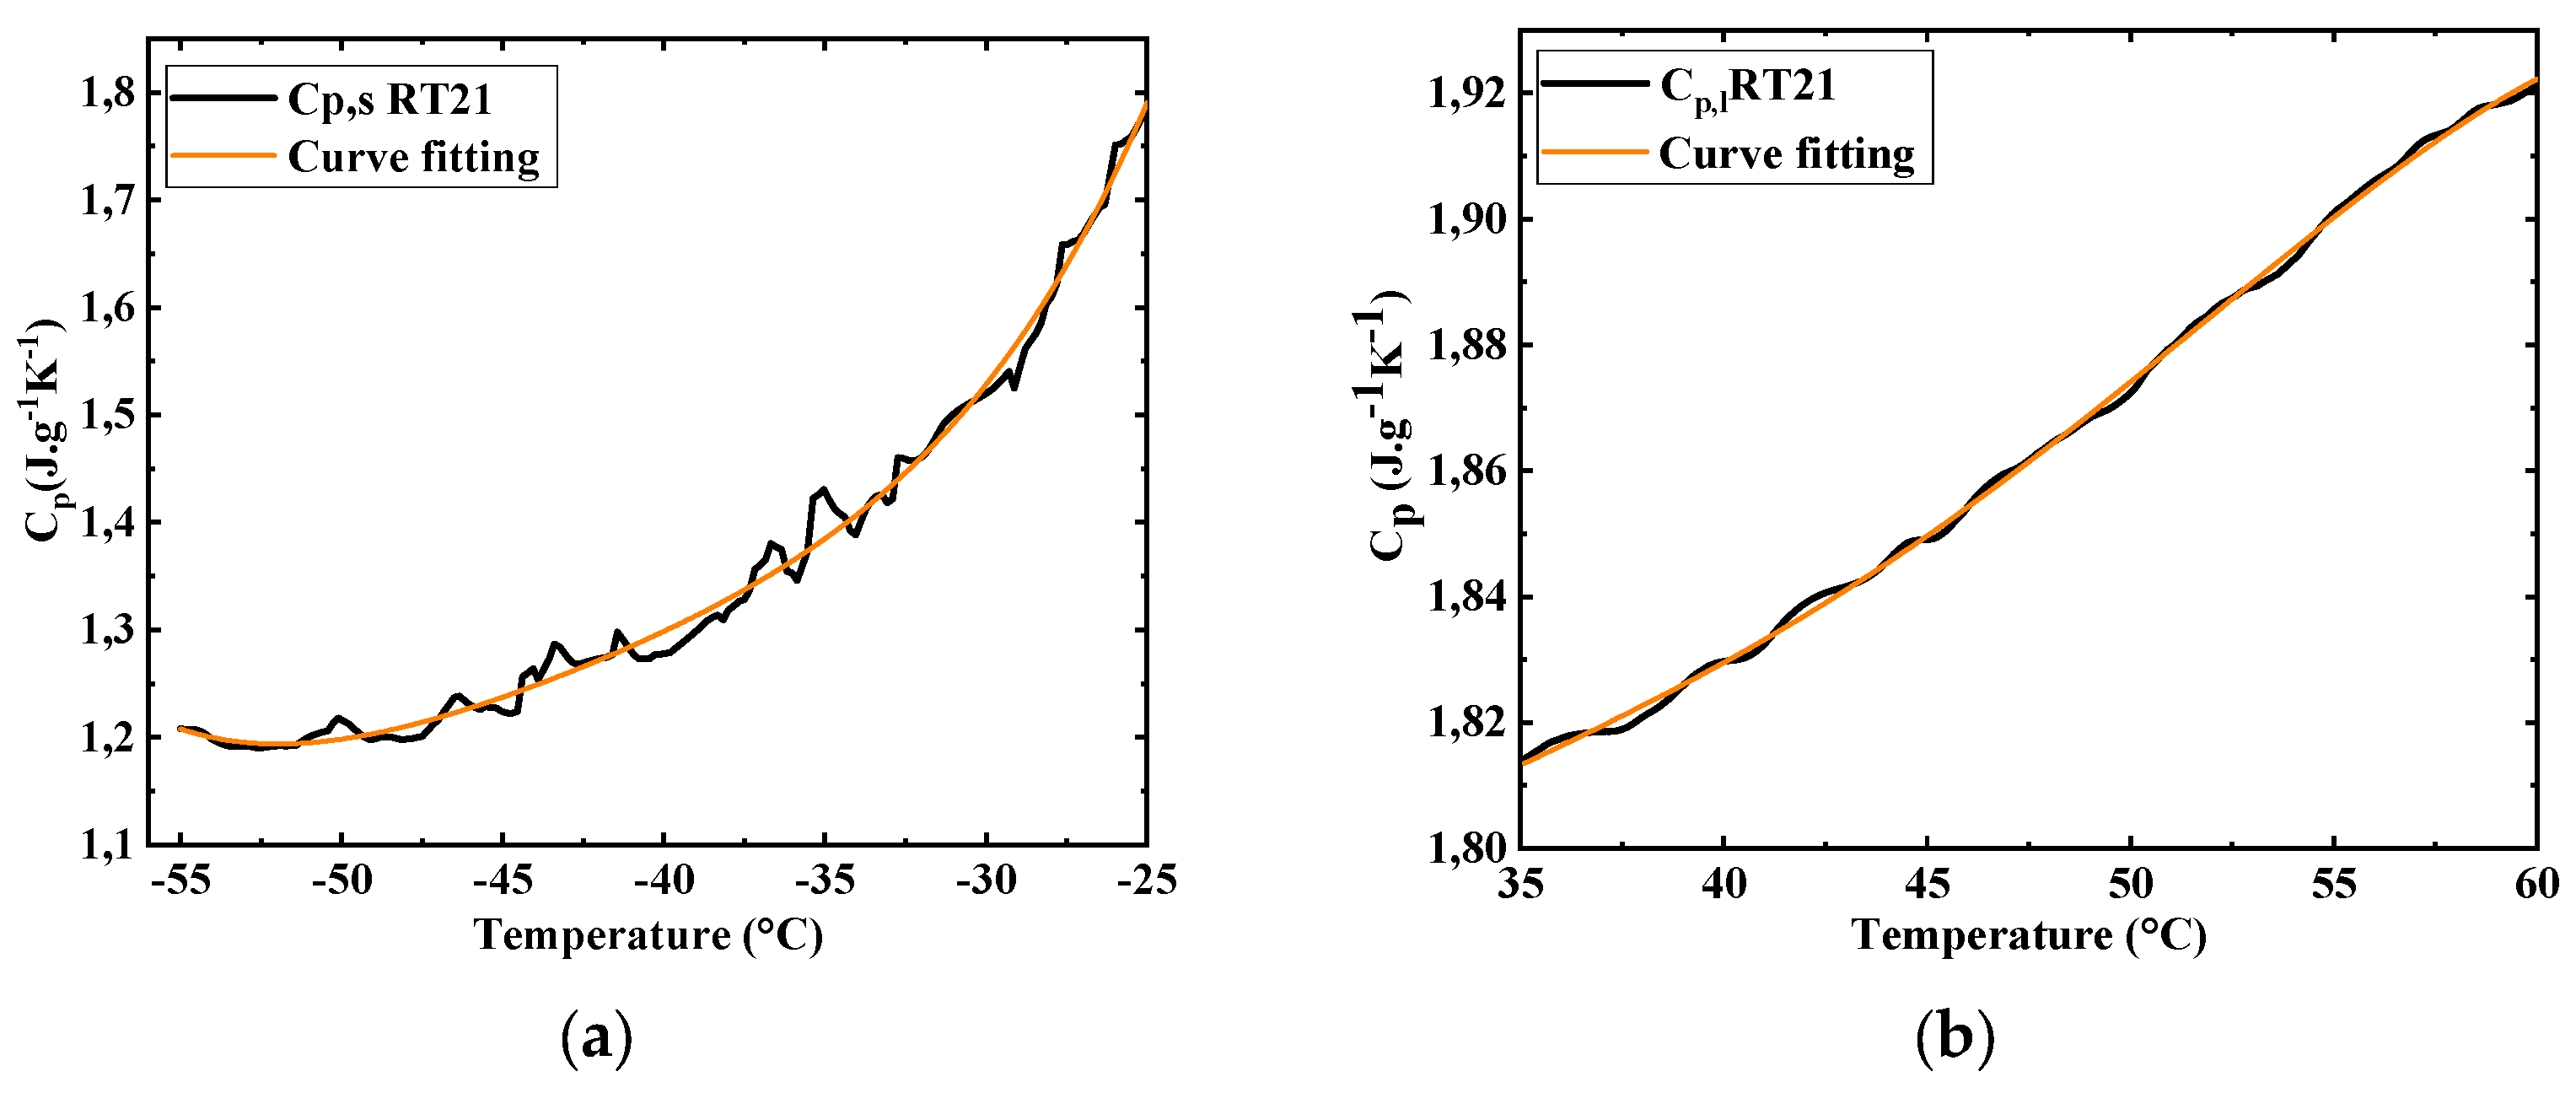
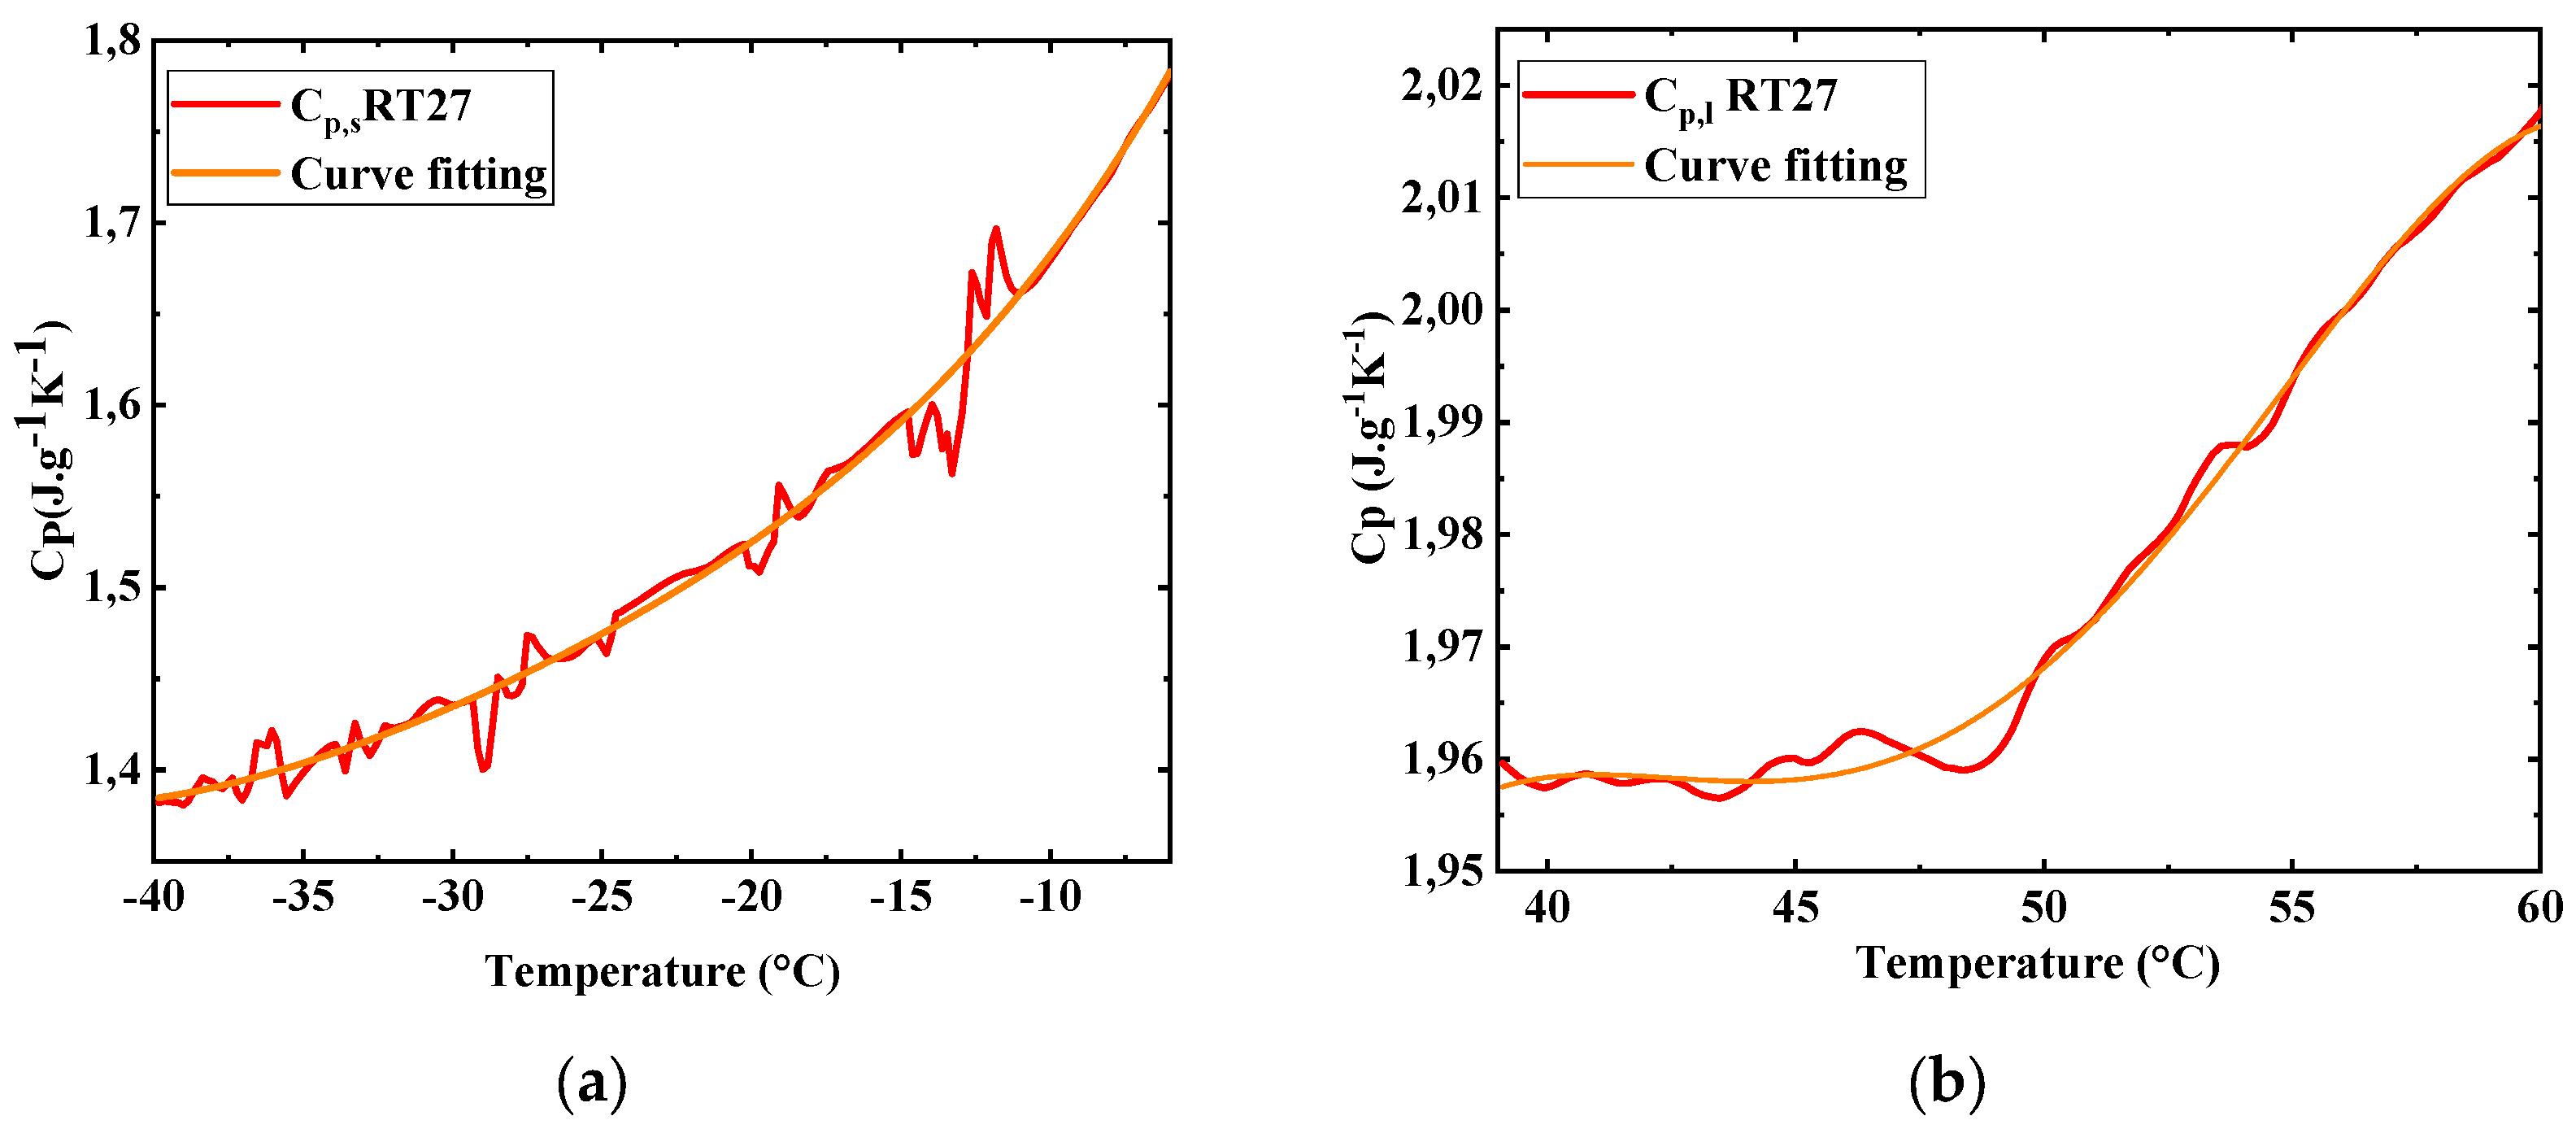
The evolution of the specific heats of the paraffins in the solid and liquid states as a function of temperature are assessed based on the apparent specific heats in the temperature ranges outside the peaks (Figure 22, Figure 23, Figure 24 and Figure 25). The results show that the specific heats of the solid and liquid paraffins increase with temperature. The fluctuations observed in the specific heat curves may be attributed to the positions of the pans in the furnace of the calorimeter, the positions of the pans’ lids, the baseline stability and the temperature gradient in the samples. The comparison between the results in the solid and liquid states reveals that the specific heat of the liquid paraffin is higher than that of the solid phase.
The fitting coefficients of the specific heats of the solid and liquid paraffins to a fourth-degree polynomial equation (Equation (10)) are determined based on the fitting curves of the experimental results (Figure 22, Figure 23, Figure 24 and Figure 25). The coefficients a–e are summarized in Table 9. These original results have a potential utility in numerical studies of the solid–liquid phase change considering the variation of the Cp with temperature.
The average specific heats of the paraffins in the solid and liquid states are calculated and summarized in Table 10. The uncertainties in the calculations are presented also in the table. The comparison between the results of the paraffins reveals that RT21 has the lowest average specific heats in the solid and liquid phases.
- Comparison between the findings of the present work and the available literature data
The experimental specific heats evaluated in this study and the results reported in the literature are compared in Table 11. It can be noted that the specific heats of paraffins RT21, RT27, RT35HC and RT50 given by the supplier [37] are identical for the four paraffins in the solid and liquid phases. This can point out a scarcity of the specific heat data for these paraffins in the literature, which highlights the originality of the current study.
The examination of Table 11 reveals that the specific heats of paraffins RT21, RT35HC and RT50 indicated by Rubitherm [37] show deviations varying from 11.7% to 48.1% in the solid phase. A better agreement was observed between the specific heats mentioned in [37] for the liquid RT21, RT35HC and RT50 and the experimental results with deviations in the range of 7.5% to 15.9%.
Concerning paraffin RT27, it was found that the specific heat in the solid phase indicated by the supplier [37] shows a deviation of 31.5% compared to this work. However, a deviation of 113% from the specific heat measured in [20] was observed. This high deviation can be attributed to the mass of the paraffin, the temperature range of the DSC test and the calibration of the DSC instrument. The results reported in the literature with regard to the specific heat of RT27 in the liquid phase were in concordance with the current result, with discrepancies of 1.5% in [37] and 13.1% in [20].
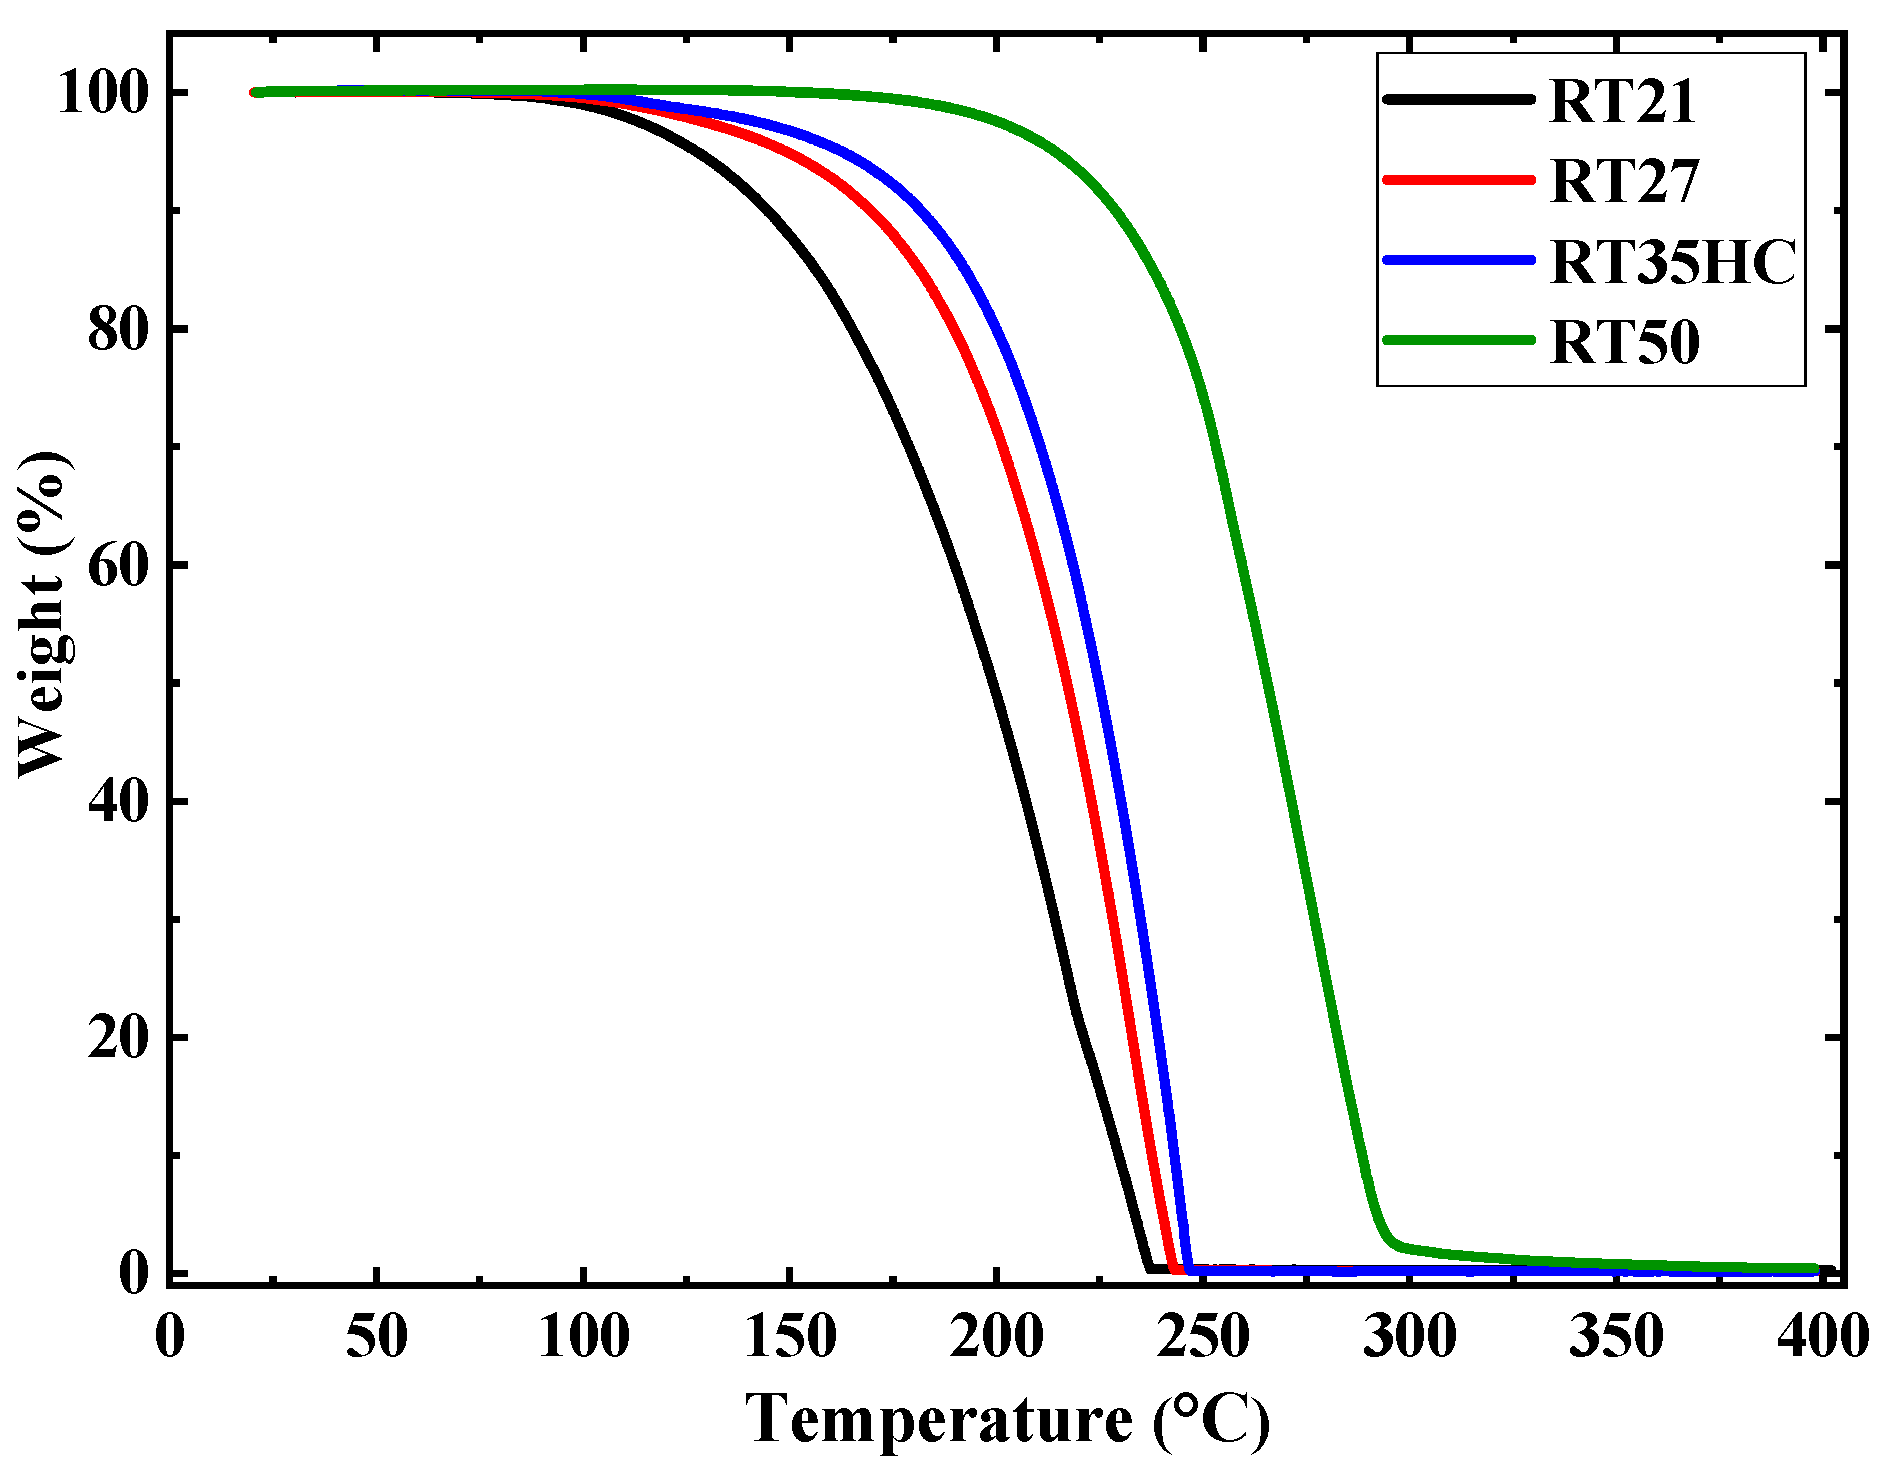
3.2. Thermogravimetric Analysis (TGA)
The thermal degradations of the paraffin waxes are illustrated in Figure 26. The results show that the mass loss of the paraffins is almost negligible (<2%) when the temperature is lower than 109.9 °C for RT21, 123.8 °C for RT27, 135.5 °C for RT35HC and 196.4 °C for RT50. This reveals that the paraffins are thermally stable in the temperature ranges of their solid–liquid phase changes. This stability provides them an advantage for the heat storage applications. The initial weight loss (3%) of RT21, RT27, RT35HC and RT50 is observed at 117 °C, 134.2 °C, 147.6 °C and 203.9 °C, respectively. These onset temperatures of degradation have great importance in terms of safety reasons in systems based on PCMs. Afterward, a rapid increase in the rate of the weight loss of the paraffins is noticed. Table 12 summarizes the temperatures associated with the degradation rates of 10%, 25%, 50% and 75% of the paraffin waxes. The quasi-total degradation of the paraffins (>99%) is reached at 236.5 °C for RT21, at 242.4 °C for RT27, at 246 °C for RT35HC and at 336 °C for RT50.
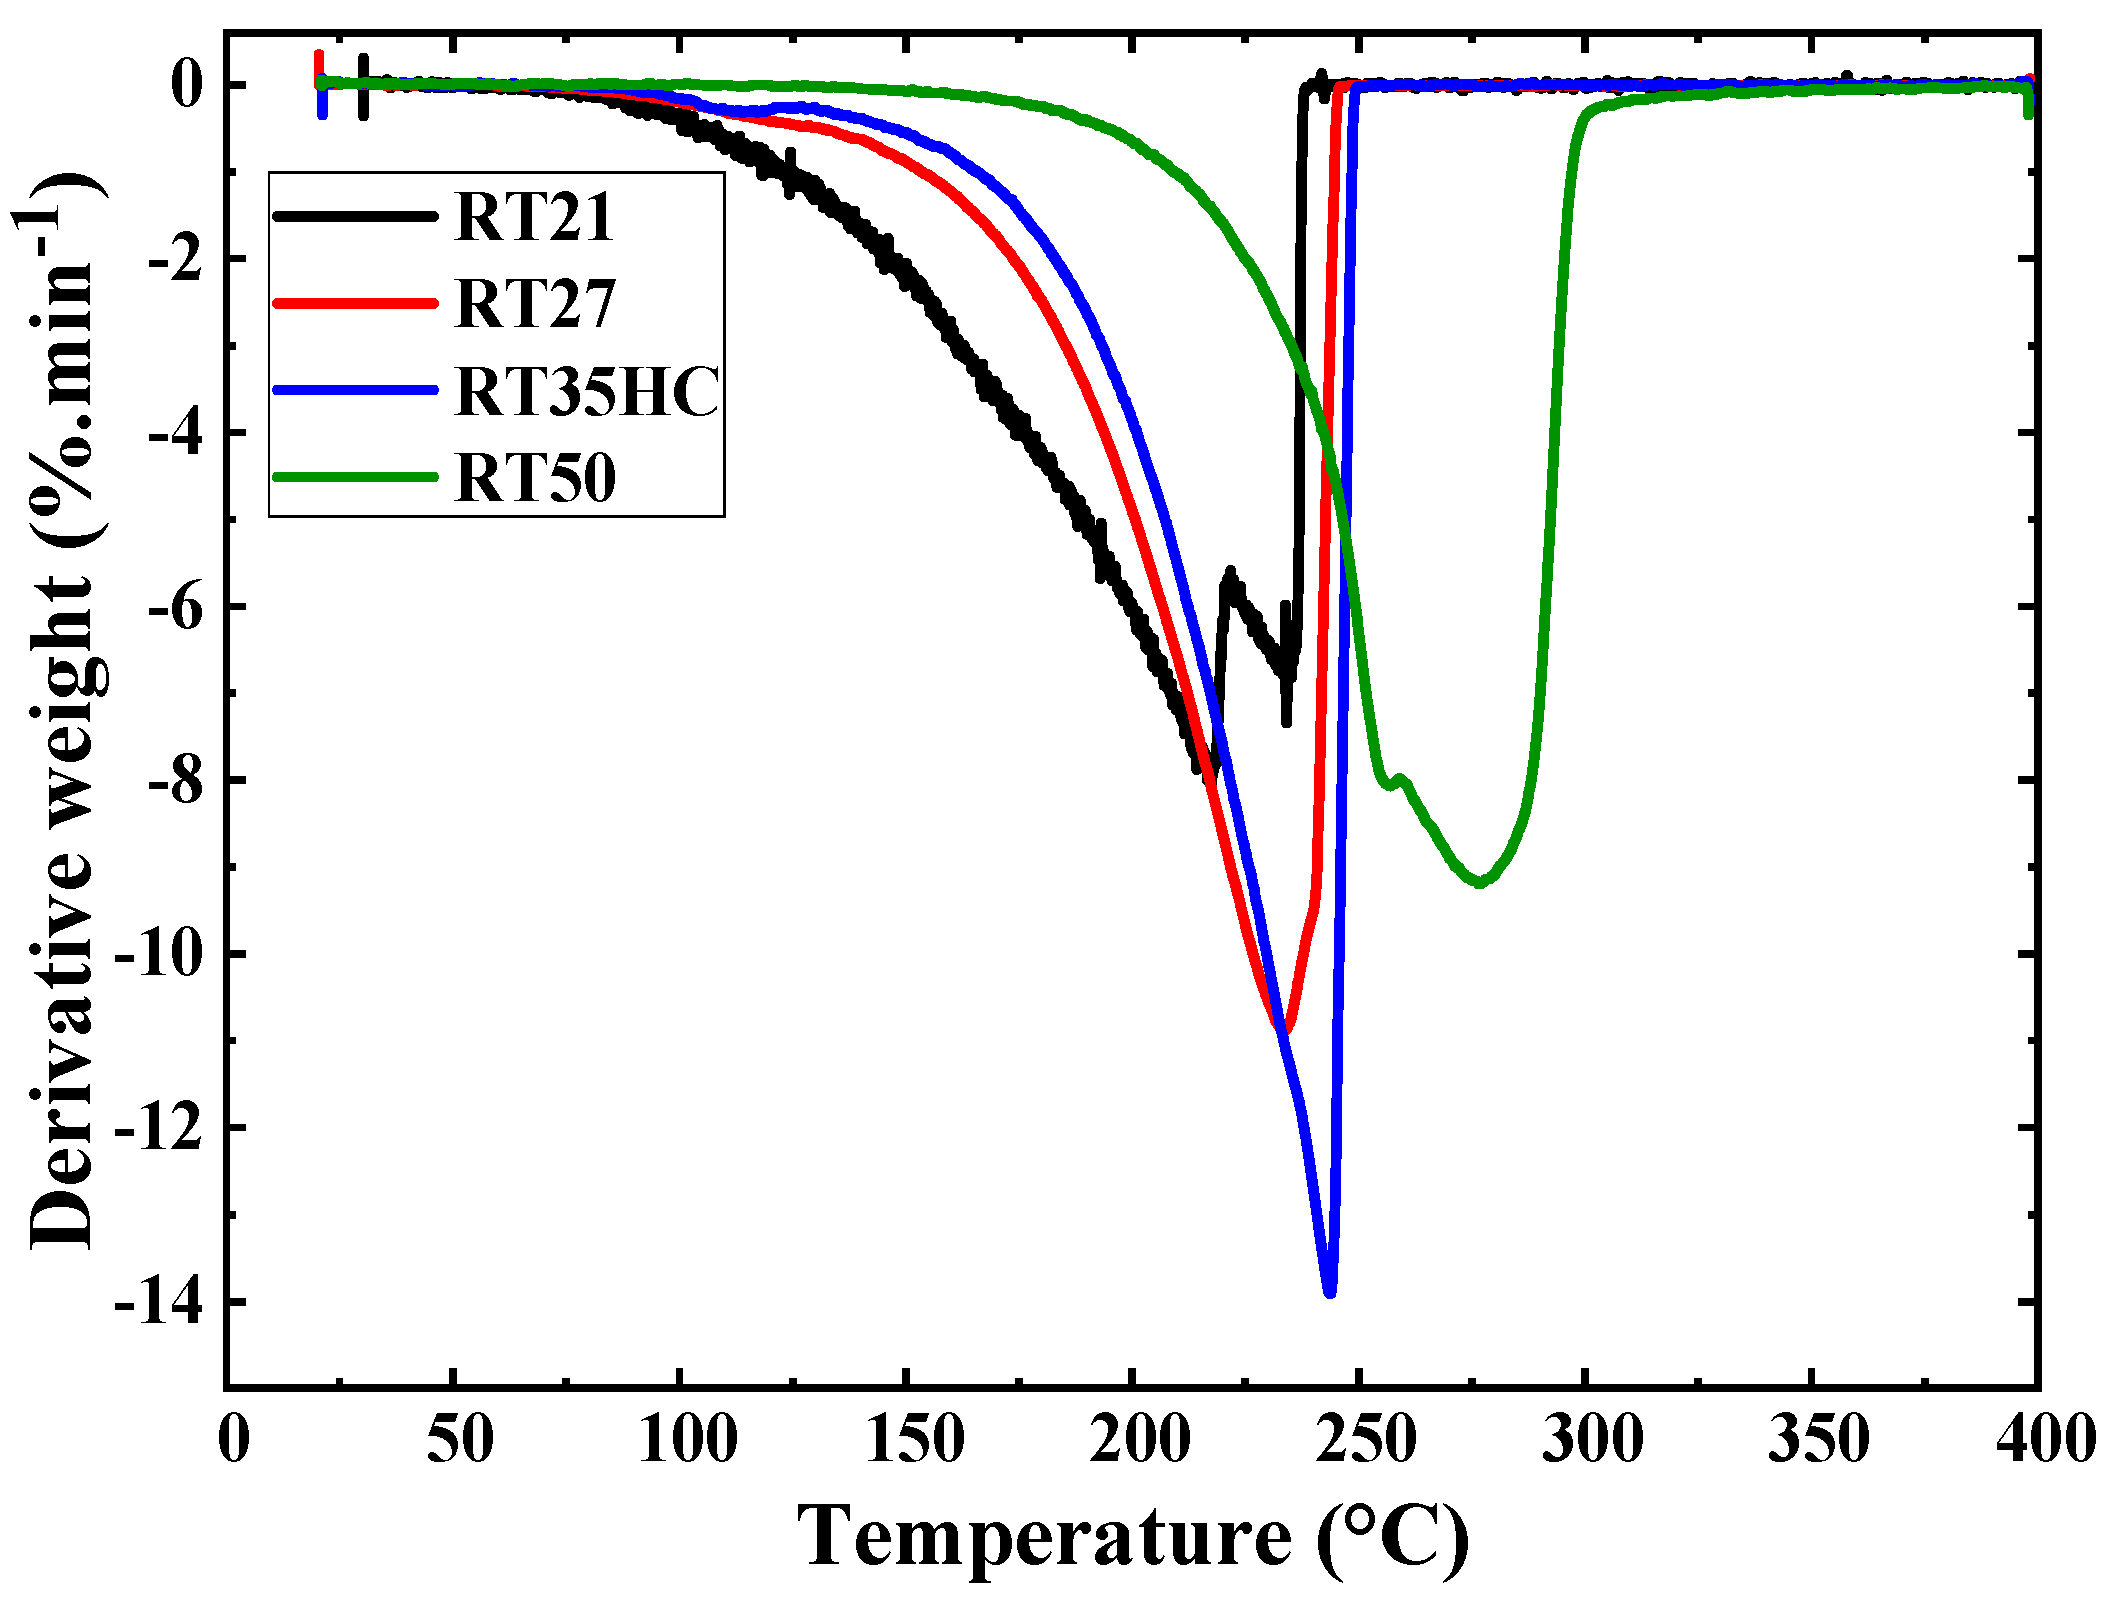
The evolution of the derivative curve of the weight loss of the paraffins as a function of temperature is illustrated in Figure 27. The results show an increase in the rate of the weight loss from the onset temperatures of degradation, which are 117 °C, 134.2 °C, 147.6 °C and 203.9 °C for paraffins RT21, RT27, RT35HC and RT50, respectively. Then, the rate of the degradation reaches its maximum at 217.5 °C for RT21, at 233.3 °C for RT27, at 243.7 °C for RT35HC and at 276.6 °C for RT50, which explains the sudden mass losses of paraffins observed in Figure 26. Finally, a zero speed of degradation is observed from the temperatures of the quasi-total degradation (>99%) of the paraffins. The comparison between the numbers of the peaks displayed in Figure 27 reveals that the degradation of paraffins RT27 and RT35HC is a one-step process. However, the weight losses of paraffins R21 and RT50 occur in two stages identified by the two peaks observed in the derivative curve of the degradation (Figure 27).
3.3. Thermal Conductivities
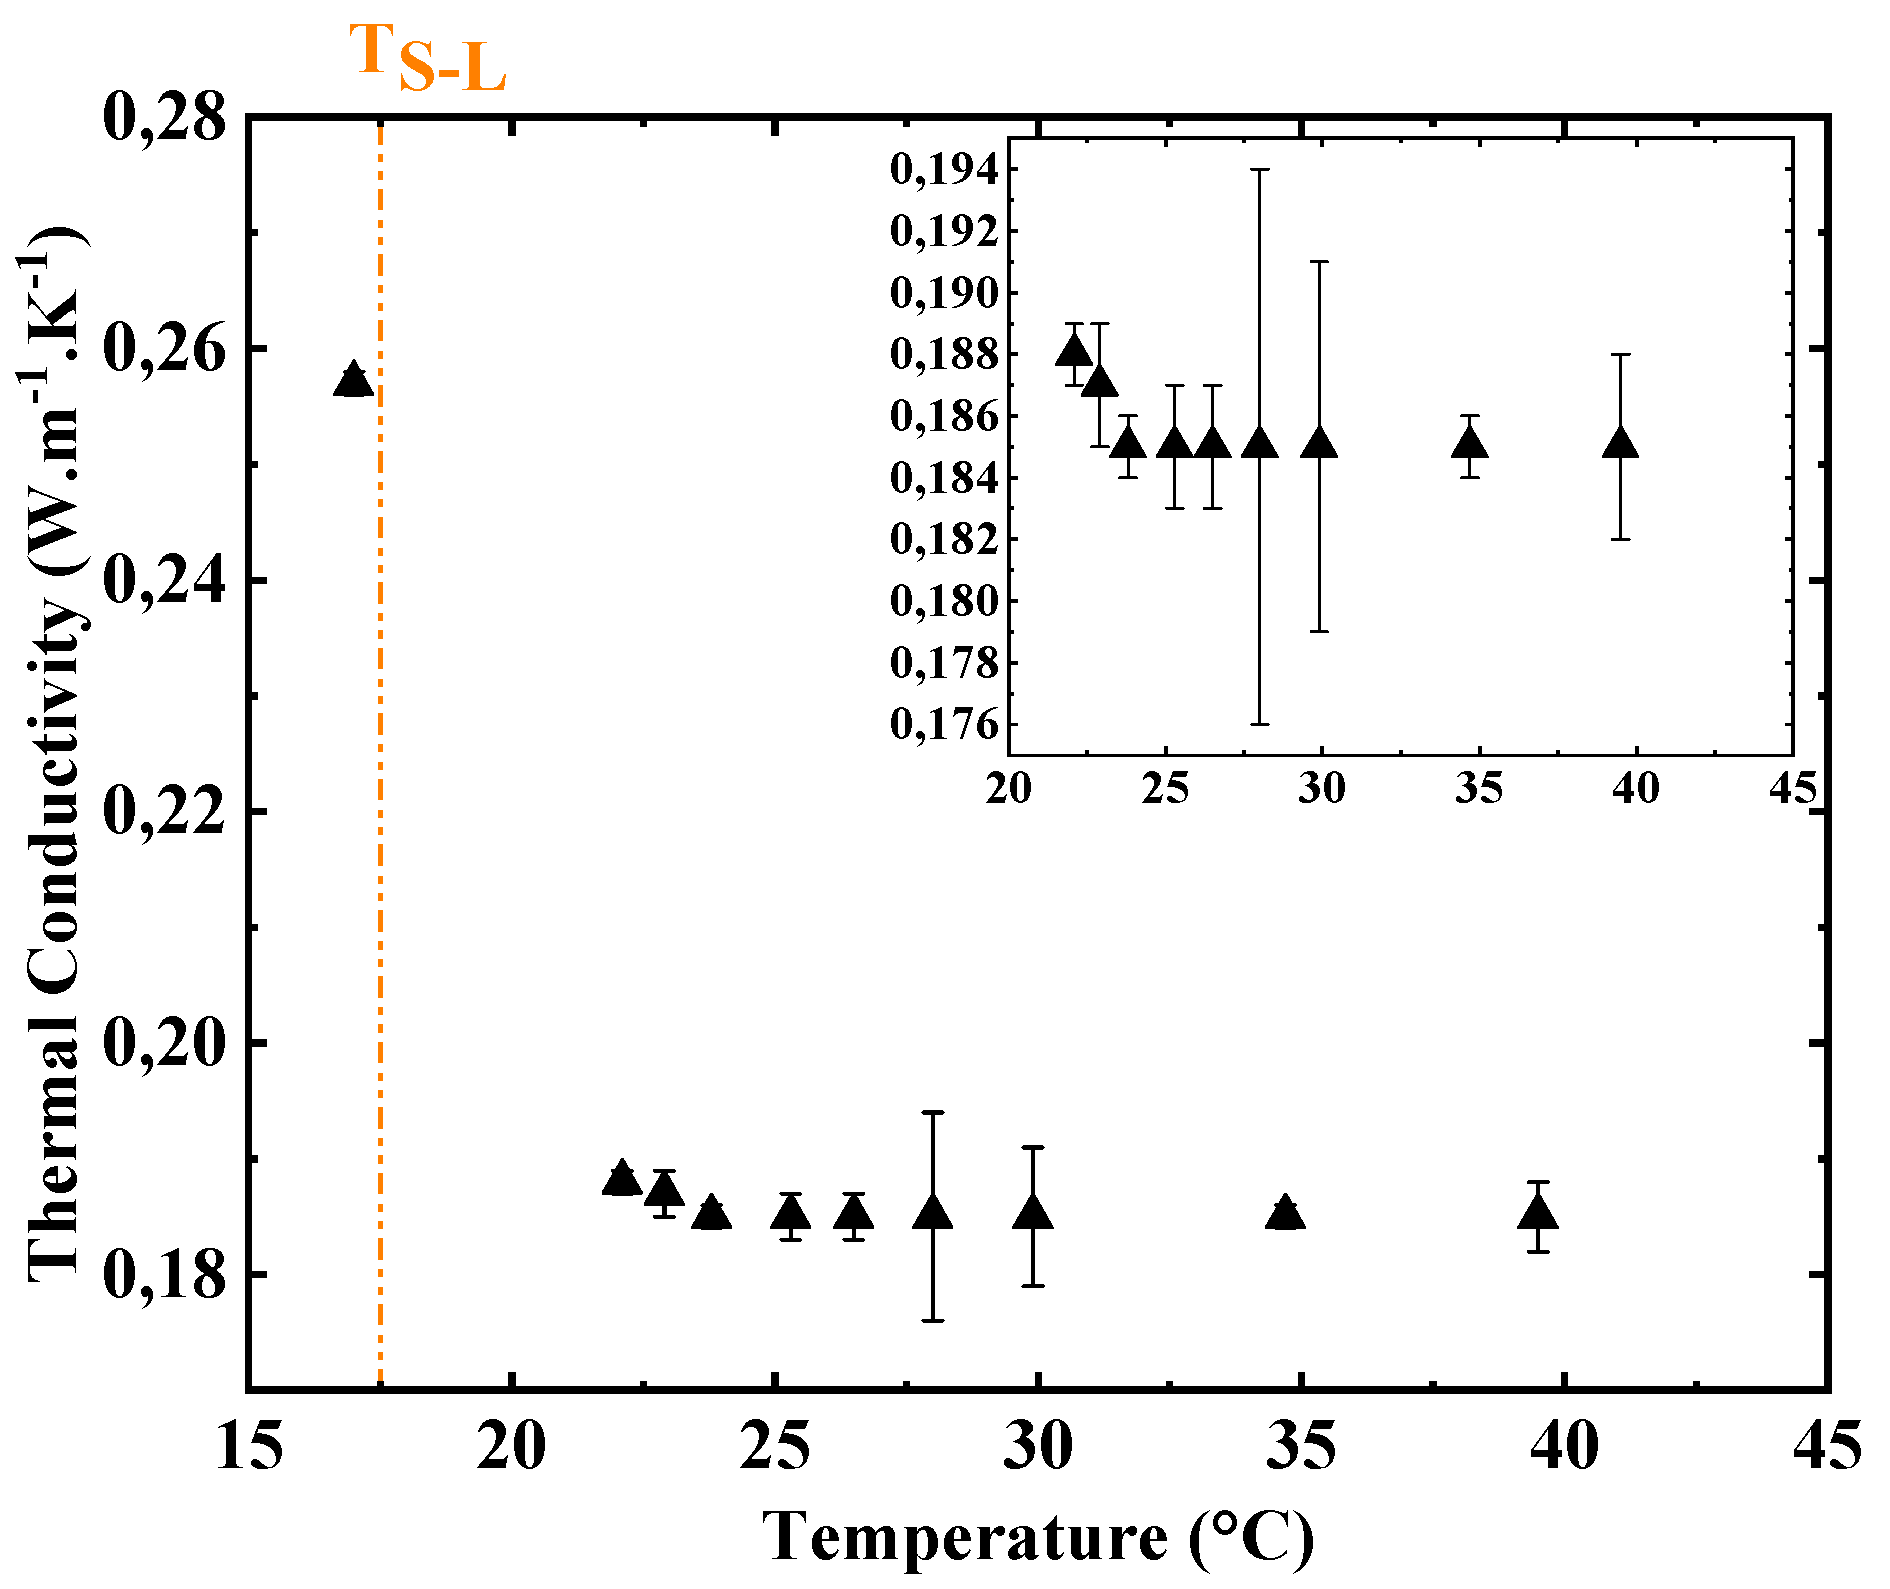
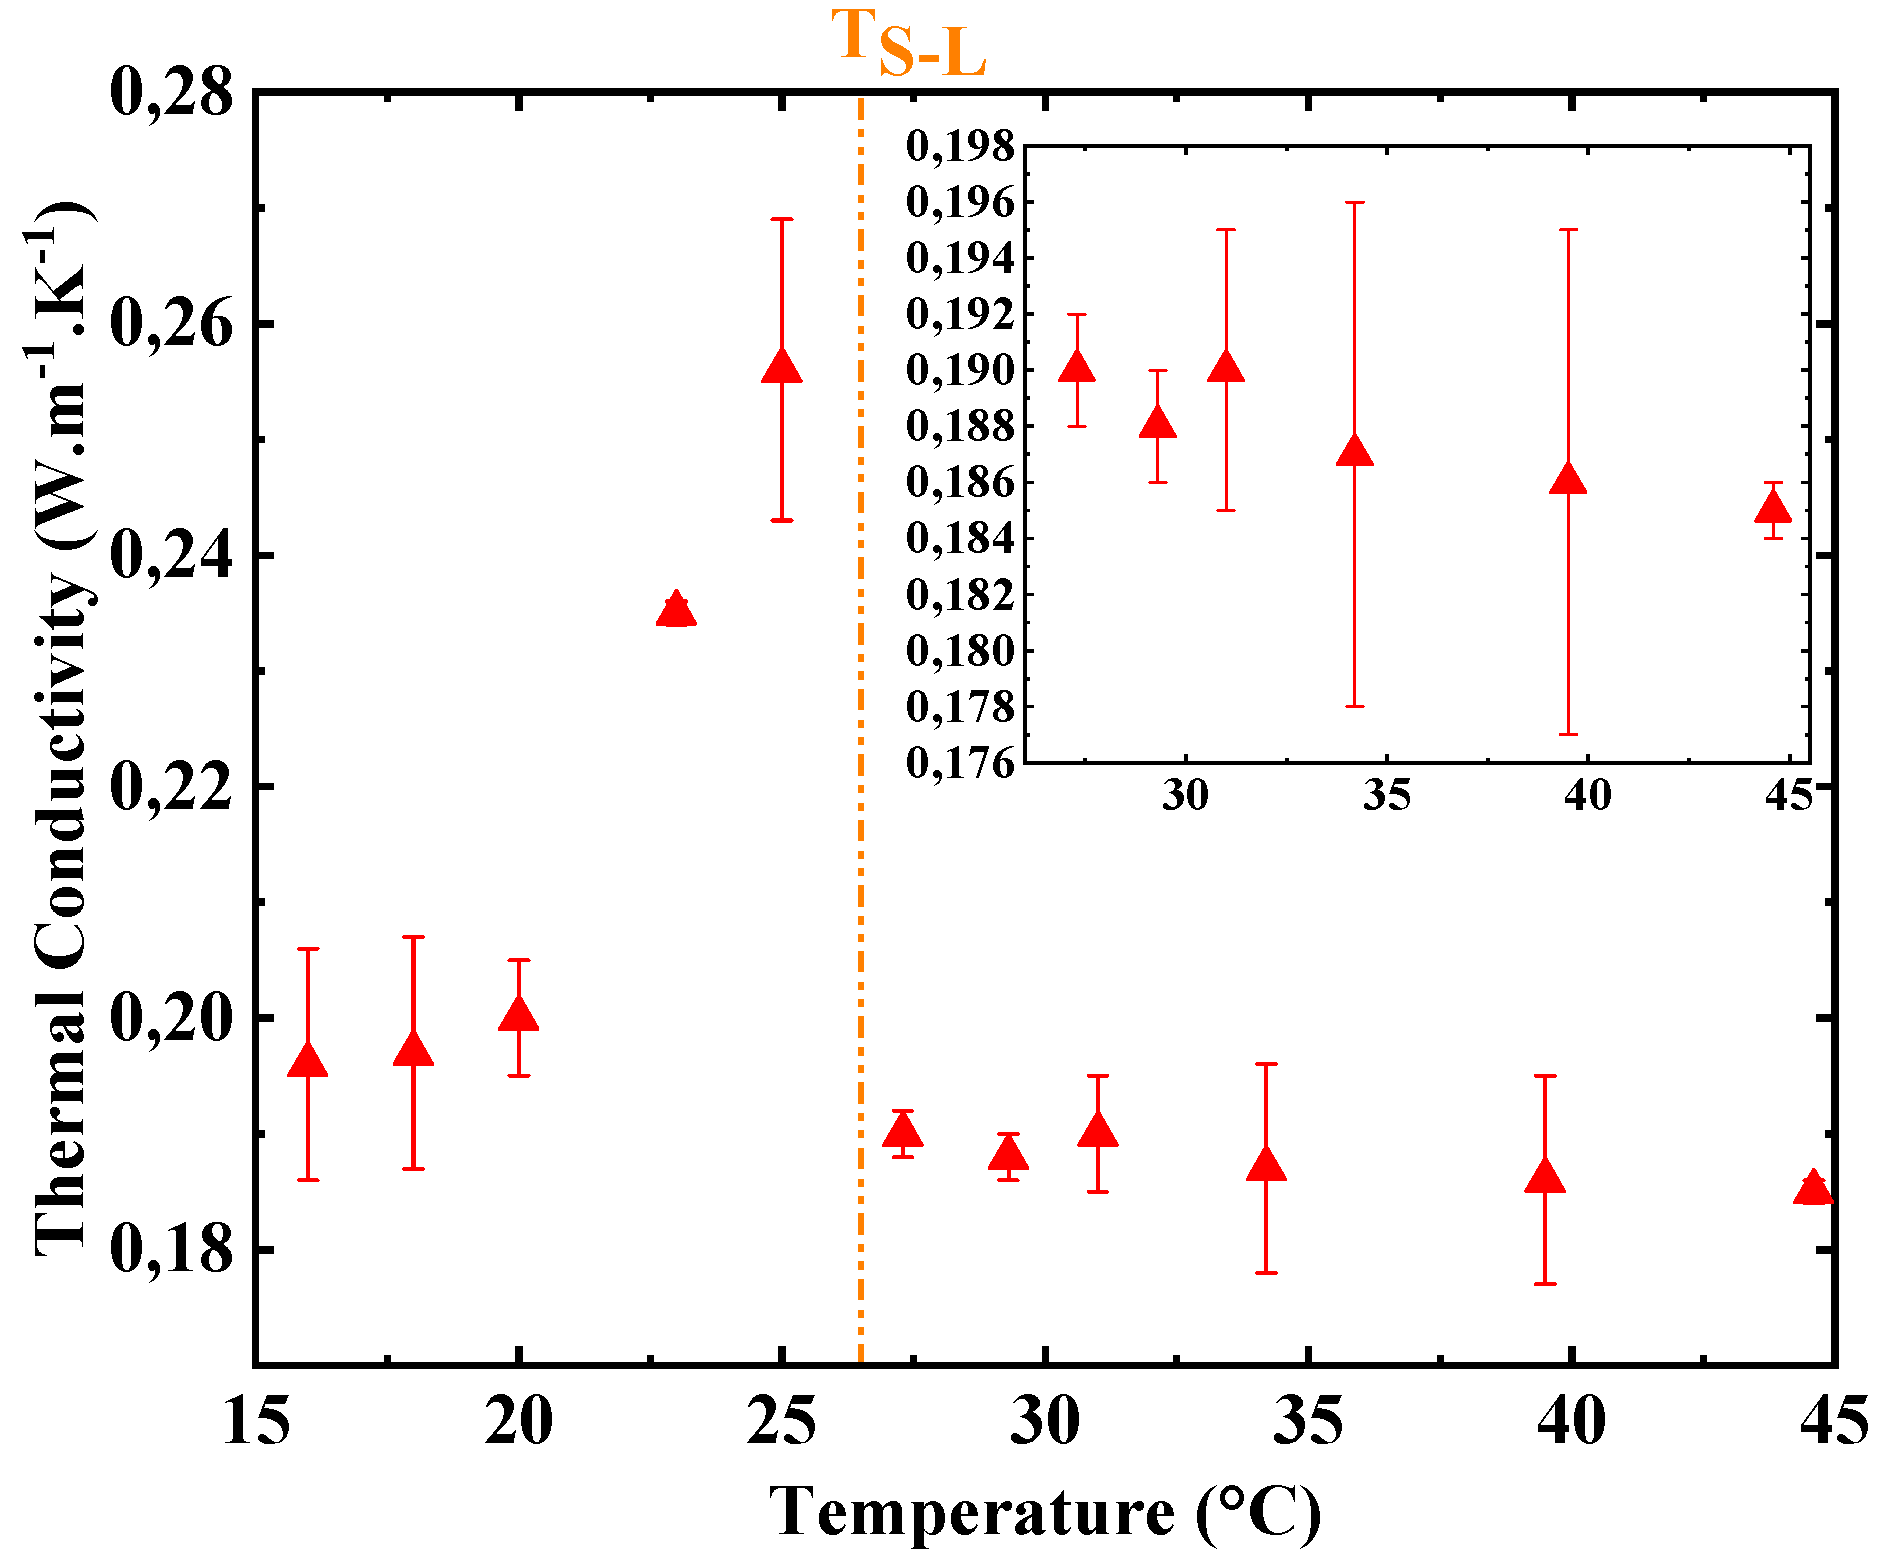
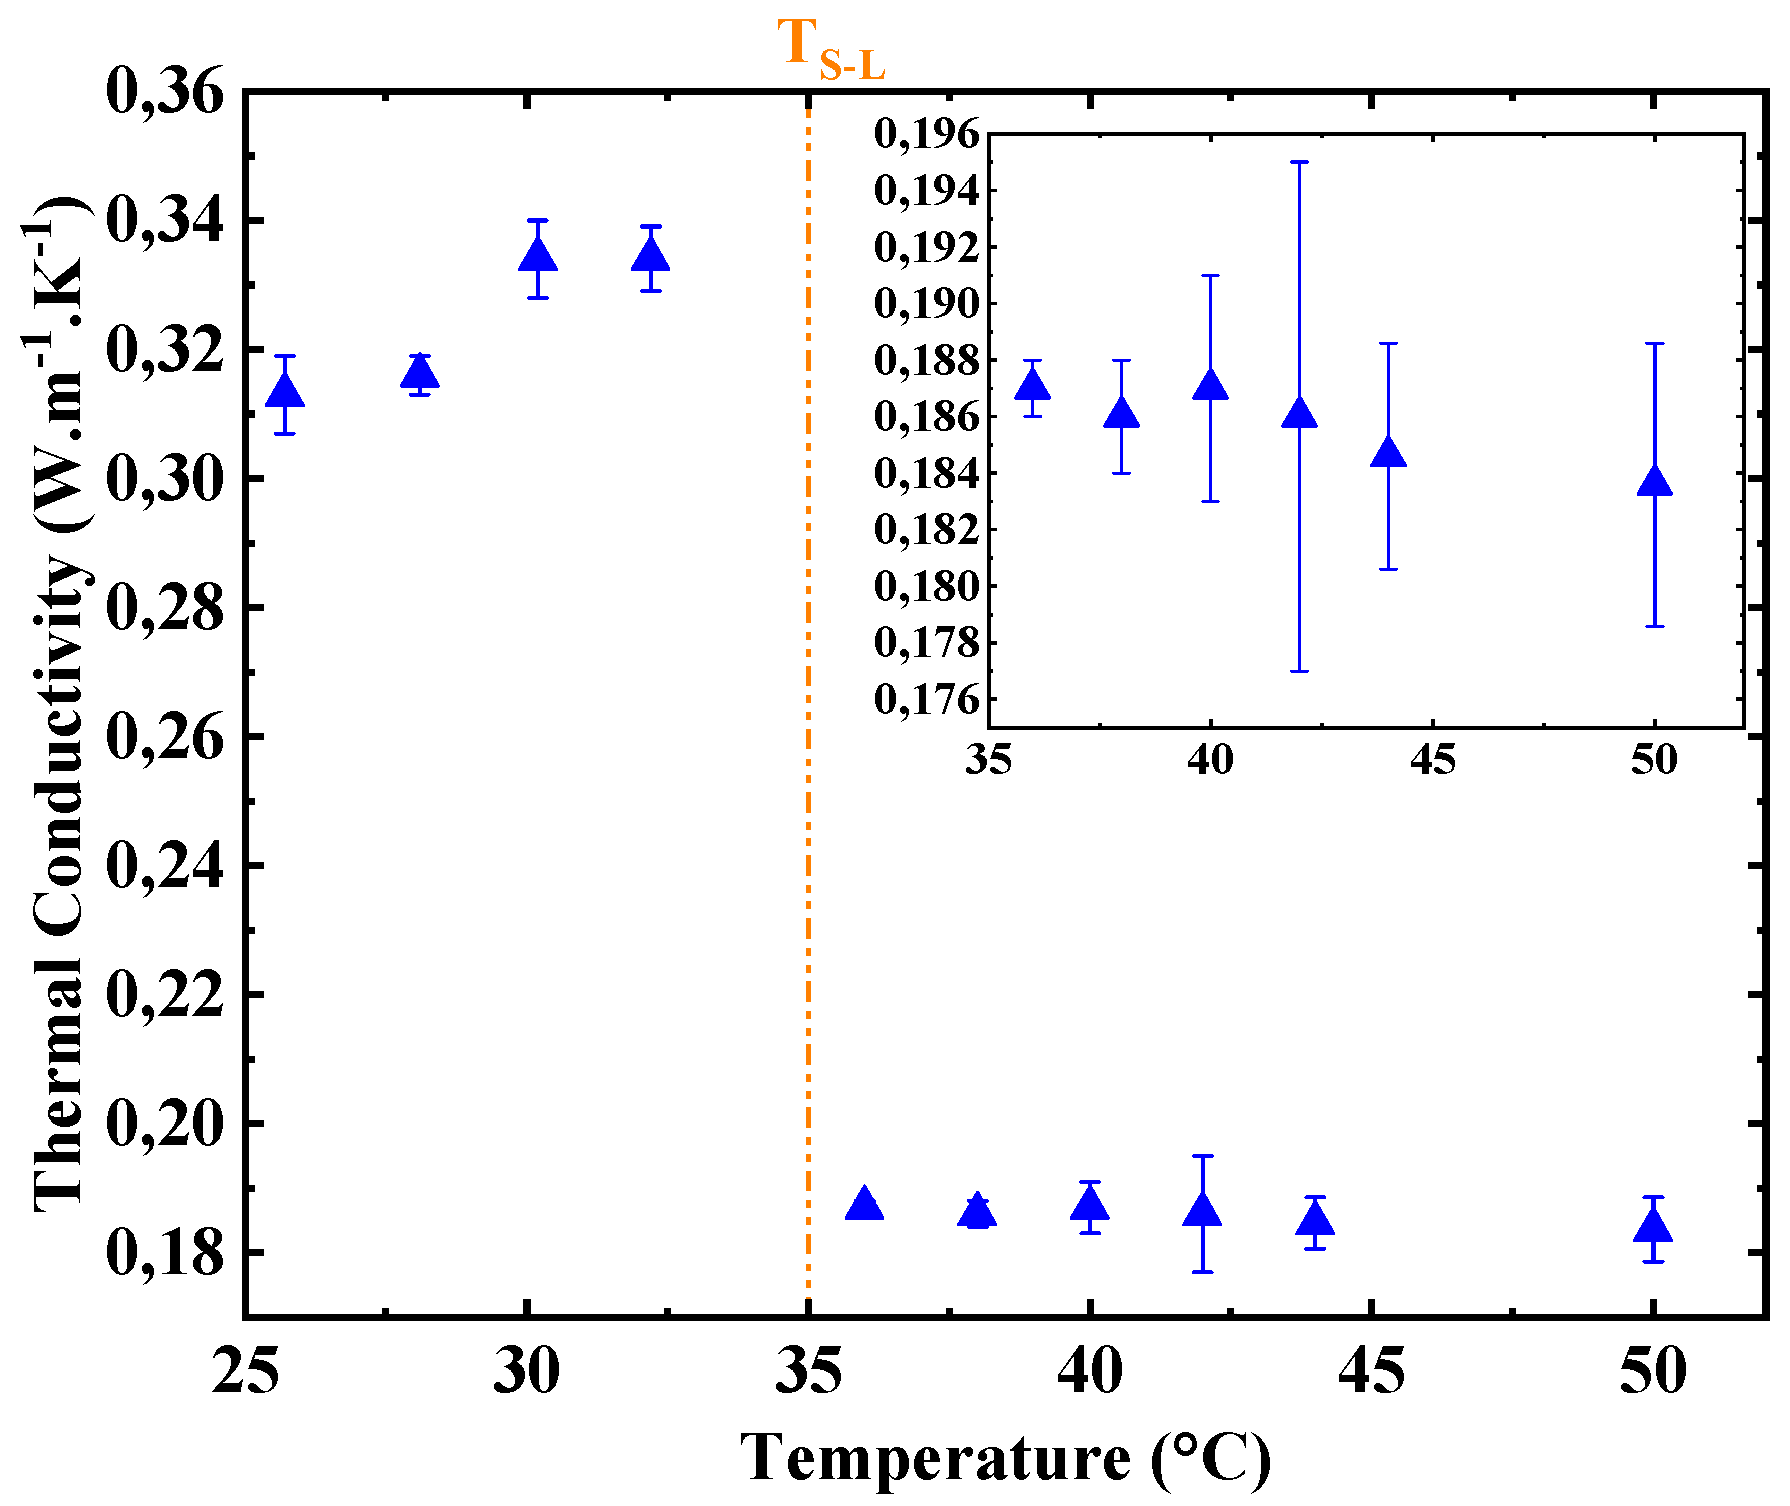
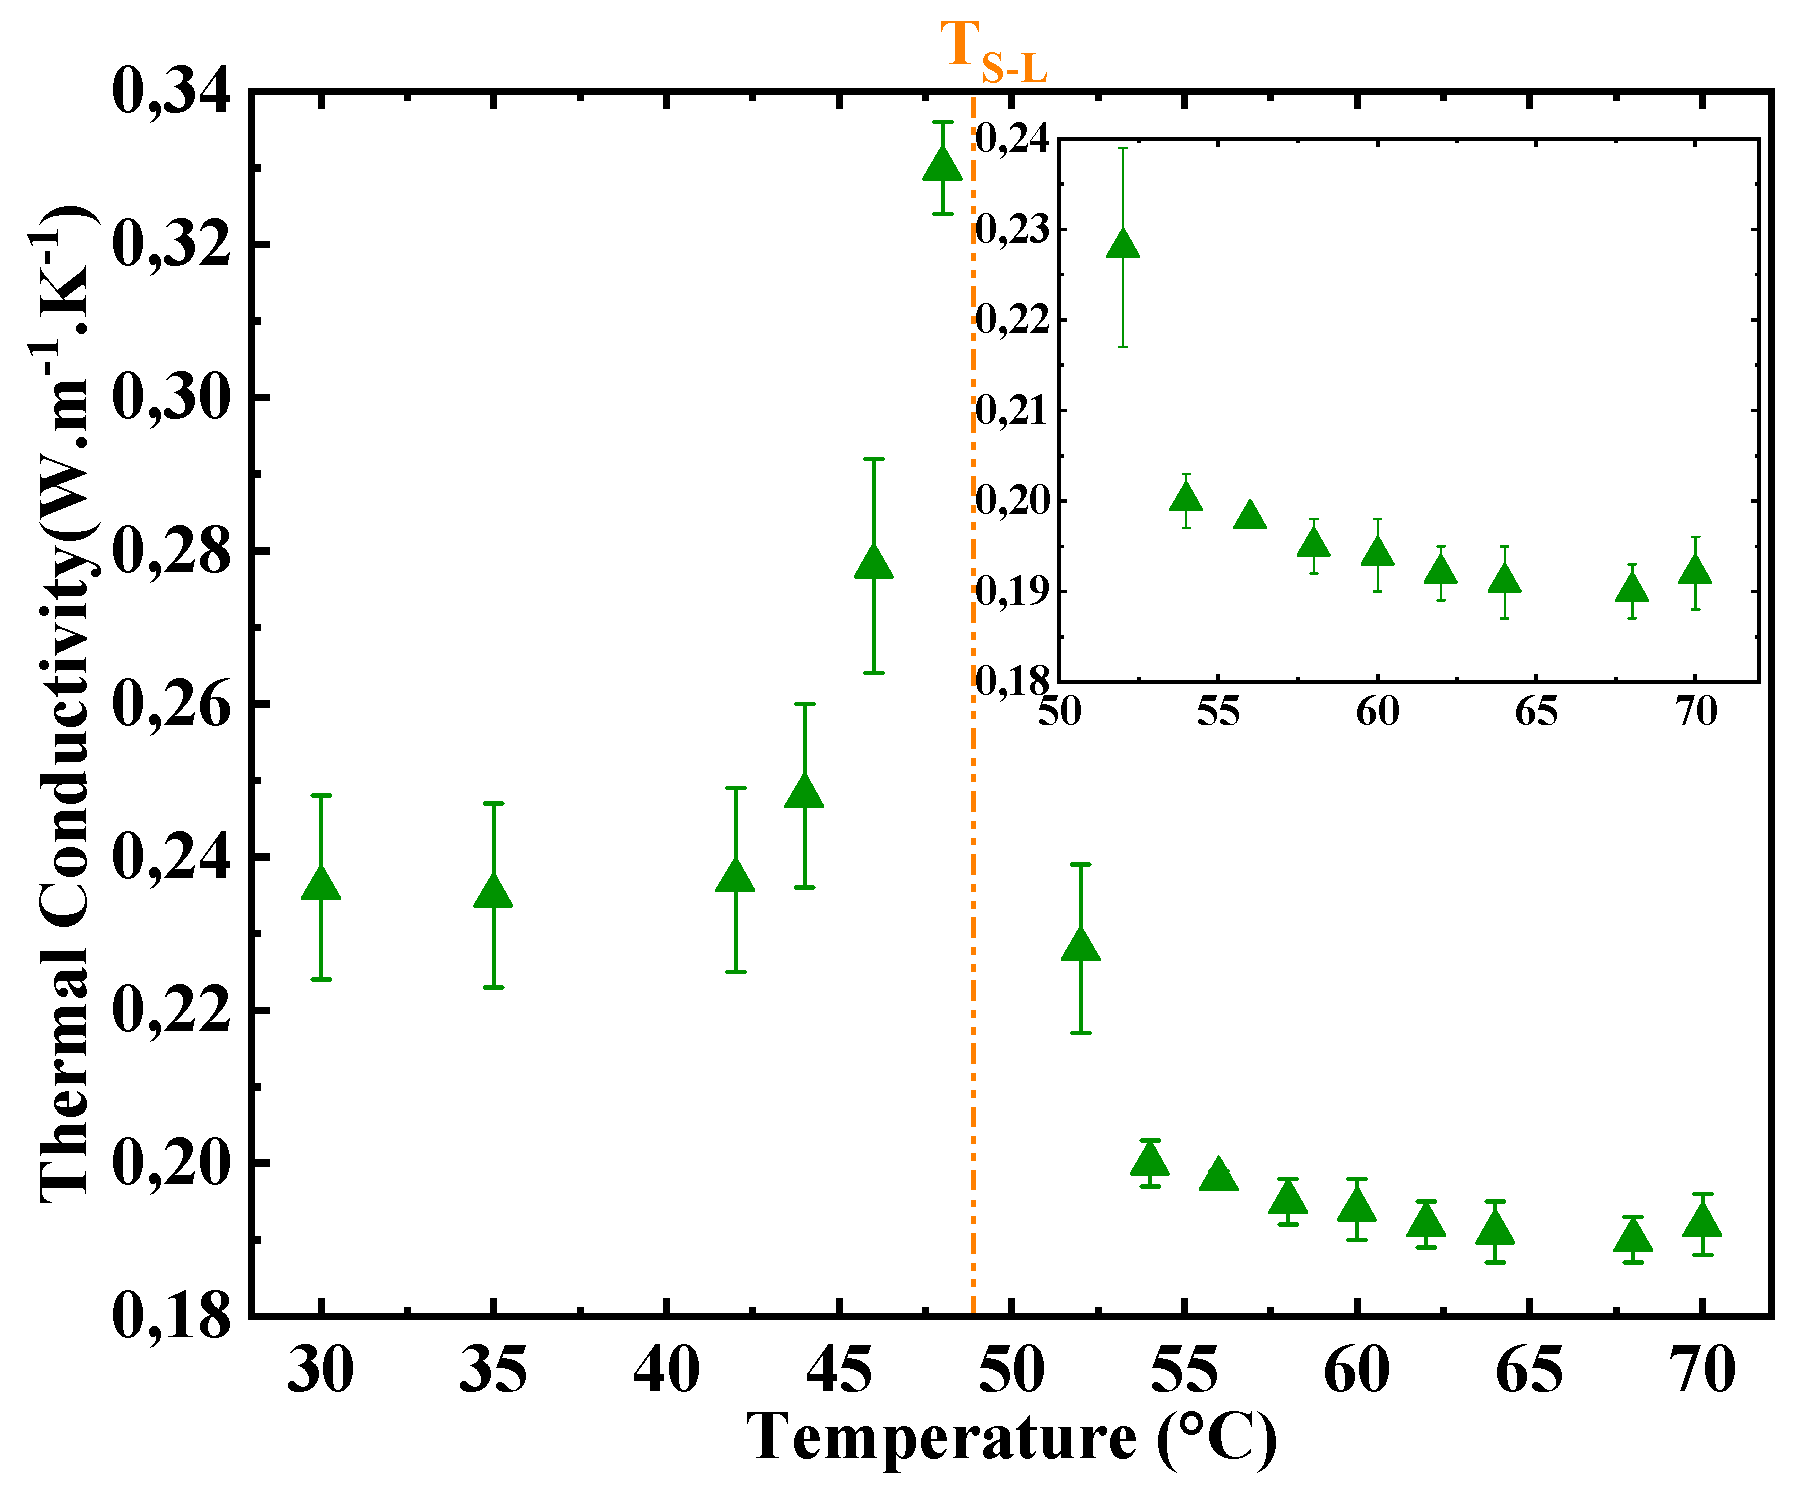
Figure 28, Figure 29, Figure 30 and Figure 31 depict the temperature dependence of the thermal conductivities of paraffins RT21, RT27, RT35HC and RT50, respectively. The results and the uncertainties (between brackets) of the measurements are summarized in Table 13, Table 14, Table 15 and Table 16. It can be noticed that the uncertainties vary from 0.39% to 5.1%, which reflects a good repeatability of the measurements. This finding is in line with the uncertainty of the hot disk device (TPS2500), which is 5%, in accordance with the ISO22007-2 standard [44].
The results displayed in Figure 28, Figure 29, Figure 30 and Figure 31 and in Table 13, Table 14, Table 15 and Table 16 show that the thermal conductivities of the paraffins in the solid phase are higher than those in the liquid phase. A discontinuity of the thermal conductivity expressed as Δλ = λs − λl is observed in the vicinity of the melting temperature. This discontinuity is 0.069 W.m−1.K−1, 0.066 W.m−1.K−1, 0.147 W.m−1.K−1 and 0.102 W.m−1.K−1 for RT21, RT27, RT35HC and RT50, respectively. It is explained by the more ordered structure and the stronger intermolecular forces of the solid PCM compared to that of the liquid PCM which facilitates the heat transfer by conduction in the solid phase.
The examination of the results reveals that the thermal conductivities of paraffins RT27, RT35HC and RT50 in the solid phase increase with increasing temperature. Then, they reach their maximums, which are 0.256 W.m−1.K−1 for RT27, 0.334W.m−1.K−1 for RT35HC and 0.330 W.m−1.K−1 for RT50, in the vicinity of the melting temperatures. This increase has a great advantage for a heat storage system since it enhances the kinetics of sensible heat storage. Concerning paraffin RT21, the thermal conductivity in the solid phase was measured only at T = 17 °C, and it was 0.257 W.m−1.K−1.
However, the results presented in Figure 28, Figure 29, Figure 30 and Figure 31 and Table 13, Table 14, Table 15 and Table 16 reveal that the thermal conductivity of paraffins RT27, RT35HC and RT50 in the liquid phase decreases when the temperature rises. As for the liquid RT21, it can be observed that its thermal conductivity decreases as a function of temperature until 23.8 °C and remains constant afterward.
Table 17 summarizes the average thermal conductivities of the paraffins in the solid and liquid phases. The results show that the average thermal conductivity of RT3HC in the solid phase is 0.324 W.m−1.K−1, which is 24%, 26% and 49% higher than that of RT50, RT21 and RT27, respectively. The observation of the results in the liquid phase reveals that the highest average thermal conductivity is attributed to paraffin RT50 and is 0.198 W.m−1.K−1.
A comparison between the thermal conductivities of the paraffins measured in the present study and those assessed in the literature is depicted in Table 17. The thermal conductivities of the solid paraffins measured in [25,37] are significantly higher than those evaluated in the present work, with deviation varying from 28.5% to 62%. This may be attributed to the technique and the accuracy of the measurements in [25,37]. A good agreement was observed between the thermal conductivities of the liquid paraffins in [36,37] and those measured in the current investigation because the maximum registered discrepancy was 1.01%.
3.4. Thermal Diffusivities
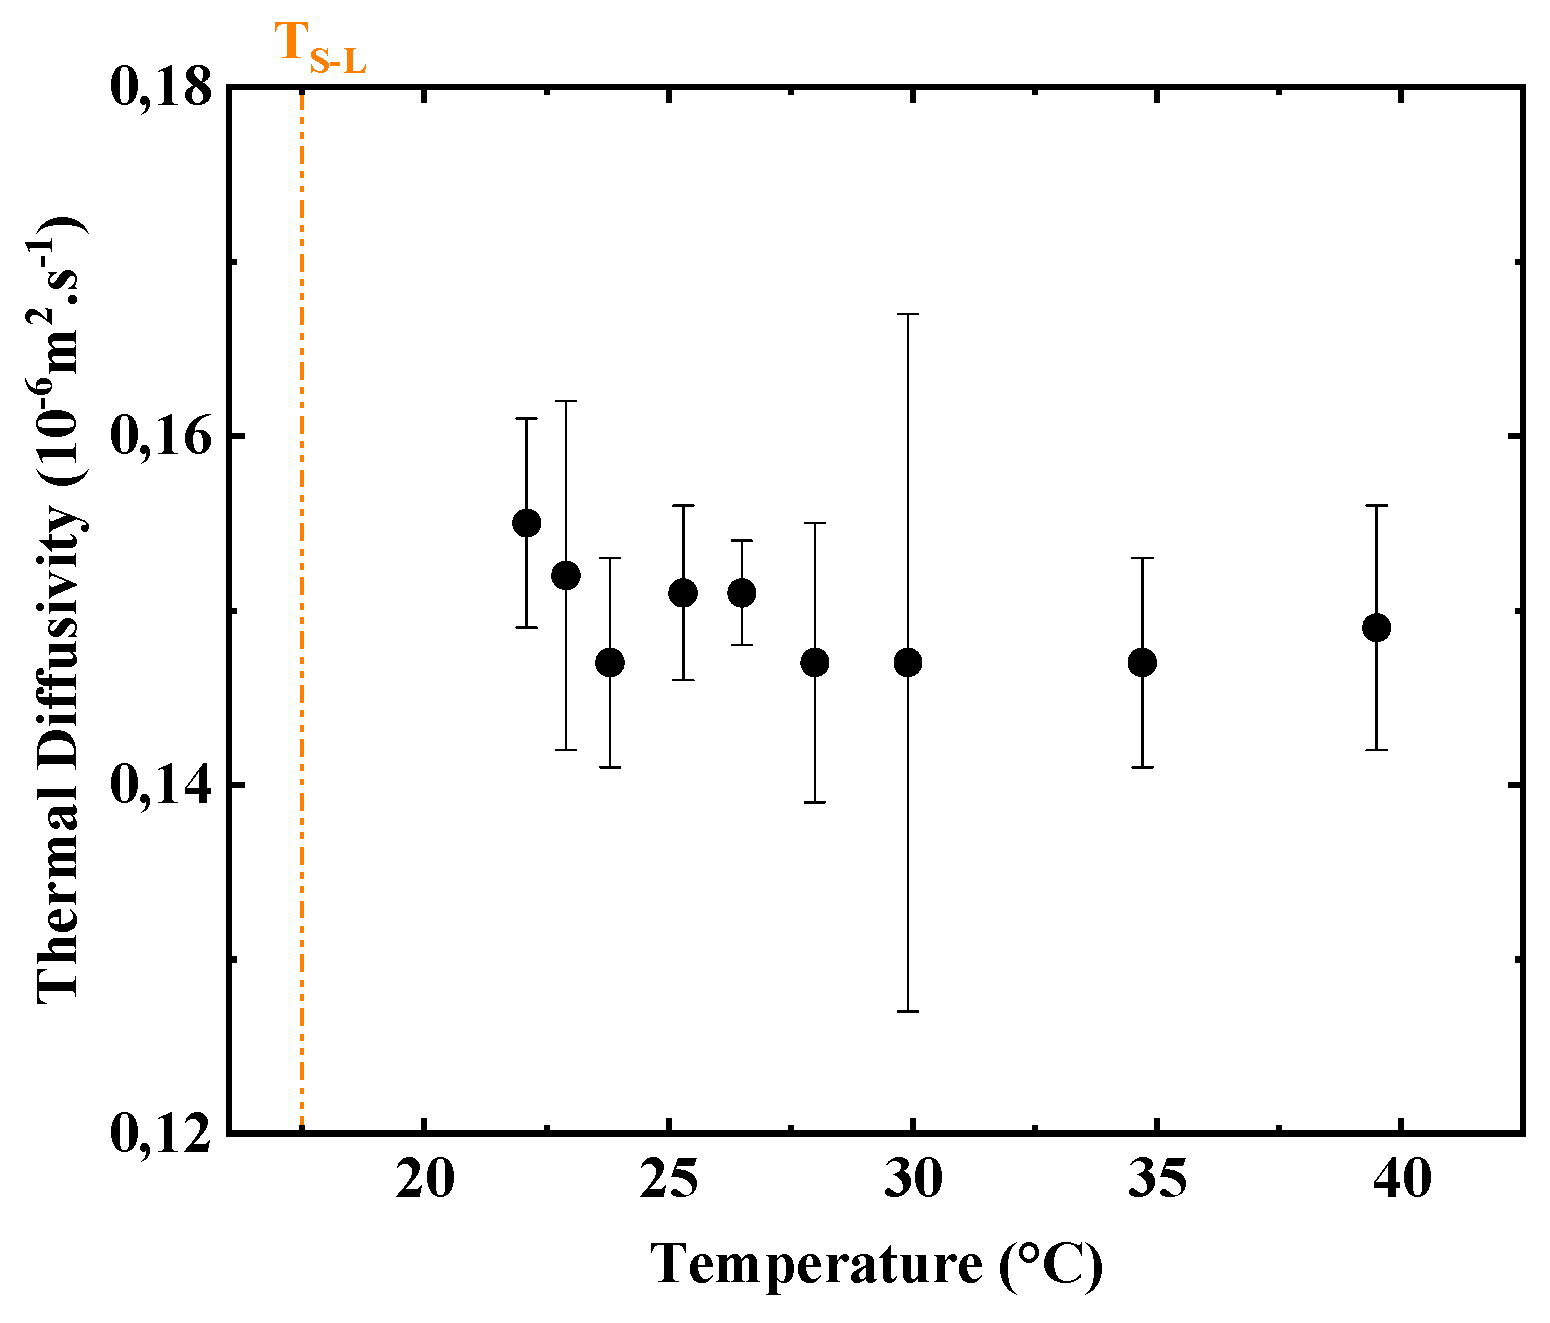
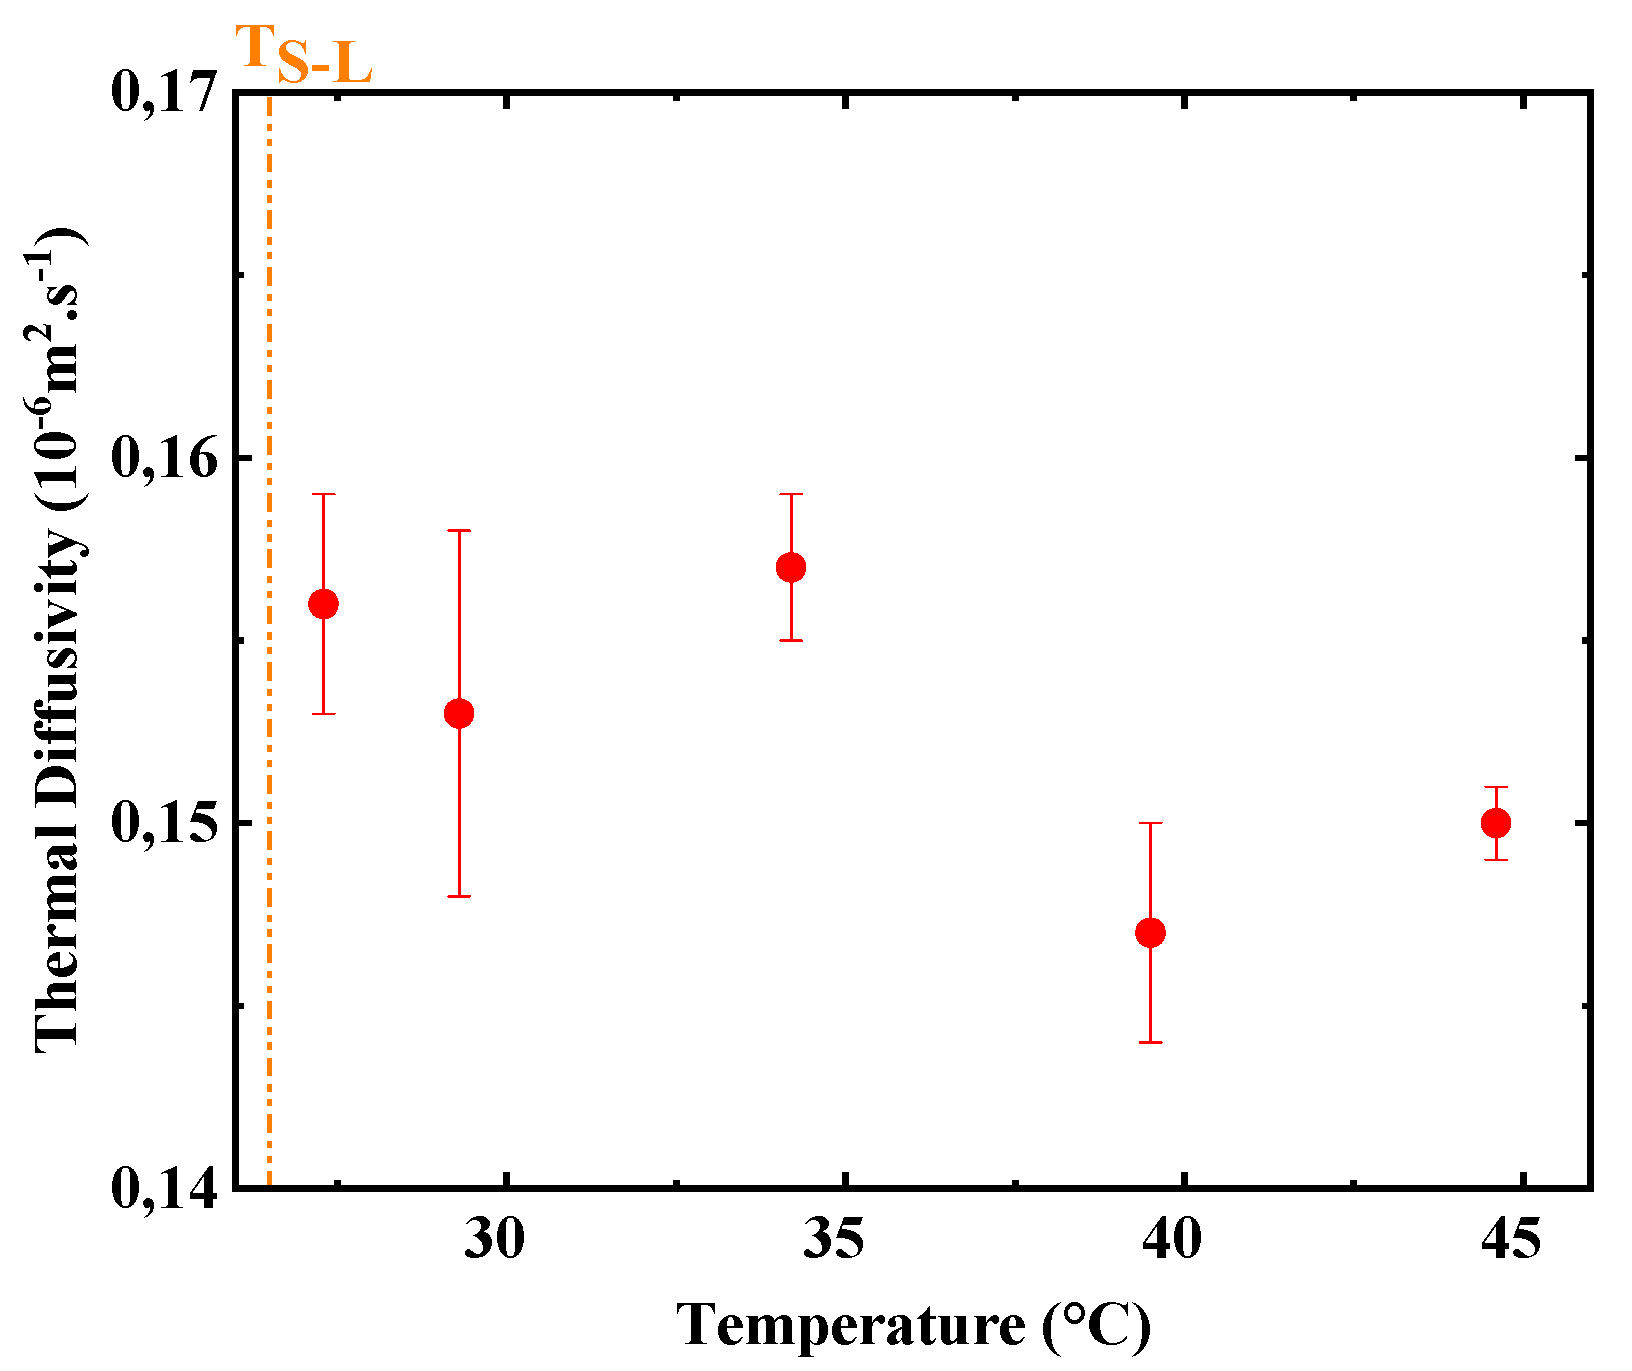
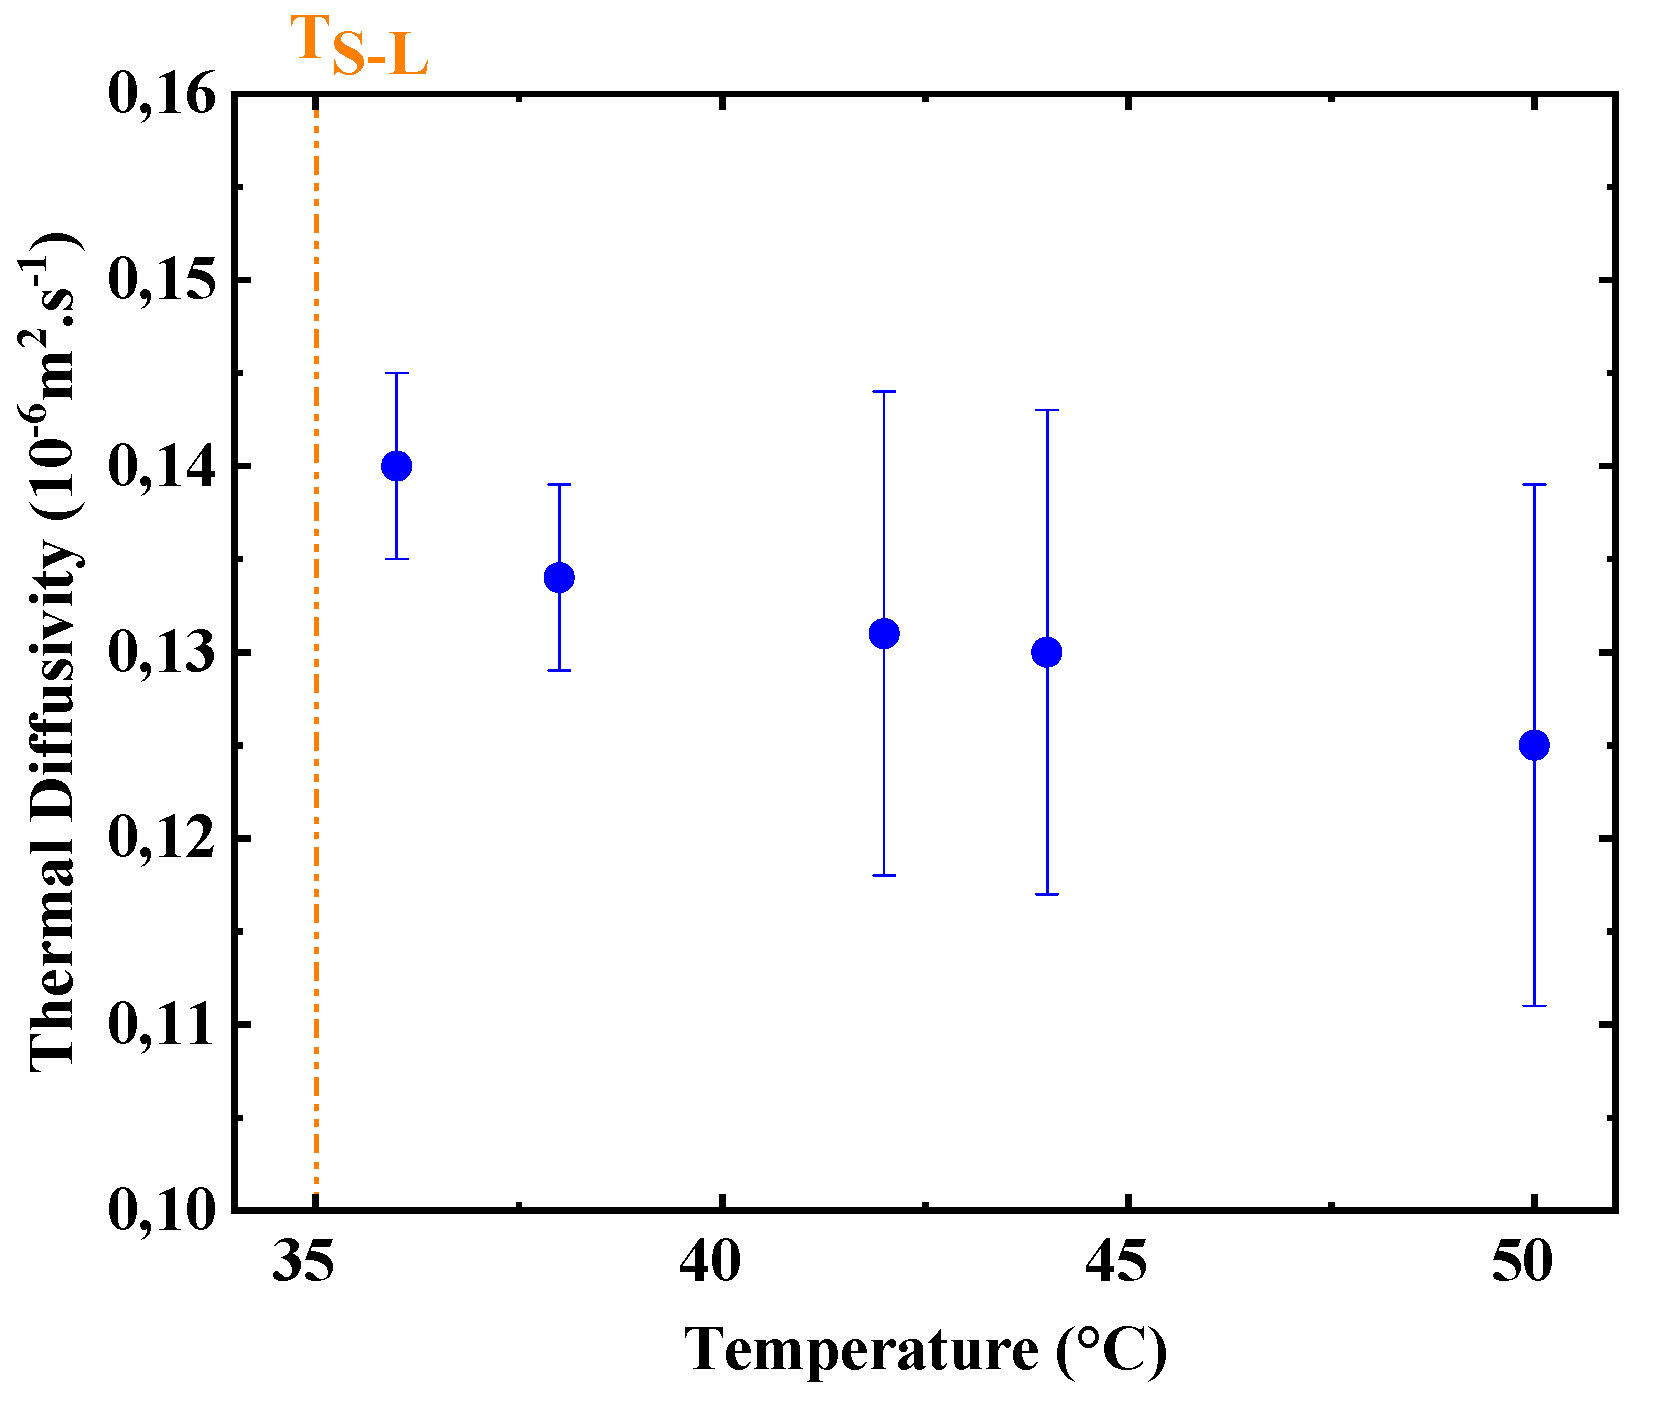
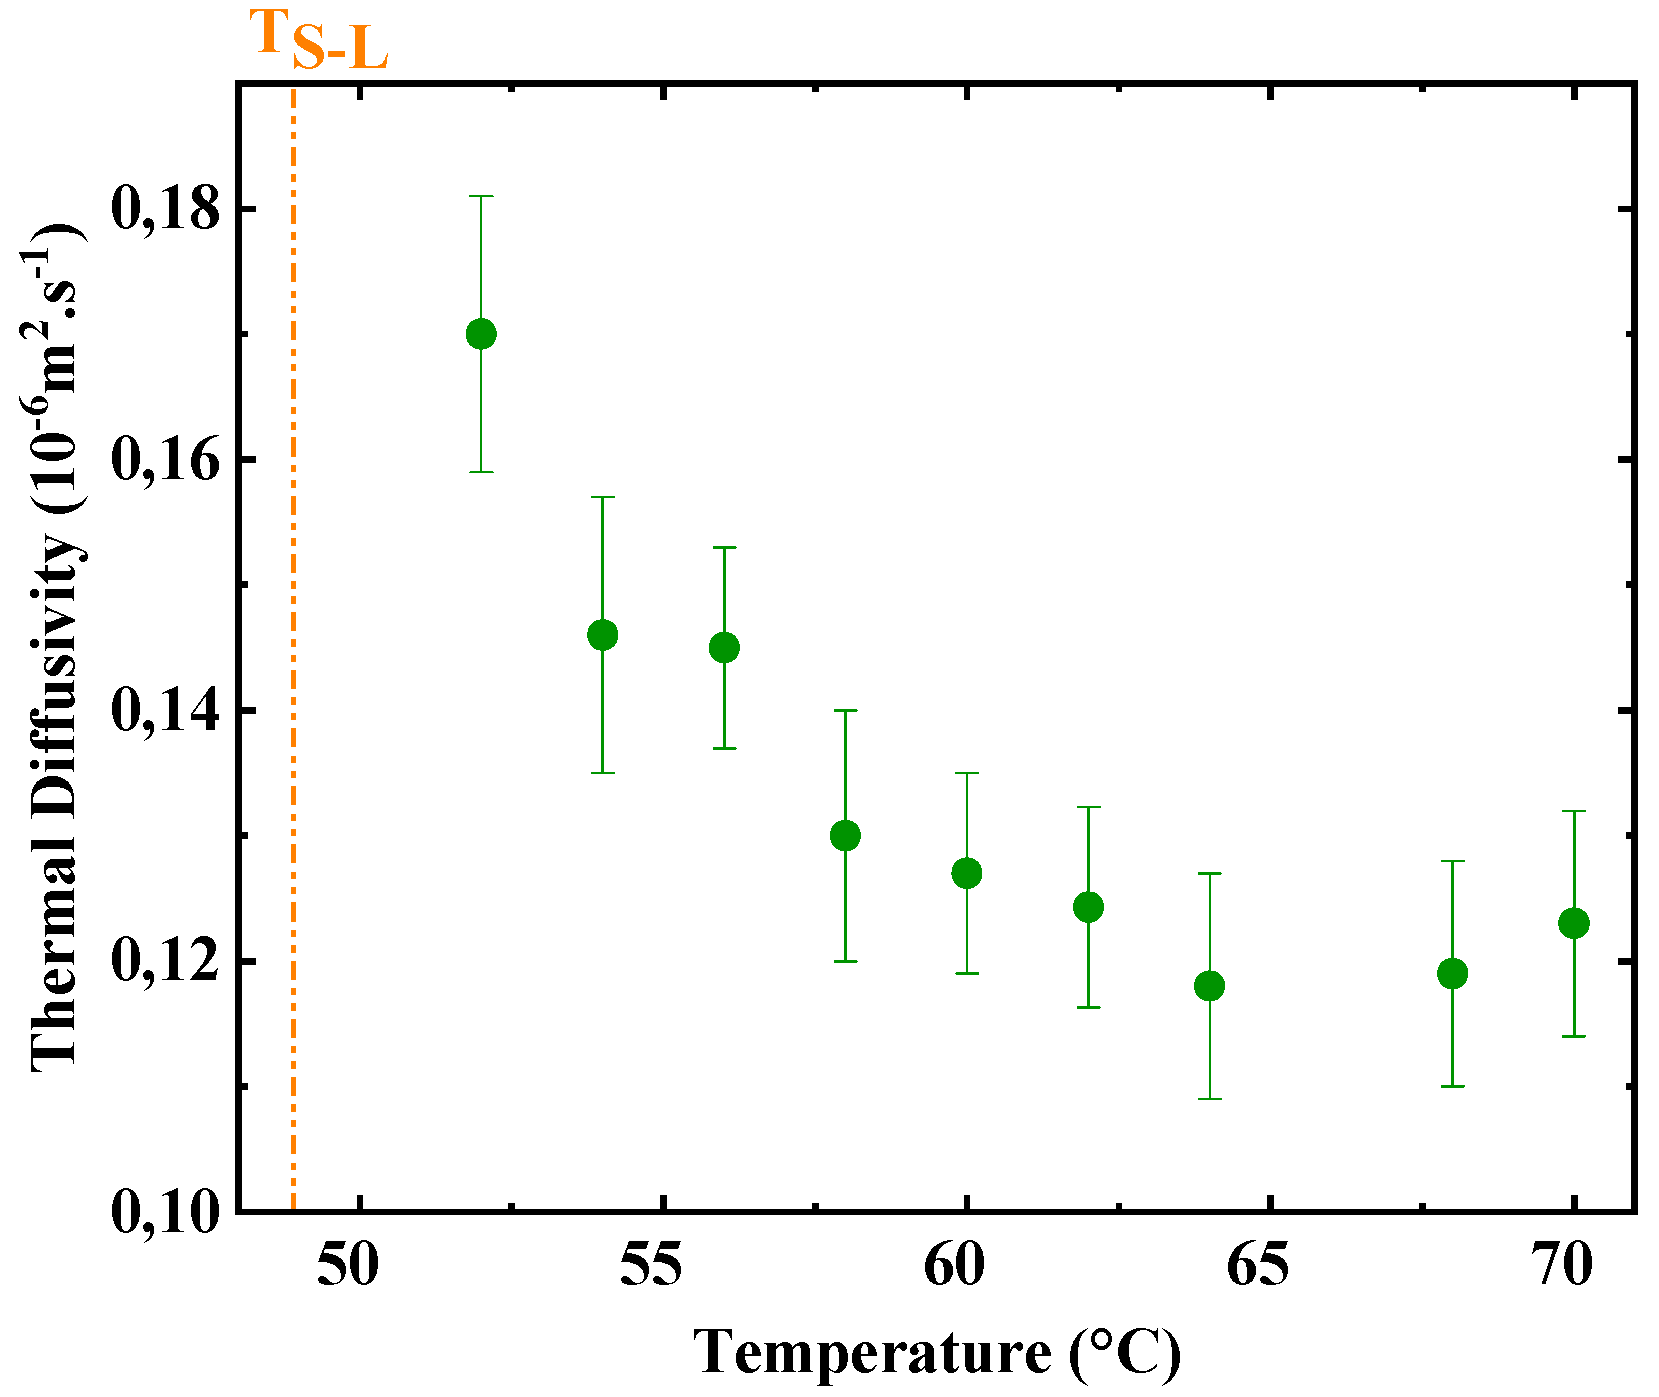
The evolution of the thermal diffusivities of paraffins RT21, RT27, RT35HC and RT50 in the liquid state as a function of temperature is illustrated in Figure 32, Figure 33, Figure 34 and Figure 35 and summarized in Table 18, Table 19, Table 20 and Table 21. The results show that the uncertainties of the measurements vary between 1.9% and 13.6% for RT21, from 0.6% to 3.2% for RT27, from 3.5% to 11.2% for RT35HC and in the range of 5.5% to 7.69 for RT50. This reveals a good agreement with the accuracy of the TPS2500 for the diffusivity measurement, which is 10% (the ISO22007-2 standard [44]).
An examination of the results displayed in Figure 32, Figure 33, Figure 34 and Figure 35 and in Table 18, Table 19, Table 20 and Table 21 reveals that the thermal diffusivities of the paraffins in the liquid phase decrease as the temperature rises. The comparison of the results shows that paraffin RT21 has the highest average thermal diffusivity in the liquid state (0.153 mm2.s−1), while those of paraffins RT27, RT35HC and RT50 are 0.150 mm2.s−1; 0.132 mm2.s−1 and 0.134 mm2.s−1, respectively.
3.5. Thermal Dependence of the Density
Table 22, Table 23, Table 24 and Table 25 summarize the densities of paraffins RT21, RT27, RT35HC and RT50 at different temperatures. It can be observed that the density in the solid phase is higher than that in the liquid phase. Hence, an increase in the volume of the paraffins throughout the solid–liquid phase change, given by Equation (11), occurs. The volume changes of the paraffins are calculated to be 3.9%, 2.2%, 14.8% and 14.5% for RT21, RT27, RT35HC and RT50, respectively.
Although there is no study that determines the densities of paraffins RT21, RT27, RT35HC and RT50 at different temperatures, a comparison between the experimental results of the current investigation and the available data mentioned by the supplier [37] is presented in Table 22, Table 23, Table 24 and Table 25. A good agreement was revealed, with deviation in the range of 2.3% to 5.6%.
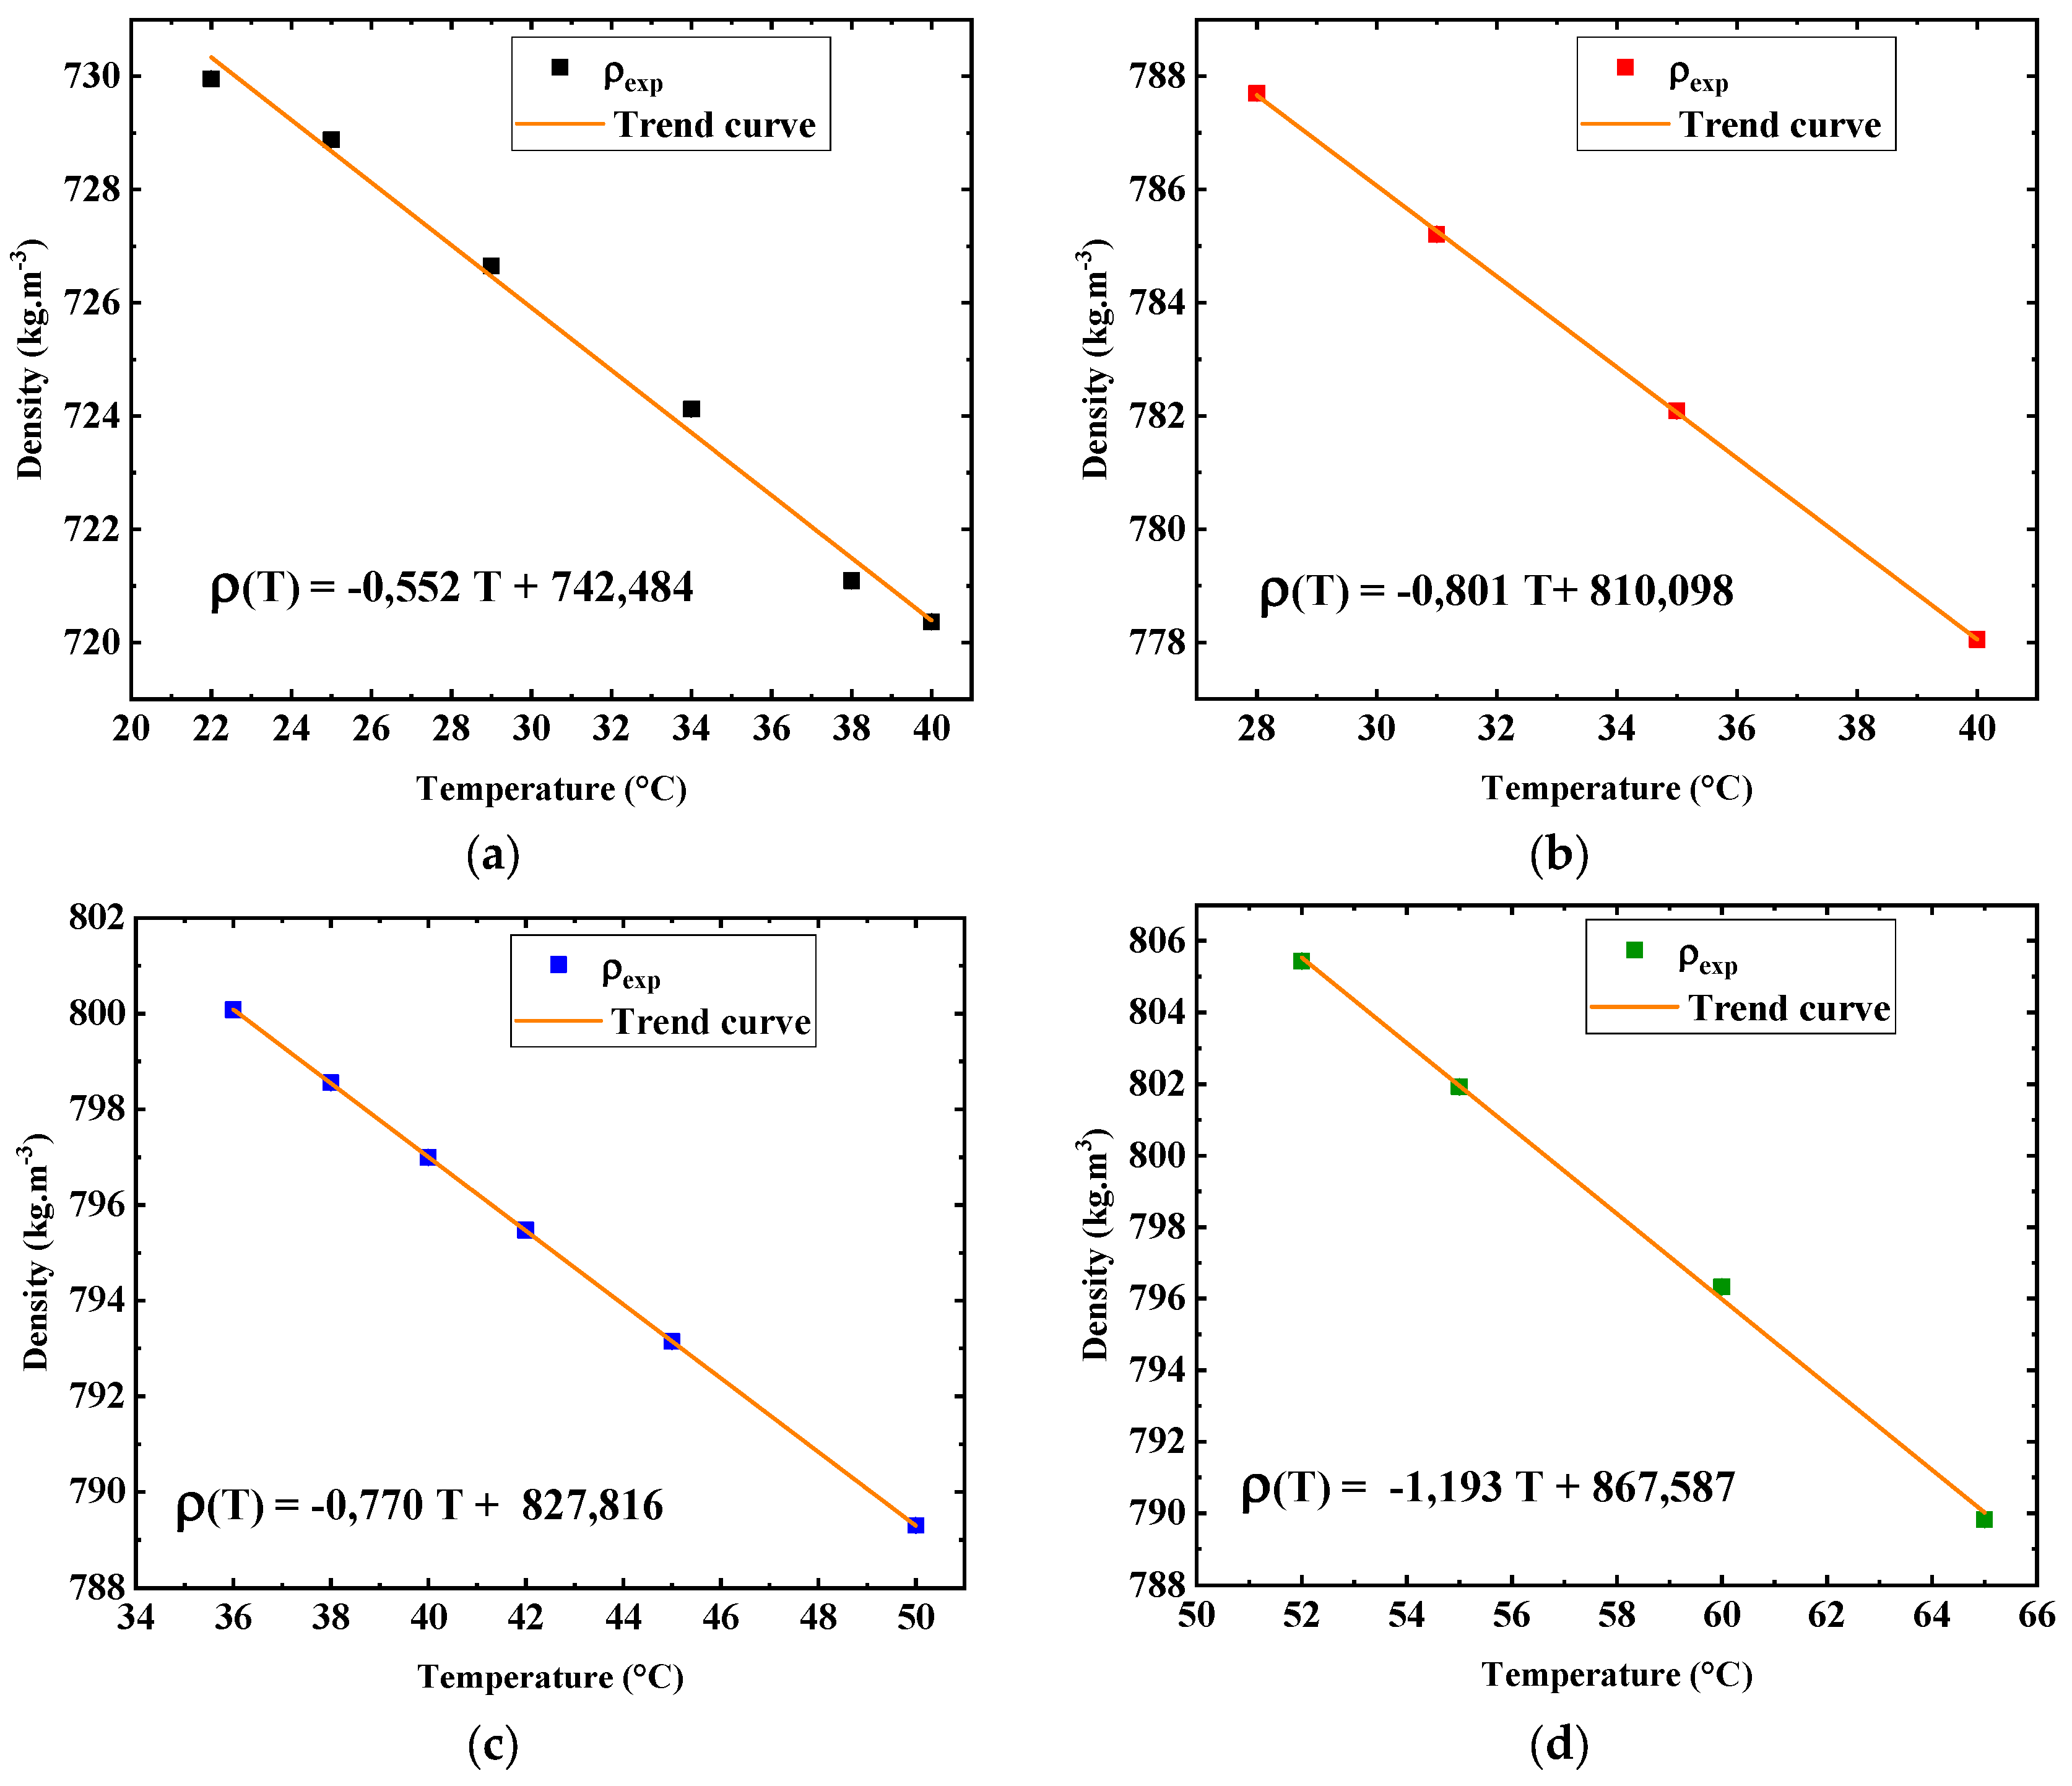
Figure 36 illustrates the evolution of the densities of the paraffins in the liquid state as a function of temperature. The results reveal that the densities of the liquid paraffins decrease linearly as the temperature rises. The fitting coefficients of the experimental densities to the linear equation (Equation (12)) were determined and are displayed in Figure 36.
The thermal expansion coefficients of the liquid paraffins (Equation (13)) are assessed from the linear fitting coefficients. The densities of paraffins RT21, RT27, RT35HC and RT50 at 22 °C, 28 °C, 36 °C and 52 °C, respectively, are taken as reference values of the density ρ0,l. Table 26 summarizes the results of the thermal expansion coefficients of the paraffins. The highest thermal expansion coefficient is attributed to RT50 (1.4 × 10⁻³ K−1), whereas those of RT21, RT27 and RT35HC are 0.7 × 10⁻³ K−1, 1 × 10⁻³ K−1 and 0.9 × 10⁻³ K−1.
3.6. Exploitation of the Experimental Results
The thermal diffusivities of the liquid paraffins (RT21, RT27, RT35HC, RT50) are calculated based on the experimental results of the thermal conductivity, the density and the specific heat (Equation (14)). They are compared in Table 27, Table 28, Table 29 and Table 30 to the experimental thermal diffusivities measured by the hot disk method.
The results show that the calculated thermal diffusivities of the liquid paraffins are 10.96%, 21.7%, 16.4% and 30.3% lower than the experimental thermal diffusivities for RT21, RT27, RT35HC and RT50, respectively. The obtained discrepancies are attributed to the higher uncertainties of the calculated thermal diffusivities compared to those of the measured thermal diffusivities. In fact, it was found that the uncertainties of the calculated results reach 17.6% for RT21, 6.4% for RT27, 16.2% for RT35HC and 27.3% for RT50. These uncertainties are due to the propagation of the uncertainties of the experimental thermal conductivity, density and specific heat. Hence, the experimental thermal diffusivities are more accurate.
4. Conclusions
This study presents an experimental investigation of the thermophysical characterization of four commercial paraffins at different temperatures. It serves as a database for future numerical simulations of the solid–liquid phase change in LHSS. The temperatures and the latent heats of the phase changes were assessed using DSC measurements. The results showed that the latent heats of melting of the paraffins are between 5% and 12% lower than those indicated by Rubitherm. It was revealed also that the melting temperatures and the latent heats decrease with the heating rate. Furthermore, the DSC study under ten thermal cycles showed good reliability of the paraffins. Moreover, the specific heats were measured at different temperatures. The results obtained yielded polynomial equations of thermal dependence of the specific heats. They show that the specific heat value provided by the supplier for the solid and liquid paraffins (2 J.g−1.K−1) is not an accurate piece of information. They highlight that the specific heats assessed in this study are reliable information for the numerical simulations. Thermogravimetric analysis revealed that the paraffins are thermally stable for the low- and medium-temperature LHSS (<100 °C). Thermal conductivities, measured by the hot disk method, present a discontinuity in the vicinity of the melting temperatures. The results showed that the thermal conductivity increases with temperature for the solid paraffins, while it decreases as the temperature rises for the liquid paraffins. The highest thermal conductivity in the solid phase was observed for RT35HC (0.324 W.m−1.K−1). The maximum thermal conductivity in the liquid phase was found for RT50 (0.198 W.m−1.K−1). In addition, it was found that the thermal diffusivities of the paraffins in the liquid state diminish with temperature.
The densities of the paraffins as a function of temperature, including the solid and liquid phases, were measured. The change in volume that occurred throughout the solid–liquid phase change was evaluated. It varies between 3.9% and 14.5%. The laws of linear thermal dependence of the densities of the liquid paraffins and the coefficient of thermal expansion were determined. This information will be useful for numerical purposes given its scarcity in the literature.
The calculation of the thermal diffusivities of the liquid paraffins, from the experimental results, showed that the experimental diffusivities are more accurate than those calculated.
The findings of this investigation respond to a potential need for scientific researchers to know the thermophysical properties of paraffins at different temperatures for the numerical simulations of the thermal behavior of PCMs in LHSS.
Author Contributions
Conceptualization: M.K. (Manel Kraiem) and M.K. (Mustapha Karkri); methodology: M.K. (Manel Kraiem), M.K. (Mustapha Karkri), M.F. and P.S.; investigation: M.K. (Manel Kraiem); data curation: M.K. (Manel Kraiem); writing—original draft: M.K. (Manel Kraiem); writing—review and editing: M.K. (Manel Kraiem); supervision: M.K. (Mustapha Karkri). All authors have read and agreed to the published version of the manuscript.
Funding
This research received no external funding.
Data Availability Statement
Not applicable. All data of this study are presented in the article.
Conflicts of Interest
The authors declare no conflict of interest.
Nomenclature
| a | Thermal diffusivity (m2.s−1) |
| Cp | Specific heat (kJ.kg−1.K−1) |
| DSC | Differential scanning calorimetry |
| Heat flow (W) | |
| f | Fraction |
| m | Mass (kg) |
| n.a. | Not available |
| PCM | Phase change material |
| r | Radius of the sensor (mm) |
| ref | Reference |
| Sapphire | Sapphire sample |
| T | Temperature (°C) |
| TGA | Thermogravimetric Analysis |
| V | Volume (m3) |
| Greek letters | |
| β | Thermal expansion coefficient (K−1) |
| Δ | Difference |
| ΔH | Latent heat of the phase transition (kJ.kg−1) |
| λ | Thermal conductivity (W.m−1.K−1) |
| ρ | Density (kg.m−3) |
| Subscripts | |
| Exp | Experimental |
| L-S | Liquid–solid phase change |
| L | Liquid |
| S-L | Solid–liquid phase change |
| S-S | Solid–solid phase change |
| S | Solid |
| 0 | Baseline |
Appendix A. The DSC thermograms of RT27 and RT50
- 1.
- Analysis of the DSC thermograms of RT27
Figure A1 and Figure A2 present the analysis of the DSC thermograms of paraffin RT27 at the heating–cooling rates of 10 °C.min−1 and 0.2 °C.min−1. This analysis was conducted by means of Pyris software 13.3.2 to assess the heat storage properties of this paraffin.
Figure A1.
Analysis of thermograms of RT27 during (a) heating and (b) cooling at 10 °C.min−1.

Figure A2.
Analysis of thermograms of RT27 during (a) heating and (b) cooling at 0.2 °C.min−1.

- 2.
- Analysis of the DSC thermograms of RT50
Figure A3 and Figure A4 illustrate the analysis of the DSC thermograms of paraffin RT50 at the heating–cooling rates of 10 °C.min−1 and 0.2 °C.min−1.
Figure A3.
Analysis of thermograms of RT50 during (a) heating and (b) cooling at 10 °C.min−1.

Figure A4.
Analysis of thermograms of RT50 during (a) heating and (b) cooling at 0.2 °C.min−1.

References
- BP. BP Energy Outlook: 2022 Edition; The British Petroleum Company BP: London, UK, 2022. [Google Scholar]
- BP. Statistical Review of World Energy, 2020 69th Edition; The British Petroleum company BP: London, UK, 2020. [Google Scholar]
- US Energy Information Administration. International Energy Outlook 2019 with Projections to 2050; US Energy Information Administration: Washington, DC, USA, 2019.
- Nazir, H.; Batool, M.; Osorio, F.J.B.; Isaza-Ruiz, M.; Xu, X.; Vignarooban, K.; Phelan, P.; Inamuddin; Kannan, A.M. Recent de-velopments in phase change materials for energy storage applications: A review. Int. J. Heat Mass Transf. 2019, 129, 491–523. [Google Scholar] [CrossRef]
- Wang, X.; Li, W.; Luo, Z.; Wang, K.; Shah, S.P. A critical review on phase change materials (PCM) for sustainable and energy efficient building: Design, characteristic, performance and application. Energy Build. 2022, 260, 111923. [Google Scholar] [CrossRef]
- Wang, Q.; Wu, C.; Wang, X.; Sun, S.; Cui, D.; Pan, S.; Sheng, H. A review of eutectic salts as phase change energy storage materials in the context of concentrated solar power. Int. J. Heat Mass Transf. 2023, 205, 123904. [Google Scholar] [CrossRef]
- Faraj, K.; Khaled, M.; Faraj, J.; Hachem, F.; Castelain, C. Phase change material thermal energy storage systems for cooling applications in buildings: A review. Renew. Sustain. Energy Rev. 2020, 119, 109579. [Google Scholar] [CrossRef]
- Pielichowska, K. Phase change materials for thermal energy storage. Prog. Mater. Sci. 2014, 65, 67–123. [Google Scholar] [CrossRef]
- Gulfam, R.; Zhang, P.; Meng, Z. Advanced thermal systems driven by paraffin-based phase change materials—A review. Appl. Energy 2019, 238, 582–611. [Google Scholar] [CrossRef]
- Parhizi, M.; Jain, A. Analytical modeling and optimization of phase change thermal management of a Li-ion battery pack. Appl. Therm. Eng. 2019, 148, 229–237. [Google Scholar] [CrossRef]
- Wang, Y.; Wang, Z.; Min, H.; Li, H.; Li, Q. Performance investigation of a passive battery thermal management system applied with phase change material. J. Energy Storage 2021, 35, 102279. [Google Scholar] [CrossRef]
- El Idi, M.M.; Karkri, M.; Kraiem, M. Preparation and effective thermal conductivity of a Paraffin/Metal Foam composite. J. Energy Storage 2021, 33, 102077. [Google Scholar] [CrossRef]
- El Idi, M.M.; Karkri, M.; Tankari, M.A.; Vincent, S. Hybrid cooling based battery thermal management using composite phase change materials and forced convection. J. Energy Storage 2021, 41, 102946. [Google Scholar] [CrossRef]
- Hua, W.; Zhang, L.; Zhang, X. Research on passive cooling of electronic chips based on PCM: A review. J. Mol. Liq. 2021, 340, 117183. [Google Scholar] [CrossRef]
- Alva, G.; Liu, L.; Huang, X.; Fang, G. Thermal energy storage materials and systems for solar energy applications. Renew. Sustain. Energy Rev. 2017, 68, 693–706. [Google Scholar] [CrossRef]
- Himran, S.; Suwono, A.; Mansoori, G.A. Characterization of Alkanes and Paraffin Waxes for Application as Phase Change Energy Storage Medium. Energy Sources 1994, 16, 117–128. [Google Scholar] [CrossRef]
- Jouhara, H.; Żabnieńska-Góra, A.; Khordehgah, N.; Ahmad, D.; Lipinski, T. Latent thermal energy storage technologies and applications: A review. Int. J. Thermofluids 2020, 5–6, 100039. [Google Scholar] [CrossRef]
- Ibrahim, S.I.; Ali, A.H.; Hafidh, S.A.; Chaichan, M.T.; Kazem, H.A.; Ali, J.M.; Isahak, W.N.R.; Alamiery, A. Stability and thermal conductivity of different nano-composite material prepared for thermal energy storage applications. S. Afr. J. Chem. Eng. 2022, 39, 72–89. [Google Scholar] [CrossRef]
- Wilhelm, E.; Richter, C.; Rapp, B. Phase change materials in microactuators: Basics, applications and perspectives. Sens. Actuators A Phys. 2018, 271, 303–347. [Google Scholar] [CrossRef]
- Trigui, A.; Karkri, M.; Krupa, I. Thermal conductivity and latent heat thermal energy storage properties of LDPE/wax as a shape-stabilized composite phase change material. Energy Convers. Manag. 2014, 77, 586–596. [Google Scholar] [CrossRef]
- Hosseini, M.; Rahimi, M.; Bahrampoury, R. Experimental and computational evolution of a shell and tube heat exchanger as a PCM thermal storage system. Int. Commun. Heat Mass Transf. 2014, 50, 128–136. [Google Scholar] [CrossRef]
- Al-Shannaq, R.; Kurdi, J.; Al-Muhtaseb, S.; Dickinson, M.; Farid, M. Supercooling elimination of phase change materials (PCMs) microcapsules. Energy 2015, 87, 654–662. [Google Scholar] [CrossRef]
- Martinelli, M.; Bentivoglio, F.; Caron-Soupart, A.; Couturier, R.; Fourmigue, J.-F.; Marty, P. Experimental study of a phase change thermal energy storage with copper foam. Appl. Therm. Eng. 2016, 101, 247–261. [Google Scholar] [CrossRef]
- Agarwal, A.; Sarviya, R. Characterization of Commercial Grade Paraffin wax as Latent Heat Storage material for Solar dryers. Mater. Today Proc. 2017, 4, 779–789. [Google Scholar] [CrossRef]
- Mekaddem, N.; Ali, B.; Fois, M.; Hannachi, A. Paraffin/Expanded Perlite/Plaster as Thermla Energy Storage Composite. Energy Procedia 2019, 157, 1118–1129. [Google Scholar] [CrossRef]
- Chriaa, I.; Trigui, A.; Karkri, M.; Jedidi, I.; Abdelmouleh, M.; Boudaya, C. Thermal properties of shape-stabilized phase change materials based on Low Density Polyethylene, Hexadecane and SEBS for thermal energy storage. Appl. Therm. Eng. 2020, 171, 115072. [Google Scholar] [CrossRef]
- B, K.; Pandey, A.; Shahabuddin, S.; George, M.; Sharma, K.; Samykano, M.; Tyagi, V.; Saidur, R. Synthesis and characterization of conducting Polyaniline@cobalt-Paraffin wax nanocomposite as nano-phase change material: Enhanced thermophysical properties. Renew. Energy 2021, 173, 1057–1069. [Google Scholar] [CrossRef]
- Lu, B.; Zhang, Y.; Sun, D.; Jing, X. Experimental investigation on thermal properties of paraffin/expanded graphite composite material for low temperature thermal energy storage. Renew. Energy 2021, 178, 669–678. [Google Scholar] [CrossRef]
- Cao, J.; Ling, Z.; Lin, X.; Wu, Y.; Fang, X.; Zhang, Z. Flexible composite phase change material with enhanced thermophysical, dielectric, and mechanical properties for battery thermal management. J. Energy Storage 2022, 52, 10479. [Google Scholar] [CrossRef]
- Leong, K.Y.; Hasbi, S.; Ahmad, K.K.; Jali, N.M.; Ong, H.C.; Din, M.M. Thermal properties evaluation of paraffin wax enhanced with carbon nanotubes as latent heat thermal energy storage. J. Energy Storage 2022, 52, 105027. [Google Scholar] [CrossRef]
- Hayat, M.A.; Yang, Y.; Li, L.; Bevilacqua, M.; Chen, Y. Preparation and thermophysical characterisation analysis of potential nano-phase transition materials for thermal energy storage applications. J. Mol. Liq. 2023, 376, 121464. [Google Scholar] [CrossRef]
- Soares, N.; Matias, T.; Durães, L.; Simões, P.; Costa, J. Thermophysical characterization of paraffin-based PCMs for low temperature thermal energy storage applications for buildings. Energy 2023, 269, 126745. [Google Scholar] [CrossRef]
- Ukrainczyk, N.; Kurajica, S.; Šipušiæ, J. Thermophysical Comparison of FiveCommercial Paraffin Waxes as Latent Heat Storage Materials. Chem. Biochem. Eng. Q. 2010, 24, 129–137. [Google Scholar]
- Velez, C.; Khayet, M.; de Zarate, J.M.O. Temperature-dependent thermal properties of solid/liquid phase change even-numbered n-alkanes: N-Hexadecane, n-octadecane and n-eicosane. Appl. Energy 2015, 143, 383–394. [Google Scholar] [CrossRef]
- Vélez, C.; de Zárate, J.M.O.; Khayet, M. Thermal properties of n-pentadecane, n-heptadecane and n-nonadecane in the solid/liquid phase change region. Int. J. Therm. Sci. 2015, 94, 139–146. [Google Scholar] [CrossRef]
- Shafee, S.; Gnanasekaran, K.; Solomon, G.R.; Balaji, R. Preparation and analysis of novel paraffin based stable nano fluid dispersed with carbon nano tubes as effective phase change material for free cooling applications. Mater. Today 2020, 33, 4526–4532. [Google Scholar] [CrossRef]
- RUBITHERM. Gmbh, Products, Heat Storage Materials, PCM RT-line. Available online: www.rubitherm.com (accessed on 15 August 2022).
- Mehling, H.; Cabeza, L.F. Heat and Cold Storage with PCM—An up to date Introduction into Basics and Applications; Springer: Berlin/Heidelberg, Germany, 2008. [Google Scholar]
- Klancnik, G.; Medved, J.; Mrvar, P. Differential thermal analysis (DTA) and differential scanning calorimetry (DSC) as a method of material investigation. RMZ Mater. Geoenviron. 2010, 57, 127–142. [Google Scholar]
- Technical Specifications of the TGA 4000 Thermogravimetric Analyzer. Available online: https://resources.perkinelmer.com/corporate/cmsresources/images/46-74807spc_tga4000.pdf (accessed on 20 August 2022).
- Gustafsson, S.E. Transient plane source techniques for thermal conductivity and thermal diffusivity measurements of solid materials. Rev.Sci. Instrum. 1991, 62, 797–804. [Google Scholar] [CrossRef]
- Bohac, V.; Gustavsson, M.K.; Kubicar, L.; Gustafsson, S.E. Parameter estimations for measurements of thermal transport properties with the hot disk thermal constants analyzer. Rev. Sci. Instrum. 2000, 71, 2452–2455. [Google Scholar] [CrossRef] [Green Version]
- He, Y. Rapid thermal conductivity measurement with a hot disk sensor Part 1. Theoretical considerations. Thermochim. Acta 2005, 436, 122–129. [Google Scholar] [CrossRef]
- ISO 22007-2:2008; Plastics—Determination of Thermal Conductivity and Thermal Diffusivity—Part 2: Transient Plane Heat Source (Hot Disc) Method. ISO: Geneva, Switzerland, 2008.
- Warzoha, R.J.; Fleischer, A.S. Determining the thermal conductivity of liquids using the transient hot disk method. Part I: Establishing transient thermal-fluid constraints. Int. J. Heat Mass Transf. 2014, 71, 779–789. [Google Scholar] [CrossRef]
- Warzoha, R.J.; Fleischer, A.S. Determining the thermal conductivity of liquids using the transient hot disk method. Part II: Establishing an accurate and repeatable experimental methodology. Int. J. Heat Mass Transf. 2014, 71, 790–807. [Google Scholar] [CrossRef]
- Nagai, H.; Rossignol, F.; Nakata, Y.; Tsurue, T.; Suzuki, M.; Okutani, T. Thermal conductivity measurement of liquid materials by a hot-disk method in short-duration microgravity environments. Mater. Sci. Eng. A 2000, 276, 117–123. [Google Scholar] [CrossRef]
- Available online: https://www.thermexcel.com/french/tables/eau_atm.htm (accessed on 1 October 2018).
- Castellon, C.; Gunther, E.; Mehling, H.; Hiebler, S.; Cabeza, L.F. Determination of the enthalpy of PCM as a function of tem-perature using a heat-flux DSC-A study of different measurement procedures and their accuracy. Int. J. Energy Res. 2008, 32, 1258–1265. [Google Scholar] [CrossRef]
- Dumas, J.-P.; Gibout, S.; Zalewski, L.; Johannes, K.; Franquet, E.; Lassue, S.; Bédécarrats, J.-P.; Tittelein, P.; Kuznik, F. Interpretation of calorimetry experiments to characterise phase change materials. Int. J. Therm. Sci. 2014, 78, 48–55. [Google Scholar] [CrossRef]
- Günther, E.; Hiebler, S.; Mehling, H.; Redlich, R. Enthalpy of Phase Change Materials as a Function of Temperature: Required Accuracy and Suitable Measurement Methods. Int. J. Thermophys. 2009, 30, 1257–1269. [Google Scholar] [CrossRef]
- Li, L.; Yu, H.; Wang, X.; Zheng, S. Thermal analysis of melting and freezing processes of phase change materials (PCMs) based on dynamic DSC test. Energy Build. 2016, 130, 388–396. [Google Scholar] [CrossRef]
- Sari-Bey, S. Mise au Point de Nouveaux Matériaux à Changement de Phase pour Optimiser les Transferts Énergétiques. Ph.D. Thesis, Université Paris-Est Créteil Val de Marne, Paris, France, 2014. [Google Scholar]
- ISO 11357-4:2005; Plastics—Differential Scanning Calorimetry (DSC), Part 4: Determination of Specific Heat Capacity. ISO: Geneva, Switzerland, 2005.
Figure 1.
Types of solid–liquid PCMs.

Figure 2.
The aluminum mold. (a) The mold; (b) Part 1; (c) Part 2.

Figure 3.
(a,b) liquid paraffin in the mold; (c) cooling; (d) solidification; (e,f) the sample; Experimental procedure of the preparation of the solid paraffin sample.
Figure 3.
(a,b) liquid paraffin in the mold; (c) cooling; (d) solidification; (e,f) the sample; Experimental procedure of the preparation of the solid paraffin sample.

Figure 4.
Principle of the hot disk method.

Figure 5.
Hot disk measurement in the solid phase: (a) experimental setup; (b) position of the sensor.
Figure 5.
Hot disk measurement in the solid phase: (a) experimental setup; (b) position of the sensor.

Figure 6.
Experimental procedure of the characterization of the liquid paraffin by the hot disk method.
Figure 6.
Experimental procedure of the characterization of the liquid paraffin by the hot disk method.

Figure 7.
Position of the sensor in the liquid paraffin.

Figure 8.
DSC results of RT21 with heating–cooling rates of 10 °C.min−1 and 0.2 °C. min−1.

Figure 9.
DSC results of RT27 with heating–cooling rates of 10 °C.min−1 and 0.2 °C.min−1.

Figure 10.
DSC results of RT50 with heating–cooling rates of 10 °C.min−1 and 0,2 °C. min−1.

Figure 11.
Analysis of thermograms of RT21 during (a) heating and (b) cooling at 10 °C.min−1.

Figure 12.
Analysis of thermograms of RT21 during (a) heating and (b) cooling at 0.2 °C.min−1.

Figure 13.
DSC results of RT35HC with heating–cooling rates of 10 °C.min−1 and 0.2 °C. min−1.

Figure 14.
Analysis of thermograms of RT35HC during (a) heating and (b) cooling at 10 °C.min−1.


Figure 15.
Analysis of thermograms of RT35HC during (a) heating and (b) cooling at 0.2 °C.min−1.


Figure 16.
DSC thermograms of RT21 under ten thermal cycles at 10 °C.min−1.

Figure 17.
DSC thermograms of RT27 under ten thermal cycles at 10 °C.min−1.

Figure 18.
DSC thermograms of RT35HC under ten thermal cycles at 10 °C.min−1.

Figure 19.
DSC thermograms of RT50 under ten thermal cycles at 10 °C.min−1.

Figure 20.
Temperature dependence of the specific heat of sapphire.

Figure 21.
Evolution of the apparent specific heat capacities of paraffins as a function of temperature.
Figure 21.
Evolution of the apparent specific heat capacities of paraffins as a function of temperature.

Figure 22.
Evolution of the specific heat of RT21 in (a) the solid state and (b) the liquid state with temperature.
Figure 22.
Evolution of the specific heat of RT21 in (a) the solid state and (b) the liquid state with temperature.

Figure 23.
Evolution of the specific heat of RT27 in (a) the solid state and (b) the liquid state with temperature.
Figure 23.
Evolution of the specific heat of RT27 in (a) the solid state and (b) the liquid state with temperature.

Figure 24.
Evolution of the specific heat of RT35HC in (a) the solid state and (b) the liquid state with temperature.
Figure 24.
Evolution of the specific heat of RT35HC in (a) the solid state and (b) the liquid state with temperature.

Figure 25.
Evolution of the specific heat of RT50 in (a) the solid state and (b) the liquid state with temperature.
Figure 25.
Evolution of the specific heat of RT50 in (a) the solid state and (b) the liquid state with temperature.

Figure 26.
Thermal degradation of paraffins.

Figure 27.
Evolution of the derivative weight of the paraffins as a function of temperature.

Figure 28.
Evolution of the thermal conductivity of RT21 as a function of temperature.

Figure 29.
Evolution of the thermal conductivity of RT27 as a function of temperature.

Figure 30.
Evolution of the thermal conductivity of RT35HC as a function of temperature.

Figure 31.
Evolution of the thermal conductivity of RT50 as a function of temperature.

Figure 32.
Evolution of the thermal diffusivity of RT21 as a function of temperature.

Figure 33.
Evolution of the thermal diffusivity of RT27 as a function of temperature.

Figure 34.
Evolution of the thermal diffusivity of RT35HC as a function of temperature.

Figure 35.
Evolution of the thermal diffusivity of RT50 as a function of temperature.

Figure 36.
Evolution of the densities of the liquid paraffins as a function of temperature: (a) RT21; (b) RT27; (c) RT35HC; (d) RT50.
Figure 36.
Evolution of the densities of the liquid paraffins as a function of temperature: (a) RT21; (b) RT27; (c) RT35HC; (d) RT50.


Table 1.
Thermophysical properties of paraffins RT21, RT27, RT35HC and RT50 [37].
Table 1.
Thermophysical properties of paraffins RT21, RT27, RT35HC and RT50 [37].
| Paraffin | Melting Area | Solidification Area | Cp | λ | ρ | ||
|---|---|---|---|---|---|---|---|
| °C | °C | J.g−1.K−1 | W.m−1.K−1 | kg.m−3 | |||
| s | l | s | l | ||||
| RT21 | 18–23 | 22–19 | 2 | 0.2 | 0.2 | 880 | 770 |
| RT27 | 25–28 | 28–25 | 2 | 0.2 | 0.2 | 880 | 760 |
| RT35HC | 34–36 | 36–34 | 2 | 0.2 | 0.2 | 880 | 770 |
| RT50 | 45–51 | 51–46 | 2 | 0.2 | 0.2 | 880 | 760 |
Table 2.
Masses and temperature programs for DSC measurements at 10 °C.min−1.
| PCM | Mass | Heating Interval | Isothermal Duration | Cooling Interval | Isothermal Duration |
|---|---|---|---|---|---|
| mg | °C | min | °C | min | |
| RT21 | 7.82 (0.01) | [−60, 80] | 3 | [80, −60] | 3 |
| RT27 | 7.90 (0.01) | [−60, 80] | 3 | [80, −60] | 3 |
| RT35HC | 7.66 (0.01) | [−40, 80] | 3 | [80, −40] | 3 |
| RT50 | 7.93 (0.01) | [−40, 80] | 3 | [80, −40] | 3 |
Table 3.
Masse and temperature programs for DSC measurements at 0.2 °C.min−1.
| PCM | Mass | Heating Interval | Isothermal Duration | Heating Interval | Isothermal Duration |
|---|---|---|---|---|---|
| mg | °C | min | °C | min | |
| RT21 | 7.28 (0.01) | [−50, 50] | 3 | [50, −50] | 3 |
| RT27 | 7.60 (0.01) | [−30, 40] | 3 | [40, −30] | 3 |
| RT35HC | 7.36 (0.01) | [−20, 45] | 3 | [45, −20] | 3 |
| RT50 | 7.40 (0.01) | [−20, 60] | 3 | [60, −20] | 3 |
Table 4.
Temperatures and latent heats of phase transitions of RT21.
| PCM | Rate | Heating | Cooling | ||||||
|---|---|---|---|---|---|---|---|---|---|
| Solid–Solid | Solid–Liquid | Liquid–Solid | Solid–Solid | ||||||
| TS-S | ∆HS-S | TS-L | ∆HS-L | TL-S | ∆HL-S | TS-S | ∆HS-S | ||
| RT21 | °C.min−1 | °C | J.g−1 | °C | J.g−1 | °C | J.g−1 | °C | J.g−1 |
| 10 | −5.2 (0.2) | 8.46 (0.22) | 18.1 (0.2) | 126.00 (2.20) | 20.7 (0.2) | 129.76 (0.72) | −5.7 (0.2) | 7.18 (0.12) | |
| 0.2 | −8.9 (0.2) | 13.32 (0.14) | 17.5 (0.2) | 136.02 (1.38) | 22.2 (0.2) | 144.42 (1.46) | −5.1 (0.2) | 11.43 (0.12) | |
Table 5.
Temperatures and latent heats of phase transitions of RT27.
| PCM | Rate | Heating | Cooling | ||||||
|---|---|---|---|---|---|---|---|---|---|
| Solid–Solid | Solid–Liquid | Liquid–Solid | Solid–Solid | ||||||
| TS-S | ∆HS-S | TS-L | ∆HS-L | TL-S | ∆HL-S | TS-S | ∆HS-S | ||
| RT27 | °C.min−1 | °C | J.g−1 | °C | J.g−1 | °C | J.g−1 | °C | J.g−1 |
| 10 | 1.5 (0.2) | 19.85 (0.30) | 25.3 (0.2) | 148.20 (1.34) | 24.4 (0.2) | 145.96 (0.96) | 0.9 (0.2) | 18.26 (0.58) | |
| 0.2 | 1.9 (0.2) | 21.81 (0.22) | 26.5 (0.2) | 175.07 (1.78) | 27.3 (0.2) | 137.52 (1.40) | 1.9 (0.2) | 20.08 (0.20) | |
Table 6.
Temperatures and latent heats of phase transitions of RT50.
| PCM | Rate | Heating | Cooling | ||||||
|---|---|---|---|---|---|---|---|---|---|
| Solid–Solid | Solid–Liquid | Liquid–Solid | Solid–Solid | ||||||
| TS-S | ∆HS-S | TS-L | ∆HS-L | TL-S | ∆HL-S | TS-S | ∆HS-S | ||
| RT50 | °C.min−1 | °C | J.g−1 | °C | J.g−1 | °C | J.g−1 | °C | J.g−1 |
| 10 | 28.0 (0.2) | 25.15 (1.64) | 48.5 (0.2) | 132.49 (1.04) | 50.3 (0.2) | 134.98 (0.28) | 34.6 (0.2) | 23.32 (0.06) | |
| 0.2 | 29.5 (0.2) | 28.24 (0.28) | 48.9 (0.2) | 151.92 (1.52) | 52.9 (0.2) | 142.66 (1.42) | 36.2 (0.2) | 24.52 (0.24) | |
Table 7.
Temperatures and latent heats of phase transitions of RT35HC.
| PCM | Rate | Heating | Cooling | |||||
|---|---|---|---|---|---|---|---|---|
| Solid–Liquid | Liquid–Solid | |||||||
| TS-L | ∆HS-L | TL-S1 | ∆HL-S1 | TL-S2 | ∆HL-S2 | ∆HL-S | ||
| RT35HC | °C.min−1 | °C | J.g−1 | °C | J.g−1 | °C | J.g−1 | J.g−1 |
| 10 | 35.8 (0.2) | 213.56 (0.34) | 33.8 (0.2) | - | 30.2 (0.6) | - | 210.83 (0.34) | |
| 0.2 | 35.0 (0.2) | 221.23 (2.24) | 35.0 (0.2) | 118.28 (1.20) | 30.4 (0.2) | 63.02 (0.64) | 181.30 (1.36) | |
Table 8.
Comparison between DSC results and literature data.
| Paraffin | TS-L | ∆HS-L | TL-S | ∆HL-S | Reference |
|---|---|---|---|---|---|
| °C | J.g−1 | °C | J.g−1 | ||
| RT21 | 17.5 | 136.02 | 22.2 | 144.42 | Present work |
| 16.53 | n.a. | 20.18 | n.a. | [22] | |
| 18–23 | 155 | 22–19 | n.a. | [37] | |
| RT27 | 26.5 | 175.07 | 27.3 | 137.52 | Present work |
| 23.67 | 134.928 | 24.78 | 130.139 | [20] | |
| 25–28 | 179 | 28–25 | n.a. | [37] | |
| RT35HC | 35.0 | 221.23 | 35 S1 * 63.02 S2 * | 181.3 | Present work |
| n.a. | 230 | n.a. | n.a. | [23] | |
| 34–36 | 240 | 36–34 | n.a. | [37] | |
| RT50 | 48.9 | 151.92 | 52.9 | 142.66 | Present work |
| 44.05 | 170.32 | n.a. | 160 | [21] | |
| 45–51 | 160 | 51–46 | n.a. | [37] |
* L-S1: First step of the solidification; * L-S2: Second step of the solidification.
Table 9.
Parameters a–e from fitting experimental specific heat to the polynomial equation (cp = a T4 + b T3 + c T2+ d T + e) as a function of temperature of the solid and liquid paraffins.
Table 9.
Parameters a–e from fitting experimental specific heat to the polynomial equation (cp = a T4 + b T3 + c T2+ d T + e) as a function of temperature of the solid and liquid paraffins.
| a | b | c | d | e | |
|---|---|---|---|---|---|
| RT21 | |||||
| Solid | 1.95877 × 10⁻⁶ | 3.36816 × 10⁻⁴ | 0.02206 | 0.66399 | 9.09801 |
| Liquid | −2.11807 × 10⁻⁷ | 3.67055 × 10⁻⁵ | −0.00229 | 0.06479 | 1.09469 |
| RT27 | |||||
| Solid | 2.6730 × 10⁻⁷ | 3.13164 × 10⁻⁵ | 0.00155 | 0.04426 | 1.99897 |
| Liquid | −1.63905 × 10⁻⁶ | 3.1888 × 10⁻⁴ | −0.02289 | 0.72072 | −6.45881 |
| RT35HC | |||||
| Solid | 7.68467 × 10⁻⁷ | −1.50598 × 10⁻⁶ | 2.0543 × 10⁻⁴ | 0.0077 | 1.54253 |
| Liquid | 7.20357 × 10⁻⁷ | −1.70982 × 10⁻⁴ | 0.01518 | −0.59265 | 10.52222 |
| RT50 | |||||
| Solid | −1.40326 × 10⁻⁷ | 9.07044 × 10⁻⁶ | 3.12614 × 10⁻⁴ | 0.01315 | 1.78909 |
| Liquid | 4.55076 × 10⁻⁶ | −0.0013 | 0.13998 | −6.66814 | 121.19226 |
Table 10.
Average specific heats of paraffins in the solid and liquid phases.
| Cp,s | Cp,l | |
|---|---|---|
| (J.g−1.K−1) | J.g−1.K−1 | |
| RT21 | 1.35 (0.26) | 1.86 (0.32) |
| RT27 | 1.52 (0.31) | 1.97 (0.31) |
| RT35HC | 1.57(0.23) | 2.00 (0.31) |
| RT50 | 1.79 (0.33) | 2.38 (0.32) |
Table 11.
Comparison between the specific heats of this study and the literature data.
| Cp, s | Cp,l | |||
|---|---|---|---|---|
| J.g−1.K−1 | J.g−1.K−1 | |||
| Present Work | Literature | Present Work | Literature | |
| RT21 | 1.35 (0.26) | 2 [37] | 1.86 (0.32) | 2 [37] |
| RT27 | 1.52 (0.31) | 2 [37] 3.25 [20] | 1.97 (0.31) | 2 [37] 2.23 [20] |
| RT35HC | 1.57(0.23) | 2 [37] | 2.00 (0.31) | 2 [37] |
| RT50 | 1.79 (0.33) | 2 [37] | 2.38 (0.32) | 2 [37] |
Table 12.
Degradation rates of the paraffin waxes.
| Degradation Rate | 10% | 25% | 50% | 75% |
|---|---|---|---|---|
| T (°C) | T (°C) | T (°C) | T (°C) | |
| RT21 | 144.7 | 172.4 | 199.2 | 217.4 |
| RT27 | 169.6 | 196.2 | 217 | 230.6 |
| RT35HC | 181.7 | 205.8 | 224.8 | 237.2 |
| RT50 | 228.8 | 249.4 | 265.7 | 279.7 |
Table 13.
Thermal conductivities of RT21 at different temperatures.
| Paraffin | T (°C) | λ (W.m−1.K−1) | Phase |
|---|---|---|---|
| RT21 | 17 | 0.257 (0.001) | Solid |
| 22.1 | 0.188 (0.001) | Liquid | |
| 22.9 | 0.187 (0.002) | ||
| 23.8 | 0.185 (0.001) | ||
| 25.3 | 0.185 (0.002) | ||
| 26.5 | 0.185 (0.002) | ||
| 28 | 0.185 (0.009) | ||
| 29.9 | 0.185 (0.006) | ||
| 34.7 | 0.185 (0.001) | ||
| 39.5 | 0.185 (0.003) |
Table 14.
Thermal conductivities of RT27 at different temperatures.
| Paraffin | T (°C) | λ (W.m−1.K−1) | Phase |
|---|---|---|---|
| RT27 | 16 | 0.196 (0.010) | Solid |
| 18 | 0.197 (0.010) | ||
| 20 | 0.200 (0.005) | ||
| 23 | 0.235 (0.001) | ||
| 25 | 0.256 (0.013) | ||
| 27.3 | 0.190 (0.002) | Liquid | |
| 29.3 | 0.188 (0.002) | ||
| 31 | 0.190 (0.005) | ||
| 34.2 | 0.187 (0.009) | ||
| 39.5 | 0.186 (0.009) | ||
| 44.6 | 0.185 (0.001) |
Table 15.
Thermal conductivities of RT35HC at different temperatures.
| Paraffin | T (°C) | λ (W.m−1.K−1) | Phase |
|---|---|---|---|
| RT35HC | 25.7 | 0.313 (0.006) | Solid |
| 28.1 | 0.316 (0.003) | ||
| 30.2 | 0.334 (0.006) | ||
| 32.2 | 0.334 (0.005) | ||
| 36 | 0.187 (0.001) | Liquid | |
| 38 | 0.186 (0.002) | ||
| 40 | 0.187 (0.004) | ||
| 42 | 0.186 (0.009) | ||
| 44 | 0.1846 (0.004) | ||
| 50 | 0.1836 (0.005) |
Table 16.
Thermal conductivities of RT50 at different temperatures.
| Paraffin | T (°C) | λ (W.m−1.K−1) | Phase |
|---|---|---|---|
| RT50 | 30 | 0.236 (0.012) | Solid |
| 35 | 0.235 (0.012) | ||
| 42 | 0.237 (0.012) | ||
| 44 | 0.248 (0.012) | ||
| 46 | 0.278 (0.014) | ||
| 48 | 0.330 (0.006) | ||
| 52 | 0.228 (0.011) | Liquid | |
| 54 | 0.200 (0.003) | ||
| 56 | 0.198 (0.001) | ||
| 58 | 0.195 (0.003) | ||
| 60 | 0.194 (0.004) | ||
| 62 | 0.192 (0.003) | ||
| 64 | 0.191 (0.004) | ||
| 68 | 0.190 (0.003) | ||
| 70 | 0.192 (0.004) |
Table 17.
Average thermal conductivities of paraffins.
| λs | λl | |||
|---|---|---|---|---|
| W.m−1.K−1 | W.m−1.K−1 | |||
| Present Work | Literature | Present Work | Literature | |
| RT21 | 0.257 (0.001) | 0.2 [37] | 0.186 (0.002) | 0.187 [36] |
| RT27 | 0.217 (0.004) | 0.166 [25] | 0.188 (0.002) | 0.2 [37] |
| RT35HC | 0.324 (0.003) | 0.2 [37] | 0.186 (0.002) | 0.2 [37] |
| RT50 | 0.260 (0.005) | 0.2 [37] | 0.198 (0.002) | 0.2 [37] |
Table 18.
Thermal diffusivities of RT21 at different temperatures.
| Paraffin | T (°C) | a (10−6 m2.s−1) | Phase |
|---|---|---|---|
| RT21 | 22.1 | 0.155 (0.006) | Liquid |
| 22.9 | 0.152 (0.010) | ||
| 23.8 | 0.147 (0.006) | ||
| 25.3 | 0.151 (0.005) | ||
| 26.5 | 0.151 (0.003) | ||
| 28 | 0.147 (0.008) | ||
| 29.9 | 0.147 (0.02) | ||
| 34.7 | 0.147 (0.006) | ||
| 39.5 | 0.149 (0.007) |
Table 19.
Thermal diffusivities of RT27 at different temperatures.
| Paraffin | T (°C) | a (10−6 m2.s−1) | Phase |
|---|---|---|---|
| RT27 | 27.3 | 0.156 (0.003) | Liquid |
| 29.3 | 0.153 (0.005) | ||
| 34.2 | 0.157 (0.002) | ||
| 39.5 | 0.147 (0.003) | ||
| 44.6 | 0.150 (0.001) |
Table 20.
Thermal diffusivities of RT35HC at different temperatures.
| Paraffin | T (°C) | a (10−6 m2.s−1) | Phase |
|---|---|---|---|
| RT35HC | 36 | 0.140 (0.005) | Liquid |
| 38 | 0.134 (0.005) | ||
| 42 | 0.131 (0.013) | ||
| 44 | 0.130 (0.013) | ||
| 50 | 0.125 (0.014) |
Table 21.
Thermal diffusivities of RT50 at different temperatures.
| Paraffin | T (°C) | a (10−6 m2.s−1) | Phase |
|---|---|---|---|
| RT50 | 52 | 0.170 (0.011) | Liquid |
| 54 | 0.146 (0.011) | ||
| 56 | 0.145 (0.008) | ||
| 58 | 0.130 (0.010) | ||
| 60 | 0.127 (0.008) | ||
| 62 | 0.124 (0.008) | ||
| 64 | 0.118 (0.009) | ||
| 68 | 0.119 (0.009) | ||
| 70 | 0.123 (0.009) |
Table 22.
Densities of RT21 at different temperatures.
| Paraffin | T (°C) | (kg.m−3) | Phase | |
|---|---|---|---|---|
| Present Work | [37] | |||
| RT21 | 17 | 748,263 (0.595) | - | Solid |
| 22 | 729,958 (0.053) | - | Liquid | |
| 25 | 728,880 (0.053) | 770 | ||
| 29 | 726,650 (0.053) | - | ||
| 34 | 724,122 (0.053) | - | ||
| 38 | 721,093 (0.053) | - | ||
| 40 | 720,368 (0.053) | - | ||
Table 23.
Densities of RT27 at different temperatures.
| Paraffin | T (°C) | (kg.m−3) | Phase | |
|---|---|---|---|---|
| Present Work | [37] | |||
| RT27 | 20 | 794,806 (0.513) | - | Solid |
| 28 | 787,699 (0.055) | - | Liquid | |
| 31 | 785,209 (0.055) | - | ||
| 35 | 782,087 (0.055) | - | ||
| 40 | 778,054 (0.054) | 760 | ||
Table 24.
Densities of RT35HC at different temperatures.
| Paraffin | T (°C) | (kg.m−3) | Phase | |
|---|---|---|---|---|
| Present Work | [37] | |||
| RT35HC | 33 | 906,362 (0.642) | - | Solid |
| 36 | 800,077 (0.055) | - | Liquid | |
| 38 | 798,553 (0.055) | - | ||
| 40 | 796,992 (0.055) | 770 | ||
| 42 | 795,468 (0.055) | - | ||
| 45 | 793,145 (0.055) | - | ||
| 50 | 789,298 (0.055) | - | ||
Table 25.
Densities of RT50 at different temperatures.
| Paraffin | T (°C) | (kg.m−3) | Phase | |
|---|---|---|---|---|
| Present Work | [37] | |||
| RT50 | 40 | 904,002 (0.689) | - | Solid |
| 52 | 805,429 (0.055) | - | Liquid | |
| 55 | 801,916 (0.055) | - | ||
| 60 | 796,323 (0.055) | - | ||
| 65 | 789,818 (0.055) | - | ||
| 80 | - | 760 | ||
Table 26.
Thermal expansion coefficients of the paraffins.
| Paraffins | β (K−1) |
|---|---|
| RT21 | 0.0007 (0.0001) |
| RT27 | 0.0010 (6 × 10⁻⁶) |
| RT35HC | 0.0009 (10−6) |
| RT50 | 0.0014 (0.0001) |
Table 27.
Comparison between the diffusivities of the liquid RT21 measured by the hot disk method and calculated.
Table 27.
Comparison between the diffusivities of the liquid RT21 measured by the hot disk method and calculated.
| Paraffin | T | a | acalcuated |
|---|---|---|---|
| °C | 10−6 m2.s−1 | 10−6 m2.s−1 | |
| RT21 | 22.1 | 0.155 (0.006) | 0.138 (0.024) |
| 22.9 | 0.152 (0.010) | 0.137 (0.024) | |
| 23.8 | 0.147 (0.006) | 0.136 (0.024) | |
| 25.3 | 0.151 (0.005) | 0.136 (0.024) | |
| 26.5 | 0.151 (0.003) | 0.136 (0.024) | |
| 28 | 0.147 (0.008) | 0.136 (0.024) | |
| 29.9 | 0.147 (0.02) | 0.137 (0.024) | |
| 34.7 | 0.147 (0.006) | 0.137 (0.024) | |
| 39.5 | 0.149 (0.007) | 0.138 (0.024) |
Table 28.
Comparison between the diffusivities of the liquid RT27 measured by the hot disk method and calculated.
Table 28.
Comparison between the diffusivities of the liquid RT27 measured by the hot disk method and calculated.
| Paraffin | T | a | acalculated |
|---|---|---|---|
| °C | 10−6 m2.s−1 | 10−6 m2.s−1 | |
| RT27 | 27.3 | 0.156 (0.003) | 0.122 (0.019) |
| 29.3 | 0.153(0.005) | 0.121 (0.019) | |
| 34.2 | 0.157 (0.002) | 0.123 (0.02) | |
| 39.5 | 0.147 (0.003) | 0.121 (0.02) | |
| 44.6 | 0.150 (0.001) | 0.121 (0.02) |
Table 29.
Comparison between the diffusivities of the liquid RT35HC measured by the hot disk method and calculated.
Table 29.
Comparison between the diffusivities of the liquid RT35HC measured by the hot disk method and calculated.
| Paraffin | T | a | acalculated |
|---|---|---|---|
| °C | 10−6 m2.s−1 | 10−6 m2.s−1 | |
| RT35HC | 36 | 0.140 (0.005) | 0.117 (0.018) |
| 38 | 0.134 (0.005) | 0.116 (0.018) | |
| 42 | 0.131 (0.013) | 0.117 (0.019) | |
| 44 | 0.130 (0.013) | 0.116 (0.018) | |
| 50 | 0.125 (0.014) | 0.116 (0.018) |
Table 30.
Comparison between the diffusivities of the liquid RT50 measured by the hot disk method and calculated.
Table 30.
Comparison between the diffusivities of the liquid RT50 measured by the hot disk method and calculated.
| Paraffin | T | a | acalculated |
|---|---|---|---|
| °C | 10−6 m2.s−1 | 10−6 m2.s−1 | |
| RT50 | 52 | 0.170 (0.011) | 0.119 (0.032) |
| 54 | 0.146 (0.011) | 0.105 (0.028) | |
| 56 | 0.145 (0.008) | 0.104 (0.028) | |
| 58 | 0.130 (0.010) | 0.103 (0.028) | |
| 60 | 0.127 (0.008) | 0.102 (0.028) | |
| 62 | 0.124 (0.008) | 0.102 (0.027) | |
| 64 | 0.118 (0.009) | 0.101 (0.027) | |
| 68 | 0.119 (0.009) | 0.102 (0.027) |
Disclaimer/Publisher’s Note: The statements, opinions and data contained in all publications are solely those of the individual author(s) and contributor(s) and not of MDPI and/or the editor(s). MDPI and/or the editor(s) disclaim responsibility for any injury to people or property resulting from any ideas, methods, instructions or products referred to in the content. |
© 2023 by the authors. Licensee MDPI, Basel, Switzerland. This article is an open access article distributed under the terms and conditions of the Creative Commons Attribution (CC BY) license (https://creativecommons.org/licenses/by/4.0/).
Share and Cite
MDPI and ACS Style
Kraiem, M.; Karkri, M.; Fois, M.; Sobolciak, P. Thermophysical Characterization of Paraffins versus Temperature for Thermal Energy Storage. Buildings 2023, 13, 877. https://doi.org/10.3390/buildings13040877
AMA Style
Kraiem M, Karkri M, Fois M, Sobolciak P. Thermophysical Characterization of Paraffins versus Temperature for Thermal Energy Storage. Buildings. 2023; 13(4):877. https://doi.org/10.3390/buildings13040877
Chicago/Turabian StyleKraiem, Manel, Mustapha Karkri, Magali Fois, and Patrik Sobolciak. 2023. "Thermophysical Characterization of Paraffins versus Temperature for Thermal Energy Storage" Buildings 13, no. 4: 877. https://doi.org/10.3390/buildings13040877
Note that from the first issue of 2016, this journal uses article numbers instead of page numbers. See further details here.