Article

Perceived Safety in the Neighborhood: Exploring the Role of Built Environment, Social Factors, Physical Activity and Multiple Pathways of Influence

1
School of Civil Engineering and Architecture, Southwest University of Science and Technology, Mianyang 621000, China
2
School of Architecture, Harbin Institute of Technology, Harbin 150001, China
3
School of Civil Engineering and Architecture, Zhejiang Sci-Tech University, Hangzhou 310018, China
*
Author to whom correspondence should be addressed.
Buildings 2023, 13(1), 2; https://doi.org/10.3390/buildings13010002
Submission received: 2 November 2022 / Revised: 15 December 2022 / Accepted: 15 December 2022 / Published: 20 December 2022

Abstract

:
Considering the sensitivity to environmental safety is rooted in human genes, the external variables that affect the perception of environmental safety and their influence mechanisms have become a point of concern. The existing literature has proven that elements of the built environment are vital influencing factors; however, little is known about the mechanism by which the built environment affects perceived safety and multiple influence pathways have been ignored. Based on defining the concept of perceived safety, this article applies a structural equation model to study the relationship between the built environment and residents’ safety perception with the social environment and physical activity as potential mediators. The statistical results suggest that the variables of the built environment, social factors, and physical activity all significantly influence perceived safety. This finding also reveals that the social environment and group physical activities slightly mediate the relationship, proving that the built environment exerts both direct and indirect effects on perceived safety. This study provides evidence that built environment design is more important than previously thought because it contributes positively to the social atmosphere and encourages the passion for physical activities, which are also beneficial to safety perception.

1. Introduction

Safety is considered a basic requirement, inferior only to physiological drive (food, shelter); thus, the safe sentiment could be treated as the premise for realizing higher emotional needs as a part of well-being [1]. In addition, numerous studies have shown that the positive perception of safety positively contributes to health outcomes, especially in the neighborhood [2,3,4]. Conversely, perceiving the neighborhood as unsafe appears to have a negative effect on residents, including increased anxiety and decreased life satisfaction [5], which further results in poor self-rated health [3] and undesirable health outcomes [2,6].
Despite its importance, the loss of safety is increasingly identified as a critical social problem [7,8,9]. In this case, determining the factors and their mechanisms through which they contribute to the growing unsafe feeling is among the most pressing concerns for urban planners [9]. In 1971, Clarence Ray Jeffery first mentioned the theory of Crime Prevention through Environmental Design (CPTED), which mainly studies how to prevent crime and decrease fear through environment design. With the efforts of various scholars (Newman, Crowe, Moffat, etc.), relative environmental principles were summarized into four strategies: (1) surveillance; (2) access control; (3) territoriality; and (4) maintenance [10,11]. After further expansion, Greg Saville and Gerry Cleveland proposed the second generation of CPTED, highlighting the “community view“ as the theory’s essence [12]. Favorable physical characteristics and attractive public space could enhance residents’ communication and cultivate a sense of community to improve safe feelings. In addition, the Routine Activity Theory (RAT), which indicates that routine activities decrease the likelihood of crime, could also be applied to explore safety perception after environmental interventions [13]. That is, perceived safety may be affected by daily activities which frequently occur in the surroundings. When it comes to communities, residents’ regular exercises serve as indispensable events which take place within the neighborhood. Relatively speaking, the development of CPTED theory has changed from statically emphasizing the physical space from architectural perspectives to dynamically focusing on social atmosphere, and the RAT enlightens us to take essential activities into account.
Although research to date has verified that the degree of perceived safety varies with different environmental variables [14], most researchers merely concentrate on one or one particular group of elements. Specifically, some studies only focus on the fine-scale built environmental features’ influence on safety perception, while others explore the factors of social networks, social support and social cohesion, all of which are constrained in social environment perspectives. However, the comprehensive influence framework, including elements of the built environment, social factors and other frequently discussed variables, such as physical activity, is generally overlooked. In addition, it is critical to clearly define the research object, since a recurring issue is that the inconsistent concepts of perceived safety are frequently found in relevant studies. Among them, some even simply substitute “perceived safety” with “fear of crime”, and the conceptual difference may produce bias in correlative research.
To address the aforementioned knowledge gap, after the connotation of perceived safety is clearly defined, this study aims to explore the relationship between built environment and residents’ safety perception and clarify the possible mediating role of social factors and group physical activities. Based on the data collected from 13 neighborhoods in Mianyang, China, a quantitative model was built to reveal the possible direct influence, which we used to validate the effect of the built environment characterized by certain attributes, social factors and physical activity upon perceived safety. In addition, indirect influence pathways were examined to explore whether social environment and physical activity could explain the relationship between the built environment and perceived safety by acting as mediating variables. By discussing these issues, we aim to provide a clearer understanding of how perceived safety is affected in communities.

2. Theoretical Framework

2.1. Perceived Safety: Defining the Concept and Content

Despite being a topic of concern, there is a lack of a clear explanation for the concept of perceived safety (as well as its synonyms of perception/feeling of safety). Some researchers treat it as a conventional term and make no reference to a definition, which may lead to different interpretations in various cultural contexts [9]. Although some studies do explicitly define what the word means, these scholars roughly equate perceived safety to the fear of crime [1,8,15,16,17,18], which has long been an area of interest in the criminology field and Crime Prevention Through Environmental Design (CPTED) theory [16]. In these studies, perceived safety is generally quantified by the reverse-coded value of fear of crime [9], while the understanding is limited within the crime-threatening aspect.
However, there is increasing acknowledgment that perceived safety comprises various factors and emotions [19,20], which is supposed to reflect the level of general anxiety about external threats. Specifically, Won [21] has clearly pointed out that this idea concerns more than the narrow dimension of crime-related fear. Therefore, in our paper, perceived safety is conceptualized as psychological emotion towards external stimuli in a particular environment; higher values represent individual perception of small extraneous dangers, and the lower values are used to express broader concerns towards outside threats.
Considering the research context is located within the neighborhood, the conceptual dimensions can be further refined. First, although it is believed that the conceptual confusion between fear of crime and perceived safety is inaccurate, it is still important to note that the existence of various crimes is perceived as a great menace to residential safety. Therefore, fear of crime could be seen as a distinct construct of safety perception [9,16,22]. Moreover, studies concerning different dimensions of perceived neighborhood safety also generally include traffic-related [8,21] and activity-related safety [9], representing oppressed feelings derived from undesirable transportation flow and environmental behavior. Furthermore, empirical research has shown that levels of interpersonal communication and trust could partially be seen as predictors of safety feeling [23]. The neighborhood is supposed to encourage interaction between people, while seclusion is also preferred [24]. With regard to this, private anxiety is also seen as a manifestation of the external environment that fails to protect the life and property of its citizens, especially in most developing countries [25].

2.2. Built Environment

Previous research has explored the associations between the built environment and the feeling of safety, and empirical evidence supporting a significant influence is fairly conclusive. Through a comprehensive literature review, the influencing factors of the built environment could be classified into four groups, consisting of seven independent variables.

2.2.1. Detailed Elements

This category involves the core structure of the residence zone, mainly referring to the characteristics of plants and architecture. Greening is the most frequently discussed environmental element connected with safety feelings. Empirical cases indicate strong associations between landscape attributes and perceived safety [26,27], which consistently applies to urban centers, residence areas or more natural parks. In addition, the literature supports that the feeling of safety is closely associated with domain awareness, and buildings are of paramount importance to construct territorial definitions between private, public or semi-public areas [10,28]. Specifically, large-scale building is an effective predictor for lower “territoriality“, as well as higher fear levels [29].

2.2.2. Mobility Arrangement

The close relationship between the “walkable“ environment and positive perception is well-supported by empirical studies [30]. Similarly, as a crucial element in building a walking-friendly environment, street design plays a significant role in affecting safety perception. Optimizing road design, such as decreasing road barriers and broadening walking paths, positively promotes traffic fluency, thereby improving users’ perceived safety [31]. On the contrary, the defense system focuses on controlling threatening persons or objects with the application of entrance guards, closed-circuit television and lighting. As a consequence, users’ sense of safety would be improved on awareness that the mobility of various dangerous sources is restricted and opportunities for self-defense are increased [10,18].

2.2.3. Supportive Aspects

Supportive elements, referring to the factors which could influence personal daily routines, play a subsidiary role in safety perception, either positively or negatively. For example, environmental amenities attract citizens to participate in necessary or recreational activities or provide them with a place for a short break. These service facilities could motivate positive behavior and facilitate the interaction between the environment and inhabitants and further increase their feeling of safety [23]. Instead, being alone may arouse fearful emotions for certain individuals [20], thus the evaluation of whether a space is actively used is frequently discussed in relative research [10]. Branas [13] has emphasized the harm of negative space and demonstrated that structural dilapidation might act as the primary threat to residents’ safety feelings. Additionally, researchers point out that the environmental factor of blind angles or vacant houses may trigger a vicious cycle, where avoidance behavior for a negative spot is generated with lower safety perception [17] and leads to further dilapidated disorder and increased fear [3].

2.2.4. Maintenance

Researchers have long pointed out the deleterious influence that disorder could have on perceived safety [13,17]. Broken window theory suggests that disordered characters, such as obsolete objects, garbage and vandalism [17], would deliver a message that little attention is given to this place and discourage objective as well as subjective safety. Relative research has focused on the topic of fear of crime [29] or perceived safety [7,9,20,23,31], and it has have been found in either theme that a high level of maintenance is associated with lower fear of crime or higher feelings of general safety.

2.3. Social Environment and Physical Activity

Social environment also plays a vital role in encouraging or discouraging perceived safety among residents, although this topic has not been widely studied compared with the built environment. It has been claimed that feeling unsafe is partly the direct product of an undesirable social environment [32]. The indirect explanation is that social condition is the primary driver or inhibitor of deviant behavior and illegal events, and these phenomena would further cause the decline or increase in safety perception [17,33]. Relevant studies may focus on particular elements of social environment, such as social capital [23], social cohesion [4], sense of community [34] and collective efficacy [35]. In most research, specific social factors remain significant predictors of perceived safety.
In addition, the literature has proven the strong connection between the perception of safety and physical activity [21,31]. In this paper, physical activity emphasizes the perception of residents’ activity participation instead of the physical activity level of the interviewees. Several studies have pointed out that residents, whether consciously or not, are inclined to be in the presence of others as an implication that might raise or lower fear [26]. The existence of suspicious figures may serve as a sign of disorder and would reduce safety feeling. On the contrary, residents may feel safe in situations where they see positive people, especially those who exercise. Therefore, group physical activities could be considered an important factor that influences our fear emotions [36].

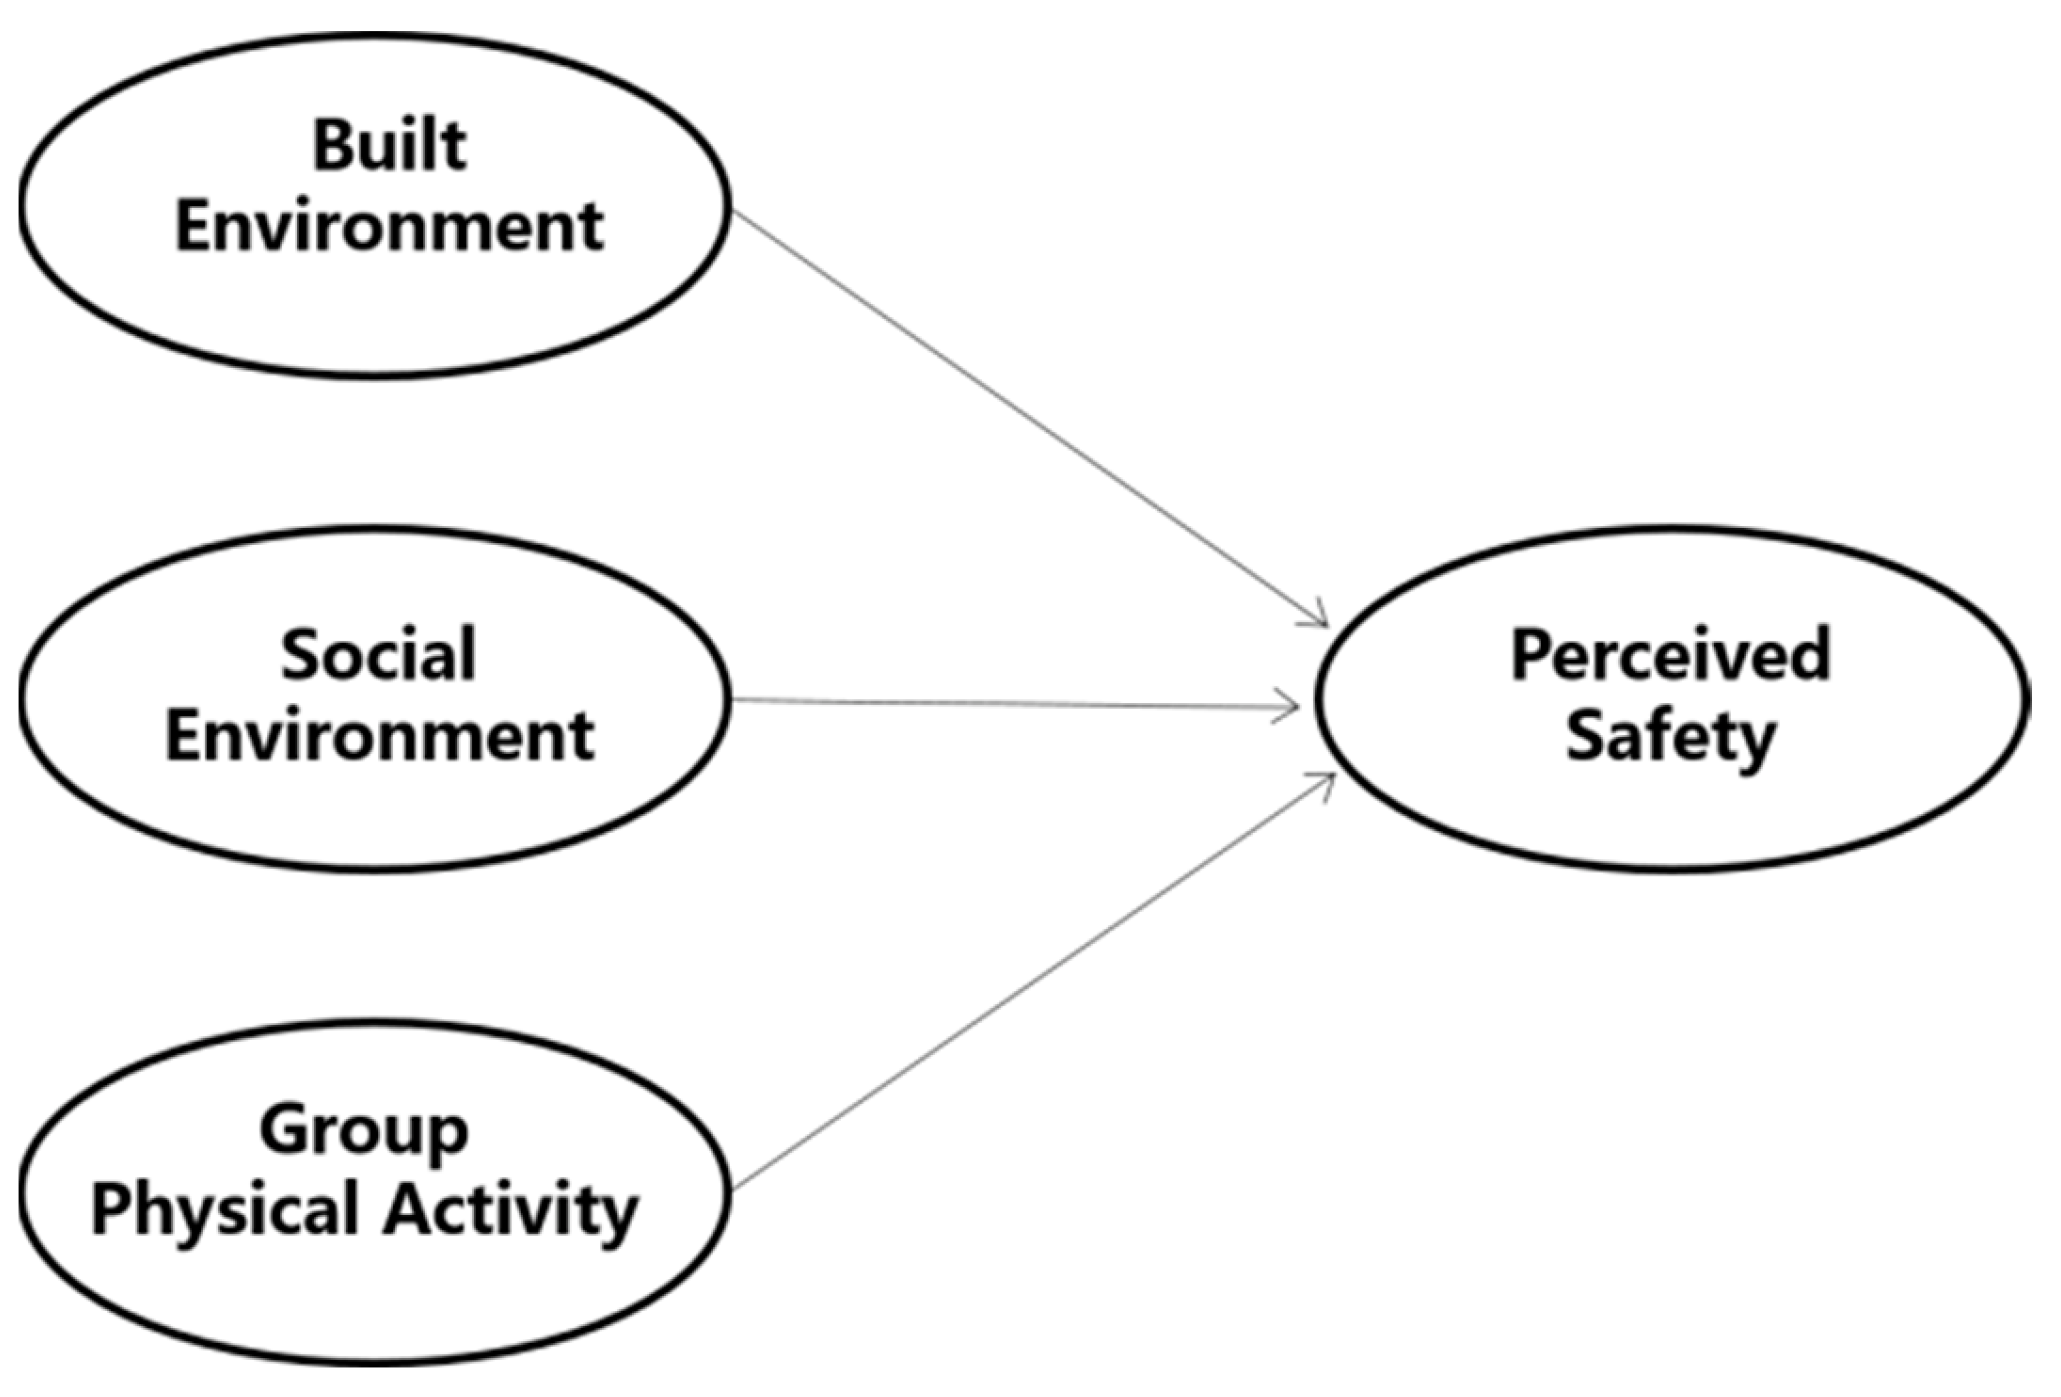
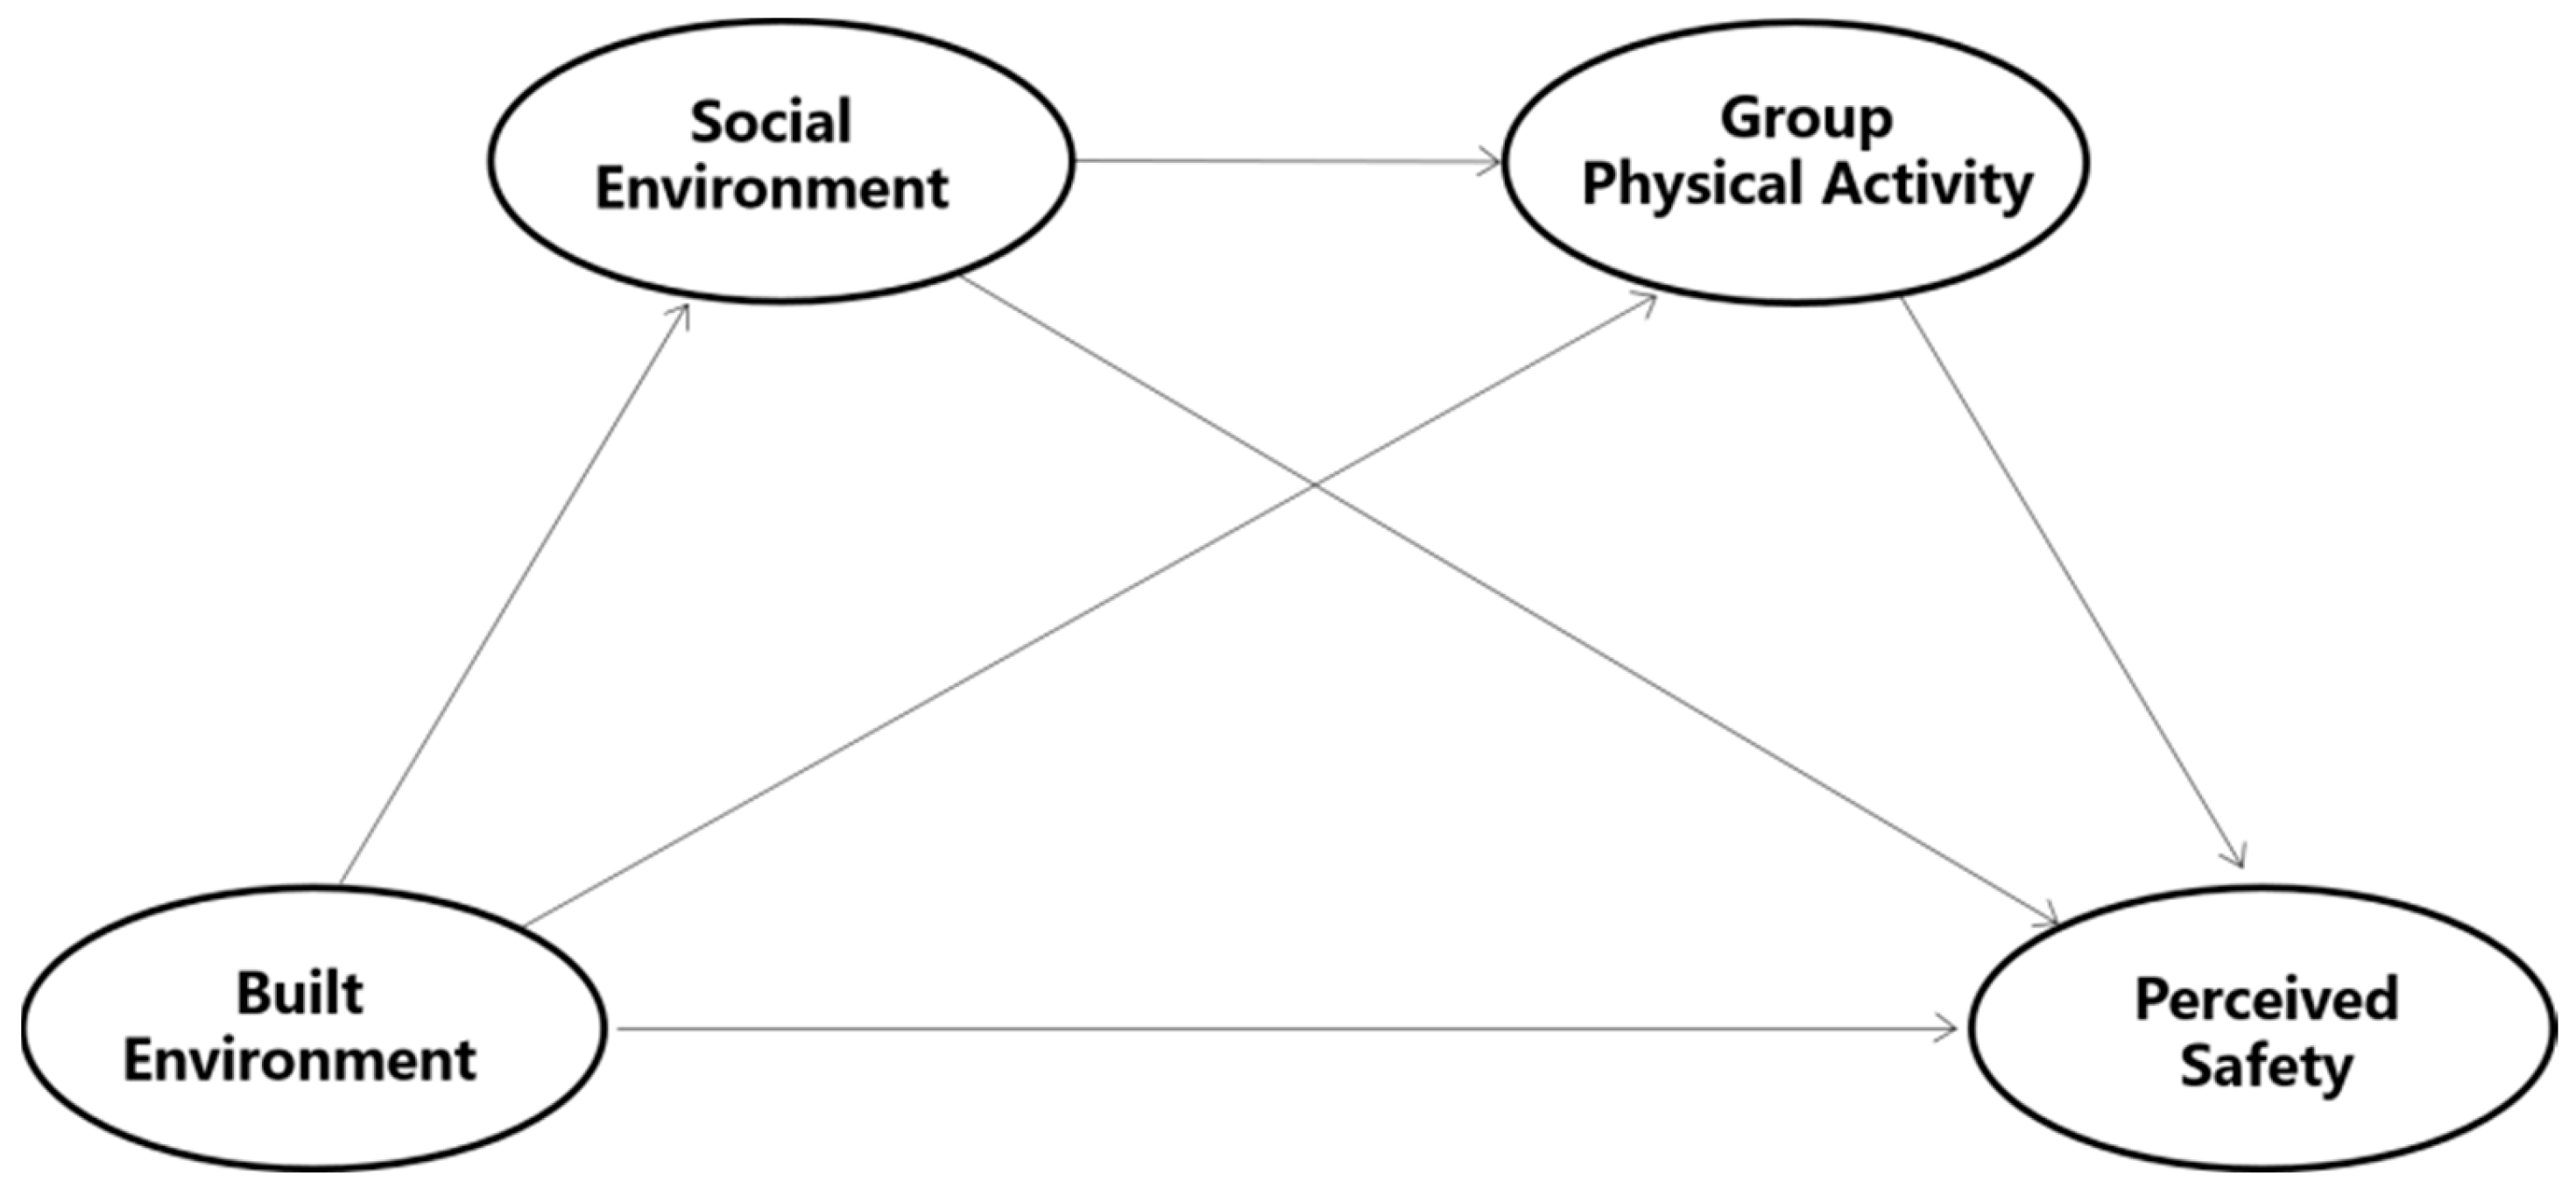
2.4. Hypothesized Model

Based on the existing literature, we focus on three external factors mostly correlated in explaining perceived safety, including the built environment, social environment and physical activity. The hypothesized model was initially established as shown in Figure 1 and illustrates the unidirectional relationship between possible influencing factors and perceived safety.
Although these factors were always studied independently in most explorations, it must be noted that the intricate relationship between these independent variables could not be ignored. Otherwise, the influence effect would be underestimated, and some influence pathways are unlikely to be detectable. Initially, the CPTED theory only paid close attention to physical characteristics of the environment. Gradually, the environmental design, which could facilitate social communication and improve a sense of community, has gained some attention, suggesting that the built environment may change residents’ safety perception by shaping the social climate. Additionally, the RAT implies that routine activities, influenced by the environment, would also contribute significantly to perceived safety. These relevant theories not only indicate the importance of built environment, but also reveal the possible influence paths from physical features to safety perception with social environment and physical activity as possible mediating variables.
Some empirical research has also offered evidence for the influence path. For example, both the built and social environments may independently influence the level of perceived safety. At the same time, empirical studies from the 1990s have proven that these two elements are also potentially related [23]. Proper environment design could encourage informal interactions and strengthen social ties among residents [37]. Moreover, research on a worldwide scale has verified that environmental attributes could promote residents’ physical activity [38], as favorable surrounding offers opportunities for inexpensive and unstructured forms of exercise [28]. Similarly, physical activity is also closely connected with social environment. As Ingram [39] has explained, social features in the neighborhoods may increase positive perceptions of the surroundings, thus a place with greater social connections would increase the likelihood for residents to complete the suggested amount of exercise [38]. In addition, different social structures may influence the perception of the same behavior [28], suggesting that the impression of group activities participation may vary depending on the social context.
Considering the possible existence of relative relationships, a complete theoretical framework was constructed and is shown in Figure 2, depicting how the built environment impacts the perceived safety directly and indirectly through specific influencing pathways through social attributes and the level of group physical activities.

3. Materials and Methods

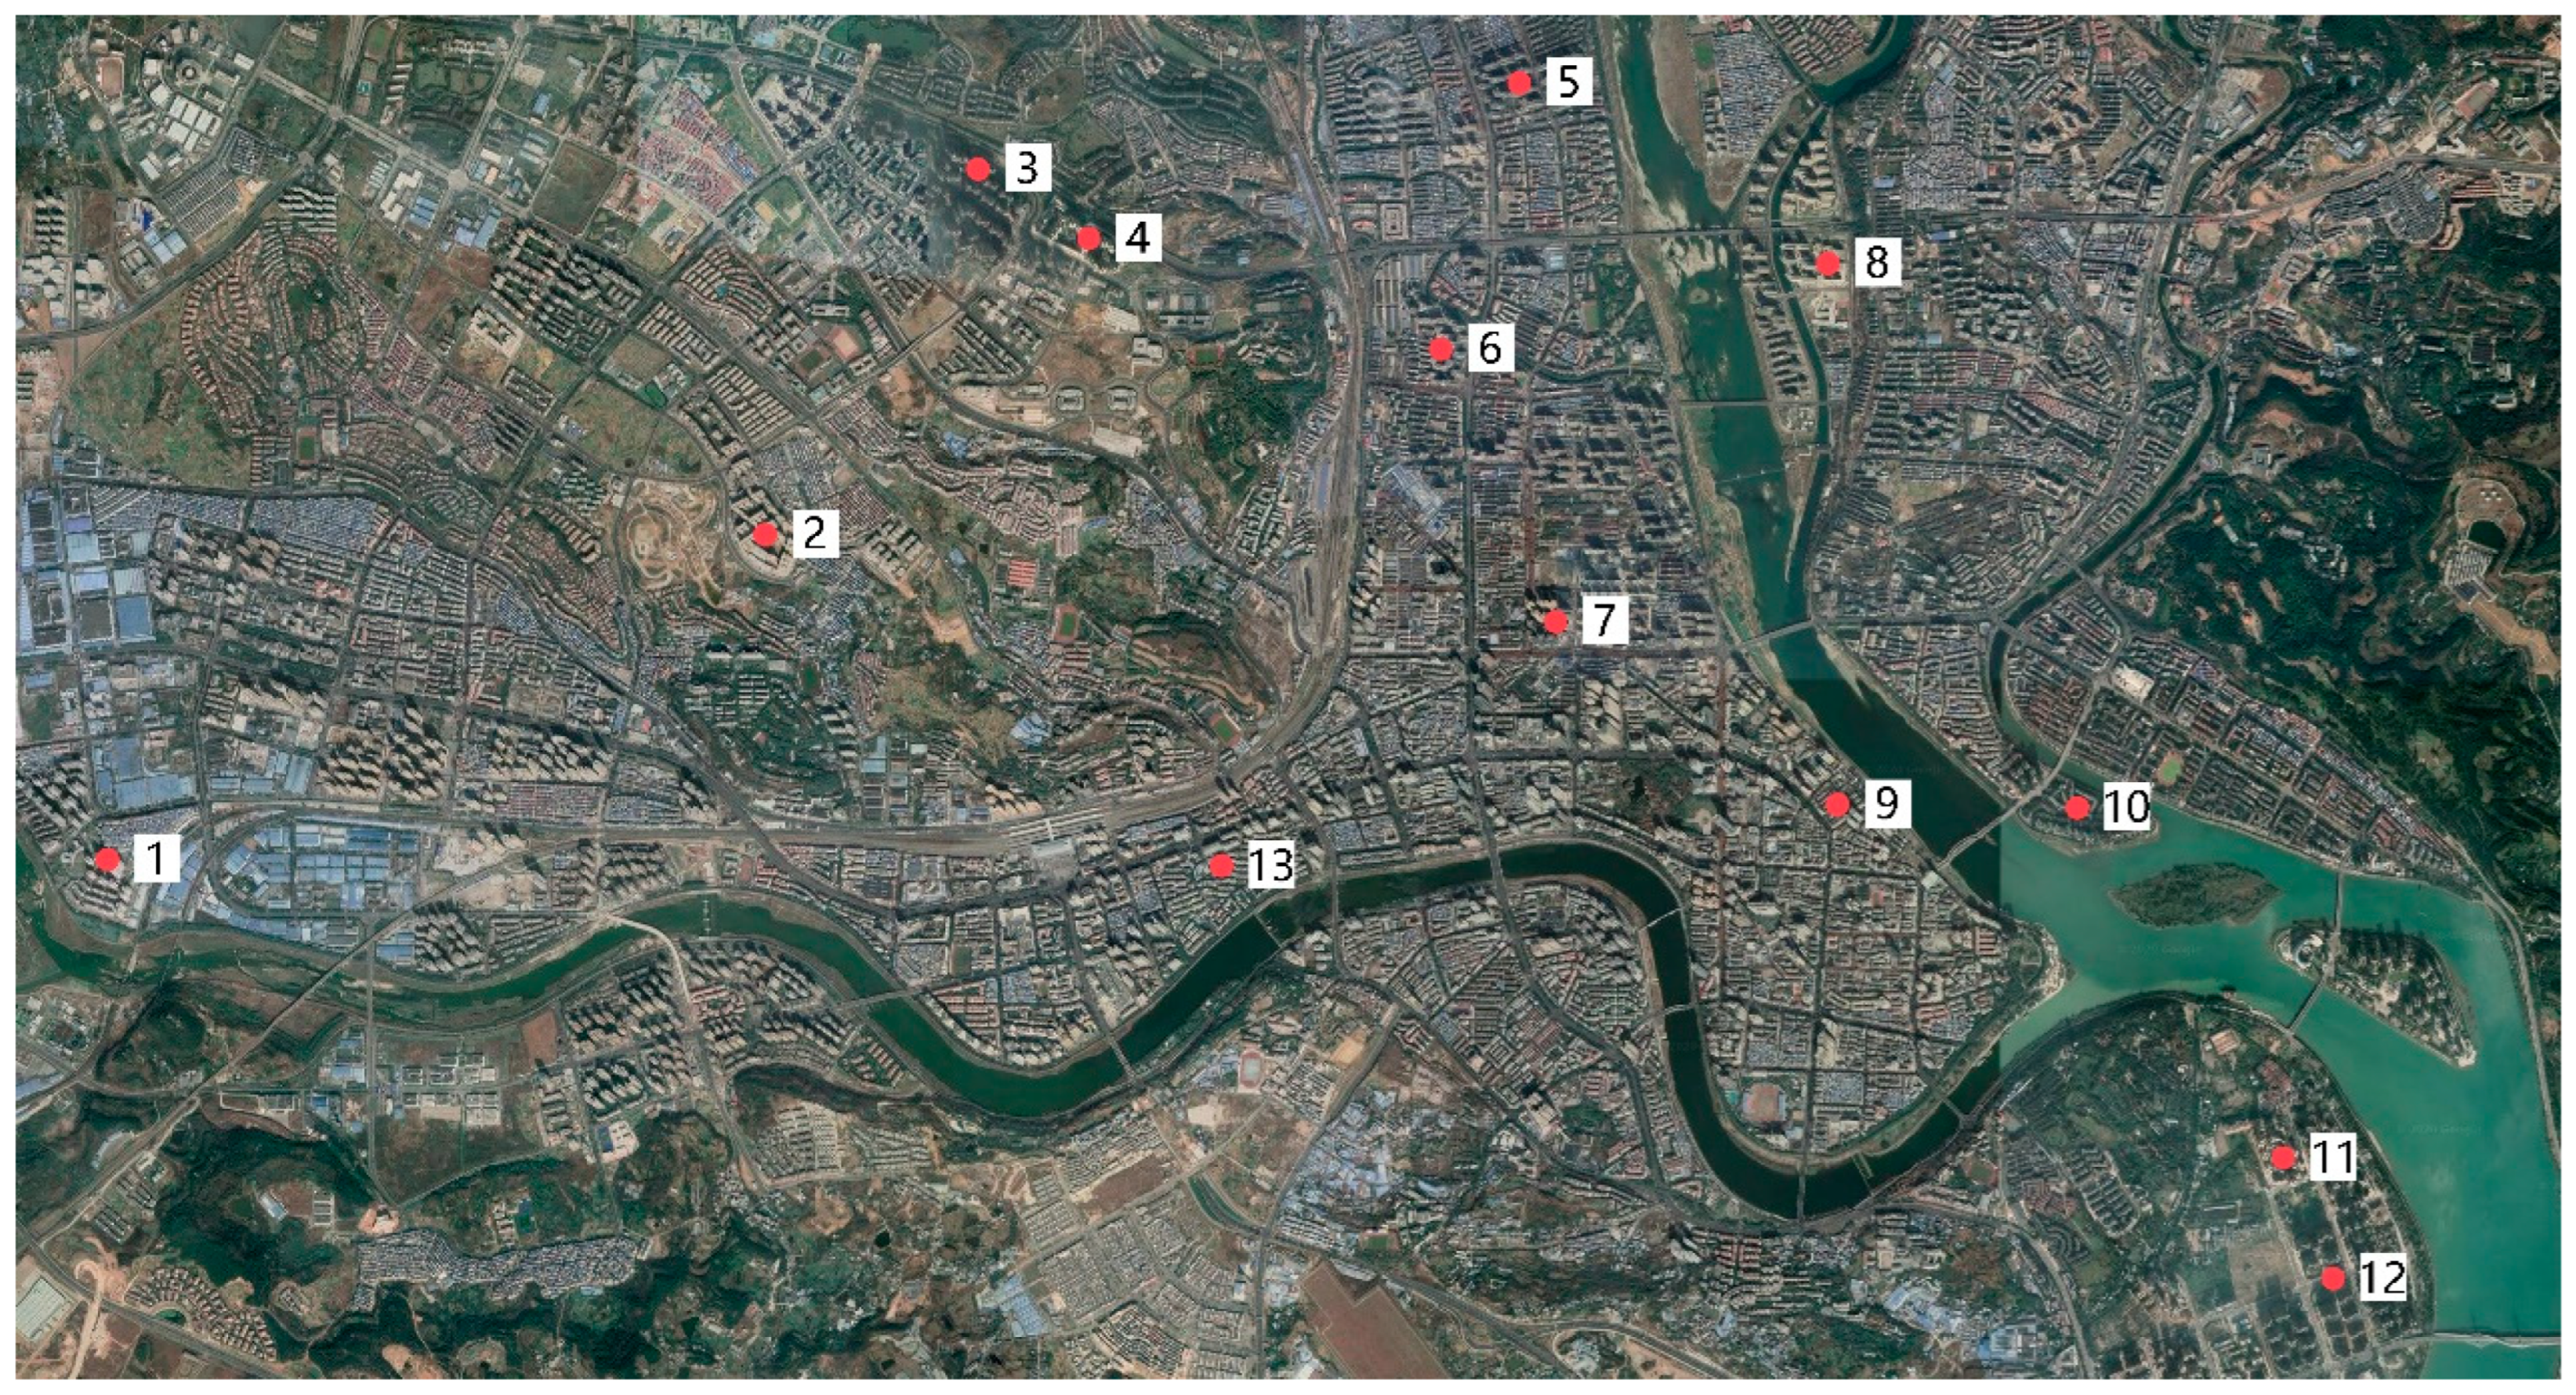
3.1. Study Context and Data Collection

Environment-psychological research from China was frequently conducted in megacities such as Beijing and Guangzhou, while the data for this study was collected in Mianyang, an ordinary third-tier city in Sichuan province. Considering that cities of similar size to Mianyang largely exist in China, this research could bring some universal conclusions for medium-sized cities, which tend to be overlooked in urban studies, and raise more awareness towards this common city type.
Mianyang is located in southwest China, with an urban area of 20,250 square kilometers and a permanent population of 4.87 million in 2020. As shown in Figure 3, 13 neighborhoods in the main urban area were selected as specific research subjects scattered in different regions to avoid typical errors. Moreover, they all share similar planning patterns, close completion time and housing price ranges to control for macroscopic urban discrepancies. Although not intentionally, it should be noted that our targets are all gated communities that are fenced or walled off from their surroundings, which is the predominant dwelling pattern in Chinese urban areas [40].
Paper-based questionnaires were randomly distributed among the selected communities from April to June 2020, throughout the day on both weekdays and weekends to avoid leaving out office workers. In addition, participants were required to age between 18 and 75 years old to guarantee a clear perceptual reflection. All of them were clearly informed that the questionnaires would be anonymously analyzed for scientific purposes. Although the survey was conducted after the outbreak of the COVID-19 pandemic, the investigated areas were not influenced by the infectious disease during that period, and did not bias our research. To encourage the residents’ willingness to finish the questionnaires, the research team prepared some small gifts for participants (WeChat bonus, tableware, USB light, etc.). Finally, a total of 620 questionnaires were sent out and 573 were recovered (92% response rate). After eliminating the questionnaires with missing answers and conflicting information, 535 pieces of valid data were finally obtained with an effective rate of 86.3%.

3.2. General Characteristics of the Respondents

Among those effectively surveyed, there were slightly more females (51.0%) than their male counterparts, and the majority of them were married (72.3%). Most interviewees were middle-aged between 31 to 45 years old (42.1%), followed by residents aged 18–30 and 45–60 composing 30% and 20% of respondents, respectively, with only a few older than 61 years old. As for family income, those who earned CNY 80–120 thousand a year accounted for the largest percentage of 24.5%, with other income data largely conforming to a normal distribution. In addition, some research has emphasized that those who experienced victims’ memory may have lower perceived safety compared with others [9], and the data showed that only 35 (6.5%) residents had experienced dangerous situations.

3.3. Measures and Analysis

3.3.1. Perceived Safety

Considering the conceptual gap in perceived safety, items from previous survey questionnaires cannot be referred to directly, especially those that equate feelings of safety to fear of crime and mainly inquire about the emotional reactions to the possibility of being the victim of certain types of crimes [16,35]. Still, relevant research also provides some references. For example, the frequently cited evaluation for both the feeling of safety and fear of crime, “How safe would you feel walking alone during day/ night in your neighborhood?” [16,29,38] was included in our study. In addition, some items of the Neighborhood Environment Walkability Scale (NEWS) [41], especially the part for traffic and safety survey, were revised into this study.
This study emphasized perceived safety to reflect the general anxiety within the neighborhood. Thus, most measured items were specifically developed in line with this definition in Section 2.1, including different questions on the residents’ perception relating to criminal safety, traffic safety, activity safety, communication safety, and privacy safety. For example, people were asked to rate their psychological feelings about transportation safety within the neighborhood through questions such as “I am worried about being knocked down by the crowd or vehicle”. The responses were calculated on a 7-point scale ranging from 1 = extremely not worried to 7 = extremely worried to effectively distinguish the subtle perceptual difference. Before analysis, the detailed statistics of perceived safety were reverse-coded to guarantee greater values corresponding to higher safety feeling.

3.3.2. Neighborhood Built Environment

The data on neighborhood characteristics were obtained by aggregating community perception rather than objective measures. As the literature review has mentioned, the environmental factors that may affect perceived safety were comprehensively summarized into four categories and seven variables, including greening, buildings, roads, defense systems, service facilities, negative spaces and maintenance, and a total of 24 questions were set concerning these elements. Participants were asked to evaluate these environmental features on a 5-section scale, and specific response options varied slightly depending on the question settings. For example, the answer for “How do you feel about the walkway width within the community” ranges from “extremely narrow” to “extremely wide”, and the options for “How do you feel about the quality of community facilities” include a score of 1 as representing “extremely poor” and 5 representing “extremely good”.
In general, higher points illustrate the perception of more desirable elements. Because the statements for negative space are inverted in nature, these answers were reverse-coded to guarantee higher scores imply better environmental awareness of fewer unused areas.

3.3.3. Neighborhood Social Environment and Physical Activity

Social environment is a complex system including various sub-group elements. Indicative questions were screened from the previous studies to simplify the quantification process. In relevant research, social networks were a commonly explored section of the social environment [4], and were broadly defined as an individual’s connection among groups. This idea was frequently measured by the Social Networks Index (BSSNI) using four items [42], which could be simplified as “the familiarity degree between residents”. Another vital factor of social environment is social cohesion [4,17,38], the higher of which represents residents’ willingness to help as well as shared values and trust within communities [35]. Therefore, the most representative question, “neighbors’ willingness to help each other” [4], was extracted to roughly conceptualize this construct. Moreover, some researchers have claimed that social support, known as resources provided by others either in the way of emotional or financial support [4], could increase the likelihood of civic community engagement [43]. Thus, specific behaviors and attitudes relating to civic engagement were summarized to examine social support [43], which is “neighbors’ concerns degree towards communal environment and problems”. The responses connected with social environment were all measured on a 5-point scale.
If this study emphatically explored the intensity of individual physical activity, it is undisputed that this variable would be elaborately measured through mature scales such as International Physical Activity Questionnaire (IPAQ) [44], collecting the duration and frequency data of various types of physical activity in the last seven days or longer. However, this paper aims to preliminarily understand the possible role of “group physical activities participation” during the influencing process. Therefore, physical activity was estimated by a single question of “The number of people participate in physical activity within communities”, revealing interviewees’ general perception of dwellers’ physical activity status within their communities. The answers to this question fell into 5-point scale from 1 = very few to 5 = a great many.

4. Results

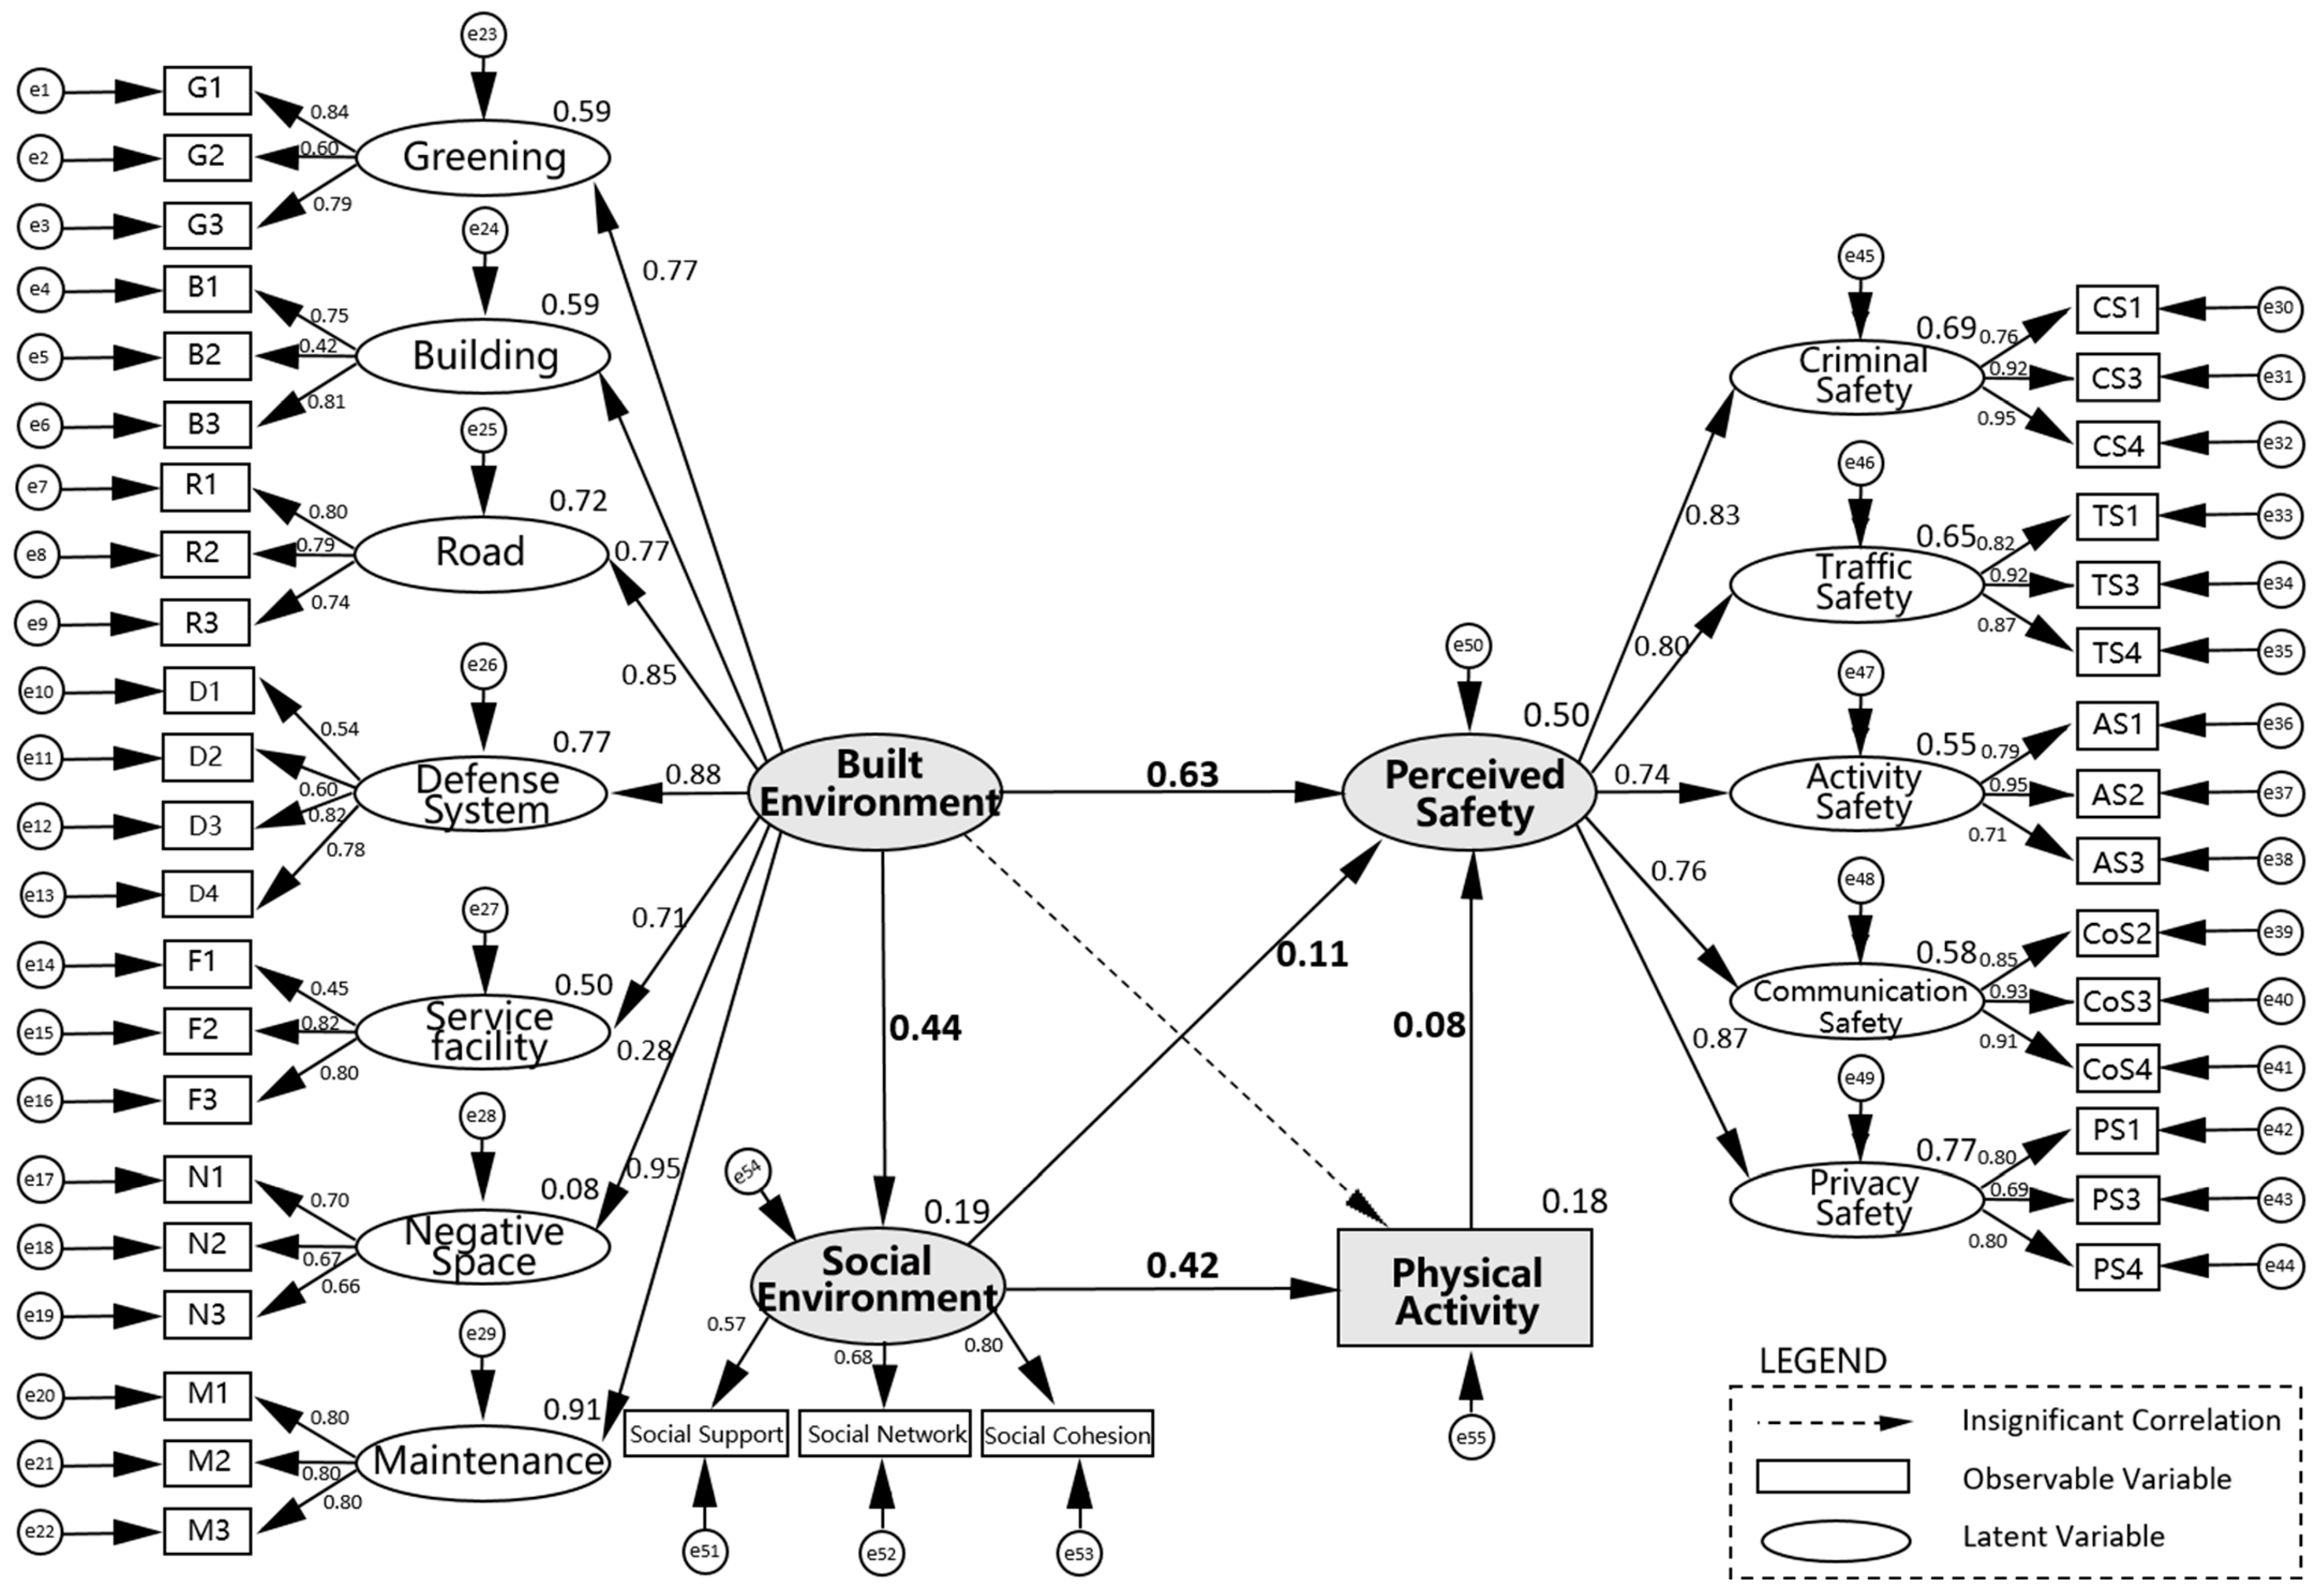
4.1. Structural Equation Model

Assumptions of normality were verified using the Skew and Kurtosis values, all of which were within the acceptable threshold of ±2 (Appendix A Table A1) [45]. Following this, a structural equation model (SEM) with maximum likelihood estimation was constructed to test our hypotheses using AMOS 23.0 (see Figure 4). In order to quantify variables more accurately, perceived safety was included in the SEM as a second-order measurement model, influenced by its five first-order dimensions defined as criminal safety, traffic safety, activity safety, communication safety and privacy safety. Similarly, the built environment was established as another second-order latent variable determined by seven first-order environmental elements: greening, buildings, roads, defense systems, service facilities, negative spaces and maintenance. While social environment was simplified as a first-order construct measured through three items, social network, social cohesion, social support, and physical activity was quantified as an observable variable by a single indicator.

4.2. Data Analysis

4.2.1. Preliminary Analysis

As an initial step before formal analysis, the Cronbach’s alpha and Kaiser–Meyer–Olkin (KMO) values were calculated to verify the internal reliability and sample adequacy of the data. These two indices were regarded as perfect with all Cronbach’s alpha values greater than 0.8 and KMO values higher than 0.9 [46].
Next, Confirmatory Factor Analysis (CFA) was performed for measurement model modification and assessment. First, the standardized factor loadings were analyzed, and elements with factor loadings lower than the recommended threshold of 0.5 [47] were eventually eliminated, which can be found in Appendix A Table A2. In the final measurement model, twenty-two built environment elements (twenty-four were initially considered) and fifteen observable items of perceived safety (twenty-three were initially considered) were retained (see Table 1). Furthermore, the indices of composite reliability (CR) and the convergent validity of average variance extracted (AVE) were tested. Table 1 also suggests that the value of CR coefficients for each latent variable exceeded the threshold criterion of 0.7. The majority of AVE scores were higher than 0.5 [46], indicating that the results satisfy the reasonable criterion, which also provides evidence that the five perceived safety variables significantly explained the construct of Perceived Safety. In addition, the goodness of fit of both the measurement models of perceived safety and built environment were assessed, and the results reveal good adjustment (Appendix A Table A3 and Table A4).
When fitting the collected dataset to the established model, the values of chi-square to the degree of freedom ratio (χ2/DF), comparative fit index (CFI), Tucker–Lewis index (TLI) and incremental fit index (IFI) were 2.56, 0.906, 0.901 and 0.907, respectively, satisfying the ideal criterion. Other indices, including goodness-of-fit index (GFI), adjusted goodness-of-fit index (AGFI) and root mean square error of approximation (RMSEA), also reached the acceptable standard. In general, as shown in Table 2, the structural equation model provides satisfactory goodness of fit to the dataset and indicates a good basis to explain the relationship between perceived safety and other variables.

4.2.2. Mediation Analyses

The SEM was established as shown in Figure 4. Table 3 displays the standardized coefficients of the path analysis, and positive associations were found between most of the variables. Specifically, the effect of the built environment on perceived safety revealed that favorable built-up environment could be a supporting factor in improving safety feelings. This influence path is highly significant considering the standardized coefficient is as high as 0.631 (SE = 0.096, p = ***). Similarly, favorable physical environment is also observed to influence the social environment, which implies that the social environment would be perceived to be better as the built-up environment condition improves within the research area. Meanwhile, the effect of the social environment on both the feeling of safety (β = 0.109, SE = 0.084, p = 0.041) and activity (β = 0.422, SE = 0.071, p = ***) are significant, suggesting that the interviewees with positive evaluations of their social environment may express greater safety feelings and raise the possibility for outdoor activities among groups. In addition, the results also indicate a positive statistical effect of activity perception on perceived safety; however, the influence effect is relatively weak with a standard coefficient of 0.082. No direct association was observed between selected elements of the built environment and residents’ activity attendance (β = −0.075, SE = 0.089, p = 0.395).
The statistical results support most of our expectations and demonstrate that the built environment’s influence on perceived safety is more than direct. The bootstrap method was further applied to verify whether the supposed mediated path is statistically significant based on 95% confidence intervals with a random sample of n = 5000 (Table 4). This analysis illustrated that all the confidence intervals do not cover the value of zero, proving that both the direct and mediated effects are significant. The established model has proven to be partial mediation.

5. Discussion

5.1. Idea of Perceived Safety

According to the literature review in Section 2.1, it was concluded that the definition of perceived safety is either vaguely articulated or sometimes directly replaced by the criminological idea of fear of crime. Although the idea necessarily encompasses judgment of crime [8], we clearly argue that perceived safety contains more subjective emotions than narrow crime-related attitudes, which express the state of being free from proximate threats.
This paper takes notice of the conceptual difference and mixed definition of perceived safety to remind future researchers that the gaps in existing studies weaken the findings and decrease the generalizability of the conclusions [20], leading to the definition of perceived safety serving as the research basis for relevant study [16,20]. We do not claim that the exploration of feeling of general safety is more valuable than crime-related emotions. However, it must be noted that perceived safety and fear of crime are closely connected while also mutually independent. Future research should distinguish the study subjects clearly, otherwise the confusion may also muddy the waters of crime research [16].

5.2. Direct Impact of Built and Social Environment, Physical Activity

As previous research has identified, our study also finds that built environmental factors play an important role in increasing or decreasing residents’ perceived safety, and the influence effect is highly significant. Discussing which specific physical features influence perceived safety and in which direction or to what extent are not the research goals of this paper. The combined findings still reveal that a neighborhood without comfortable, detailed design (including architecture and greenery), reasonable mobility (traffic fluency of insiders and limited access for outsiders) [9], as well as extended maintenance, is less likely to make inhabitants feel free from unclear menaces. Conversely, a place with lower uncertainty, such as wider walking paths, less negative spaces and better environmental quality, where residents could extensively observe the surroundings from a protected location, would provide higher levels of perceived safety to dwellers [48].
Existing research concentrates on more specific aspects of the social environment, such as social cohesion or social capital [4]. This study proves that generally desirable social environments are linked with higher perceived neighborhood safety. Riger [49] proposed that healthy social environments could prevent emotional stress from developing, the increase of which would pose a strong negative effect on perceived safety from a psychological level. Additionally, as Eduardo [19] has explained, favorable social environments may be viewed as a buffer to compensate for the lack of control over the environment. Residents with a positive sense of social environment may have adequate material and affective energy to support themselves, and the interchange process could provide ample sources and information to counteract the feelings of insecurity [32]. However, other studies mentioned that excessive information delivery may exacerbate the unsafe feeling, as frequent social interactions may increase fear by promoting communication about accidents [29]. The possibility that the influence of the social environment upon perceived safety may be non-linear, and negative effects may arise beyond a certain threshold. Therefore, the precise influence of the social environment and the proper level of information exchange is worth further in-depth study.
The positive role of group physical activities could be interpreted from different perspectives. On the one hand, the presence of people engaged in physical activity is a positive signal, serving as an effective way of Natural Surveillance that facilitates observation of intruders [1]. Residents may obtain more security in areas with confidence that there are more chances for people to intervene or report dangers, incivilities or accidents [50,51]. On the other hand, although groups rather than individuals were assessed in this study, it appears conclusive that sufficient exercise is conducive to personal psychological health, improving residents’ well-being [52]. Therefore, it is reasonable to estimate that daily activities may increase personal safety consciousness, as the safe sentiment is the premise for realizing higher emotional needs.

5.3. Indirect Role of Built Environment from Mediators

This paper also reveals the mediating role that the social environment and physical activity have played during the influencing process. The built environment exerts both direct and indirect effects upon perceived safety, suggesting that the environmental impact is more complicated than we thought. Favorable built environment of urban space is conducive to creating healthy social structural settings [17], and a place that encourages routine activities motivated by stronger social dynamic would be perceived as safer [1]. Therefore, separate elements of the built environment may also influence perceived safety in various paths. For example, high-quality pedestrian space could increase perceived safety directly [53], and an indirect influence, considering previous literature, may be that desirable road design will enhance a sense of community [54]. Similarly, well-maintained vegetation is observed to increase perceived safety as it brings a strong indication of professional management [17]. In addition, the positive effect of green space on providing an improved social atmosphere has also been extensively verified [1,55].
Nevertheless, the insignificant relationship between the built environment and physical activity does not imply contradiction to previous significant evidence. The model here suggests that heterogeneous environmental factors which contribute positively to emotional safety may not significantly influence the level of group physical activities. While other specific environment variables, such as aesthetics [56] and accessibility [57], which were widely documented in previous studies, may still appear as strong influencing factors on physical activity. This situation also reminds us that some unexpected environmental measures that do not directly influence perceived safety, may change it indirectly through increasing social ties or promoting exercise.

5.4. Mutual-Contradictory Causal Relationships

In some studies, safety has been regarded as the “reason” instead of the “result”. It was found that residents who perceive the environment to be safer tend to have a higher sense of belonging to the community [32], as well as a satisfactory assessment of the overall social environment [54]. Moreover, other research has shown that emotional responses to safe states have a modest effect on health behaviors [58], especially physical activity [32,59]. Relevant contexts suggest that when perceived safety is theoretically considered an independent variable, it is shown to be an essential factor in changing the level of social environment evaluation and influencing physical activity.
In contrast, our paper reveals that perceived safety relates to the evaluation of the social environment as well as group physical activity. By comparing existing conclusions and the results of this paper, as well as related supporting evidence, it is apparent that the results from various studies speak mainly in two mixed and contradictory streams. That is to say, the relationship between the built and social environment, physical activity, and perceived safety may be more complicated than we thought. While the cross-sectional data of this research, similar to most relevant experiments [18], limits the possibility of exploring the explicit two-way causality. Therefore, further studies may consider the possible bidirectional relationship, adopt more scientific methods, and propose more reasonable research designs.

6. Conclusions

This article expands the content of previous studies by including various safety domains to define the concept of perceived safety, which contains more information than reversed crime fear. On this basis, the relationship between perceived safety, the built environment, social environment and physical activity was investigated through a structural equation model. The results demonstrated that perceived safety is highly correlated with the built environment, and also significantly related to the social environment as well as physical activity to a lesser degree. Moreover, the built environment was observed to change perceived safety indirectly through the social environment and the level of group physical activities, revealing that the environmental impact could be slightly amplified via mediating variables, which also suggests that the influence of the built environment upon perceived safety may be underestimated in some existing studies.
The structural equation model assisted in understanding the significant moderation effect, and contributed to our knowledge on the potential pathways through which built environmental factors influence perceived safety, serving as a valuable complement to current literature to answer the ‘‘how’’ question. The findings reported here effectively acknowledge the necessity of environment optimization for designing a more reassuring place to contribute positively to a harmonious social atmosphere and encourage physical activity, which are beneficial to safety perception.

Author Contributions

Conceptualization, E.Z. and Y.D.; methodology, Y.D.; software, E.Z.; validation, E.Z., L.Y. and A.L.; formal analysis, E.Z.; investigation, L.Y. and A.L.; writing—original draft preparation, E.Z.; writing—review and editing, L.Y. and A.L.; visualization, E.Z.; funding acquisition, Y.D. All authors have read and agreed to the published version of the manuscript.

Funding

This project was funded by National Natural Science Foundation of China (Grant No. 52278057).

Institutional Review Board Statement

Not applicable.

Informed Consent Statement

Informed consent was obtained from all subjects involved in the study.

Data Availability Statement

The data displayed in this research are obtainable upon consent from the corresponding and the first author.

Acknowledgments

The authors greatly appreciate anonymous reviewers and editors for their insightful suggestions.

Conflicts of Interest

Authors declare no conflicts of interest.

Appendix A

Table A1. Assessment of normality.
VariableSkewKurtosis
Group Physical Activities−0.205−0.157
Social Support−0.380−0.101
Social Network−0.069−0.482
Social Cohesion0.080−0.213
PS 4−0.864−0.068
PS 3−0.667−0.647
PS 1−0.760−0.126
CS 4−0.8880.014
CS 3−0.797−0.179
CS 1−0.730−0.286
TS 4−0.456−0.704
TS 3−0.514−0.812
TS 1−0.378−0.948
AS 3−0.410−0.712
AS 2−0.411−0.710
AS 1−0.339−1.012
CS 4−0.8510.075
CS 3−0.728−0.166
CS 2−0.593−0.413
D4−0.332−0.519
D3−0.512−0.124
D20.005−0.162
D10.072−0.558
N3−0.382−0.040
N2−0.395−0.115
N1−0.3760.033
M3−0.5740.388
M2−0.336−0.360
M1−0.188−0.083
F30.169−0.415
F20.234−0.357
F1−0.259−0.701
G3−0.6520.311
G2−0.126−0.770
G1−0.437−0.609
B3−0.186−0.277
B2−0.0030.308
B1−0.165−0.270
R3−0.273−0.988
R2−0.529−0.121
R1−0.383−0.121
Table A2. Deleted Items and Possible Justification.
ConstructsItems/QuestionsReasoning for Low Factor Loading
Criminal
Safety
CS2: Feel afraid to do activity alone after 10:30 p.m.The vast majority of residents will not do activities in the public space within communities after 10:30 p.m.; therefore, it would be difficult for them to answer this question.
CS5: The security environment needs to be improved.Although some residents may feel a little scared when walking outside after 10:30 p.m., they are still satisfied with the security environment because they have low environmental expectations.
Traffic
Safety
TS2: Feel worried about the car being scratched while driving or parked.Residents usually park their cars in the underground parking at the community entrance instead of along the road or in the courtyard within the community. Therefore, residents are rarely worried about the condition of the car.
Activity
Safety
AS4: Feel worried about your young or old relatives when they do activity alone.Some interviewees live alone, therefore they have lower anxiety for relatives.
Communication SafetyCoS1: Feel uneasy when make eye contacts with unfamiliar people.China has high population density; therefore, residents are quite accustomed to coming across strangers.
CoS5: Feel afraid when unfamiliar people knocks on the door. Sometimes the neighborhood committee will visit the family; therefore, residents generally will not feel scared when someone they do not know knocks on the door.
Privacy
Safety
PS2: Deliveries to the community will not have real names written on them.Most residents in China do not care about this issue (the exposure of real name) compared with people from other cultural backgrounds.
PS5: Always keep the curtains closed at home during the day.The vast majority of residents prefer to open the curtains because they would like to open the windows for better ventilation, which is a common practice in Chinese families.
Defense
System
D5: Anti-theft fencesThe installation of anti-theft fences is strictly forbidden by some management offices; therefore, the situation could not offer enough information.
D6: Sight permeability Some interviewees could not accurately understand the term “permeability”.
Table A3. CFA fit indices of perceived safety measurement model.
Fit IndexAcceptable CriterionIdeal CriterionModel Fit StatisticsModel Evaluation
CMIN/DF<5<33.479Acceptable
GFI>0.8>0.90.936Ideal
AGFI>0.8>0.90.904Ideal
NFI>0.8>0.90.956Ideal
IFI>0.8>0.90.968Ideal
TLI>0.8>0.90.958Ideal
CFI>0.8>0.90.968Ideal
RMSEA<0.08<0.050.068Acceptable
Table A4. CFA fit indices of built environment measurement model.
Fit IndexAcceptable CriterionIdeal CriterionModel Fit StatisticsModel Evaluation
CMIN/DF<5<32.956Ideal
GFI>0.8>0.90.913Ideal
AGFI>0.8>0.90.883Acceptable
NFI>0.8>0.90.899Acceptable
IFI>0.8>0.90.931Ideal
TLI>0.8>0.90.930Ideal
CFI>0.8>0.90.930Ideal
RMSEA<0.08<0.050.061Acceptable

References

  1. Mouratidis, K. The impact of urban tree cover on perceived safety. Urban For. Urban Green. 2019, 44, 126434. [Google Scholar] [CrossRef]
  2. Macintyre, S.; Ellaway, A. Ecological Approaches: Rediscovering the Role of the Physical and Social Environment. Soc. Epidemiol. 2000, 9, 332–348. [Google Scholar]
  3. Chandola, T. The fear of crime and area differences in health. Health Place 2001, 7, 105–116. [Google Scholar] [CrossRef] [PubMed]
  4. Baum, F.E.; Ziersch, A.M.; Zhang, G.; Osborne, K. Do perceived neighbourhood cohesion and safety contribute to neighbourhood differences in health? Health Place 2009, 15, 925–934. [Google Scholar] [CrossRef] [PubMed]
  5. Møller, V. Resilient or Resigned? Criminal victimisation and quality of life in South Africa. Soc. Indic. Res. 2005, 72, 263–317. [Google Scholar] [CrossRef]
  6. He, B.J.; Zhao, D.; Dong, X.; Zhao, Z.; Li, L.; Duo, L.; Li, J. Will individuals visit hospitals when suffering heat-related illnesses? Yes, but…. Build. Environ. 2022, 208, 108587. [Google Scholar] [CrossRef]
  7. Innes, M.; Jones, V. Neighbourhood Security and Urban Change: Risk, Resilience and Recovery; Joseph Rowntree Foundation: York, UK, 2006; p. 70. Available online: https://citeseerx.ist.psu.edu/document?repid=rep1&type=pdf&doi=a5a4bb832c9ec06a3ac93f16292d360d9a355b98. (accessed on 1 November 2022).
  8. Wang, R.; Yuan, Y.; Liu, Y.; Zhang, J.; Liu, P.; Lu, Y.; Yao, Y. Using street view data and machine learning to assess how perception of neighborhood safety influences urban residents’ mental health. Health Place 2019, 59, 102186. [Google Scholar] [CrossRef]
  9. Makinde, O.O. The correlates of residents’ perception of safety in gated communities in Nigeria. Soc. Sci. Humanit. Open 2020, 2, 100018. [Google Scholar] [CrossRef]
  10. Shach-Pinsly, D. Measuring security in the built environment: Evaluating urban vulnerability in a human-scale urban form. Landsc. Urban Plan. 2019, 191, 103412. [Google Scholar] [CrossRef]
  11. Cozens, P.M.; Saville, G.; Hillier, D. Crime prevention through environmental design (CPTED): A review and modern bibliography. Prop. Manag. 2005, 23, 328–356. [Google Scholar] [CrossRef] [Green Version]
  12. Saville, G.; Cleveland, G. 2nd Generation CPTED: An Antidote to the Social Y2K Virus of Urban Design. In Proceedings of the International CPTED Association Conference, Washington, DC, USA, December 1998; pp. 3–5. [Google Scholar]
  13. Branas, C.C.; South, E.; Kondo, M.C.; Hohl, B.C.; Bourgois, P.; Wiebe, D.J.; MacDonald, J.M. Citywide cluster randomized trial to restore blighted vacant land and its effects on violence, crime, and fear. Proc. Natl. Acad. Sci. USA 2018, 115, 2946–2951. [Google Scholar] [CrossRef]
  14. Rišová, K.; Sládeková Madajová, M. Gender differences in a walking environment safety perception: A case study in a small town of Banská Bystrica (Slovakia). J. Transp. Geogr. 2020, 85, 102723. [Google Scholar] [CrossRef]
  15. Jansson, M.; Fors, H.; Lindgren, T.; Wiström, B. Perceived personal safety in relation to urban woodland vegetation–A review. Urban For. Urban Green 2013, 12, 127–133. [Google Scholar] [CrossRef] [Green Version]
  16. Hinkle, J.C. Emotional Fear of Crime vs. Perceived Safety and Risk: Implications for Measuring “Fear” and Testing the Broken Windows Thesis. Am. J. Crim. Justice 2015, 40, 147–168. [Google Scholar] [CrossRef]
  17. Jiang, B.; Mak, C.N.S.; Zhong, H.; Larsen, L.; Webster, C.J. From broken windows to perceived routine activities: Examining impacts of environmental interventions on perceived safety of urban alleys. Front. Psychol. 2018, 9, 2450. [Google Scholar] [CrossRef]
  18. Rees-Punia, E.; Hathaway, E.D.; Gay, J.L. Crime, Perceived Safety, and Physical Activity: A Meta-Analysis. Preventive Medicine; Academic Press Inc: Cambridge, MA, USA, 2018. [Google Scholar] [CrossRef]
  19. Wills, E. Encyclopedia of Quality of Life and Wellbeing Research; Springer: Berlin/Heidelberg, Germany, 2014; pp. 2233–2235. [Google Scholar]
  20. Odufuwa, B.; Badiora, A.I.; Olaleye, D.O.; Akinlotan, P.A.; Adebara, T.M. Perceived personal safety in built environment facilities: A Nigerian case study of urban recreation sites. J. Outdoor Recreat. Tour. 2019, 25, 24–35. [Google Scholar] [CrossRef]
  21. Won, J.; Lee, C.; Forjuoh, S.N.; Ory, M.G. Neighborhood safety factors associated with older adults’ health-related outcomes: A systematic literature review. Social Sci. Med. 2016, 165, 177–186. [Google Scholar] [CrossRef]
  22. Warr, M. Fear of crime in the United States: Avenues for policy and research. In Measurement and Analysis of Crime and Justice; US Department of Justice, Office of Justice Programs: Washington, DC, USA, 2000; Volume 4, pp. 451–489. [Google Scholar]
  23. Wood, L.; Shannon, T.; Bulsara, M.; Pikora, T.; McCormack, G.; Giles-Corti, B. The anatomy of the safe and social suburb: An exploratory study of the built environment, social capital and residents’ perceptions of safety. Health Place 2008, 14, 15–31. [Google Scholar] [CrossRef]
  24. Lis, A.; Anwajler, K. Privacy in public places. Landsc. Archit. 2014, 42, 4–19. Available online: http://architekturakrajobrazu.up.wroc.pl/2014/23-2014/151-1-2014a. (accessed on 1 November 2022).
  25. Atkinson, R.; Flint, J. Fortress UK? Gated communities, the spatial revolt of the elites and time-space trajectories of segregation. Hous. Stud. 2004, 19, 875–892. [Google Scholar] [CrossRef] [Green Version]
  26. Jorgensen, L.J.; Ellis, G.D.; Ruddell, E. Fear perceptions in public parks: Interactions of environmental concealment, the presence of people recreating, and gender. Environ. Behav. 2013, 45, 803–820. [Google Scholar] [CrossRef]
  27. Baran, P.K.; Tabrizian, P.; Zhai, Y.; Smith, J.W.; Floyd, M.F. An exploratory study of perceived safety in a neighborhood park using immersive virtual environments. Urban For. Urban Green. 2018, 35, 72–81. [Google Scholar] [CrossRef]
  28. Timperio, A.; Veitch, J.; Carver, A. Safety in numbers: Does perceived safety mediate associations between the neighborhood social environment and physical activity among women living in disadvantaged neighborhoods? Prev. Med. 2015, 74, 49–54. [Google Scholar] [CrossRef] [PubMed] [Green Version]
  29. Lorenc, T.; Clayton, S.; Neary, D.; Whitehead, M.; Petticrew, M.; Thomson, H.; Renton, A. Crime, fear of crime, environment, and mental health and wellbeing: Mapping review of theories and causal pathways. Health Place 2012, 18, 757–765. [Google Scholar] [CrossRef] [PubMed]
  30. Koohsari, M.J.; Nakaya, T.; McCormack, G.R.; Shibata, A.; Ishii, K.; Yasunaga, A.; Oka, K. Traditional and novel walkable built environment metrics and social capital. Landsc. Urban Plan. 2021, 214, 104184. [Google Scholar] [CrossRef]
  31. Hong, J.; Chen, C. The role of the built environment on perceived safety from crime and walking: Examining direct and indirect impacts. Transportation 2014, 41, 1171–1185. [Google Scholar] [CrossRef]
  32. Allik, M.; Kearns, A. “There goes the fear”: Feelings of safety at home and in the neighborhood: The role of personal, social, and service factors. J. Community Psychol. 2017, 45, 543–563. [Google Scholar] [CrossRef] [Green Version]
  33. Furr-Holden, C.D.M.; Lee, M.H.; Milam, A.J.; Johnson, R.M.; Lee, K.S.; Ialongo, N.S. The growth of neighborhood disorder and marijuana use among urban adolescents: A case for policy and environmental interventions. J. Stud. Alcohol Drugs 2011, 72, 371–379. [Google Scholar] [CrossRef] [Green Version]
  34. Wilson-Doenges, G. An exploration of sense of community and fear of crime in gated communities. Environ. Behav. 2020, 32, 597–611. [Google Scholar] [CrossRef]
  35. Abdullah, A.; Marzbali, M.H.; Bahauddin, A.; Tilaki, M.J.M. Broken windows and collective efficacy: Do they affect fear of crime? SAGE Open 2015, 5, 1–11. Available online: https://journals.sagepub.com/doi/pdf/10.1177/2158244014564361 (accessed on 1 November 2022). [CrossRef]
  36. Lis, A.; Krzeminska, A. Social control as an indicator of safety in residential neighborhoods in western societies and China. Landsc. Archit. 2013, 3, 4–15. Available online: http://architekturakrajobrazu.up.wroc.pl/ (accessed on 1 November 2022).
  37. Baum, F.; Palmer, C. “Opportunity structures”: Urban landscape, social capital and health promotion in Australia. Health Promot. Int. 2002, 17, 351–361. [Google Scholar] [CrossRef] [Green Version]
  38. Aliyasa, Z. Does social environment mediate the association between perceived safety and physical activity among adults living in low socioeconomic neighborhoods? J. Transp. Health 2019, 14, 100578. [Google Scholar] [CrossRef]
  39. Ingram, M.; Adkins, A.; Hansen, K.; Cascio, V.; Somnez, E. Sociocultural perceptions of walkability in Mexican American neighborhoods: Impications for policy and practice. J. Transport. Health 2017, 7, 172–180. [Google Scholar] [CrossRef] [Green Version]
  40. Hamama, B.; Liu, J. What is beyond the edges? Gated communities and their role in China’s desire for harmonious cities. City Territ. Archit. 2020, 7, 13. [Google Scholar] [CrossRef]
  41. Cerin, E.; Saelens, B.E.; Sallis, J.F.; Frank, L.D. Neighborhood environment walkability scale: Validity and development of a short form. Med. Sci. Sport. Exerc. 2006, 38, 1682–1691. [Google Scholar] [CrossRef] [Green Version]
  42. Berkman, L.F.; Syme, S.L. Social networks, host resistance, and mortality: A nine-year follow-up study of Alameda County residents. Am. J. Epidemiol. 1979, 109, 186–204. [Google Scholar] [CrossRef]
  43. Acedo, A.; Oliveira, T.; Naranjo-Zolotov, M.; Painho, M. Place and city: Toward a geography of engagement. Heliyon 2019, 5, e02261. [Google Scholar] [CrossRef] [Green Version]
  44. Craig, C.L.; Marshall, A.L.; Sjöström, M.; Bauman, A.E.; Booth, M.L.; Ainsworth, B.E.; Oja, P. International physical activity questionnaire: 12-Country reliability and validity. Med. Sci. Sport. Exerc. 2003, 35, 1381–1395. [Google Scholar] [CrossRef] [Green Version]
  45. Ryu, E. Effects of skewness and kurtosis on normal-theory based maximum likelihood test statistic in multilevel structural equation modeling. Behav. Res. Methods 2011, 43, 1066–1074. [Google Scholar] [CrossRef] [PubMed] [Green Version]
  46. Halkos, G.; Leonti, A.; Sardianou, E. Activities, motivations and satisfaction of urban parks visitors: A structural equation modeling analysis. Econ. Anal. Policy 2021, 70, 502–513. [Google Scholar] [CrossRef]
  47. Hair, J.F., Jr.; Black, W.C.; Babin, B.J.; Anderson, R.E. Multivariate Data Analysis, Upper Saddle River, 7th ed.; Pearson Education Limited: Hoboken, NJ, USA, 2009; p. 761. [Google Scholar]
  48. Hur, M.; Nasar, J.L. Physical upkeep, perceived upkeep, fear of crime and neighborhood satisfaction. J. Environ. Psychol. 2014, 38, 186–194. [Google Scholar] [CrossRef]
  49. Riger, S.; Lavrakas, P.J. Community ties: Patterns of attachment and social interaction in urban neighborhoods. Am. J. Community Psychol. 1981, 9, 55–66. [Google Scholar] [CrossRef]
  50. Foster, S.; Giles-Corti, B.; Knuiman, M. Creating safe walkable streetscapes: Does house design and upkeep discourage incivilities in suburban neighbourhoods? J. Environ. Psychol. 2011, 31, 79–88. [Google Scholar] [CrossRef]
  51. Zhang, G.; He, B.J. Towards green roof implementation: Drivers, motivations, barriers and recommendations. Urban Forestry and Urban Greening; Elsevier GmbH: Amsterdam, The Netherlands, 2021. [Google Scholar] [CrossRef]
  52. Thomas, J.; Thirlaway, K.; Bowes, N.; Meyers, R. Effects of combining physical activity with psychotherapy on mental health and well-being: A systematic review. J. Affect. Disorders. 2020, 265, 475–485. [Google Scholar] [CrossRef]
  53. Zeng, E.; Dong, Y.; Li, F.; Che, L. The Impact of Built Environment Characteristics on Perceived Safety of City Dwellers: A Case Study in Mianyang (China). In Proceedings of the 57th ISOCARP World Planning Congress, Doha, Qatar, 8–11 November 2021; pp. 970–981. [Google Scholar]
  54. Lund, H. Pedestrian environments and sense of community. J. Plan. Educ. Res. 2002, 21, 301–312. [Google Scholar] [CrossRef]
  55. Kondo, M.C.; Fluehr, J.M.; McKeon, T.; Branas, C.C. Urban green space and its impact on human health. Int. J. Environ. Res. Public Health. 2018, 15, 445. [Google Scholar] [CrossRef] [PubMed] [Green Version]
  56. Koohsari, M.J.; Mavoa, S.; Villianueva, K.; Sugiyama, T.; Badland, H.; Kaczynski, A.T.; Giles-Corti, B. Public open space, physical activity, urban design and public health: Concepts, methods and research agenda. Health Place 2015, 33, 75–82. [Google Scholar] [CrossRef] [Green Version]
  57. An, R.; Shen, J.; Yang, Q.; Yang, Y. Impact of built environment on physical activity and obesity among children and adolescents in China: A narrative systematic review. J. Sport Health Sci. 2019, 8, 153–169. [Google Scholar] [CrossRef]
  58. Foster, S.; Giles-Corti, B. The built environment, neighborhood crime and constrained physical activity: An exploration of inconsistent findings. Prev. Med. 2008, 47, 241–251. [Google Scholar] [CrossRef]
  59. Aliyas, Z. Why some walk and others don’t: Neighborhood safety and the sociodemographic variation effect on walking for leisure and transportation. J. Public Health Manag. Pract. 2019, 26, 24–32. [Google Scholar] [CrossRef]
Figure 1. Elementary framework: the independent relationship between determinants and perceived safety.
Buildings 13 00002 g001
Figure 2. Complete framework: the integrated relationship between determinants and perceived safety with mediators.
Buildings 13 00002 g002
Figure 3. Distribution of surveyed communities in Mianyang. Note: The 13 dots in the figure represent the location of the selected communities in the main urban area of Mianyang.
Buildings 13 00002 g003
Figure 4. Structural equation model of built environment, social environment, physical activity and perceived safety (N = 535). Note: Full line paths show the statistically significant associations between factors at 95% significant level and the standardized coefficients. Table 1 shows the full names of variables.
Buildings 13 00002 g004
Table 1. Factor loadings of selective items in CFA and reliability-validity analyses.
Second-Order Formative ConstructFirst-Order Reflective ConstructsItems/QuestionsStandardized
Path
Coefficients
SMCCRAVE
Std.
Perceived
Safety
Criminal
Safety
CS1:Feel afraid to go out alone after 10:30 p.m.0.780.6080.9160.786
CS3:Feel worried about property safety.0.9030.815
CS4: Feel worried about personal security.0.9660.933
Traffic
Safety
TS1: Fear of being hit by other objects (people/vehicles) while walking.0.7520.5660.8790.710
TS3: It is difficult to feel completely relaxed on the way home from the communal border.0.8980.806
TS4: Need to pay attention to the surroundings on the way home from the communal border.0.8720.760
Activity
Safety
AS1: It is difficult to feel completely relaxed during activities (such as exercise or walking).0.770.5930.8480.653
AS2: Feel a lack of control over yourself during activities.0.9230.852
AS3: Fear of slipping, tripping, and falling objects during activities.0.7170.514
Communication SafetyCoS2: Feel nervous when unfamiliar people get closer to you within communities.0.840.7060.9280.812
CoS3: Feel uneasy when unfamiliar people ask you questions within communities.0.9430.889
CoS4: Feel uneasy when chatting with unfamiliar people within communities.0.9160.839
Privacy
Safety
PS1: Feel nervous about being noticed.0.820.6720.8090.587
PS3: Feel difficult to find personal space thus feel reluctant to stay in the community.0.6740.454
PS4: Always rush through the communal spaces with heads down.0.7980.637
Built EnvironmentGreeningG1:Area0.8590.7380.7920.564
G2:Shadow0.5960.355
G3:Flourishing degree0.7740.599
BuildingsB1:Interval0.740.5480.7090.463
B2:Volume0.4290.184
B3:Enclosed space0.8110.658
RoadsR1:Footpath width0.7950.6320.8220.606
R2:Road patency0.7870.619
R3:Road zoning0.7520.566
Defense
Systems
D1:Night lighting0.5460.2980.7840.483
D2:Electronic monitoring equipment0.6080.370
D3:Access control of the community0.8130.661
D4:Access control of the cell gate0.7760.602
Service
Facilities
F1:Number of facilities for service0.4470.2000.7420.505
F2:Area of facilities0.8260.682
F3:Number of facilities for activities0.7950.632
Negative
Spaces
N1:Dead angle0.6940.4820.7190.460
N2:Vacant houses0.670.449
N3:Empty public area0.6710.450
MaintenanceM1:Public facilities0.7970.6350.8410.638
M2:Ground pavement0.8010.642
M3:Cleanliness0.7980.637
Table 2. Model fit indices.
Model Fit IndexAcceptable CriterionIdeal CriterionModel Fit StatisticsModel Evaluation
χ2/DF<5<32.567Ideal
IFI>0.8>0.90.907Ideal
TLI>0.8>0.90.901Ideal
CFI >0.8>0.90.906Ideal
GFI>0.8>0.90.841Acceptable
AGFI>0.8>0.90.821Acceptable
RMSEA<0.08<0.050.054Acceptable
Table 3. Standardized coefficients of SEM.
PathStandardized CoefficientsStandard Error (S.E.)Critical Ratio
(C.R.)
p
Built Environment → Perceived Safety0.6310.09610.444***
Built Environment → Social Environment0.440.0558.073***
Social Environment → Perceived Safety0.1090.0842.0440.041(*)
Social Environment → Physical Activity0.4220.0718.387***
Physical Activity → Perceived Safety0.0820.0462.0010.045(*)
Note: *** p < 0.001, ** p < 0.01, * p < 0.05.
Table 4. Bootstrap analysis of mediated effects.
Influence PathEffectStandardized
Effect
95% Confidence Intervals
(Bootstrap n = 5000)
Type
Lower LevelUpper Level
Built Environment → Social Environment → Physical Activity → Perceived SafetyTotal0.6940.6220.761Partial-mediation
Direct0.6310.5290.722
Indirect0.0630.0150.138
Disclaimer/Publisher’s Note: The statements, opinions and data contained in all publications are solely those of the individual author(s) and contributor(s) and not of MDPI and/or the editor(s). MDPI and/or the editor(s) disclaim responsibility for any injury to people or property resulting from any ideas, methods, instructions or products referred to in the content.

