
Behavior of Waste Glass Powder in Concrete Deep Beams with Web Openings

1
Civil Construction Technology Department, Faculty of Technology and Education, Beni-Suef University, Beni Suef 62511, Egypt
2
Department of Civil and Environmental Engineering, Incheon National University, Incheon 22012, Korea
3
Incheon Disaster Prevention Research Center, Incheon National University, Incheon 22012, Korea
4
Civil Engineering Department, Shoubra Faculty of Engineering, Benha University, Benha 13511, Egypt
5
Faculty of Engineering, Delta University for Science and Technology, Gamasa 35712, Egypt
*
Author to whom correspondence should be addressed.
Buildings 2022, 12(9), 1334; https://doi.org/10.3390/buildings12091334
Submission received: 11 July 2022
/
Revised: 22 August 2022
/
Accepted: 25 August 2022
/
Published: 30 August 2022
(This article belongs to the Collection Advanced Concrete Materials in Construction)
Abstract
:Waste Glass Powder (WGP) could be used as a cement replacement additive to manufacture concrete and solving the problem of environmental pollution. The experimental program was made up of ten simply supported reinforced High-Strength Concrete (HSC) deep beams tested under static loadings. Five beams were with WGP, while the other five beams were without WGP. Eight beams had web openings while two reference beams were without openings. The principal studied parameters were the effect of using WGP, and the location and size of web openings. Using the three-dimensional finite element computer program ABAQUS, a numerical simulation for comparing the shear strength and behavior of tested deep beams has been suggested. The comparison between experimental failure loads of studied beams with that estimated by the Strut-and-Tie model was carried out. Three codes of practice were used to make this comparison: the American Concrete Institute (ACI 318-19), the New Zealand Code (NZS-06), and the Japan Society of Civil Engineering (JSCE-07). The results showed that using WGP in similar deep beams with web openings enhances the cracking shear strength (by about 17–25%) and the ultimate shear strength (by about 12–41%). The improvement in the ultimate failure load could be attributed to the developed concrete microstructures caused by WGP’s very fine grains, producing further gel, and decreasing the number of voids in the concrete matrix. The suggested finite element simulation accurately predicts the behavior of HSC deep beams with and without WGP beams and with web openings.
1. Introduction
Waste glass powder (WGP) is produced from crushing and grinding glass waste. WGP could be used as a cement replacement additive to manufacture concrete, solving the problem of environmental pollution. WGP is a modern and hopeful eco-supplementary cement replacement material that can enhance concrete behavior [1,2,3]. The impact of using WGP to partially substitute cement on concrete compressive strength, modulus of elasticity, and creep have been investigated [4]. The main studied variable was the WGP weight ratios as a replacement of cement (0%, 10%, 20%, and 30%).
The results revealed that the use of WGP content less than or equal to 20% increases the compressive strength, increases elastic modulus, and decreases the creep strain of concrete at late ages. The application of glass powder with a suitable content can successfully enhance the concrete internal microstructure and increase the content of high-density calcium silicate hydrate at later ages. This could be ascribed to the influence of the micro filler and the pozzolanic reaction of the glass powder. It was determined that 20% WGP was the ideal ratio to obtain the highest concrete compressive strength at age of 3 months, when the concrete compressive strength was increased by about 6% compared to specimens without WGP. In a similar experimental study [5], the results showed that concrete produced with glass powder (GP) as cement replacement exhibited an enhancement in compressive and flexural strengths compared to 0% GP concrete at 91 days due to increased microstructure enhancement from the pozzolanic property of GP. The concrete compressive strength was increased by about 21% when using a GP of 20%. The same finding with respect to the durability of WGP concrete has been emphasized [6]. The enhancement in durability was attributed to the advanced microstructures caused by WGP, especially at the interfacial transition zone. The same conclusion was recognized in another empirical study [7], where it was found that GP significantly decreases the chloride permeability of concrete. In another investigation [8], the results exhibited that the optimal concrete compressive strength was attained by using a 20% GP replacement at age three months where the compressive strength was increased by about 11%. In a similar investigation [9], when 20% of the cement in the concrete was replaced with GP, the compressive strength of the concrete increased by 27%. In a similar empirical investigation [10], it was highlighted that 15% GP was the best ratio among other cement replacement ratios, where the increase of concrete compressive strength was about 31% compared to 0% GP concrete at late ages (56 and 90 days). This was attributed to the pozzolanic activity of GP’s very fine grains that react with calcium hydroxide, producing further gel and decreasing the number of voids in the concrete matrix. In another study [11], it was found that concrete compressive strength with 20% GP exhibited the highest value, 24% greater than that of 0% GP at age three months, and the concrete flexural strength improved by 17%. In addition, it was found that [12] when replacing cement with 10% WGP, the increase in concrete compressive, tensile, and flexural strengths were 16.56%, 7.16%, and 6.57%, respectively. However, in another experimental study [13], the results showed that concrete constructed with 20% replacement of cement with WGP gave slightly higher compressive strength, by 2%, than the control concrete at age 90 days. The structural flexural behavior of reinforced concrete beams constructed with partial replacement of cement by WGP was experimentally investigated [14]. It was found that reinforced concrete beams having WGP exhibited good resistance, acceptable flexural performance, and improved strength capacity compared to beams without WGP. The results revealed that the ultimate load of 10% and 15% WGP beams were higher than that of the control beam by about 18.25% and 26.5%, respectively. Deep beams, which have a relatively small span-to-depth ratio, are commonly employed as a transfer girder in high-rise buildings. In some cases, web openings are needed to implement some utilities. Experimental research has been carried out on the behavior of reactive powder concrete deep beams with openings externally bonded by carbon fiber reinforced polymer strips [15]. The findings revealed that the ultimate strength of the tested deep beams with openings increased by 11%–94% compared to non-strengthened specimens. The tests have been recorded on reinforced High-Strength Concrete (HSC with fc′ > 50 MPa) deep beams with web openings [16,17,18,19] but the effect of using WGP on the behavior of HSC deep beams is limited. The capacity of reinforced concrete deep beams with openings subjected to various loads and boundary conditions has been predicted using the STM methodology [20]. It was concluded that the STM provides a satisfactory decrease bound assessment of the deep beams with openings’ load carrying capacity. The openings also have a considerable impact on the stress paths, creating zones of tension strains at the top and lower corners of the opening.
The main objective of the current work is to experimentally investigate the structural behavior of HSC deep beams with and without WGP in addition to the web opening effect. The principal studied parameters were the effect of using WGP, and the location and size of web openings. Using three-dimensional finite element computer software ABAQUS [21], a numerical simulation for comparing the shear strength of deep beams was suggested. The comparison between experimental failure loads of studied beams with that estimated by the Strut-and-Tie model was carried out. Three codes of practice were used to make this comparison: the American Concrete Institute “ACI 318-19” [22], the New Zealand Code “NZS-06” [23], and the Japan Society of Civil Engineering “JSCE-07” [24].
2. The Technique for Designing STM for a Beam with and without Openings
The main parts of the STM are the concrete as strut members, the reinforcement as tie members, and the nodal zones. When actual stress exceeds the member’s maximum stress limit, the member will fail. The approach to the development of the STM for a beam with openings is demonstrated as. First. getting external reactions and then adopting the load path principle.
3. Material Strengths in the STM Model for the Studied International Codes
Table 1 shows the computation of the effective compressive strength of the concrete in a strut fces for the studied international codes. The nominal compressive force of a strut, Fns, is estimated as:
where Acs is the strut cross-section area. The effective compressive strength of concrete in a nodal zone fcen is calculated as shown in Table 2 for the studied international codes. The nominal compressive force of a nodal zone, Fnn, is calculated as:
where Anz is the area of each face of the nodal zone. Finally, Table 3 describes the calculation of the nominal tensile force of a tie, Fnt, according to the studied international codes.
Fns = fcesAcs
Fnn = fcen Anz
4. Experimental Program
4.1. Tested Deep Beams Details
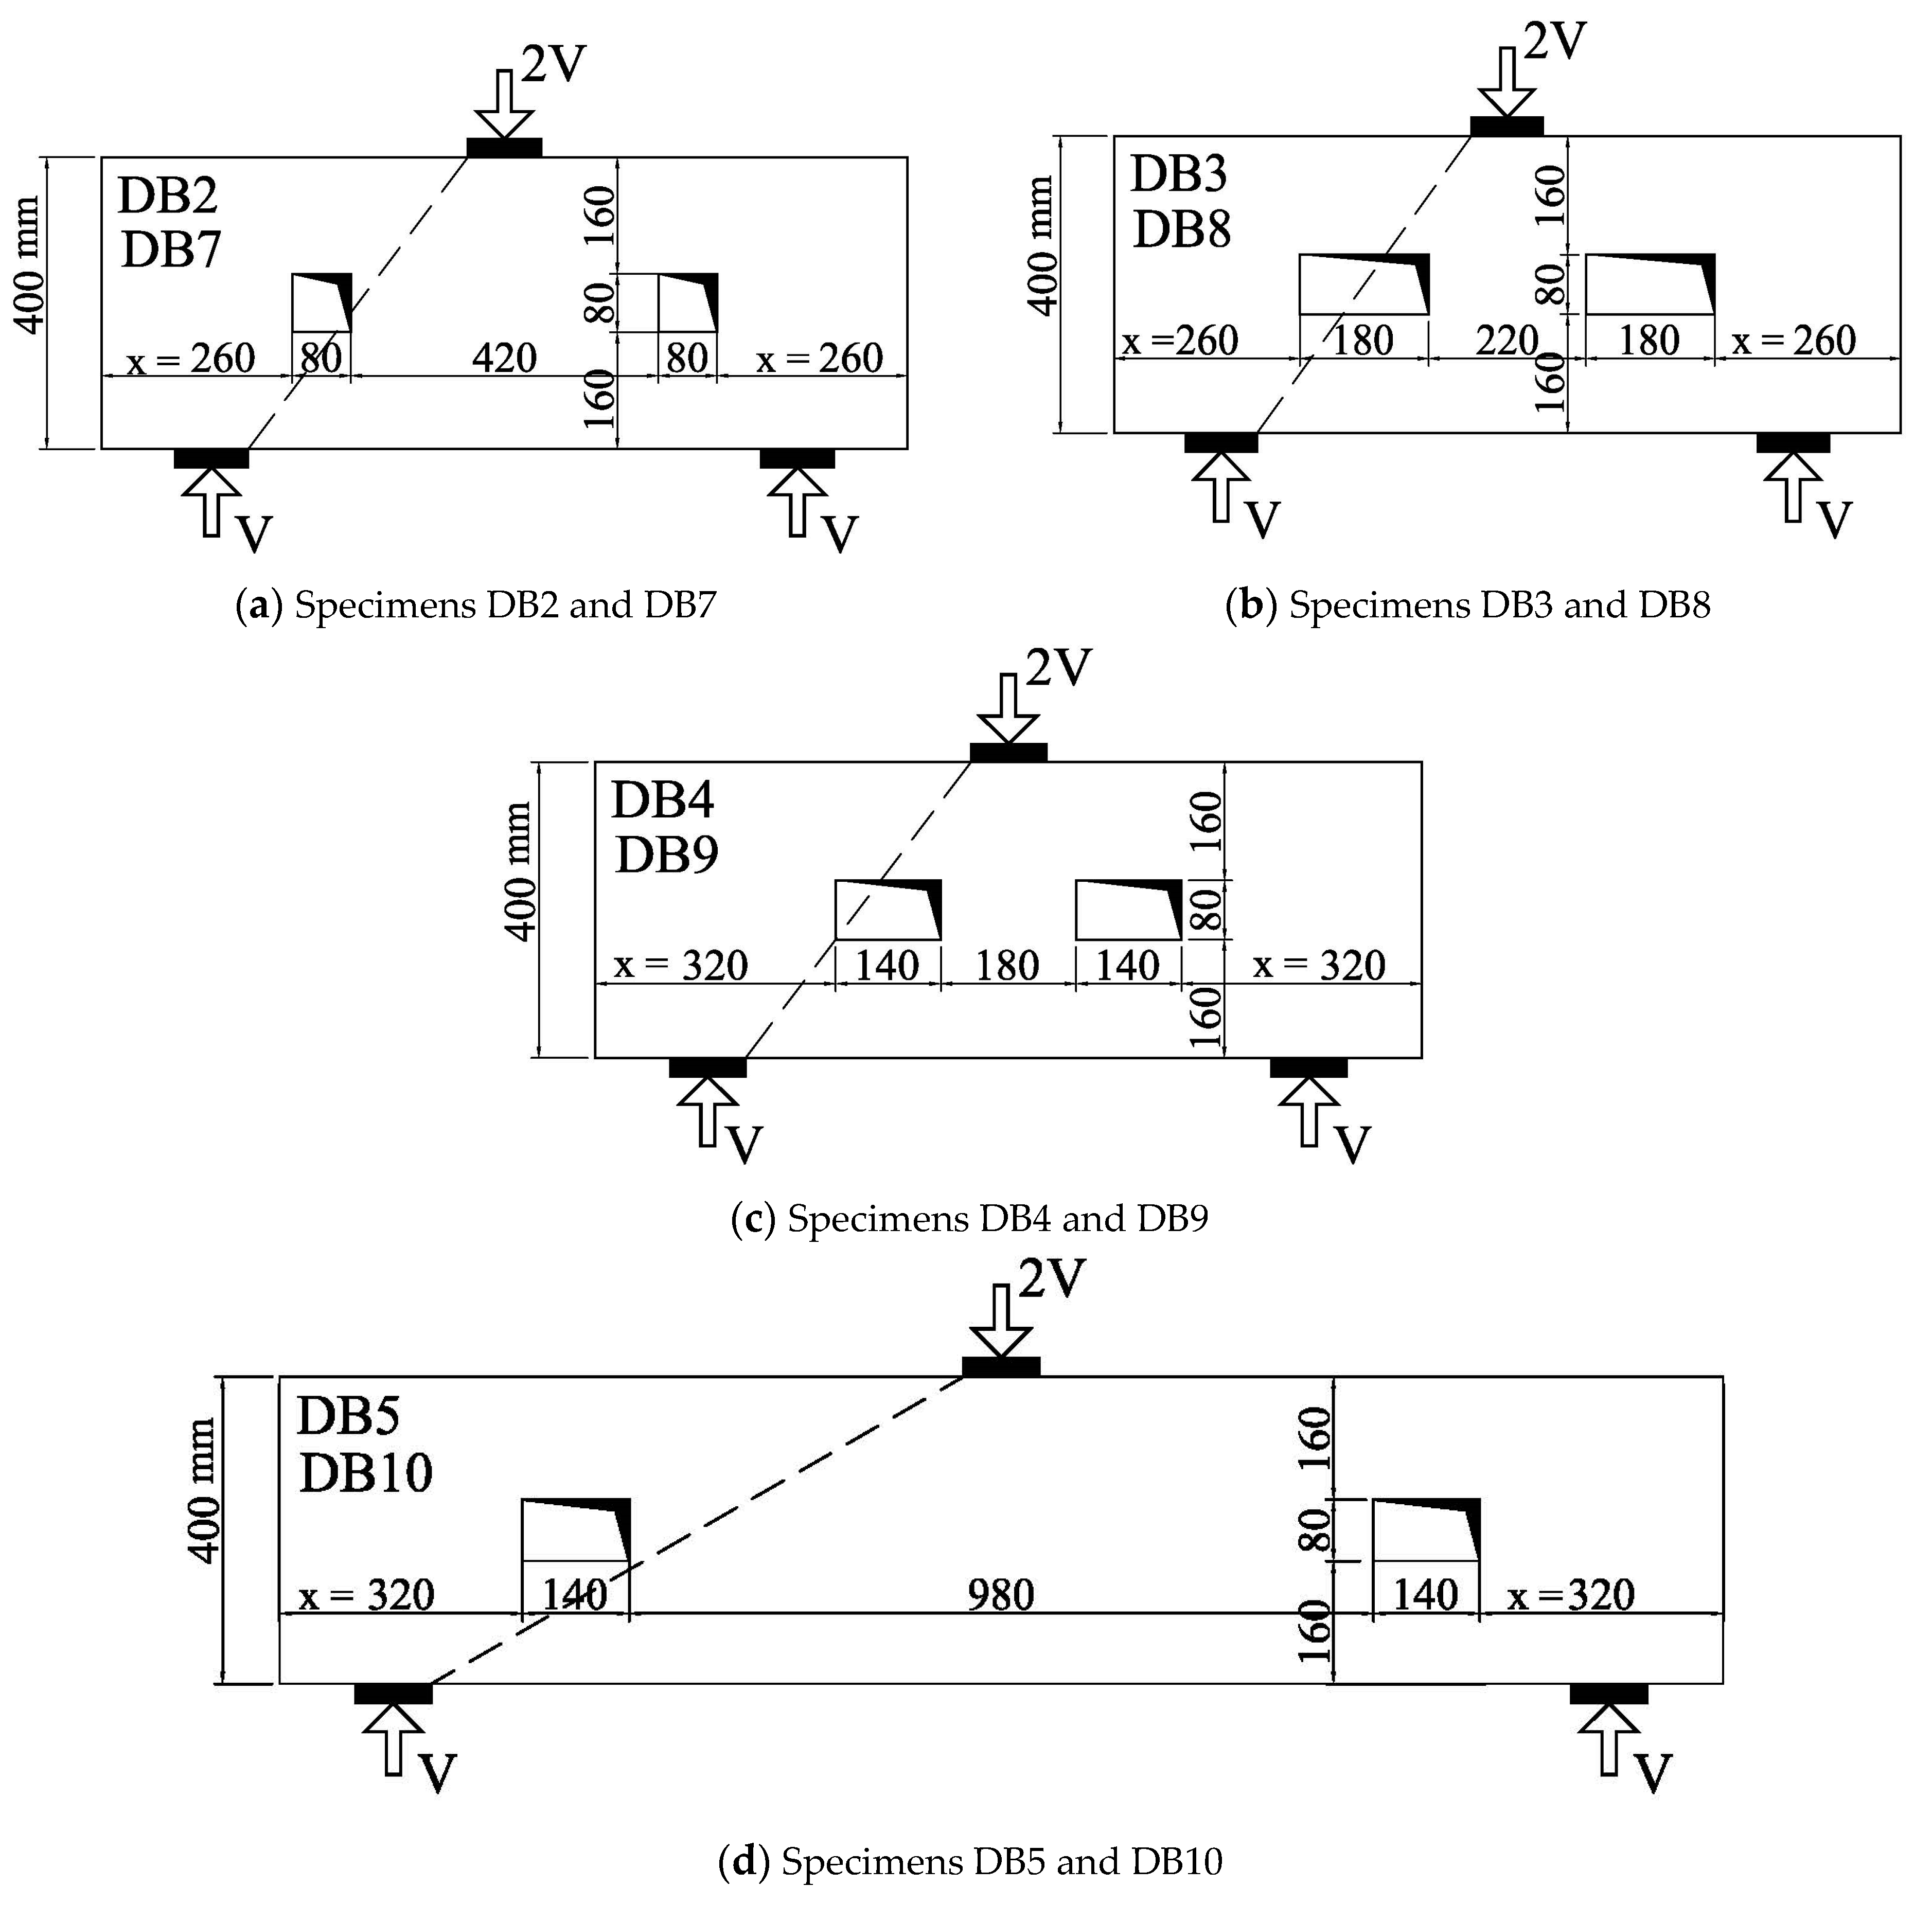
As displayed in Table 4, the experimental program consisted of ten simply supported reinforced High-Strength Concrete (HSC) deep beams tested under static loadings. The beams were split into two groups; the first group consists of 5 HSC with WGP beams, while the second group consists of 5 HSC without WGP beams. Eight beams had web openings while the two reference beams were without openings. All the tested beams have a similar rectangular cross-section of 90 mm breadth and a total height of 400 mm [17]. The reinforcement details of the tested beams are illustrated in Figure 1. Four deformed bars with a diameter of 16 mm are the lower bars of all tested deep beams placed in two layers. The provided tensile reinforcement ratio (ρl = 2.87%) was relatively high and was selected to ensure that the beams failure will be in shear. The yield strength for these bars was 410 MPa. The compression reinforcement was two deformed bars with a yield strength of 407.60 MPa with a diameter of 10 mm. The diameter of the vertical web reinforcement is 8 mm with yield strength 260.2 MPa. For all deep beams tested, the providing horizontal web reinforcement ratio ρh and the spacing between the horizontal web reinforcement sh were maintained as the same. The vertical web reinforcement ratio ρv and the spacing between the vertical web reinforcement sv are changed as illustrated in Table 4. Figure 2 shows the size of the web openings and their locations. The height of one opening is equal to 80 mm (20% of the total height of the tested deep beam). These openings were located symmetrically relative to the deep beam’s mid-span. The tested shear spans to overall depth ratio (a/d) were 0.97, and 2.08. The testing under concentrated load is appropriate for the a/d ratio of less than 2.5. Three different widths for the openings, primarily 80 mm, 140 mm, and 180 mm, were considered. For deep beams with 80 mm × 80 mm, 140 mm × 80 mm, and 180 mm × 80 mm opening dimensions, the ratio of the opening side dimension to the total web height was adopted to be 20%, 35%, and 45%, respectively. Two solid specimens were employed as a reference deep beam among those that were tested, while in the other tested beams the load path intersects its openings at different sections. For the tested beams, the required vertical web reinforcement ratio ρv% covers the minimum required by the international code ACI 318-19. According to ACI 318-19, web reinforcement should be given in such a way that sv and sh do not surpass d/5 or 300 mm. Three different spacing between vertical web reinforcement (sv = 100, 160, and 200 mm) were tested.
4.2. Materials
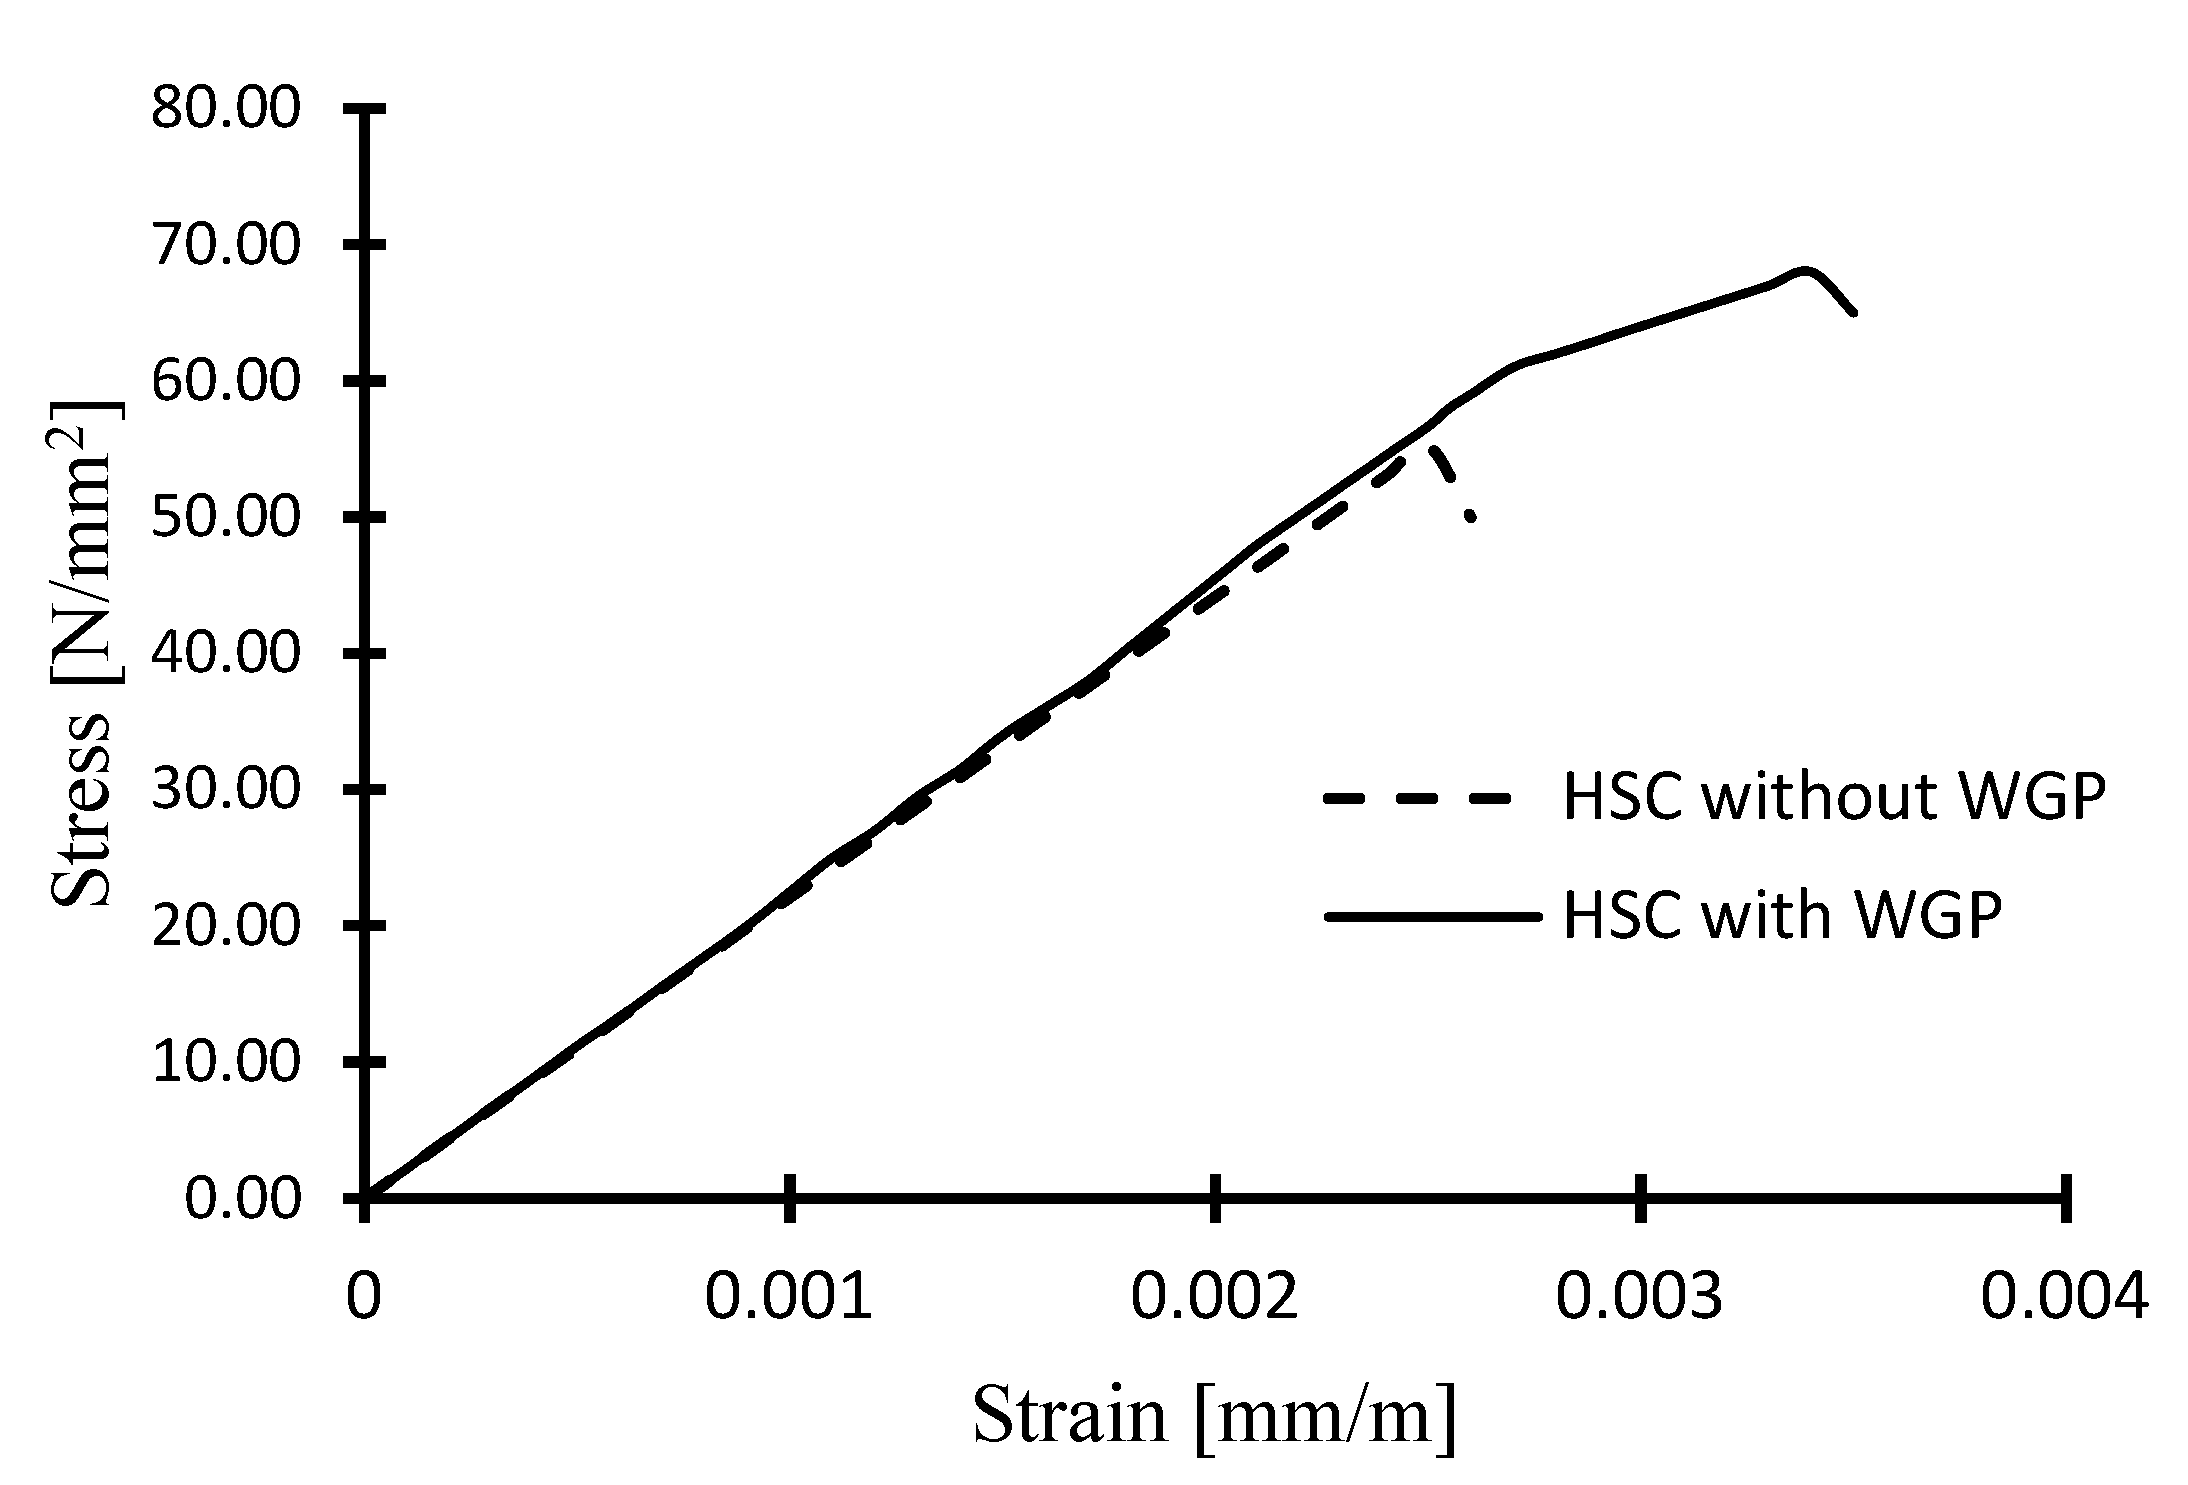
In the concrete mix design, ordinary Portland cement type CEM I 52.50N was utilized in conjunction with 8 mm crushed limestone. The ordinary Portland cement has a specific gravity of 3.12 g/cm3 and an average particle size of 19.76 µm. The chemical composition of the ordinary Portland cement type is shown in Table 5. The crushed limestone had a specific gravity of 2.74 g/cm3 and water absorption of 1.54%, respectively. Natural sand with a fineness modulus of 2.82 was the fine aggregate. The sand had a specific gravity of 2.43 g/cm3, and water absorption of 1.91%, respectively. The damaged glass utilized in this experiment was salvaged from demolished structures. Recycling glass was milled into small particle sizes by using the crushing machine. The generated WGP had ground particle sizes ranging from 75 μm to 140 μm. In addition, 75% of the WGP was passed via sieve No. 200 (75 μm). The reactivity of glass powder correlates strongly to the powder size and 75 μm is commonly considered as a powder size level for obvious pozzolanic reactivity [1]. It was determined that [4] 20% WGP was the ideal ratio to obtain the highest concrete compressive strength at age 3 months. Concrete was made using tap water and it was necessary to utilize a superplasticizer to ensure the required workability. Therefore, as illustrated in Table 6, two concrete mixes were designed; the first was HSC without WGP and the second with 20% WGP. The cylinder concrete compressive strength fc′ based on three-cylinder specimens (ϕ150 × 300 mm) was 69.6 MPa and 55.2 MPa for HSC with and without WGP, respectively. Figure 3 shows stress–strain curves for HSC with and without WGP. The splitting cylinder tensile strengths were equal to 3.83 MPa and 3.56 MPa for HSC with and without WGP, while the flexural strengths (based on 100 mm × 100 mm × 500 mm prisms) were equal to 7.30 MPa and 7.10 MPa, respectively. From previous results adding WGP improves the compressive strength and tensile strength of concrete by about 26% and 8%, respectively.
5. Test Setup and Instrumentation
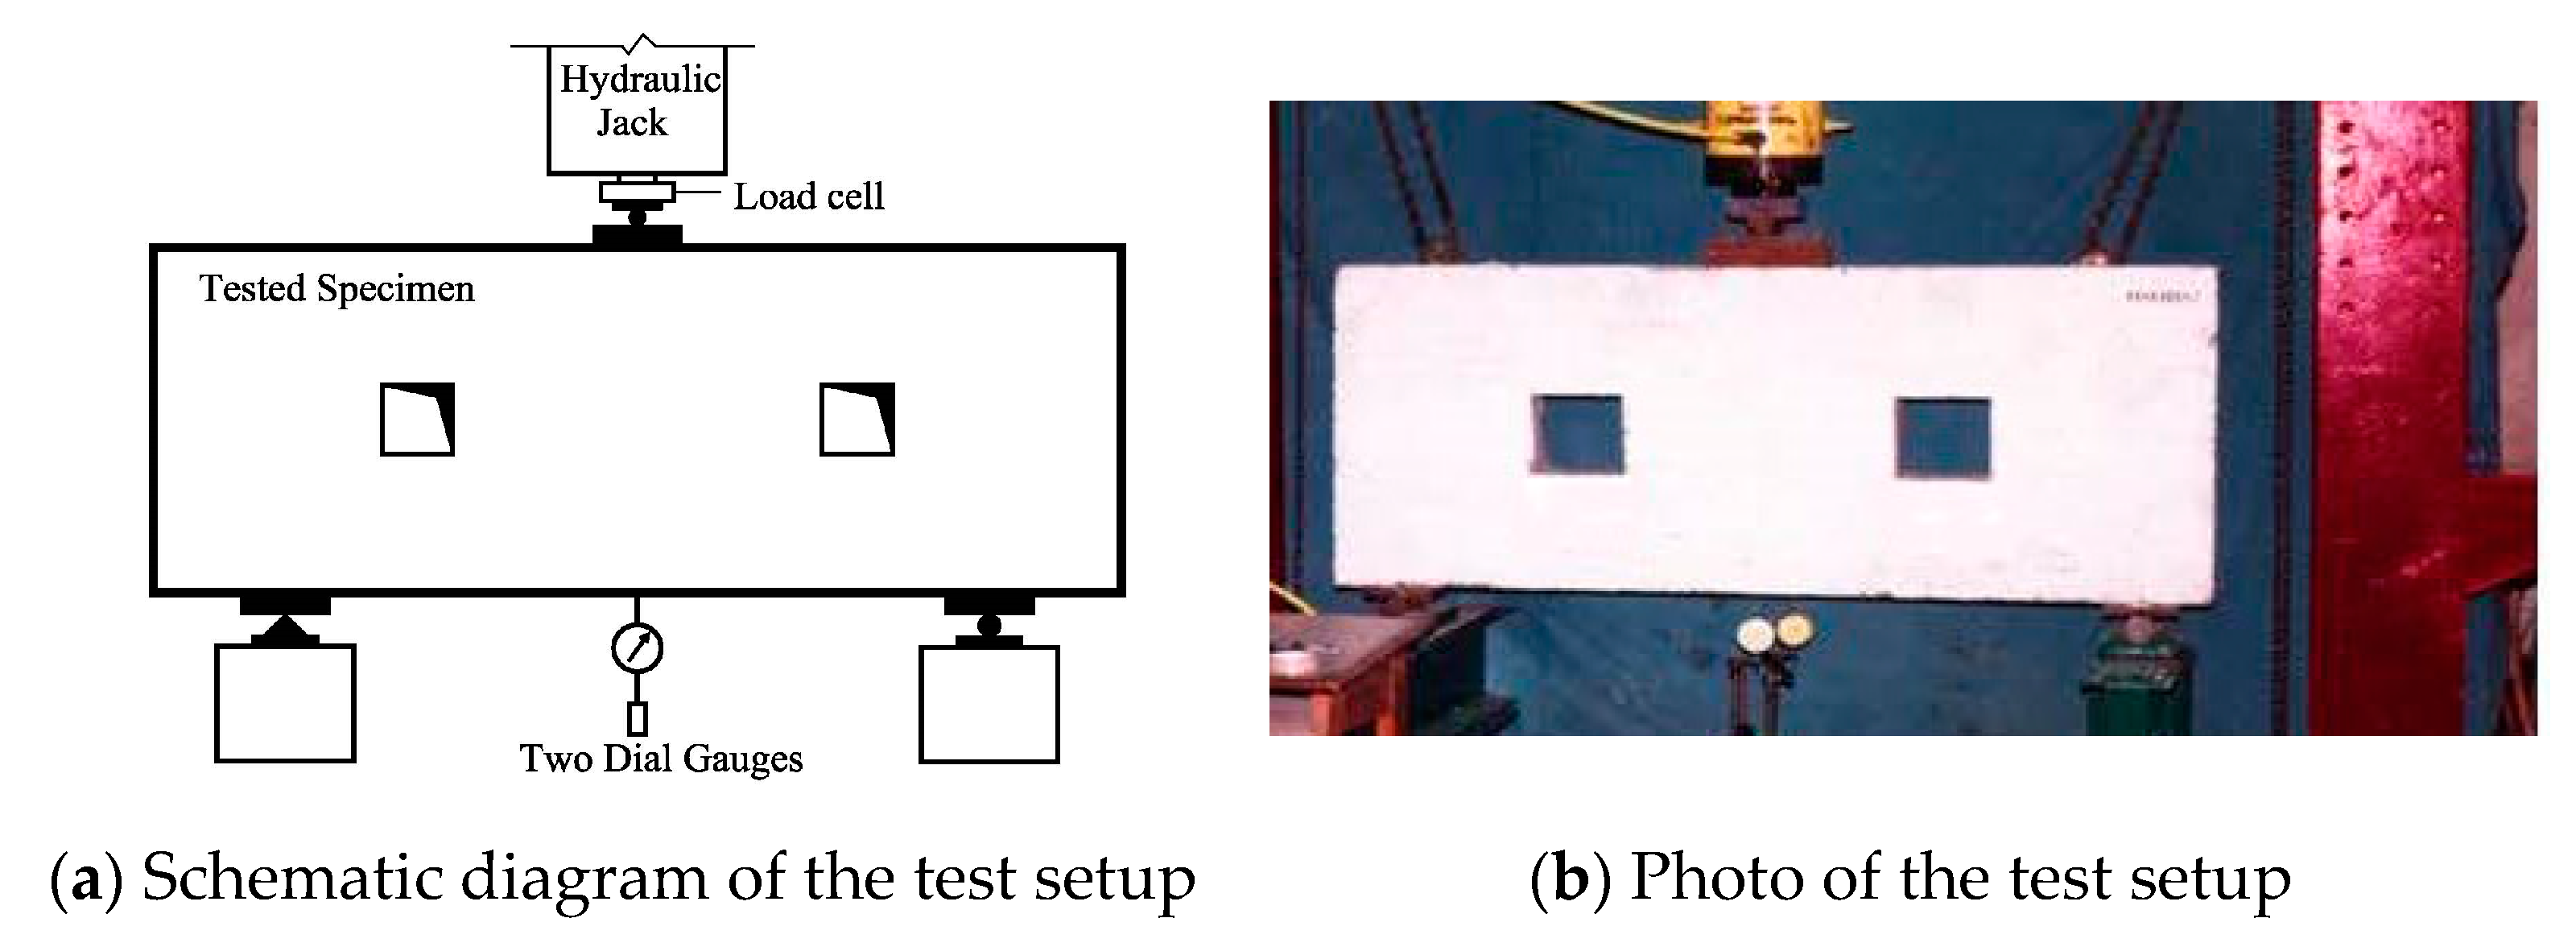
All the examined deep beams have been cast and cured with pure water after 24 h from casting until the test. The beams have been tested with a total capacity of 1500 kN in a loading frame, as shown in Figure 4, specific adjustments made to obtain a one-point load and two support reactions. Two dial gauges of 0.01 mm and a total capacity of 20.0 mm were used for deflection measurements of the tested deep beams in the middle of each span. A crack detection microscope was used for crack-width measurements. It consists of a system of two lenses that enables measurement on either plane or curved surface. A transparent and calibrated measuring scale is fitted in between lenses; each division of this scale is 0.05 mm. Electrical strain gauges were bonded to the longitudinal and vertical web reinforcement at some critical locations as shown in Figure 1. The load was applied incrementally and at each load increment the deformation readings were recorded.
6. Experimental Results of Testing and Discussions
6.1. Mid-Span Deflection
The total applied load versus the mid-span deflection curves for studied deep beams with and without WGP and with web openings are shown in Figure 5. The load–deflection relationships for deep beams without WGP are shown in Figure 5a while the load–deflection relationships for deep beams with WGP are shown in Figure 5b. Two dial gauges of 0.01 mm accuracy and a total capacity of 20.0 mm were used for mid-span deflection measurements. The beams showed almost elastic behavior in the early phases of loading. Beams DB7 and DB2 that have small web openings (80 mm × 80 mm) demonstrated very similar load–deflection behavior to their corresponding solid beam. The maximum mid-span deflection for beams DB9 and DB4 with web opening (140 mm × 80 mm) is less than that of corresponding solid beams by about 13% and 14%, respectively whereas the mid-span deflections for beams DB10 and DB5 that have the same opening size but do not intersect the load path was decreased by about 16% and 17%, respectively. The maximum mid-deflection of beams DB8 and DB3 with web opening (180 mm × 80 mm) is less than that of corresponding beams without openings by about 24% and 19%, respectively. These results indicated that the beams with large width web openings experienced the highest deflection of all beams with and without WGP at the same level of loading. As shown in Figure 5a,b, HSC deep beams with WGP and web openings are more rigid than similar HSC deep beams without WGP by about 33%. The increase of the mid-span deflection in the presence of openings with a width exceeding 20% of the total height of the beam at any location inside the shear span was 46%. The results also showed that the shifting of the openings towards the mid-span section of the beam reduces mid-span deflection with a clear difference. In general, when compared to deep beams with WGP, deep beams without WGP displayed reduced mid-span deflection ranging from 12.5% to 19% which indicates that WGP provides more ductility for the deep beams.
6.2. Cracking Behavior and Ultimate Strength
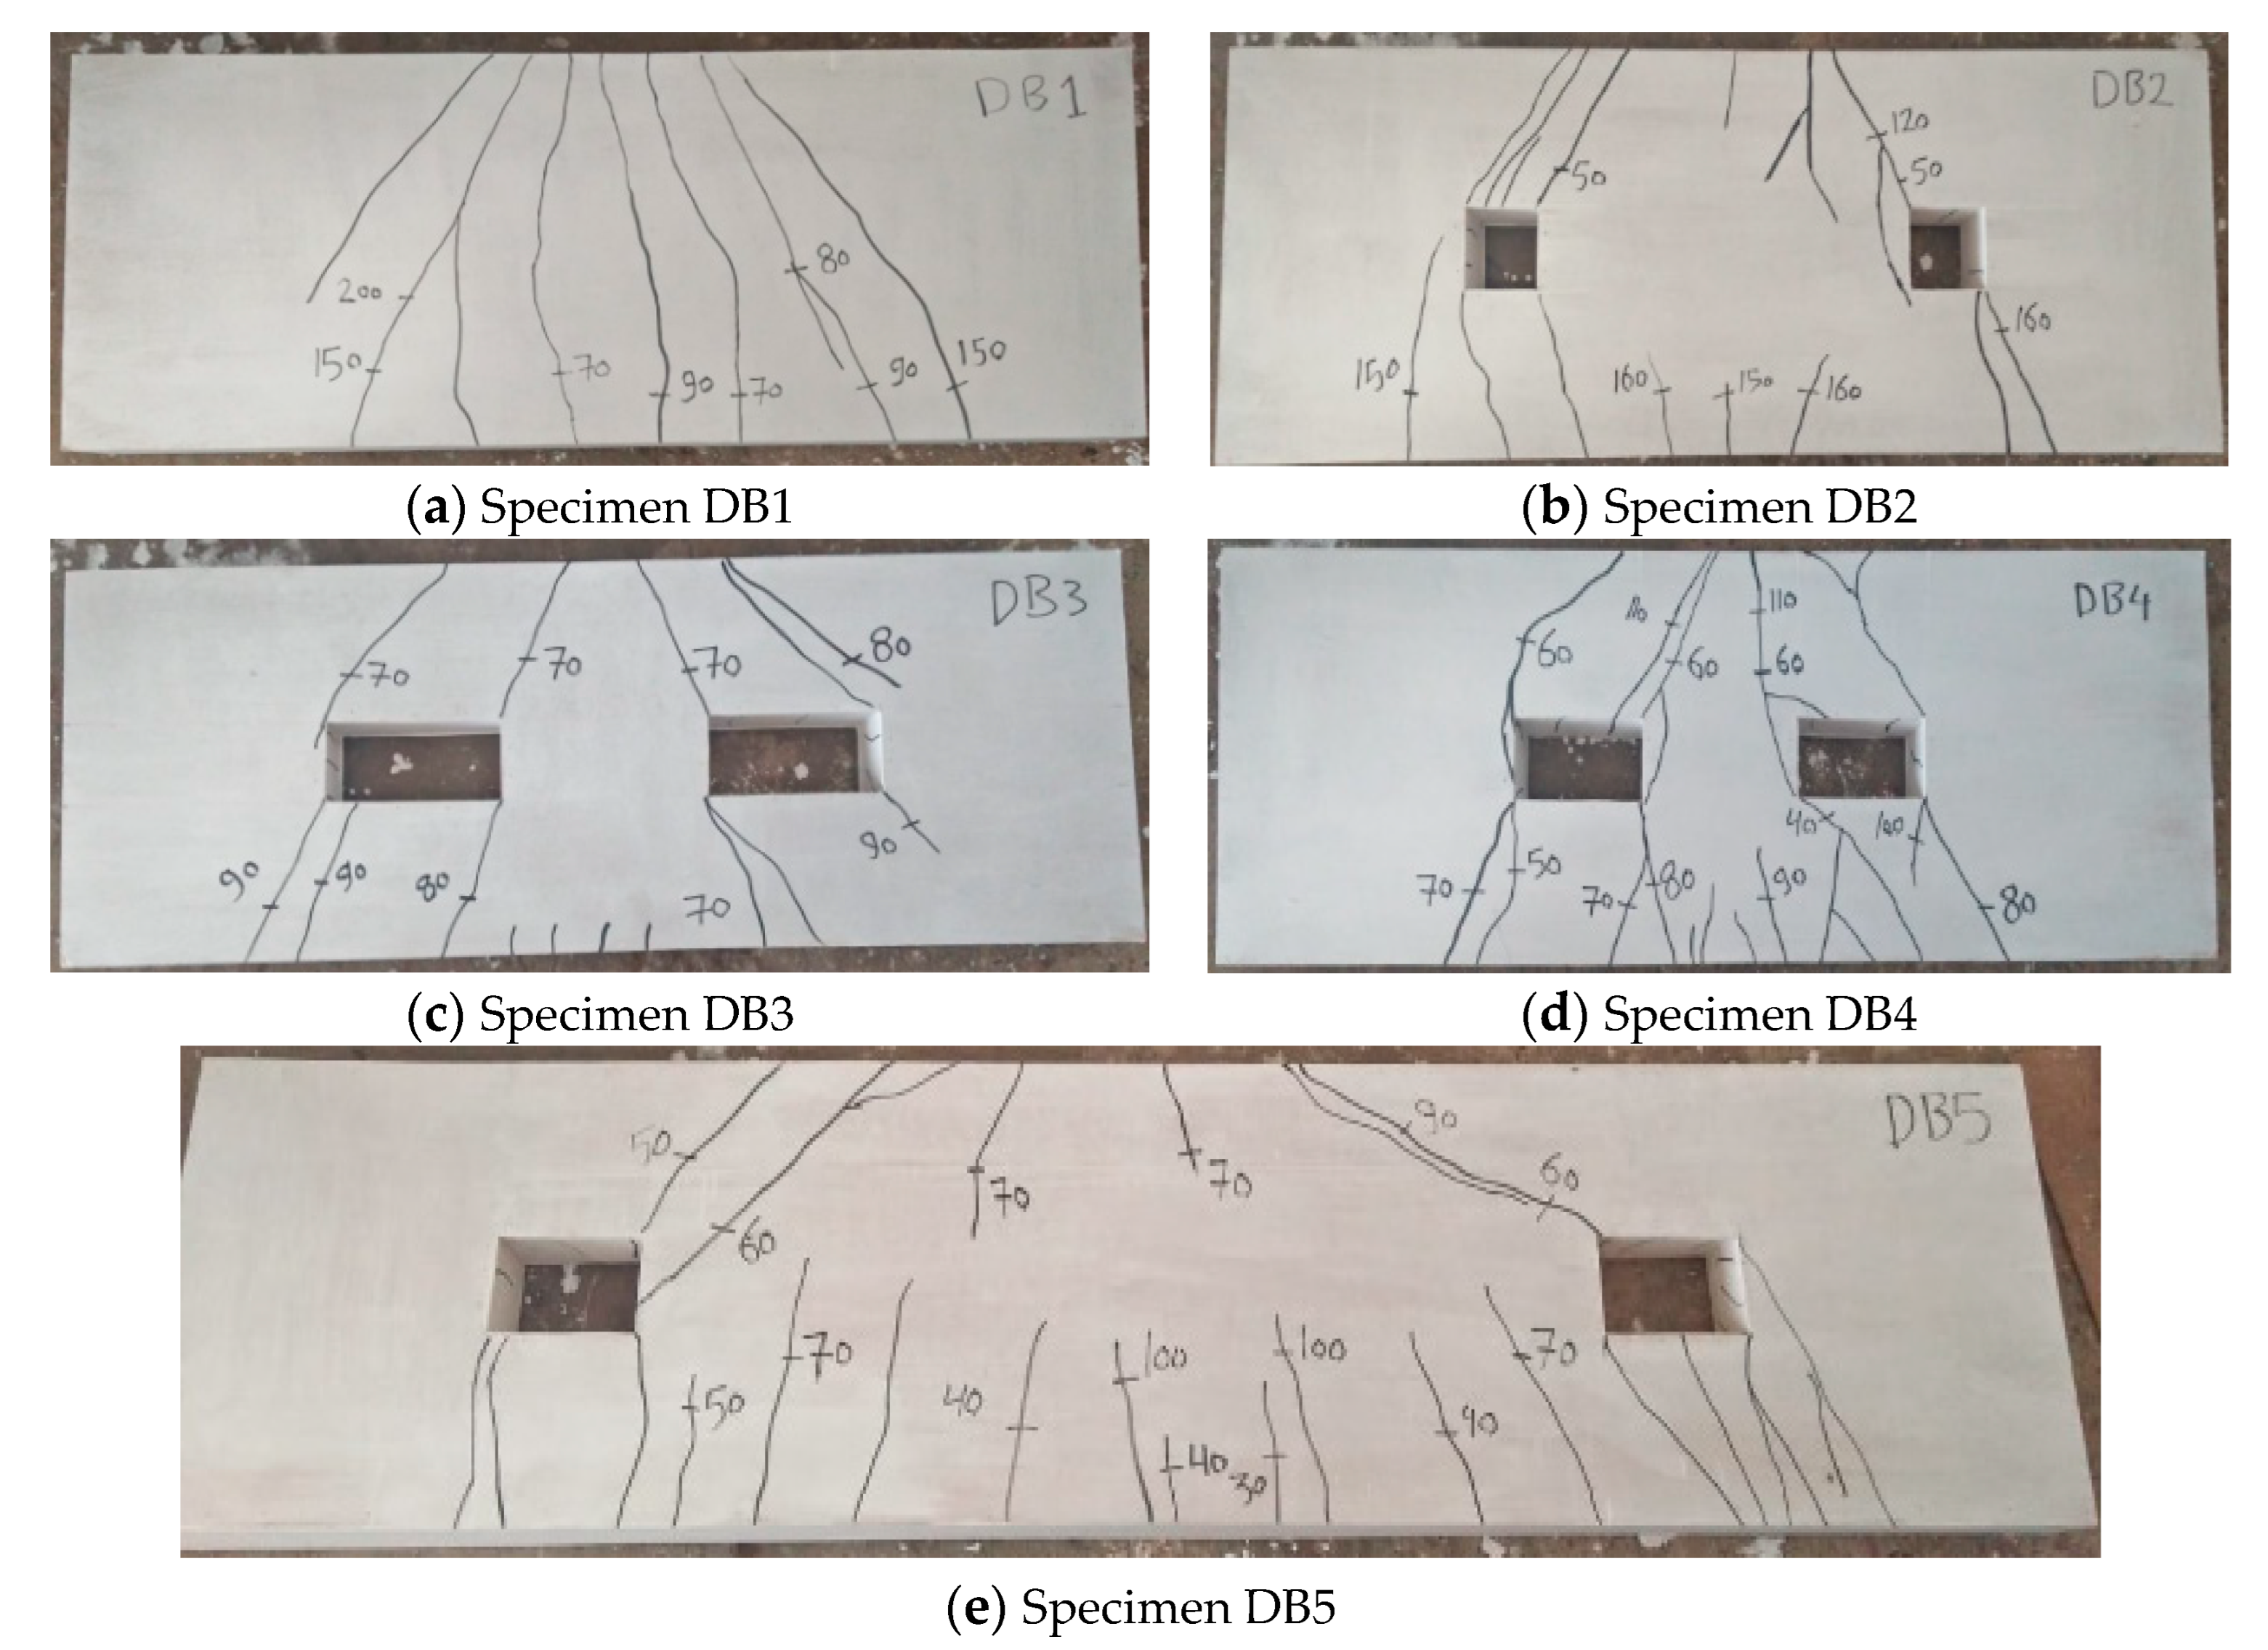
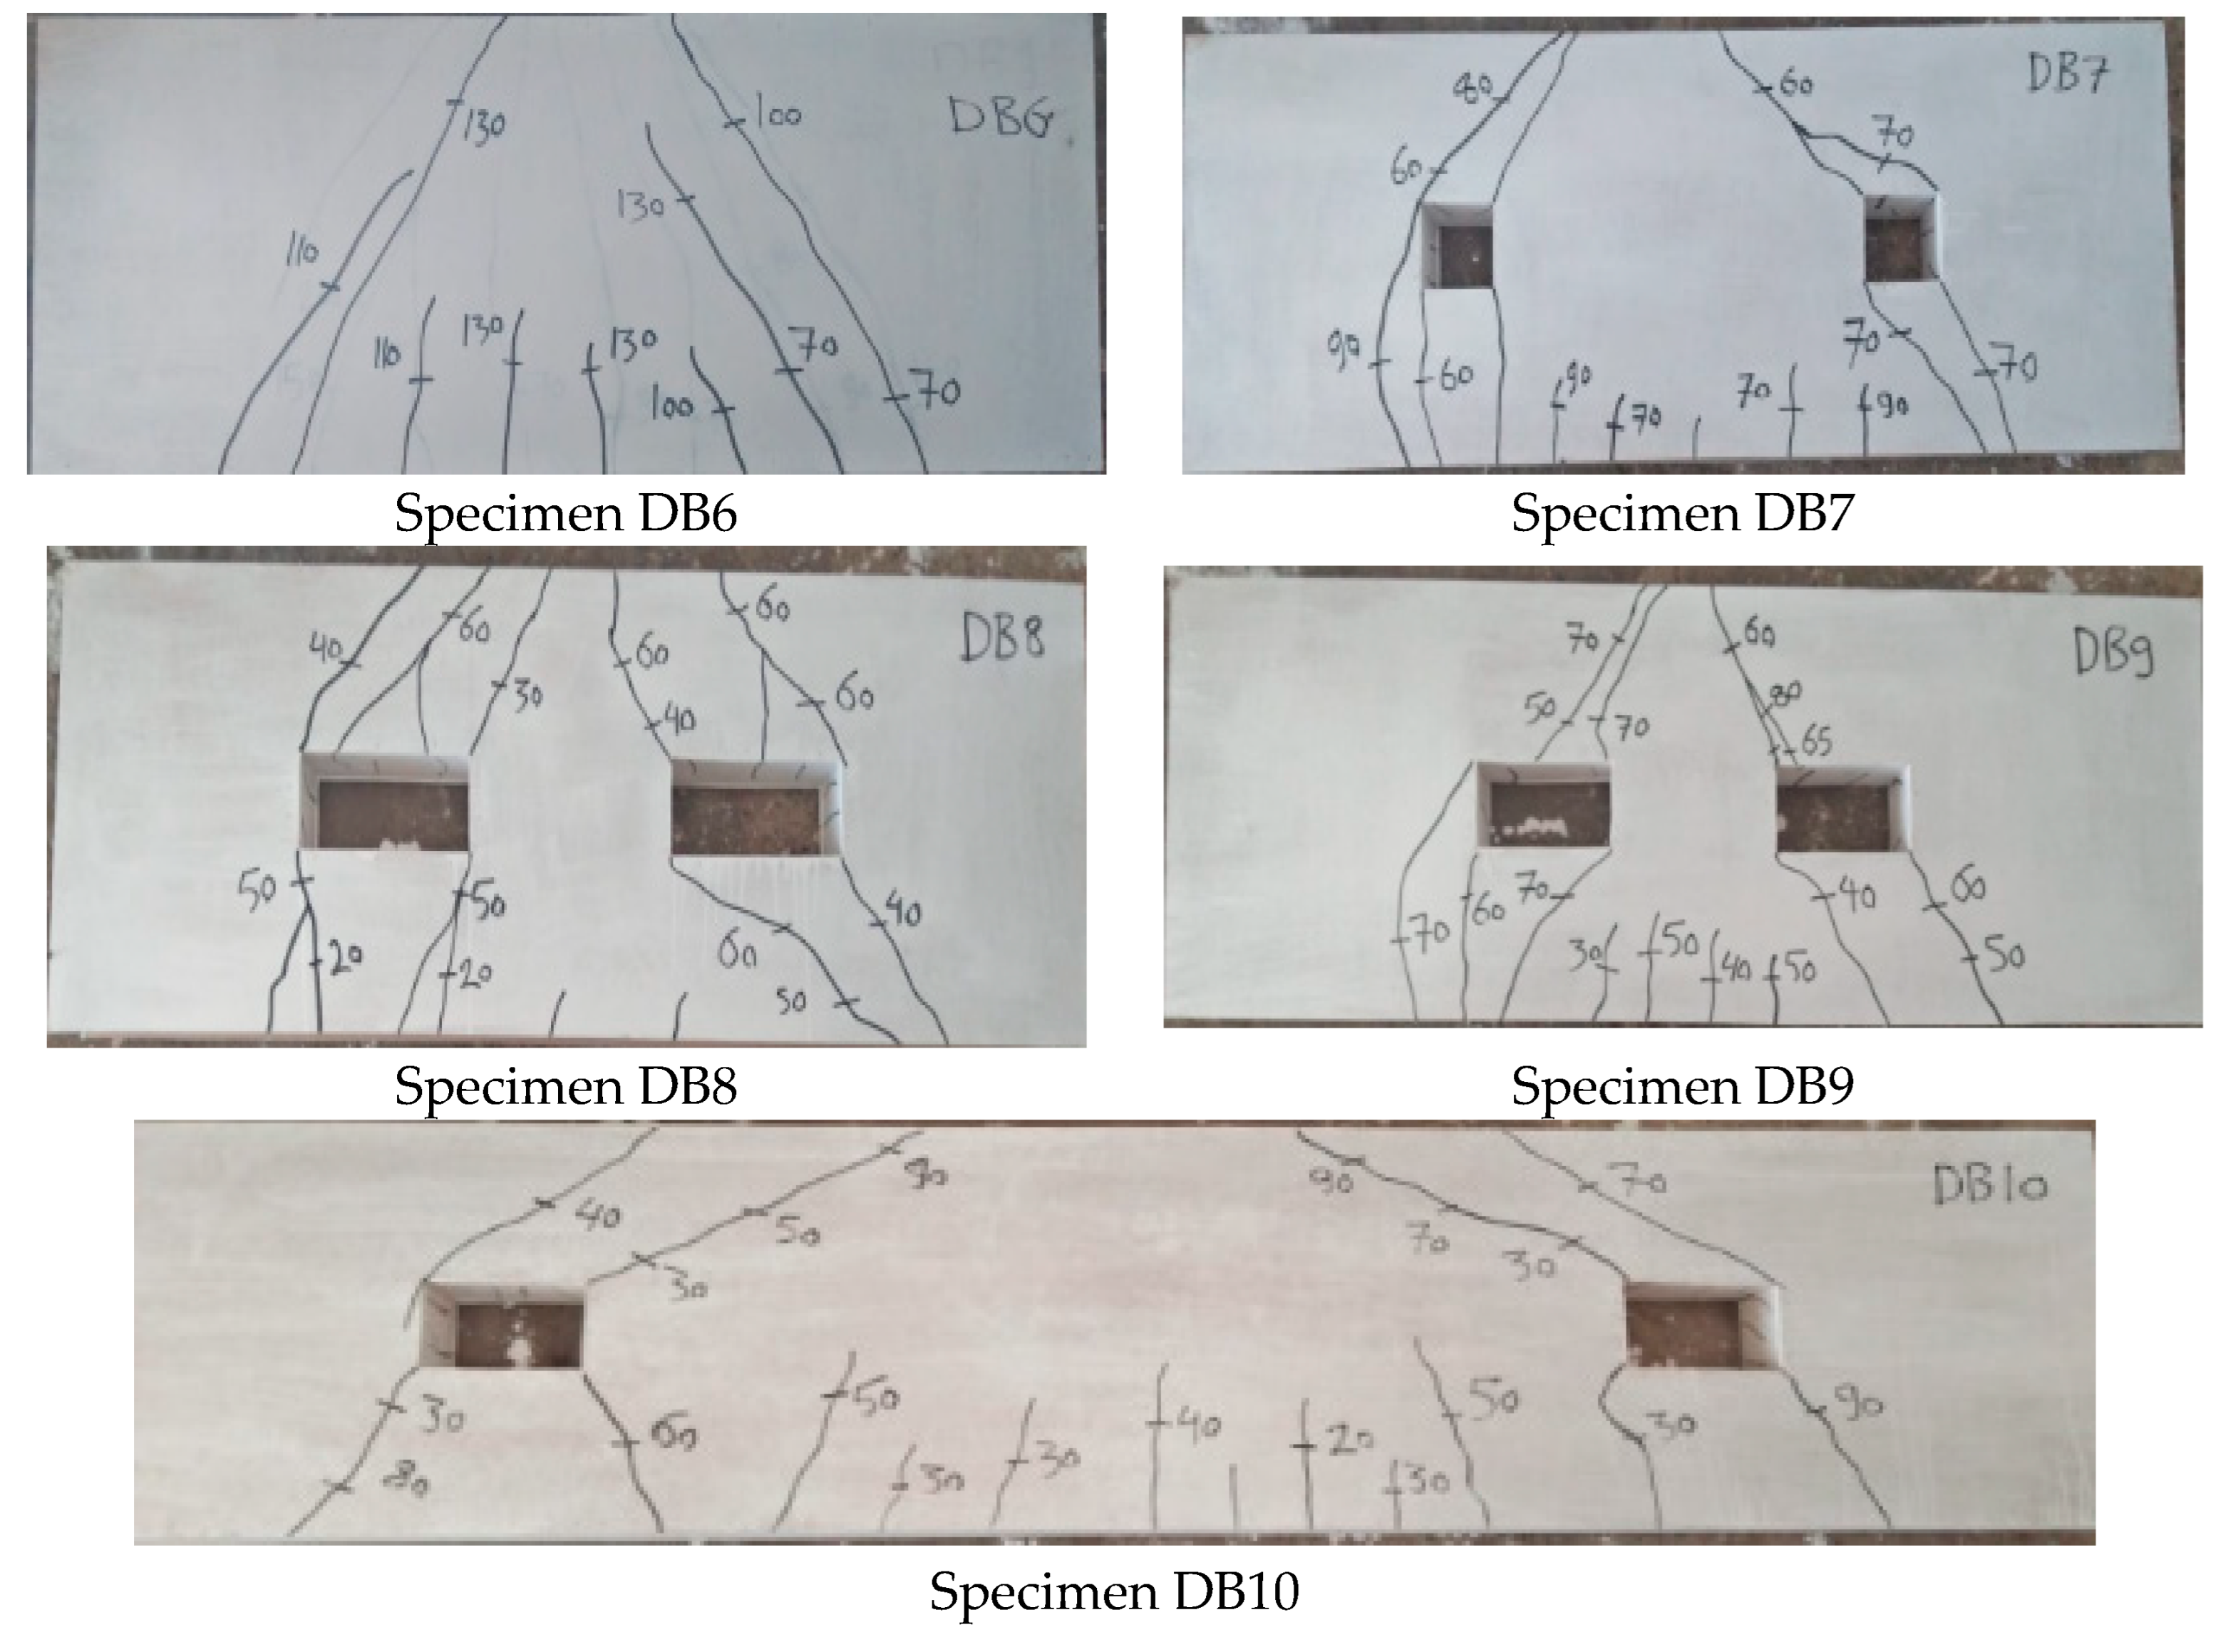
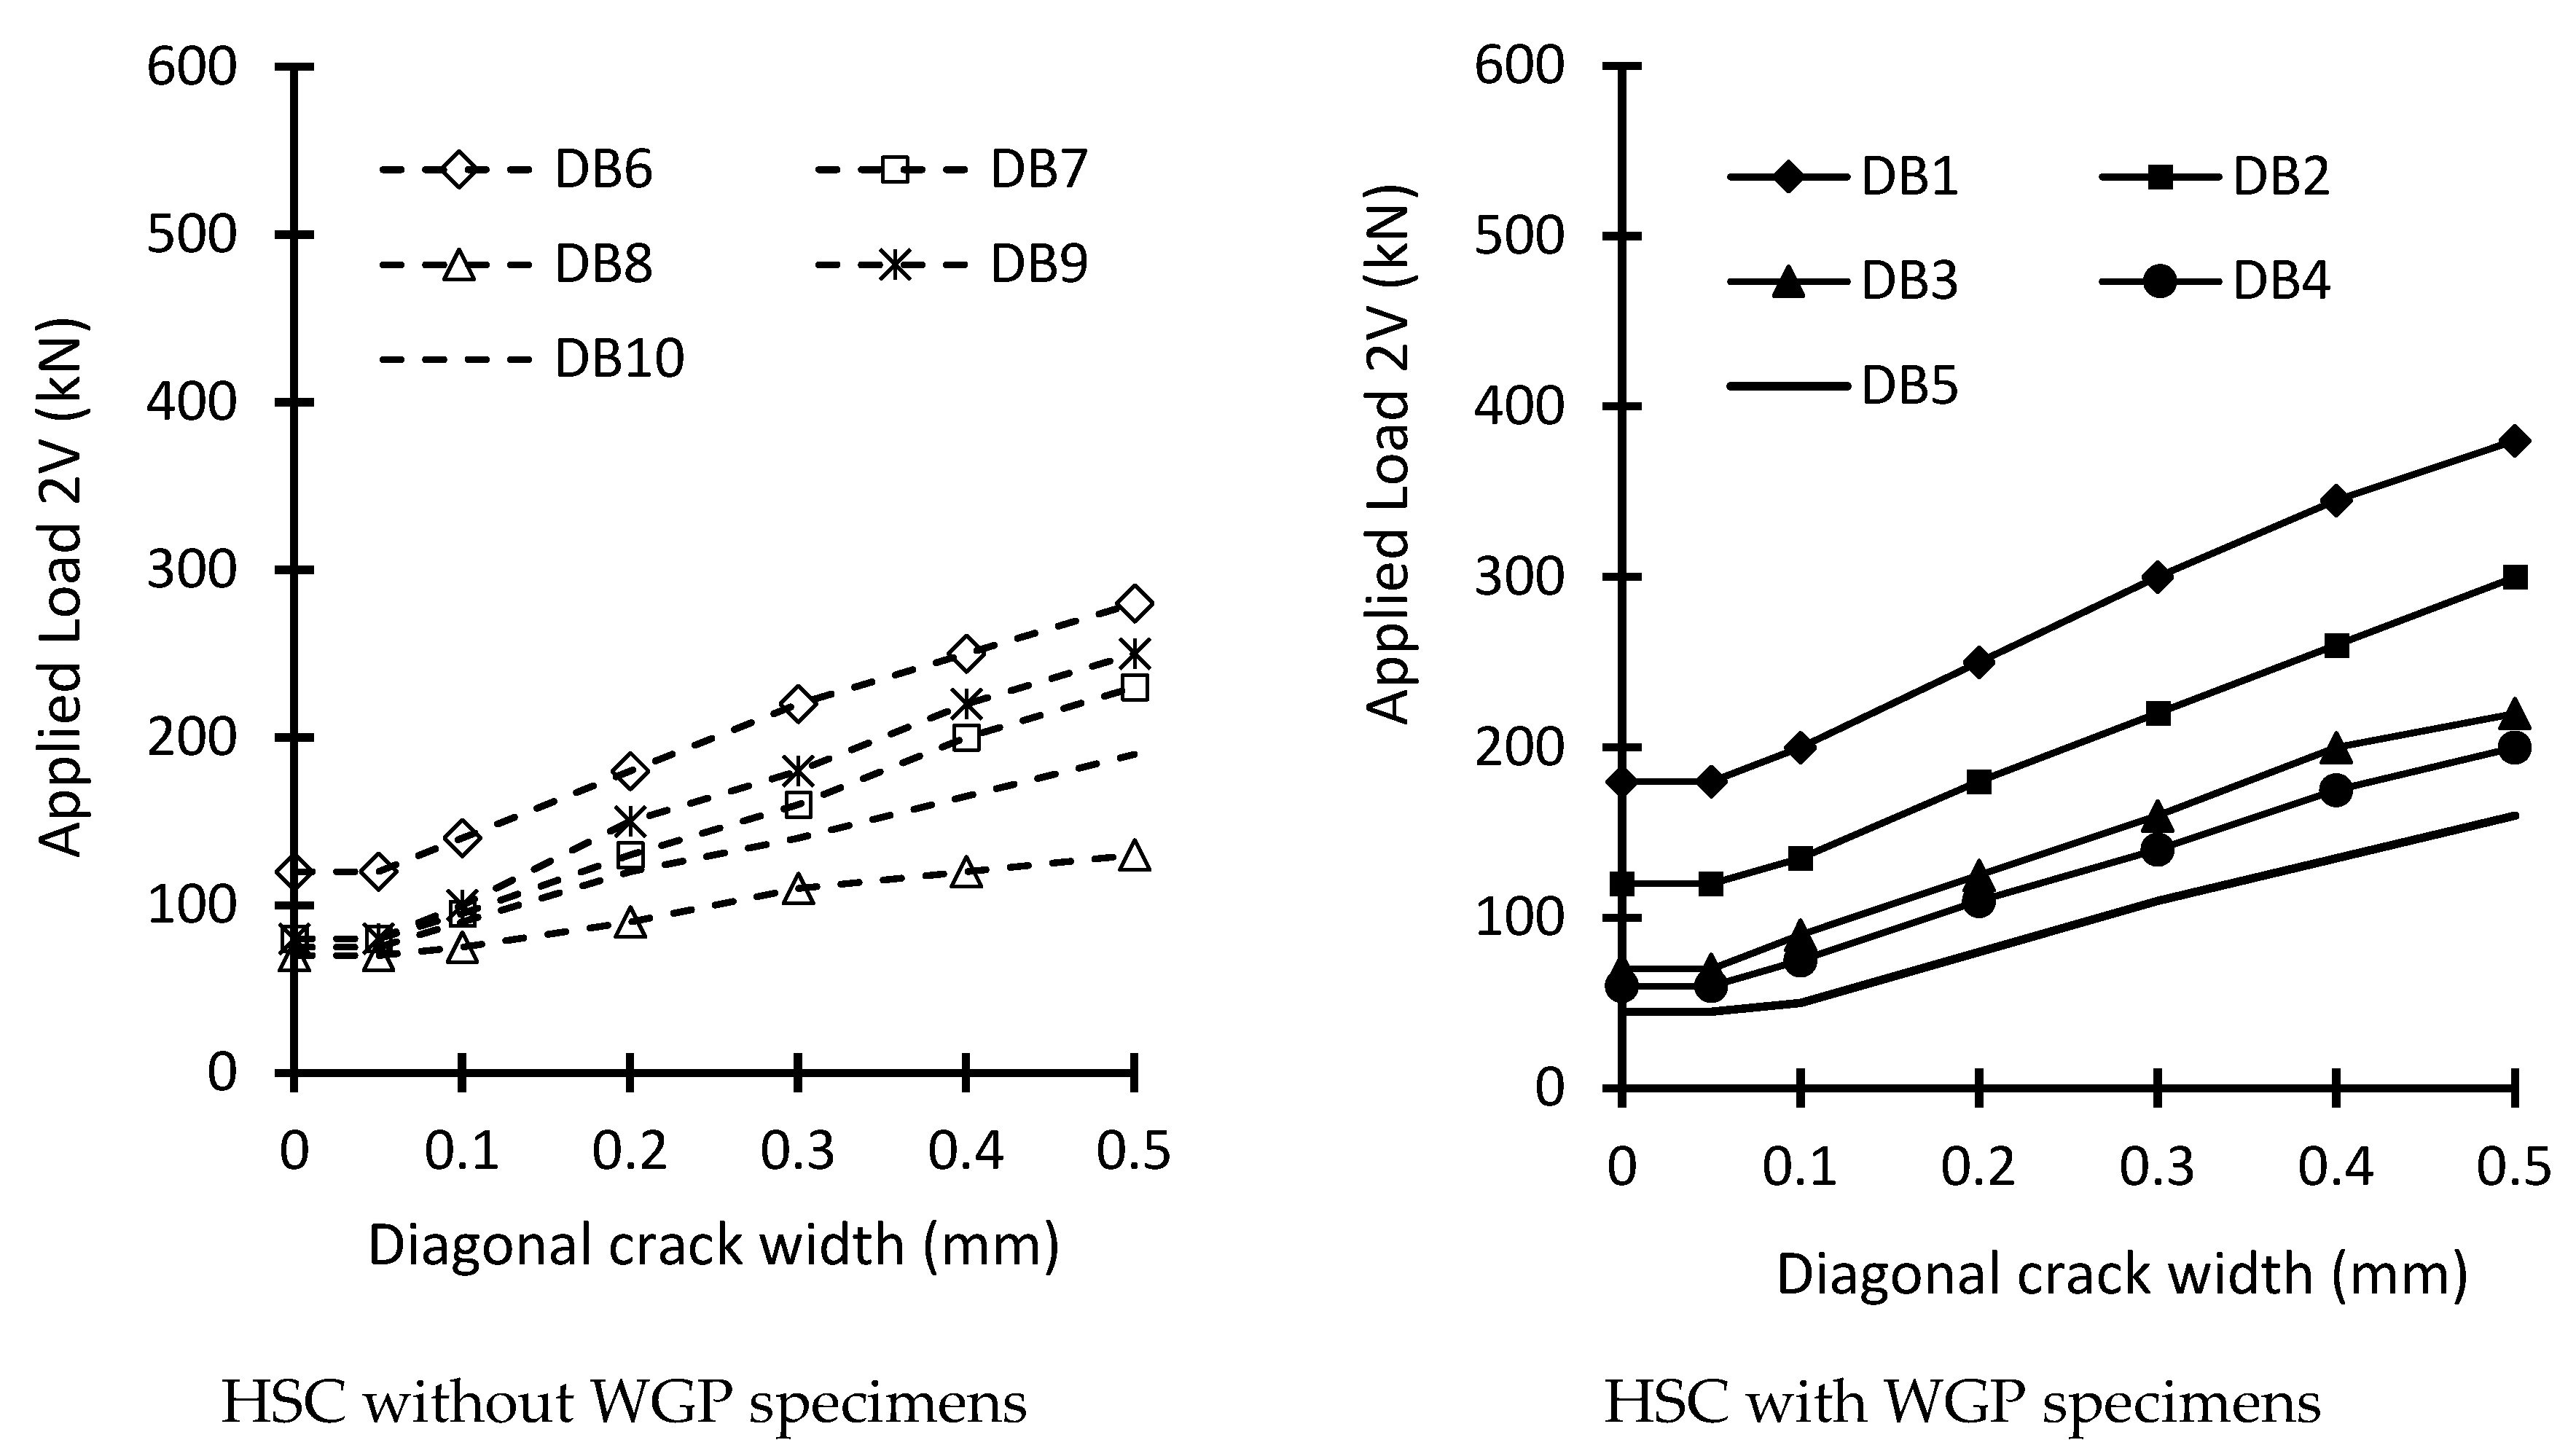
Figure 6 and Figure 7 show the cracking patterns and failure modes of the examined beams with and without WGP. The numbers written along the cracks indicate the load value (V) in kN at which the crack has been started. The size and location of the web opening in the shear span produce the main effect on the failure mode and the ultimate shear strength. The ultimate shear strength of tested beams was significantly reduced when the opening was made wider to cut the load path. Table 7 introduces the measured first diagonal cracking strength (2Vcrs). All of the tested deep beams with and without WGP failed in shear. The first cracks of solid beams DB1 and DB6 were noted at a load of about 23% and 31% of failure load, respectively, and diagonal cracks in the direction of the compression strut were found and spread to the loading region and supports. The first crack of beams DB2 and DB7 was observed at a load of about 30%, and 33% of the failure load, respectively. For these beams with small web openings, the diagonal cracks that appeared at the web opening corners spread to the support’s edge and the load plate’s edge. (Between the load edges and the support surfaces, the largest diagonal crack occurred). The first crack of the beams DB9, DB10, DB4, and DB5 was noted at a load of about 33%, 23%, 31%, and 27% of the ultimate failure load, respectively. The width of the diagonal cracks that occurred in the middle of the web opening corners and the load plate increased more quickly than that which propagated from the web opening and the support plate. The first cracks of the beams DB3 and DB8 were noted at a load of about 27% and 42%, respectively, for these beams’ opening failure. as described for previous beams. The ultimate failure load decreased by clear values when the width of the openings exceeds 20% of the overall beam depth at any location. Beams DB2 and DB7 that have small openings (80 mm × 80 mm) did not have a significant influence on the recorded ultimate loads as is obvious from Table 7. It was also found that the ultimate failure load of the tested WGP deep beams without web opening, with web openings of 140 mm × 80 mm at different locations, and with web openings of 180 mm × 80 mm, was larger than that of the similar deep beams without WGP by about 41%, 12–20%, and 36%, respectively. The improvement in the ultimate failure load could be attributed to the developed concrete microstructures caused by WGP’s very fine grains, producing further gel and decreasing the number of voids in the concrete matrix. The results also showed that the worst opening location was when cutting a large distance from the load path. It should be noted that either increasing the opening width or increasing the spacing between the stirrups reduces the ultimate strength of deep beams with and without WGP. For all specimens, a plot of the applied shear force (2V) versus the maximum diagonal shear crack width is shown in Figure 8. It was established that the cracks grew rapidly when increasing the applied loads. The development of the diagonal shear cracks for the tested deep beams with web openings was faster than that of the similar beams without openings. As seen in Figure 8, the development of the diagonal shear cracks of HSC deep beams without WGP was faster than that of the similar deep beams with WGP. This could be attributed to the enhancement in concrete tensile strength caused by utilizing WGP.
6.3. Applied Load–Steel Strains Relationships
Table 8 shows the maximum steel bar strains for both stirrups and longitudinal bars. Records of the longitudinal steel strain for the tested beams with and without WGP indicated that strains around a maximum bending moment in the mid-spans are in tension and practically uniform at each load level. When flexural cracks developed in the mid-span of the beam, a significant redistribution of strains occurred at the top and bottom longitudinal steel bars. Except for beams DB5 and DB10, all deep beams tested with and without web opening failed before the longitudinal bars yielded. The formation of inclined diagonal cracks did not affect the strain readings in the longitudinal bars. For some of the tested beams, the recorded stirrups strain readings were recorded from Gauge G2 as shown in Figure 1. The strains in the stirrups before the initial diagonal crack were very small and a sudden high rise took place after the formation of this crack. It could be explained that the use of WGP decreased the strain in the transverse steel, as it could stop cracks spreading in reinforced concrete structural members, which is a result of concrete tensile strength enhancement caused by using WGP.
7. Numerical Simulation
7.1. Proposed 3-D Nonlinear Finite Element Simulation
A three-dimensional nonlinear Finite Element Simulation (FEM) utilizing the computer program ABAQUS [20] is employed to compare the response of reinforced concrete examined beams with and without WGP, such as displacements, failure mode, and ultimate shear load. The Concrete Damage Plasticity model CDP was utilized to simulate the concrete behavior, defined as the compression and tension degradation of concrete. The failure surface in the CDP is controlled by εt−pl and εc−pl, which are tensile and compressive equivalent plastic strains, respectively. Tensile damage dt and compressive damage dc are two damage variables that describe the loss of elastic stiffness. The damage variables can vary from zero to one, with zero representing undamaged concrete and one signifying total loss of strength. Under uniaxial tension σt and compression σc loading, the stress–strain relationships are:
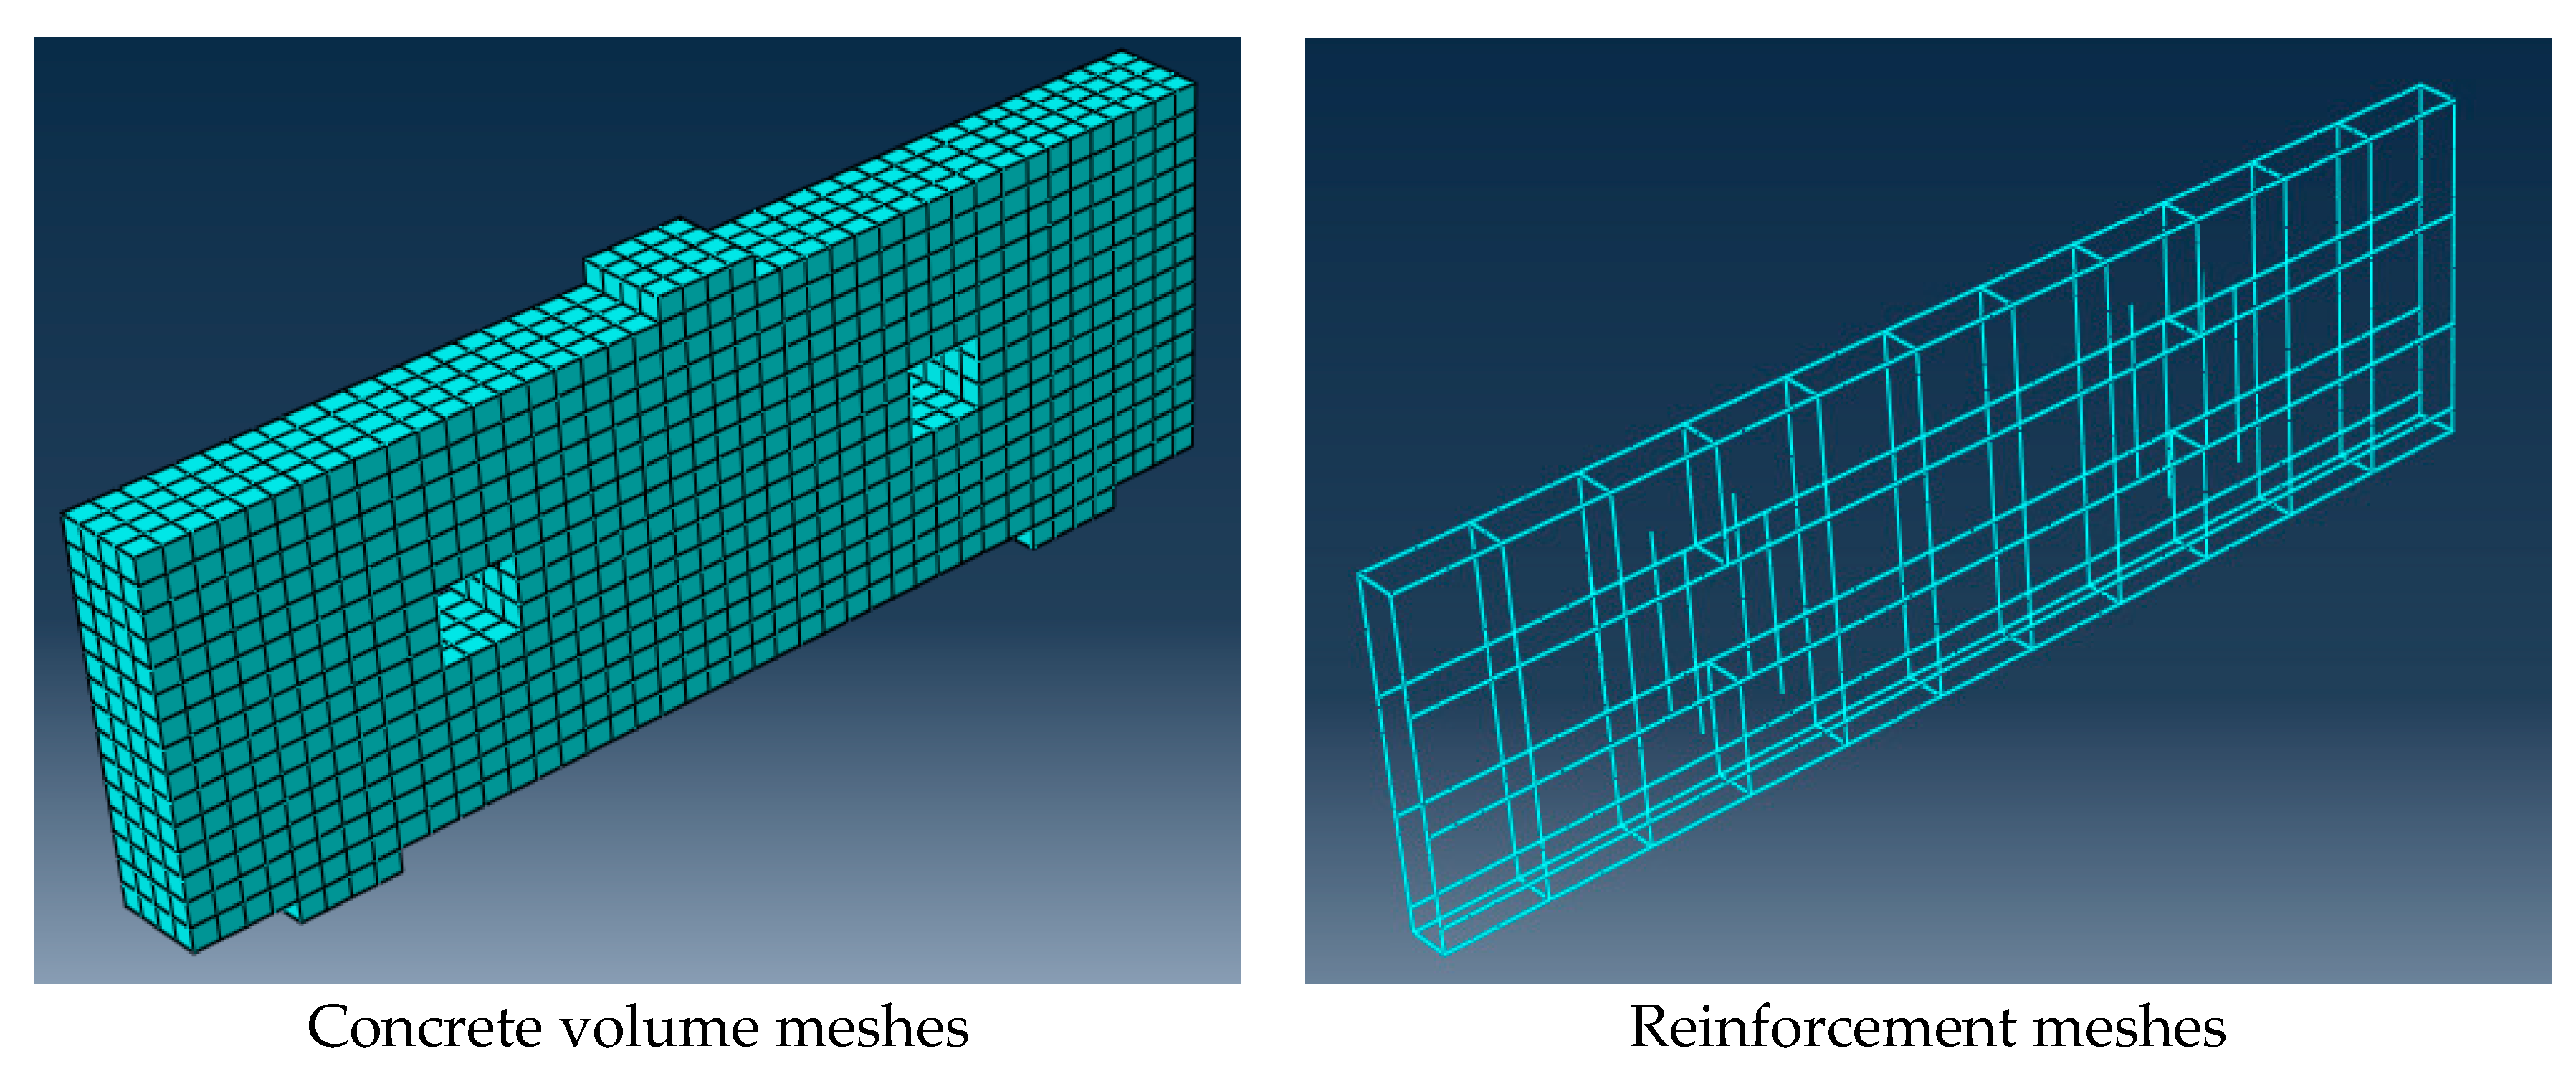
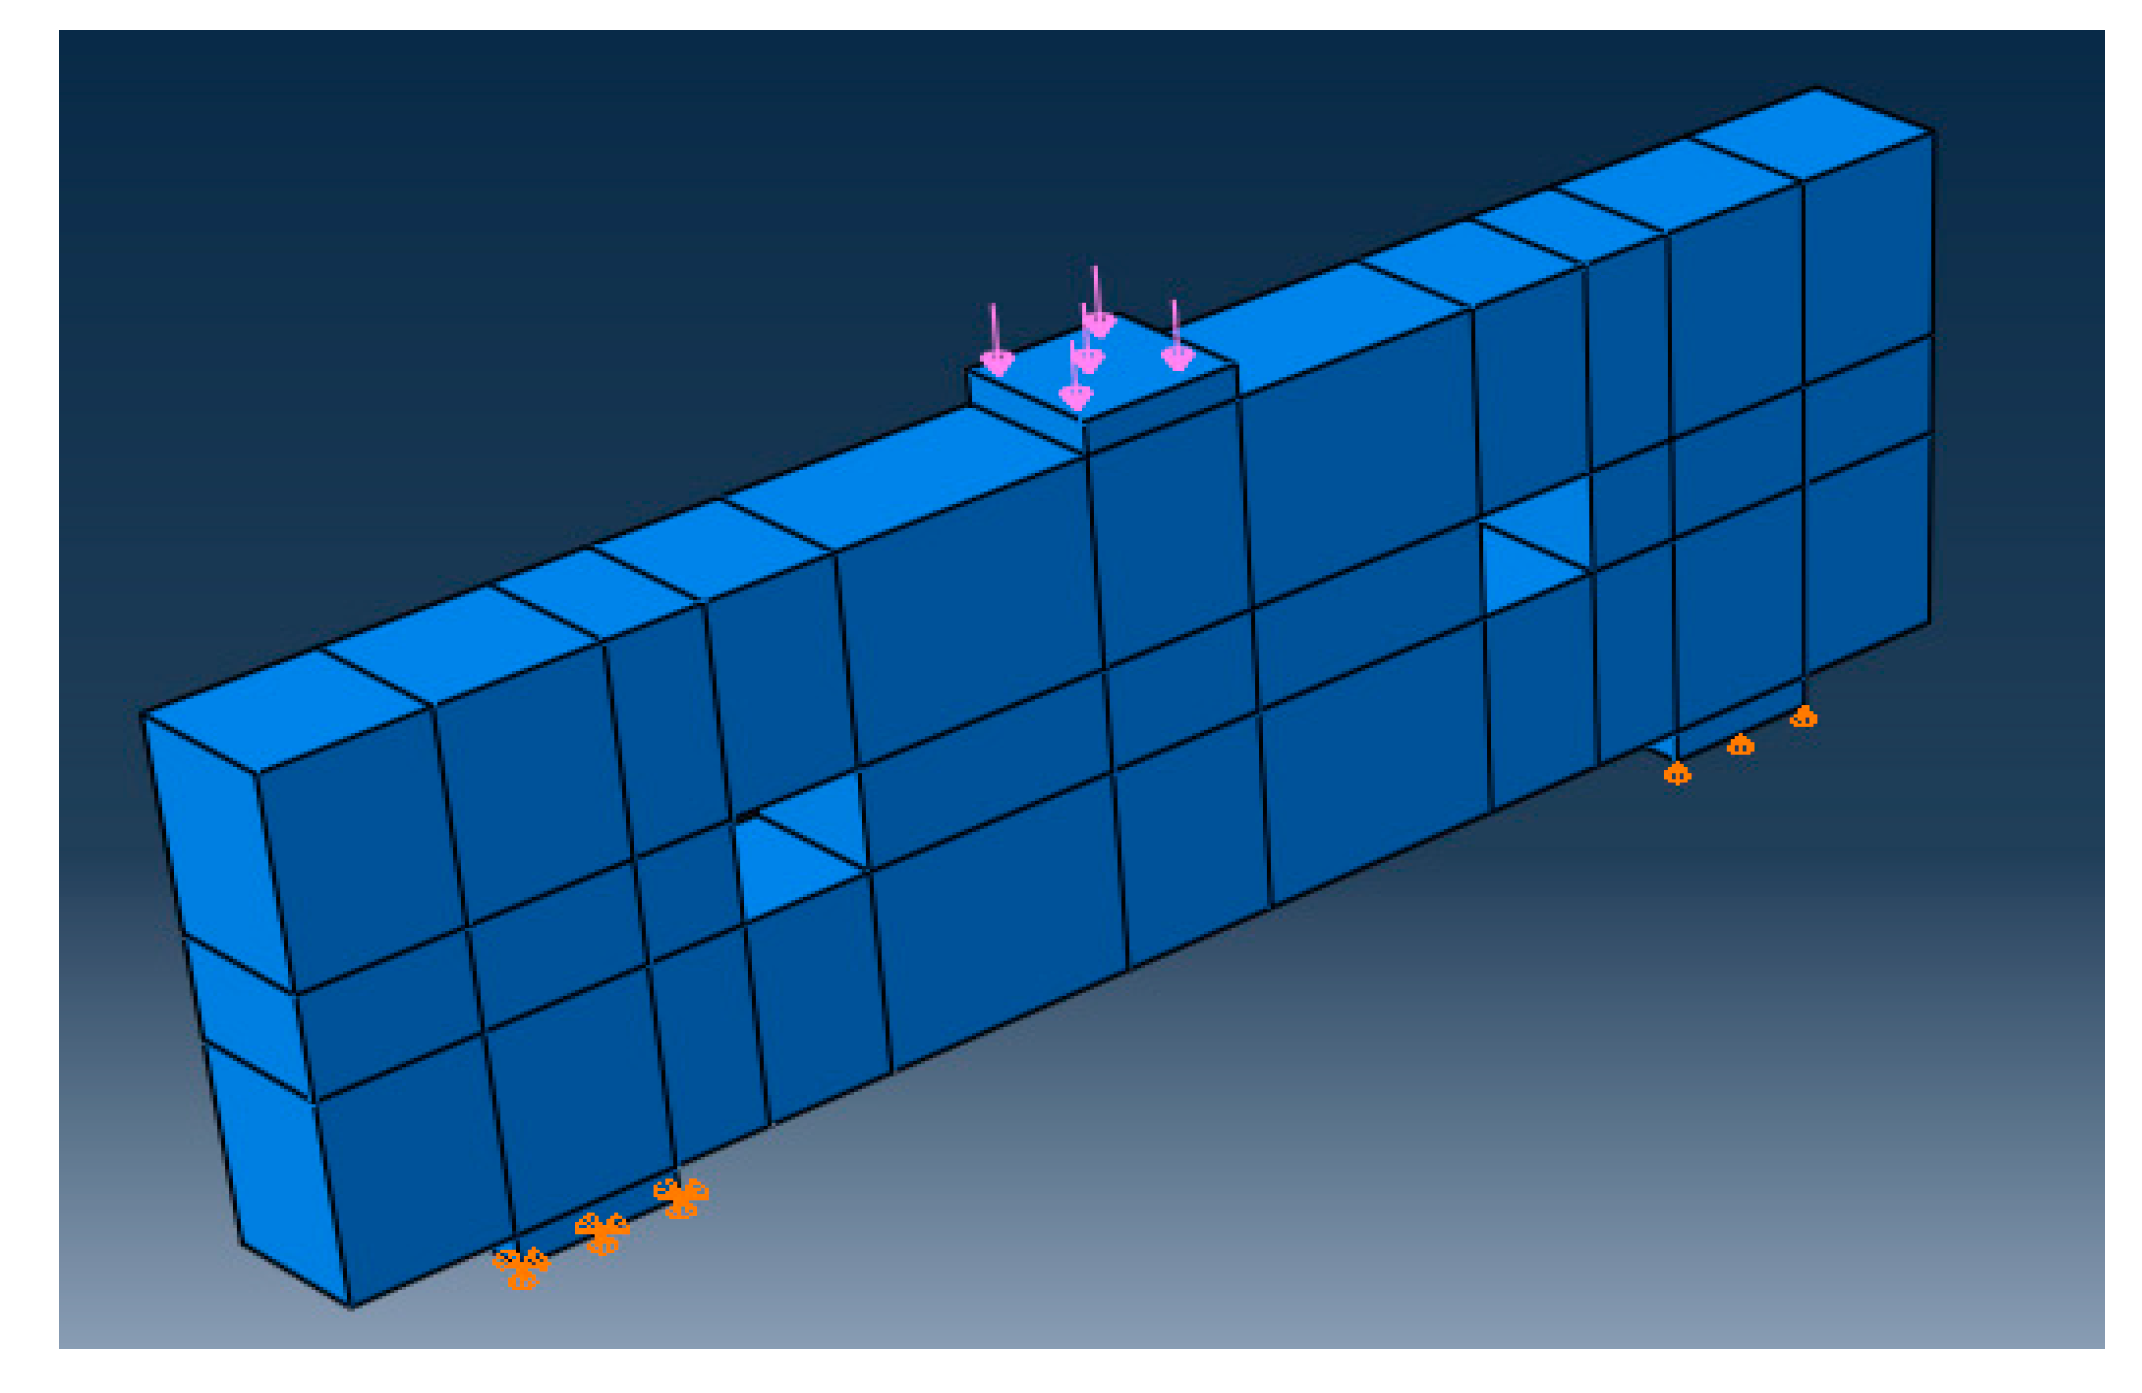
where Eo is the concrete’s initial elastic stiffness and εt and εc are the total tensile and compressive strains, respectively. The expansion angle ψ and eccentricity λ are yield surface flow rule parameters that have been set to 300 and 0.10, respectively. The yield surface shape is controlled by the parameter K, which is equal to 0.1667. μ is the CDP model’s viscosity parameter, which is equal to 0.0005 to satisfy the accuracy and convergence. In this model, a nonlinear concrete and reinforcement constitutive model is implemented. Concrete is constructed using a three-dimensional reinforced concrete part called the solid element C3D8R, able to crack in tension and crush in compression. This element is specified by eight nodes having three translational degrees of freedom (x, y, and z) per node. The supports and bearings of point loads are modelled using three 25 mm thick rigid steel plates. The main beam reinforcement, stirrups, and additional reinforcement around openings are modelled using a bar truss element called T2D3. This element is made up of two nodes, each with two translational degrees of freedom (x and y). The contact between beam reinforcement and concrete is assumed to be perfect. All of the elements in the finite element model were purposefully given the same mesh size to make sure that each pair of distinct materials shared a node in order to provide accurate results. The concrete mesh size is 25 mm × 25 mm × 25 mm and longitudinal beam reinforcement and stirrups are 25 mm. Figure 9 displays the finite element meshing for some tested beams. To simulate the experimental test setup, the right support is hinged, and the left support is a roller. Figure 10 shows the applied load and boundary conditions of the tested beam. The modulus of elasticity Es and the Poisson’s ratio of reinforcement were taken as equal to 2 × 10⁵ MPa and 0.30, respectively. The yield strengths for tension, compression, and stirrups reinforcement were taken as the experimental that is equal to 410 MPa, 407.60 MPa, and 260.2 MPa, respectively. The experimental stress-strain curve for the cylinders with and without WGP that were used in the FEM is illustrated in Figure 3. The Poisson’s ratio of concrete was taken as equal to 0.2.
σt = (1 − dt) x Eo (εt − εt−pl)
σt = (1 − dc) x Eo (εc − εc−pl)
7.2. Finite Element Results
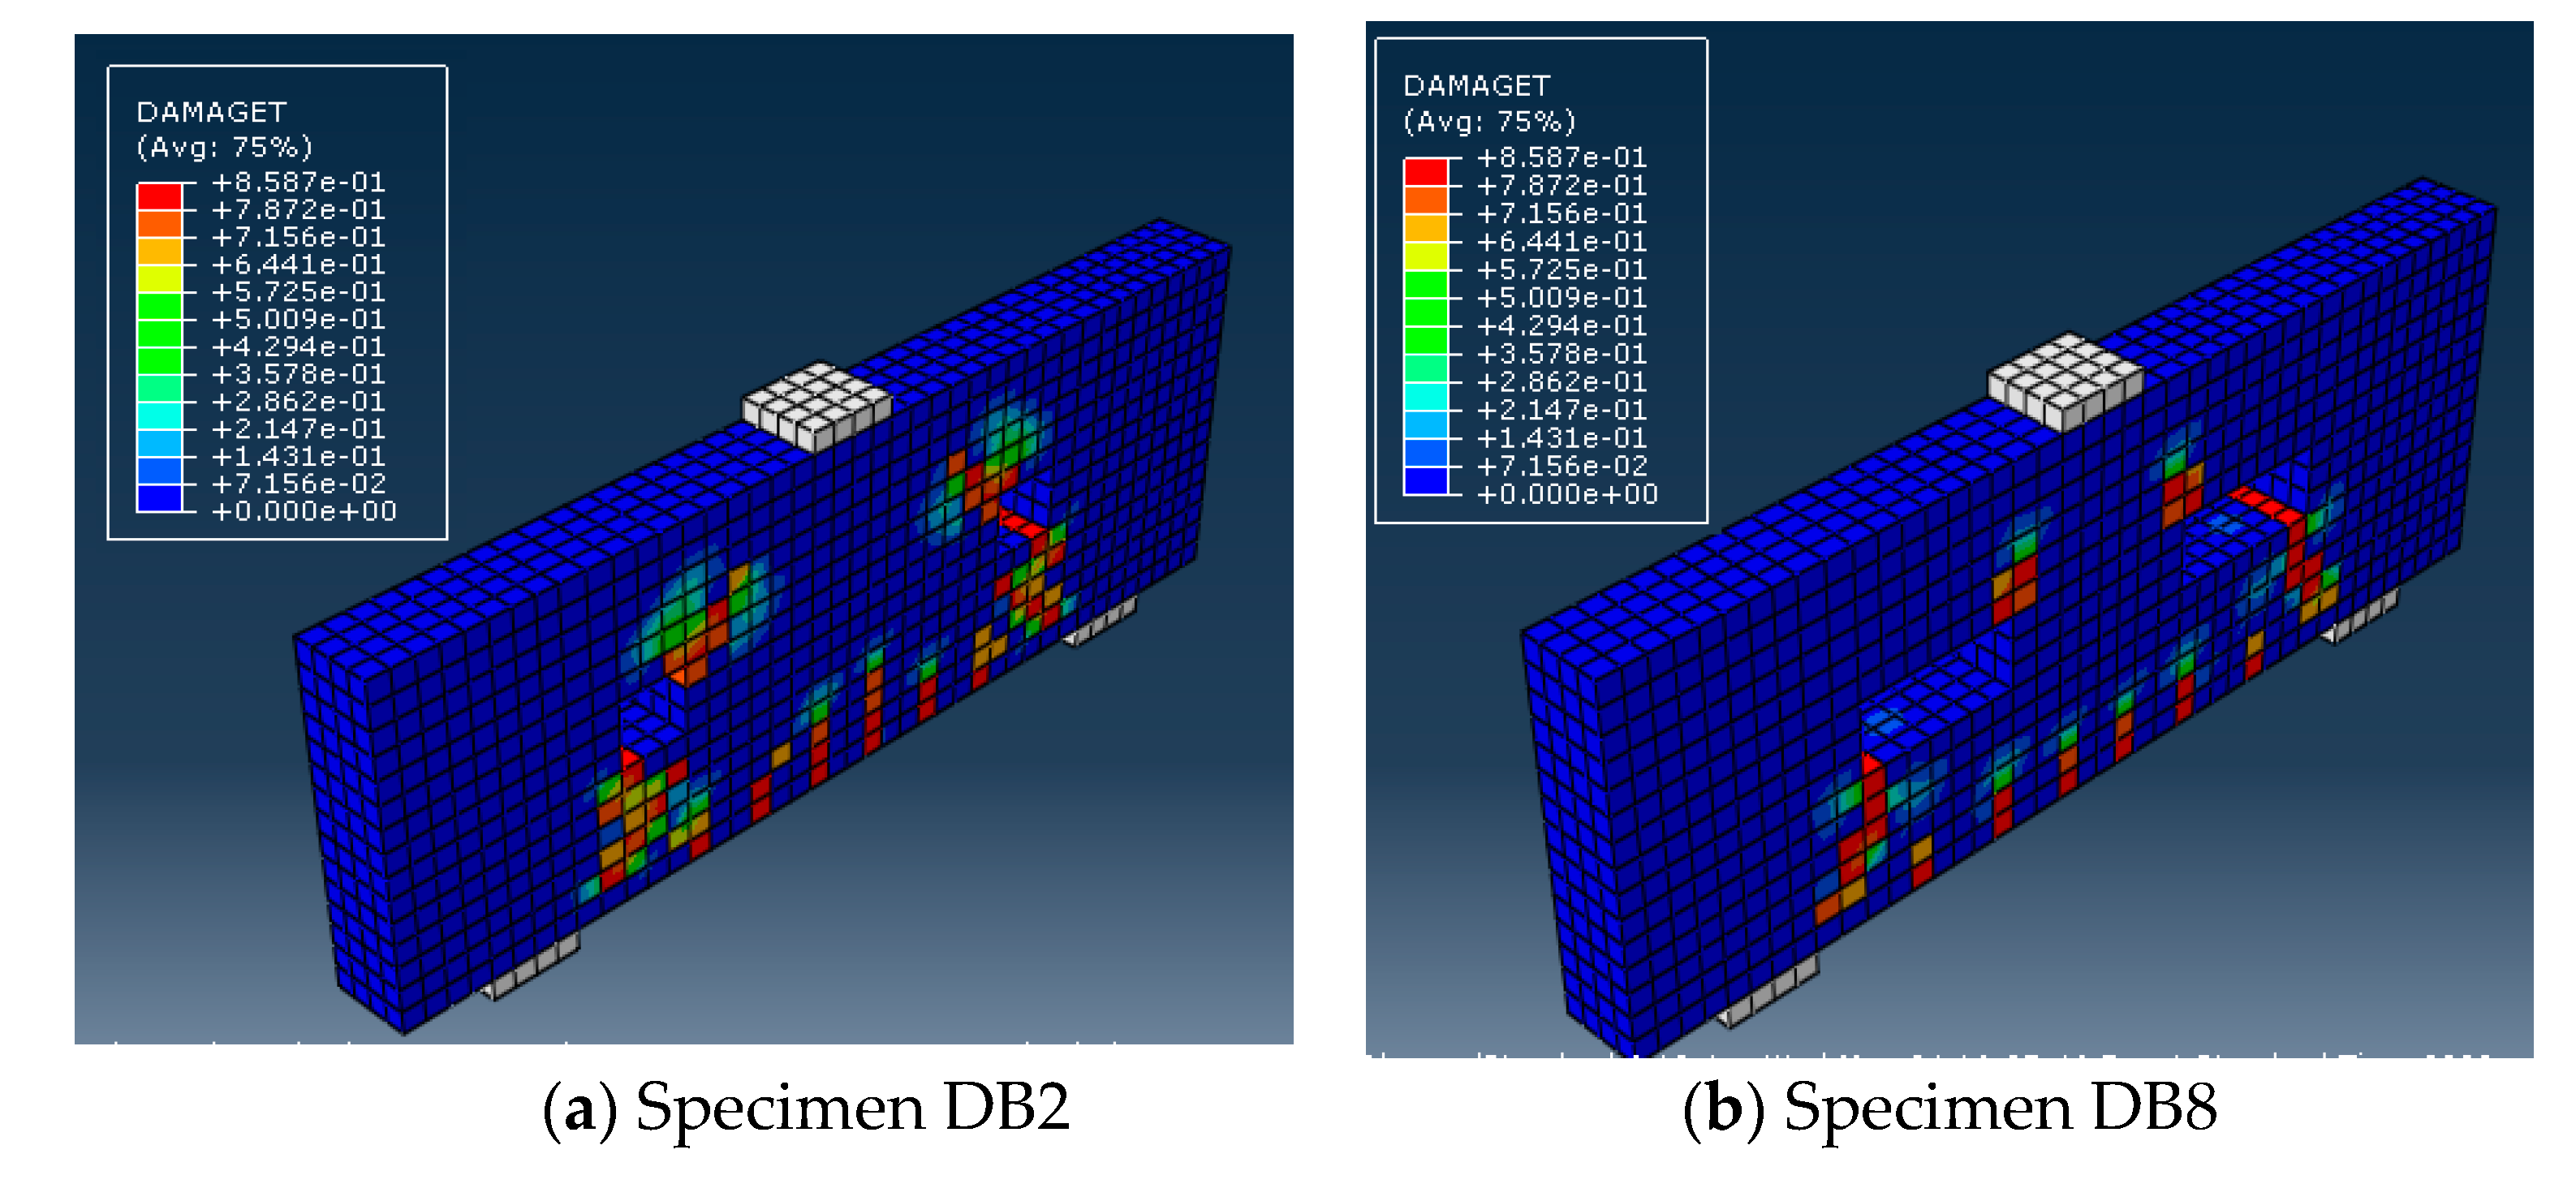
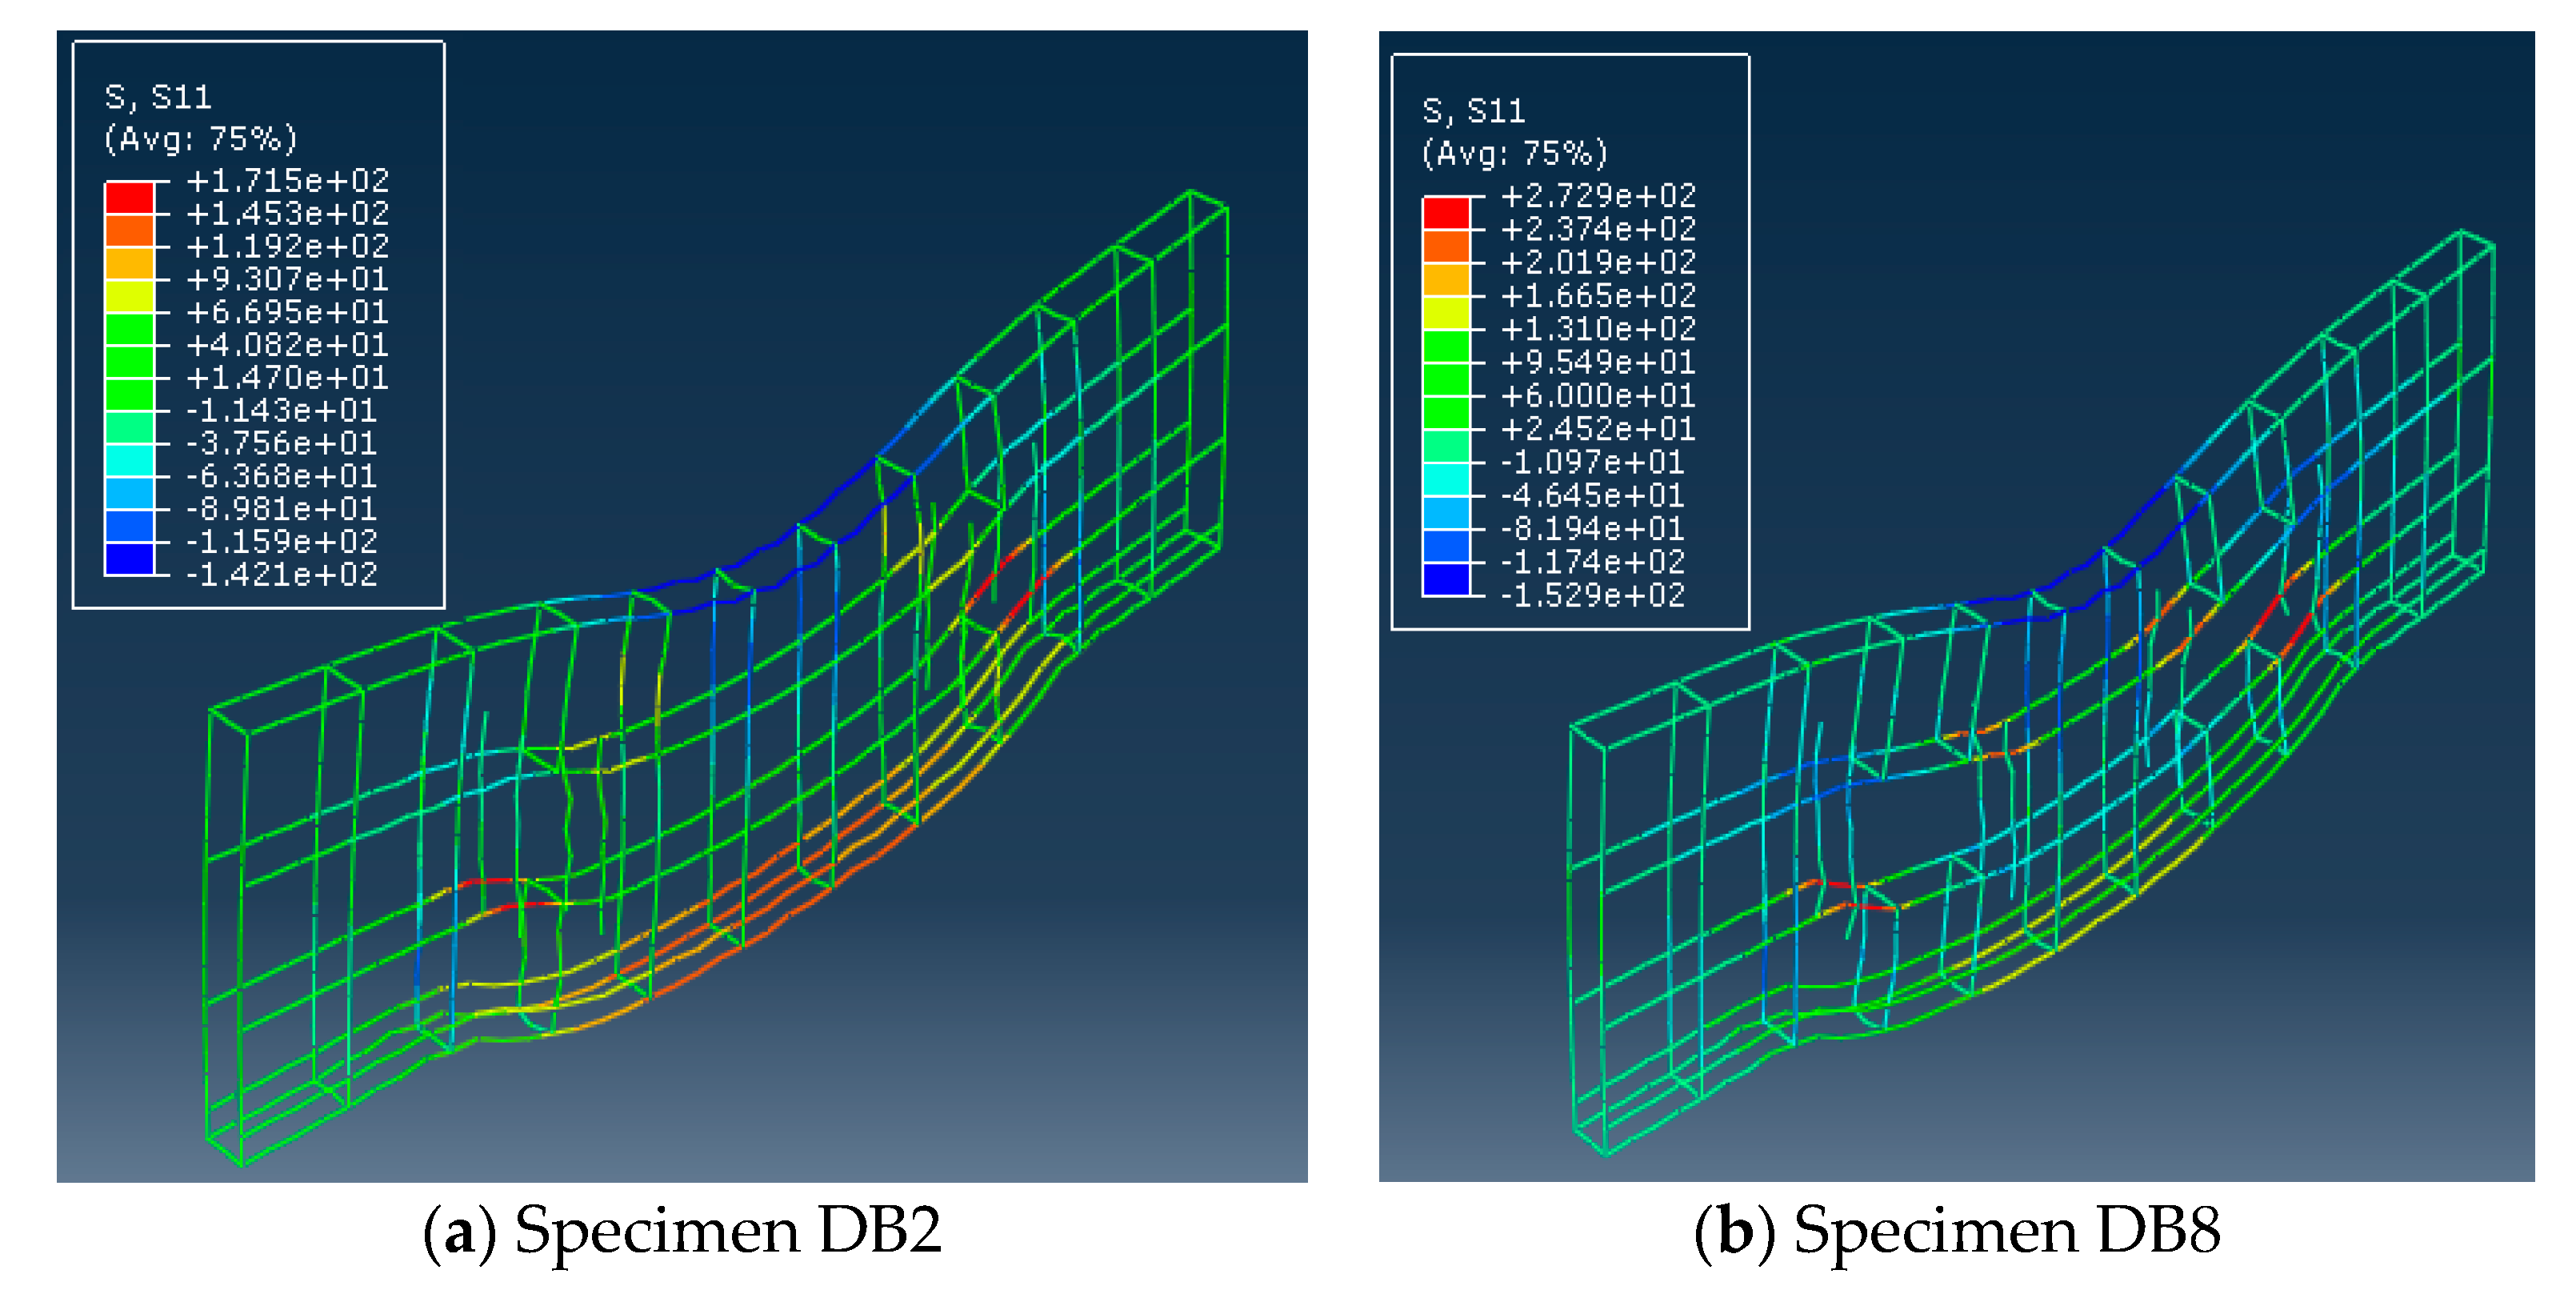
Table 8 indicates the maximum deflection and the ultimate load predicted from the FEM. The analytical results showed that, for all analyzed deep beams, at about 30% of the analytical ultimate load the first vertical cracks were created in the zone of the highest bending moment, and cracks were also formed in the corner of openings. A sudden inclined tension crack was created in the center of the shear span at about 45% of the analytical ultimate load and as the load increased, the inclined cracks spread. Meanwhile, the cracks propagated to point load above openings, and down to supports. With more growth in the applied load, the current vertical flexural and inclined shear cracks were created parallel to the initially inclined cracks in the shear span. The cracking patterns during failure using the FEM are shown in Figure 11 for some of the tested beams with and without WGP. Furthermore, the results revealed that the experimental and finite element crack patterns were identical. At the ultimate load, diagonal cracks form an angle of around 45° causing the shear collapse of the tested beams. It should be noted that, in the nonlinear analysis, the tensile stresses are transferred to steel bars through the cracking of concrete. As all beams with and without web opening were reinforced with a high longitudinal reinforcement ratio, all the beams also failed in shear before longitudinal reinforcement yielded. This could be noticed in Figure 12 for part of the evaluated beams. Finally, the finite element results showed that the highest concrete crushing strength was generated commonly around the openings.
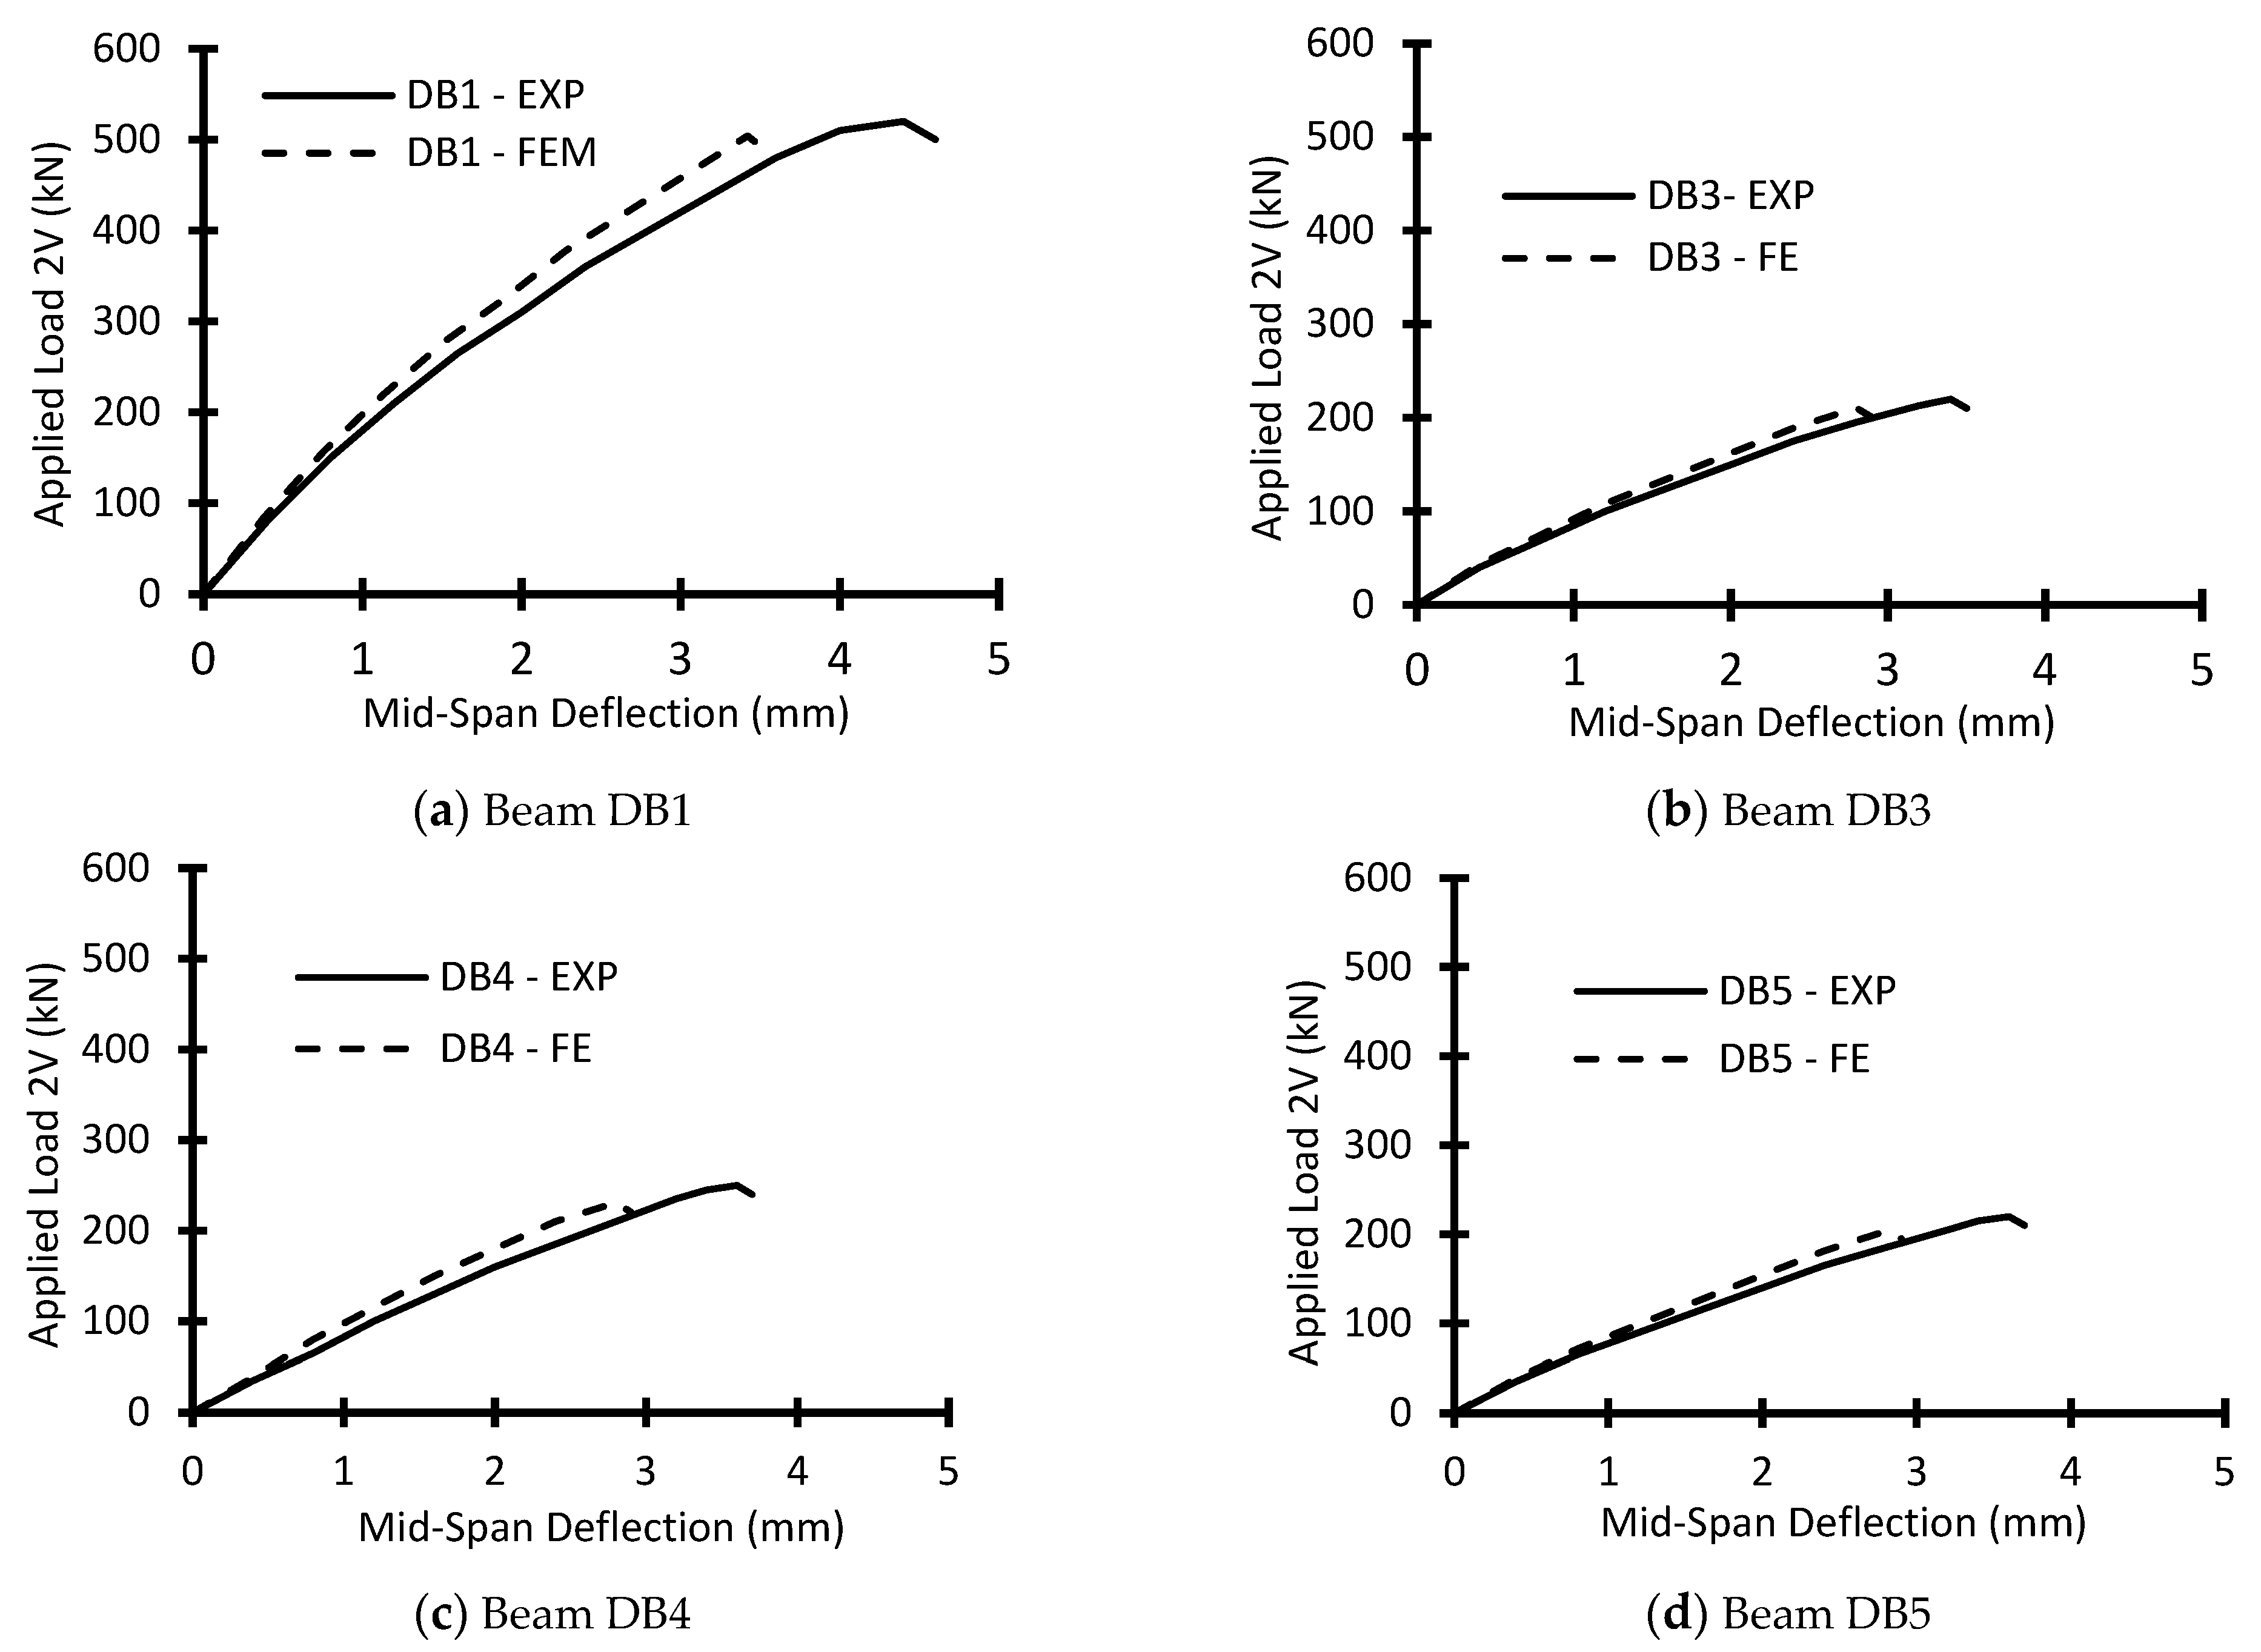
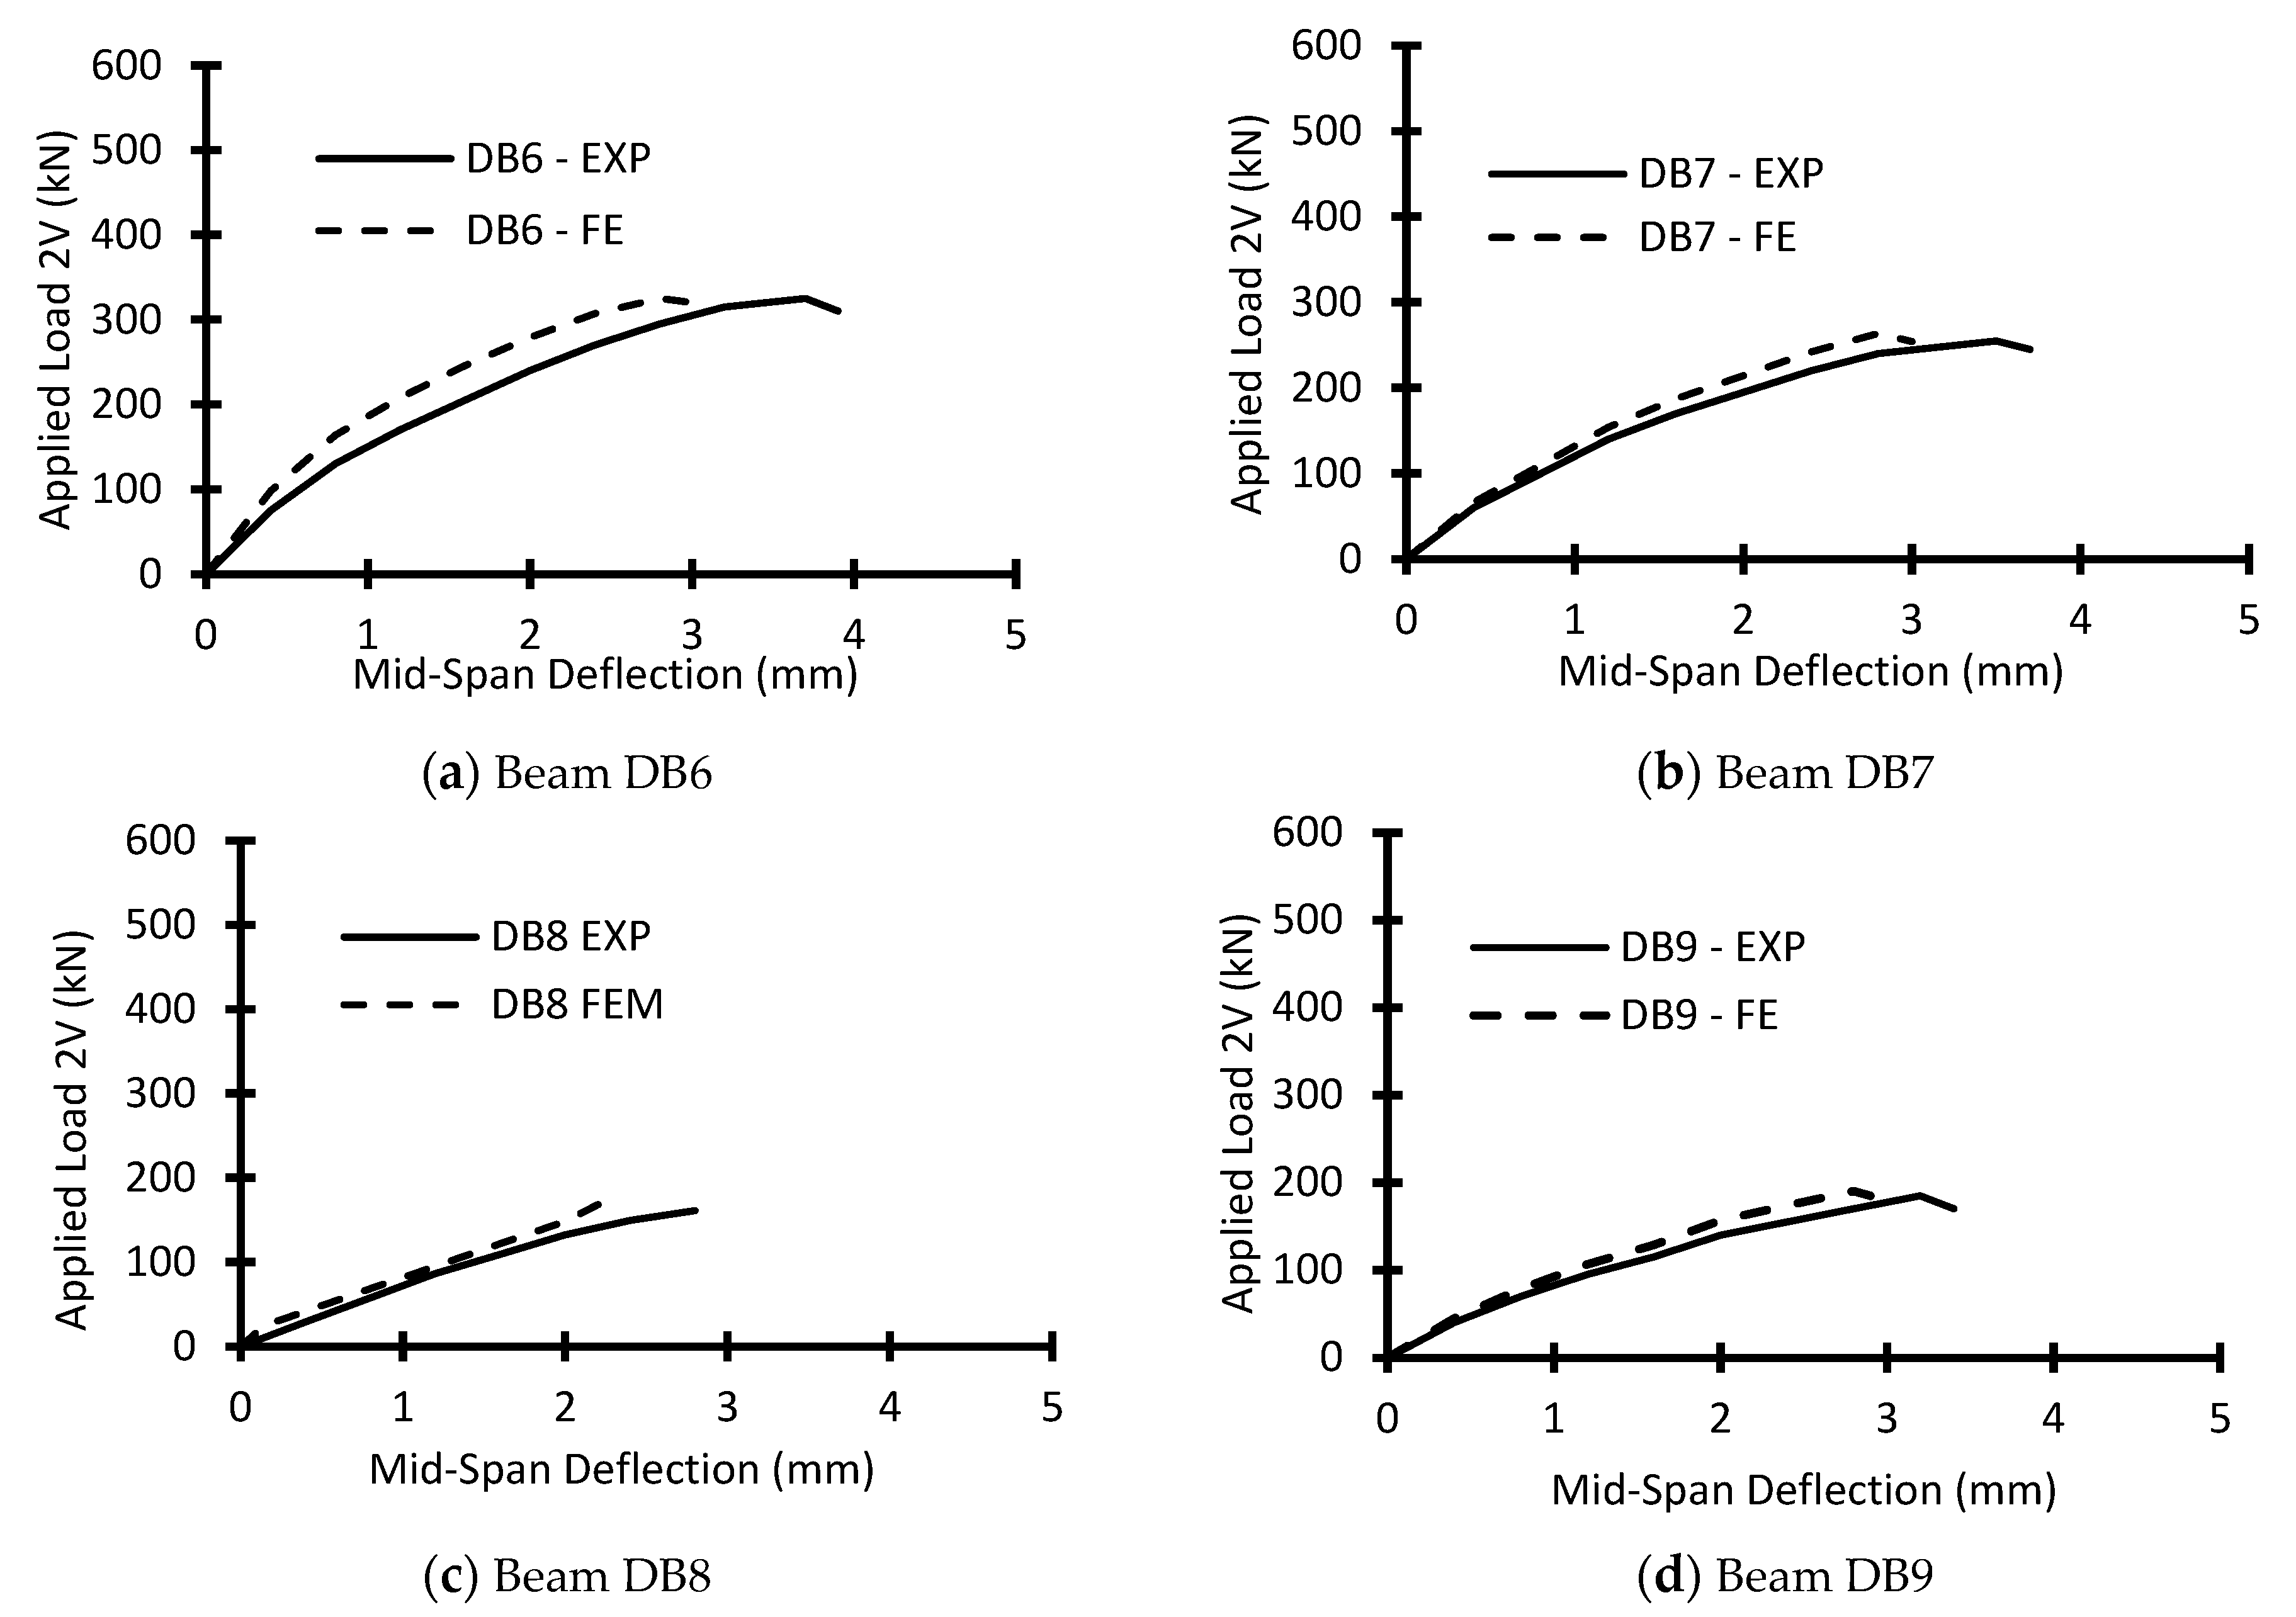
8. Comparison between Numerical and STM via Experimental Results
Table 9 shows a contrast between the experimental ultimate failure load for the examined deep beams with and without WGP, VuEXP, and that estimated from the nonlinear FEM, VuFEM. The mean values for the ratio of VuFEM to VuEXP of tested deep beams with and without WGP were 0.90 and 0.92, respectively. Table 9 also shows a comparison between the experimental mid-span deflections (∆EXP.) and that predicted using FEM (∆FEM) for the tested deep beams with and without WGP and this was about 0.80. This demonstrates that the nonlinear FEM simulation provides reliable estimates of the ultimate load for the tested deep beams with and without WGP. In addition, Figure 13 and Figure 14 show the load versus vertical displacement for both experimental and FEM of the studied deep beams, which indicated a reasonable agreement between experimental and FEM results. The results clearly showed that the adopted nonlinear FEM offers a valuable method to recognize the actions of web openings on the behavior of HSC deep beams with and without WGP. With the assistance of an extensive reference focused on strut-and-tie models for structural concrete members [25], Figure 15 shows the proposed STM of the studied deep beams with openings. Table 9 also shows the comparison between the ultimate failures loads estimated from STM with the experimental results. Three international codes were used to make this comparison: ACI 318-19, NZS-07, and JSCE-07. The results showed that the ACI 318-19 and JSCE-07 give a more applicable failure load for HSC deep beams with WGP where the average of the experimental ultimate load to that calculated from STM were 1.38 and 1.28 respectively. On the other hand, the JSCE-07 gives a more applicable failure load for HSC deep beams without WGP where the average of the experimental ultimate load to that calculated from STM was 1.35.
9. Conclusions
The subsequent conclusions can be drawn according to the findings of this examination of the behavior of HSC deep beams with and without web openings.
The cracking shear strength and the ultimate shear strength of WGP deep beams and with web openings were greater than those of the similar deep beams without WGP by about 17–25% and 12–41%, respectively. The improvement in the ultimate failure load could be attributed to the developed concrete microstructures caused by WGP’s very fine grains, producing further gel and decreasing the number of voids in the concrete matrix.
The existence of web openings that had opening height and width not exceeding 20% of the beam total height did not have a significant influence on the recorded ultimate loads for both HSC deep beams with and without WGP.
The decrease of ultimate shear strength in the presence of web openings that have a height exceeding 20% of the overall deep beam height at any location may reach 60%.
The development of the diagonal shear cracks of deep beams without WGP was considerably faster than that of the similar deep beams with WGP beams.
For deep beams with openings within the shear zone, the worst opening location is cutting a large distance from the load path. In this case, web openings led to further deterioration in the overall stiffness of a deep beam and, subsequently, a considerable decrease in the ultimate shear strength.
Accurate predictions of ultimate load, mid-span deflections, and failure modes of simple deep beams with and without WGP and with web openings were given by the adopted nonlinear finite element simulation.
The results showed that the ACI 318-19 and JSCE-07 give a more applicable failure load for HSC deep beams with WGP and having openings whereas the JSCE-07 gives a more applicable failure load for HSC deep beams without WGP.
Author Contributions
Conceptualization, M.A.E.-M. and A.S.A.E.-M.; methodology, M.A.E.-M., software, J.-W.H.; validation, M.A.E.-M. and J.-W.H.; formal analysis, M.A.E.-M.; investigation, A.S.A.E.-M. and J.-W.H.; resources, data curation, M.A.E.-M. and J.-W.H.; writing-original draft preparation, J.-W.H., writing-review and editing, A.S.A.E.-M. and J.-W.H.; visualization, M.A.E.-M.; supervision, J.-W.H.; project administration. All authors have read and agreed to the published version of the manuscript.
Funding
This work is supported by the Korea Agency for Infrastructure Technology Advancement (KAIA) grant funded by the Ministry of Land, Infrastructure and Transport (Grant RS-2022-00143541).
Institutional Review Board Statement
Not applicable.
Informed Consent Statement
Not applicable.
Data Availability Statement
All the data supporting reported results can be found in the manuscript.
Conflicts of Interest
The authors declare no conflict of interest.
References
- Jiang, Y.; Ling, T.C.; Mo, K.H.; Shi, C. A critical review of waste glass powder—Multiple roles of utilization in cement-based materials and construction products. J. Environ. Manag. 2019, 242, 440–449. [Google Scholar] [CrossRef] [PubMed]
- Abdelli, H.E.; Mokrani, L.; Kennouche, S.; de Aguiar, J.B. Utilization of waste glass in the improvement of concrete performance: A mini-review. Waste Manag. Res. J. 2020, 38, 1204–1213. [Google Scholar] [CrossRef] [PubMed]
- Elaqra, H.; Rustom, R. Effect of using glass powder as cement replacement on rheological and mechanical properties of cement paste. Constr. Build. Mater. J. 2018, 179, 326–335. [Google Scholar] [CrossRef]
- He, Z.H.; Zhan, P.M.; Du, S.G.; Liu, B.J.; Yuan, W.B. Creep behavior of concrete containing glass powder. Compos. Part B Eng. J. 2019, 166, 13–20. [Google Scholar] [CrossRef]
- Kamali, M.; Ghahremaninezhad, A. Effect of glass powders on the mechanical and durability properties of cementitious materials. Constr. Build. Mater. J. 2015, 98, 407–416. [Google Scholar] [CrossRef]
- Du, H.; Tan, K.H. Waste glass powder as cement replacement in concrete. J. Adv. Concr. Technol. 2014, 12, 468–477. [Google Scholar] [CrossRef]
- Zidol, A.; Tognonvi, M.T.; Hamou, A.T. Effect of glass powder on concrete sustainability. New J. Glass Ceram. 2017, 7, 34–47. [Google Scholar] [CrossRef]
- Elaqra, H.A.; Abou Haloub, M.A.; Rustom, R.N. Effect of new mixing method of glass powder as cement replacement on mechanical behavior of concrete. Constr. Build. Mater. J. 2019, 203, 75–82. [Google Scholar] [CrossRef]
- Bhat, V.V.; Rao, N.B. Influence of glass powder on the properties of concrete. Int. J. Eng. Trends Technol. (IJETT) 2014, 16, 196–199. [Google Scholar] [CrossRef]
- Mahmoud, A.S.; Mohamed, M.Y.; Hama, S.H. Effect of glass powder as partial replacement of cement on concrete strength and stress-strain relationship. In Proceedings of the IEEE 2019 12th International Conference on Developments in Systems Engineering (DESE), Kazan, Russia, 7–10 October 2019; pp. 109–114. [Google Scholar] [CrossRef]
- Raju, S.; Kumar, P.R. Effect of using glass powder in concrete. Int. J. Innov. Res. Sci. Eng. Technol. 2014, 3, 421–427. [Google Scholar]
- Anwar, A. The Influence of Waste Glass Powder as a Pozzolanic Material in Concrete. Int. J. Civ. Eng. Technol. 2016, 7, 131–148. [Google Scholar]
- Islam, G.M.S.; Rahman, M.H.; Kazi, N. Waste glass powder as partial replacement of cement for sustainable concrete practice. Int. J. Sustain. Built Environ. 2017, 6, 37–44. [Google Scholar] [CrossRef]
- Hama, S.M.; Mahmoud, A.S.; Yassen, M.M. Flexural behavior of reinforced concrete beam incorporating waste glass powder. Struct. J. 2019, 20, 510–518. [Google Scholar] [CrossRef]
- Makki, R.F.; Jassem, A.T.; Jassem, H.A. Behavior of reactive-powder concrete deep beams with CFRP-strengthened openings. Pract. Period. Struct. Des. Constr. 2019, 24, 04019016. [Google Scholar] [CrossRef]
- ACI Committee 363. State-of-the-Art Report on High-Strength Concrete ACI 363R-92; American Concrete Institute: Farmington Hills, MI, USA, 1997. [Google Scholar]
- Hashem, M.F. Behavior of Reinforced HSC Deep Beams with Web Openings. Master’s Thesis, Mansoura University, Mansura, Egypt, 2007. [Google Scholar]
- Yoo, T.M. Strength and Behavior of High Strength Concrete Deep Beam with Web Openings. Ph.D. Thesis, Griffith University, Brisbane, Australia, 2011. [Google Scholar]
- Hassan, M.H.; Arab, M.A.; El-Kassas, A.I. Behavior of high strength self-compacted concrete deep beams with web openings. Helion 2019, 5, e01524. [Google Scholar] [CrossRef] [PubMed]
- El-Demerdash, W.E.; El-Metwally, S.E.; El-Zoughiby, M.E.; Ghaleb, A.A. Behavior of RC Shallow and Deep Beams with Openings Via the Strut-and-Tie Model Method and Nonlinear Finite Element. Arab. J. Sci. Eng. 2016, 41, 401–424. [Google Scholar] [CrossRef]
- ABAQUS. Abaqus Analysis User’s Manual Version 6.9; Dassault Systems Corp.: Providence, RI, USA, 2014. [Google Scholar]
- ACI Committee 318. Building Code Requirements for Reinforced Concrete and Commentary (ACI 318-19); American Concrete Institute: Farmington Hills, MI, USA, 2019. [Google Scholar]
- New Zealand Standard NZS 3101; Part 1. Concrete Structures Standard—The Design of Concrete Structures. Standards New Zealand: Wellington, New Zealand, 2007.
- JSCE. Standard Specifications for Concrete Structures 2007, Design; Japanese Society of Civil Engineers (JSCE): Tokyo, Japan, 2007. [Google Scholar]
- El-Metwally, S.E.; Chen, W.F. Structural Concrete: Strut-and-Tie Models for Unified Design; CRC Press: Boca Raton, FL, USA; Taylor & Francis Group: New York, NY, USA, 2016. [Google Scholar]
Figure 1.
The tested deep beams’ dimensions and reinforcement details.

Figure 2.
Size and location of the first and second group’s web openings.

Figure 3.
Stress–strain curves for HSC with and without WGP.

Figure 4.
Photograph showing a general view of the test setup.

Figure 5.
Applied load-mid span deflection for HSC with and without WGP deep beams. (a) Beams without WGP; (b) Beams with WGP.
Figure 5.
Applied load-mid span deflection for HSC with and without WGP deep beams. (a) Beams without WGP; (b) Beams with WGP.

Figure 6.
The crack pattern for the examined deep beams with WGP. (a) Specimen DB1; (b) Specimen DB2; (c) Specimen DB3; (d) Specimen DB4; (e) Specimen DB5.
Figure 6.
The crack pattern for the examined deep beams with WGP. (a) Specimen DB1; (b) Specimen DB2; (c) Specimen DB3; (d) Specimen DB4; (e) Specimen DB5.

Figure 7.
The crack pattern for the examined deep beams without WGP.

Figure 8.
Measured diagonal crack widths for the tested HSC with and without WGP deep beams.

Figure 9.
Meshing of specimens DB2 and DB7 using FEM.

Figure 10.
Applied load and boundary conditions.

Figure 11.
Crack patterns from FEM of some of the tested deep beams.

Figure 12.
Reinforcement stresses of some of the examined beams.

Figure 13.
Comparison between the experimental and numerical load–displacement curves for tested HSC beams with WGP. (a) Beam DB1; (b) Beam DB3; (c) Beam DB4; (d) Beam DB5.
Figure 13.
Comparison between the experimental and numerical load–displacement curves for tested HSC beams with WGP. (a) Beam DB1; (b) Beam DB3; (c) Beam DB4; (d) Beam DB5.

Figure 14.
Comparison between the experimental and numerical load–displacement curves for tested HSC beams without WGP (a) Beam DB6; (b) Beam DB7; (c) Beam DB8; (d) Beam DB9.
Figure 14.
Comparison between the experimental and numerical load–displacement curves for tested HSC beams without WGP (a) Beam DB6; (b) Beam DB7; (c) Beam DB8; (d) Beam DB9.

Figure 15.
Details of the proposed STM of the tested beams with openings.


Table 1.
Effective compressive strength of concrete in a strut fces.
| Code | fces |
|---|---|
| ACI 318-19 | fces = 0.85 ϕ fc′ βs, the factor ϕ is the material strength reduction factor and is equal to 0.75. The factor βs is the effectiveness factor of concrete strut and is equal to 1.0, 0.75, 0.40, and 0.60 for prismatic strut, bottle-shaped strut, struts in tension members, and for all other cases, respectively. |
| NZS-06 | fces = ϕ βs α1 fc′, α1 = 0.85 − 0.004 (fc′ − 55) > 0.75, the factors ϕ and βs are the same as the ACI 318-19. |
| JSCE-07 | fces = ν1 ν2 fc′/γb, the factor ν1 is the reduction factor and taken as equal to 0.85. The factor ν2 is equal to 1.00 and 0.80 for un-cracked struts and struts with cracks parallel to the strut, respectively. Factor γb is the concrete strength reduction factor and is equal to 1.30. |
Table 2.
Effective compressive strength of the concrete in a nodal zone, fcen.
| Code | fcen |
|---|---|
| ACI 318-19 | fcen = 0.85 ϕ fc′ βn, where the factor βn is the effectiveness factor for nodal zones and is equal to 1.00, 0.8, 0.6, and 0.4 for *C–C–C node, *C–C–T node, *C–T–T node, *T–T–T node, respectively. |
| NZ-06 | fcen = ϕ α1 βn fc’, the factor βn is the same as the ACI 318-19. |
| JSCE-07 | fcen = ν1 ν2 fc′/γb, the factor ν2 is equal to 1.00 for both *C–C–C node and 0.80 for *C-C-T node. |
*C-C-C node surrounded by compression struts only, *C−C−T nodal zone surrounded by one tension tie and compression struts,*C−T−T nodal zone surrounded by two tension ties and a compression strut, and *T−T−T nodal zone surrounded by tension ties.
Table 3.
The Nominal Tensile Force of a tie Fnt.
| Code | Fnt |
|---|---|
| ACI 318-19 and NZ-06 | Fnt = ϕ Ast fy, where fy and Ast are the yield stress and the cross-section area of the longitudinal steel reinforcement, respectively. |
| JSCE-07 | Fnt = Ast fy/γs, the factor γs is the factor of safety for steel and is equal to 1.15. |
Table 4.
Test specimen details.
| Group | Beam Notation | fc′ (MPa) | (a/d) Ratio | Vertical Web Reinforcement | Opening Size (mm) | Distance from the Beam Edge to the Opening Side (x) (mm) | |
|---|---|---|---|---|---|---|---|
| sv (mm) | (ρv = Av/sv b) % | ||||||
| 1 (with WGP) | DB1 | 69.6 | 0.97 | 100 | 0.707 | - | - |
| DB2 | 69.6 | 0.97 | 100 | 0.707 | 80 × 80 | 260 | |
| DB3 | 69.6 | 0.97 | 200 | 0.354 | 180 × 80 | 260 | |
| DB4 | 69.6 | 0.97 | 160 | 0.442 | 140 × 80 | 320 | |
| DB5 | 69.6 | 2.08 | 160 | 0.442 | 140 × 80 | 320 | |
| 2 (without WGP) | DB6 | 55.2 | 0.97 | 100 | 0.707 | - | - |
| DB7 | 55.2 | 0.97 | 100 | 0.707 | 80 × 80 | 260 | |
| DB8 | 55.2 | 0.97 | 200 | 0.354 | 180 × 80 | 260 | |
| DB9 | 55.2 | 0.97 | 160 | 0.442 | 140 × 80 | 320 | |
| DB10 | 55.2 | 2.08 | 160 | 0.442 | 140 × 80 | 320 | |
Table 5.
Chemical composition of ordinary Portland cement.
| Composition | SiO2 | Al2O3 | CaO | Fe2O3 | MgO | K2O | Na2O | SO3 |
| 19.39 | 4.13 | 55.66 | 4.70 | 1.70 | 0.28 | 0.31 | 3.90 |
Table 6.
Concrete mix proportions per one cubic meter (1.0 m3).
| Mix. No. | WGP % | Cement Kg/m3 | WGP Kg/m3 | Superplasticizer kg/m3 | Fine Aggregates (Sand) Kg/m3 | Coarse Aggregates (Crushed Limestone) Kg/m3 | Water Kg/m3 | Water/Binder Ratio |
|---|---|---|---|---|---|---|---|---|
| 1 | 0 | 470 | 0 | 3.38 | 681 | 1065 | 179 | 0.38 |
| 2 | 20 | 376 | 94 | 3.66 | 681 | 1065 | 179 | 0.38 |
Table 7.
Summary of test results.
| Group | Beam | Shear Cracking Loads 2Vcrs (kN) | Failure Load 2VuEXP (kN) | Exp. Max. Defl. at Failure Load (mm) | Vcrs/VuEXP | 2VuEXP/[b d1 (fc′)0.5] | Mode Failure |
|---|---|---|---|---|---|---|---|
| With WGP | DB1 | 120 | 520 | 4.20 | 0.25 | 2.16 | Shear |
| DB2 | 100 | 390 | 4.00 | 0.30 | 2.03 | Opening | |
| DB3 | 60 | 220 | 3.40 | 0.27 | 1.15 | Opening | |
| DB4 | 60 | 250 | 3.60 | 0.24 | 1.30 | Opening | |
| DB5 | 60 | 220 | 3.50 | 0.27 | 1.15 | Opening | |
| Without WGP | DB6 | 100 | 368 | 3.70 | 0.31 | 2.02 | Shear |
| DB7 | 80 | 276 | 3.50 | 0.33 | 1.88 | Opening | |
| DB8 | 60 | 161 | 2.80 | 0.43 | 1.10 | Opening | |
| DB9 | 60 | 210 | 3.10 | 0.22 | 1.41 | Opening | |
| DB10 | 40 | 196 | 3.20 | 0.23 | 1.33 | Opening |
b: breadth of the beam cross-section. d1: deducting the web opening height from the beam depth.
Table 8.
Maximum strain for both stirrups and longitudinal bars.
| Beam | Maximum Bar Strain (Micro-Strain) | |
|---|---|---|
| For Stirrups | For Longitudinal Bottom Bar Reinforcement at G5 | |
| DB1 | 0.00047 | 0.000621 |
| DB2 | 0.00044 | 0.000582 |
| DB3 | 0.00040 | 0.000531 |
| DB4 | 0.00043 | 0.000569 |
| DB5 | 0.00041 | 0.000543 |
| DB6 | 0.00042 | 0.000556 |
| DB7 | 0.00040 | 0.000535 |
| DB8 | 0.00031 | 0.000413 |
| DB9 | 0.00033 | 0.000439 |
| DB10 | 0.00032 | 0.000426 |
Table 9.
Comparison between the experimental ultimate load of the tested deep beams with and without WGP and that predicted from both the FEM and STM.
Table 9.
Comparison between the experimental ultimate load of the tested deep beams with and without WGP and that predicted from both the FEM and STM.
| Group | Beam | Experimental (EXP) | FEM | FEM/EXP | 2VuExp/2VSTM | |||||
|---|---|---|---|---|---|---|---|---|---|---|
| ∆EXP. (mm) | 2VuExp (kN) | ∆FEM (mm) | 2VUFEM. (kN) | ∆FEM/∆EXP. | 2VUFEM. /2VuExp | ACI 318-19 | NZS-06 | JSEC-07 | ||
| 1 (with WGP) | DB1 | 4.20 | 520 | 3.30 | 497 | 0.79 | 0.96 | 1.64 | 1.76 | 1.52 |
| DB2 | 4.00 | 390 | 3.16 | 418 | 0.79 | 1.07 | 1.80 | 1.94 | 1.65 | |
| DB3 | 3.40 | 220 | 2.72 | 206 | 0.80 | 0.94 | 0.93 | 0.88 | 0.92 | |
| DB4 | 3.45 | 290 | 2.75 | 258 | 0.80 | 0.89 | 1.27 | 1.38 | 1.18 | |
| DB5 | 3.60 | 250 | 2.86 | 229 | 0.79 | 0.92 | 1.24 | 1.33 | 1.13 | |
| 2 (without WGP) | DB6 | 3.70 | 368 | 2.93 | 401 | 0.79 | 1.08 | 1.87 | 1.66 | 1.71 |
| DB7 | 3.50 | 276 | 2.79 | 298 | 0.80 | 1.07 | 2.03 | 1.82 | 1.86 | |
| DB8 | 2.80 | 161 | 2.29 | 176 | 0.82 | 1.09 | 0.92 | 0.82 | 0.97 | |
| DB9 | 3.10 | 210 | 2.50 | 224 | 0.81 | 1.06 | 1.06 | 1.01 | 1.03 | |
| DB10 | 3.20 | 196 | 2.57 | 214 | 0.80 | 1.09 | 1.68 | 1.46 | 1.64 | |
| Total Average | 1.44 | 1.41 | 1.36 | |||||||
| HSC with WGP Average | 1.38 | 1.46 | 1.28 | |||||||
| HSC without WGP Average | 1.51 | 1.35 | 1.44 | |||||||
Publisher’s Note: MDPI stays neutral with regard to jurisdictional claims in published maps and institutional affiliations. |
© 2022 by the authors. Licensee MDPI, Basel, Switzerland. This article is an open access article distributed under the terms and conditions of the Creative Commons Attribution (CC BY) license (https://creativecommons.org/licenses/by/4.0/).
Share and Cite
MDPI and ACS Style
El-Mandouh, M.A.; Hu, J.-W.; Abd El-Maula, A.S. Behavior of Waste Glass Powder in Concrete Deep Beams with Web Openings. Buildings 2022, 12, 1334. https://doi.org/10.3390/buildings12091334
AMA Style
El-Mandouh MA, Hu J-W, Abd El-Maula AS. Behavior of Waste Glass Powder in Concrete Deep Beams with Web Openings. Buildings. 2022; 12(9):1334. https://doi.org/10.3390/buildings12091334
Chicago/Turabian StyleEl-Mandouh, Mahmoud A., Jong-Wan Hu, and Ahmed S. Abd El-Maula. 2022. "Behavior of Waste Glass Powder in Concrete Deep Beams with Web Openings" Buildings 12, no. 9: 1334. https://doi.org/10.3390/buildings12091334
Note that from the first issue of 2016, this journal uses article numbers instead of page numbers. See further details here.