
Study on Wind-Induced Response of Transmission Tower-Line System under Downburst Wind


1
School of Civil Engineering, Henan University of Science and Technology, Luoyang 471023, China
2
School of Civil Engineering, Chongqing University, Chongqing 400045, China
3
China Aerodynamics Research and Development Center, Mianyang 621010, China
*
Author to whom correspondence should be addressed.
Buildings 2022, 12(7), 891; https://doi.org/10.3390/buildings12070891
Submission received: 25 May 2022
/
Revised: 17 June 2022
/
Accepted: 23 June 2022
/
Published: 24 June 2022
(This article belongs to the Special Issue Wind Nonlinear Analysis of Tall Buildings, High-Rise Structures, Flexible Bridges and Transmission Lines)
Abstract
:Downburst is the main source of extreme wind speed in non-typhoon areas, which has caused a large amount of transmission line damage all over the world. In order to reveal the wind-induced vibration response characteristics of a transmission tower-line system under downburst, the nonlinear dynamic analysis of a single tower and tower-line system is carried out, and the amplification effect of tower-line coupling and fluctuating wind on the dynamic response is studied. Then, the effects of three wind field parameters closely related to the average wind profile on the wind-induced response of the tower-line system are studied. The results show that under the action of the downburst, the tower-line coupling weakens the dynamic response to a certain extent, and the dynamic amplification factor of a single tower and tower-line system is 1.1 ~ 1.3; for the self-supporting tower, when the height of the peak wind speed is close to the height of tower, the responses of the structure are more unfavorable. When the vector superposition method is used, the storm moving speed (Vt) has little effect on the wind-induced response of the tower-line system. For large-span structures such as tower-line systems, to ensure the safety of the structural design, the value of the characteristic radius (Rc) should not be too small.
1. Introduction
The transmission tower-line system is a typical wind-sensitive structure with the characteristics of high flexibility, long span, and strong geometric nonlinearity. In the past, the wind-induced vibration response analysis of the transmission tower-line system mainly focused on the atmospheric boundary layer (ABL) wind field, and the value of the design wind load in the current code is mainly based on this kind of wind. However, meteorological data and relevant statistical information [1,2,3,4] show that most of the design wind speed in non-typhoon areas comes from extremely strong winds, such as downbursts generated in thunderstorm weather. Downbursts have caused a large amount of engineering structural damage around the world [5,6,7], among which the damage to transmission tower-line structures is particularly frequent and serious [8].
A downburst is a strong wind formed by high-density cold air hitting the ground during thunderstorms. Downbursts and their associated wind-induced pressure data have always challenged the wind engineering community due to their transient (i.e., non-stationary, short temporal scale) characteristics. Different from ABL wind, a downburst is a short-term local strong wind, which has significant non-stationary characteristics. The wind profile is quite different from the ABL wind, and the wind load changes with the relative position relationship between the structure and the storm center. For the wind-induced response analysis of long-span structures under extreme wind, although some scholars have carried out research based on a machine learning method at this stage [9,10,11], there is still little research on the response of transmission lines under downburst, and the research is mainly based on finite element simulation or test methods. To study the response characteristics of a transmission tower-line system under downburst, scholars have carried out a series of studies. The earliest research work was carried out by Savory et al. [12], who analyzed the response characteristics of a transmission tower under a tornado and downburst based on an empirical model. Shehata et al. [13] proposed a numerical model to analyze the structural performance of a guyed tower under downburst wind. On this basis, they further studied the wind field parameters affecting the structural performance of the guyed tower [14,15]. They believed that the structural performance was significantly affected by the jet diameter and the relative position relationship between the storm center and the tower. Damatty and Elawady [16] studied the response characteristics of various transmission towers under downburst and discussed the influence of structural parameters (tower type, height, conductor span, etc.) on the critical load condition of downburst wind.
The above studies are based on quasi-static analysis. The wind load comes from the time-varying average wind in the stationary downburst wind field, without considering the dynamic effects of storm movement and fluctuating wind. Darwish [17] made a simple vector superposition between the storm moving speed and the wind field of the stationary downburst in the study, ignoring the storm center movement, and concluded that the storm moving speed has no effect on the selection of critical load conditions, so this parameter cannot be considered in the analysis. However, this conclusion is based on the fact that the wind field of a moving downburst conforms to the principle of vector superposition. With the in-depth study of the storm movement effect, the correctness of this conclusion needs to be further verified [18,19]. To evaluate the dynamic amplification effect of turbulent wind on the transmission tower-line system, Darwish et al. [20] extracted the turbulence component from the field measurement results given by Holmes et al. [21], and analyzed the dynamic response of the transmission line. The results show that the background component accounts for the main part of the total response. After considering the turbulent dynamic effect, the maximum axial force of the components in the guyed tower increases by 15–20%. Aboshosha and Damatty [22] reached a similar conclusion in their research on the dynamic response of a transmission line; that is, after considering the dynamic response, the transverse force and longitudinal force transmitted from the line to the tower increased by only 5% and 6%, respectively. However, their research is mainly aimed at the conductor, and the dynamic effect of fluctuating wind in the tower-line coupling system is not considered. Wang et al. [23] studied the influence of downburst jet diameter on transmission towers with different heights, and compared the response characteristics of transmission towers under stationary and moving downbursts.
It can be seen from the above that although some research has been conducted on the wind-induced response of transmission lines under downburst, the research objects are mostly single towers or conductors, and the tower-line coupling effect and the dynamic effect of fluctuating wind in the coupling system are less considered. The wind load of the tower-line system is significantly affected by the horizontal wind profile of the downburst, but previous studies rarely involve the wind field parameters closely related to it. Therefore, based on the empirical model, this paper simulates the moving downburst wind field, studies the influence of tower-line coupling on the structural response in this wind field, and discusses the dynamic amplification effect caused by fluctuating wind load. In addition, this paper will also study the sensitivity of tower-line structure to key wind field parameters, and discuss the unfavorable value of wind field parameters.
2. Modeling of Transmission Tower-Line System under Downburst Wind Loads
2.1. Modeling of Transmission Tower-Line System
2.1.1. Finite Element Model
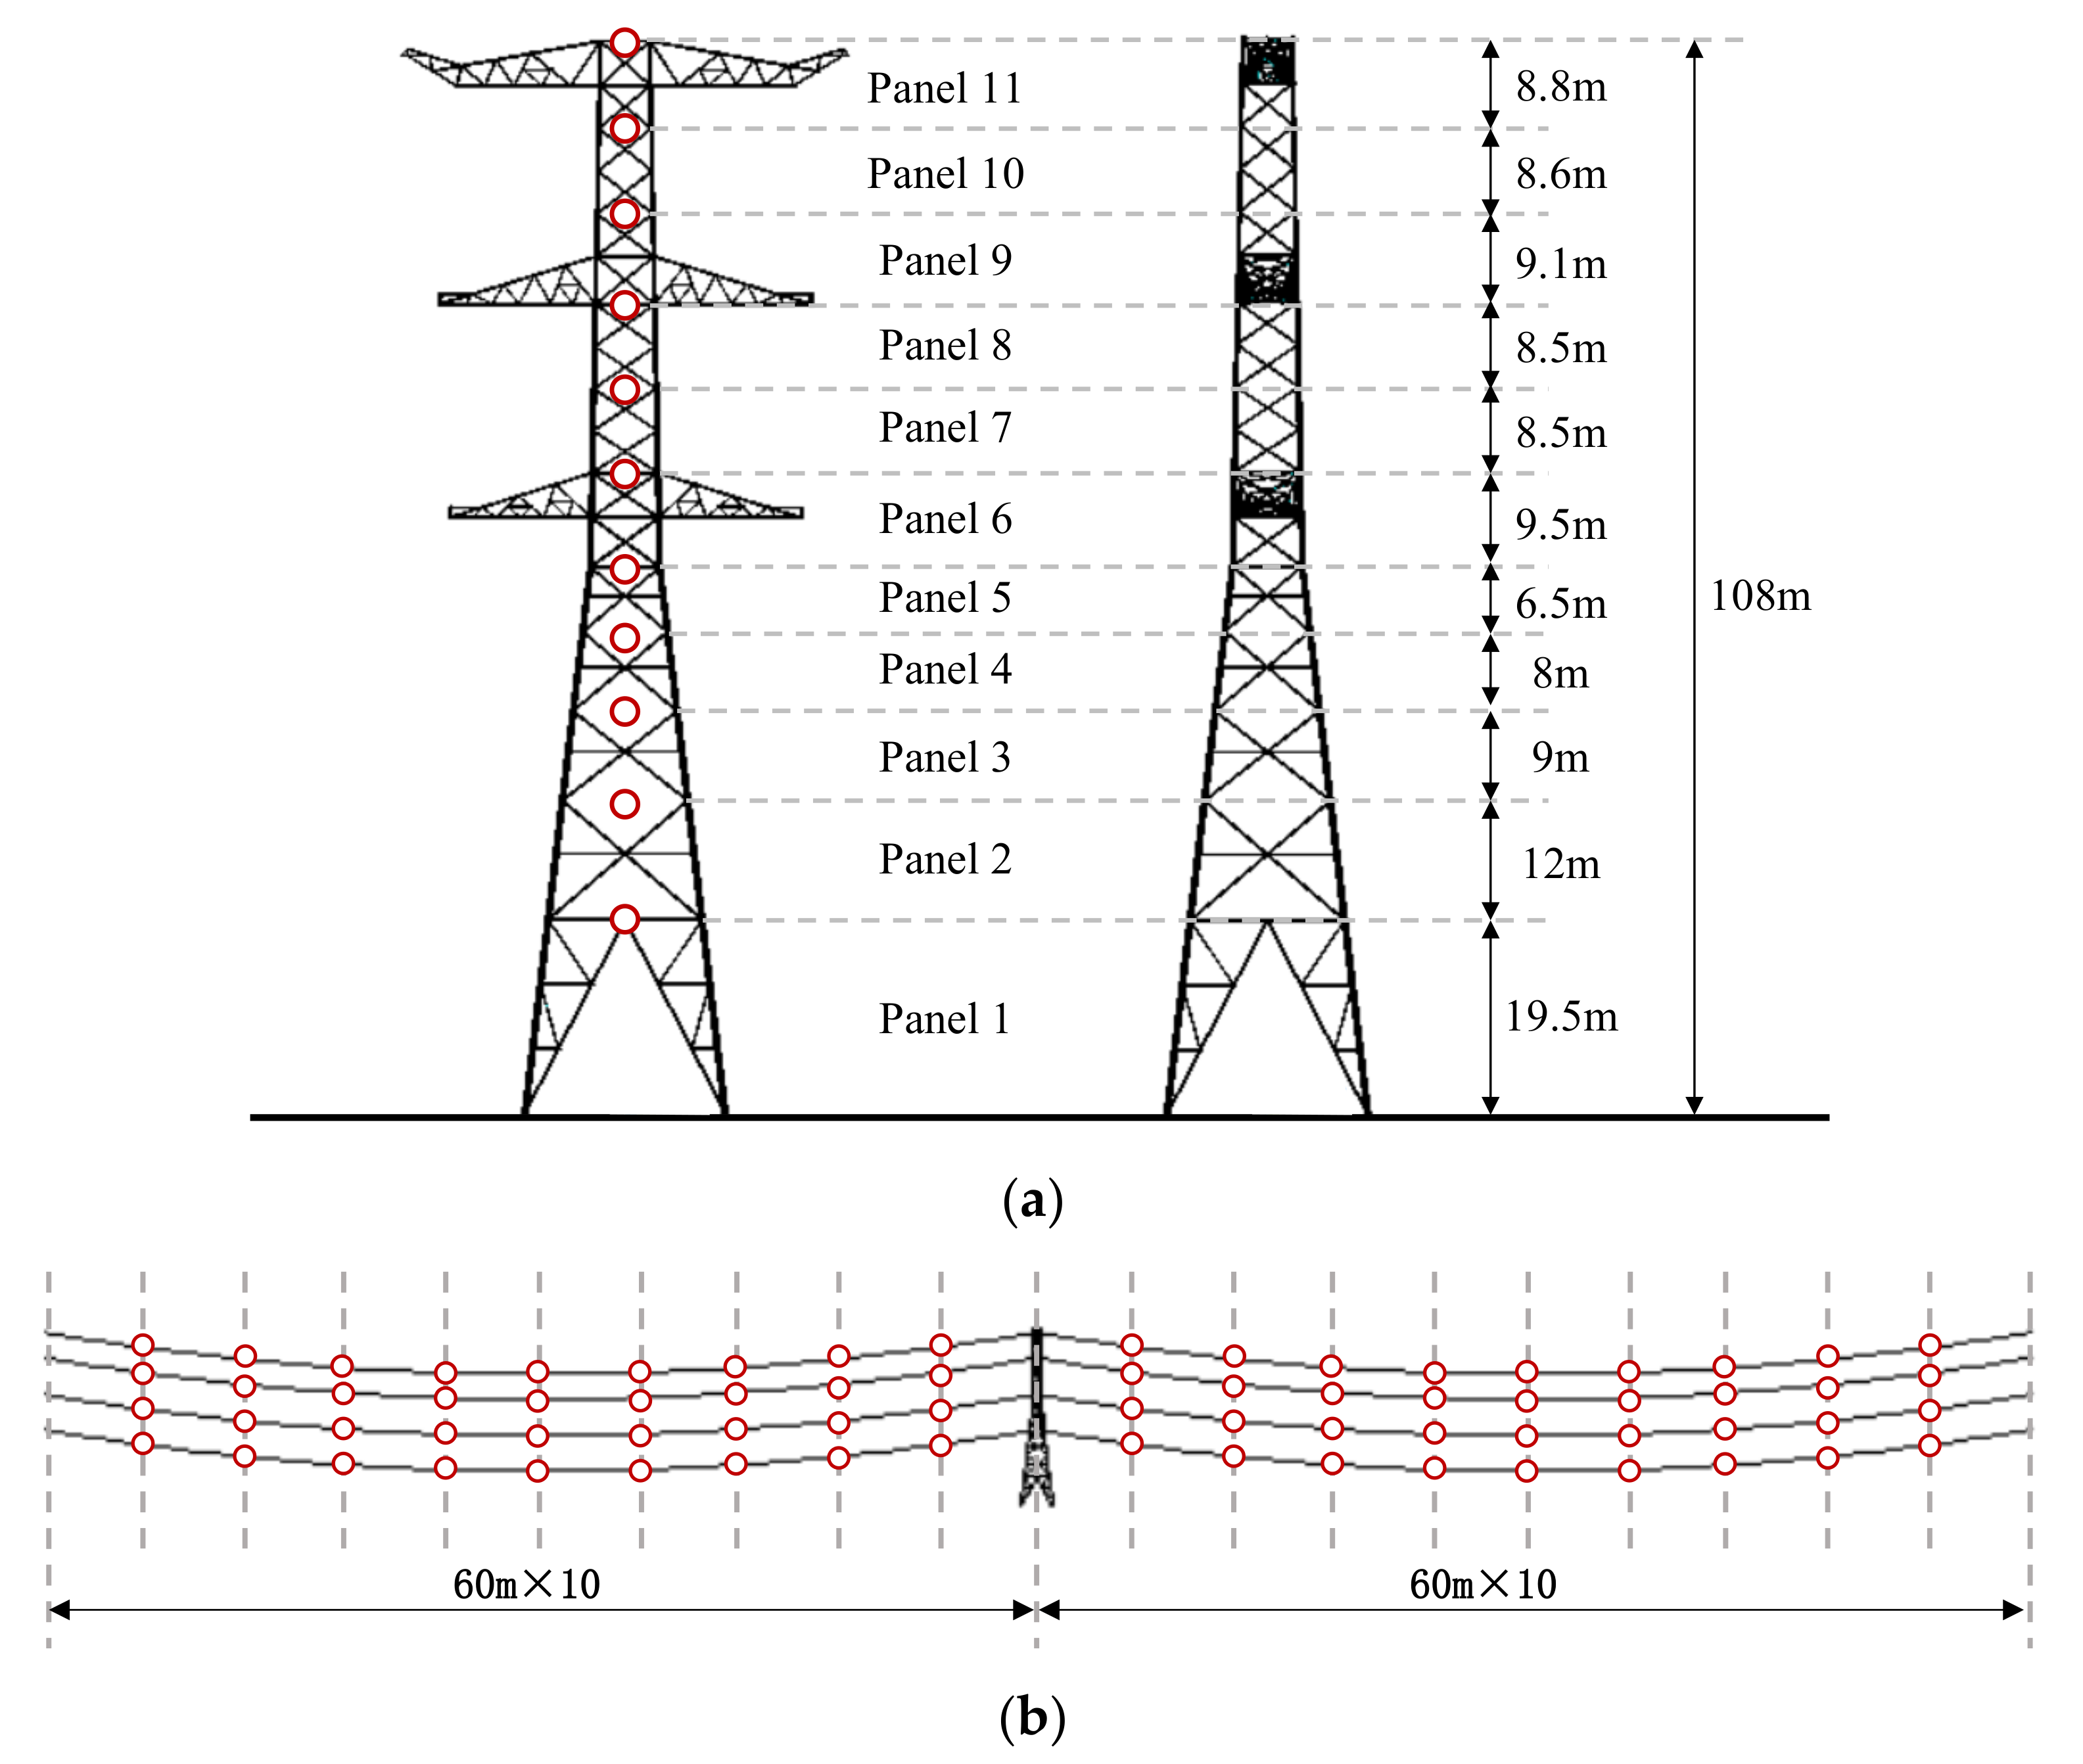
In this study, a 1000 kV UHV transmission tower-line system was selected as the research object, as shown in Figure 1. The transmission tower is a lattice steel pipe tower (a small number of secondary components are angle steel), with a tower height of 108 m and a tower foundation size of 20.2 m × 20.2 m. The main material of the tower body is Q345, and the diaphragm, inclined material and cross arm are Q235. The elastic modulus is 206 GPa, Poisson’s ratio is 0.3, and the density is 7850 kg/m3. The flange and accessory mass were considered in the calculation, and the density is enlarged by 1.05 times. The horizontal span of the conductors and ground wire is 600 m, and its main physical parameters are given in Table 1.
The finite element models of the single tower and tower-line system were established by using the general finite element software ANSYS. As shown in Figure 2, the tower-line system is modeled as one tower and two lines. The model includes a tower, insulators, conductors and ground wires on both sides. Among them, eight bundle conductors are combined and simplified into one “thickened” conductor according to the principle of equivalence of physical parameters, such as windward area and linear density. Fixed boundary conditions are used at the bottom of the transmission tower legs, and the ends of conductors and ground wires are constrained by fixed hinge supports. The tower body components are simulated by the Beam188 element, and the conductor, ground wire and insulator are simulated by the Link10 element. Among them, the conductor and ground wire can only bear the tensile force, and the initial shape needs to be determined through shape-finding analysis. The shape-finding method can refer to the relevant literature [24], which will not be repeated here.
2.1.2. Model Dynamic Characteristics
The dynamic characteristics of the finite element models of a single tower and tower-line system are analyzed by the block Lanczos method. The first three vibration modes of a single tower are shown in Figure 3. For the tower-line system, the first three modes dominated by transmission tower vibration are shown in Figure 4. It can be seen that in the single tower and tower-line system, the 1st-order mode of the transmission tower is the 1st-order bending vibration in the X direction, the 2nd-order mode is the 1st-order bending vibration in the Y direction, and the 3rd-order mode is the 1st-order torsional vibration.
The calculation shows that the tower-line system has the characteristics of low natural frequency and dense vibration modes, and the first 200 vibration modes are conductor and ground wire vibration. Compared with the single tower model, the lowest natural vibration frequency of the tower is reduced in the tower-line system. On the one hand, the conductor and insulator string are equivalent to the local additional mass, which changes the mass distribution of the structure; on the other hand, the wire imposes constraints on the tower, which will directly affect the stiffness of the tower. The dynamic characteristics of the structure are closely related to its stiffness and mass. Therefore, considering the coupling effect of the conductor and ground wire, the frequency and vibration mode of the transmission tower will be affected by the transmission line. Therefore, it is necessary to study the dynamic response of a single tower and tower-line system under downburst wind load, in order to clarify the influence of the tower-line coupling effect on the wind-induced vibration response of the transmission tower.
2.2. Downburst Wind Loads
2.2.1. Wind Field Model
Different from the ABL wind, the wind speed at any point in the downburst wind field is affected by many parameters, including the outflow diameter (Djet), storm moving speed (Vt), and the relative position relationship between the point and the storm center (r, θ). Previous studies often ignored the influence of storm moving speed. However, the movement of the storm will lead to the extreme wind speed area with bow distribution in front of the storm, which is very unfavorable to the wind resistance of long-span structures. As shown in Figure 5, the initial touchdown center of the downdraft is used as the coordinate origin to establish the Cartesian coordinate system, and the initial touchdown time of the downdraft is used as the starting time of the development of the downburst. With the movement of the storm, the wind speed and direction at any position in the wind field are constantly changing, which affects the wind load distribution on the structure. Therefore, for long-span structures, such as a transmission tower-line system, the movement effect of storms should not be ignored.
- (1)
- Mean wind
For the moving downburst, the horizontal wind speed U (x, y, z, t) of P (x, y, z) at any position in the wind field at time t can be decomposed into the sum of the average component and fluctuating component, as shown in the following formula:
where is the time-varying average wind speed of the downburst; and is the non-stationary fluctuating wind speed with zero mean value.
The mean wind component of the downburst can be decomposed into the product of the time component and space component:
where is the maximum average wind speed of position (x, y) in the whole development process of the wind field; is the vertical distribution function of horizontal wind speed; and is a time function, which is used to describe the time-varying characteristics of horizontal wind speed at a specific location during the development of a downburst.
For the value of , the maximum value of short-time (3 s) average wind speed is usually taken. The existing measured records show that the maximum horizontal wind speed near the ground of the downburst can reach 67 m/s.
The vertical distribution function of the horizontal wind speed of the downburst is described by the wood model [25]:
where δ corresponds to the height at which 0.5 occurs; and erf is the error function:
Holmes proposed that the overall wind speed, , at any observation point in the wind field can be obtained by vector addition of downburst radial wind speed, , and the storm moving speed, , as follows:
where can be expressed as follows:
where is the maximum value of radial outflow wind speed; is the radius at which the maximum horizontal wind speed occurs; is a radial length scale; and is the intensity factor.
The time function f (t) can be expressed as follows:
- (2)
- Fluctuating wind
For the simulation of downburst fluctuating wind, the hybrid simulation method proposed by Chen and letchford [26] is adopted. This method is based on the evolutionary spectrum theory, and the amplitude of stationary random wind speed is modulated by introducing the modulation function to obtain a non-stationary random fluctuating wind field. Therefore, the fluctuating wind speed can be treated as the product of a stationary Gaussian random process and the amplitude modulation function under a given power spectrum, as follows:
where is the amplitude modulation function:
where Iu is the turbulence intensity of the horizontal wind speed of a downburst. Based on the measured data, Chen and letchford [27] believe that the reasonable value range of Iu is 0.08 ~ 0.11, and Iu = 0.11 is taken in this paper. represents a stationary Gaussian random process with a mean value of 0 and variance of 1, which can be simulated by the harmonic synthesis method. The power spectral density function of can be expressed by the normalized Kaimal spectrum [28]:
where n is the fluctuating wind frequency; , is the maximum value of time-varying average wind speed at z height; and is the root mean square of fluctuating wind speed. In the wind field, the cross spectrum of fluctuating wind speed at any two points, , , in space can be expressed as:
where is the coherence function, which is used to characterize the correlation of spatial fluctuating wind speed. Here, the coherence function formula suggested by Simiu is adopted:
where Cy and Cz are attenuation coefficients, and Simiu suggests Cy = 16, Cz = 10.
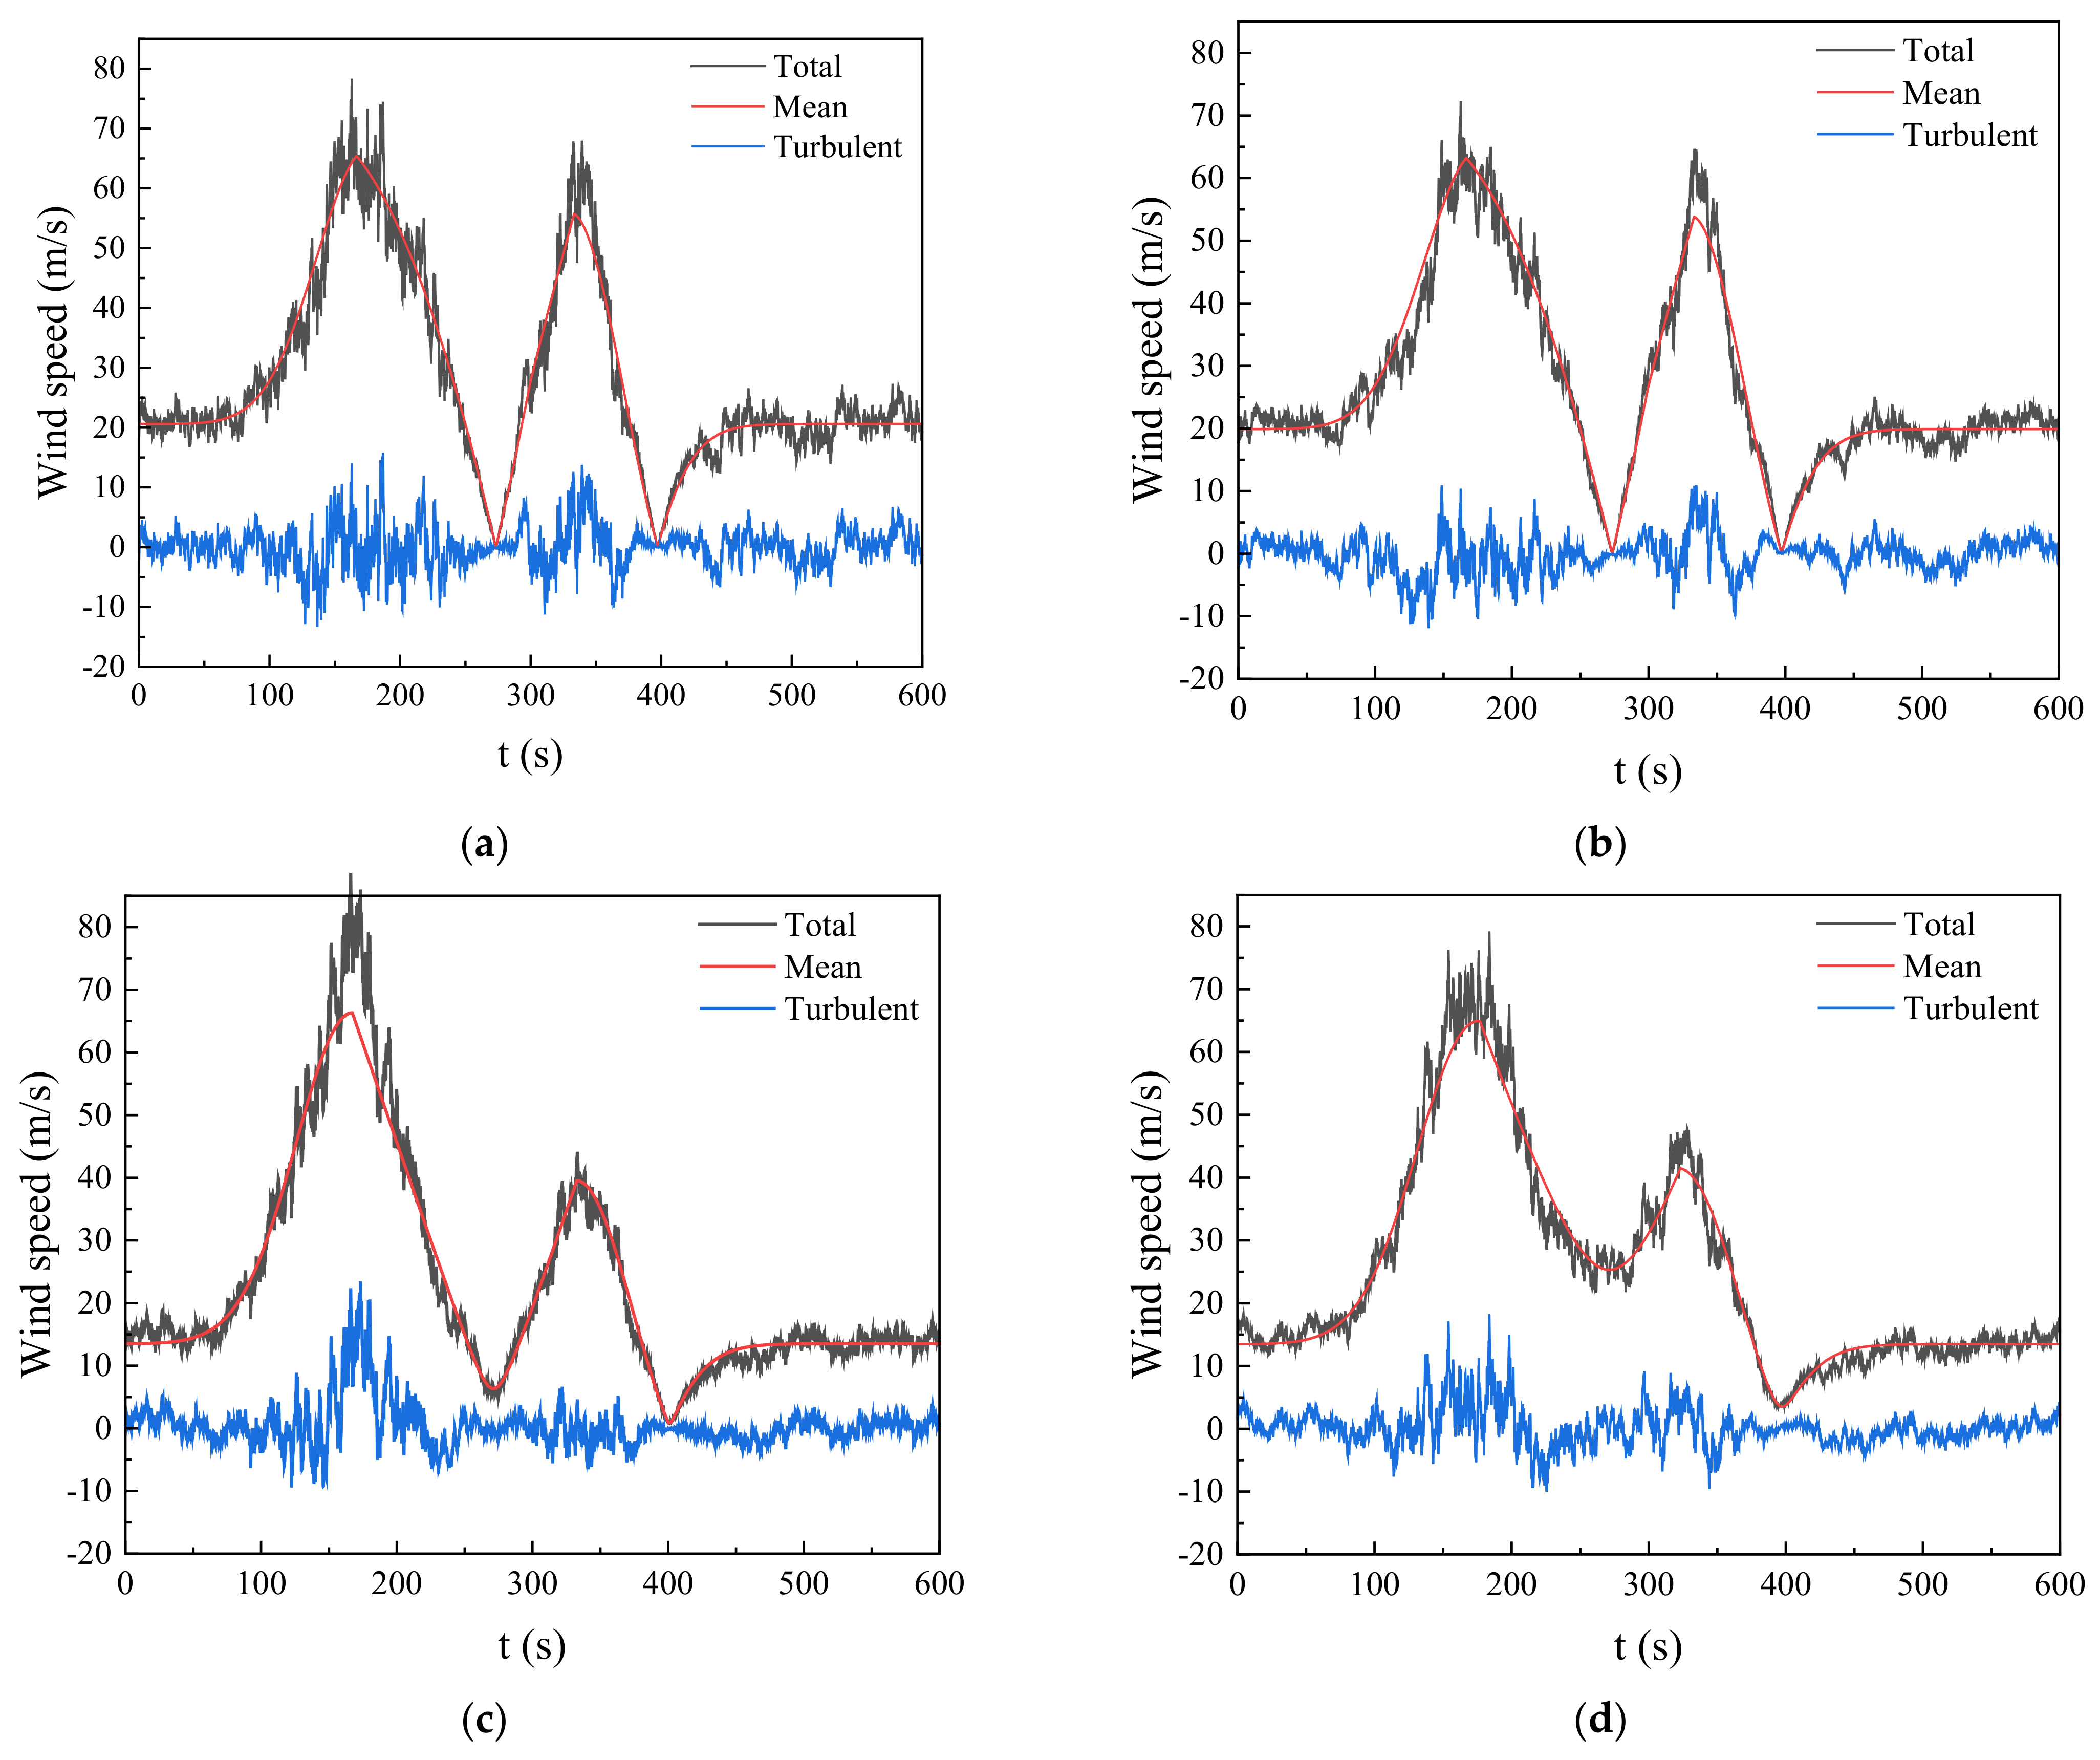
When , , δ = 300 m, , , , and the initial touchdown center of downburst is 3000 m away from the tower center, the wind speed time history at typical locations is shown in Figure 6.
2.2.2. Wind Loads and Analysis Procedure
A previous study [16] has shown that for self-supporting transmission towers, as shown in Figure 7a, the wind-induced response of the tower is usually strongest when the downburst’s travel path is perpendicular to the transmission line and the tower is on the centerline of the storm’s movement. Therefore, based on the research purpose of this paper, only the load conditions shown in Figure 5 are studied here. Figure 7 shows the division of the wind load loading section of the transmission tower-line system. The transmission tower is divided into 11 tower sections from bottom to top. The wind speed simulation point is the center point of the top surface of the tower section. Each transmission line is equally divided into 10 sections according to the horizontal distance of 60 m. Therefore, for the tower-line system, a total of 83 wind speed simulation points are generated.
According to relevant structural design codes, the wind load on each panel of the tower can be given by the following formula:
where is the air density; is the shape coefficient, taking 2.5 for the tower and 1.1 for the conductor and ground wire; and is the projected area of the windward side of load section i.
For a tower-line system, geometric nonlinearity should be considered in the analysis. To obtain the transient dynamic response of the system under the action of downburst wind load, the time-domain analysis method is followed. In ANSYS, the Full method and the mode superposition method can be used for transient dynamic analysis. Among them, the Full method is the direct integration method, which has powerful solving function and can provide various nonlinear characteristics (such as plasticity, large deformation, large strain, etc.). Therefore, in this paper, the Full method is adopted, and the geometric large deformation and stress stiffening effect are considered in the calculation. Rayleigh damping is adopted; the damping ratio of the tower is 0.02, and the damping ratio of the conductor and ground wire structure is 0.005. In addition, for the conductors and ground wires, aerodynamic damping is also considered.
3. Numerical Analysis Results
3.1. Nonlinear Dynamic Response Analysis
In this section, the single tower and tower-line system under downburst wind load are analyzed, respectively, and the influence of the tower-line coupling effect on the wind-induced vibration response of the transmission tower is studied. The wind field parameters are given in Section 2.2.1. The following three cases are considered in the calculation:
Case 1: multi-step static analysis of time-varying average wind load to calculate the time-varying average response () of the structure.
Case 2: multi-step static analysis of total wind load to calculate the quasi-static response (Rs) of the structure under total wind load.
Case 3: transient dynamic analysis of total wind load to calculate the dynamic response (Rd) of the structure under total wind load.
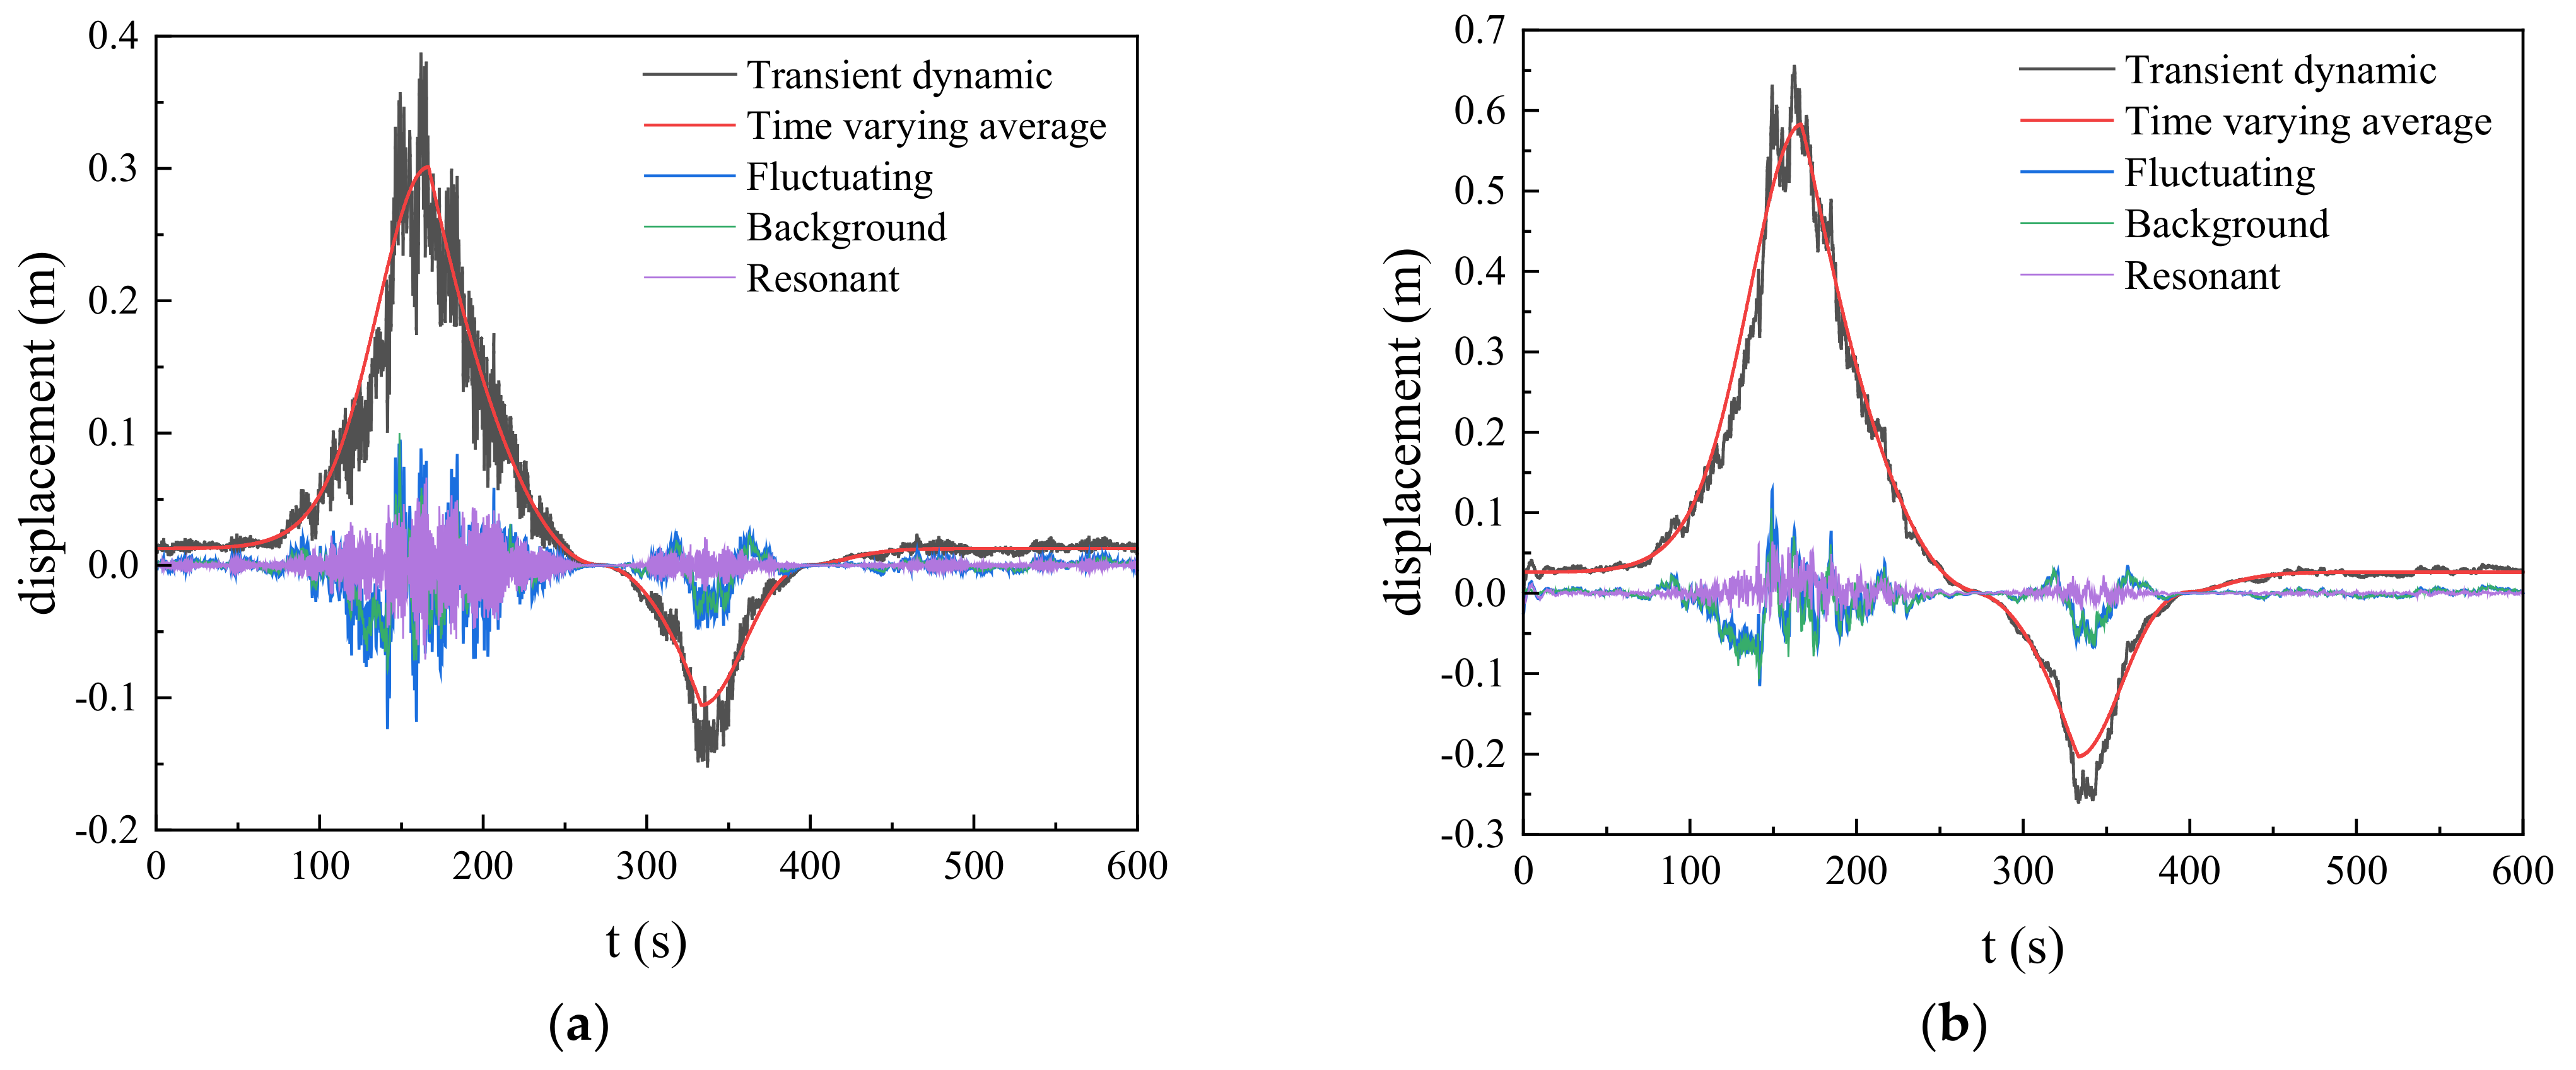
Figure 8 shows the time history of alongwind displacement response at the top of a single tower and tower-line system. In the figure, the fluctuating response is obtained by subtracting from Rd; the fluctuation background component is obtained by subtracting from Rs; and the fluctuation resonance component is obtained by subtracting Rs from Rd. With the passage of time, the storm center first gradually approaches the structure, and then gradually moves away. It can be seen from the figure that when t = 200 s, the displacement of the tower top is 0. At this time, the downdraft is just above the transmission tower, and the structure is basically not affected by horizontal wind load. After that, the storm came to the rear of the structure, and the displacement direction of the tower top was reversed. The time history response characteristics of a single tower and tower-line system are basically the same, but compared with a single tower, the time-varying average response and transient dynamic response amplitude of the tower-line system are greatly improved, which is caused by the existence of conductors and ground wires increasing the total wind load of the structure. In terms of fluctuating response, the background component accounts for a larger proportion in the single tower and tower-line system, and the fluctuation resonance component of the tower-line system is relatively smaller than that of the single tower.
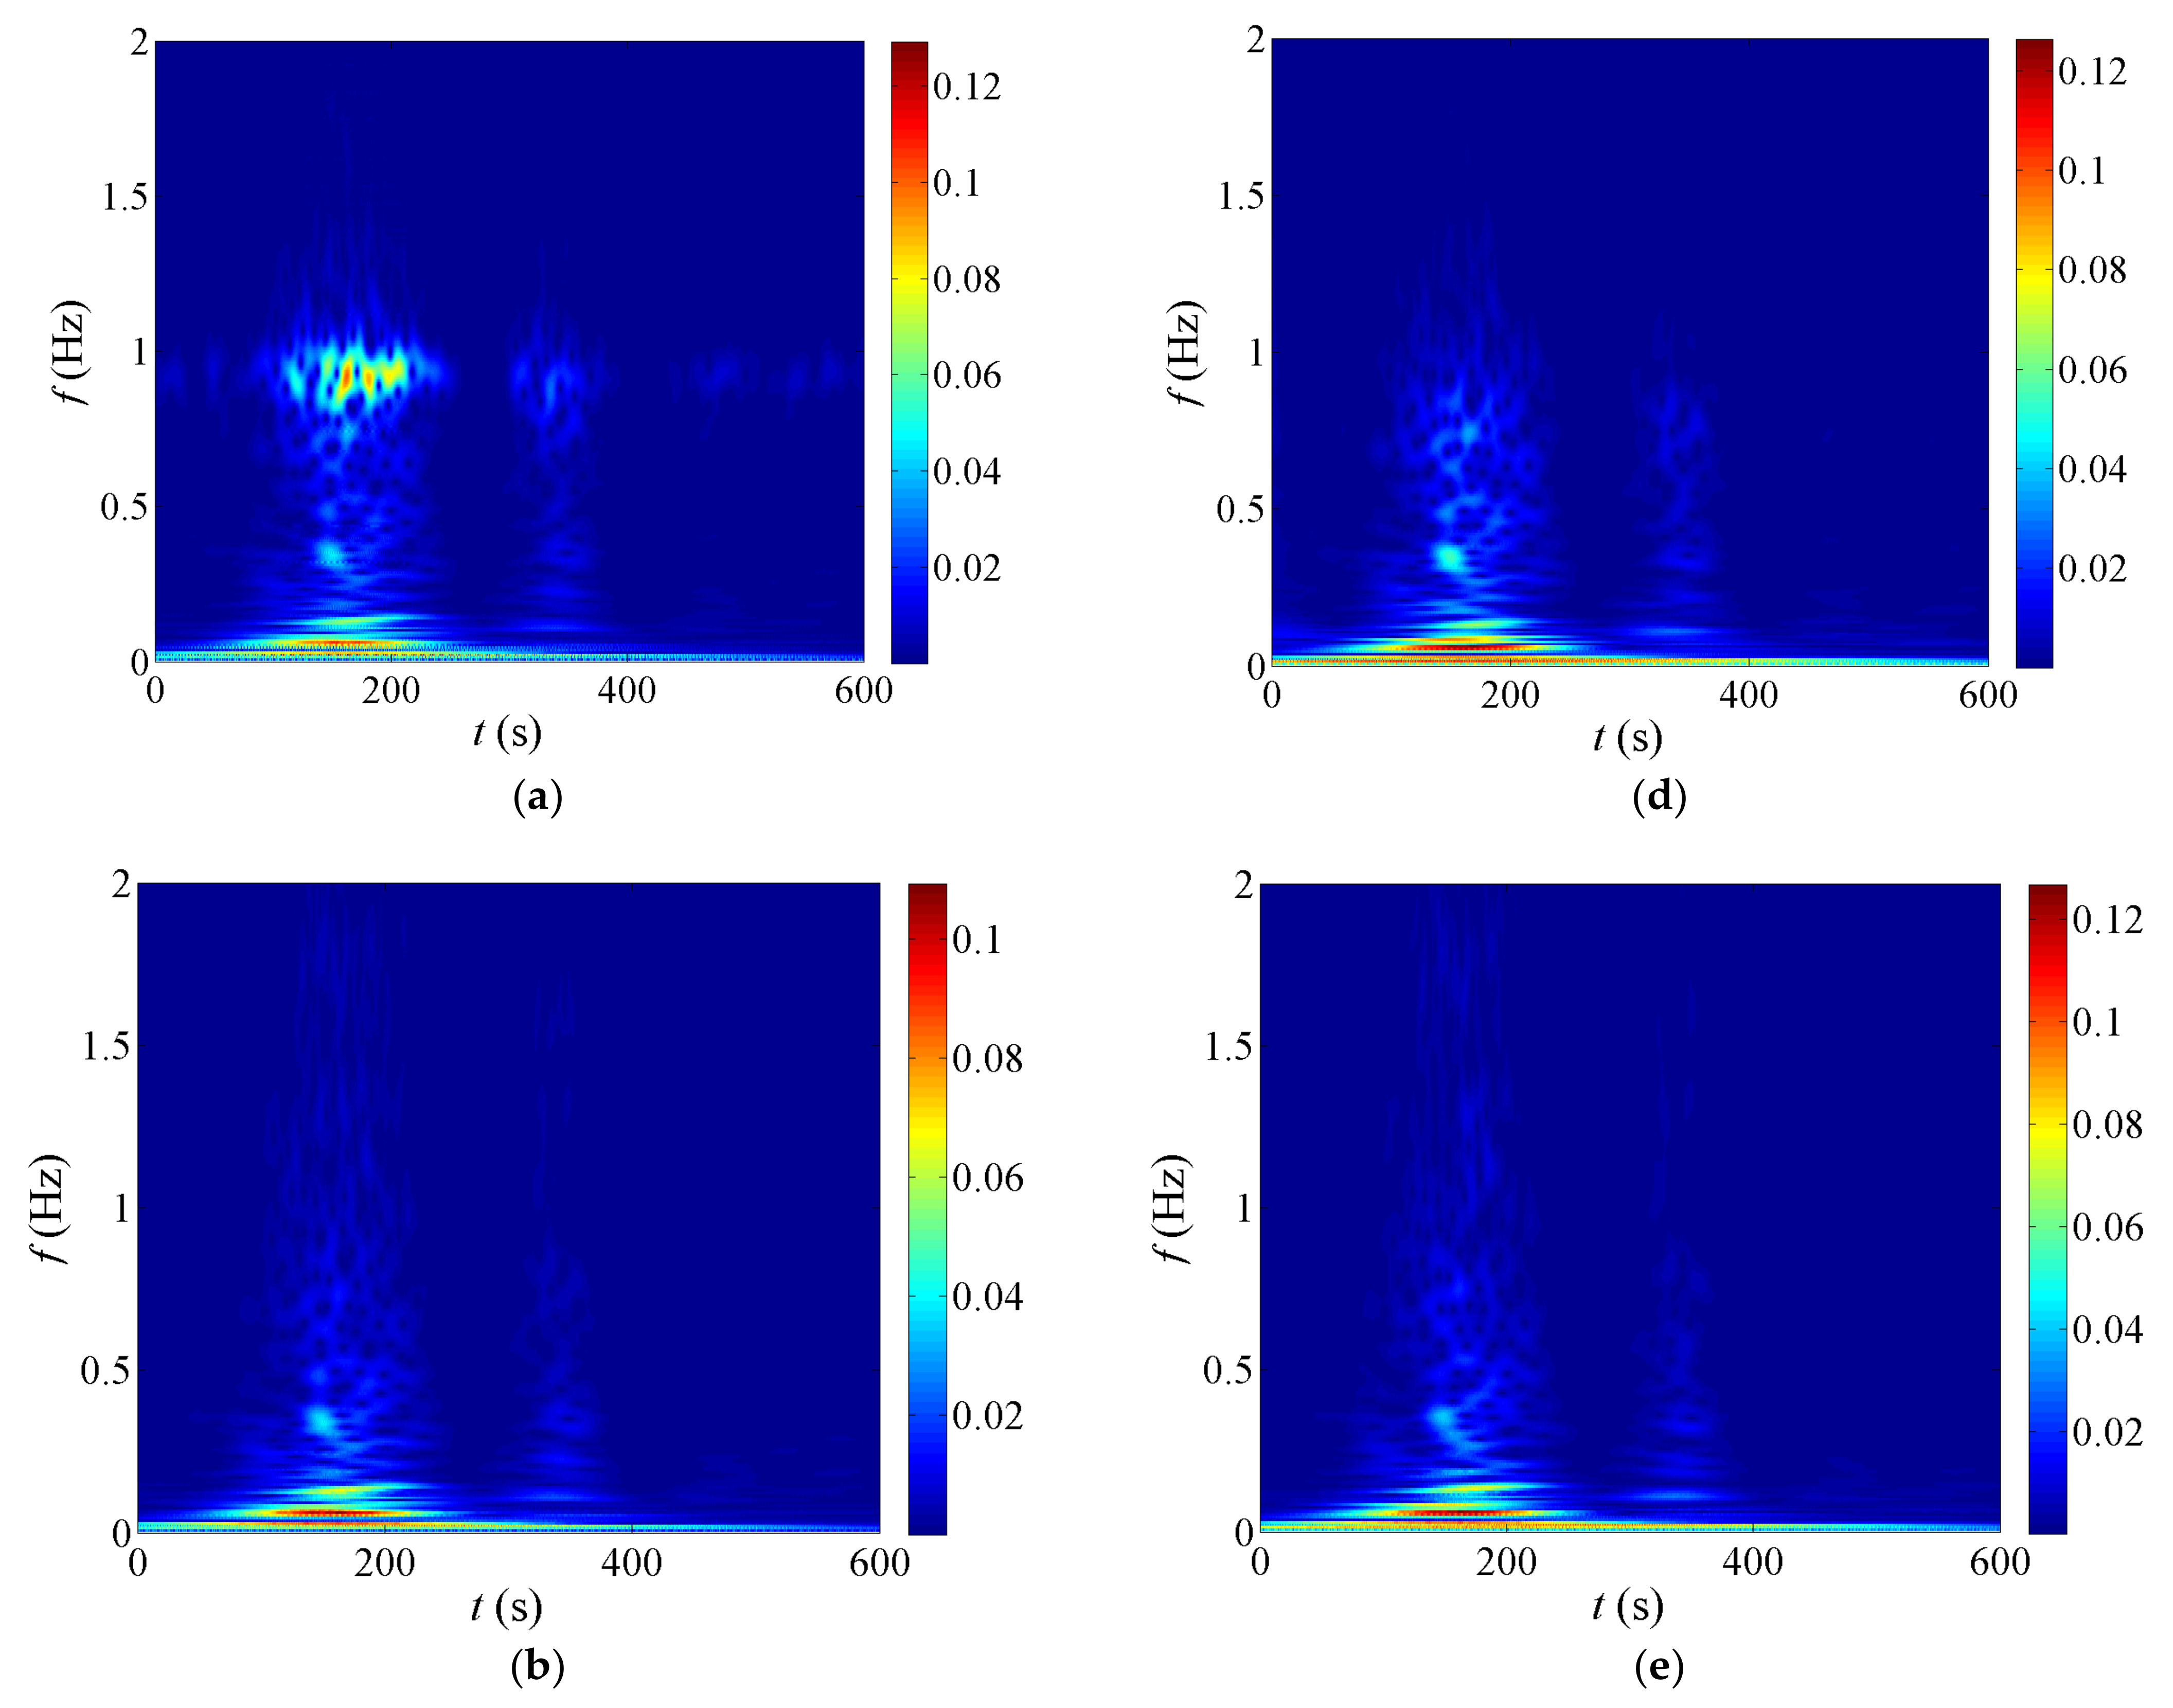
In order to further study the displacement wind-induced vibration characteristics of a single tower and tower-line system, the time-frequency analysis results of their fluctuating response are given through wavelet transform, as shown in Figure 9. It can be seen from the figure that in the time domain, the distribution law of peak energy is consistent with the amplitude modulation function of fluctuating wind speed. The energy peaks of a single tower and tower-line system appear around t = 166 s and t = 334 s, and the corresponding energy at the previous time is higher. In the frequency domain, for a single tower, the energy of fluctuating response in the low frequency band is higher. This section of energy is mainly provided by the background response, the proportion of resonance response is small, and the resonance energy is mainly concentrated at about f = 0.94 Hz, which corresponds to the fundamental frequency of the single tower. For the tower-line system, the peak value of fluctuating response is still mainly distributed in the low frequency band, and the energy is mainly provided by the background response, and the proportion of resonance response is also very small. However, unlike a single tower, the fluctuating resonance component of the tower-line system is widely distributed in the frequency range of 0 ~ 1 Hz, and the resonance energy corresponding to the fundamental frequency of the tower is relatively small. This is mainly due to the dense line vibration modes of the tower-line system in the low frequency range. The aerodynamic damping of the transmission line increases the overall damping of the structure and dissipates more energy in the vibration process, which reduces the resonance response of the tower.
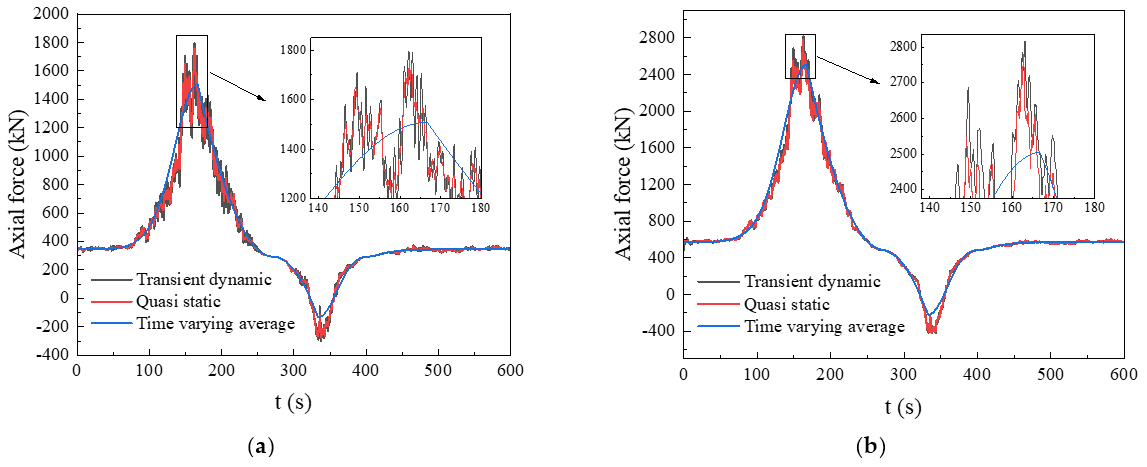
Figure 10 shows the axial force response time history of the main member of the tower leg on the initial leeward side in the single tower and tower-line system. In the figure, the axial pressure is positive. Before the wind load is applied, the axial force of the tower leg is mainly generated by gravity. With the development and movement of the storm, the axial force of the tower leg gradually increases. After the storm center passes over the tower, the tower leg on the initial leeward side turns to the windward side, and the pressure of the tower leg gradually decreases. After the storm moves away from the tower, the wind load gradually decreases, and the axial force of the tower leg is gradually controlled by the gravity load.
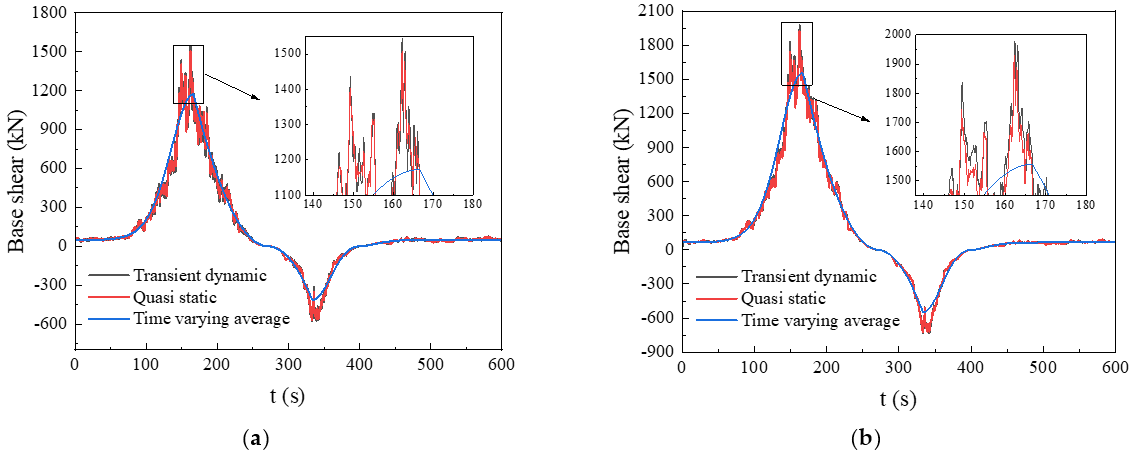
Figure 11 shows the time history response results of base shear of the single tower and tower-line system. It can be seen from the figure that due to the additional transmission line load, the base shear peak of the tower-line system is increased compared with the single tower. It can be seen that the transient dynamic response is nearly equivalent to the quasi-static response, indicating that the background response is dominant.
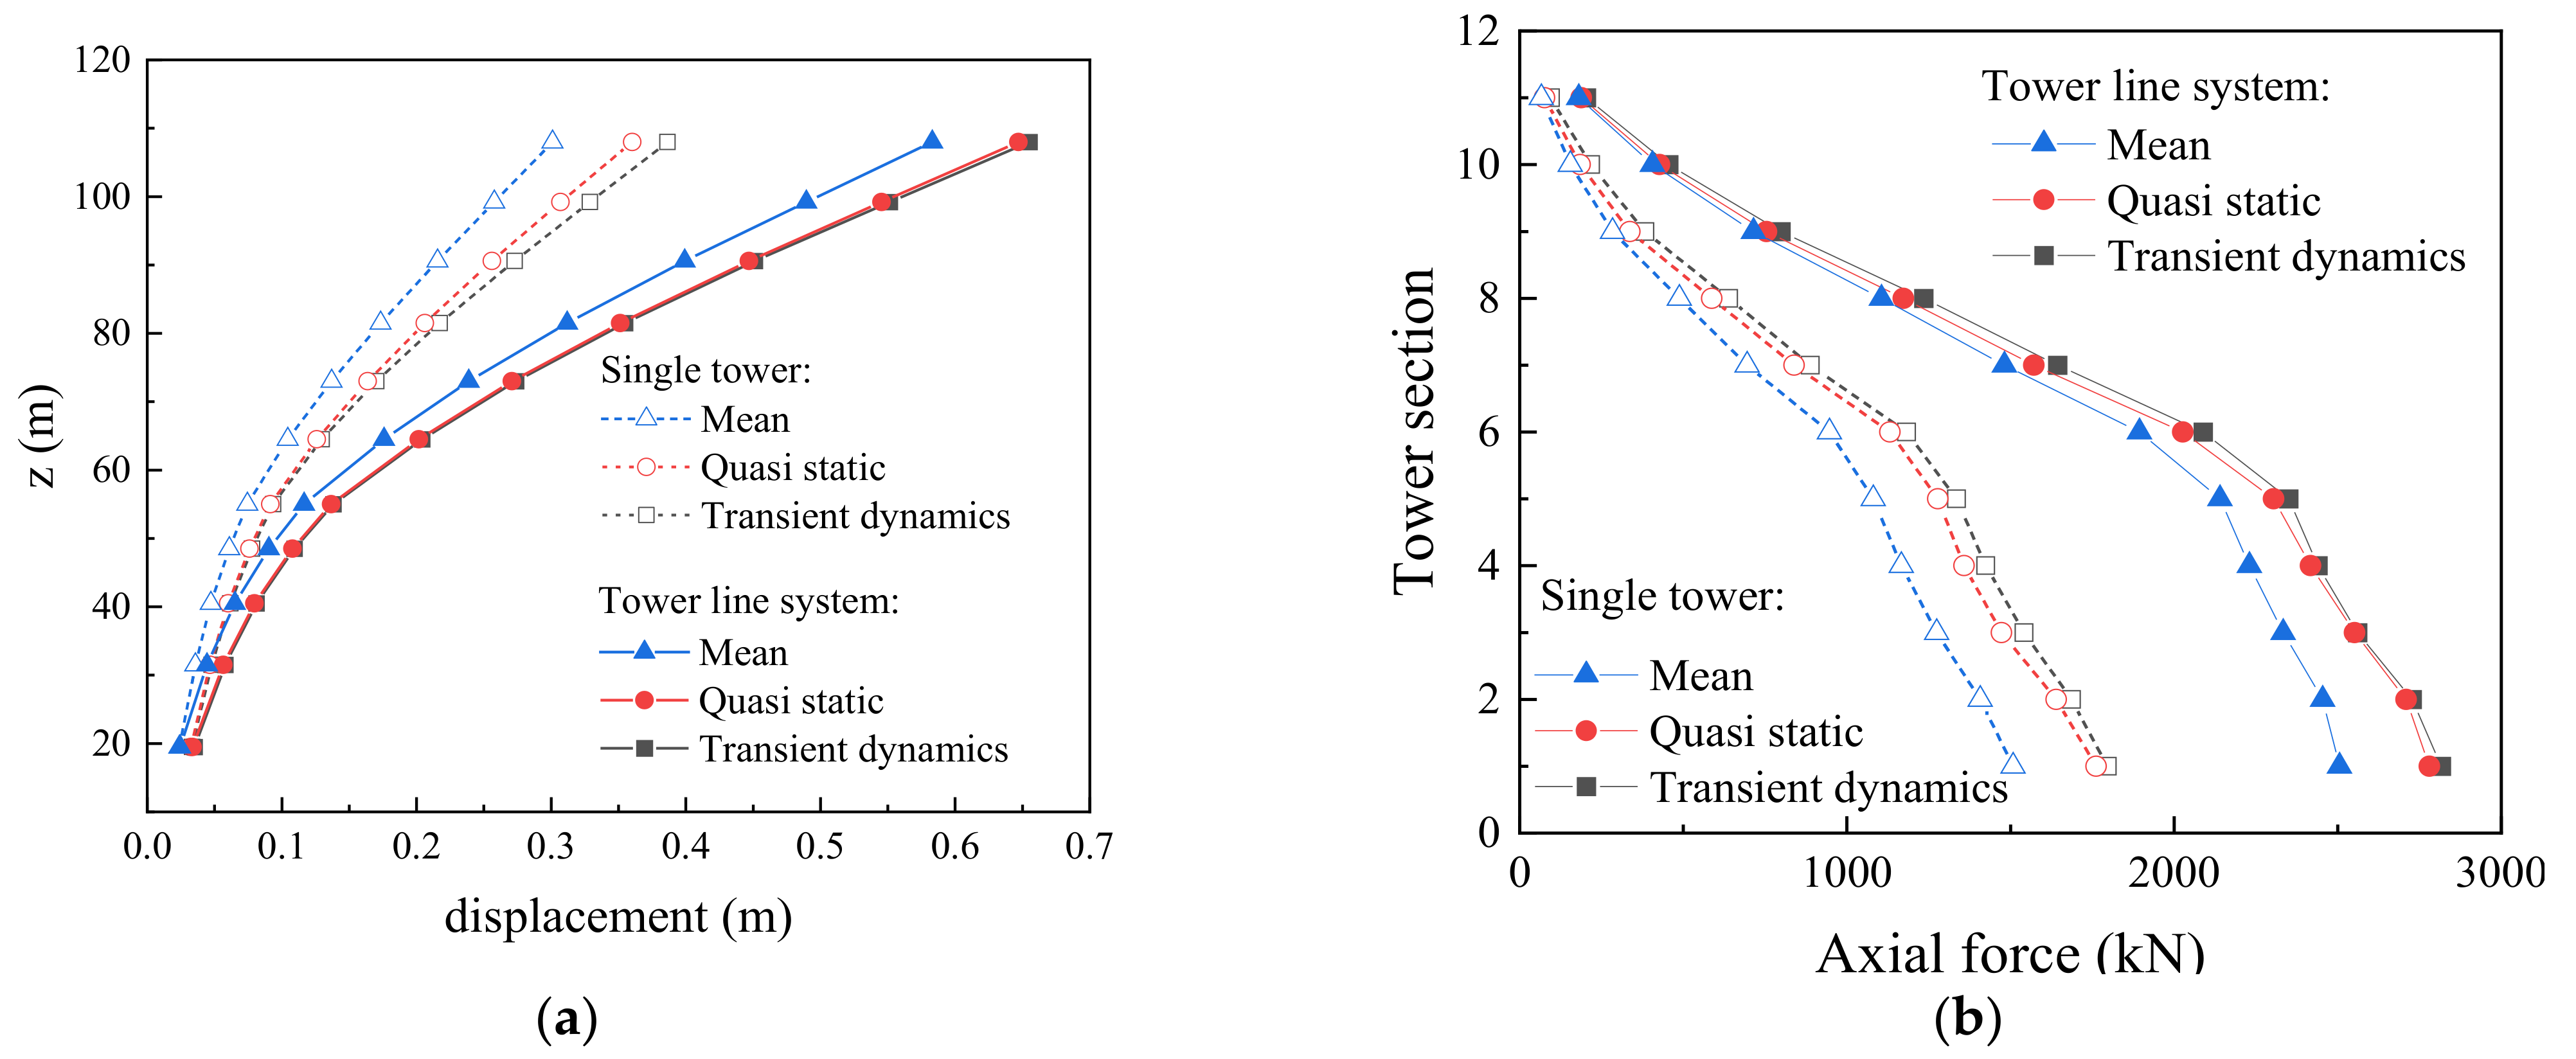
Figure 12 shows the distribution of tower displacement and peak axial force of main members along the tower height. It can be seen that the distribution law of peak response of a single tower and tower-line system along the tower height is the same, but there are differences in amplitude. The difference in amplitude is mainly caused by the wind load of the conductors and ground wires. For a single tower and tower-line system, the quasi-static response and transient dynamic response under total wind load are very close, and the time-varying average response is consistent with the distribution law of total wind response along the tower height. For the displacement response, the proportion of time-varying average response in the transient dynamic response gradually decreases with the increase of height. At the top height of the tower, the of a single tower is about 0.78, and that of the tower-line is about 0.89. For the axial force response of main materials, the proportion of time-varying average response in the transient dynamic response gradually decreases with the decrease of height. At the tower leg position, the proportion of the single tower is about 0.84, and that of the tower-line is about 0.89.
It can be seen from the above wind field simulation that the nonstationary fluctuating wind speed of downburst is obtained by amplitude modulation based on the normalized time-varying average wind speed. Therefore, the maximum value of fluctuating wind speed and the maximum value of time-varying average wind speed almost appear at the same time. From Figure 10 and Figure 11, it can be seen that the time-varying average response of a single tower and tower-line system has high synchronization with the total wind response. The time-varying average response can well reflect the variation trend of structural displacement, internal force, and base reaction with time, but the dynamic amplification effect caused by fluctuating wind should be considered at the peak response. Table 2 shows the dynamic amplification factor. In the table, and are the dynamic amplification factors obtained based on quasi-static analysis and transient dynamic analysis, which is defined by the following formula:
where is the maximum value of time-varying average response; Rs,max is the maximum value of static response of total wind load; and Rd,max is the maximum value of transient dynamic response of total wind load. It can be seen from Table 2 that the dynamic amplification factors of tower top displacement and tower leg axial force are concentrated at about 1.1 ~ 1.3. The dynamic amplification factor of the tower-line system is slightly less than that of a single tower, indicating that the tower-line coupling effect has a certain weakening effect on the dynamic response of the transmission tower.
3.2. Parameter Sensitivity Study
It can be seen from the above that under the action of downburst, the dynamic response of a tower-line system is mainly the background component, and the time-varying average result can well reflect the overall response characteristics of the structure. Therefore, the parameter sensitivity study in this section is based on multi-step static analysis under the time-varying average wind load.
3.2.1. Influence of δ
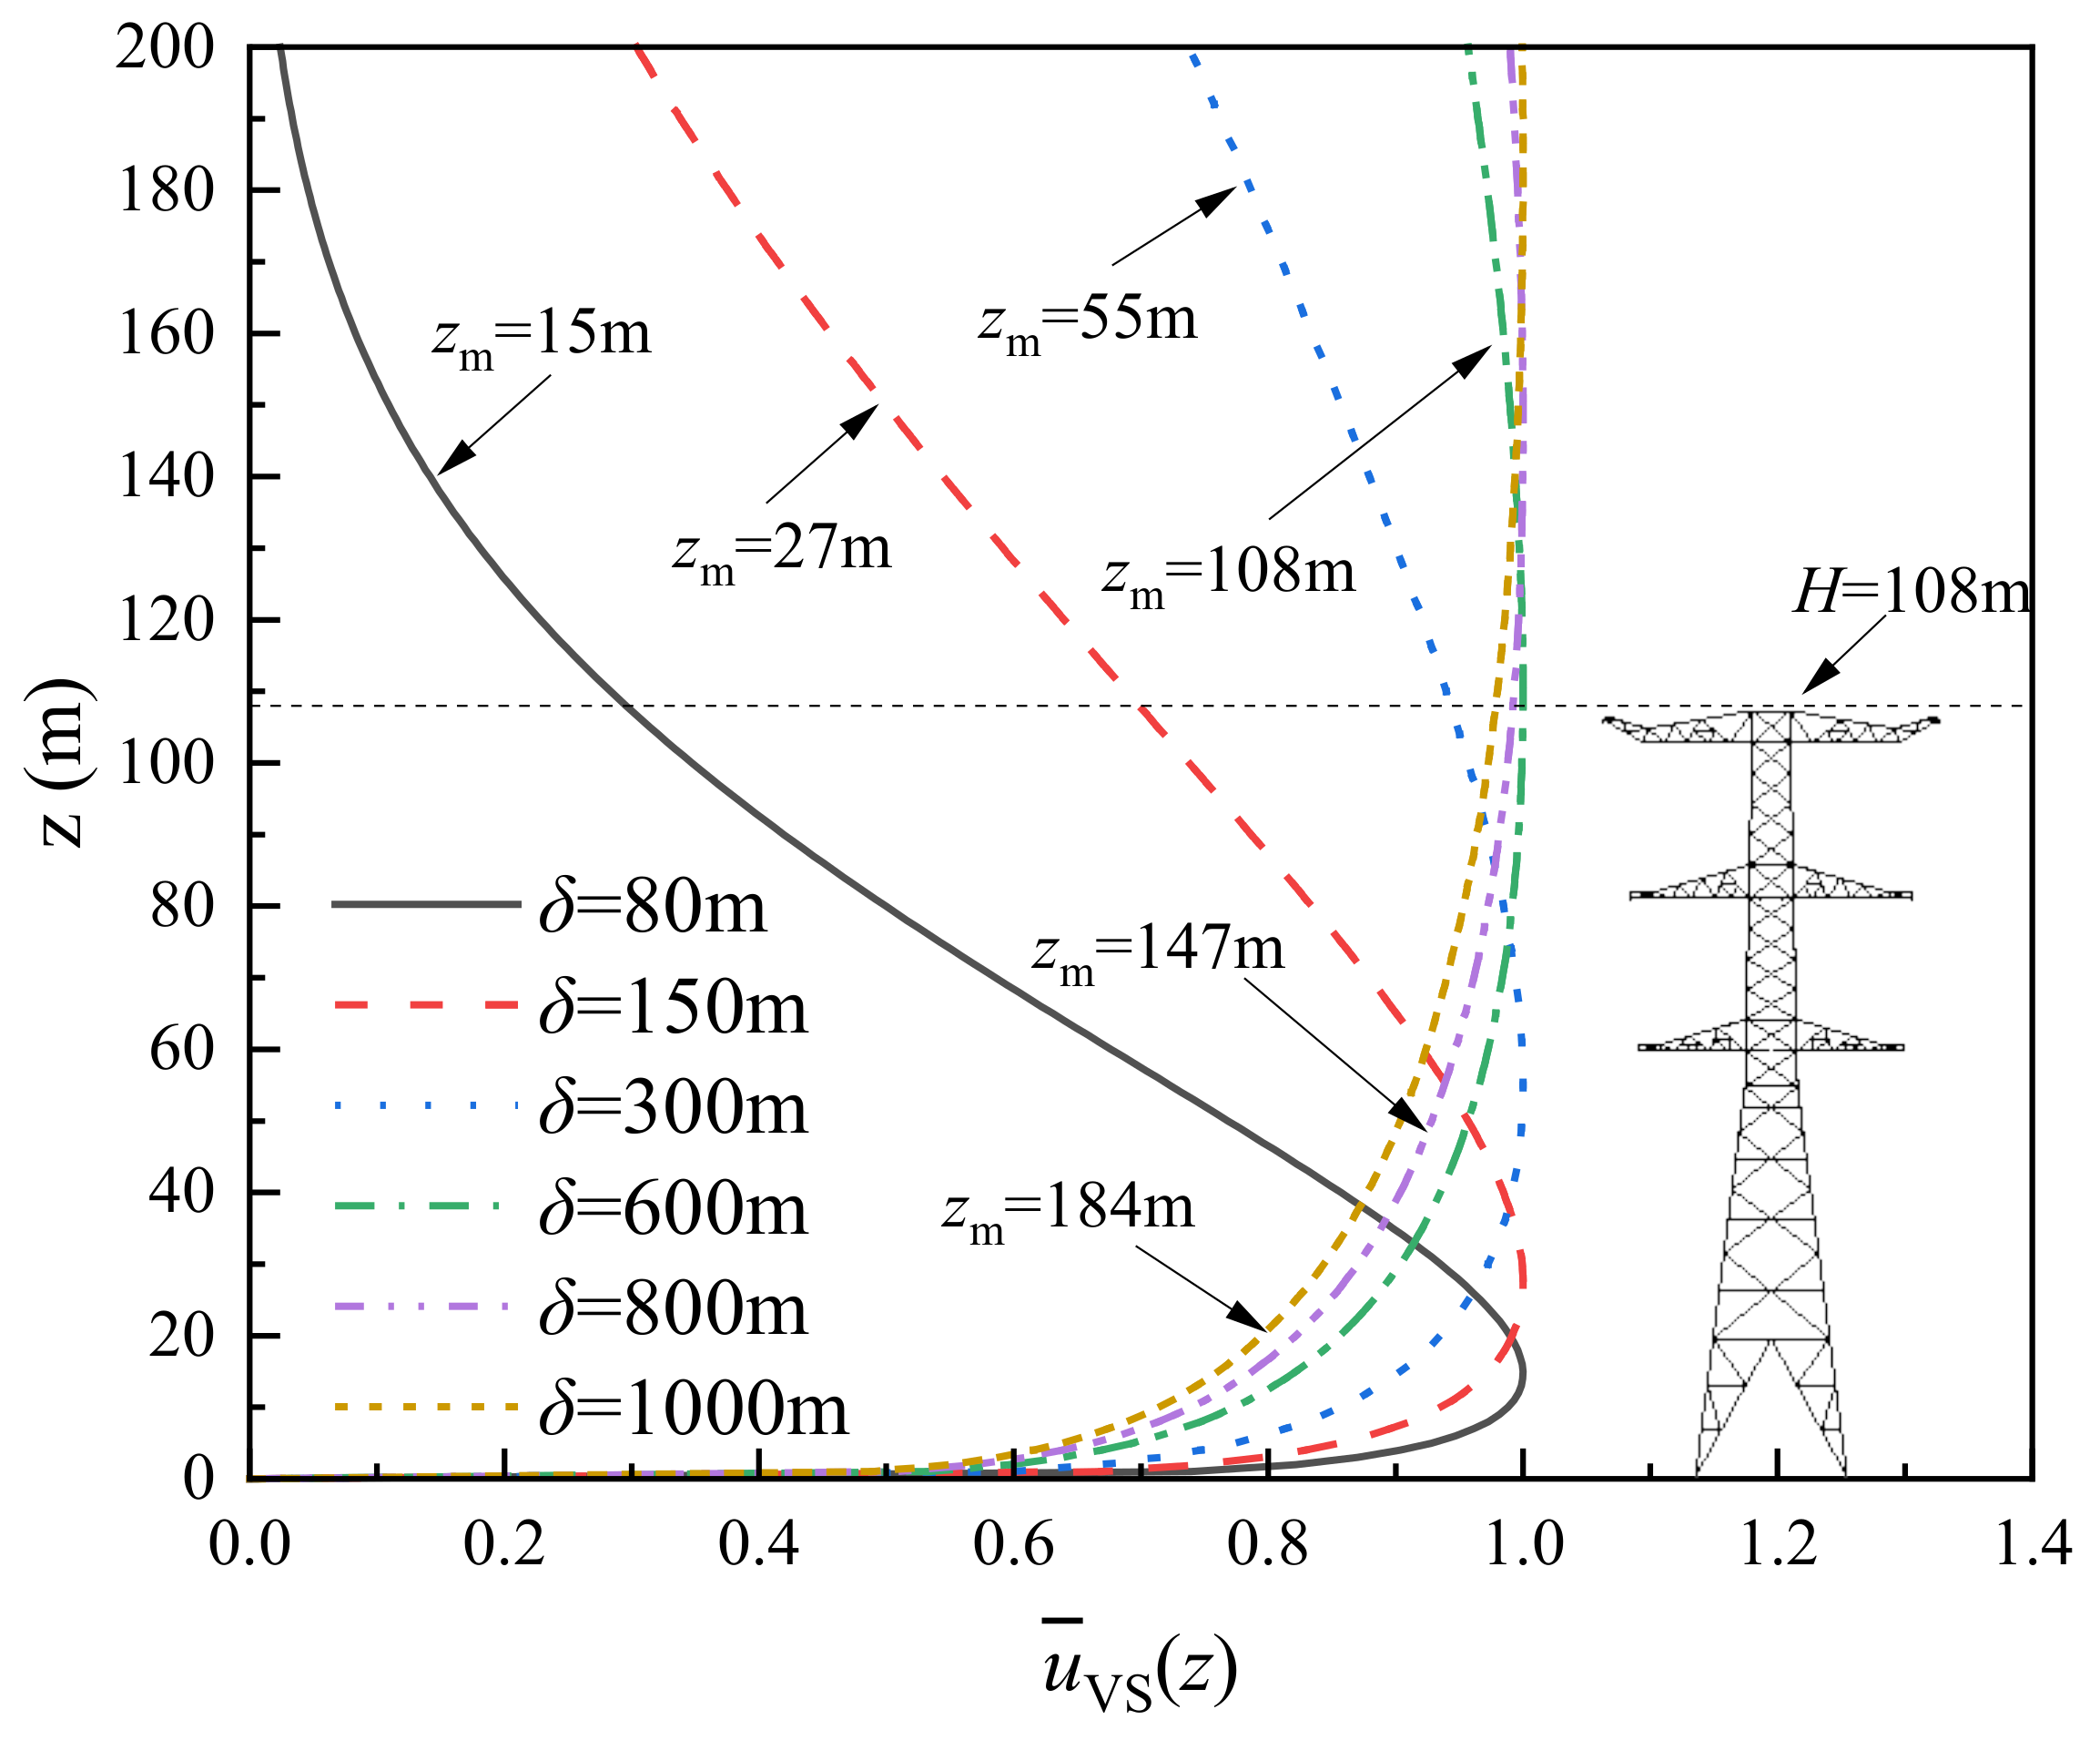
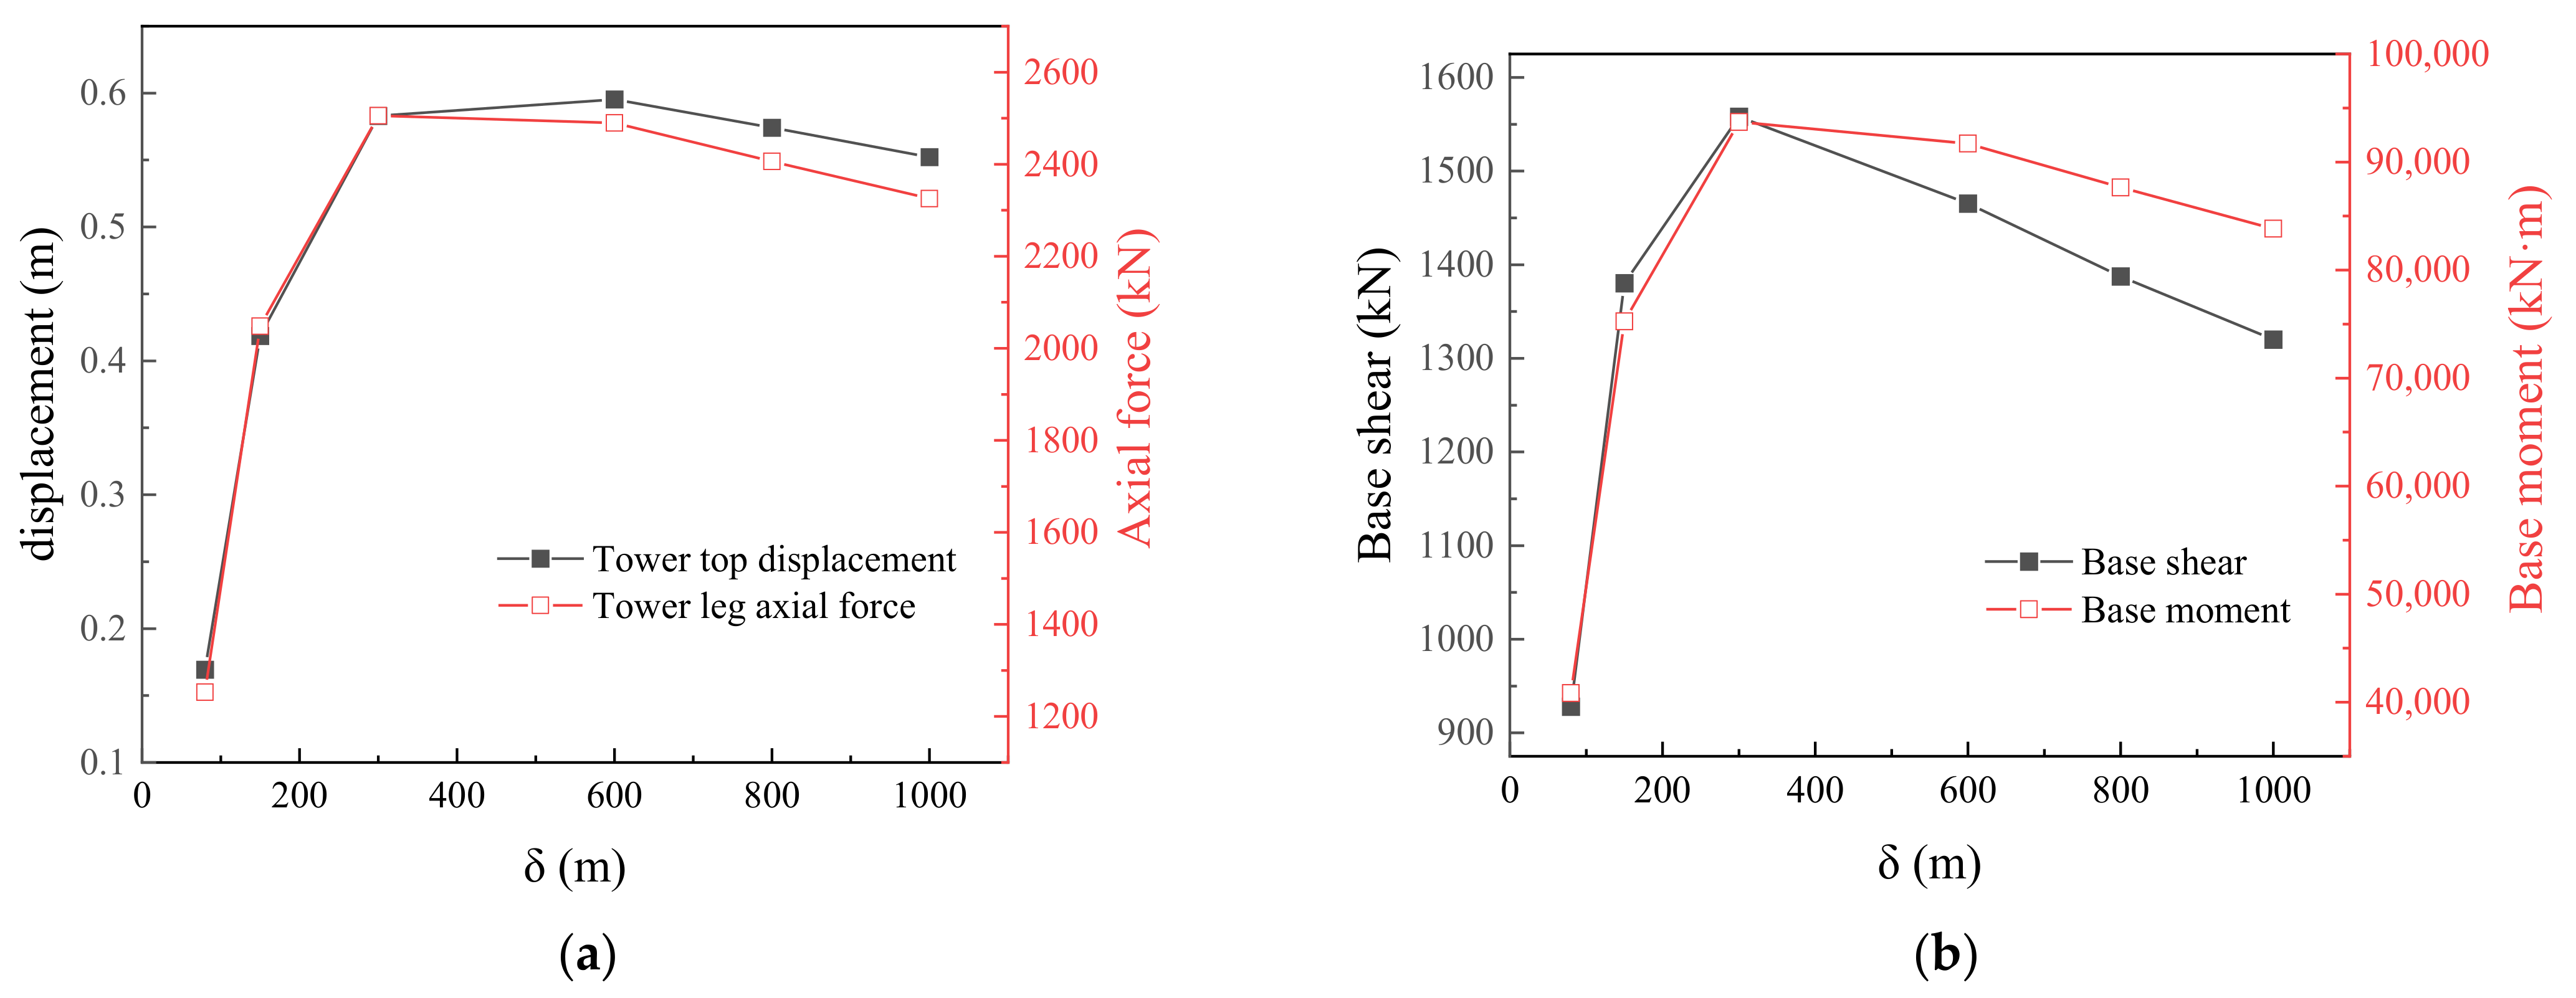
In the wood model, the height of the peak wind speed can be determined by the parameter δ. The research shows that the height of the maximum horizontal wind speed in the downburst wind field is related to the storm scale, which generally occurs in the range of 30–150 m above the ground [29,30]. In order to study the influence of the height of the peak wind speed on the wind vibration response of the tower-line system, we assumed , , , , , , and calculated the structural response when δ was 80 m, 150 m, 300 m, 600 m, 800 m, and 1000 m, respectively. The vertical wind profiles corresponding to different δ are shown in Figure 13.
It can be seen from Figure 14 that with the increase of δ, the tower top displacement and tower leg axial force first increase rapidly and then gradually decrease. The maximum displacement and axial force appear when δ = 600 m, and the corresponding zm is equivalent to the tower top height. Similarly, with the increase of δ, the base shear force and bending moment also show the characteristics of first increasing and then decreasing, and the maximum response appears when δ = 300 m. Therefore, for the self-supporting tower studied in this paper, when the height of the peak wind speed is close to the height of the tower, the displacement and internal force response of the structure are more unfavorable.
3.2.2. Influence of Vt
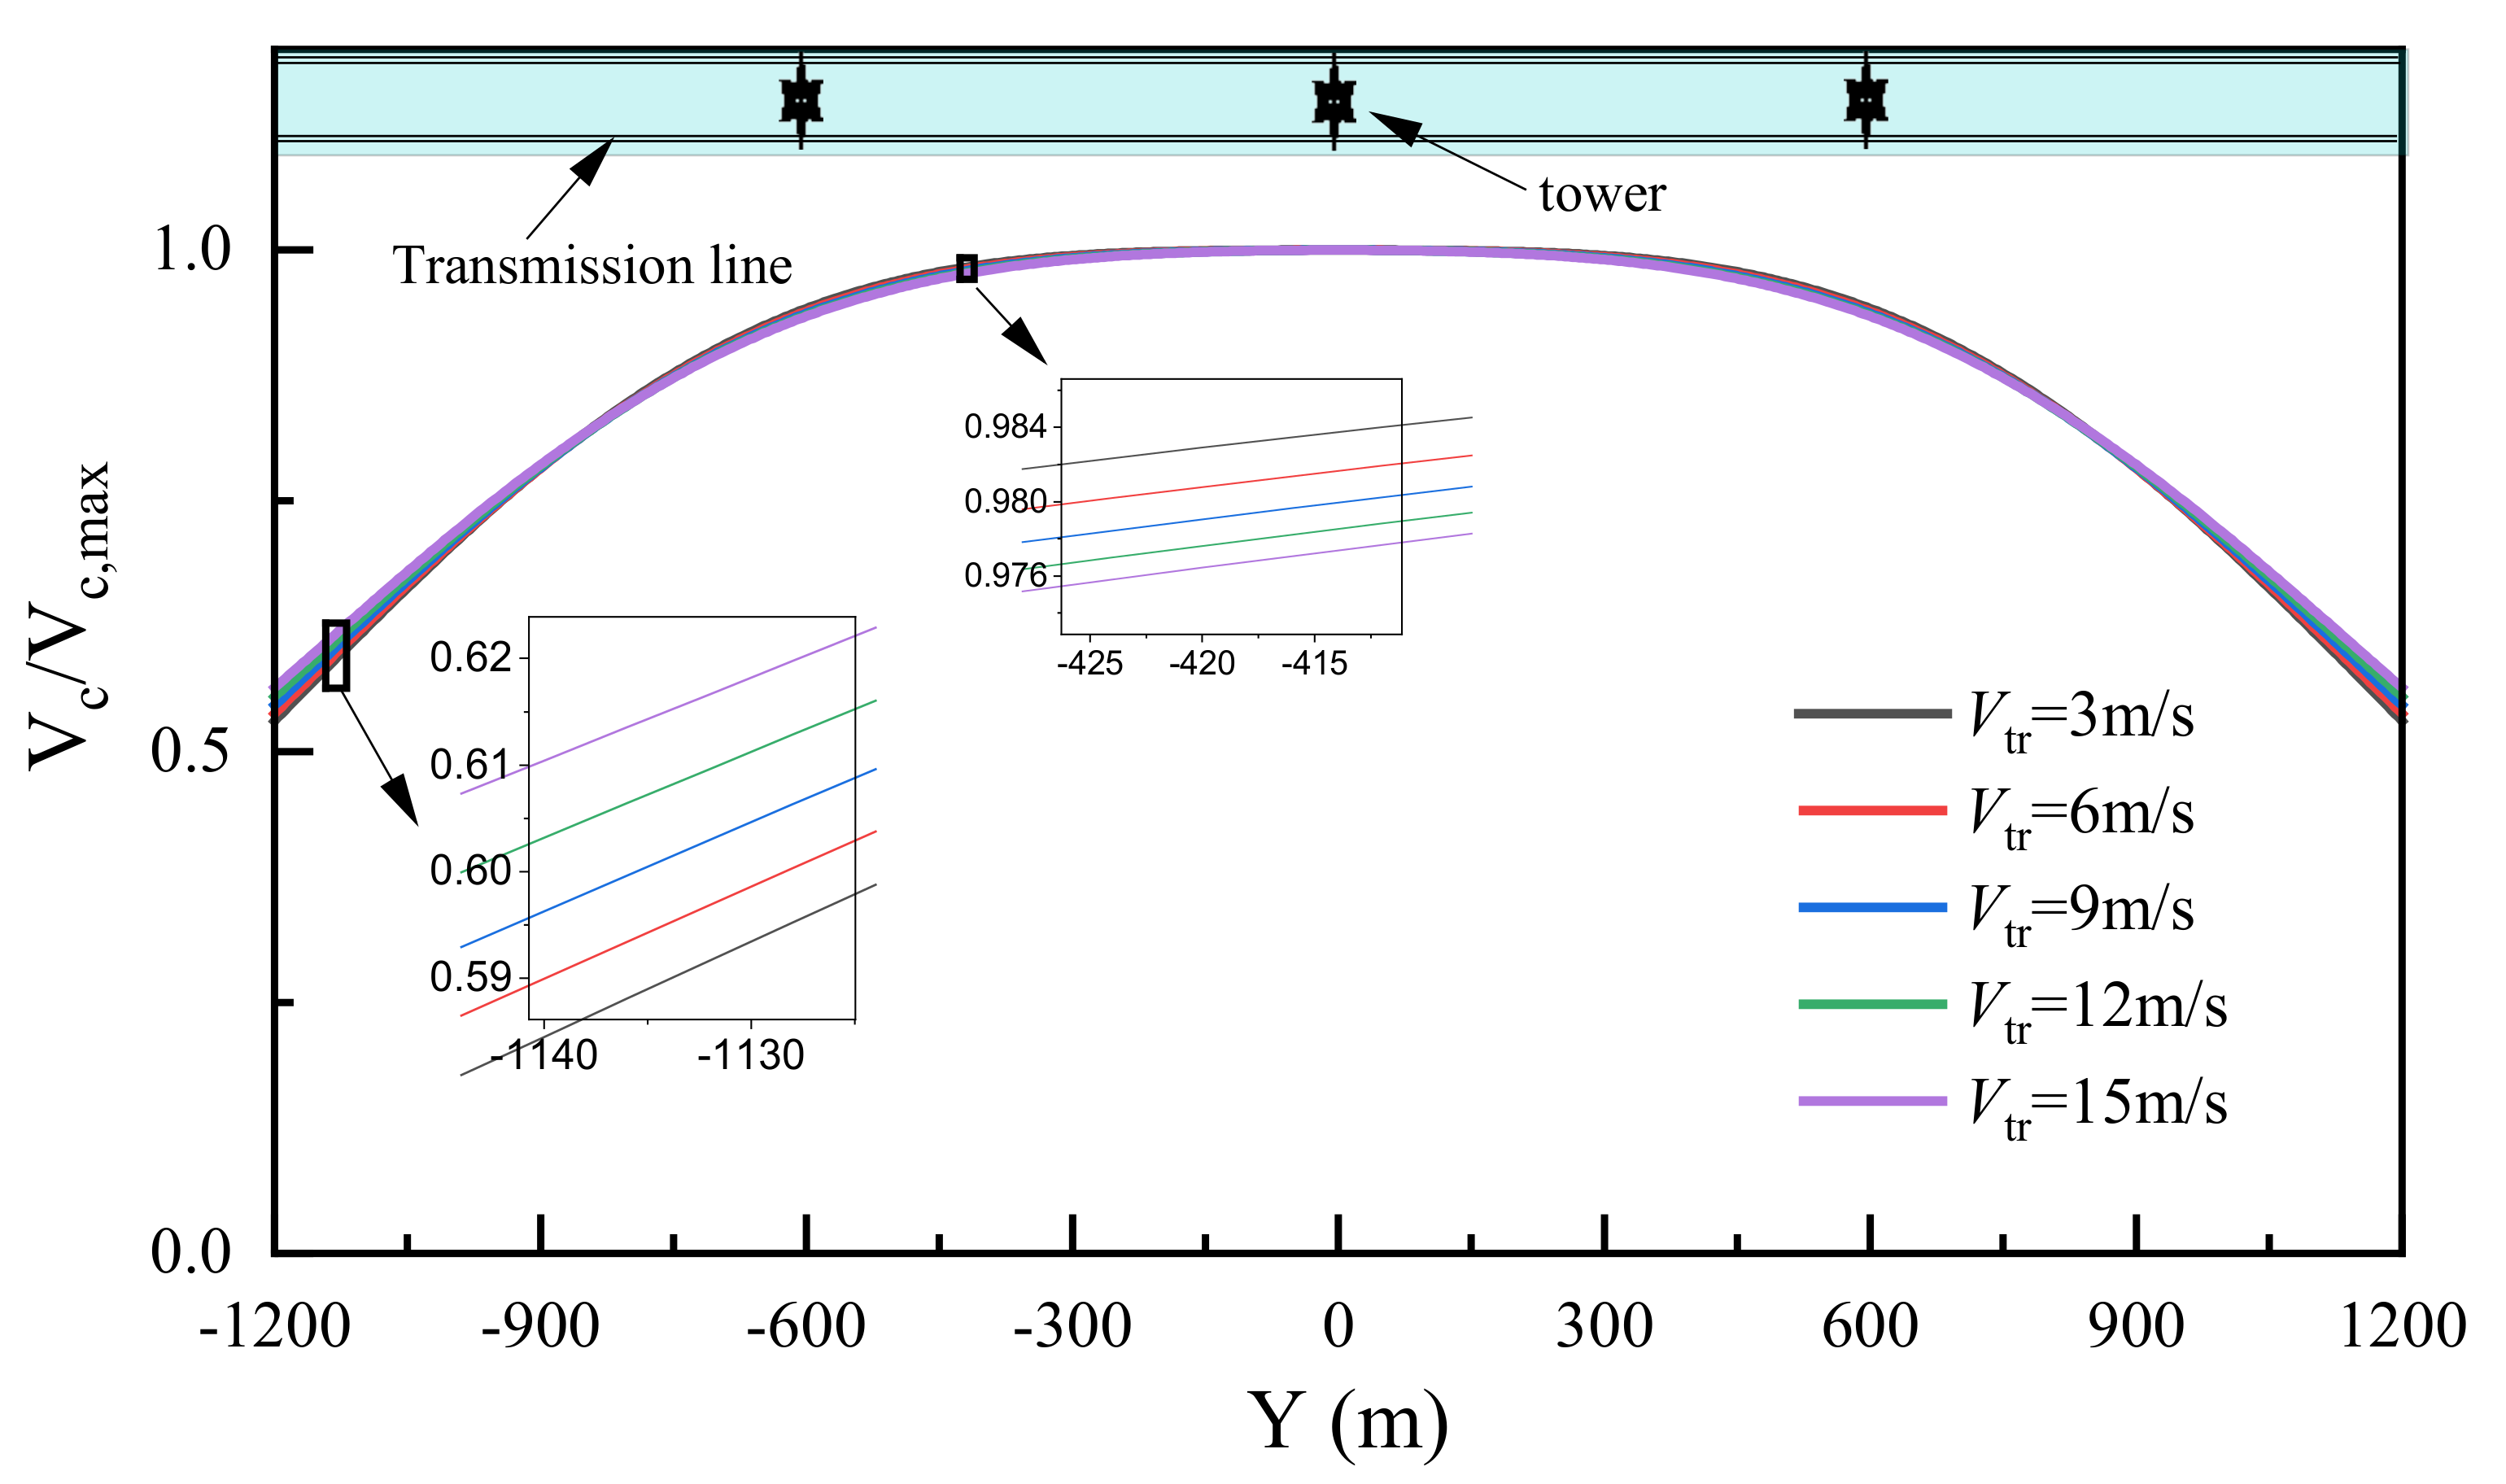
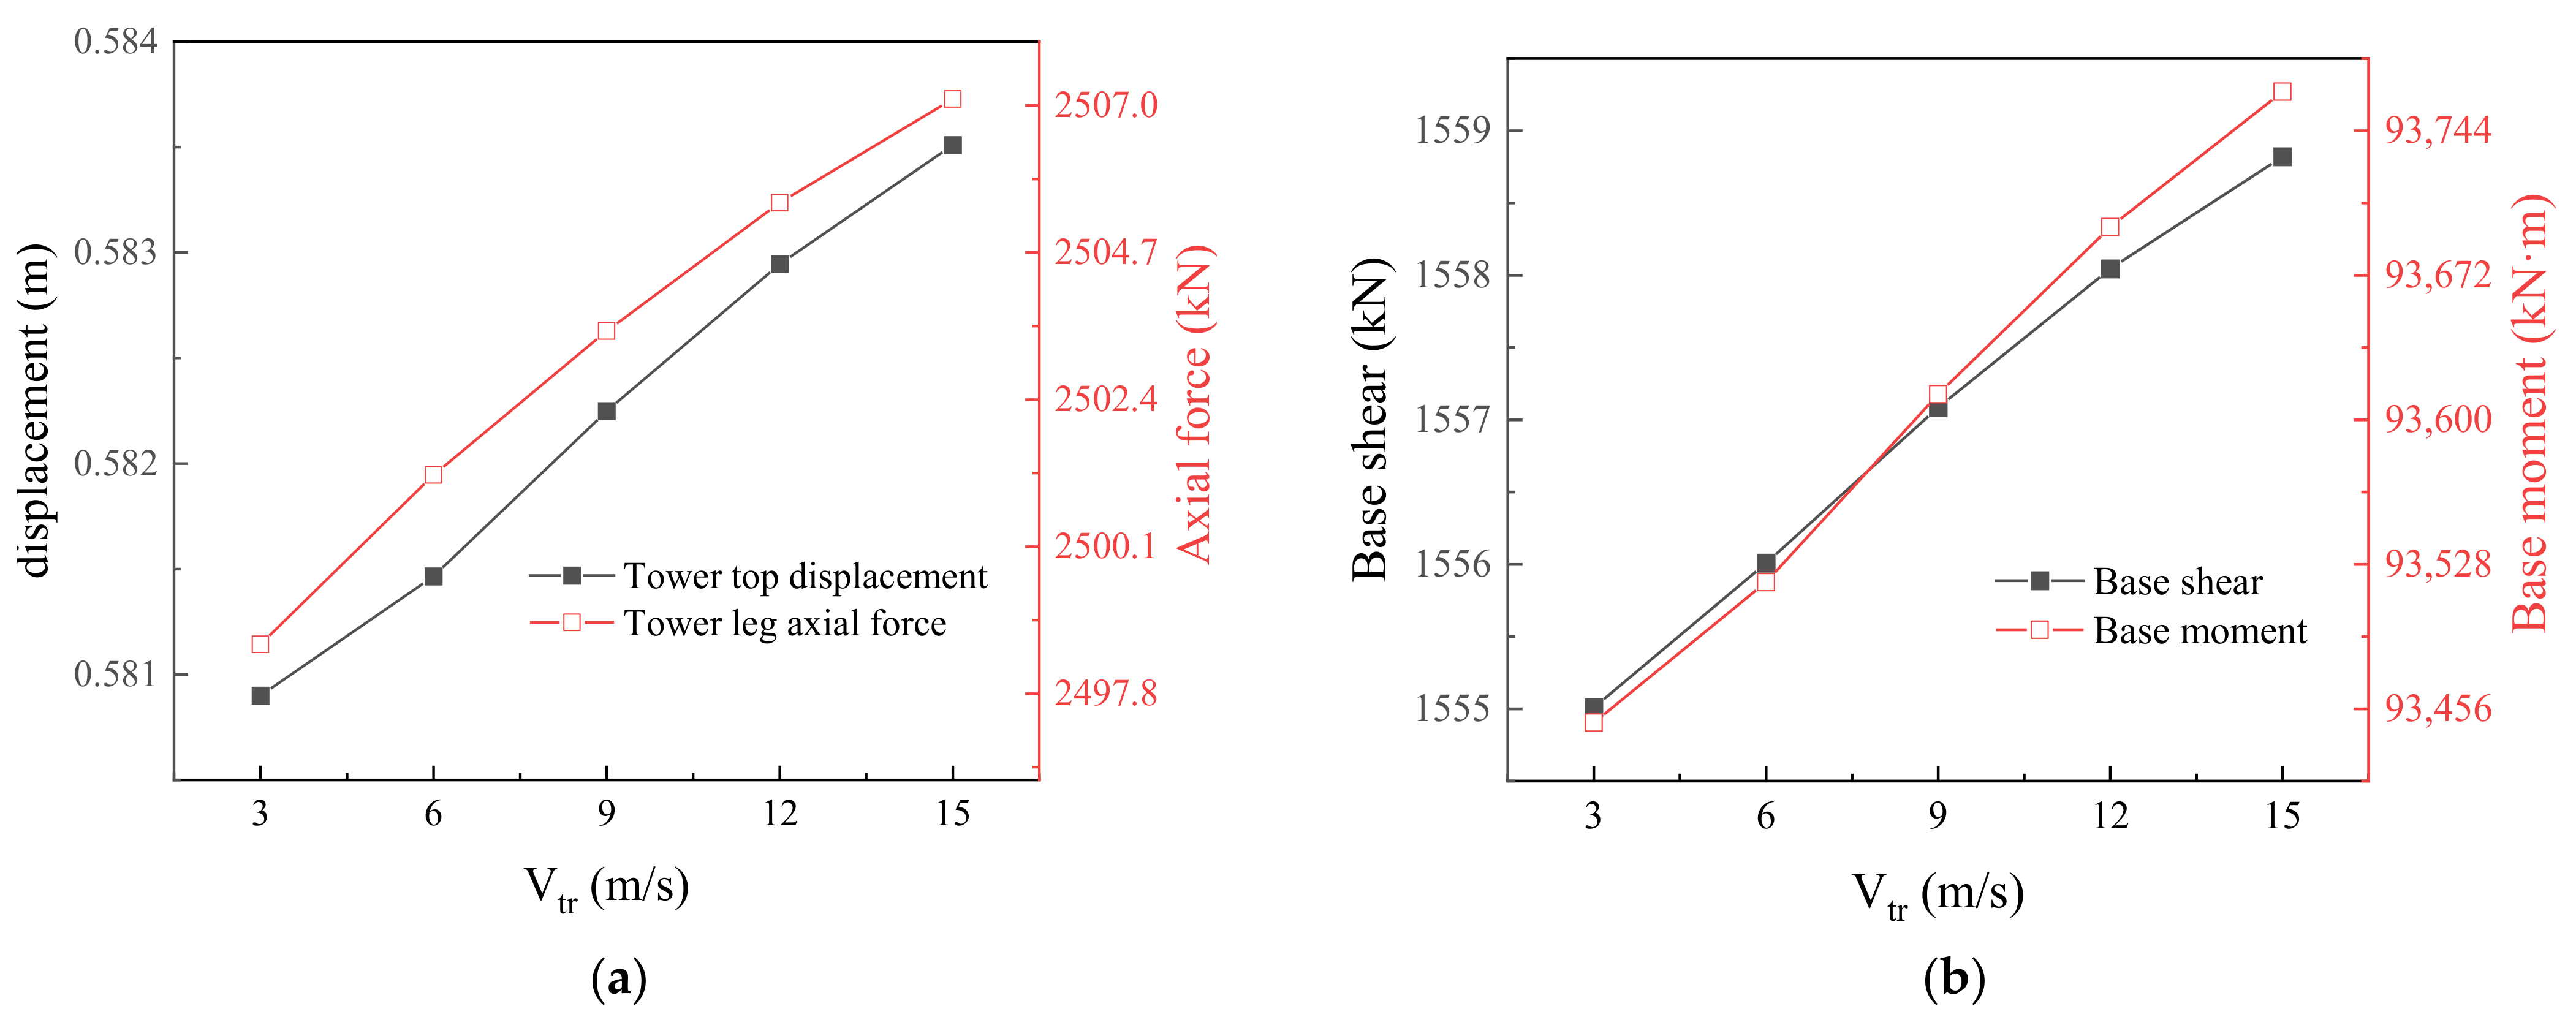
In order to study the influence of Vt on the wind-induced vibration response of the tower-line system, we assumed , , δ = 300 m, , , , and calculated the structural response when Vt was 3 m/s, 6 m/s, 9 m/s, 12 m/s, and 15 m/s, respectively. According to the Holmes model, the transverse wind profiles corresponding to different Vt are shown in Figure 15.
It can be seen from Figure 15 that when the vector superposition method recommended by Holmes is used, Vt has little effect on the shape of the transverse wind profile. Correspondingly, in Figure 16, the response values under different Vt are also similar. However, it is worth noting that previous studies have shown that the vector superposition method is not fully applicable in the simulation of moving downbursts. When the ratio of the moving speed to the jet speed is large, the shape of the transverse wind profile will change significantly. Therefore, the influence of moving speed on the wind vibration response of the tower-line system needs to be further clarified on the basis of wind field research.
3.2.3. Influence of Rc
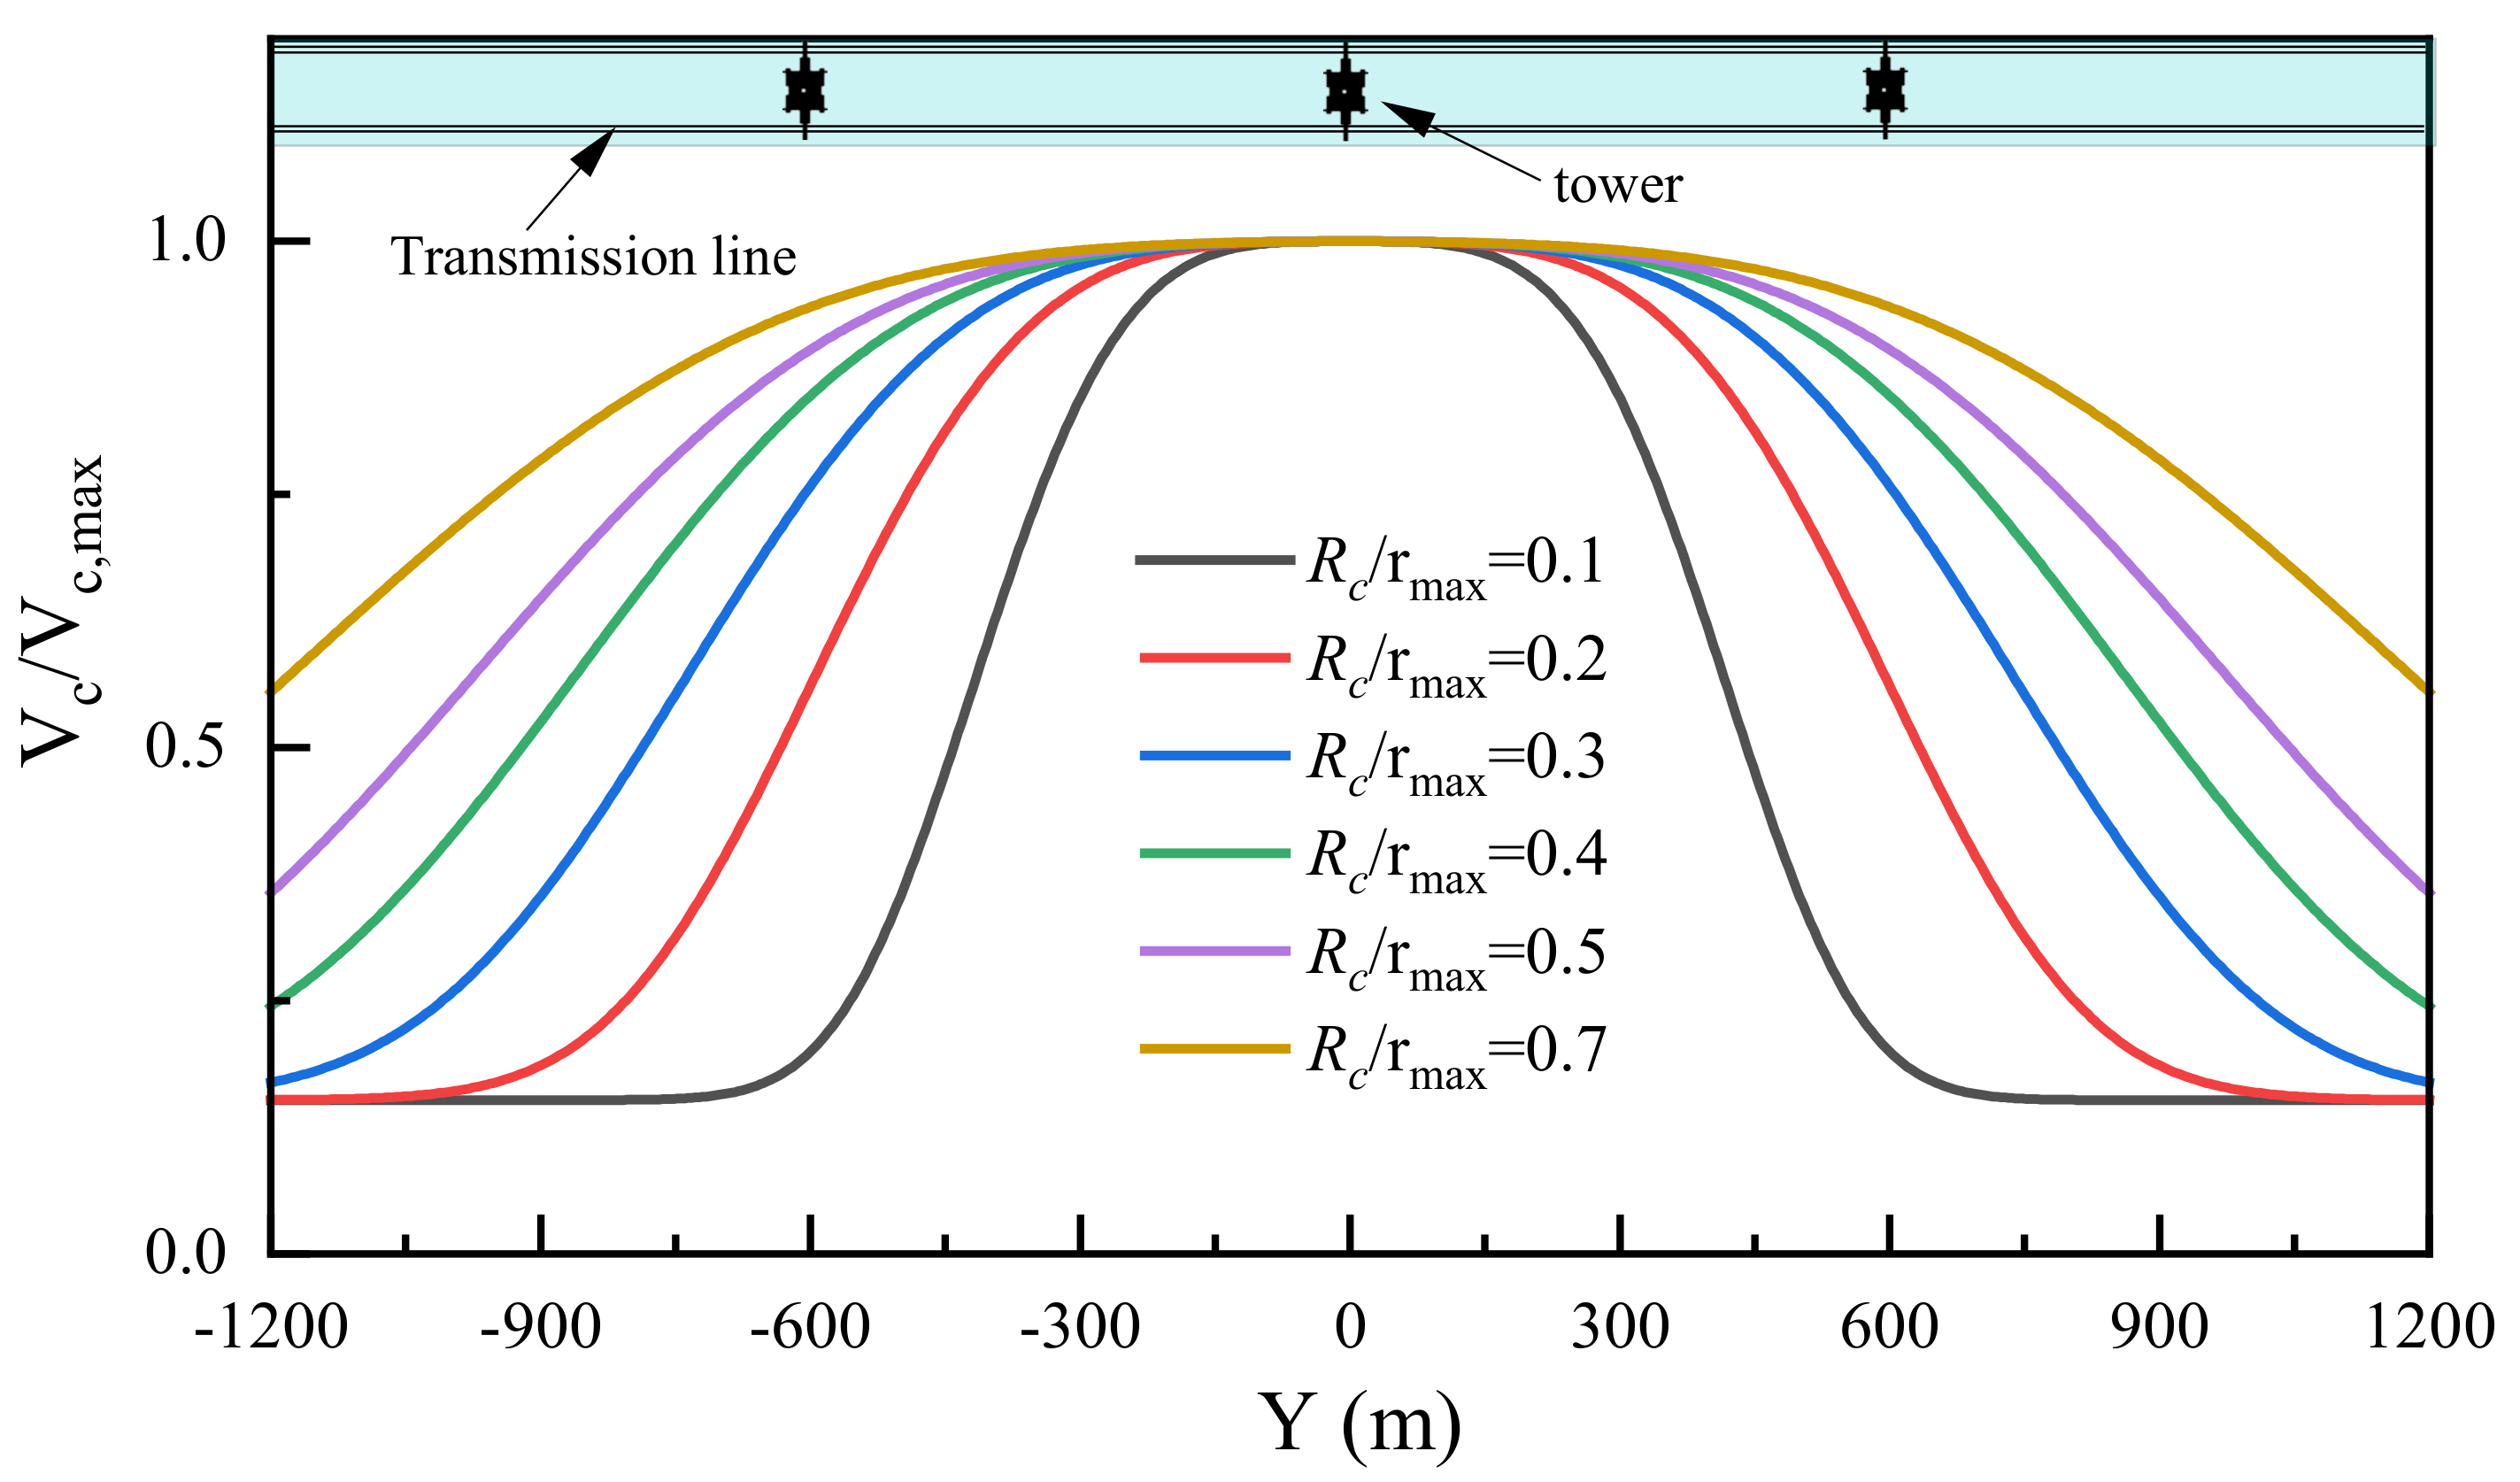
In order to study the influence of Rc on the wind-induced vibration response of the tower-line system, we assumed , , δ = 300 m, , , , and calculated the structural response when was 0.1, 0.2, 0.3, 0.4, 0.5, and 0.7, respectively. According to the Holmes model, the transverse wind profiles corresponding to different are shown in Figure 17.
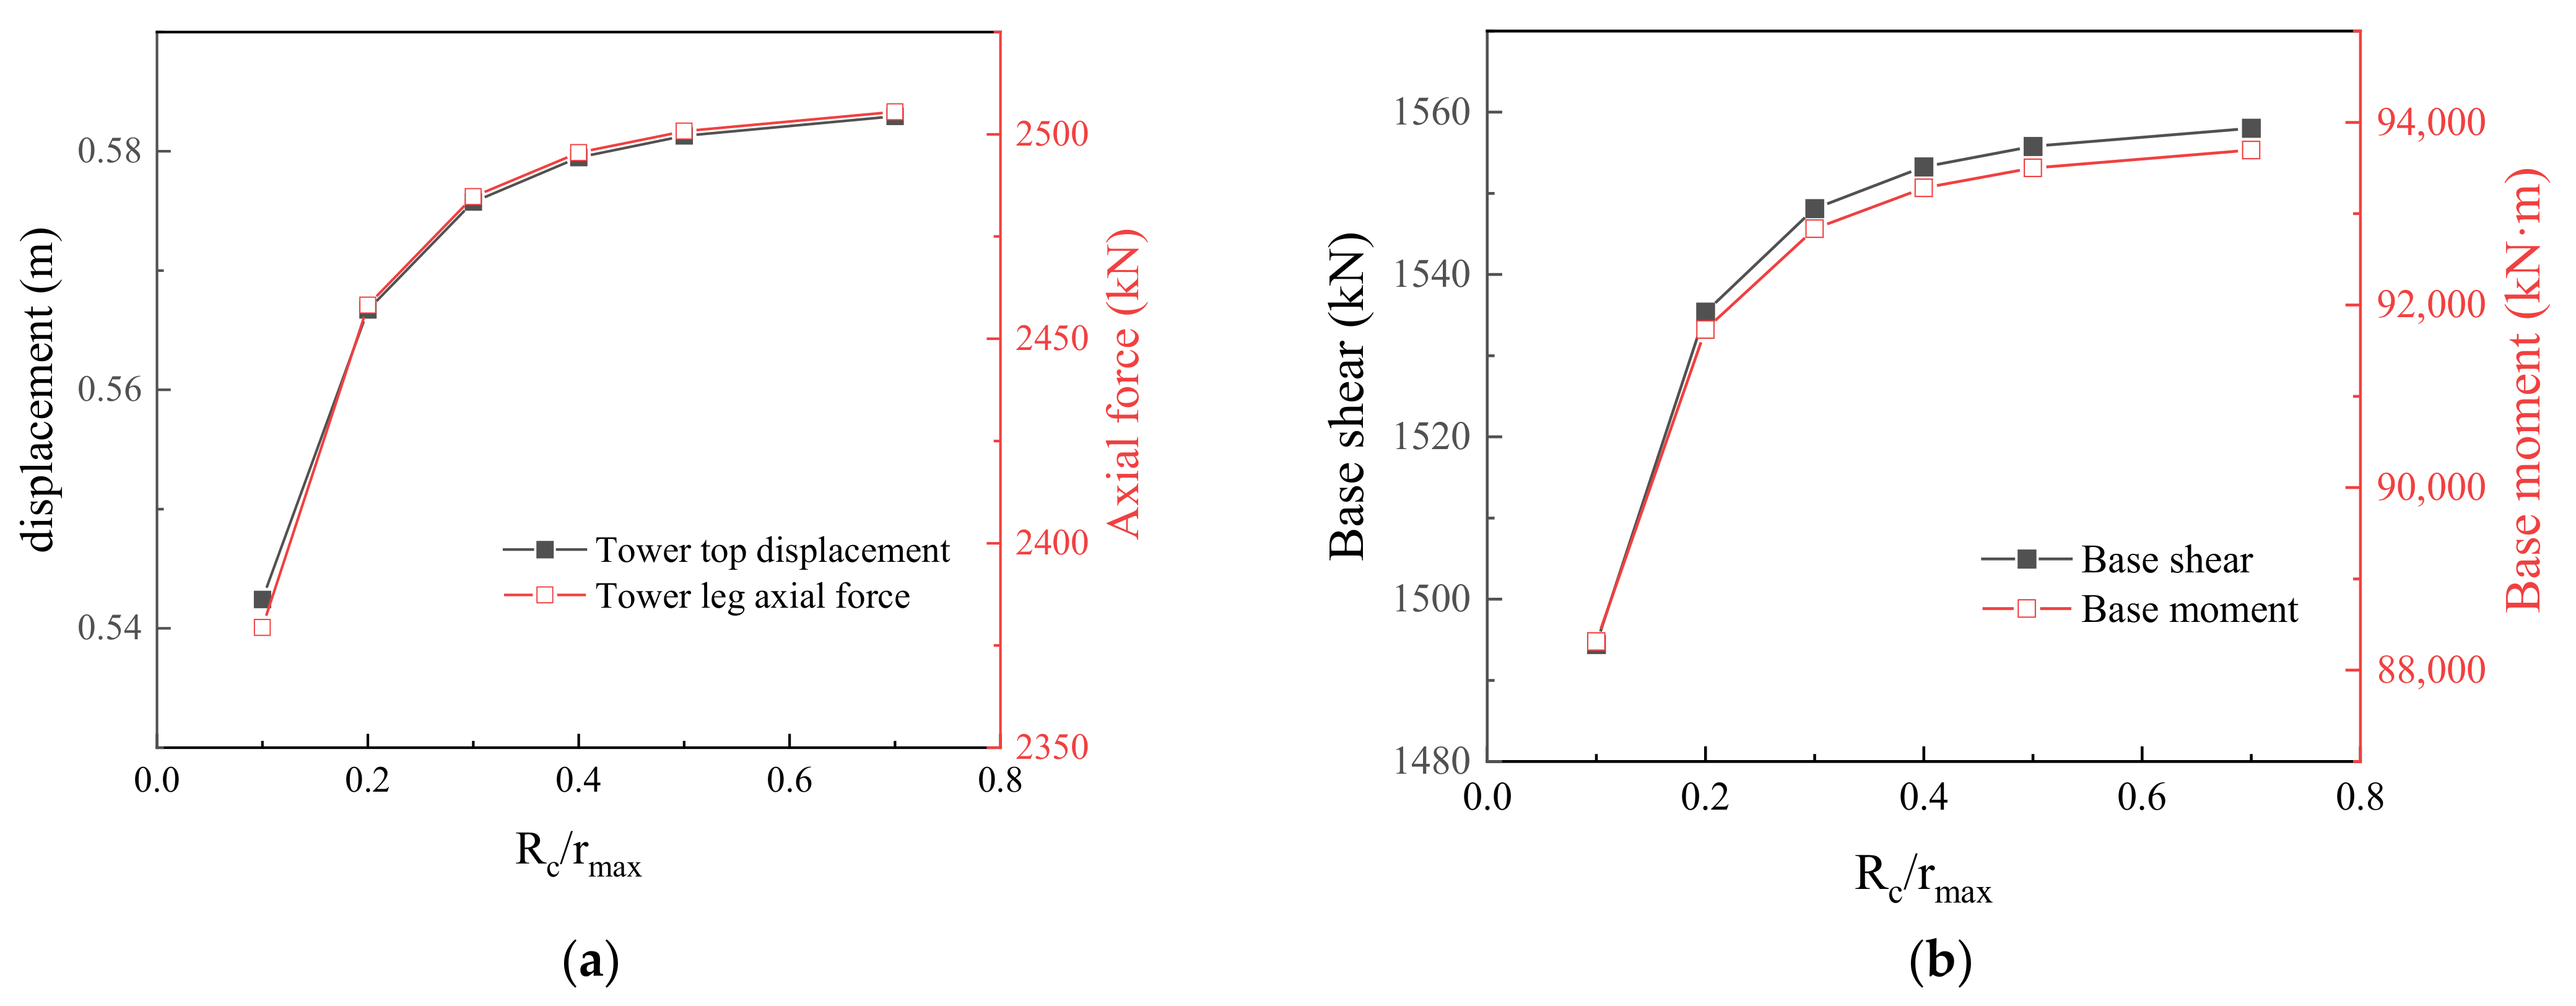
The parameter Rc has an important influence on the transverse wind profile shape of the horizontal wind speed, which in turn affects the wind load on the tower-line system. It can be seen from Figure 18 that with the increase of , various responses increase rapidly at first, and then they gradually slow down after becomes greater than 0.4. The influence of Rc is often ignored in previous studies, but the results of this paper show that for large-span structures such as tower-line systems, the value of has a significant impact on the structural response. When the value of this parameter is too small, it will lead to a structural design being not safe enough.
4. Conclusions
Firstly, the finite element models of a single tower and tower-line system are established, and then the downburst wind load time history is generated. Using the time-domain dynamic analysis method, the wind-induced vibration responses of a single tower and tower-line system are studied, and their dynamic amplification coefficients under downburst are given. The influence of the tower-line coupling effect on the dynamic response of tower is discussed. Finally, the sensitivity of the wind-induced response of the tower-line system to δ, Vt, and Rc is studied. The main conclusions are as follows:
- (1)
- Under the action of downburst, the single tower and tower-line system are dominated by background response. Compared with the single tower, the background response of the tower increases greatly and the resonance response decreases slightly due to the existence of transmission lines in the tower-line system. The dynamic amplification factor of a single tower and tower-line system can be conservatively taken as 1.3. For various responses, the dynamic amplification factor of a tower-line system is slightly less than that of a single tower, indicating that the tower-line coupling effect has weakened the dynamic response of the transmission tower.
- (2)
- With the increase of δ, the various responses of the tower-line system first increase rapidly, and then decrease gradually. For the self-supporting tower studied in this paper, when the height of the peak wind speed is close to the height of tower, the displacement and internal force response of the structure are more unfavorable.
- (3)
- When the vector superposition method is used, the difference of the storm moving speed, Vt, has little effect on the wind-induced response of the tower-line system. However, previous studies have shown that the vector superposition method is not suitable for a moving downburst. With the deepening of wind field research, the impact of Vt on the wind-induced response of tower-line system is worthy of re-evaluation.
- (4)
- With the increase of , various responses increase rapidly at first, and then they gradually slow down after becomes greater than 0.4. For large-span structures such as tower-line systems, the value of has a significant impact on the structural response. When the value of this parameter is too small, it will lead to a structural design being not safe enough.
Author Contributions
Conceptualization, Z.F. and H.H.; methodology, Z.F.; software, Z.F.; validation, Z.F., Z.W. and H.H.; formal analysis, Z.F.; investigation, Z.F. and R.Z.; resources, Z.F.; data curation, Z.F.; writing—original draft preparation, Z.F.; writing—review and editing, Z.F. and H.H.; visualization, Z.F. and R.Z.; supervision, Z.W., R.Z. and H.H.; project administration, Z.F.; funding acquisition, Z.W. All authors have read and agreed to the published version of the manuscript.
Funding
This research was funded by the National Natural Science Foundation of China (NSFC), grant number 52178455. The APC was funded by NSFC.
Data Availability Statement
Not applicable.
Conflicts of Interest
The authors declare no conflict of interest.
References
- Chay, M.; Albermani, F.; Wilson, R. Numerical and analytical simulation of downburst wind loads. Eng. Struct. 2006, 28, 240–254. [Google Scholar] [CrossRef] [Green Version]
- Holmes, J.D.; Oliver, S. An empirical model of a downburst. Eng. Struct. 2000, 22, 1167–1172. [Google Scholar] [CrossRef]
- Letchford, C.; Mans, C.; Chay, M. Thunderstorms—Their importance in wind engineering (a case for the next generation wind tunnel). J. Wind. Eng. Ind. Aerodyn. 2002, 90, 1415–1433. [Google Scholar] [CrossRef]
- Solari, G. Emerging issues and new frameworks for wind loading on structures in mixed climates. Wind Struct 2014, 19, 295–320. [Google Scholar] [CrossRef]
- Li, C. A stochastic model of severe thunderstorms for transmission line design. Probabilistic Eng. Mech. 2000, 15, 359–364. [Google Scholar] [CrossRef]
- McCarthy, P.; Melsness, M. Severe Weather Elements Associated with September 5, 1996 Hydro tower Failures Near Grosse Isle, Manitoba, Canada; Manitoba Environmental Service Centre, Environment Canada: Winnipeg, MB, Canada, 1996; p. 21. [Google Scholar]
- Shehata, A.Y.; El Damatty, A.A. Assessment of the failure of an electrical transmission line due to a downburst event. In Proceedings of the Structural Reliability in a Changing World—Proceedings of the 2006 Electrical Transmission Conference, Birmingham, AL, USA, 15–19 October 2006; pp. 27–38. [Google Scholar]
- Yao, J.; Lundgren, T. Experimental investigation of microbursts. Exp. Fluids 1996, 21, 17–25. [Google Scholar] [CrossRef]
- Fenerci, A.; Oiseth, O. Site-specific data-driven probabilistic wind field modeling for the wind-induced response prediction of cable-supported bridges. J. Wind Eng. Ind. Aerodyn. 2018, 181, 161–179. [Google Scholar] [CrossRef]
- Wang, H.; Zhang, Y.-M.; Mao, J.-X. Sparse Gaussian process regression for multi-step ahead forecasting of wind gusts combining numerical weather predictions and on-site measurements. J. Wind Eng. Ind. Aerodyn. 2022, 220, 104873. [Google Scholar] [CrossRef]
- Li, S.; Li, S.; Laima, S.; Li, H. Data-driven modeling of bridge buffeting in the time domain using long short-term memory network based on structural health monitoring. Struct. Control. Health Monit. 2021, 28, e2772. [Google Scholar] [CrossRef]
- Savory, E.; Parke, G.A.; Zeinoddini, M.; Toy, N.; Disney, P. Modelling of tornado and microburst-induced wind loading and failure of a lattice transmission tower. Eng. Struct. 2001, 23, 365–375. [Google Scholar] [CrossRef]
- Shehata, A.; El Damatty, A.; Savory, E. Finite element modeling of transmission line under downburst wind loading. Finite Elem. Anal. Des. 2005, 42, 71–89. [Google Scholar] [CrossRef]
- Shehata, A.; El Damatty, A. Behaviour of guyed transmission line structures under downburst wind loading. Wind Struct. 2007, 10, 249–268. [Google Scholar] [CrossRef]
- Shehata, A.; Nassef, A.; El Damatty, A. A coupled finite element-optimization technique to determine critical microburst parameters for transmission towers. Finite Elem. Anal. Des. 2008, 45, 1–12. [Google Scholar] [CrossRef]
- El Damatty, A.; Elawady, A. Critical load cases for lattice transmission line structures subjected to downbursts: Economic implications for design of transmission lines. Eng. Struct. 2018, 159, 213–226. [Google Scholar] [CrossRef]
- Darwish, M.M.S.E.-D. Characteristics and Design of Downburst loaded Transmission Lines. Ph.D. Thesis, Western University, London, ON, Canada, 2010. Volume 72. [Google Scholar]
- Fang, Z.; Li, Z.; Wang, Z. Study on effect of storm movement on wind field characteristics of downburst. J. Build. Struct. 2019, 40, 166–174. [Google Scholar]
- Wu, Z.; Iida, Y.; Uematsu, Y. The flow fields generated by stationary and travelling downbursts and resultant wind load effects on transmission line structural system. J. Wind Eng. Ind. Aerodyn. 2021, 210, 104521. [Google Scholar] [CrossRef]
- Darwish, M.M.; Damatty, A.A.E.; Hangan, H. Dynamic characteristics of transmission line conductors and behaviour under turbulent downburst loading. Wind Struct. 2010, 13, 327. [Google Scholar] [CrossRef]
- Holmes, J.D.; Hangan, H.M.; Schroeder, J.; Letchford, C.; Orwig, K.D. A forensic study of the Lubbock-Reese downdraft of 2002. Wind Struct. 2008, 11, 137–152. [Google Scholar] [CrossRef]
- Aboshosha, H.; Damatty, A.E. Dynamic response of transmission line conductors under downburst and synoptic winds. Wind Struct 2015, 21, 241–272. [Google Scholar] [CrossRef]
- Wang, Z.; Yang, F.; Wang, Y.; Fang, Z. Study on Wind Loads of Different Height Transmission Towers under Downbursts with Different Parameters. Buildings 2022, 12, 193. [Google Scholar] [CrossRef]
- Meng, S.; Shan, L. Form-finding in dynamic analysis of transmission line. Power Syst. Clean Energy 2009, 25, 43–47. [Google Scholar]
- Wood, G.S.; Kwok, K.C.; Motteram, N.A.; Fletcher, D.F. Physical and numerical modelling of thunderstorm downbursts. J. Wind Eng. Ind. Aerodyn. 2001, 89, 535–552. [Google Scholar] [CrossRef]
- Chen, L.; Letchford, C.W. A deterministic-stochastic hybrid model of downbursts and its impact on a cantilevered structure. Eng. Struct. 2004, 26, 619–629. [Google Scholar] [CrossRef]
- Chen, L.; Letchford, C. Multi-scale correlation analyses of two lateral profiles of full-scale downburst wind speeds. J. Wind Eng. Ind. Aerodyn. 2006, 94, 675–696. [Google Scholar] [CrossRef]
- Kaimal, J.C.; Wyngaard, J.; Izumi, Y.; Coté, O. Spectral characteristics of surface-layer turbulence. Q. J. R. Meteorol. Soc. 1972, 98, 563–589. [Google Scholar] [CrossRef]
- Fujita, T.T. Tornadoes and downbursts in the context of generalized planetary scales. J. Atmos. Sci. 1981, 38, 1511–1534. [Google Scholar] [CrossRef] [Green Version]
- Holmes, J. Modeling of extreme thunderstorm winds for wind loading of structures and risk assessment. In Proceedings of the Tenth International Conference on Wind Engineering, Copenhagen, Denmark, 21–24 June 1999; pp. 1409–1415. [Google Scholar]
Figure 1.
Transmission tower-line system: (a) tower-line system; (b) plane view of the tower; (c) 3-D isometric view of transmission tower model.
Figure 1.
Transmission tower-line system: (a) tower-line system; (b) plane view of the tower; (c) 3-D isometric view of transmission tower model.

Figure 2.
Finite element model of single tower and tower-line system: (a) single tower; (b) tower-line system.
Figure 2.
Finite element model of single tower and tower-line system: (a) single tower; (b) tower-line system.

Figure 3.
Vibration modes of a single tower: (a) first mode, 0.9370 Hz; (b)second mode, 0.9582 Hz; (c) third mode, 1.3617 Hz.
Figure 3.
Vibration modes of a single tower: (a) first mode, 0.9370 Hz; (b)second mode, 0.9582 Hz; (c) third mode, 1.3617 Hz.

Figure 4.
Vibration modes of a tower-line system: (a) first mode, 0.8669 Hz; (b)second mode, 0.9271 Hz; (c) third mode, 1.3209 Hz.
Figure 4.
Vibration modes of a tower-line system: (a) first mode, 0.8669 Hz; (b)second mode, 0.9271 Hz; (c) third mode, 1.3209 Hz.

Figure 5.
Schematic of relative position relationship between a tower-line system and downburst. (Coordinates Pi = (xi, yi, zi) (m) of the points: P1 = (1200, 0, 31.5), P2 = (1200, 0, 108), P3 = (1200, −74.6, 31.5), P4 = (1200, 525, 31.5)).
Figure 5.
Schematic of relative position relationship between a tower-line system and downburst. (Coordinates Pi = (xi, yi, zi) (m) of the points: P1 = (1200, 0, 31.5), P2 = (1200, 0, 108), P3 = (1200, −74.6, 31.5), P4 = (1200, 525, 31.5)).

Figure 6.
Wind speed time history of simulation points: (a) P1; (b) P2; (c) P3; (d) P4.

Figure 7.
Diagram of load area division and wind load simulation points: (a) tower; (b) tower-line system.
Figure 7.
Diagram of load area division and wind load simulation points: (a) tower; (b) tower-line system.

Figure 8.
Time history of tower top displacement response: (a) single tower; (b) tower-line system.

Figure 9.
Time frequency diagram of the fluctuating displacement response of the tower top. Single tower: (a) fluctuating response; (b) fluctuation background component; (c) fluctuation resonance component. Tower-line system: (d) fluctuating response; (e) fluctuation background component; (f) fluctuation resonance component.


Figure 10.
Time history of tower leg axial force response: (a) single tower; (b) tower-line system.

Figure 11.
Time history of base shear response: (a) single tower; (b) tower-line system.

Figure 12.
Distribution of displacement and axial force along the tower height: (a) displacement; (b) axial force.
Figure 12.
Distribution of displacement and axial force along the tower height: (a) displacement; (b) axial force.

Figure 13.
Variation of vertical wind profile of downburst with δ.

Figure 14.
Wind-induced response of tower-line system changes with δ: (a) tower top displacement and tower leg axial force; (b) base shear and bending moment.
Figure 14.
Wind-induced response of tower-line system changes with δ: (a) tower top displacement and tower leg axial force; (b) base shear and bending moment.

Figure 15.
Variation of transverse wind profiles of downburst with Vt.

Figure 16.
Wind-induced response of tower-line system changes with Vt: (a) tower top displacement and tower leg axial force; (b) base shear and bending moment.
Figure 16.
Wind-induced response of tower-line system changes with Vt: (a) tower top displacement and tower leg axial force; (b) base shear and bending moment.

Figure 17.
Variation of transverse wind profiles of downburst with .

Figure 18.
Wind-induced response of tower-line system changes with (a) tower top displacement and tower leg axial force; (b) base shear and bending moment.
Figure 18.
Wind-induced response of tower-line system changes with (a) tower top displacement and tower leg axial force; (b) base shear and bending moment.


Table 1.
Main physical parameters of the conductors and ground wires.
| Parameter | Conductor | Ground Wire |
|---|---|---|
| Model | 8 split LGJ-630/45 | JLB20A-240 |
| Calculated sectional area (mm2) | 666.55 | 236.60 |
| Appearance diameter (mm) | 33.60 | 20.00 |
| Equivalent density (kg/m3) | 3090.54 | 7383.77 |
| Unit weight (kg/m) | 2.06 | 1.75 |
| Modulus of elasticity (MPa) | 63,000 | 139,500 |
Table 2.
Dynamic amplification factor of a transmission tower under downburst.
| Tower Top Displacement (m) | Tower Leg Axial Force (kN) | |||
|---|---|---|---|---|
| Single Tower | Tower-Line | Single Tower | Tower-Line | |
| 0.301 | 0.583 | 1508 | 2502 | |
| Rs,max | 0.360 | 0.647 | 1762 | 2788 |
| Rd,max | 0.386 | 0.655 | 1796 | 2822 |
| βs | 1.197 | 1.110 | 1.169 | 1.114 |
| βd | 1.283 | 1.124 | 1.191 | 1.128 |
Publisher’s Note: MDPI stays neutral with regard to jurisdictional claims in published maps and institutional affiliations. |
© 2022 by the authors. Licensee MDPI, Basel, Switzerland. This article is an open access article distributed under the terms and conditions of the Creative Commons Attribution (CC BY) license (https://creativecommons.org/licenses/by/4.0/).
Share and Cite
MDPI and ACS Style
Fang, Z.; Wang, Z.; Zhu, R.; Huang, H. Study on Wind-Induced Response of Transmission Tower-Line System under Downburst Wind. Buildings 2022, 12, 891. https://doi.org/10.3390/buildings12070891
AMA Style
Fang Z, Wang Z, Zhu R, Huang H. Study on Wind-Induced Response of Transmission Tower-Line System under Downburst Wind. Buildings. 2022; 12(7):891. https://doi.org/10.3390/buildings12070891
Chicago/Turabian StyleFang, Zhiyuan, Zhisong Wang, Renyu Zhu, and Hanjie Huang. 2022. "Study on Wind-Induced Response of Transmission Tower-Line System under Downburst Wind" Buildings 12, no. 7: 891. https://doi.org/10.3390/buildings12070891
Note that from the first issue of 2016, this journal uses article numbers instead of page numbers. See further details here.