
Mitochondria-Mediated Apoptosis of HCC Cells Triggered by Knockdown of Glutamate Dehydrogenase 1: Perspective for Its Inhibition through Quercetin and Permethylated Anigopreissin A

 , , and
Abstract
:
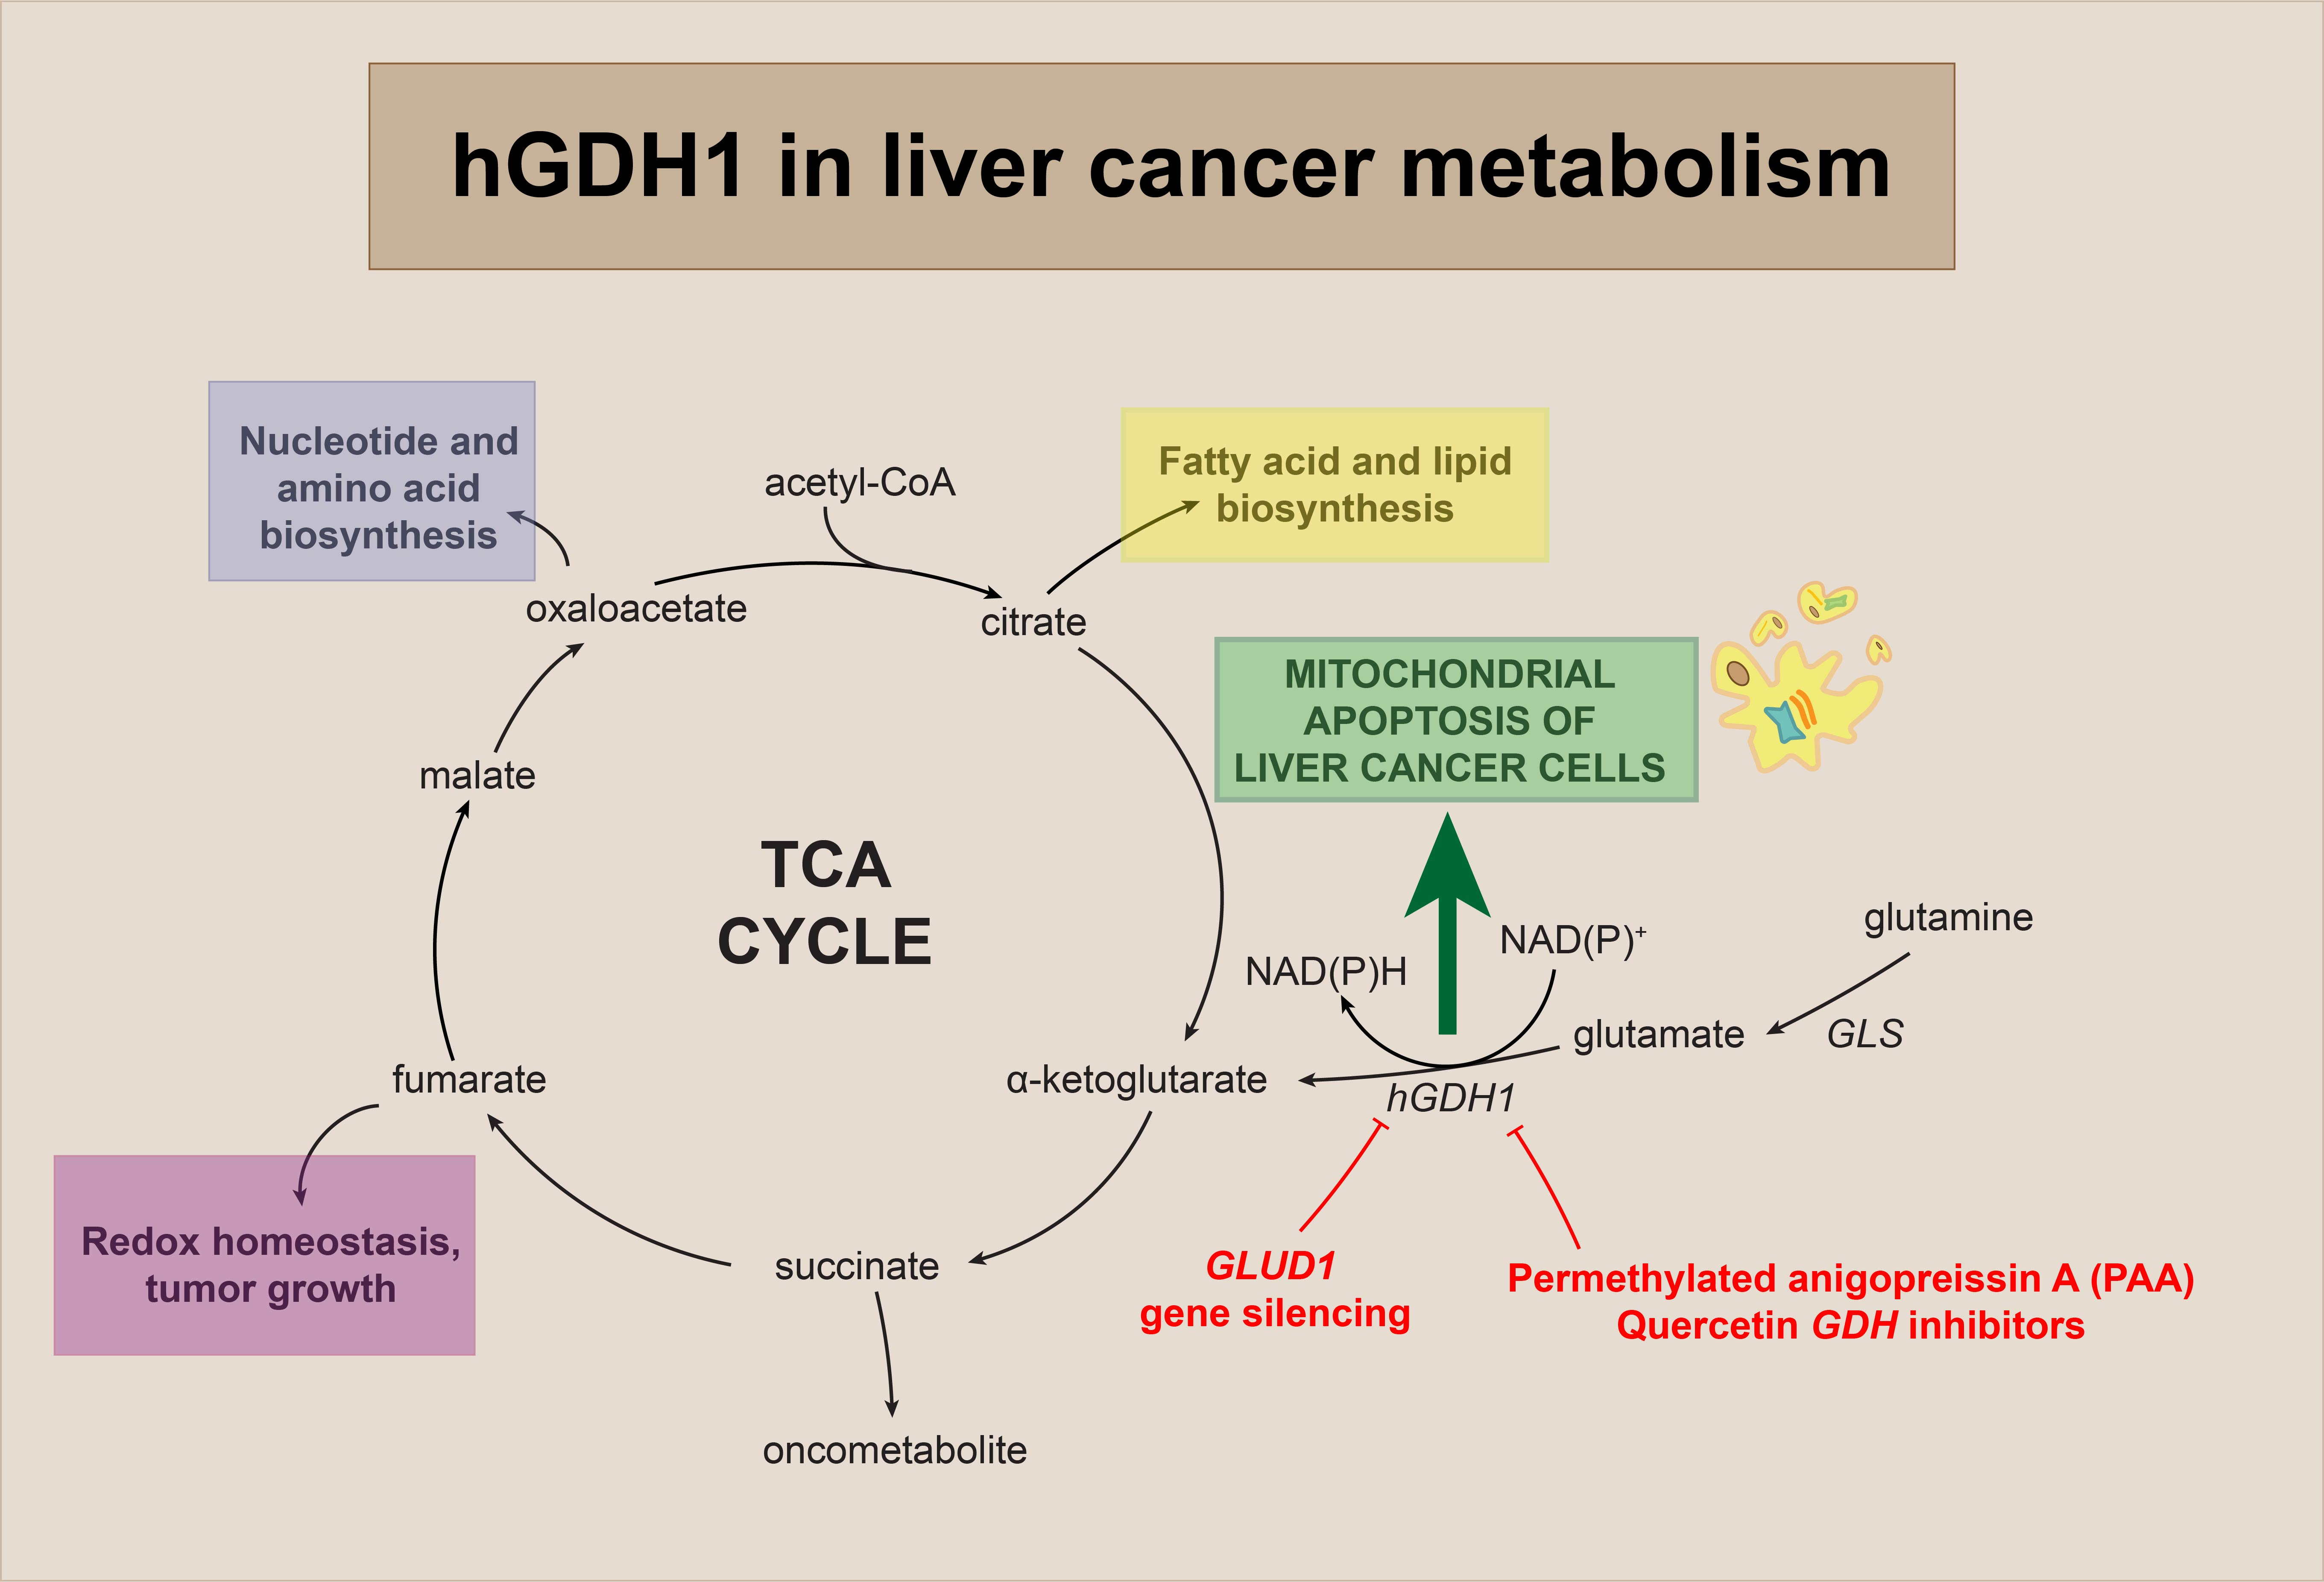
1. Introduction
2. Materials and Methods
2.1. Cell Culture
2.2. GLUD1 Expression Analysis
2.3. Transfection of GLUD1 siRNA
2.4. Cell Proliferation Assay
2.5. Caspase Assay
2.6. DNA Fragmentation Assay
2.7. Real-Time PCR
2.8. Mitochondrial Mass Analysis
2.9. Mitochondrial Membrane Potential Analysis
2.10. Mitochondrial Superoxide Analysis
2.11. Purified Bovine Liver GDH Activity
2.12. hGDH Activity in Cellular Extracts
2.13. Statistical Analysis
3. Results
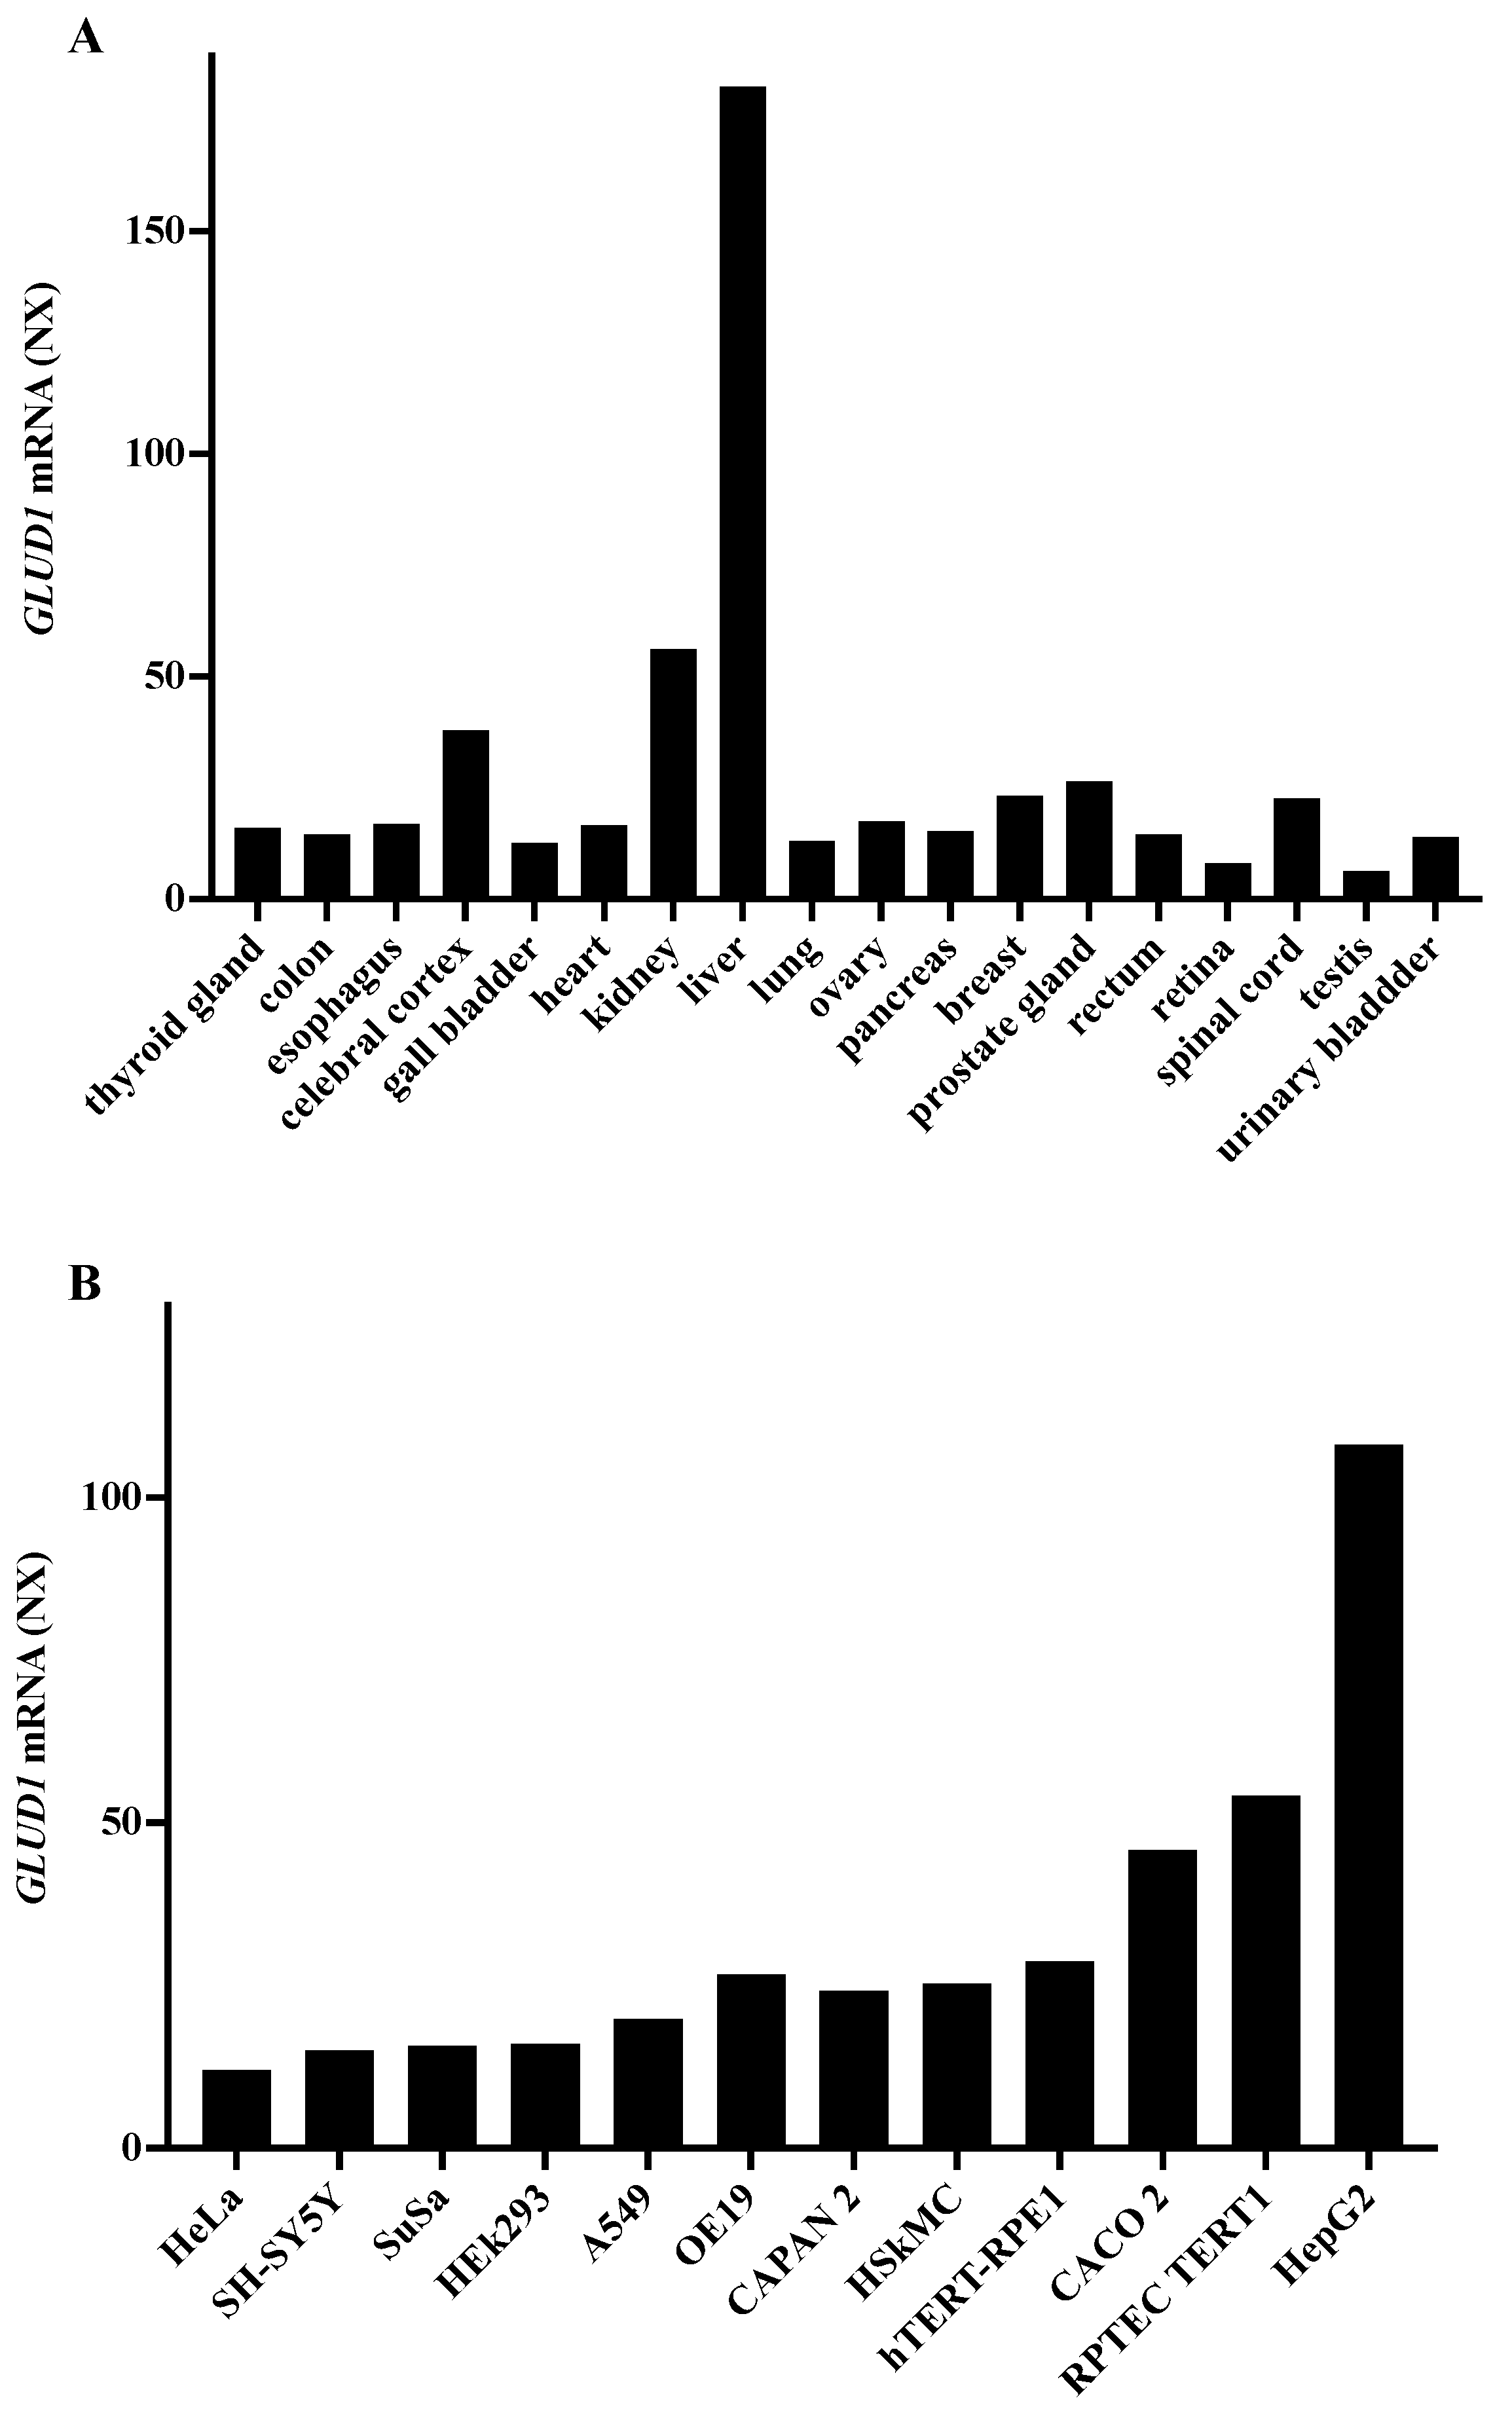
3.1. GLUD1 Gene Expression
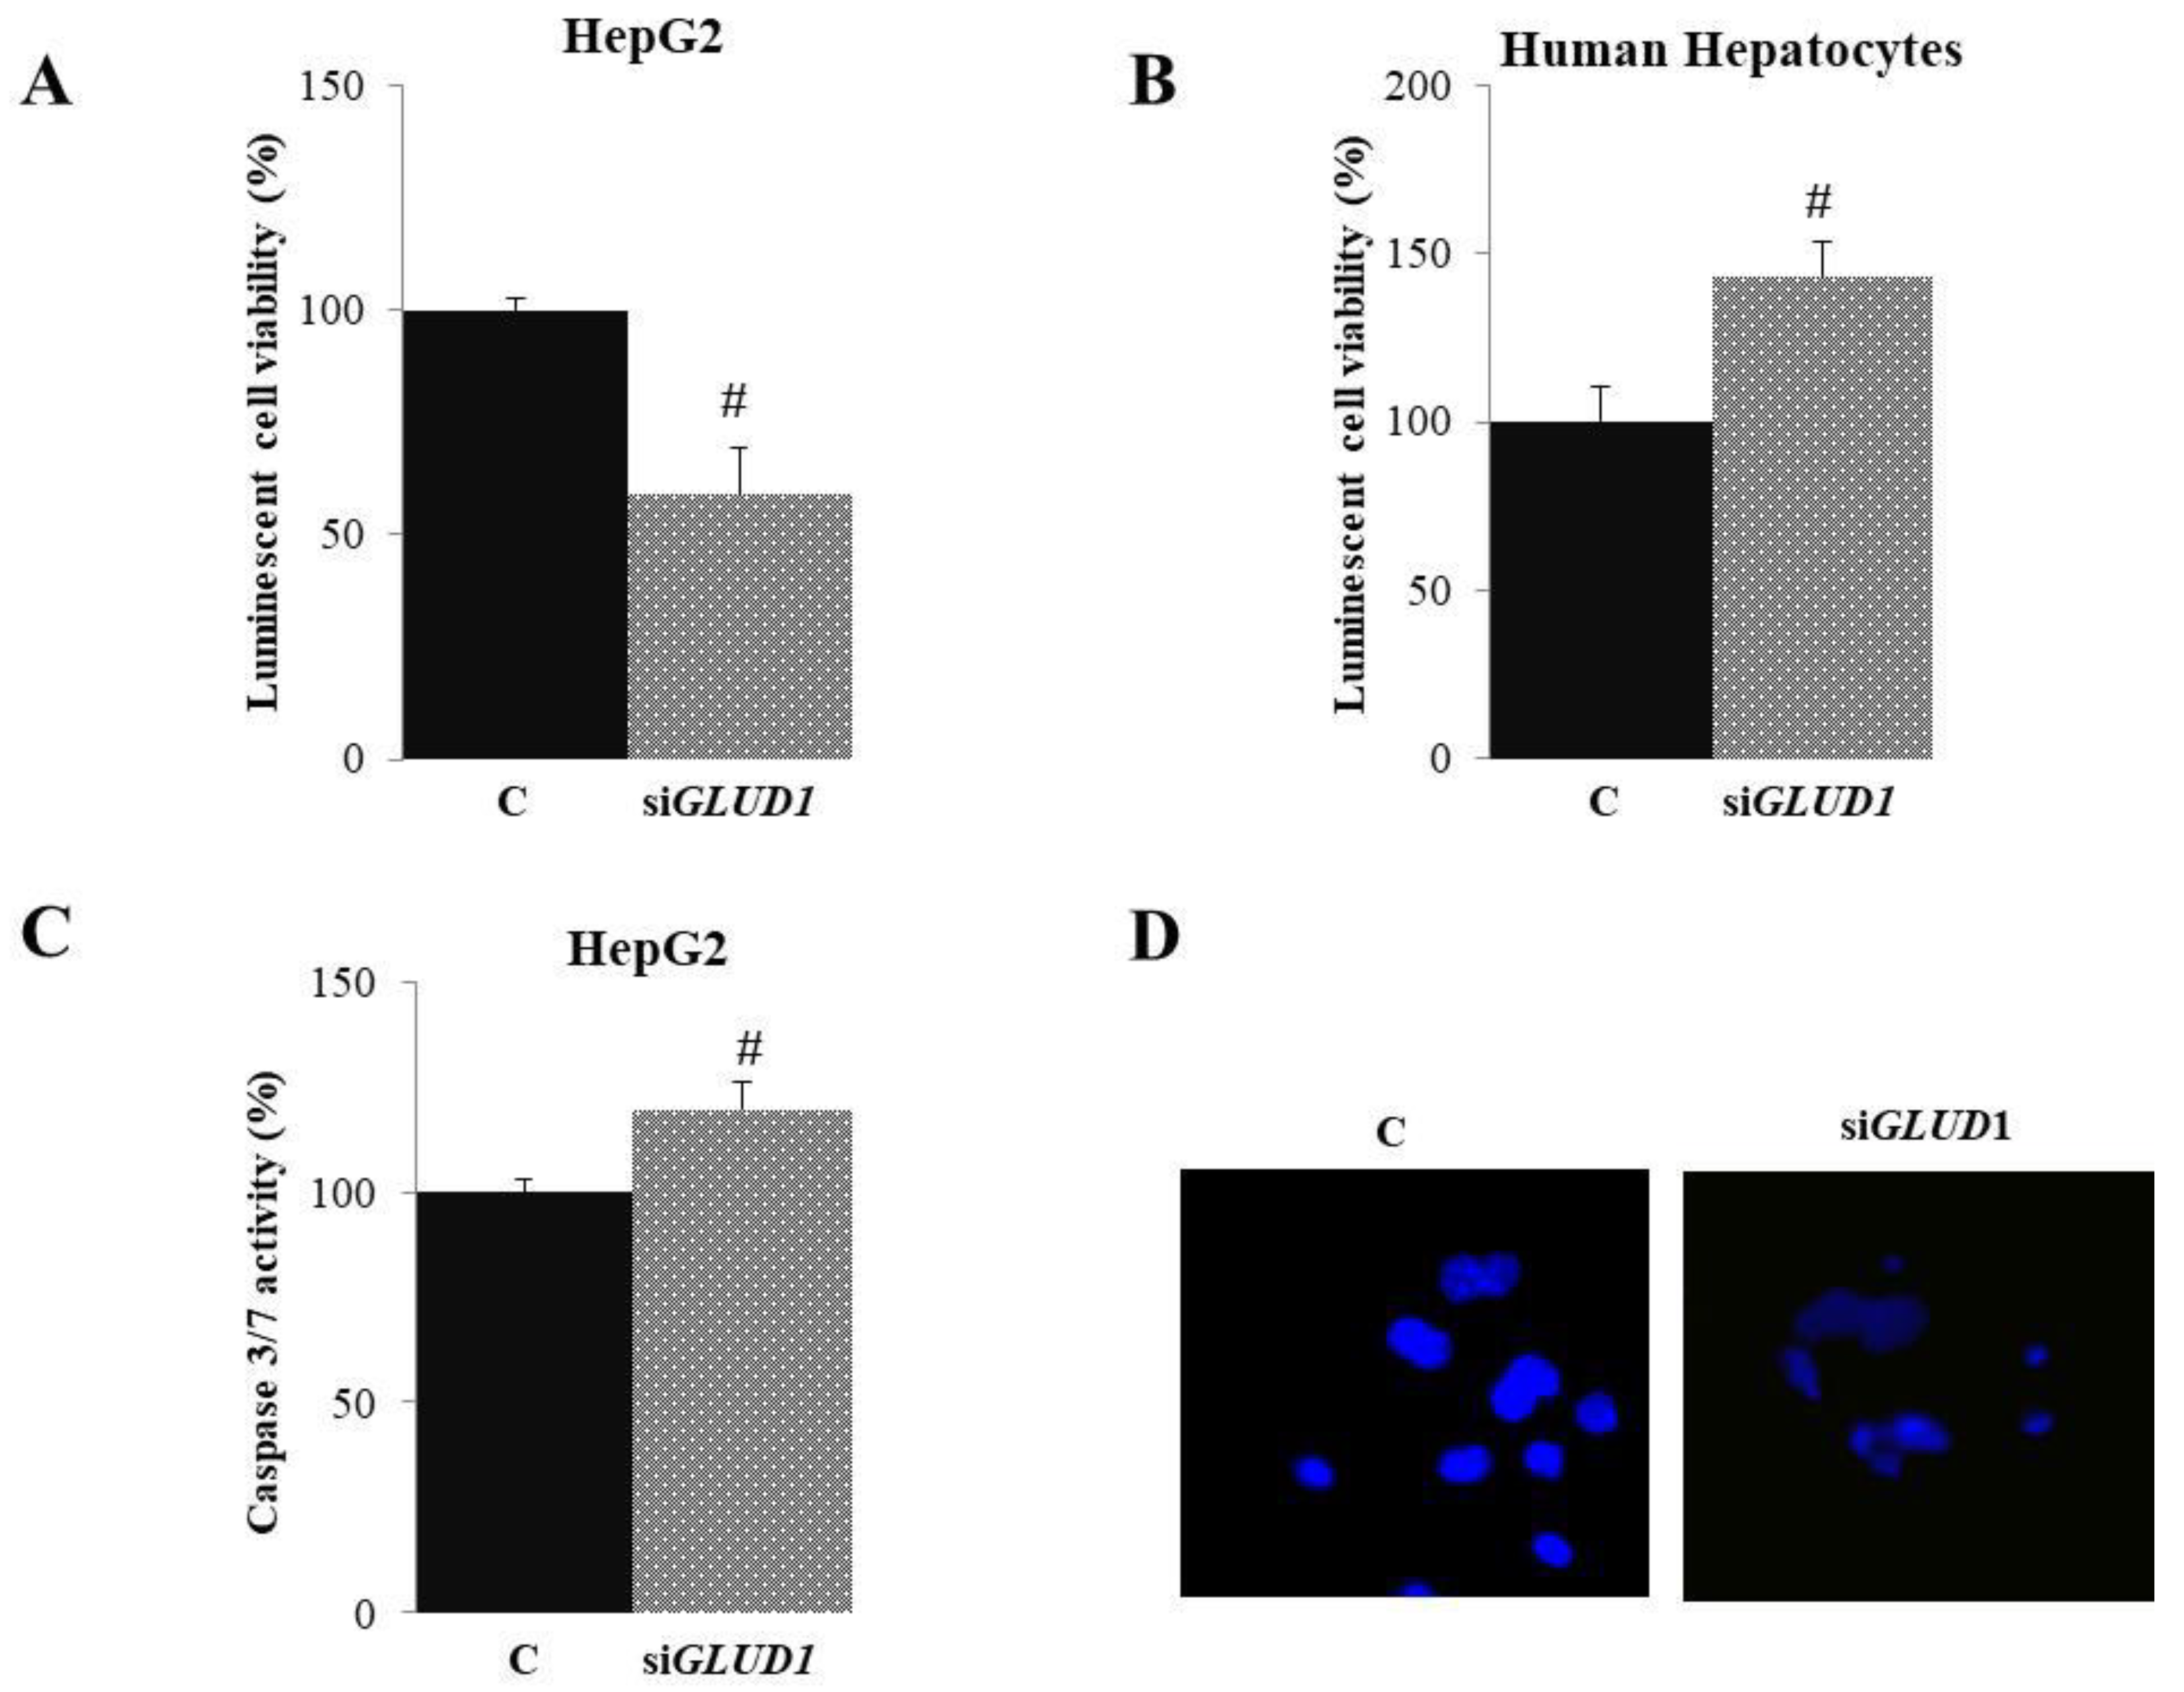
3.2. Cytotoxic Effect of GLUD1 Gene Silencing on HCC and HH Cells
3.3. Apoptotic Activity in GLUD1-Silenced HCC Cells
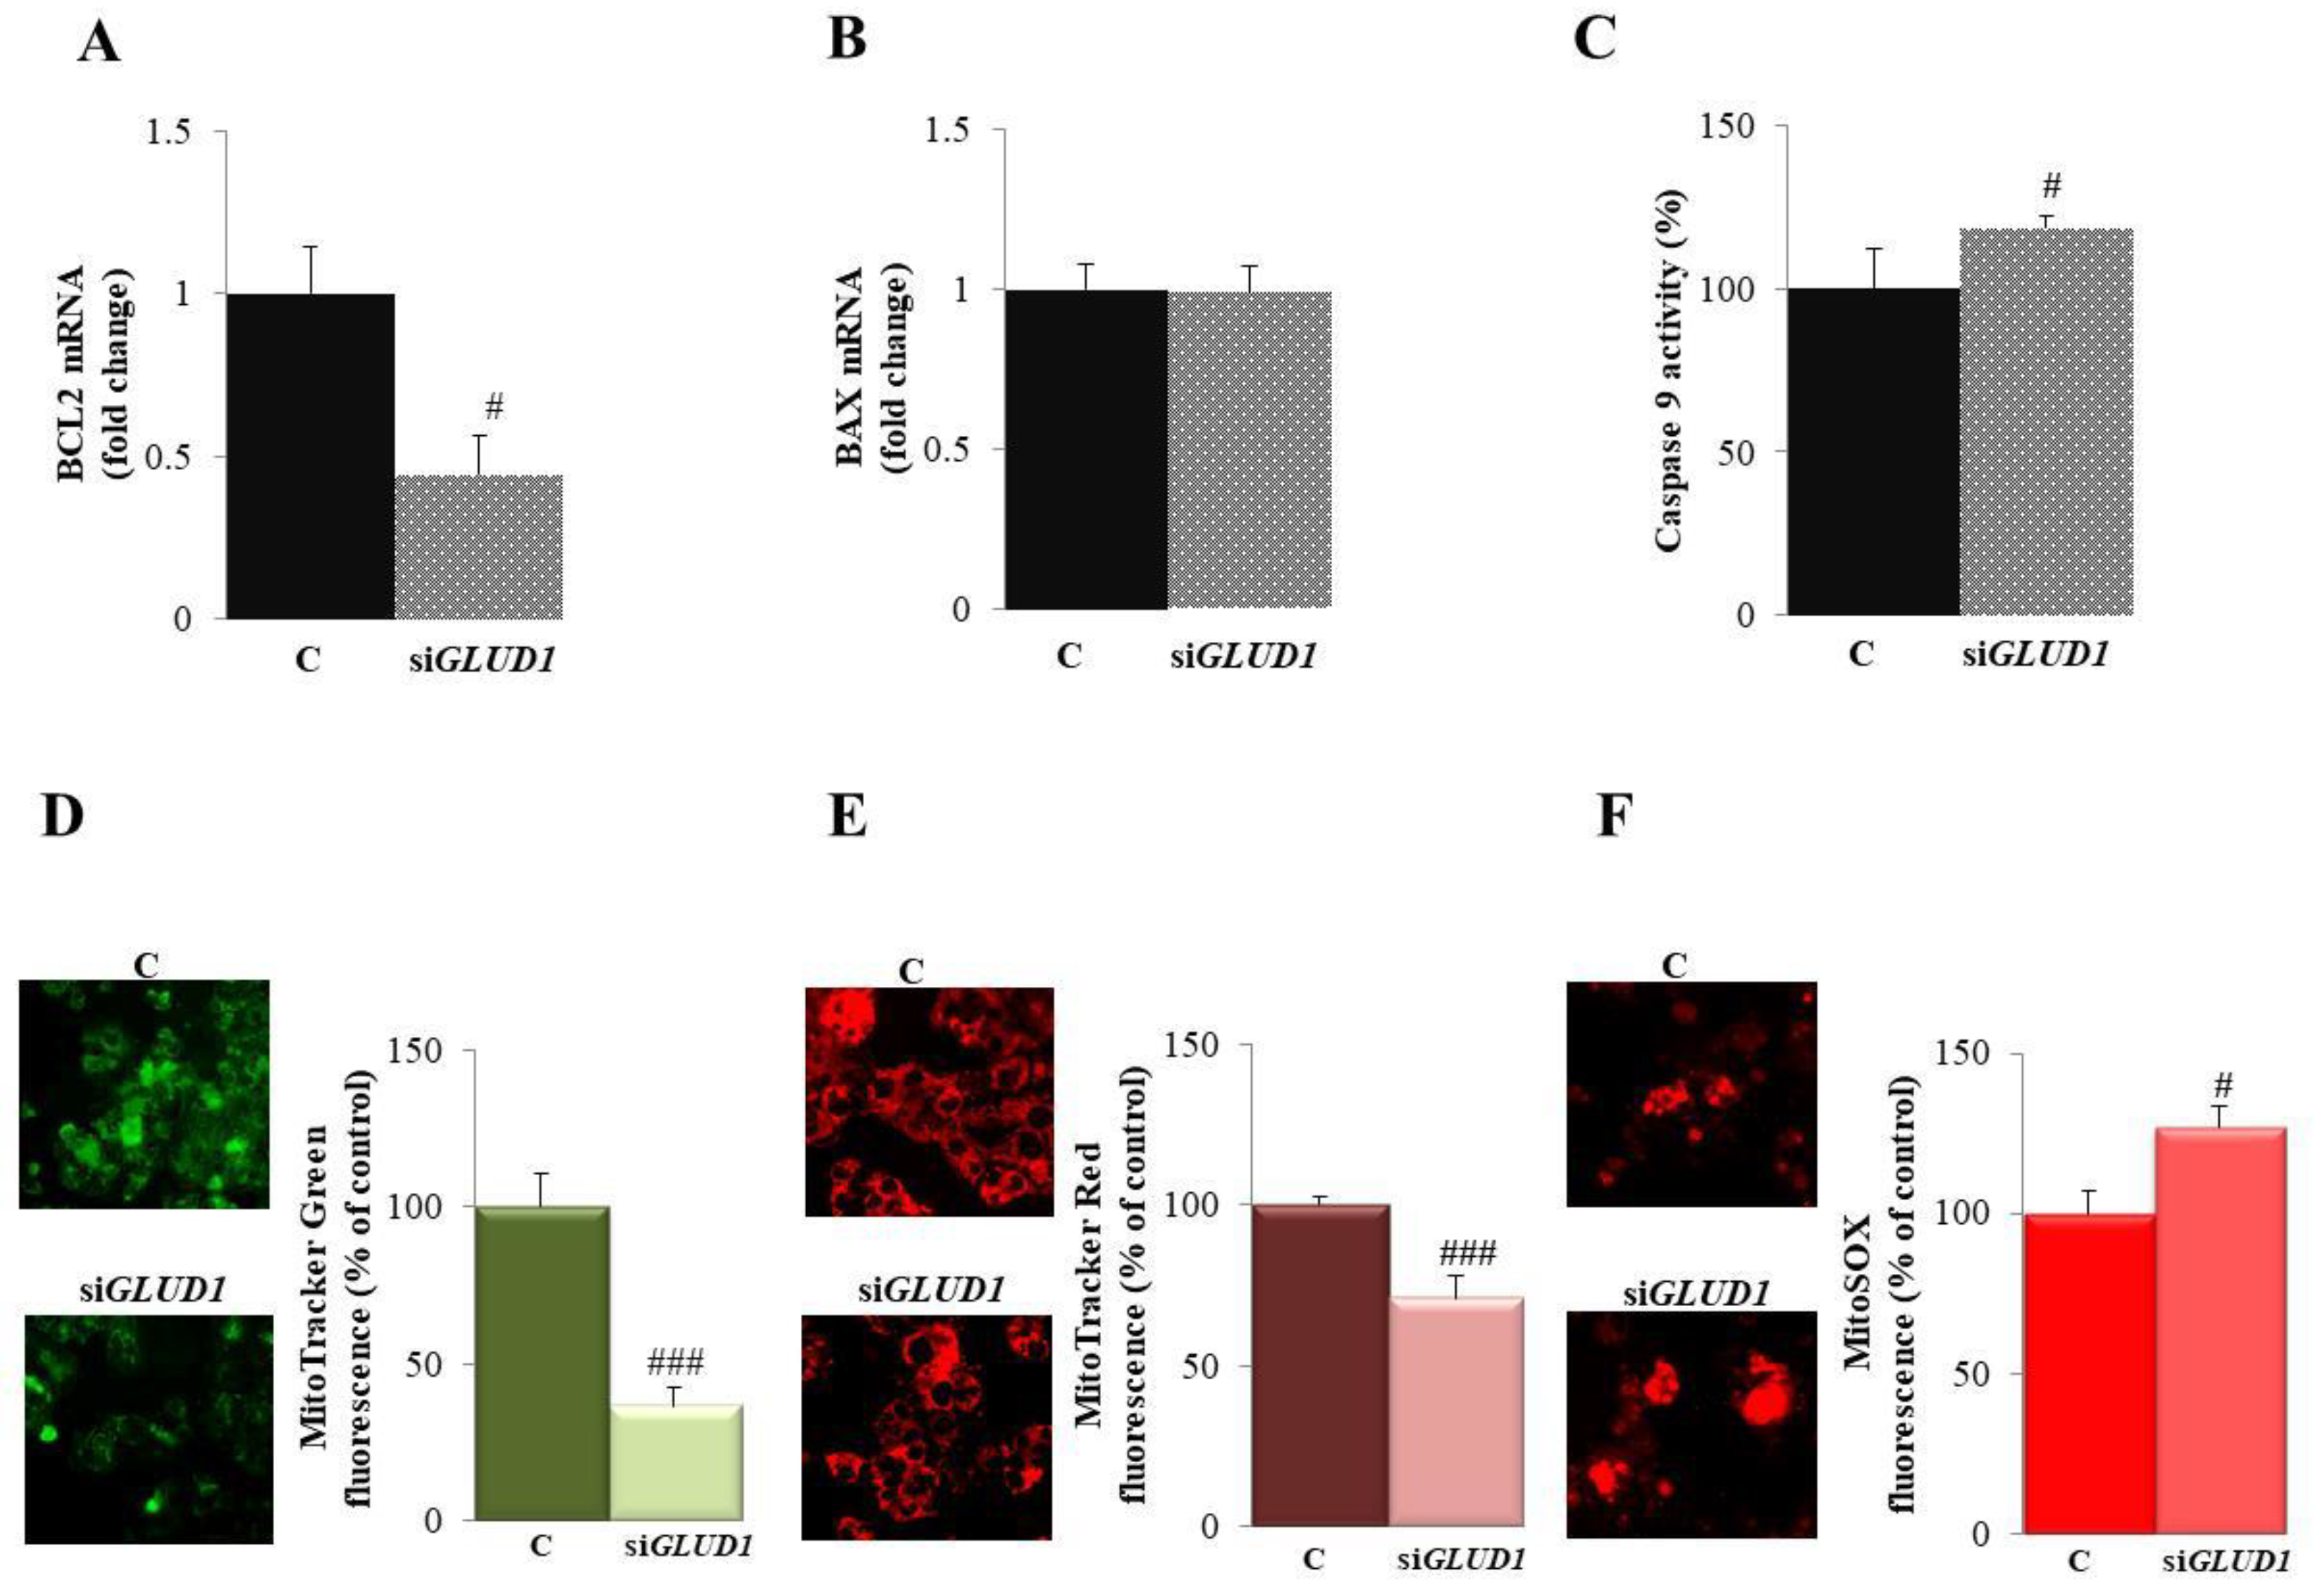
3.4. GLUD1 Gene Silencing Induces Apoptosis via the Intrinsic Pathway in HCC Cells
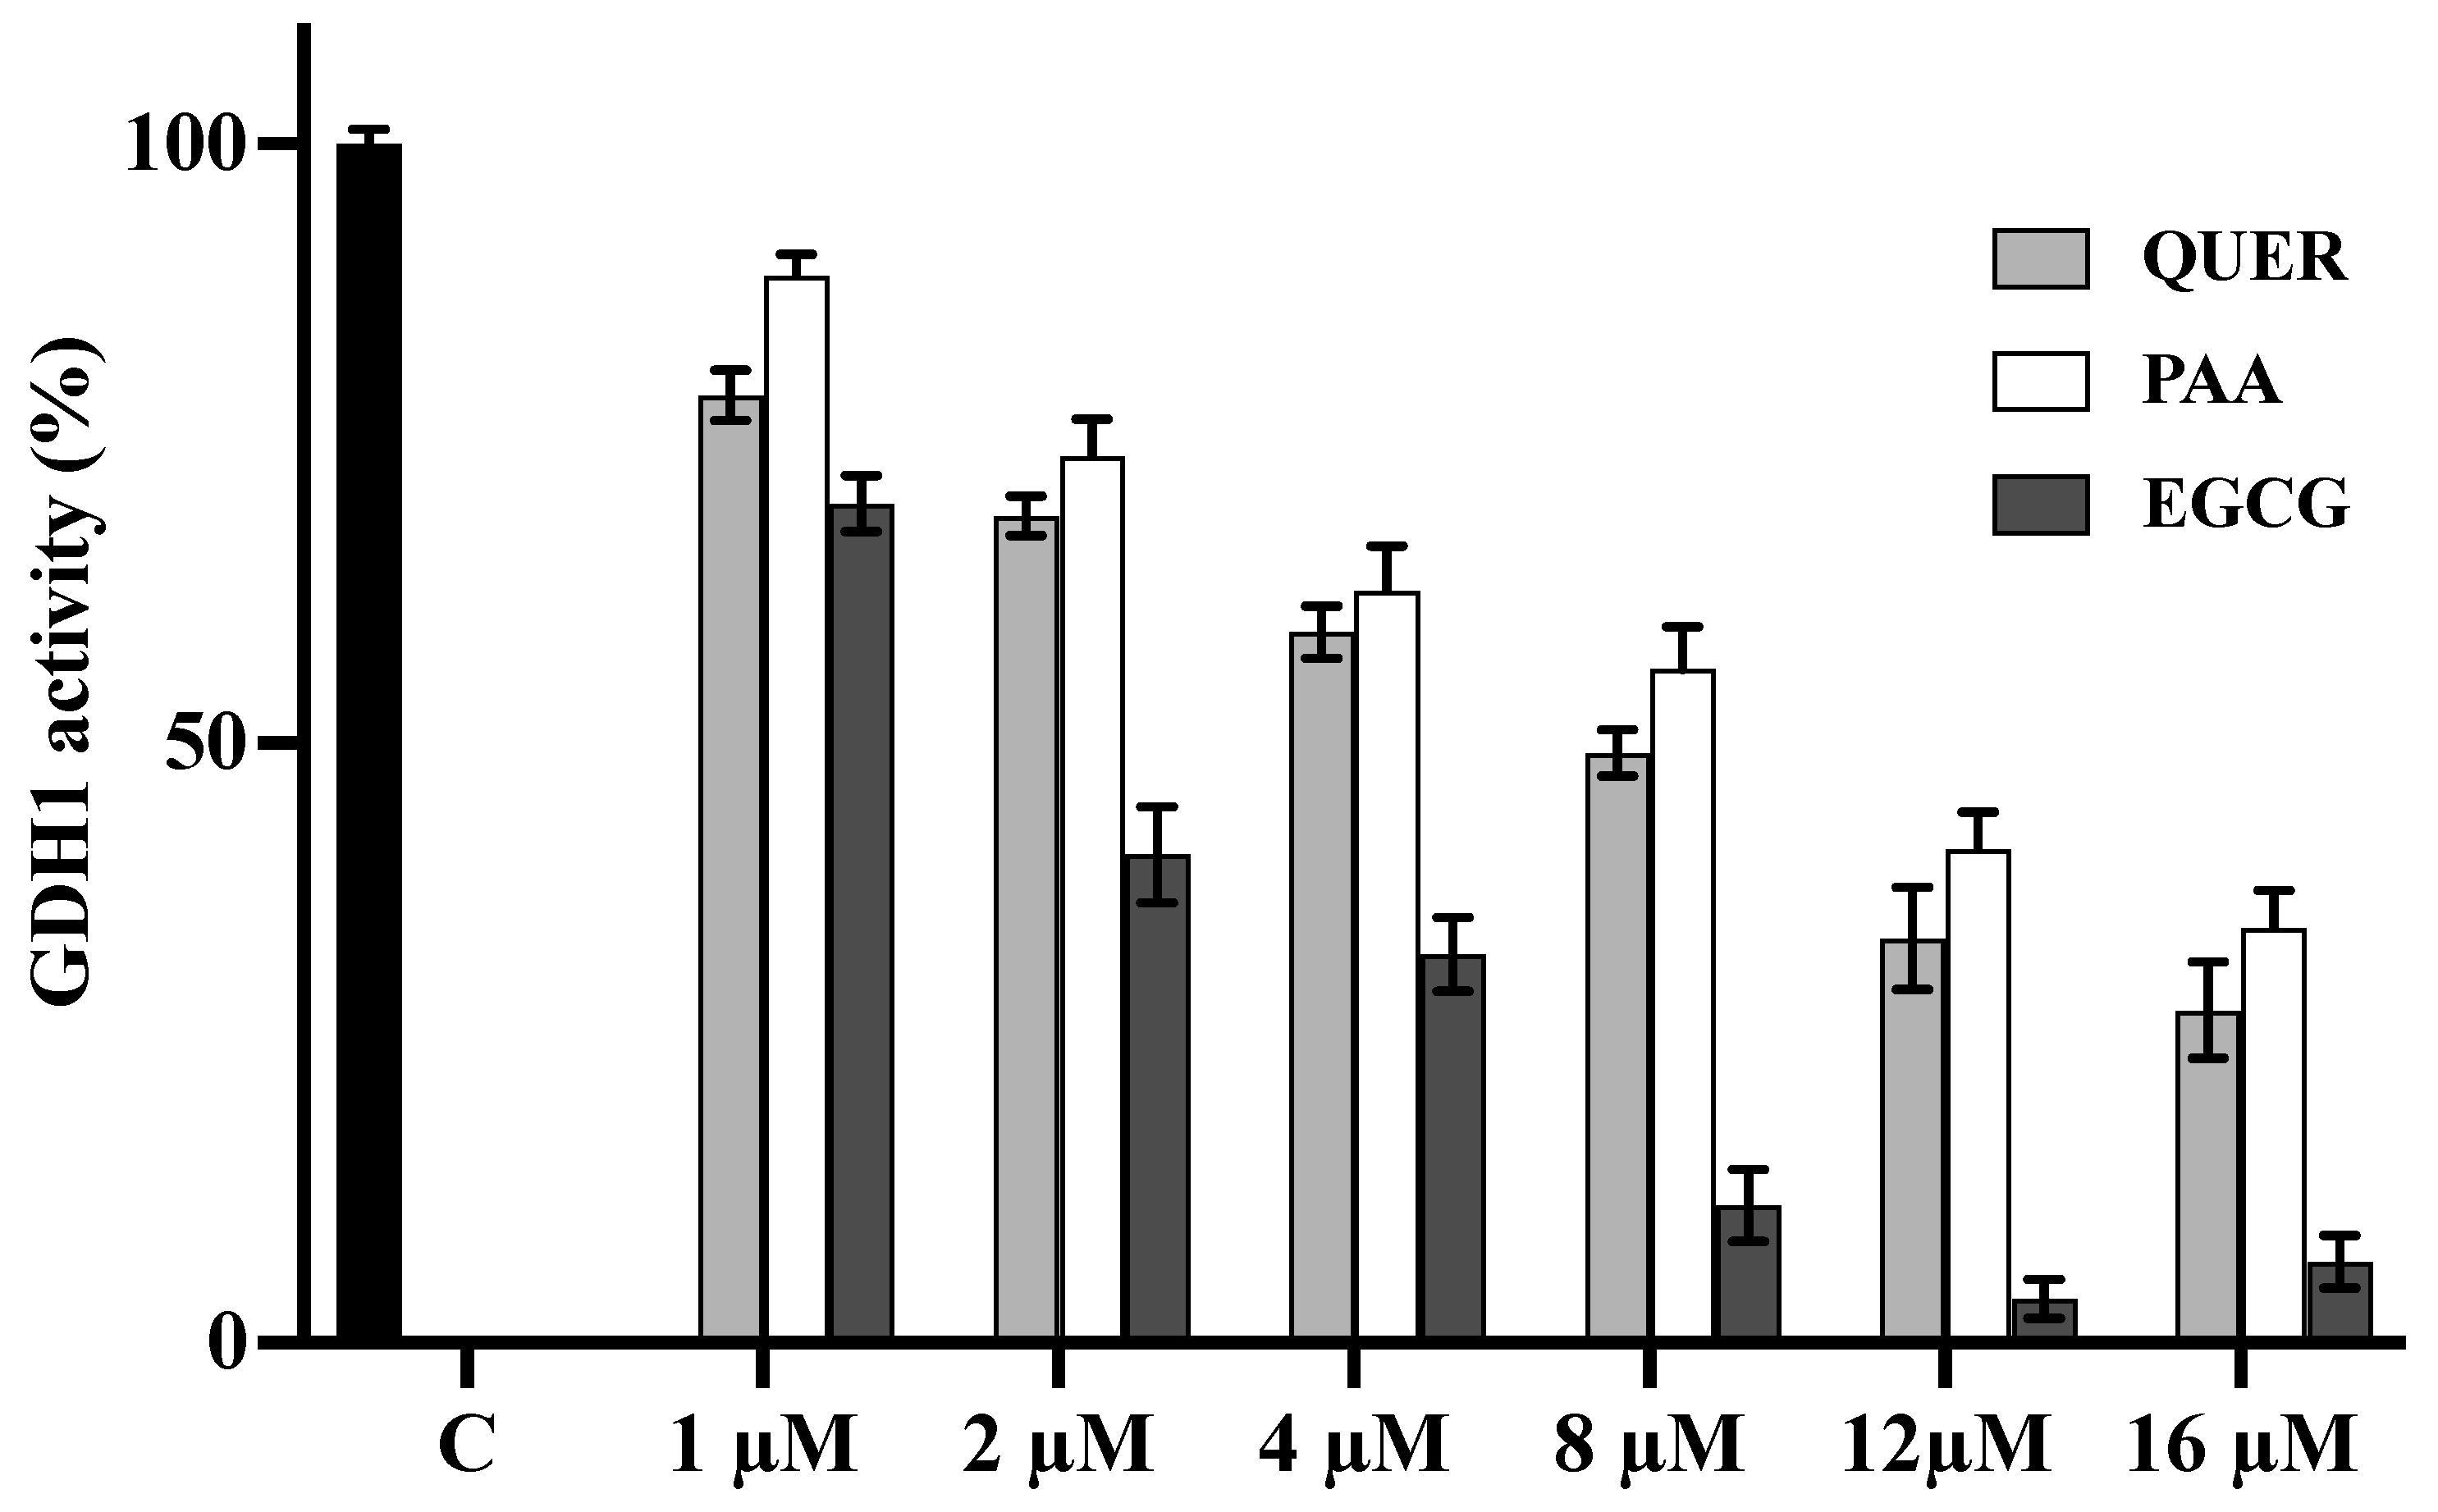
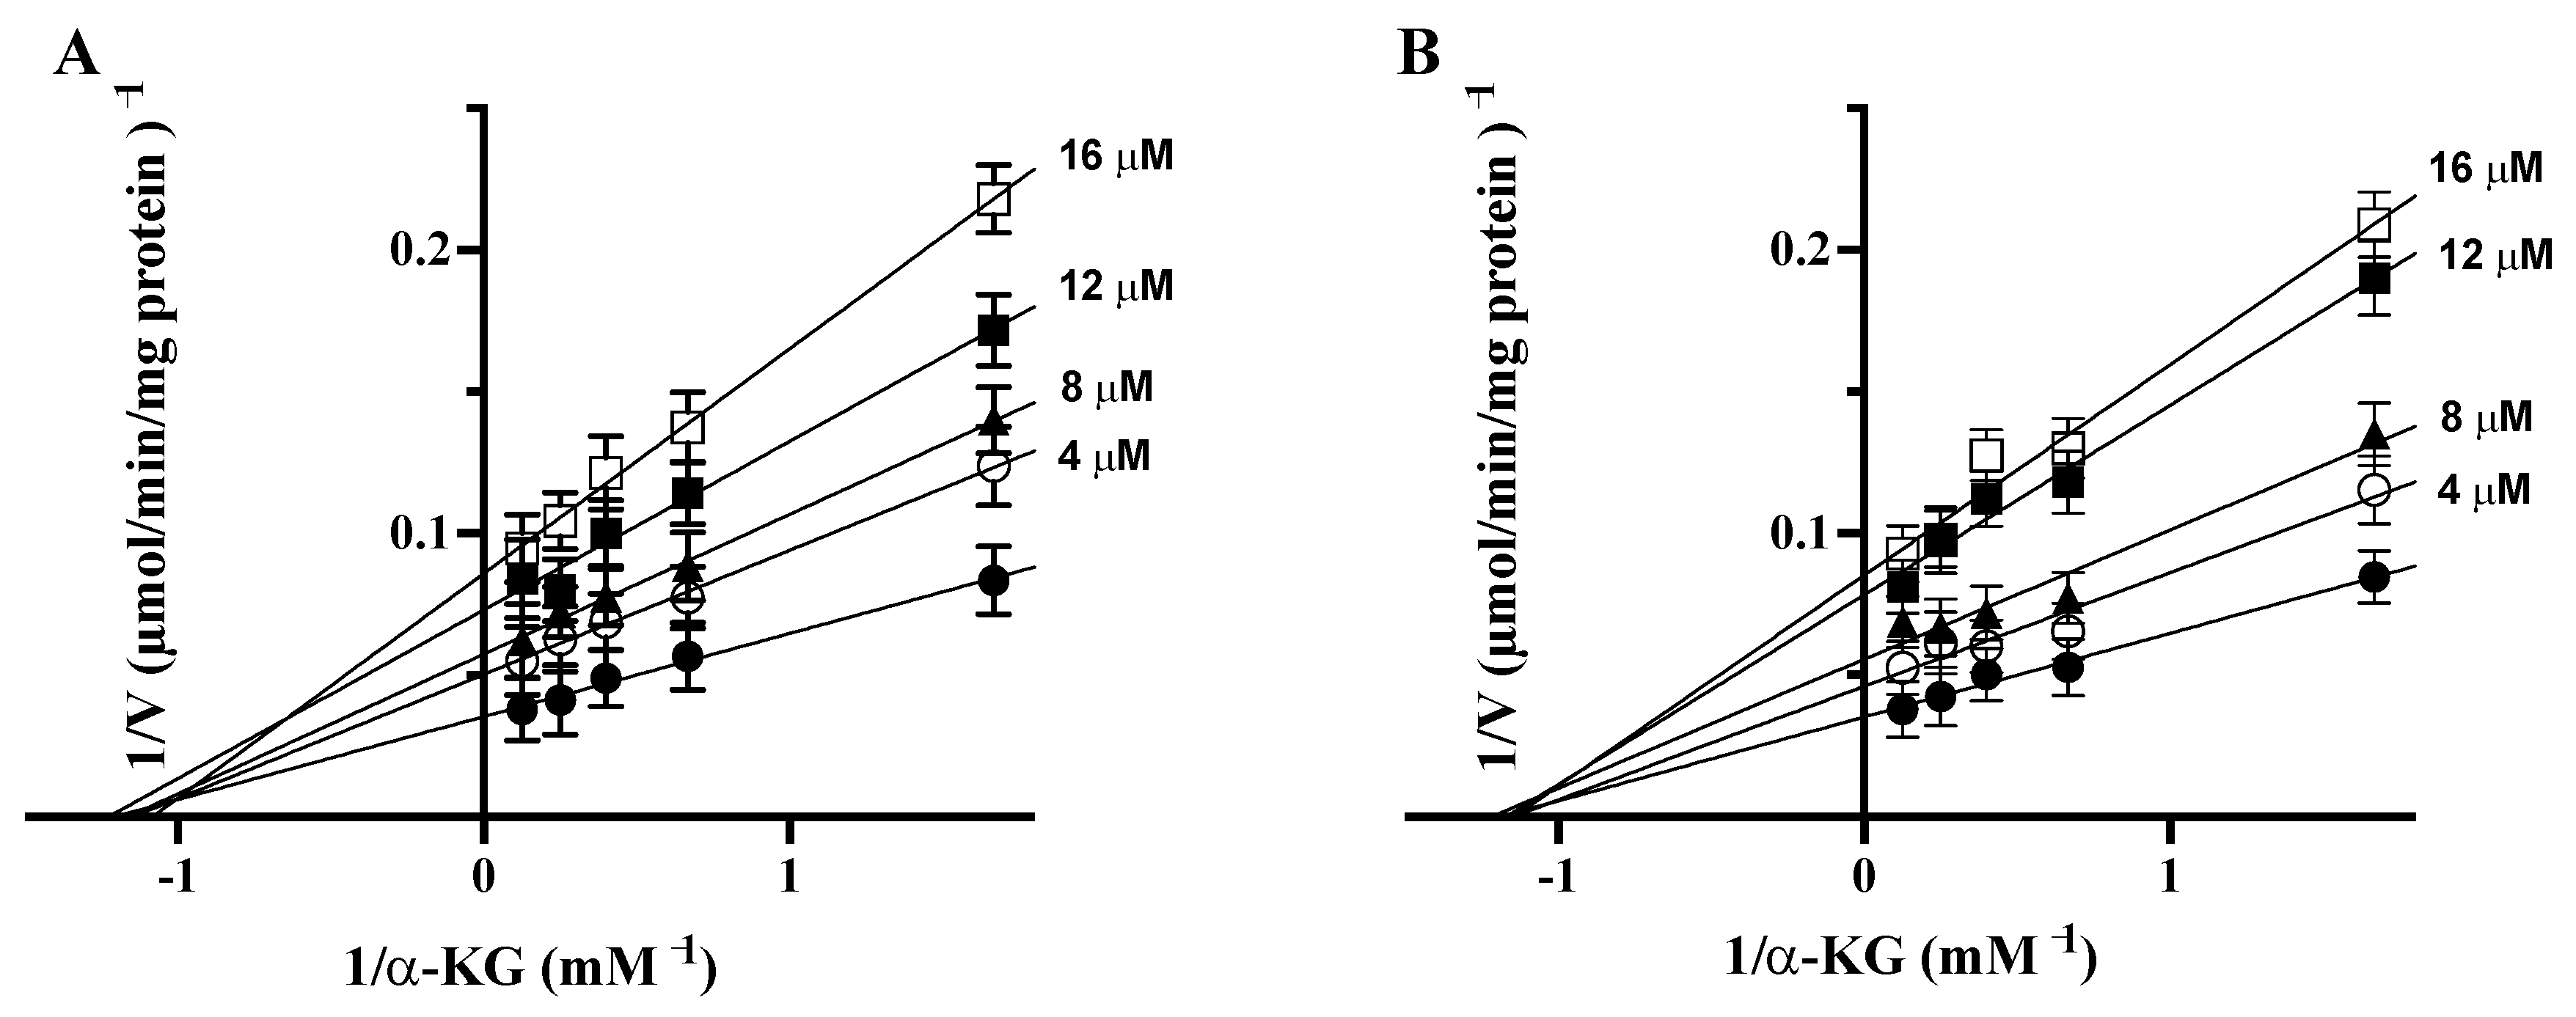
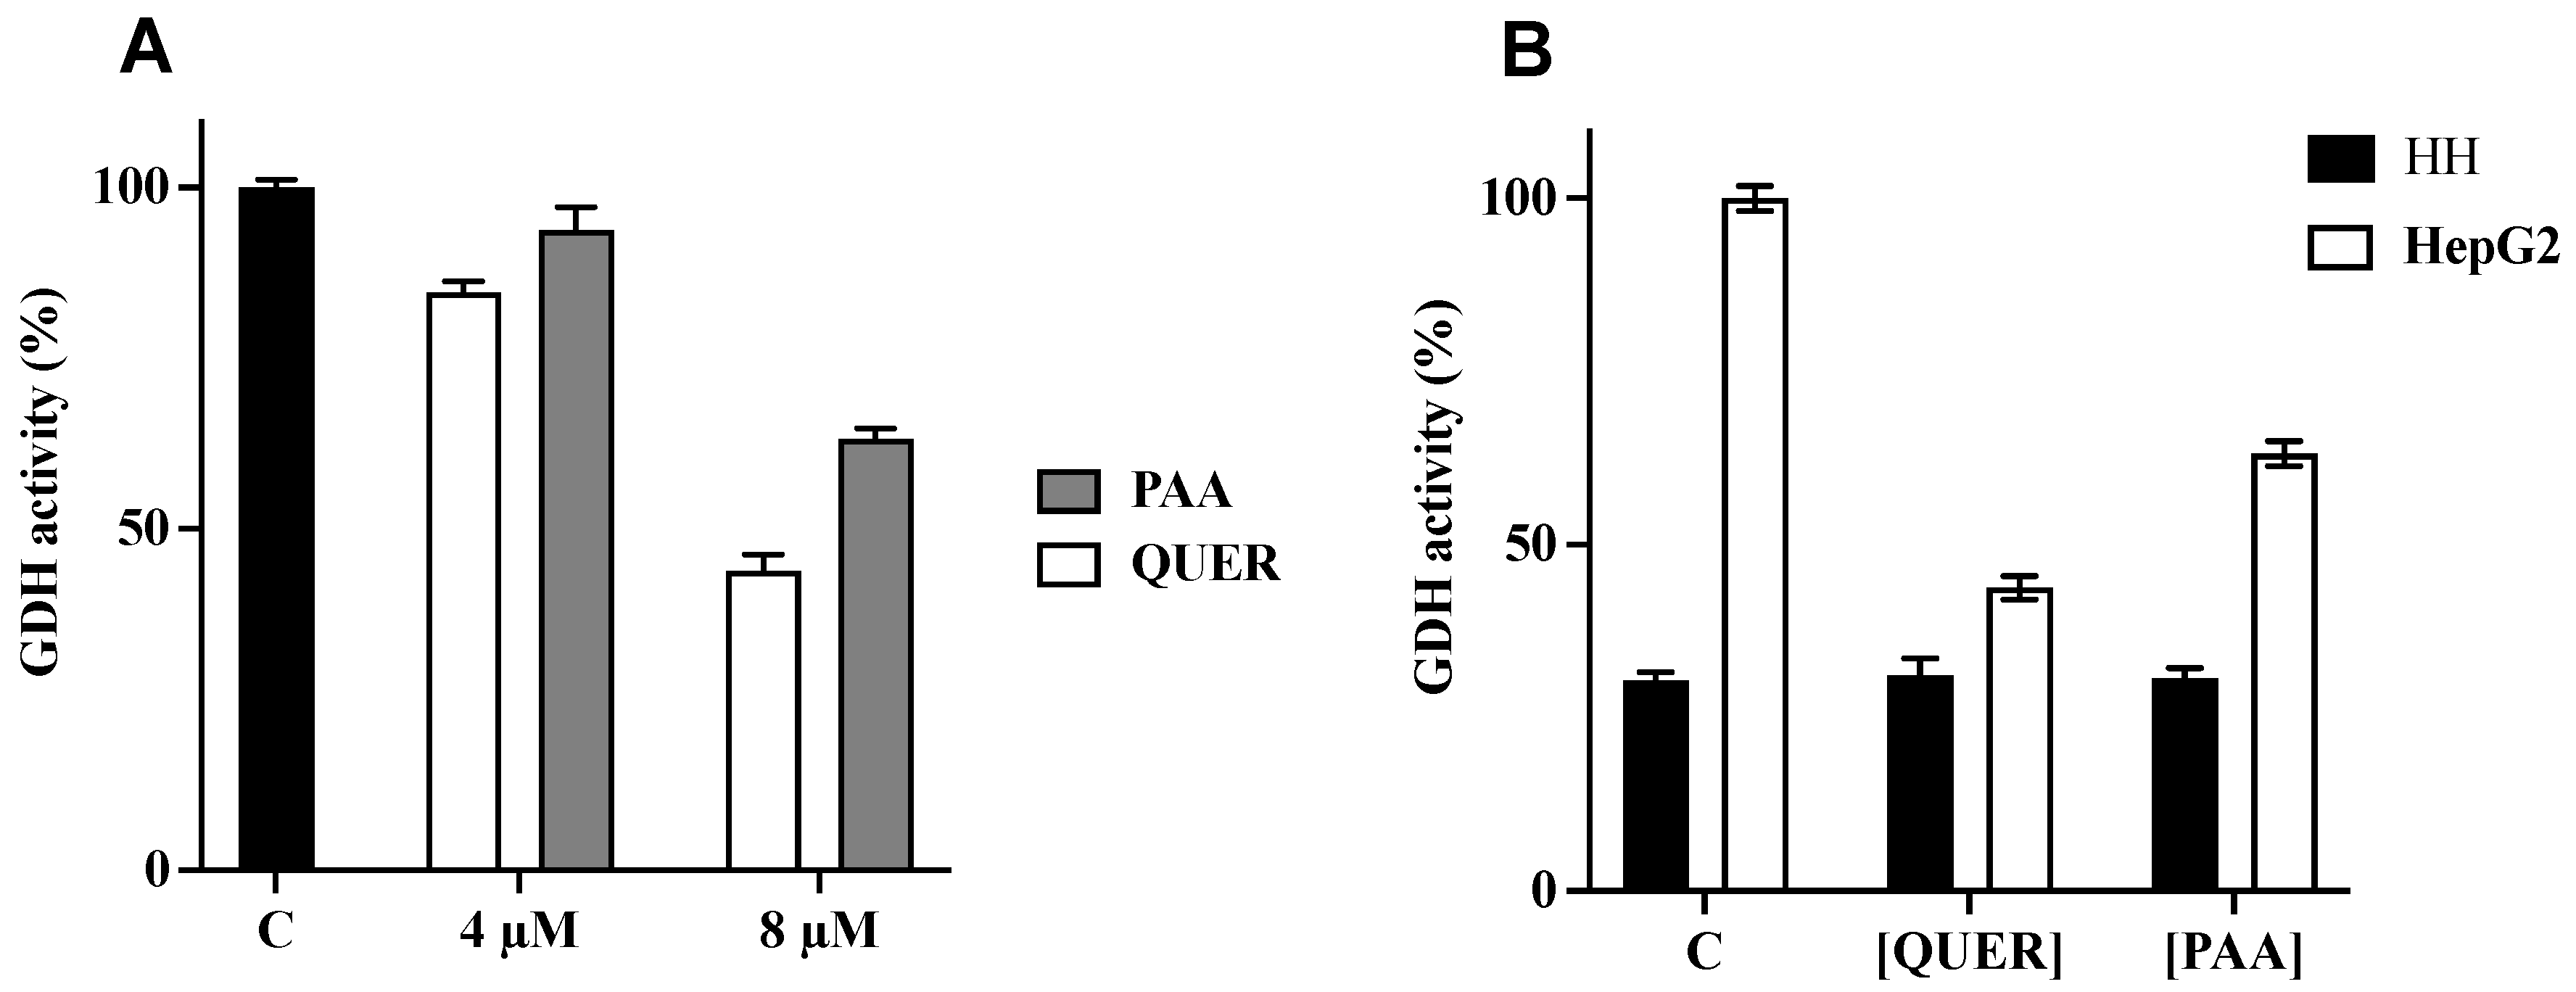
3.5. Quercetin and PAA Inhibit GDH Activity
4. Discussion
Supplementary Materials
Author Contributions
Funding
Institutional Review Board Statement
Informed Consent Statement
Data Availability Statement
Conflicts of Interest
References
- Hoffpauir, Z.A.; Sherman, E.; Smith, T.J. Dissecting the Antenna in Human Glutamate Dehydrogenase: Understanding Its Role in Subunit Communication and Allosteric Regulation. Biochemistry 2019, 58, 4195–4206. [Google Scholar] [CrossRef]
- Li, M.; Li, C.; Allen, A.; Stanley, C.A.; Smith, T.J. The structure and allosteric regulation of glutamate dehydrogenase. Neurochem. Int. 2011, 59, 445–455. [Google Scholar] [CrossRef] [Green Version]
- Plaitakis, A.; Kalef-Ezra, E.; Kotzamani, D.; Zaganas, I.; Spanaki, C. The Glutamate Dehydrogenase Pathway and Its Roles in Cell and Tissue Biology in Health and Disease. Biology 2017, 6, 11. [Google Scholar] [CrossRef] [Green Version]
- Shashidharan, P.; Clarke, D.D.; Ahmed, N.; Moschonas, N.; Plaitakis, A. Nerve tissue-specific human glutamate dehydrogenase that is thermolabile and highly regulated by ADP. J. Neurochem. 1997, 68, 1804–1811. [Google Scholar] [CrossRef] [PubMed] [Green Version]
- Mathioudakis, L.; Bourbouli, M.; Daklada, E.; Kargatzi, S.; Michaelidou, K.; Zaganas, I. Localization of Human Glutamate Dehydrogenases Provides Insights into Their Metabolic Role and Their Involvement in Disease Processes. Neurochem. Res. 2019, 44, 170–187. [Google Scholar] [CrossRef] [PubMed]
- Todisco, S.; Convertini, P.; Iacobazzi, V.; Infantino, V. TCA Cycle Rewiring as Emerging Metabolic Signature of Hepatocellular Carcinoma. Cancers 2019, 12, 68. [Google Scholar] [CrossRef] [Green Version]
- Chen, J.-Q.; Russo, J. Dysregulation of glucose transport, glycolysis, TCA cycle and glutaminolysis by oncogenes and tumor suppressors in cancer cells. Biochim. Biophys. Acta 2012, 1826, 370–384. [Google Scholar] [CrossRef] [PubMed]
- Jin, L.; Li, D.; Alesi, G.N.; Fan, J.; Kang, H.-B.; Lu, Z.; Boggon, T.J.; Jin, P.; Yi, H.; Wright, E.R.; et al. Glutamate Dehydrogenase 1 Signals through Antioxidant Glutathione Peroxidase 1 to Regulate Redox Homeostasis and Tumor Growth. Cancer Cell 2015, 27, 257–270. [Google Scholar] [CrossRef] [Green Version]
- Wallace, D.C. Mitochondria and cancer. Nat. Rev. Cancer 2012, 12, 685–698. [Google Scholar] [CrossRef] [Green Version]
- Infantino, V.; Dituri, F.; Convertini, P.; Santarsiero, A.; Palmieri, F.; Todisco, S.; Mancarella, S.; Giannelli, G.; Iacobazzi, V. Epigenetic upregulation and functional role of the mitochondrial aspartate/glutamate carrier isoform 1 in hepatocellular carcinoma. Biochim. Biophys. Acta Mol. Basis Dis. 2019, 1865, 38–47. [Google Scholar] [CrossRef]
- Convertini, P.; Todisco, S.; De Santis, F.; Pappalardo, I.; Iacobazzi, D.; Castiglione Morelli, M.A.; Fondufe-Mittendorf, Y.N.; Martelli, G.; Palmieri, F.; Infantino, V. Transcriptional Regulation Factors of the Human Mitochondrial Aspartate/Glutamate Carrier Gene, Isoform 2 (SLC25A13): USF1 as Basal Factor and FOXA2 as Activator in Liver Cells. Int. J. Mol. Sci. 2019, 20, 1888. [Google Scholar] [CrossRef] [PubMed] [Green Version]
- Yoo, H.C.; Park, S.J.; Nam, M.; Kang, J.; Kim, K.; Yeo, J.H.; Kim, J.-K.; Heo, Y.; Lee, H.S.; Lee, M.Y.; et al. A Variant of SLC1A5 Is a Mitochondrial Glutamine Transporter for Metabolic Reprogramming in Cancer Cells. Cell Metab. 2020, 31, 267–283.e12. [Google Scholar] [CrossRef]
- DeWaal, D.; Nogueira, V.; Terry, A.R.; Patra, K.C.; Jeon, S.-M.; Guzman, G.; Au, J.; Long, C.P.; Antoniewicz, M.R.; Hay, N. Hexokinase-2 depletion inhibits glycolysis and induces oxidative phosphorylation in hepatocellular carcinoma and sensitizes to metformin. Nat. Commun. 2018, 9, 446. [Google Scholar] [CrossRef] [PubMed]
- Björnson, E.; Mukhopadhyay, B.; Asplund, A.; Pristovsek, N.; Cinar, R.; Romeo, S.; Uhlen, M.; Kunos, G.; Nielsen, J.; Mardinoglu, A. Stratification of Hepatocellular Carcinoma Patients Based on Acetate Utilization. Cell Rep. 2015, 13, 2014–2026. [Google Scholar] [CrossRef] [PubMed] [Green Version]
- Liu, G.; Zhu, J.; Yu, M.; Cai, C.; Zhou, Y.; Yu, M.; Fu, Z.; Gong, Y.; Yang, B.; Li, Y.; et al. Glutamate dehydrogenase is a novel prognostic marker and predicts metastases in colorectal cancer patients. J. Transl. Med. 2015, 13, 144. [Google Scholar] [CrossRef] [PubMed] [Green Version]
- Zhang, J.; Wang, G.; Mao, Q.; Li, S.; Xiong, W.; Lin, Y.; Ge, J. Glutamate dehydrogenase (GDH) regulates bioenergetics and redox homeostasis in human glioma. Oncotarget 2016, 5. [Google Scholar] [CrossRef] [Green Version]
- Li, C.; Li, M.; Chen, P.; Narayan, S.; Matschinsky, F.M.; Bennett, M.J.; Stanley, C.A.; Smith, T.J. Green tea polyphenols control dysregulated glutamate dehydrogenase in transgenic mice by hijacking the ADP activation site. J. Biol. Chem. 2011, 286, 34164–34174. [Google Scholar] [CrossRef] [Green Version]
- Domith, I.; Duarte-Silva, A.T.; Garcia, C.G.; Calaza, K.d.C.; Paes-de-Carvalho, R.; Cossenza, M. Chlorogenic acids inhibit glutamate dehydrogenase and decrease intracellular ATP levels in cultures of chick embryo retina cells. Biochem. Pharmacol. 2018, 155, 393–402. [Google Scholar] [CrossRef]
- Hou, W.; Lu, S.; Zhao, H.; Yu, Y.; Xu, H.; Yu, B.; Su, L.; Lin, C.; Ruan, B.H. Propylselen inhibits cancer cell growth by targeting glutamate dehydrogenase at the NADP+ binding site. Biochem. Biophys. Res. Commun. 2019, 509, 262–267. [Google Scholar] [CrossRef]
- Ezzati, M.; Yousefi, B.; Velaei, K.; Safa, A. A review on anti-cancer properties of Quercetin in breast cancer. Life Sci. 2020, 248, 117463. [Google Scholar] [CrossRef]
- Santarsiero, A.; Convertini, P.; Vassallo, A.; Santoro, V.; Todisco, S.; Iacobazzi, D.; Fondufe-Mittendorf, Y.; Martelli, G.; de Oliveira, M.R.; Montanaro, R.; et al. Phenolic Compounds of Red Wine Aglianico del Vulture Modulate the Functional Activity of Macrophages via Inhibition of NF-κB and the Citrate Pathway. Oxidative Med. Cell. Longev. 2021, 2021, 5533793. [Google Scholar] [CrossRef] [PubMed]
- Xu, D.; Hu, M.-J.; Wang, Y.-Q.; Cui, Y.-L. Antioxidant Activities of Quercetin and Its Complexes for Medicinal Application. Molecules 2019, 24, 1123. [Google Scholar] [CrossRef] [PubMed] [Green Version]
- Chiummiento, L.; Funicello, M.; Lopardo, M.T.; Lupattelli, P.; Choppin, S.; Colobert, F. Concise Total Synthesis of Permethylated Anigopreissin A, a New Benzofuryl Resveratrol Dimer. Eur. J. Org. Chem. 2012, 2012, 188–192. [Google Scholar] [CrossRef]
- Convertini, P.; Tramutola, F.; Iacobazzi, V.; Lupattelli, P.; Chiummiento, L.; Infantino, V. Permethylated Anigopreissin A inhibits human hepatoma cell proliferation by mitochondria-induced apoptosis. Chem. Biol. Interact. 2015, 237, 1–8. [Google Scholar] [CrossRef] [PubMed]
- de Oliveira, M.R.; Nabavi, S.M.; Braidy, N.; Setzer, W.N.; Ahmed, T.; Nabavi, S.F. Quercetin and the mitochondria: A mechanistic view. Biotechnol. Adv. 2016, 34, 532–549. [Google Scholar] [CrossRef] [PubMed]
- Kamiloglu, S.; Sari, G.; Ozdal, T.; Capanoglu, E. Guidelines for cell viability assays. Food Front. 2020, 1, 332–349. [Google Scholar] [CrossRef]
- Livak, K.J.; Schmittgen, T.D. Analysis of relative gene expression data using real-time quantitative PCR and the 2(-Delta Delta C(T)) Method. Methods 2001, 25, 402–408. [Google Scholar] [CrossRef]
- Wojtala, A.; Bonora, M.; Malinska, D.; Pinton, P.; Duszynski, J.; Wieckowski, M.R. Methods to monitor ROS production by fluorescence microscopy and fluorometry. Methods Enzym. 2014, 542, 243–262. [Google Scholar] [CrossRef]
- Plaitakis, A.; Metaxari, M.; Shashidharan, P. Nerve Tissue-Specific (GLUD2) and Housekeeping (GLUD1) Human Glutamate Dehydrogenases Are Regulated by Distinct Allosteric Mechanisms. J. Neurochem. 2000, 75, 1862–1869. [Google Scholar] [CrossRef]
- Kim, T.K. T test as a parametric statistic. Korean J. Anesth. 2015, 68, 540–546. [Google Scholar] [CrossRef] [Green Version]
- Kim, T.K. Understanding one-way ANOVA using conceptual figures. Korean J. Anesth. 2017, 70, 22–26. [Google Scholar] [CrossRef] [Green Version]
- McIlwain, D.R.; Berger, T.; Mak, T.W. Caspase functions in cell death and disease. Cold Spring Harb. Perspect. Biol. 2013, 5, a008656. [Google Scholar] [CrossRef] [PubMed]
- Boatright, K.M.; Salvesen, G.S. Mechanisms of caspase activation. Curr. Opin. Cell Biol. 2003, 15, 725–731. [Google Scholar] [CrossRef] [PubMed]
- Lopez, J.; Tait, S.W.G. Mitochondrial apoptosis: Killing cancer using the enemy within. Br. J. Cancer 2015, 112, 957–962. [Google Scholar] [CrossRef] [Green Version]
- Khodapasand, E.; Jafarzadeh, N.; Farrokhi, F.; Kamalidehghan, B.; Houshmand, M. Is Bax/Bcl-2 ratio considered as a prognostic marker with age and tumor location in colorectal cancer? Iran. Biomed. J. 2015, 19, 69–75. [Google Scholar] [CrossRef]
- Tsujimoto, Y. Role of Bcl-2 family proteins in apoptosis: Apoptosomes or mitochondria? Genes Cells 1998, 3, 697–707. [Google Scholar] [CrossRef] [PubMed]
- Agnello, M.; Morici, G.; Rinaldi, A.M. A method for measuring mitochondrial mass and activity. Cytotechnology 2008, 56, 145–149. [Google Scholar] [CrossRef] [Green Version]
- Bunik, V.; Artiukhov, A.; Aleshin, V.; Mkrtchyan, G. Multiple Forms of Glutamate Dehydrogenase in Animals: Structural Determinants and Physiological Implications. Biology 2016, 5, 53. [Google Scholar] [CrossRef] [Green Version]
- Rivera, S.; Azcón-Bieto, J.; López-Soriano, F.J.; Miralpeix, M.; Argilés, J.M. Amino acid metabolism in tumour-bearing mice. Biochem. J. 1988, 249, 443–449. [Google Scholar] [CrossRef] [Green Version]
- DeBerardinis, R.J.; Mancuso, A.; Daikhin, E.; Nissim, I.; Yudkoff, M.; Wehrli, S.; Thompson, C.B. Beyond aerobic glycolysis: Transformed cells can engage in glutamine metabolism that exceeds the requirement for protein and nucleotide synthesis. Proc. Natl. Acad. Sci. USA 2007, 104, 19345–19350. [Google Scholar] [CrossRef] [Green Version]
- Li, Y.; Xu, S.; Li, J.; Zheng, L.; Feng, M.; Wang, X.; Han, K.; Pi, H.; Li, M.; Huang, X.; et al. SIRT1 facilitates hepatocellular carcinoma metastasis by promoting PGC-1α-mediated mitochondrial biogenesis. Oncotarget 2016, 7, 29255–29274. [Google Scholar] [CrossRef] [PubMed] [Green Version]
- Sullivan, L.B.; Martinez-Garcia, E.; Nguyen, H.; Mullen, A.R.; Dufour, E.; Sudarshan, S.; Licht, J.D.; Deberardinis, R.J.; Chandel, N.S. The proto-oncometabolite fumarate binds glutathione to amplify ROS-dependent signaling. Mol. Cell 2013, 51, 236–248. [Google Scholar] [CrossRef] [PubMed] [Green Version]
- Infantino, V.; Santarsiero, A.; Convertini, P.; Todisco, S.; Iacobazzi, V. Cancer Cell Metabolism in Hypoxia: Role of HIF-1 as Key Regulator and Therapeutic Target. Int. J. Mol. Sci. 2021, 22, 5703. [Google Scholar] [CrossRef]
- Sun, R.C.; Denko, N.C. Hypoxic regulation of glutamine metabolism through HIF1 and SIAH2 supports lipid synthesis that is necessary for tumor growth. Cell Metab. 2014, 19, 285–292. [Google Scholar] [CrossRef] [Green Version]
- Alberghina, L.; Gaglio, D. Redox control of glutamine utilization in cancer. Cell Death Dis. 2014, 5, e1561. [Google Scholar] [CrossRef] [PubMed] [Green Version]
- Granado-Serrano, A.B.; Martín, M.A.; Bravo, L.; Goya, L.; Ramos, S. Quercetin Induces Apoptosis via Caspase Activation, Regulation of Bcl-2, and Inhibition of PI-3-Kinase/Akt and ERK Pathways in a Human Hepatoma Cell Line (HepG2). J. Nutr. 2006, 136, 2715–2721. [Google Scholar] [CrossRef] [Green Version]
- Salama, Y.A.; El-Karef, A.; El Gayyar, A.M.; Abdel-Rahman, N. Beyond its antioxidant properties: Quercetin targets multiple signalling pathways in hepatocellular carcinoma in rats. Life Sci. 2019, 236, 116933. [Google Scholar] [CrossRef]


| Tissues/Cell Lines | Number of Samples | Expression Level (Log2 Scale)-Average |
|---|---|---|
| Liver | 878 | 1633 |
| Cancer liver | 48 | 1785 |
| Hepatocyte (ESC) | 53 | 1618 |
| Hepatocyte-immature (WA09) | 3 | 16 |
Publisher’s Note: MDPI stays neutral with regard to jurisdictional claims in published maps and institutional affiliations. |
© 2021 by the authors. Licensee MDPI, Basel, Switzerland. This article is an open access article distributed under the terms and conditions of the Creative Commons Attribution (CC BY) license (https://creativecommons.org/licenses/by/4.0/).
Share and Cite
Marsico, M.; Santarsiero, A.; Pappalardo, I.; Convertini, P.; Chiummiento, L.; Sardone, A.; Di Noia, M.A.; Infantino, V.; Todisco, S. Mitochondria-Mediated Apoptosis of HCC Cells Triggered by Knockdown of Glutamate Dehydrogenase 1: Perspective for Its Inhibition through Quercetin and Permethylated Anigopreissin A. Biomedicines 2021, 9, 1664. https://doi.org/10.3390/biomedicines9111664
Marsico M, Santarsiero A, Pappalardo I, Convertini P, Chiummiento L, Sardone A, Di Noia MA, Infantino V, Todisco S. Mitochondria-Mediated Apoptosis of HCC Cells Triggered by Knockdown of Glutamate Dehydrogenase 1: Perspective for Its Inhibition through Quercetin and Permethylated Anigopreissin A. Biomedicines. 2021; 9(11):1664. https://doi.org/10.3390/biomedicines9111664
Chicago/Turabian StyleMarsico, Michela, Anna Santarsiero, Ilaria Pappalardo, Paolo Convertini, Lucia Chiummiento, Alessandra Sardone, Maria Antonietta Di Noia, Vittoria Infantino, and Simona Todisco. 2021. "Mitochondria-Mediated Apoptosis of HCC Cells Triggered by Knockdown of Glutamate Dehydrogenase 1: Perspective for Its Inhibition through Quercetin and Permethylated Anigopreissin A" Biomedicines 9, no. 11: 1664. https://doi.org/10.3390/biomedicines9111664